Embed Size (px)
Citation preview
Graphic Excellence for the Commissioning Profession:
Strategies for Representing Building Performance Data
Ryan Stroupe, PG&E Pacific Energy Center

AIA Quality Assurance
The Building Commissioning Association is a Registered Provider with The American Institute of Architects Continuing Education Systems (AIA/CES). Credit(s) earned on completion of this program will be reported to AIA/CES for AIA members. Certificates of the Completion for both AIA members and non-AIA members are available upon request.
This program is registered with AIA/CES for continuing professional education. As such, it does not include content that may be deemed or construed to be an approval or endorsement by the AIA of any material of construction or any method or manner of handling, using, distributing, or dealing in any material or product.
Questions related to specific materials, methods, and services will be addressed at the conclusion of this presentation.
2

3
Commissioning in the Digital Age: Data, Software and Graphs
At the end of this session participants will be able to:
1. Decipher data graphs by looking for specific visual clues.
2. Discover a number of graph types and understand the
appropriate application of each.
3. Understand the basic principles of whole building interval
meter data modeling and anomaly detection.
4. Learn how any software-as-service can be improved with
the human element.
Session Learning Objectives

• 19 years at PG&E Pacific Energy Center (PEC) in San Francisco
• Coordinates the Center’s Existing Building Curriculao Building commissioningo Energy auditso Measuremento Financial calculationso Water conservation
• Teaches many PEC classes covering 32 different EE topics
• Oversees the Center’s Tool Lending Library Program
• Manages Universal Translator software development project
• Six-time Speaker at National Conference on Building Commissioning
• Instructor for several college and university extension programs
4
Ryan Stroupe Bio
5
Mystery Graph Activity
6
Mystery Graph Instructions
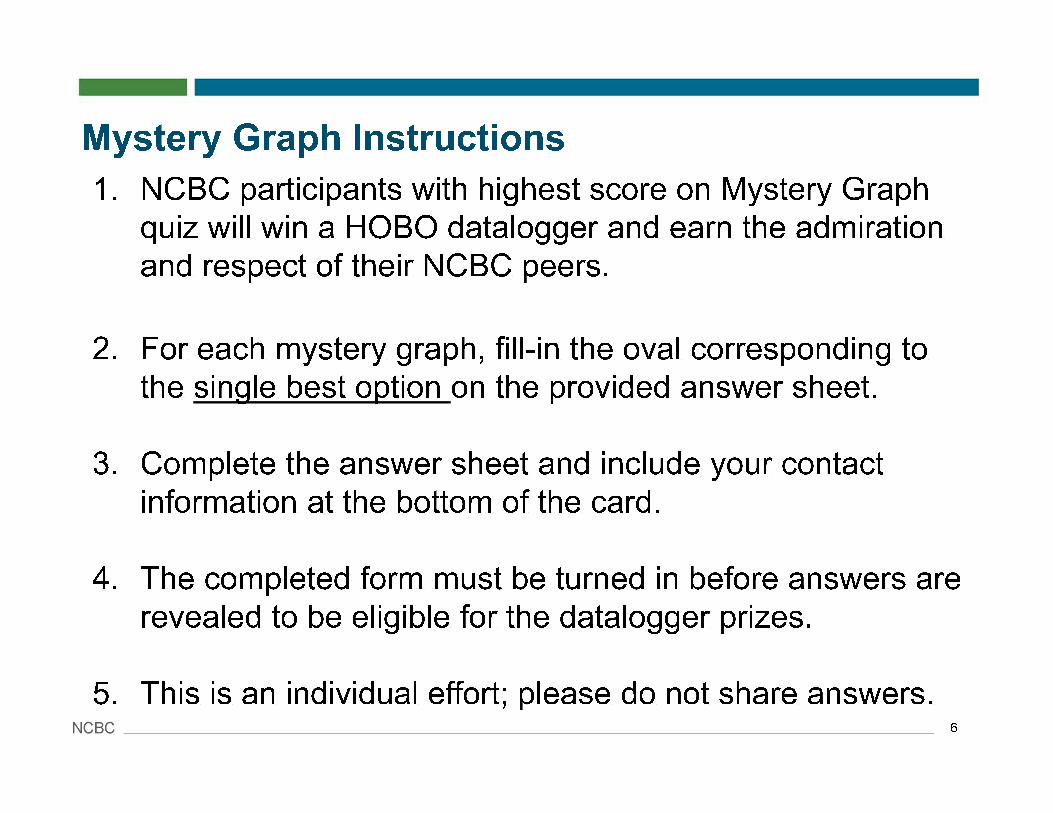
1. NCBC participants with highest score on Mystery Graph
quiz will win a HOBO datalogger and earn the admiration
and respect of their NCBC peers.
2. For each mystery graph, fill-in the oval corresponding to
the single best option on the provided answer sheet.
3. Complete the answer sheet and include your contact
information at the bottom of the card.
4. The completed form must be turned in before answers are
revealed to be eligible for the datalogger prizes.
5. This is an individual effort; please do not share answers.
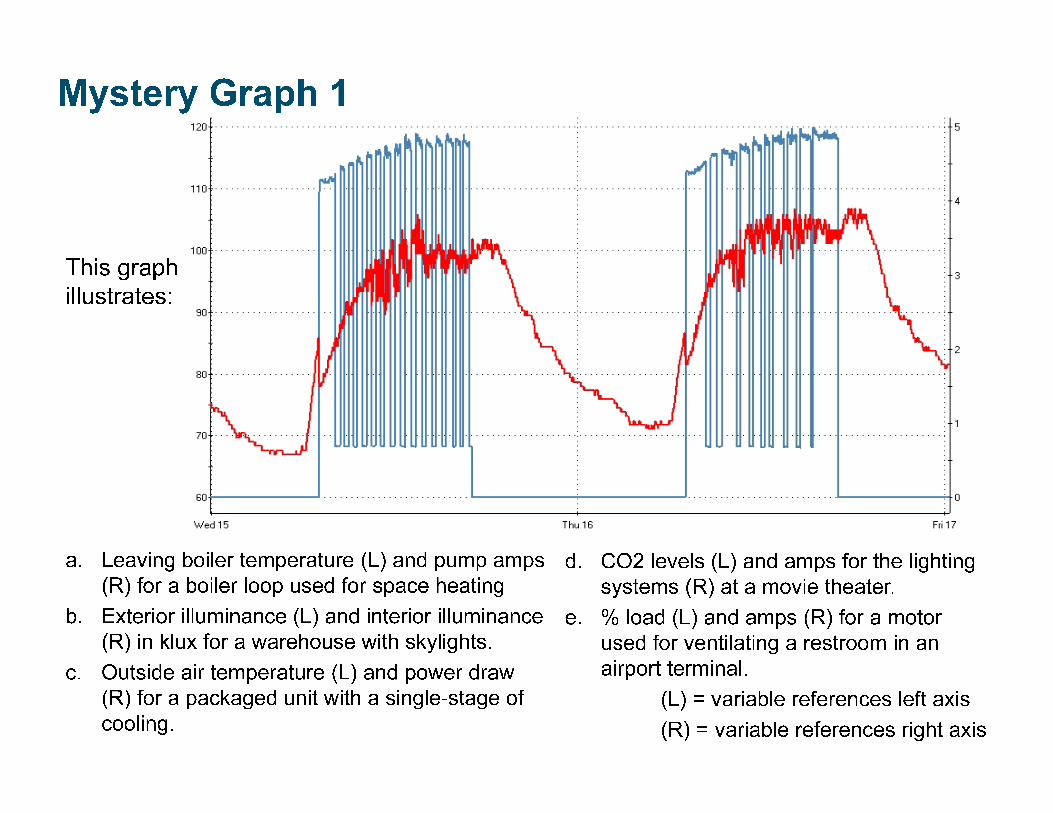
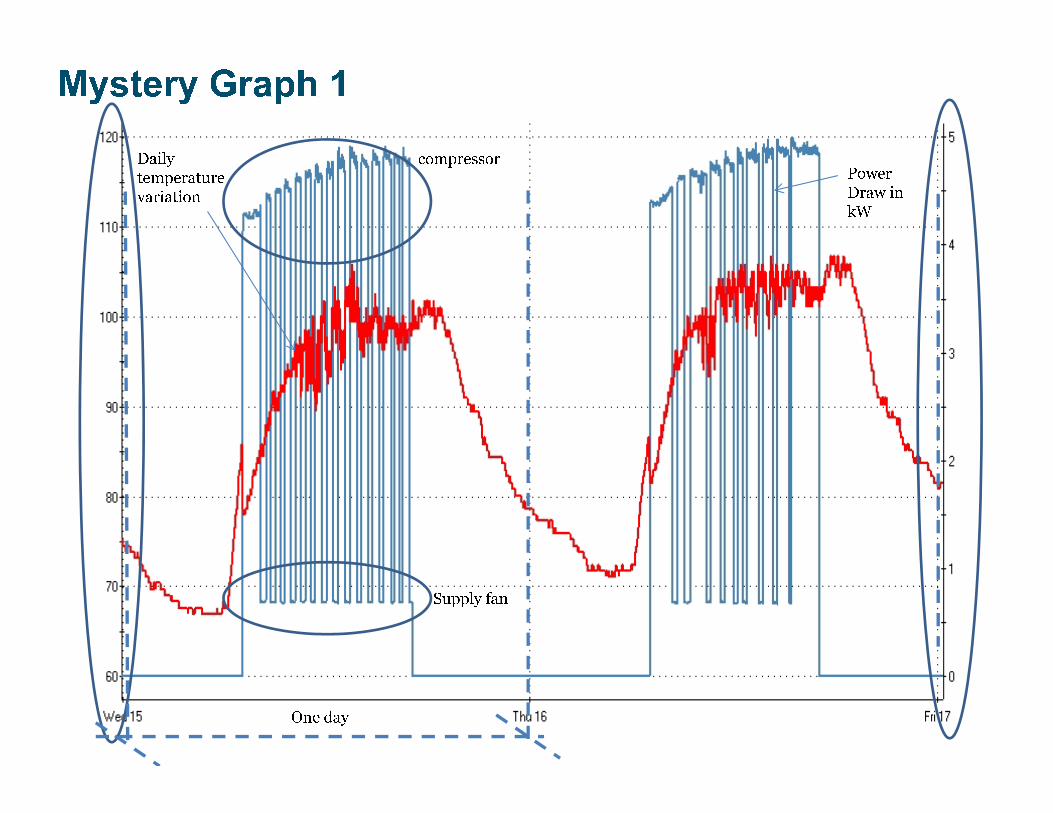
Mystery Graph 1
a. Leaving boiler temperature (L) and pump amps
(R) for a boiler loop used for space heating
b. Exterior illuminance (L) and interior illuminance
(R) in klux for a warehouse with skylights.
c. Outside air temperature (L) and power draw
(R) for a packaged unit with a single-stage of
cooling.
d. CO2 levels (L) and amps for the lighting
systems (R) at a movie theater.
e. % load (L) and amps (R) for a motor
used for ventilating a restroom in an
airport terminal.
(L) = variable references left axis
(R) = variable references right axis
This graph
illustrates:
a. daily electricity, natural gas and water use.
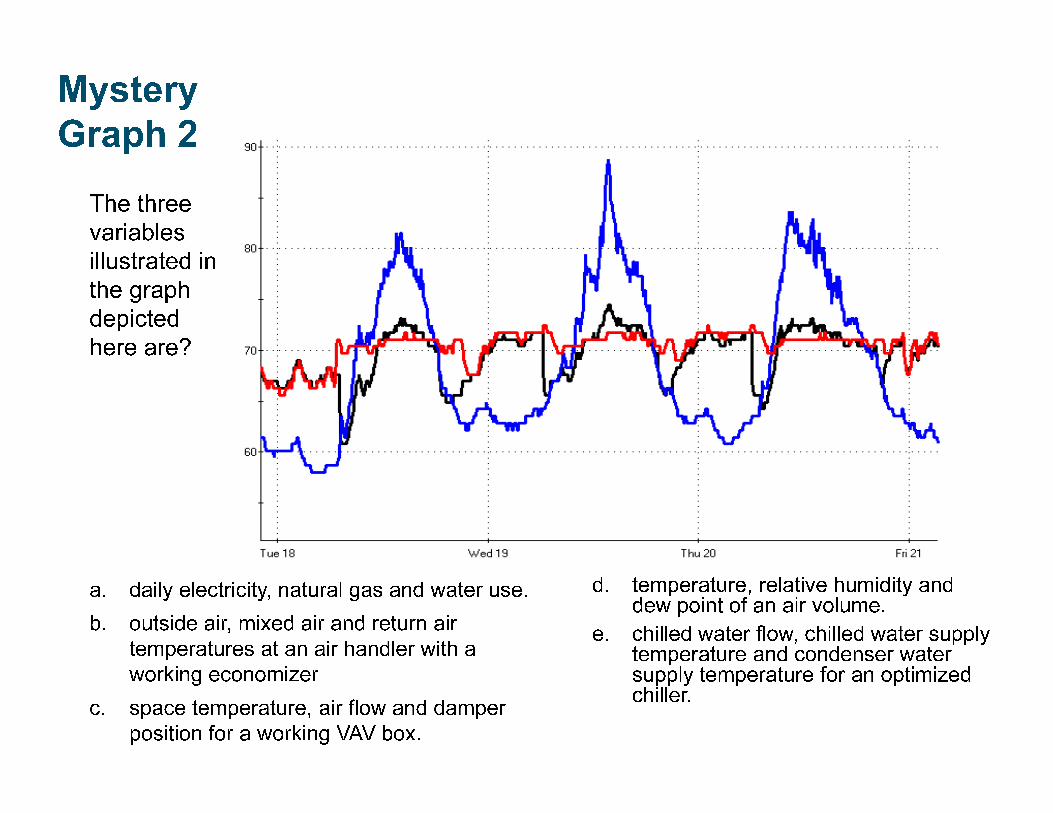
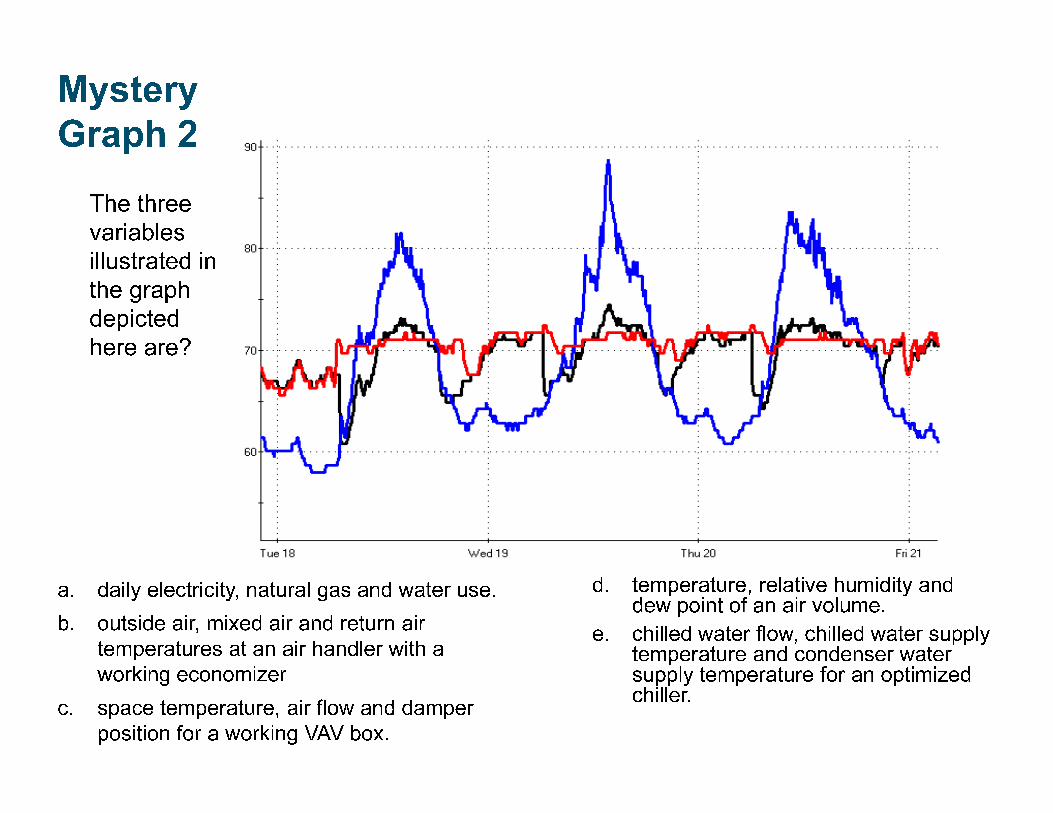
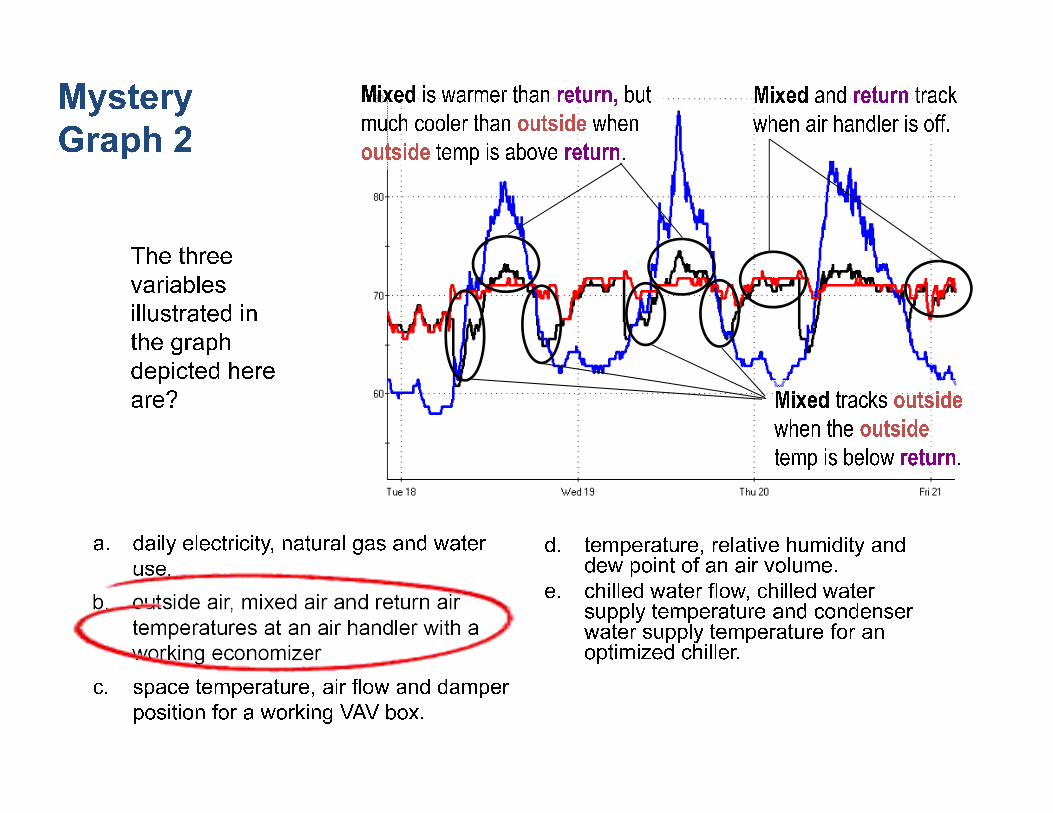
b. outside air, mixed air and return air
temperatures at an air handler with a
working economizer
c. space temperature, air flow and damper
position for a working VAV box.
d. temperature, relative humidity and dew point of an air volume.
e. chilled water flow, chilled water supply temperature and condenser water supply temperature for an optimized chiller.
Mystery
Graph 2
The three
variables
illustrated in
the graph
depicted
here are?
Mystery
Graph 3
Mystery Graph 2
40
50
60
70
80
90
100
08/12/04
12:00 AM
08/12/04
03:00 AM
08/12/04
06:00 AM
08/12/04
09:00 AM
08/12/04
12:00 PM
08/12/04
03:00 PM
08/12/04
06:00 PM
08/12/04
09:00 PM
08/13/04
12:00 AM
Date
Three inter-related parameters
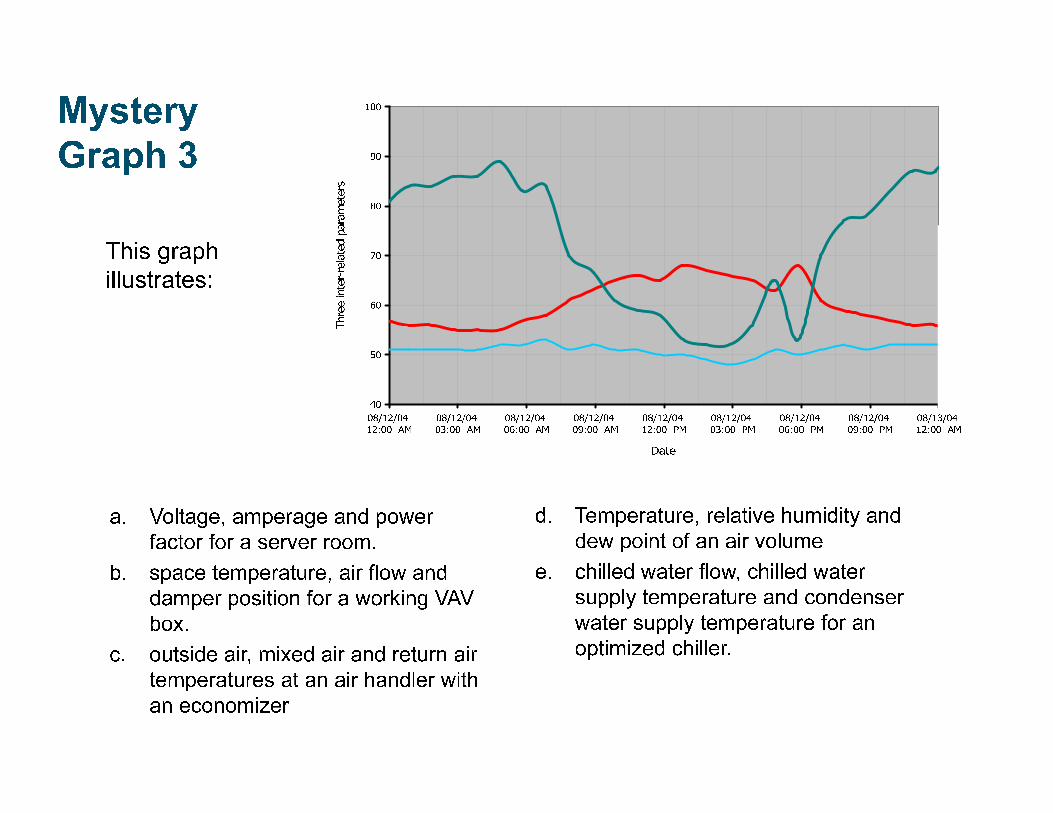
a. Voltage, amperage and power
factor for a server room.
b. space temperature, air flow and
damper position for a working VAV
box.
c. outside air, mixed air and return air
temperatures at an air handler with
an economizer
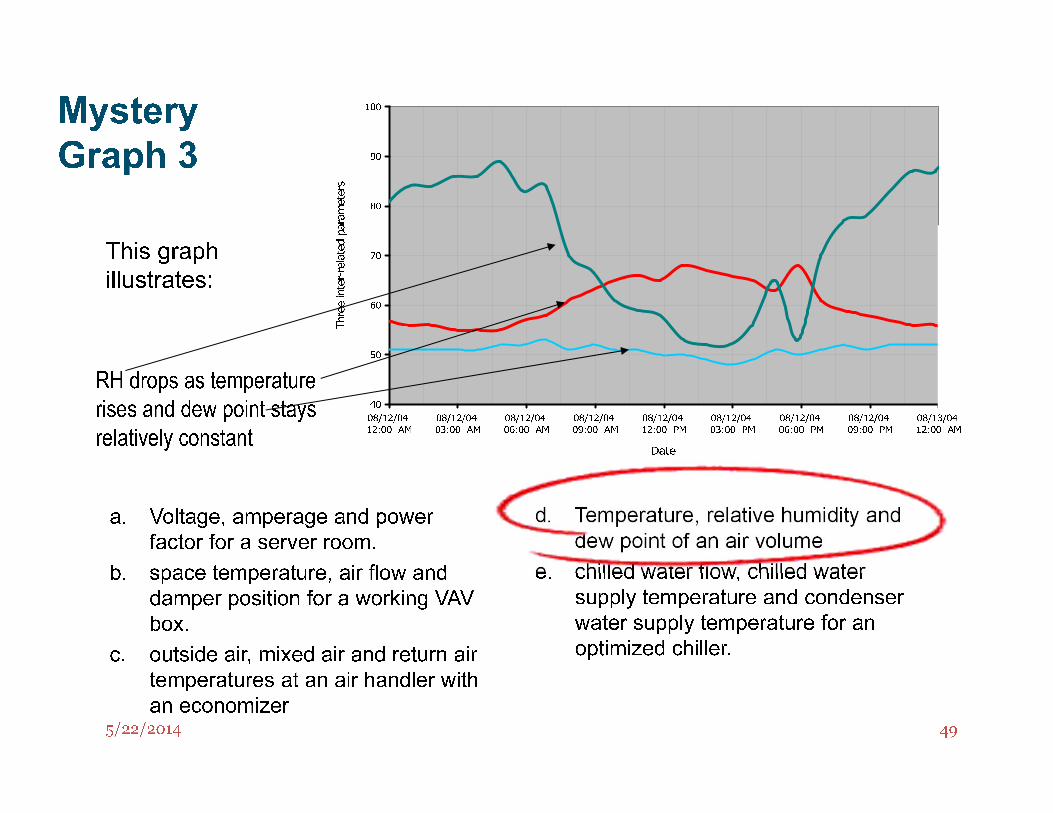
d. Temperature, relative humidity and
dew point of an air volume
e. chilled water flow, chilled water
supply temperature and condenser
water supply temperature for an
optimized chiller.
This graph
illustrates:
5/22/2014 10
Mystery
Graph 4
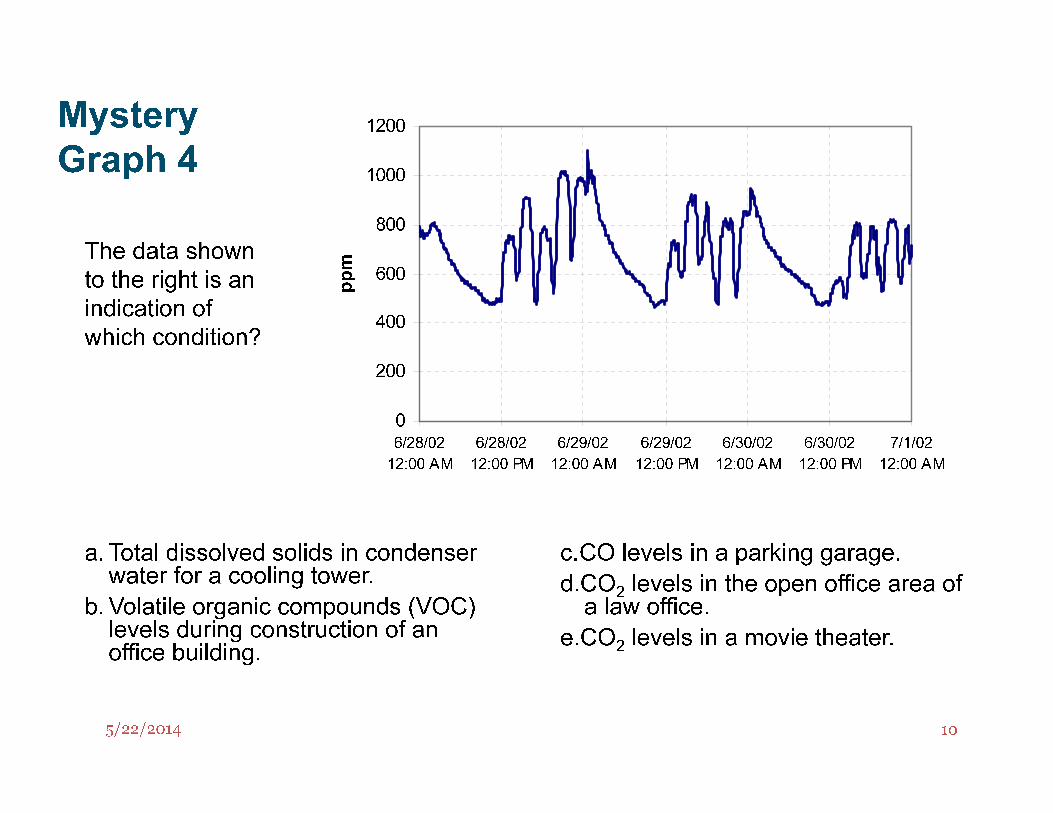
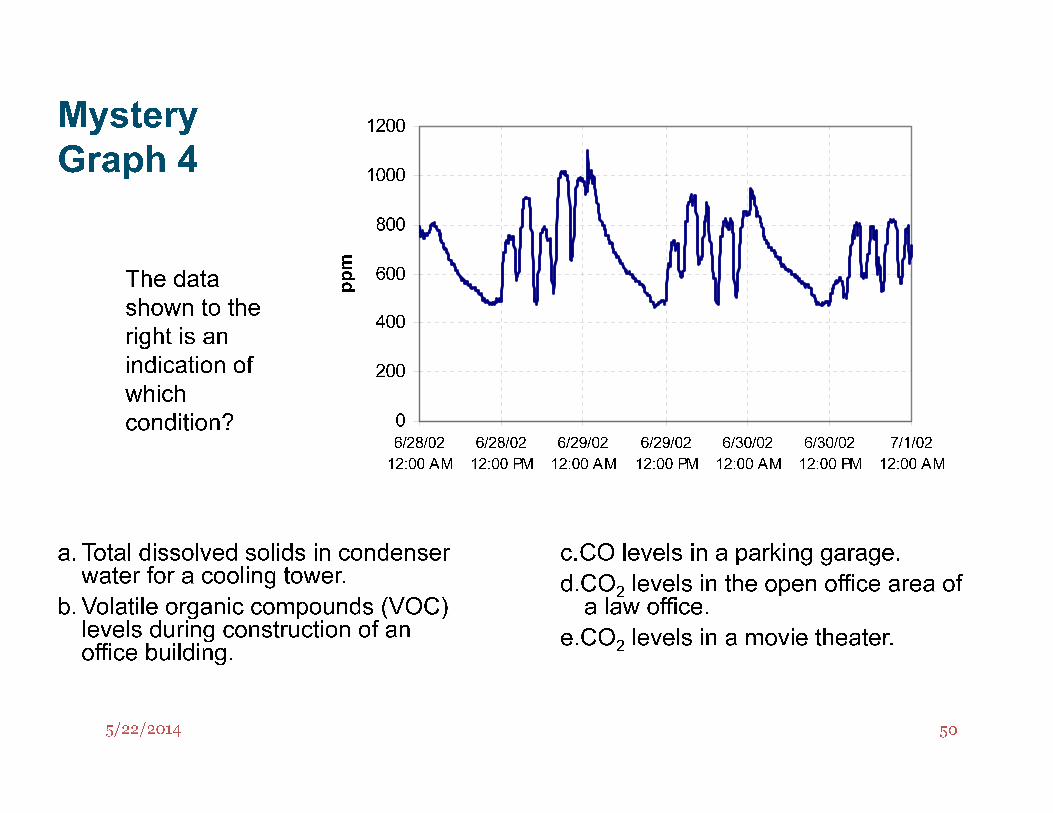
a. Total dissolved solids in condenser water for a cooling tower.
b. Volatile organic compounds (VOC) levels during construction of an office building.
c.CO levels in a parking garage.
d.CO2
levels in the open office area of a law office.
e.CO2
levels in a movie theater.
The data shown
to the right is an
indication of
which condition?
0
200
400
600
800
1000
1200
6/28/02
12:00 AM
6/28/02
12:00 PM
6/29/02
12:00 AM
6/29/02
12:00 PM
6/30/02
12:00 AM
6/30/02
12:00 PM
7/1/02
12:00 AM
ppm
5/22/2014 11
Mystery Graph
60
70
80
90
100
110
120
5/20/05 12:00
PM
5/21/05 12:00
AM
5/21/05 12:00
PM
5/22/05 12:00
AM
5/22/05 12:00
PM
5/23/05 12:00
AM
5/23/05 12:00
PM
5/24/05 12:00
AM
Date and time
Temperature, °F
Mystery
Graph 5
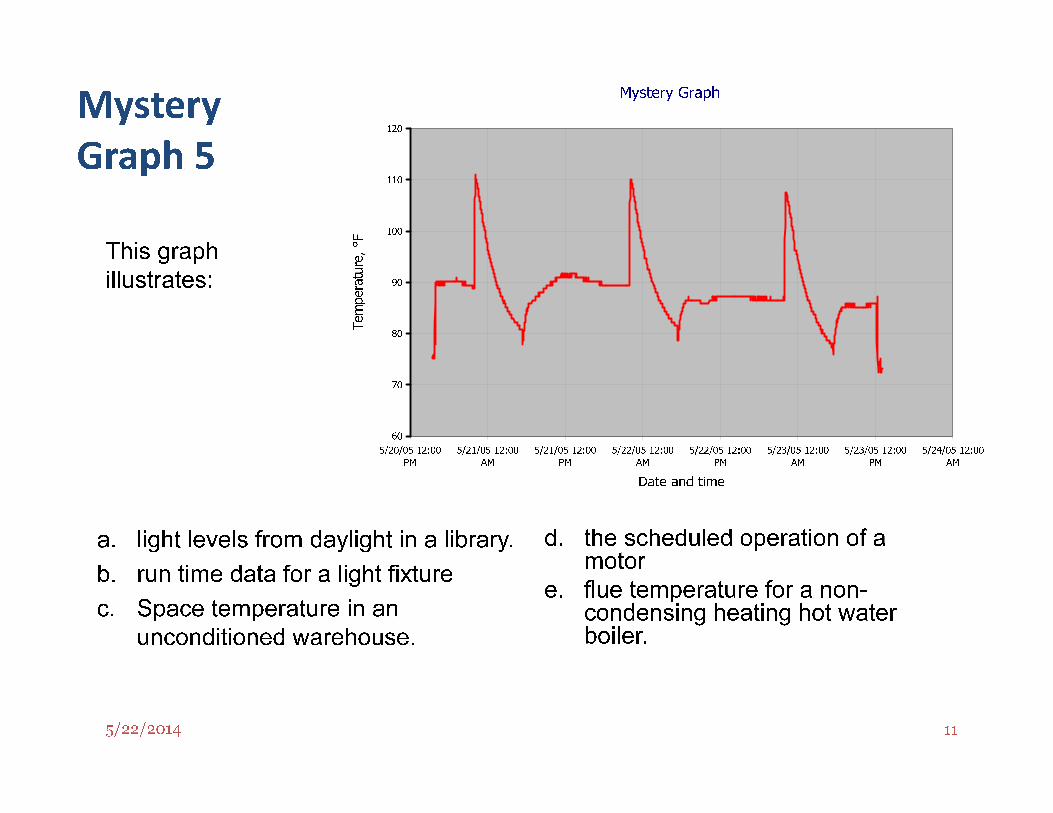
a. light levels from daylight in a library.
b. run time data for a light fixture
c. Space temperature in an
unconditioned warehouse.
d. the scheduled operation of a motor
e. flue temperature for a non-condensing heating hot water boiler.
This graph
illustrates:
5/22/2014 12
0
10
20
30
40
50
60
8/4/2011 9:00 8/4/2011 21:00 8/5/2011 9:00 8/5/2011 21:00 8/6/2011 9:00 8/6/2011 21:00 8/7/2011 9:00 8/7/2011 21:00 8/8/2011 9:00 8/8/2011 21:00 8/9/2011 9:00
0
50
100
150
200
250
300
350
400
450
500
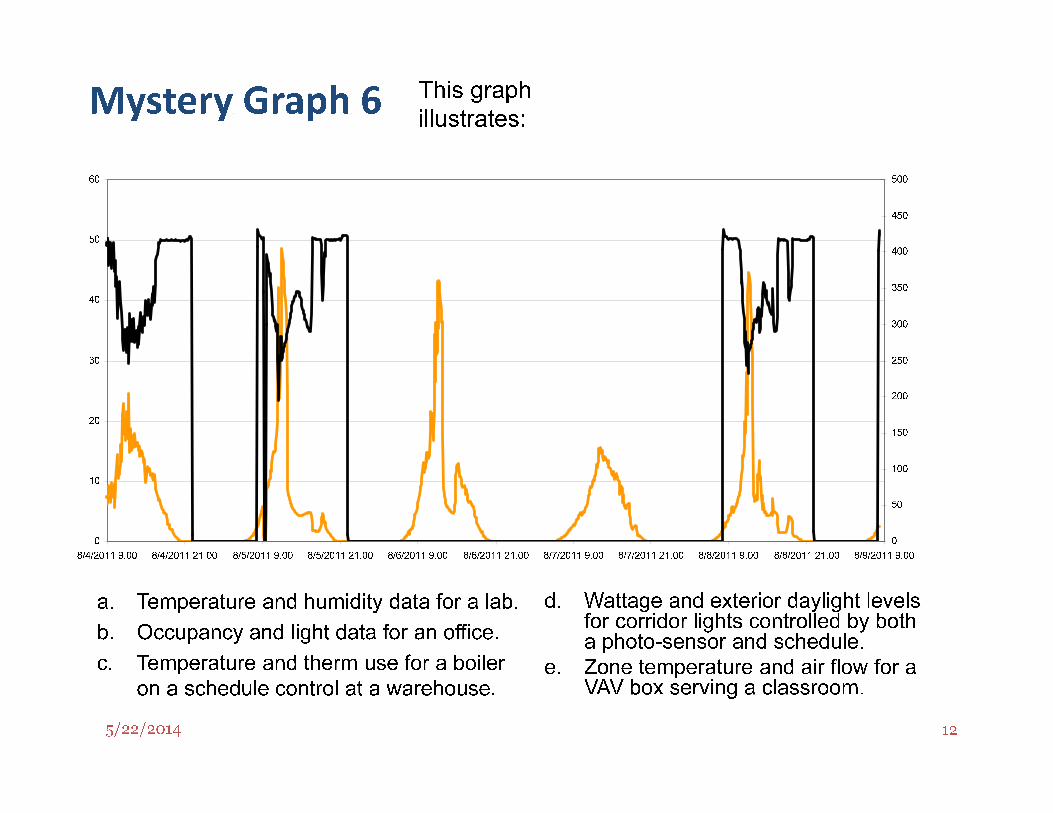
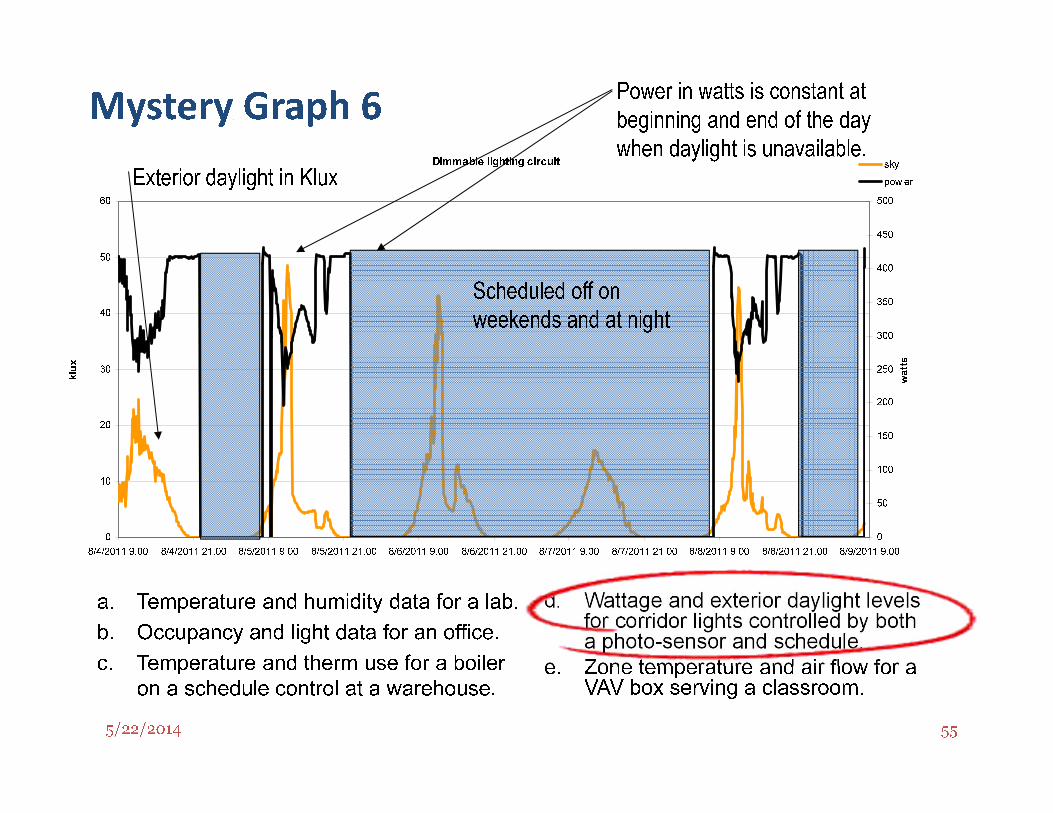
Mystery Graph 6
a. Temperature and humidity data for a lab.
b. Occupancy and light data for an office.
c. Temperature and therm use for a boiler
on a schedule control at a warehouse.
d. Wattage and exterior daylight levels for corridor lights controlled by both a photo-sensor and schedule.
e. Zone temperature and air flow for a VAV box serving a classroom.
This graph
illustrates:
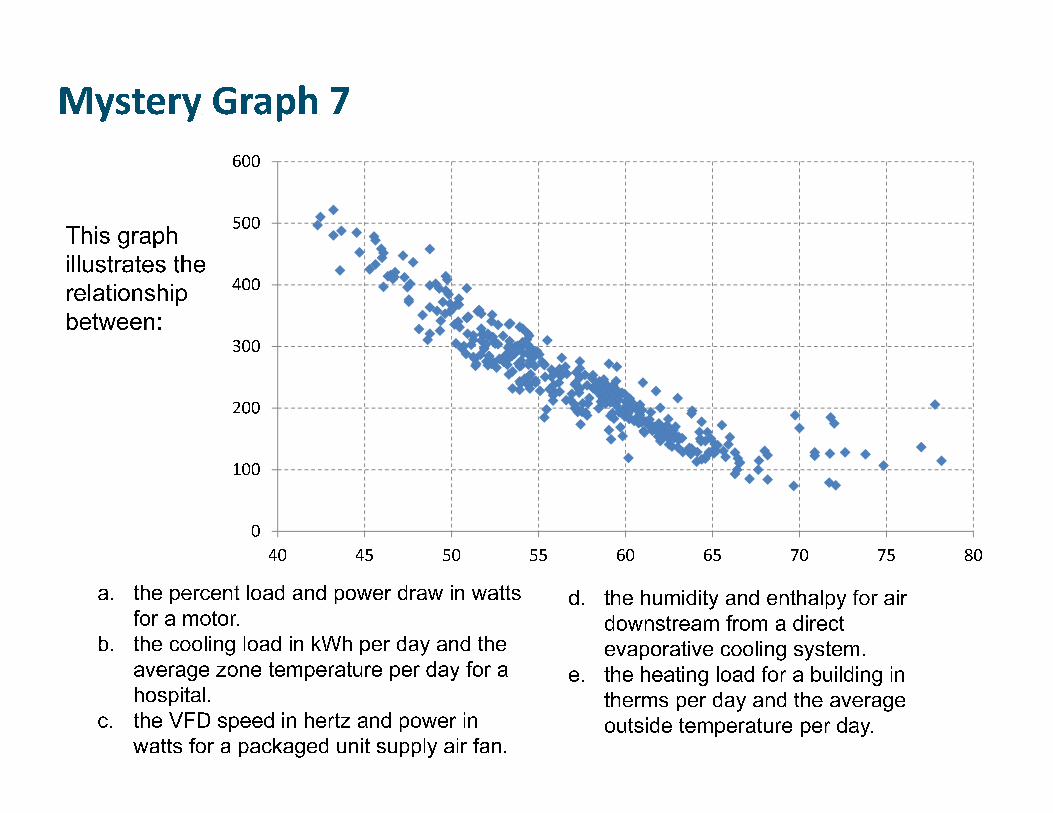
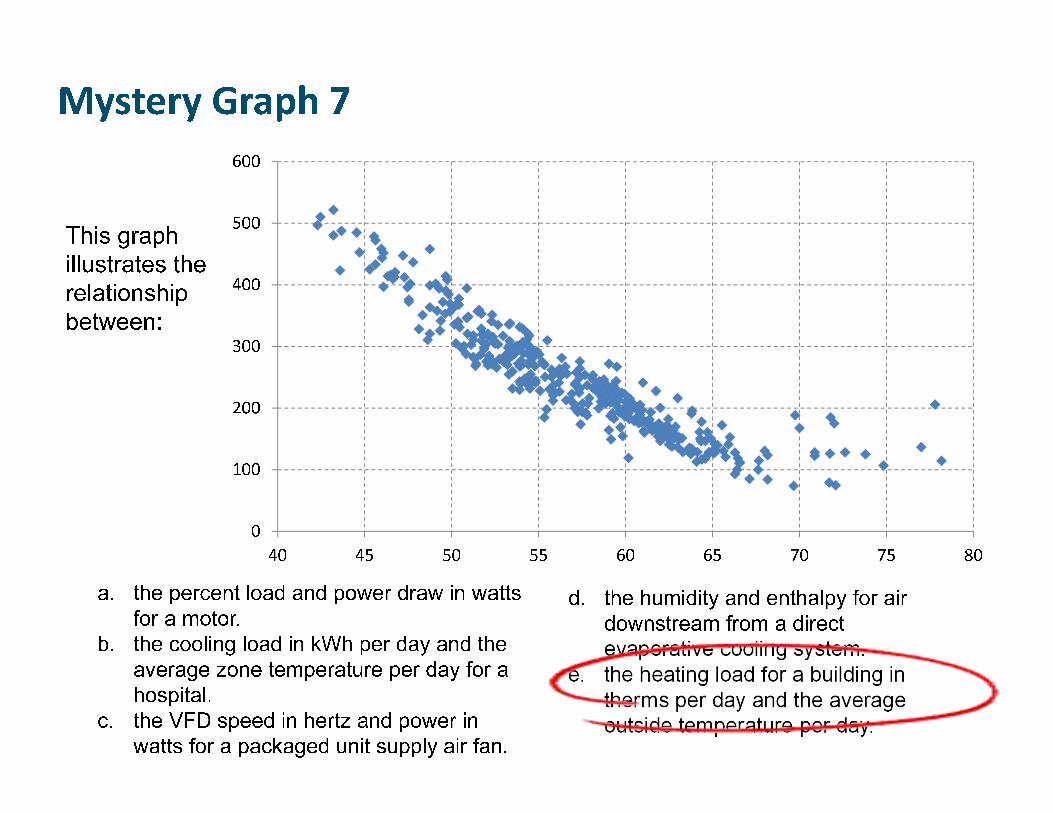
Mystery Graph 7
0
100
200
300
400
500
600
40 45 50 55 60 65 70 75 80
a. the percent load and power draw in watts
for a motor.
b. the cooling load in kWh per day and the
average zone temperature per day for a
hospital.
c. the VFD speed in hertz and power in
watts for a packaged unit supply air fan.
d. the humidity and enthalpy for air
downstream from a direct
evaporative cooling system.
e. the heating load for a building in
therms per day and the average
outside temperature per day.
This graph
illustrates the
relationship
between:
5/22/2014 14
Mystery
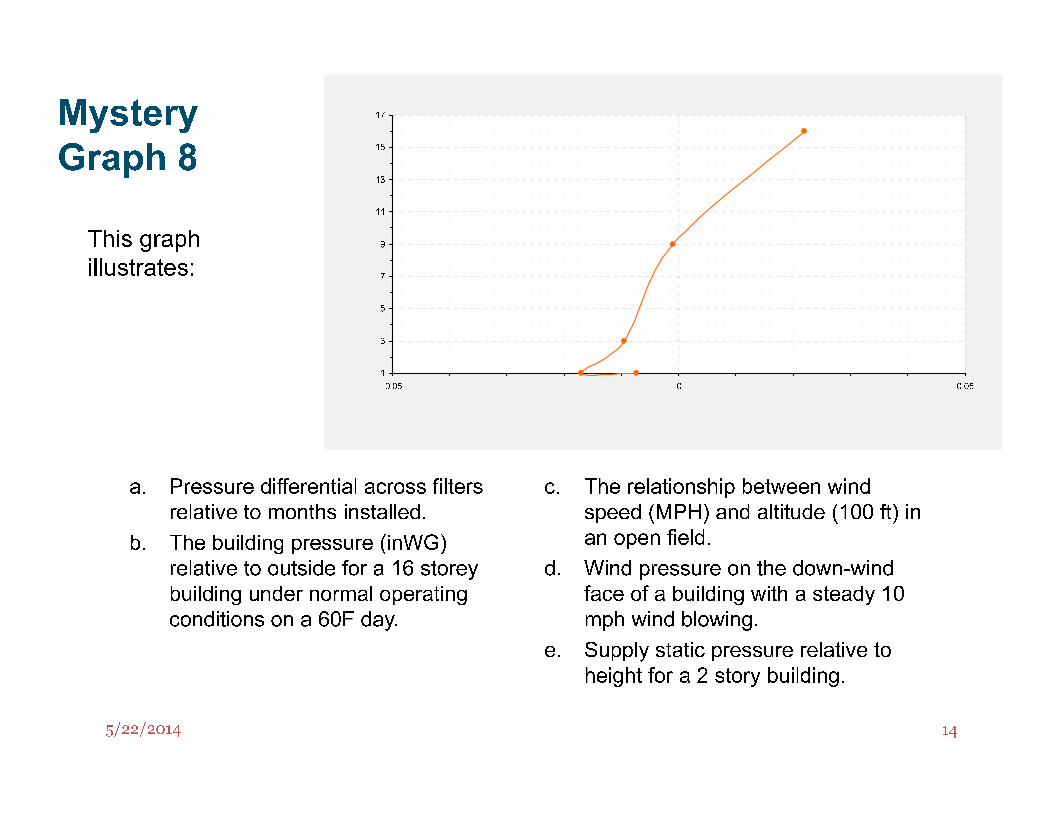
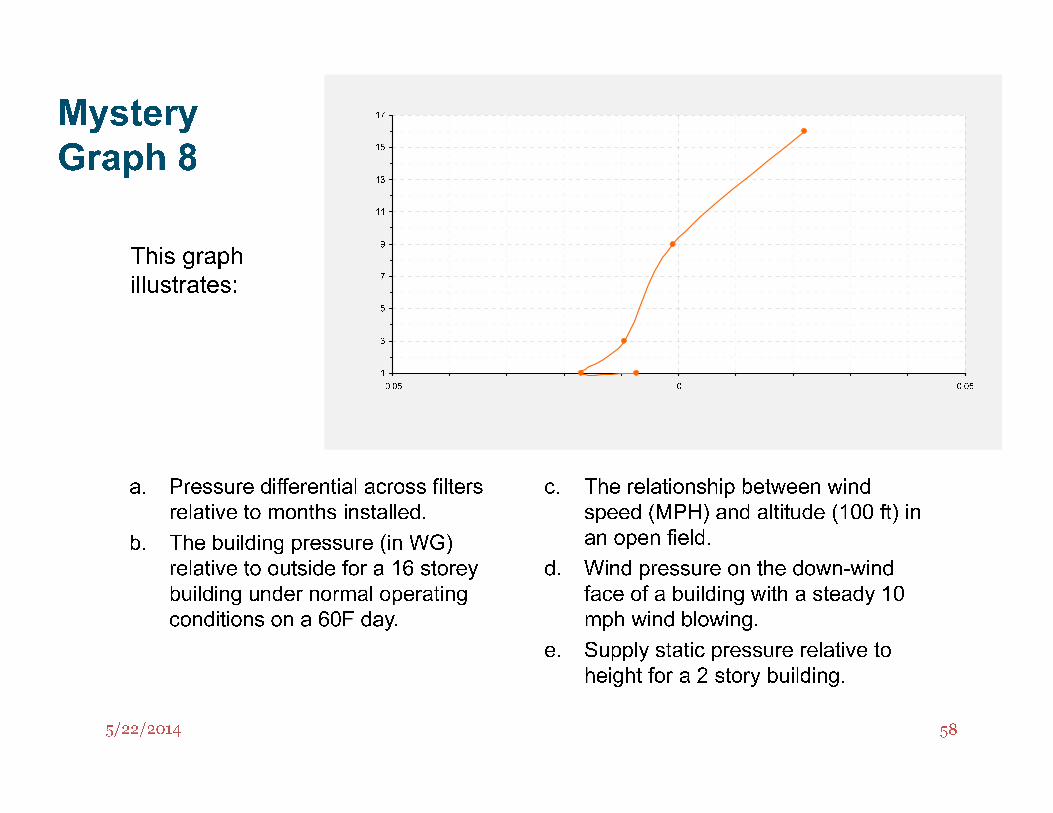
Graph 8
1
3
5
7
9
11
13
15
17
-0.05 0 0.05
a. Pressure differential across filters
relative to months installed.
b. The building pressure (inWG)
relative to outside for a 16 storey
building under normal operating
conditions on a 60F day.
c. The relationship between wind
speed (MPH) and altitude (100 ft) in
an open field.
d. Wind pressure on the down-wind
face of a building with a steady 10
mph wind blowing.
e. Supply static pressure relative to
height for a 2 story building.
This graph
illustrates:
5/22/2014 15
Mystery
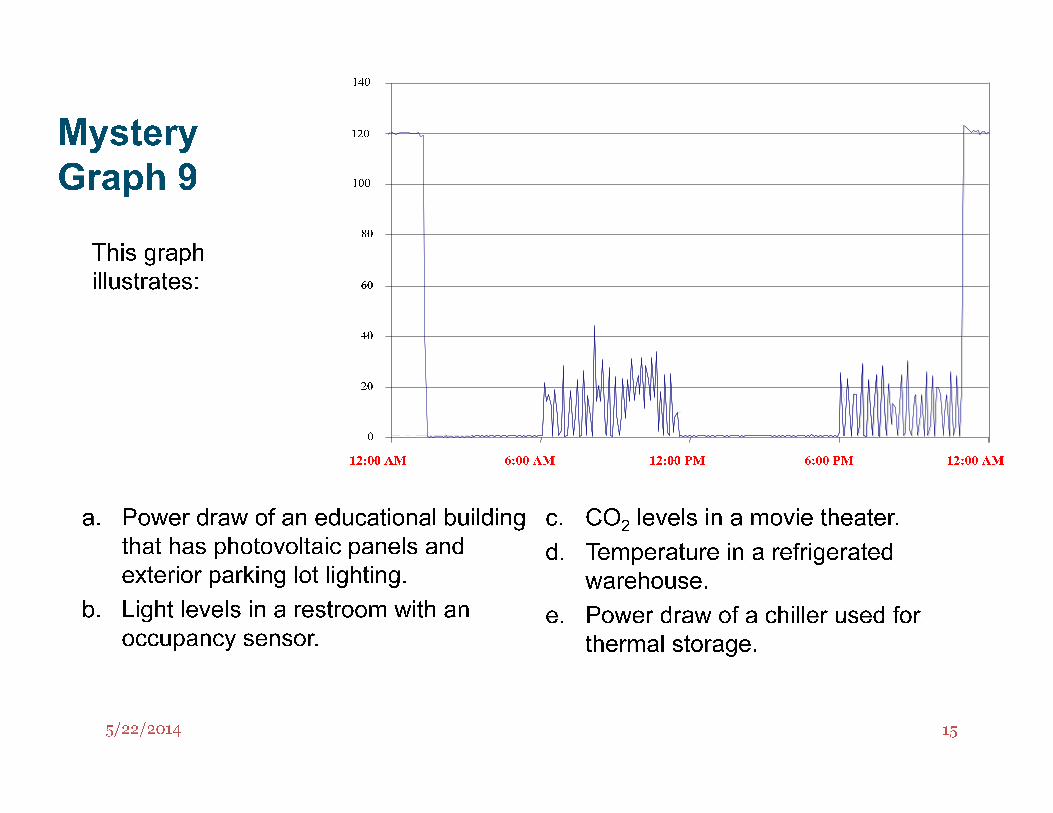
Graph 9
0
20
40
60
80
100
120
140
12:00 AM 6:00 AM 12:00 PM 6:00 PM 12:00 AM
0
20
40
60
80
100
120
140
12:00 AM 6:00 AM 12:00 PM 6:00 PM 12:00 AM
a. Power draw of an educational building
that has photovoltaic panels and
exterior parking lot lighting.
b. Light levels in a restroom with an
occupancy sensor.
c. CO2
levels in a movie theater.
d. Temperature in a refrigerated
warehouse.
e. Power draw of a chiller used for
thermal storage.
This graph
illustrates:

Mystery Graph 10
0
5,000
10,000
15,000
20,000
25,000
0 500,000 1,000,000 1,500,000 2,000,000
DA
B
EC
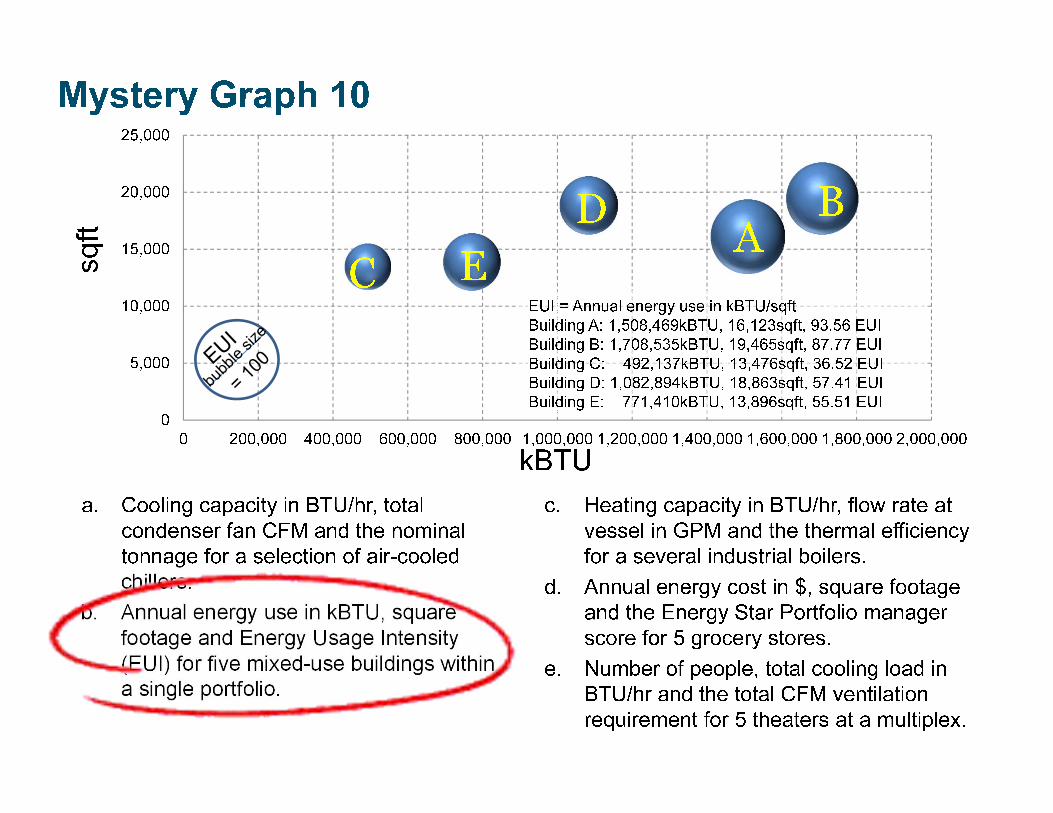
a. Cooling capacity in BTU/hr, total condenser fan CFM and the nominal tonnage for a selection of air-cooled chillers.
b. Annual energy use in kBTU, square footage and Energy Usage Intensity (EUI) for five mixed-use buildings within a single portfolio.
c. Heating capacity in BTU/hr, flow rate at vessel in GPM and the thermal efficiency for a several industrial boilers.
d. Annual energy cost in $, square footage and the Energy Star Portfolio manager score for 5 grocery stores.
e. Number of people, total cooling load in BTU/hr and the total CFM ventilation requirement for 5 theaters at a multiplex.
This
graph
illustrates:
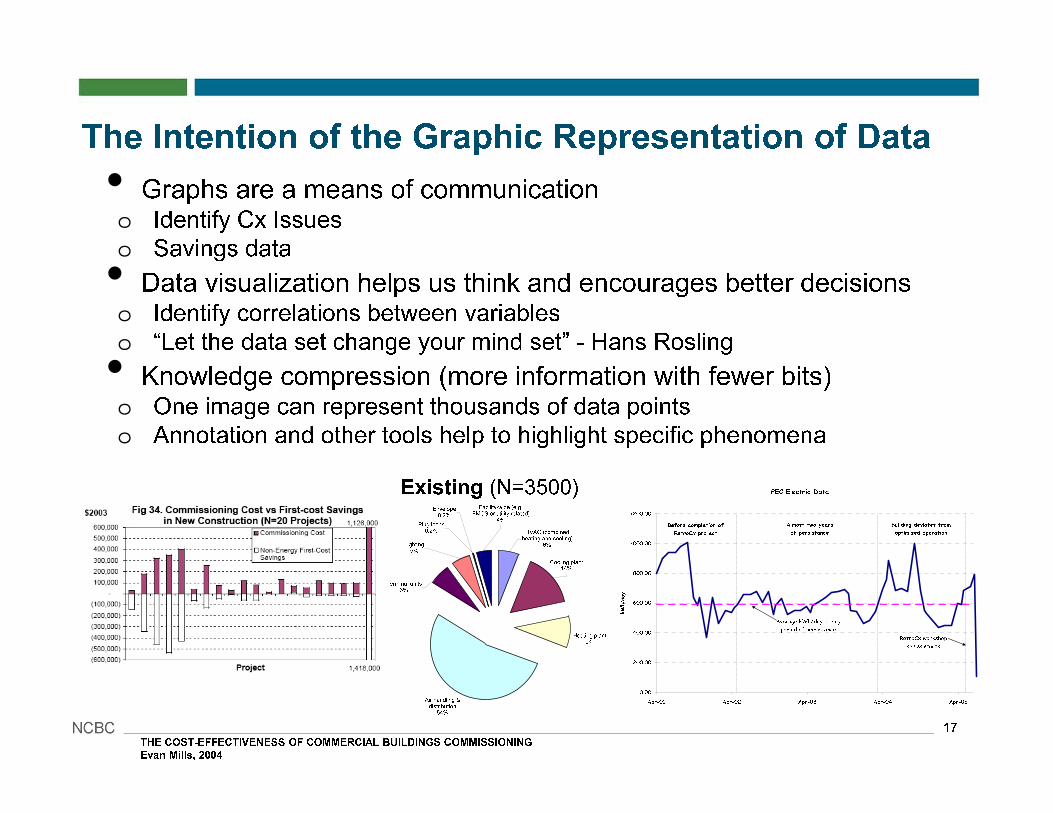
• Graphs are a means of communicationo Identify Cx Issues
o Savings data
• Data visualization helps us think and encourages better decisionso Identify correlations between variables
o “Let the data set change your mind set” - Hans Rosling
• Knowledge compression (more information with fewer bits)o One image can represent thousands of data points
o Annotation and other tools help to highlight specific phenomena
17
The Intention of the Graphic Representation of Data
PEC Electric Data
0.00
200.00
400.00
600.00
800.00
1000.00
1200.00
Apr-01 Apr-02 Apr-03 Apr-04 Apr-05
kWh/day
Before completion of
RetroCx project
Almost two years
of persistance
Building deviates from
optimized operation
Average kWh/day during
period of persistance
RetroCx workshop
series starts
Air handling & distribution
54%
Cooling plant16%
Heating plant9%
HVAC (combined heating and cooling)
6%Lighting5%
Terminal units6%
Facility-wide (e.g. EMCS or utility related)
4%Plug loads
0.2%
Envelope0.2%
Existing (N=3500)
THE COST-EFFECTIVENESS OF COMMERCIAL BUILDINGS COMMISSIONING
Evan Mills, 2004
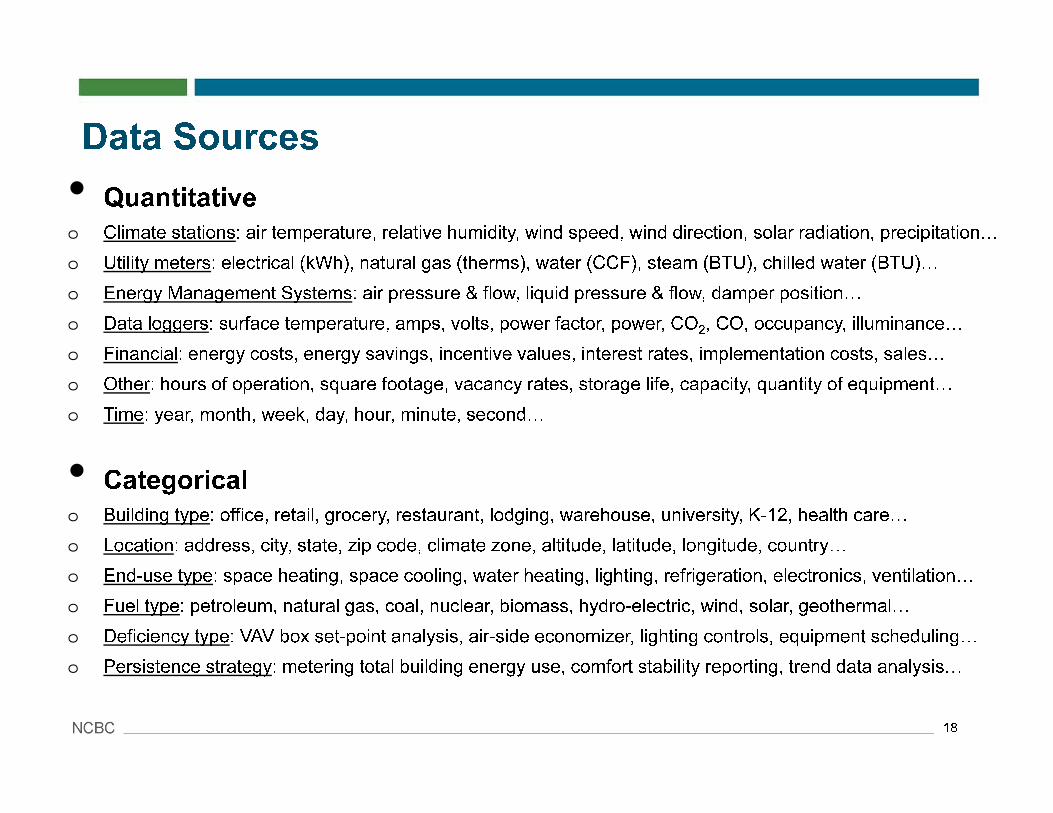
• Quantitative
o Climate stations: air temperature, relative humidity, wind speed, wind direction, solar radiation, precipitation�
o Utility meters: electrical (kWh), natural gas (therms), water (CCF), steam (BTU), chilled water (BTU)�
o Energy Management Systems: air pressure & flow, liquid pressure & flow, damper position�
o Data loggers: surface temperature, amps, volts, power factor, power, CO2, CO, occupancy, illuminance�
o Financial: energy costs, energy savings, incentive values, interest rates, implementation costs, sales�
o Other: hours of operation, square footage, vacancy rates, storage life, capacity, quantity of equipment�
o Time: year, month, week, day, hour, minute, second�
• Categorical
o Building type: office, retail, grocery, restaurant, lodging, warehouse, university, K-12, health care�
o Location: address, city, state, zip code, climate zone, altitude, latitude, longitude, country�
o End-use type: space heating, space cooling, water heating, lighting, refrigeration, electronics, ventilation�
o Fuel type: petroleum, natural gas, coal, nuclear, biomass, hydro-electric, wind, solar, geothermal�
o Deficiency type: VAV box set-point analysis, air-side economizer, lighting controls, equipment scheduling�
o Persistence strategy: metering total building energy use, comfort stability reporting, trend data analysis�
18
Data Sources

19
Graph Types and Applications
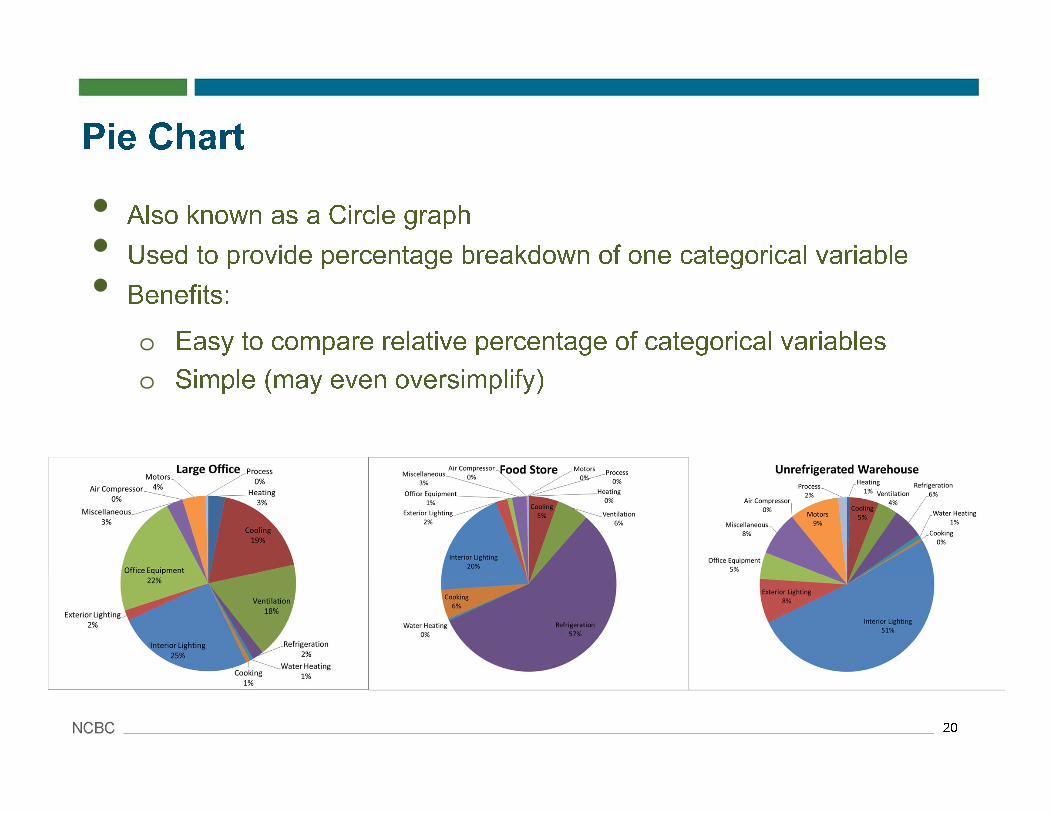
• Also known as a Circle graph
• Used to provide percentage breakdown of one categorical variable
• Benefits:
o Easy to compare relative percentage of categorical variables
o Simple (may even oversimplify)
20
Pie Chart
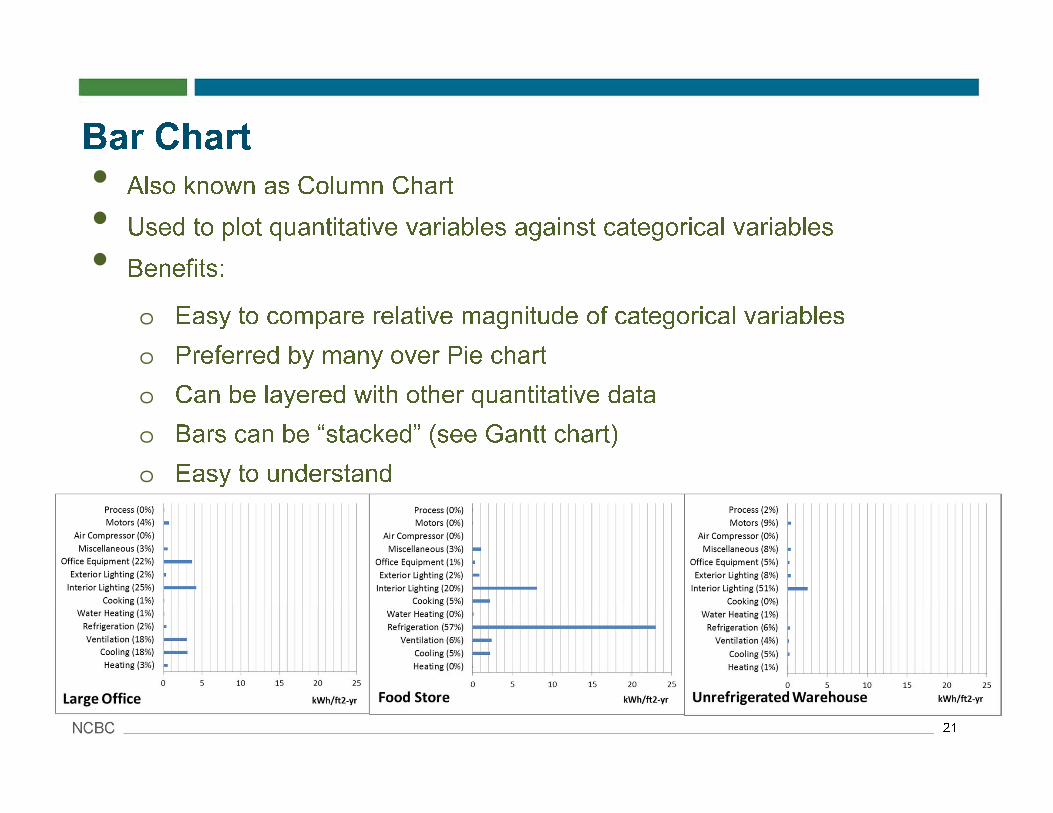
• Also known as Column Chart
• Used to plot quantitative variables against categorical variables
• Benefits:
o Easy to compare relative magnitude of categorical variables
o Preferred by many over Pie chart
o Can be layered with other quantitative data
o Bars can be “stacked” (see Gantt chart)
o Easy to understand
21
Bar Chart
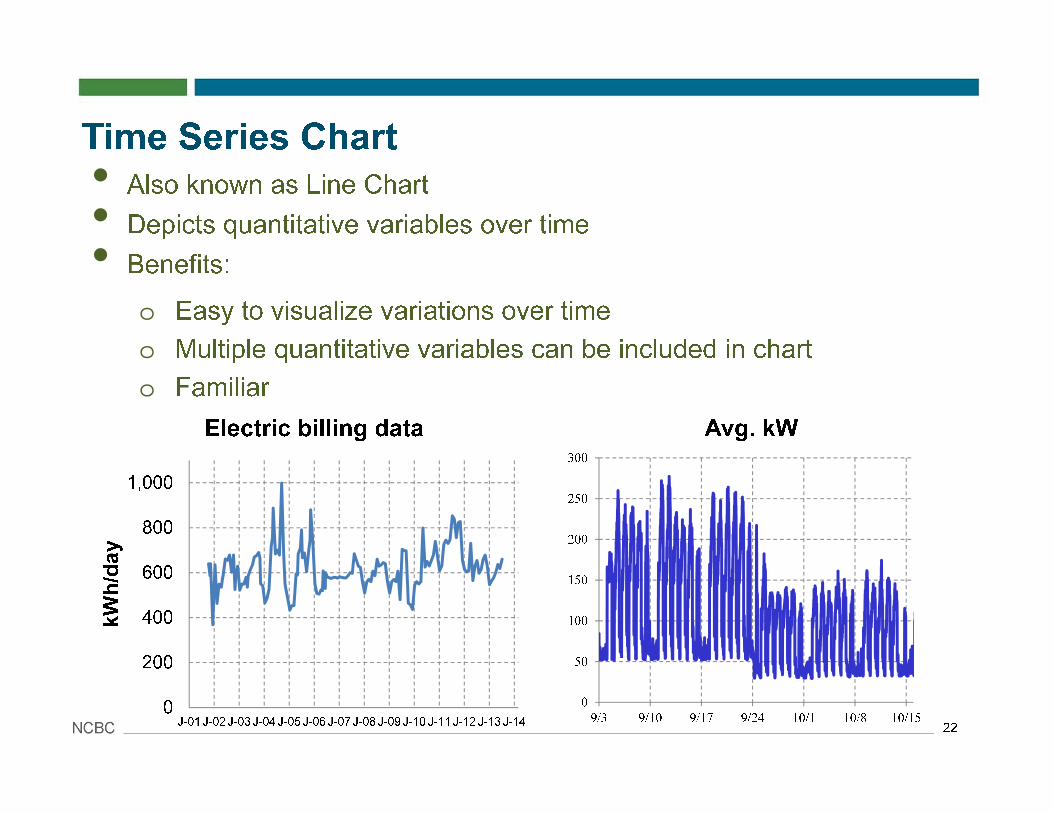
• Also known as Line Chart
• Depicts quantitative variables over time
• Benefits:
o Easy to visualize variations over time
o Multiple quantitative variables can be included in chart
o Familiar
22
Time Series Chart
0
50
100
150
200
250
300
9/3 9/10 9/17 9/24 10/1 10/8 10/15
Avg. kW
0
200
400
600
800
1,000
J-01 J-02J-03 J-04J-05 J-06J-07J-08 J-09J-10 J-11J-12 J-13J-14
kWh/day
Electric billing data
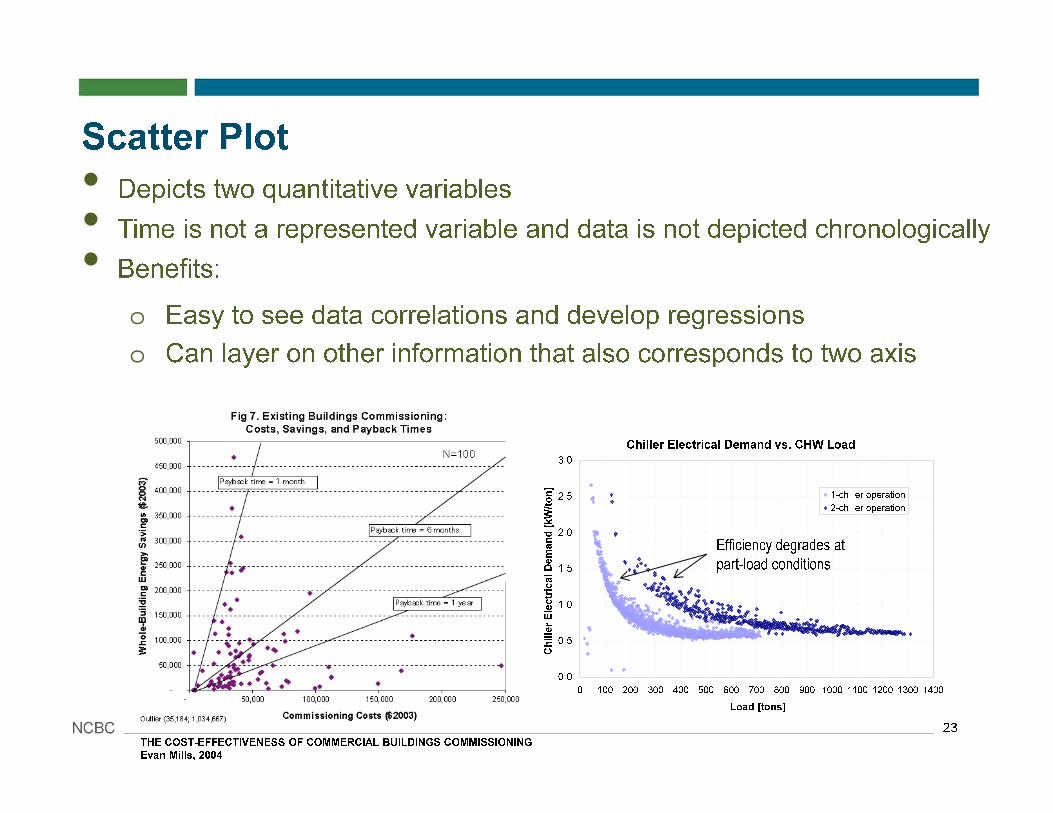
• Depicts two quantitative variables
• Time is not a represented variable and data is not depicted chronologically
• Benefits:
o Easy to see data correlations and develop regressions
o Can layer on other information that also corresponds to two axis
23
Scatter Plot
THE COST-EFFECTIVENESS OF COMMERCIAL BUILDINGS COMMISSIONING
Evan Mills, 2004
Chiller Electrical Demand vs. CHW Load
0.0
0.5
1.0
1.5
2.0
2.5
3.0
0 100 200 300 400 500 600 700 800 900 1000 1100 1200 1300 1400
Load [tons]
Chiller Electrical Demand [kW/ton]
1-chiller operation
2-chiller operation
Efficiency degrades at
part-load conditions
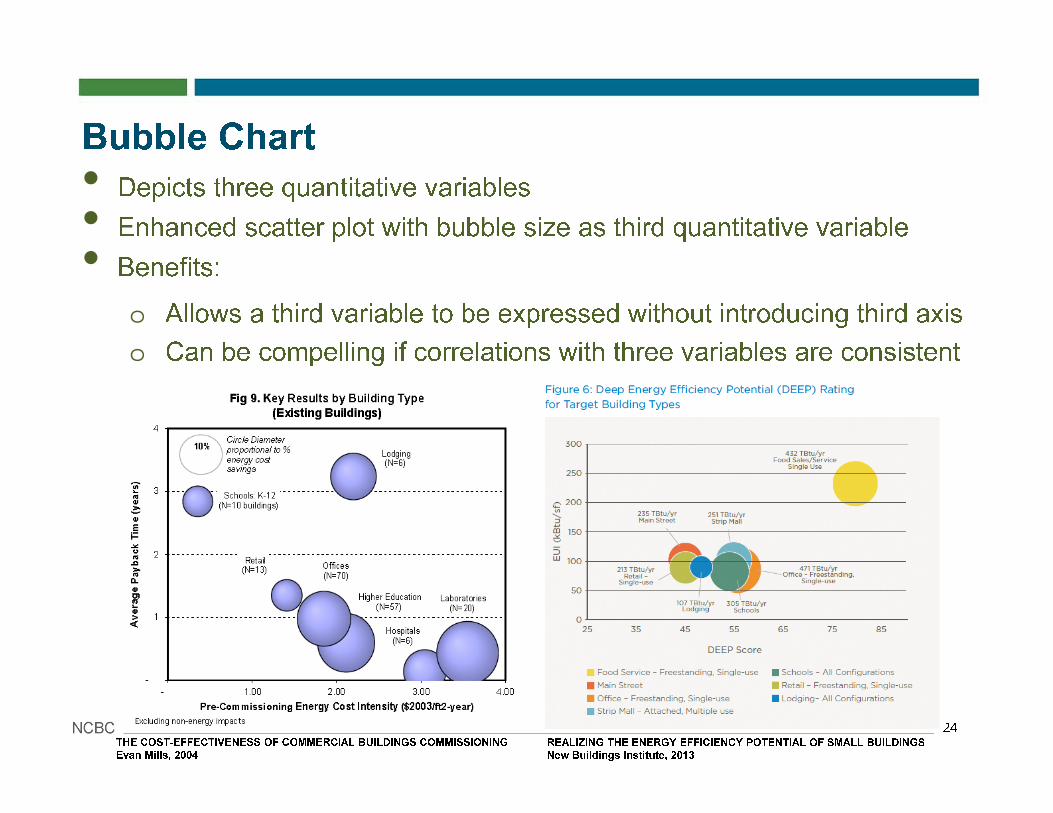
• Depicts three quantitative variables
• Enhanced scatter plot with bubble size as third quantitative variable
• Benefits:
o Allows a third variable to be expressed without introducing third axis
o Can be compelling if correlations with three variables are consistent
24
Bubble Chart
THE COST-EFFECTIVENESS OF COMMERCIAL BUILDINGS COMMISSIONING
Evan Mills, 2004
REALIZING THE ENERGY EFFICIENCY POTENTIAL OF SMALL BUILDINGS
New Buildings Institute, 2013
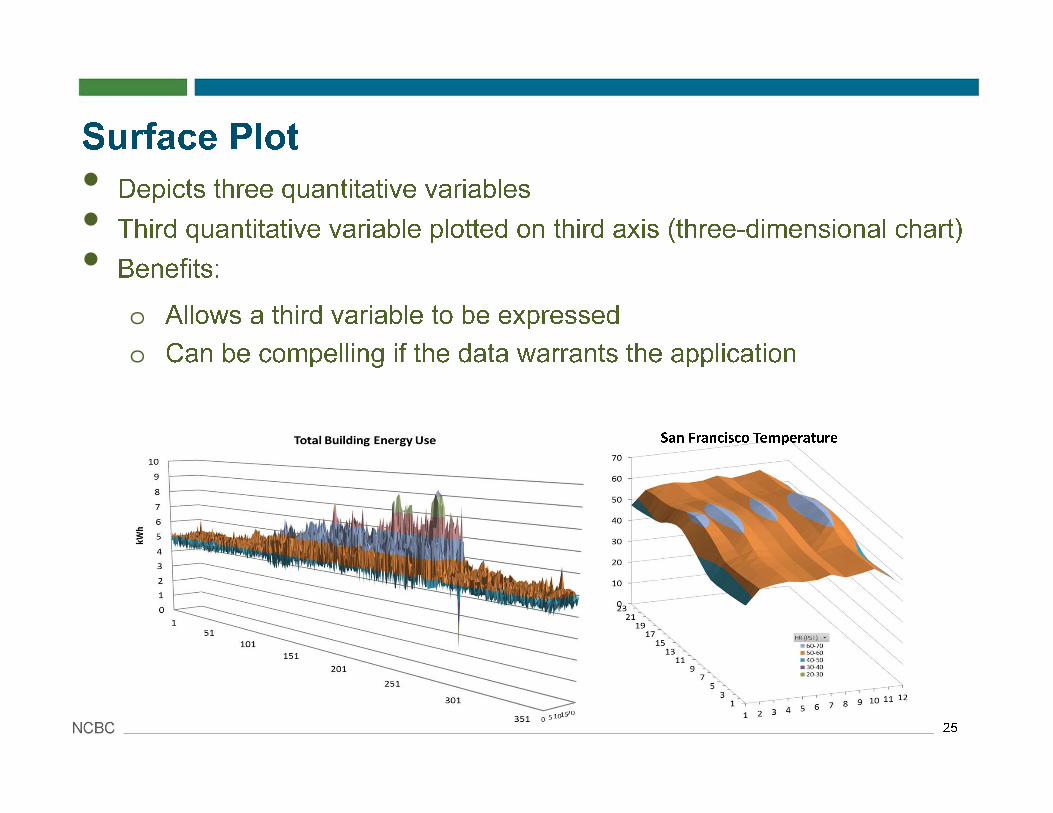
• Depicts three quantitative variables
• Third quantitative variable plotted on third axis (three-dimensional chart)
• Benefits:
o Allows a third variable to be expressed
o Can be compelling if the data warrants the application
25
Surface Plot
San Francisco Temperature
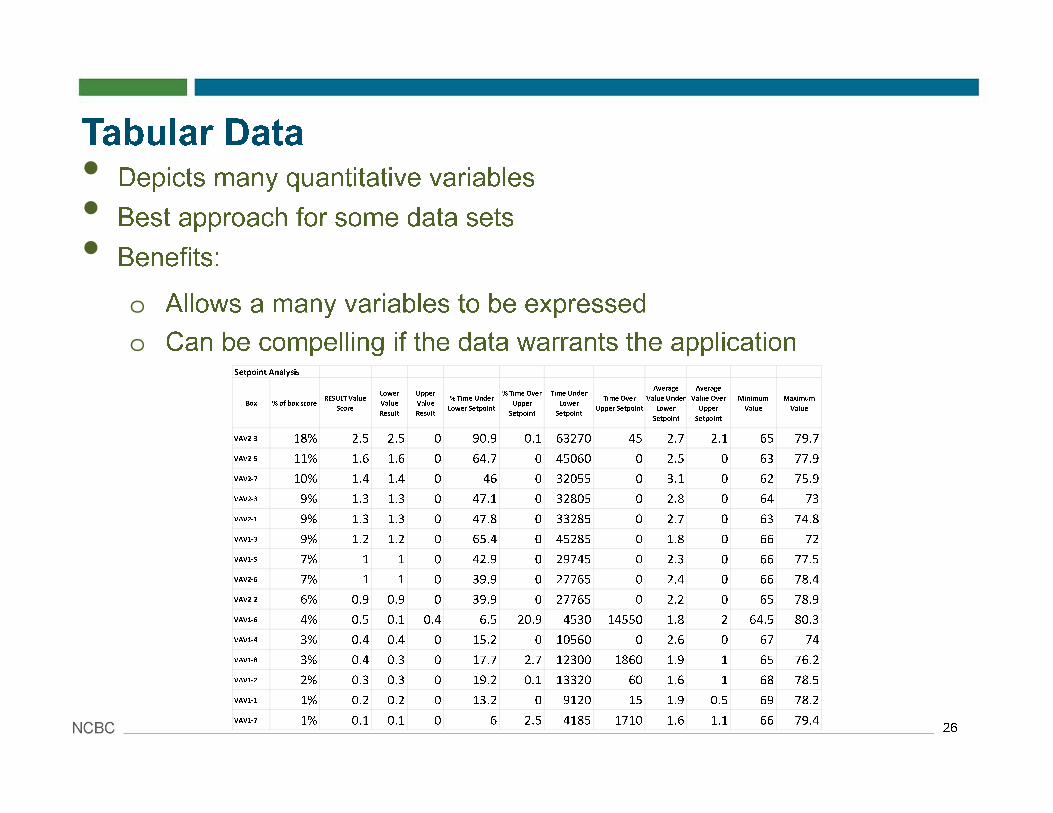
• Depicts many quantitative variables
• Best approach for some data sets
• Benefits:
o Allows a many variables to be expressed
o Can be compelling if the data warrants the application
26
Tabular Data
Setpoint Analysis
Box % of box scoreRESULT Value
Score
Lower
Value
Result
Upper
Value
Result
% Time Under
Lower Setpoint
% Time Over
Upper
Setpoint
Time Under
Lower
Setpoint
Time Over
Upper Setpoint
Average
Value Under
Lower
Setpoint
Average
Value Over
Upper
Setpoint
Minimum
Value
Maximum
Value
VAV2-3 18% 2.5 2.5 0 90.9 0.1 63270 45 2.7 2.1 65 79.7
VAV2-5 11% 1.6 1.6 0 64.7 0 45060 0 2.5 0 63 77.9
VAV2-7 10% 1.4 1.4 0 46 0 32055 0 3.1 0 62 75.9
VAV2-3 9% 1.3 1.3 0 47.1 0 32805 0 2.8 0 64 73
VAV2-1 9% 1.3 1.3 0 47.8 0 33285 0 2.7 0 63 74.8
VAV1-3 9% 1.2 1.2 0 65.4 0 45285 0 1.8 0 66 72
VAV1-5 7% 1 1 0 42.9 0 29745 0 2.3 0 66 77.5
VAV2-6 7% 1 1 0 39.9 0 27765 0 2.4 0 66 78.4
VAV2-2 6% 0.9 0.9 0 39.9 0 27765 0 2.2 0 65 78.9
VAV1-6 4% 0.5 0.1 0.4 6.5 20.9 4530 14550 1.8 2 64.5 80.3
VAV1-4 3% 0.4 0.4 0 15.2 0 10560 0 2.6 0 67 74
VAV1-8 3% 0.4 0.3 0 17.7 2.7 12300 1860 1.9 1 65 76.2
VAV1-2 2% 0.3 0.3 0 19.2 0.1 13320 60 1.6 1 68 78.5
VAV1-1 1% 0.2 0.2 0 13.2 0 9120 15 1.9 0.5 69 78.2
VAV1-7 1% 0.1 0.1 0 6 2.5 4185 1710 1.6 1.1 66 79.4

27
Graphic Excellence
28
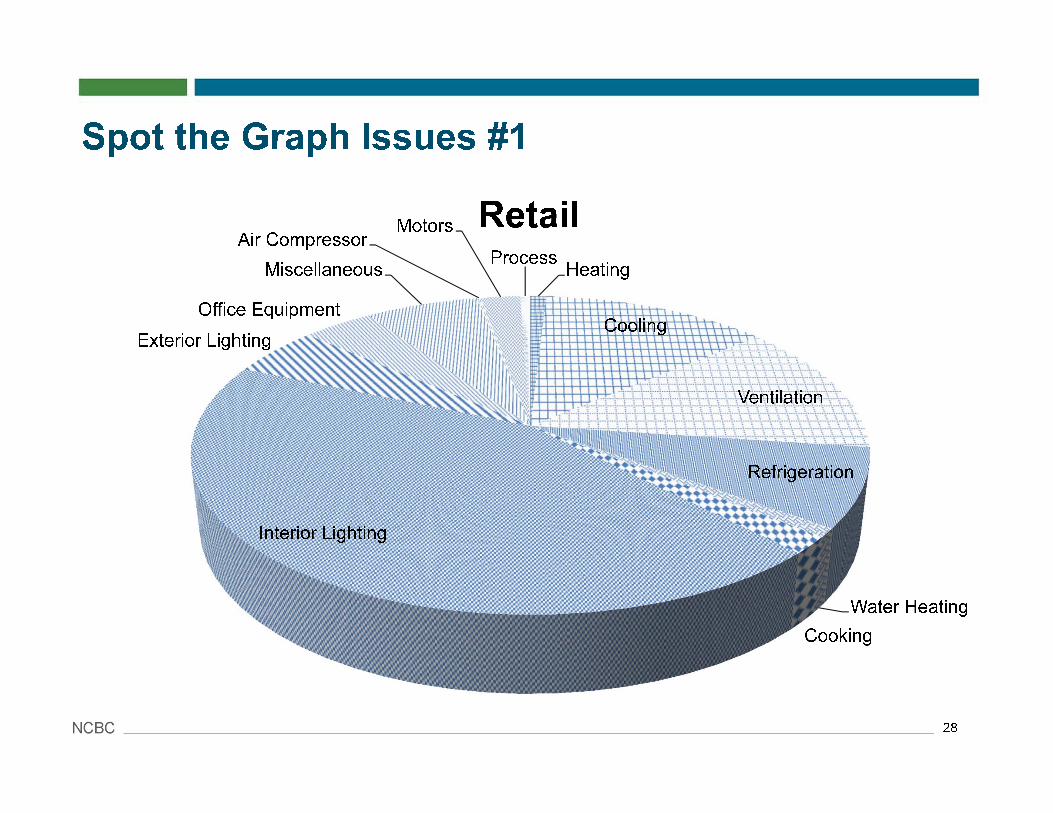
Spot the Graph Issues #1
Heating
Cooling
Ventilation
Refrigeration
Water Heating
Cooking
Interior Lighting
Exterior Lighting
Office Equipment
Miscellaneous
Air CompressorMotors
Process
Retail
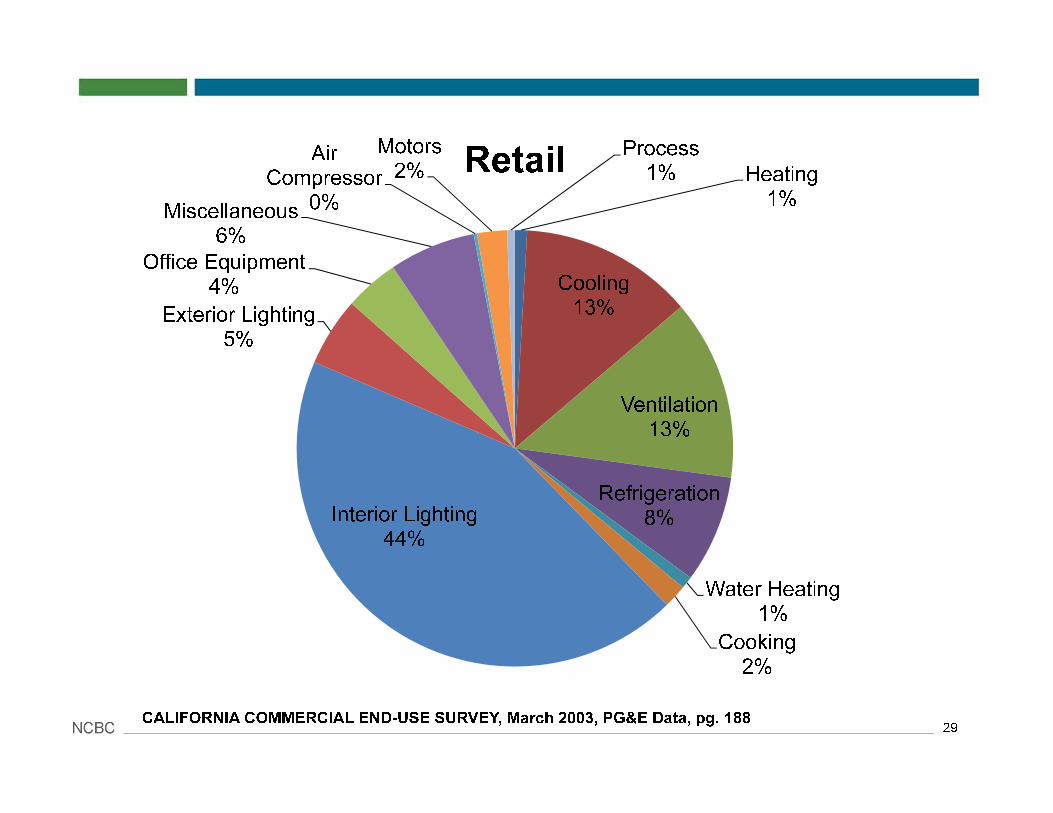
29
Heating1%
Cooling13%
Ventilation13%
Refrigeration8%
Water Heating1%
Cooking2%
Interior Lighting44%
Exterior Lighting5%
Office Equipment4%
Miscellaneous 6%
Air Compressor
0%
Motors2%
Process1%Retail
CALIFORNIA COMMERCIAL END-USE SURVEY, March 2003, PG&E Data, pg. 188
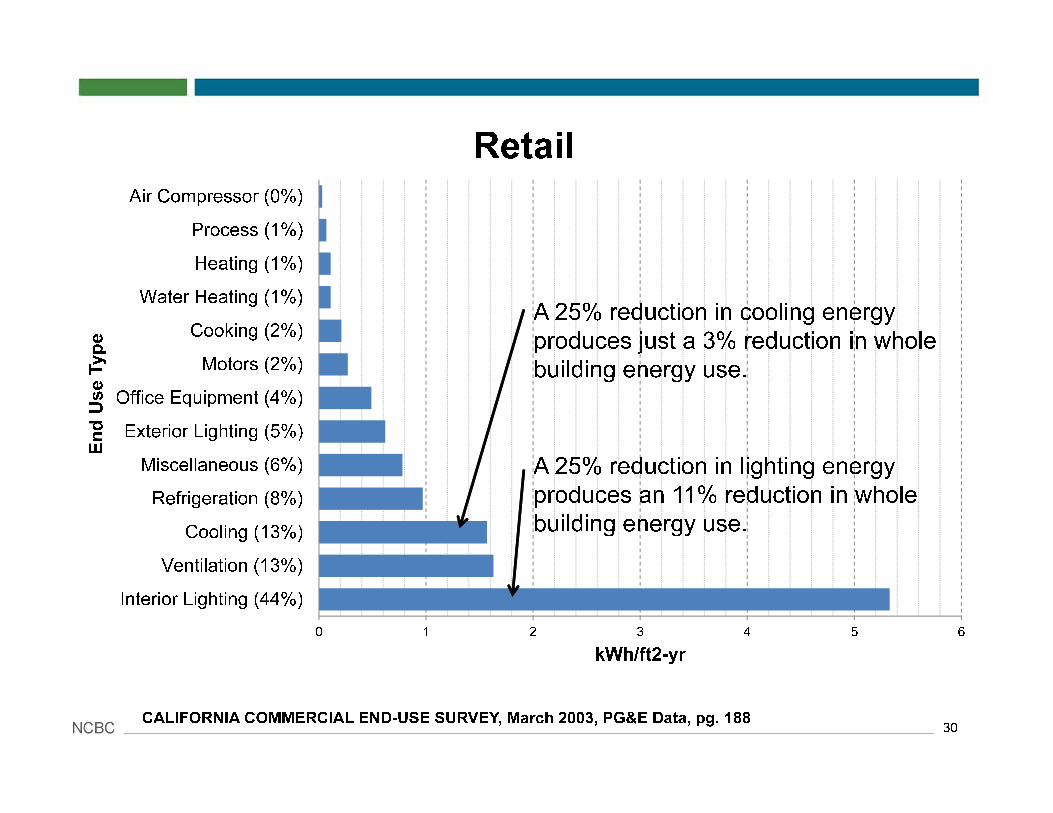
30
0 1 2 3 4 5 6
Air Compressor (0%)
Process (1%)
Heating (1%)
Water Heating (1%)
Cooking (2%)
Motors (2%)
Office Equipment (4%)
Exterior Lighting (5%)
Miscellaneous (6%)
Refrigeration (8%)
Cooling (13%)
Ventilation (13%)
Interior Lighting (44%)
kWh/ft2-yr
End Use Type
Retail
CALIFORNIA COMMERCIAL END-USE SURVEY, March 2003, PG&E Data, pg. 188
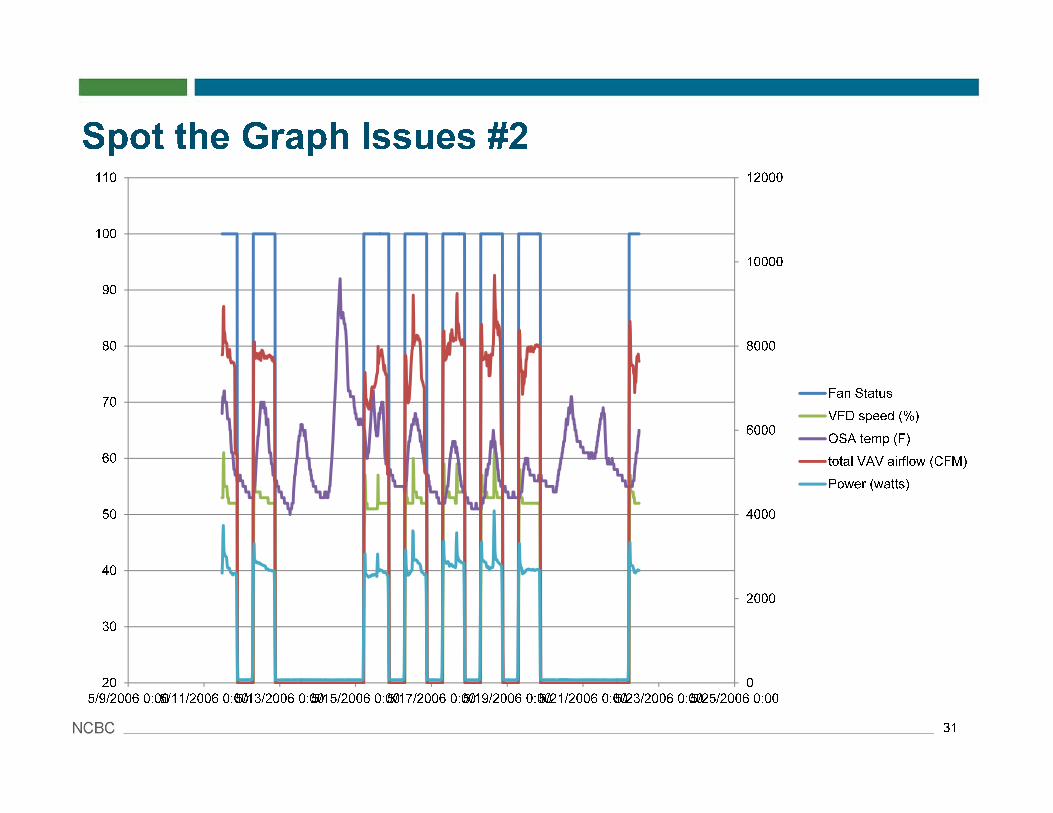
A 25% reduction in lighting energy
produces an 11% reduction in whole
building energy use.
A 25% reduction in cooling energy
produces just a 3% reduction in whole
building energy use.
31
Spot the Graph Issues #2
0
2000
4000
6000
8000
10000
12000
20
30
40
50
60
70
80
90
100
110
5/9/2006 0:005/11/2006 0:005/13/2006 0:005/15/2006 0:005/17/2006 0:005/19/2006 0:005/21/2006 0:005/23/2006 0:005/25/2006 0:00
Fan Status
VFD speed (%)
OSA temp (F)
total VAV airflow (CFM)
Power (watts)
32
0
2000
4000
6000
8000
10000
12000
0
20
40
60
80
100
120
5/14/2006 5/15/2006 5/16/2006 5/17/2006 5/18/2006 5/19/2006 5/20/2006 5/21/2006
Fan status, OSA F, and % speed
CFM and
watts
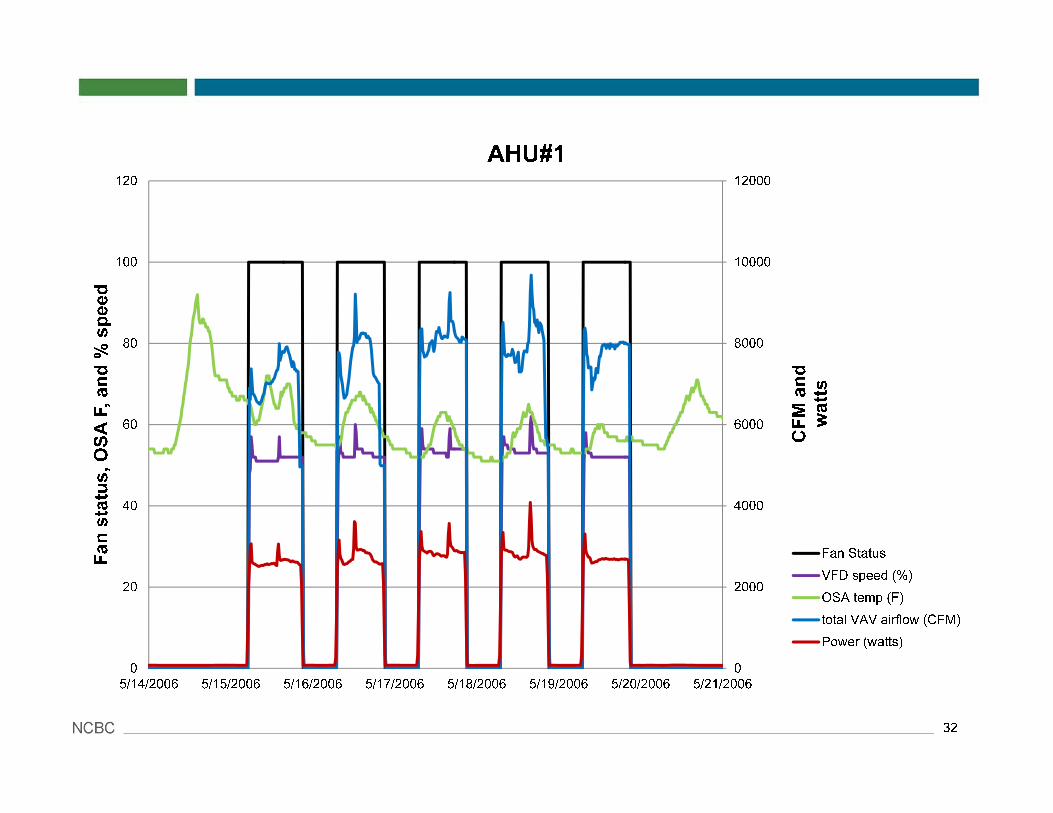
AHU#1
Fan Status
VFD speed (%)
OSA temp (F)
total VAV airflow (CFM)
Power (watts)
33
0
2,000
4,000
6,000
8,000
10,000
0
20
40
60
80
100
5/14/2006 5/15/2006 5/16/2006 5/17/2006 5/18/2006 5/19/2006 5/20/2006 5/21/2006
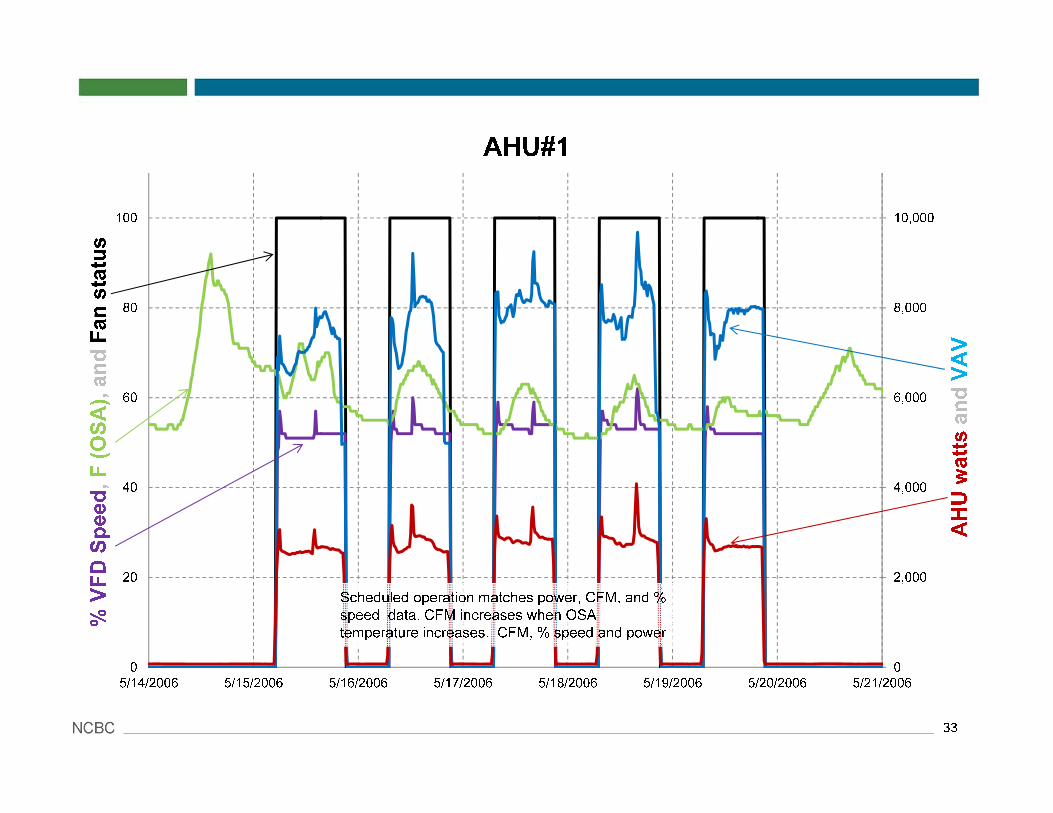
% VFD Speed,F (OSA), andFan status
AHU#1
AHU watts andVAV
Scheduled operation matches power, CFM, and %
speed data. CFM increases when OSA
temperature increases. CFM, % speed and power
34
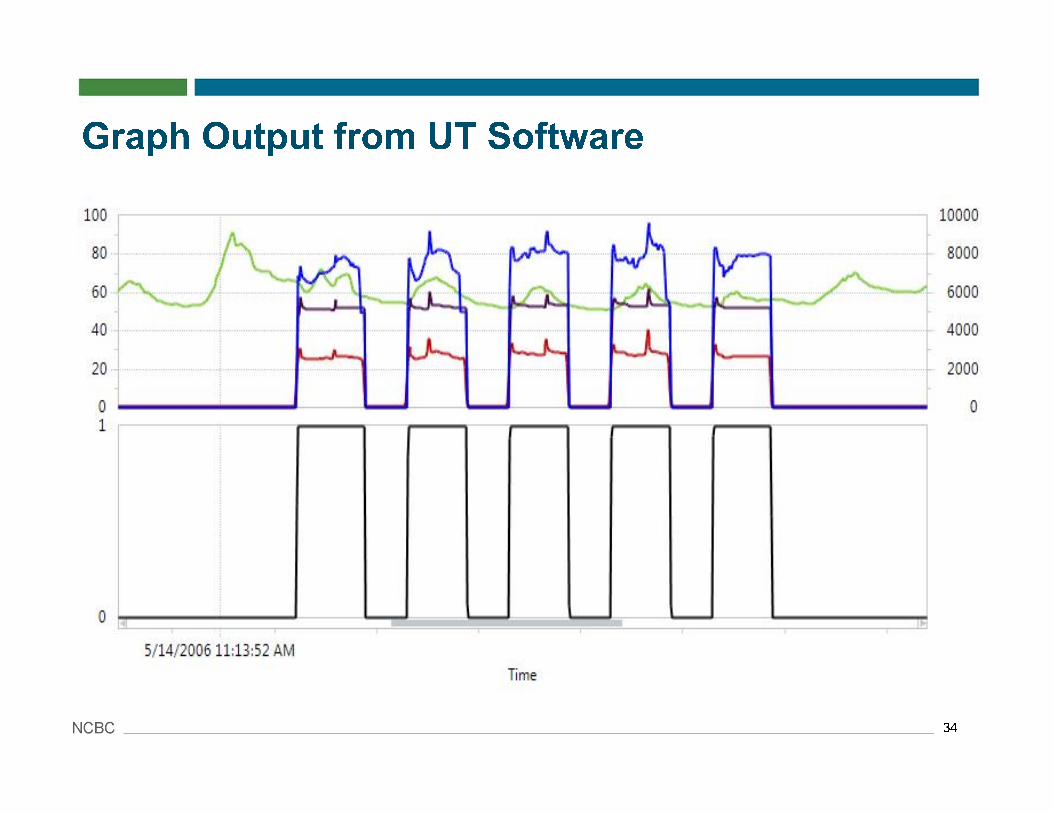
Graph Output from UT Software
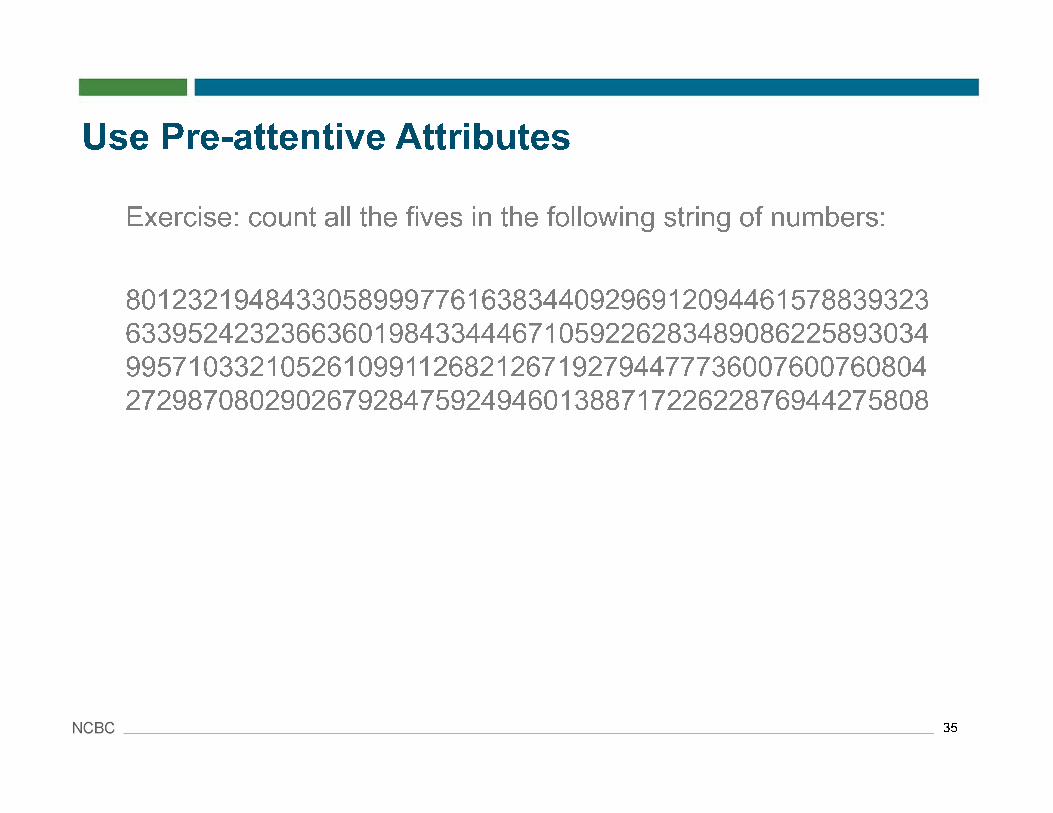
Exercise: count all the fives in the following string of numbers:
8012321948433058999776163834409296912094461578839323
6339524232366360198433444671059226283489086225893034
9957103321052610991126821267192794477736007600760804
2729870802902679284759249460138871722622876944275808
35
Use Pre-attentive Attributes
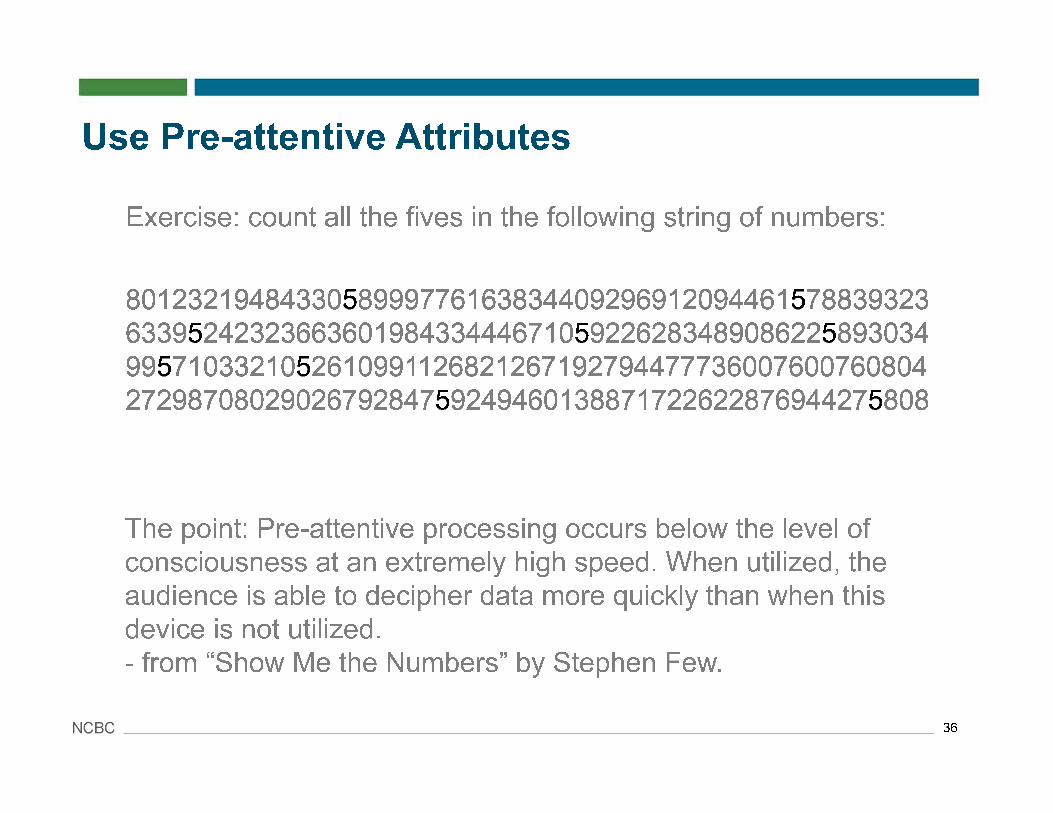
Exercise: count all the fives in the following string of numbers:
8012321948433058999776163834409296912094461578839323
6339524232366360198433444671059226283489086225893034
9957103321052610991126821267192794477736007600760804
2729870802902679284759249460138871722622876944275808
36
Use Pre-attentive Attributes
8012321948433058999776163834409296912094461578839323
6339524232366360198433444671059226283489086225893034
9957103321052610991126821267192794477736007600760804
2729870802902679284759249460138871722622876944275808
The point: Pre-attentive processing occurs below the level of
consciousness at an extremely high speed. When utilized, the
audience is able to decipher data more quickly than when this
device is not utilized.
- from “Show Me the Numbers” by Stephen Few.
37
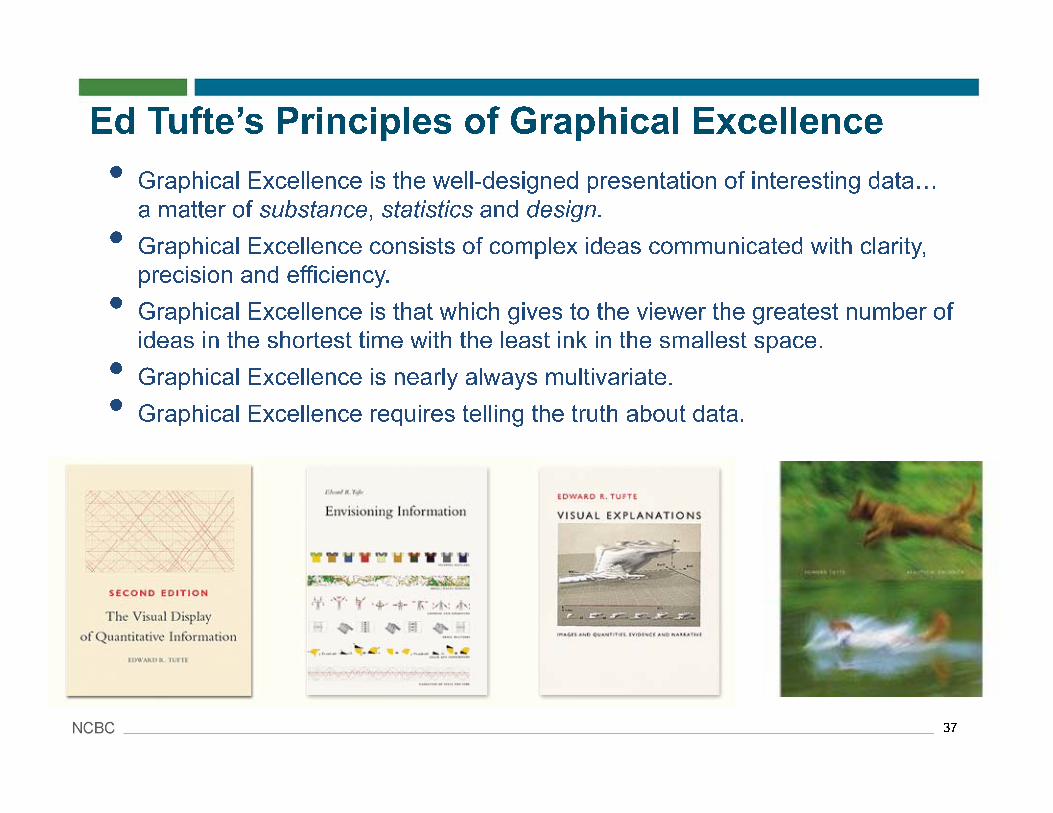
• Graphical Excellence is the well-designed presentation of interesting data�
a matter of substance, statistics and design.
• Graphical Excellence consists of complex ideas communicated with clarity,
precision and efficiency.
• Graphical Excellence is that which gives to the viewer the greatest number of
ideas in the shortest time with the least ink in the smallest space.
• Graphical Excellence is nearly always multivariate.
• Graphical Excellence requires telling the truth about data.
Ed Tufte’s Principles of Graphical Excellence
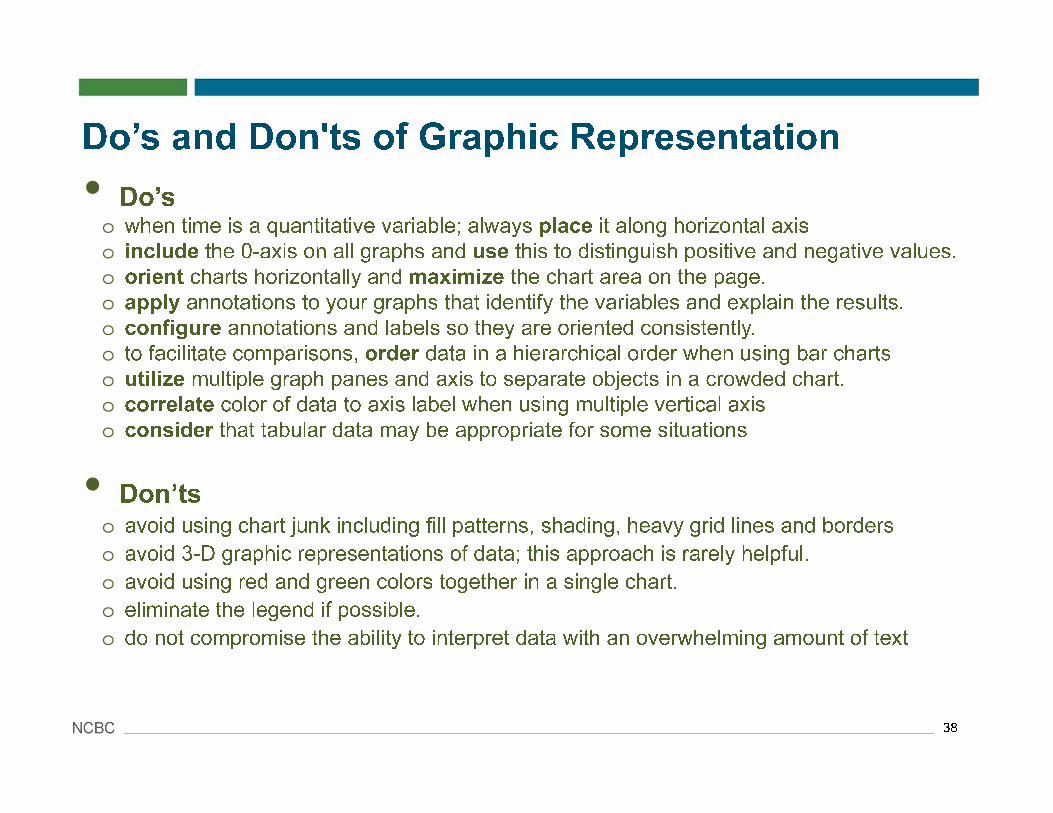
• Do’s
o when time is a quantitative variable; always place it along horizontal axis
o include the 0-axis on all graphs and use this to distinguish positive and negative values.
o orient charts horizontally and maximize the chart area on the page.
o apply annotations to your graphs that identify the variables and explain the results.
o configure annotations and labels so they are oriented consistently.
o to facilitate comparisons, order data in a hierarchical order when using bar charts
o utilize multiple graph panes and axis to separate objects in a crowded chart.
o correlate color of data to axis label when using multiple vertical axis
o consider that tabular data may be appropriate for some situations
• Don’ts
o avoid using chart junk including fill patterns, shading, heavy grid lines and borders
o avoid 3-D graphic representations of data; this approach is rarely helpful.
o avoid using red and green colors together in a single chart.
o eliminate the legend if possible.
o do not compromise the ability to interpret data with an overwhelming amount of text
38
Do’s and Don'ts of Graphic Representation

39
Graph Interpretation Clues
40
The Sky is Blue
0
5
10
15
20
25
30
35
40
45
50
0
20
40
60
80
100
120
140
1/1/2008 1/1/2009 1/1/2010 1/1/2011 1/1/2012 1/1/2013 1/1/2014
kWh/day
Therms/day
Facility E
kWh/day
therms/day
41
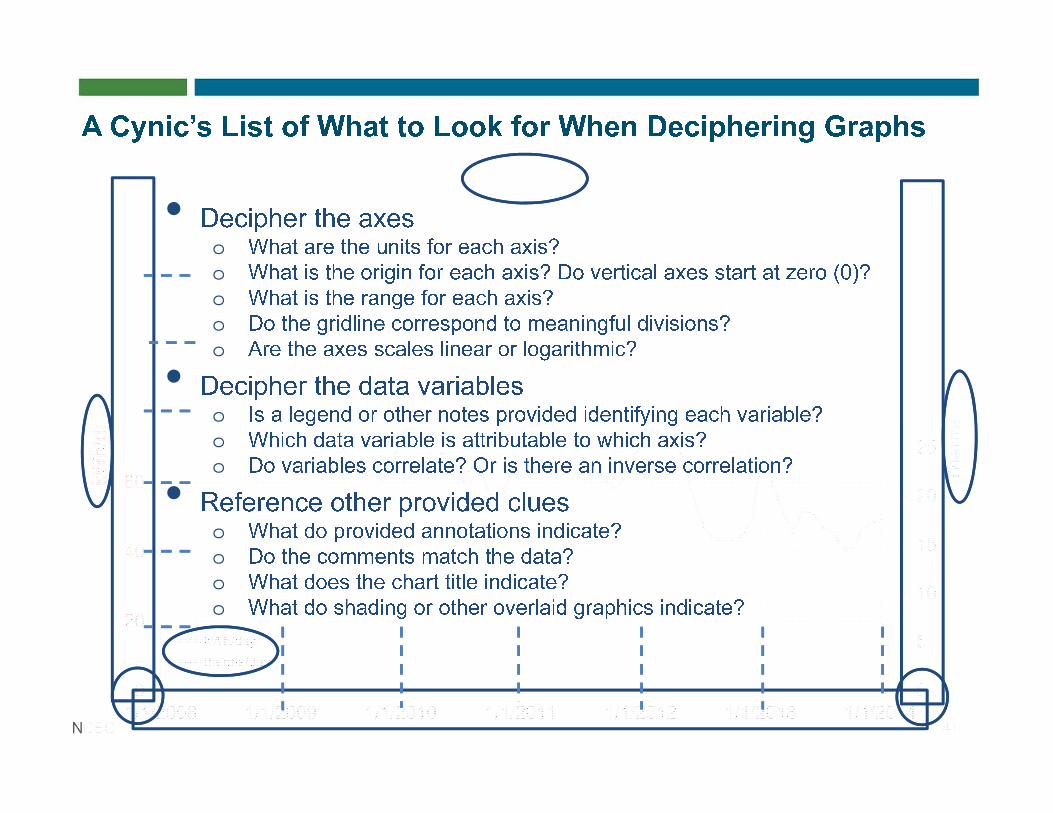
A Cynic’s List of What to Look for When Deciphering Graphs
• Decipher the axeso What are the units for each axis?
o What is the origin for each axis? Do vertical axes start at zero (0)?
o What is the range for each axis?
o Do the gridline correspond to meaningful divisions?
o Are the axes scales linear or logarithmic?
• Decipher the data variableso Is a legend or other notes provided identifying each variable?
o Which data variable is attributable to which axis?
o Do variables correlate? Or is there an inverse correlation?
• Reference other provided clueso What do provided annotations indicate?
o Do the comments match the data?
o What does the chart title indicate?
o What do shading or other overlaid graphics indicate?

42
0
5
10
15
20
25
30
35
40
45
50
0
20
40
60
80
100
120
140
1/1/2008 1/1/2009 1/1/2010 1/1/2011 1/1/2012 1/1/2013 1/1/2014
kWh/day
Therms/day
Facility E
kWh/day
therms/day
43
Mystery Graphs Answers
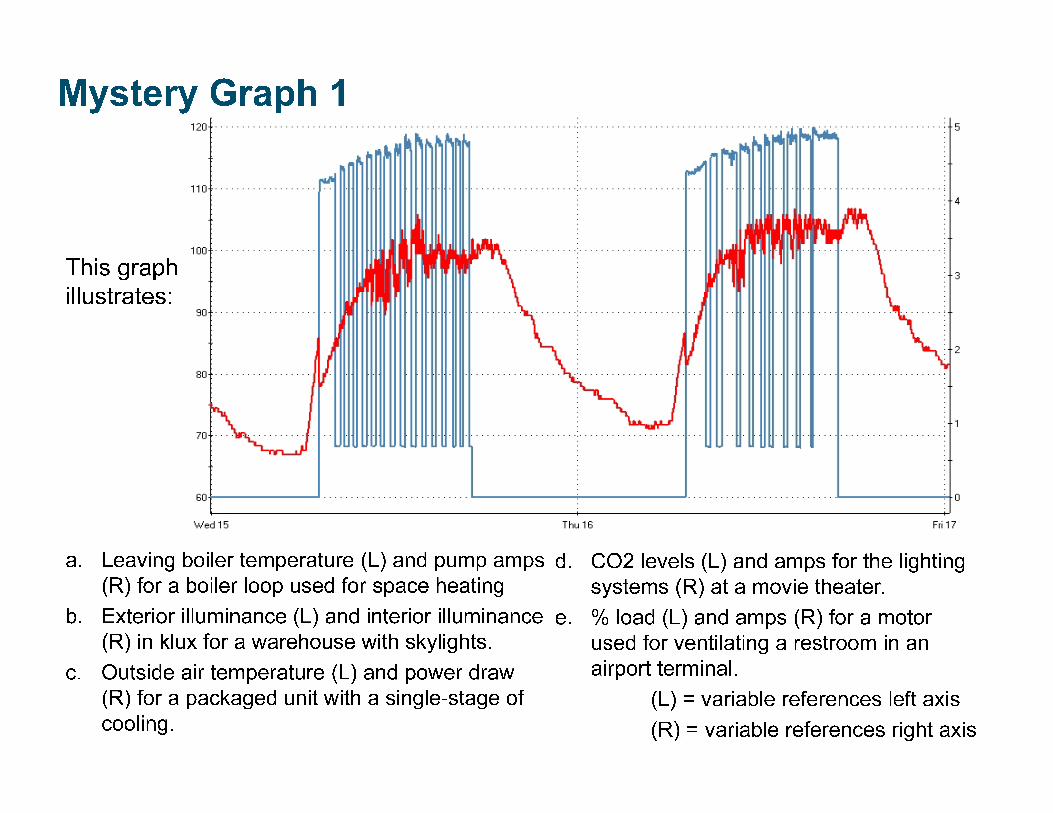
Mystery Graph 1
a. Leaving boiler temperature (L) and pump amps
(R) for a boiler loop used for space heating
b. Exterior illuminance (L) and interior illuminance
(R) in klux for a warehouse with skylights.
c. Outside air temperature (L) and power draw
(R) for a packaged unit with a single-stage of
cooling.
d. CO2 levels (L) and amps for the lighting
systems (R) at a movie theater.
e. % load (L) and amps (R) for a motor
used for ventilating a restroom in an
airport terminal.
(L) = variable references left axis
(R) = variable references right axis
This graph
illustrates:
Mystery Graph 1
Daily temperature variation
Power Draw in kW
compressor
Supply fan
One day
a. daily electricity, natural gas and water use.
b. outside air, mixed air and return air
temperatures at an air handler with a
working economizer
c. space temperature, air flow and damper
position for a working VAV box.
d. temperature, relative humidity and dew point of an air volume.
e. chilled water flow, chilled water supply temperature and condenser water supply temperature for an optimized chiller.
Mystery
Graph 2
The three
variables
illustrated in
the graph
depicted
here are?
a. daily electricity, natural gas and water
use.
b. outside air, mixed air and return air
temperatures at an air handler with a
working economizer
c. space temperature, air flow and damper
position for a working VAV box.
The three
variables
illustrated in
the graph
depicted here
are? Mixed tracks outside
when the outside
temp is below return.
Mixed is warmer than return, but
much cooler than outside when
outside temp is above return.
Mixed and return track
when air handler is off.
d. temperature, relative humidity and dew point of an air volume.
e. chilled water flow, chilled water supply temperature and condenser water supply temperature for an optimized chiller.
Mystery
Graph 2

Mystery
Graph 3
Mystery Graph 2
40
50
60
70
80
90
100
08/12/04
12:00 AM
08/12/04
03:00 AM
08/12/04
06:00 AM
08/12/04
09:00 AM
08/12/04
12:00 PM
08/12/04
03:00 PM
08/12/04
06:00 PM
08/12/04
09:00 PM
08/13/04
12:00 AM
Date
Three inter-related parameters
a. Voltage, amperage and power
factor for a server room.
b. space temperature, air flow and
damper position for a working VAV
box.
c. outside air, mixed air and return air
temperatures at an air handler with
an economizer
d. Temperature, relative humidity and
dew point of an air volume
e. chilled water flow, chilled water
supply temperature and condenser
water supply temperature for an
optimized chiller.
This graph
illustrates:
5/22/2014 49
Mystery
Graph 3
Mystery Graph 2
40
50
60
70
80
90
100
08/12/04
12:00 AM
08/12/04
03:00 AM
08/12/04
06:00 AM
08/12/04
09:00 AM
08/12/04
12:00 PM
08/12/04
03:00 PM
08/12/04
06:00 PM
08/12/04
09:00 PM
08/13/04
12:00 AM
Date
Three inter-related parameters
a. Voltage, amperage and power
factor for a server room.
b. space temperature, air flow and
damper position for a working VAV
box.
c. outside air, mixed air and return air
temperatures at an air handler with
an economizer
d. Temperature, relative humidity and
dew point of an air volume
e. chilled water flow, chilled water
supply temperature and condenser
water supply temperature for an
optimized chiller.
This graph
illustrates:
RH drops as temperature
rises and dew point stays
relatively constant
5/22/2014 50
Mystery
Graph 4
a. Total dissolved solids in condenser water for a cooling tower.
b. Volatile organic compounds (VOC) levels during construction of an office building.
c.CO levels in a parking garage.
d.CO2
levels in the open office area of a law office.
e.CO2
levels in a movie theater.
The data
shown to the
right is an
indication of
which
condition? 0
200
400
600
800
1000
1200
6/28/02
12:00 AM
6/28/02
12:00 PM
6/29/02
12:00 AM
6/29/02
12:00 PM
6/30/02
12:00 AM
6/30/02
12:00 PM
7/1/02
12:00 AM
ppm
5/22/2014 51
Mystery
Graph 4
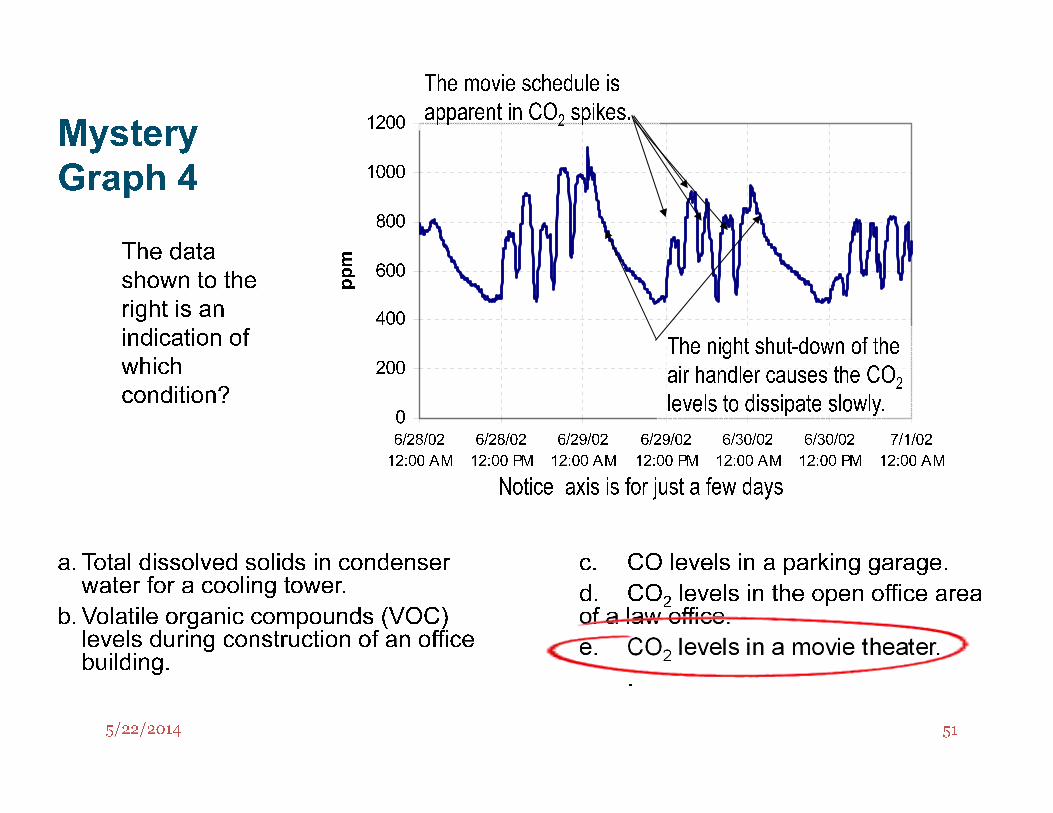
a. Total dissolved solids in condenser water for a cooling tower.
b. Volatile organic compounds (VOC) levels during construction of an office building.
c. CO levels in a parking garage.
d. CO2
levels in the open office area of a law office.
e. CO2
levels in a movie theater.
.
The data
shown to the
right is an
indication of
which
condition?0
200
400
600
800
1000
1200
6/28/02
12:00 AM
6/28/02
12:00 PM
6/29/02
12:00 AM
6/29/02
12:00 PM
6/30/02
12:00 AM
6/30/02
12:00 PM
7/1/02
12:00 AM
ppm
The night shut-down of the
air handler causes the CO2
levels to dissipate slowly.
The movie schedule is
apparent in CO2
spikes.
Notice axis is for just a few days

5/22/2014 52
Mystery Graph
60
70
80
90
100
110
120
5/20/05 12:00
PM
5/21/05 12:00
AM
5/21/05 12:00
PM
5/22/05 12:00
AM
5/22/05 12:00
PM
5/23/05 12:00
AM
5/23/05 12:00
PM
5/24/05 12:00
AM
Date and time
Temperature, °F
Mystery
Graph 5
a. light levels from daylight in a library.
b. run time data for a light fixture
c. Space temperature in an
unconditioned warehouse.
d. the scheduled operation of a motor
e. flue temperature for a non-condensing heating hot water boiler.
This graph
illustrates:
5/22/2014 53
Mystery Graph
60
70
80
90
100
110
120
5/20/05 12:00
PM
5/21/05 12:00
AM
5/21/05 12:00
PM
5/22/05 12:00
AM
5/22/05 12:00
PM
5/23/05 12:00
AM
5/23/05 12:00
PM
5/24/05 12:00
AM
Date and time
Temperature, °F
Mystery
Graph 5
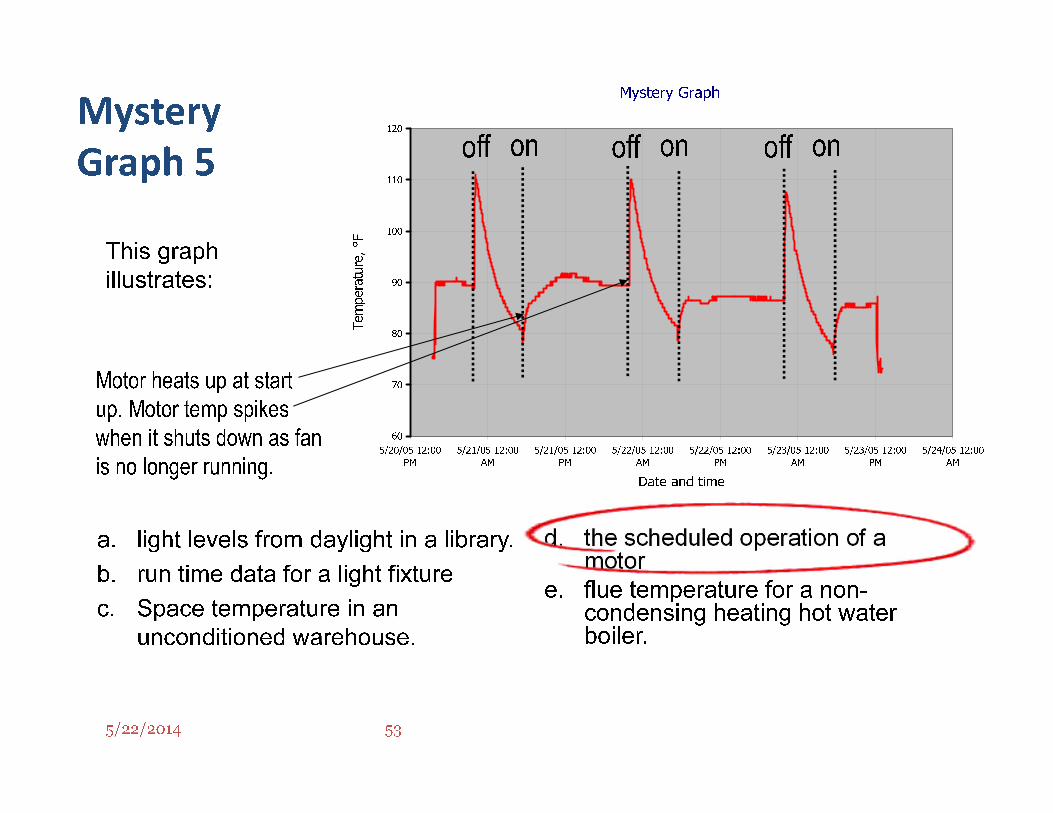
a. light levels from daylight in a library.
b. run time data for a light fixture
c. Space temperature in an
unconditioned warehouse.
d. the scheduled operation of a motor
e. flue temperature for a non-condensing heating hot water boiler.
This graph
illustrates:
Motor heats up at start
up. Motor temp spikes
when it shuts down as fan
is no longer running.
onoff onoff onoff
5/22/2014 54
0
10
20
30
40
50
60
8/4/2011 9:00 8/4/2011 21:00 8/5/2011 9:00 8/5/2011 21:00 8/6/2011 9:00 8/6/2011 21:00 8/7/2011 9:00 8/7/2011 21:00 8/8/2011 9:00 8/8/2011 21:00 8/9/2011 9:00
0
50
100
150
200
250
300
350
400
450
500
Mystery Graph 6
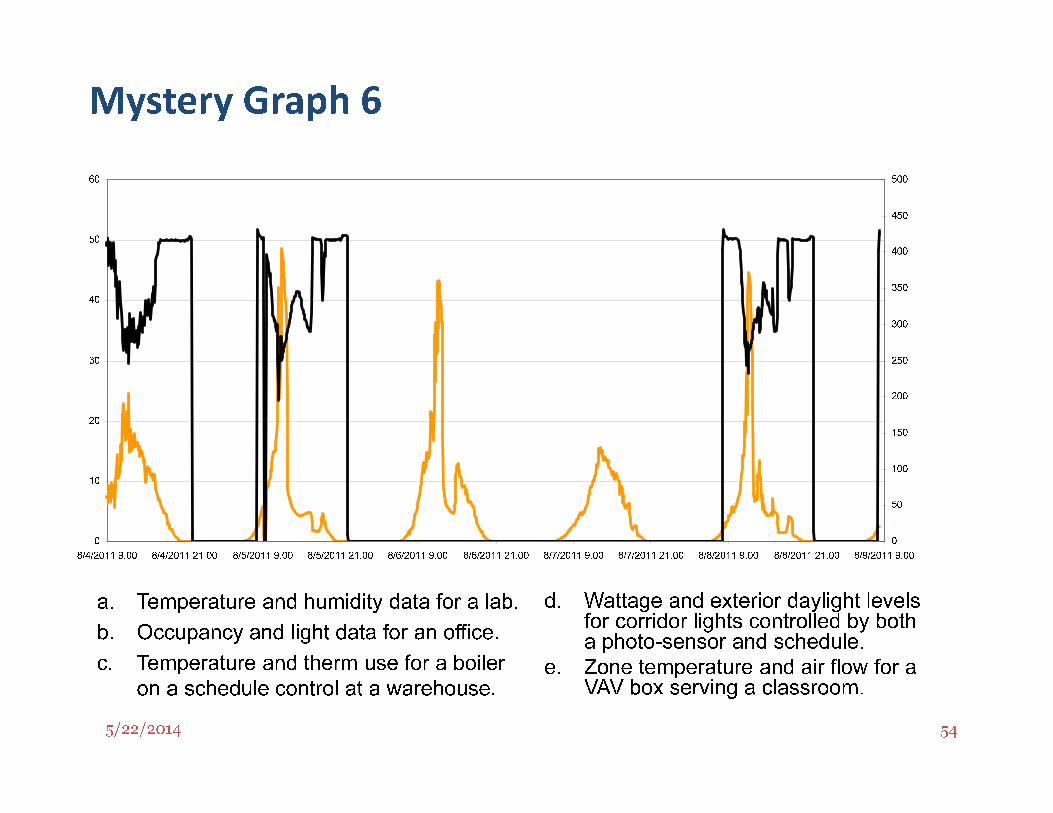
a. Temperature and humidity data for a lab.
b. Occupancy and light data for an office.
c. Temperature and therm use for a boiler
on a schedule control at a warehouse.
d. Wattage and exterior daylight levels for corridor lights controlled by both a photo-sensor and schedule.
e. Zone temperature and air flow for a VAV box serving a classroom.
5/22/2014 55
Dimmable lighting circuit
0
10
20
30
40
50
60
8/4/2011 9:00 8/4/2011 21:00 8/5/2011 9:00 8/5/2011 21:00 8/6/2011 9:00 8/6/2011 21:00 8/7/2011 9:00 8/7/2011 21:00 8/8/2011 9:00 8/8/2011 21:00 8/9/2011 9:00
klux
0
50
100
150
200
250
300
350
400
450
500
watts
sky
pow er
Mystery Graph 6
a. Temperature and humidity data for a lab.
b. Occupancy and light data for an office.
c. Temperature and therm use for a boiler
on a schedule control at a warehouse.
d. Wattage and exterior daylight levels for corridor lights controlled by both a photo-sensor and schedule.
e. Zone temperature and air flow for a VAV box serving a classroom.
Power in watts is constant at
beginning and end of the day
when daylight is unavailable.
Scheduled off on
weekends and at night
Exterior daylight in Klux
Mystery Graph 7
0
100
200
300
400
500
600
40 45 50 55 60 65 70 75 80
a. the percent load and power draw in watts
for a motor.
b. the cooling load in kWh per day and the
average zone temperature per day for a
hospital.
c. the VFD speed in hertz and power in
watts for a packaged unit supply air fan.
d. the humidity and enthalpy for air
downstream from a direct
evaporative cooling system.
e. the heating load for a building in
therms per day and the average
outside temperature per day.
This graph
illustrates the
relationship
between:
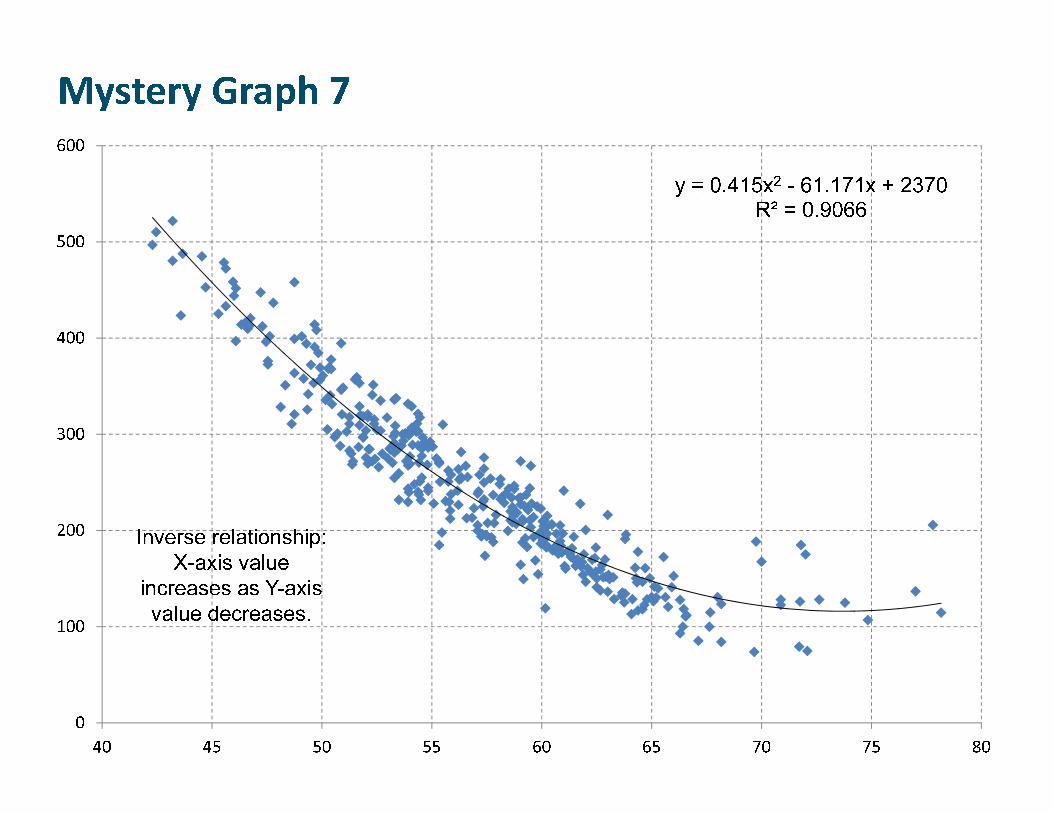
Mystery Graph 7
y = 0.415x2 - 61.171x + 2370R² = 0.9066
0
100
200
300
400
500
600
40 45 50 55 60 65 70 75 80
Inverse relationship:
X-axis value
increases as Y-axis
value decreases.
5/22/2014 58
Mystery
Graph 8
1
3
5
7
9
11
13
15
17
-0.05 0 0.05
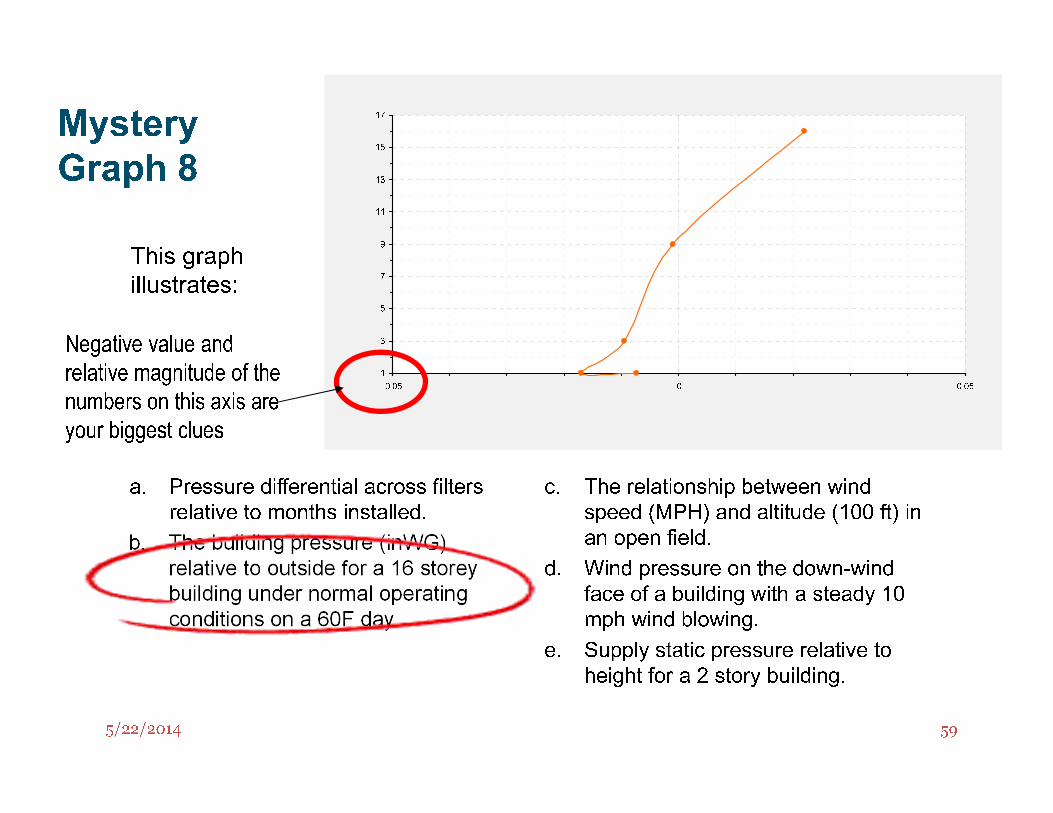
a. Pressure differential across filters
relative to months installed.
b. The building pressure (in WG)
relative to outside for a 16 storey
building under normal operating
conditions on a 60F day.
c. The relationship between wind
speed (MPH) and altitude (100 ft) in
an open field.
d. Wind pressure on the down-wind
face of a building with a steady 10
mph wind blowing.
e. Supply static pressure relative to
height for a 2 story building.
This graph
illustrates:
5/22/2014 59
Mystery
Graph 8
1
3
5
7
9
11
13
15
17
-0.05 0 0.05
a. Pressure differential across filters
relative to months installed.
b. The building pressure (inWG)
relative to outside for a 16 storey
building under normal operating
conditions on a 60F day.
c. The relationship between wind
speed (MPH) and altitude (100 ft) in
an open field.
d. Wind pressure on the down-wind
face of a building with a steady 10
mph wind blowing.
e. Supply static pressure relative to
height for a 2 story building.
This graph
illustrates:
Negative value and
relative magnitude of the
numbers on this axis are
your biggest clues
5/22/2014 60
Mystery
Graph 9
0
20
40
60
80
100
120
140
12:00 AM 6:00 AM 12:00 PM 6:00 PM 12:00 AM
0
20
40
60
80
100
120
140
12:00 AM 6:00 AM 12:00 PM 6:00 PM 12:00 AM
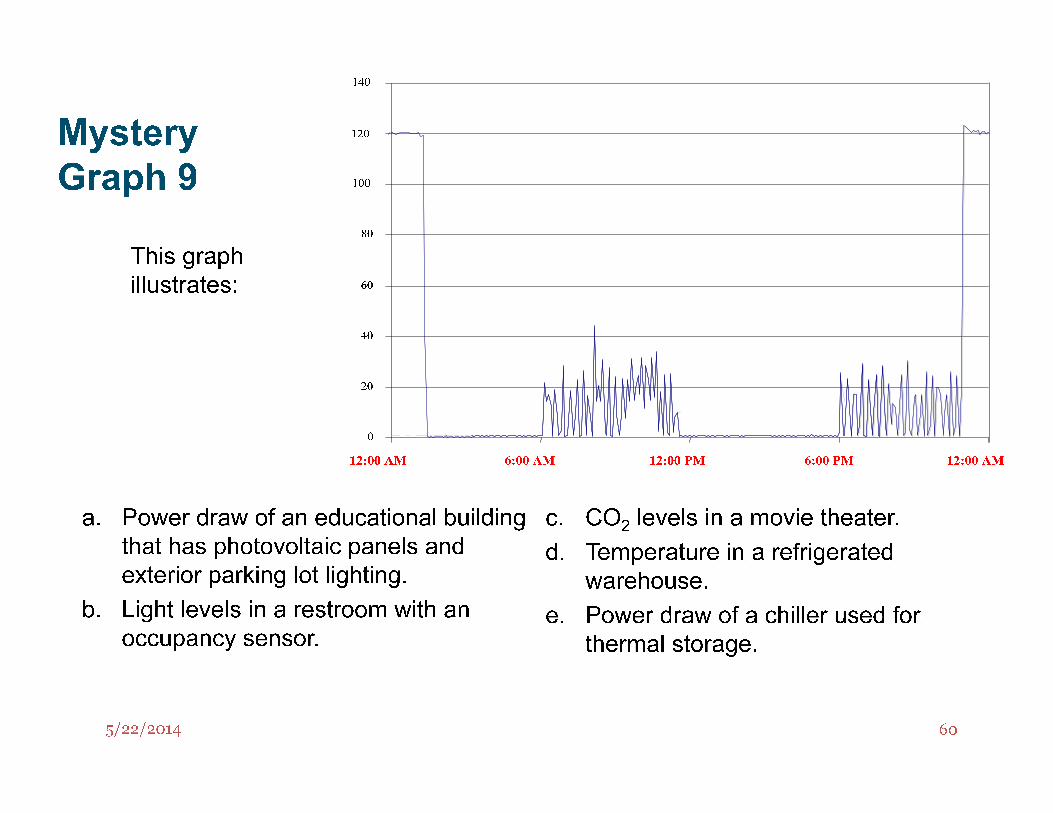
a. Power draw of an educational building
that has photovoltaic panels and
exterior parking lot lighting.
b. Light levels in a restroom with an
occupancy sensor.
c. CO2
levels in a movie theater.
d. Temperature in a refrigerated
warehouse.
e. Power draw of a chiller used for
thermal storage.
This graph
illustrates:
5/22/2014 61
Mystery
Graph 9
0
20
40
60
80
100
120
140
12:00 AM 6:00 AM 12:00 PM 6:00 PM 12:00 AM
0
20
40
60
80
100
120
140
12:00 AM 6:00 AM 12:00 PM 6:00 PM 12:00 AM
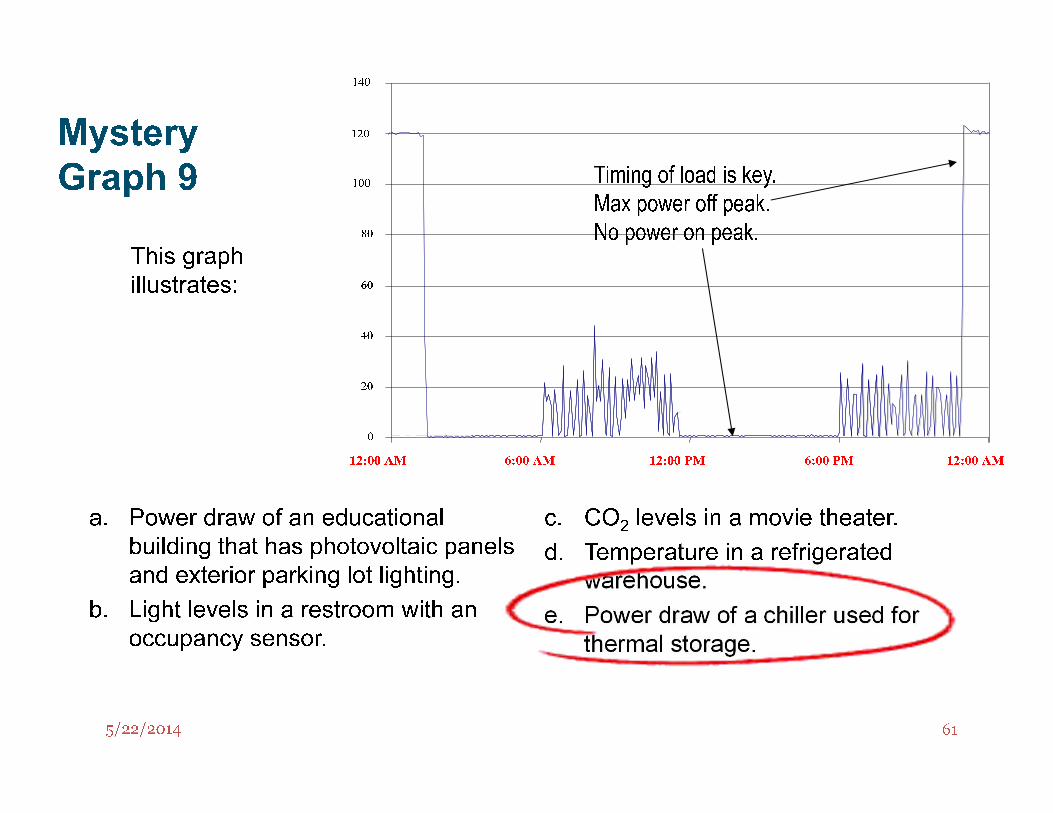
a. Power draw of an educational
building that has photovoltaic panels
and exterior parking lot lighting.
b. Light levels in a restroom with an
occupancy sensor.
c. CO2
levels in a movie theater.
d. Temperature in a refrigerated
warehouse.
e. Power draw of a chiller used for
thermal storage.
This graph
illustrates:
Timing of load is key.
Max power off peak.
No power on peak.
Mystery Graph 10
0
5,000
10,000
15,000
20,000
25,000
0 500,000 1,000,000 1,500,000 2,000,000
DA
B
EC
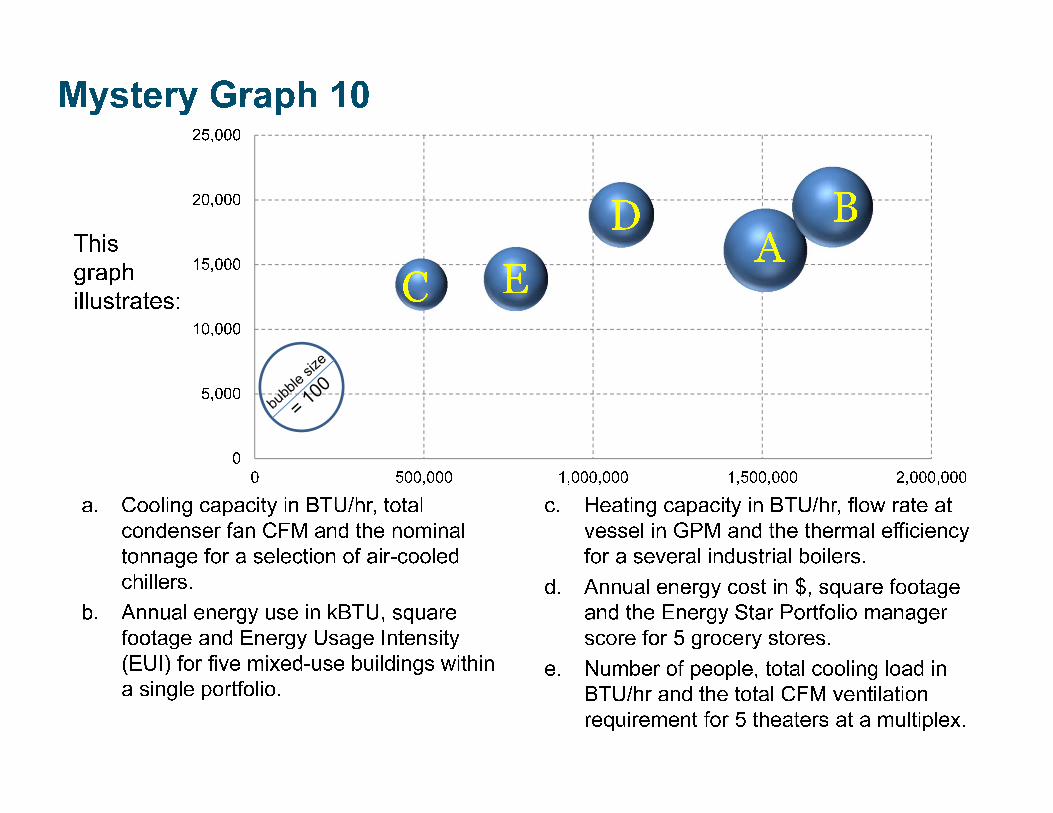
a. Cooling capacity in BTU/hr, total condenser fan CFM and the nominal tonnage for a selection of air-cooled chillers.
b. Annual energy use in kBTU, square footage and Energy Usage Intensity (EUI) for five mixed-use buildings within a single portfolio.
c. Heating capacity in BTU/hr, flow rate at vessel in GPM and the thermal efficiency for a several industrial boilers.
d. Annual energy cost in $, square footage and the Energy Star Portfolio manager score for 5 grocery stores.
e. Number of people, total cooling load in BTU/hr and the total CFM ventilation requirement for 5 theaters at a multiplex.
This
graph
illustrates:
Mystery Graph 10
0
5,000
10,000
15,000
20,000
25,000
0 200,000 400,000 600,000 800,000 1,000,000 1,200,000 1,400,000 1,600,000 1,800,000 2,000,000
DA
B
EC
a. Cooling capacity in BTU/hr, total condenser fan CFM and the nominal tonnage for a selection of air-cooled chillers.
b. Annual energy use in kBTU, square footage and Energy Usage Intensity (EUI) for five mixed-use buildings within a single portfolio.
c. Heating capacity in BTU/hr, flow rate at vessel in GPM and the thermal efficiency for a several industrial boilers.
d. Annual energy cost in $, square footage and the Energy Star Portfolio manager score for 5 grocery stores.
e. Number of people, total cooling load in BTU/hr and the total CFM ventilation requirement for 5 theaters at a multiplex.
EUI = Annual energy use in kBTU/sqft
Building A: 1,508,469kBTU, 16,123sqft, 93.56 EUI
Building B: 1,708,535kBTU, 19,465sqft, 87.77 EUI
Building C: 492,137kBTU, 13,476sqft, 36.52 EUI
Building D: 1,082,894kBTU, 18,863sqft, 57.41 EUI
Building E: 771,410kBTU, 13,896sqft, 55.51 EUI
kBTU
sqft

64
Resources/Bibliography
65
Related Publications
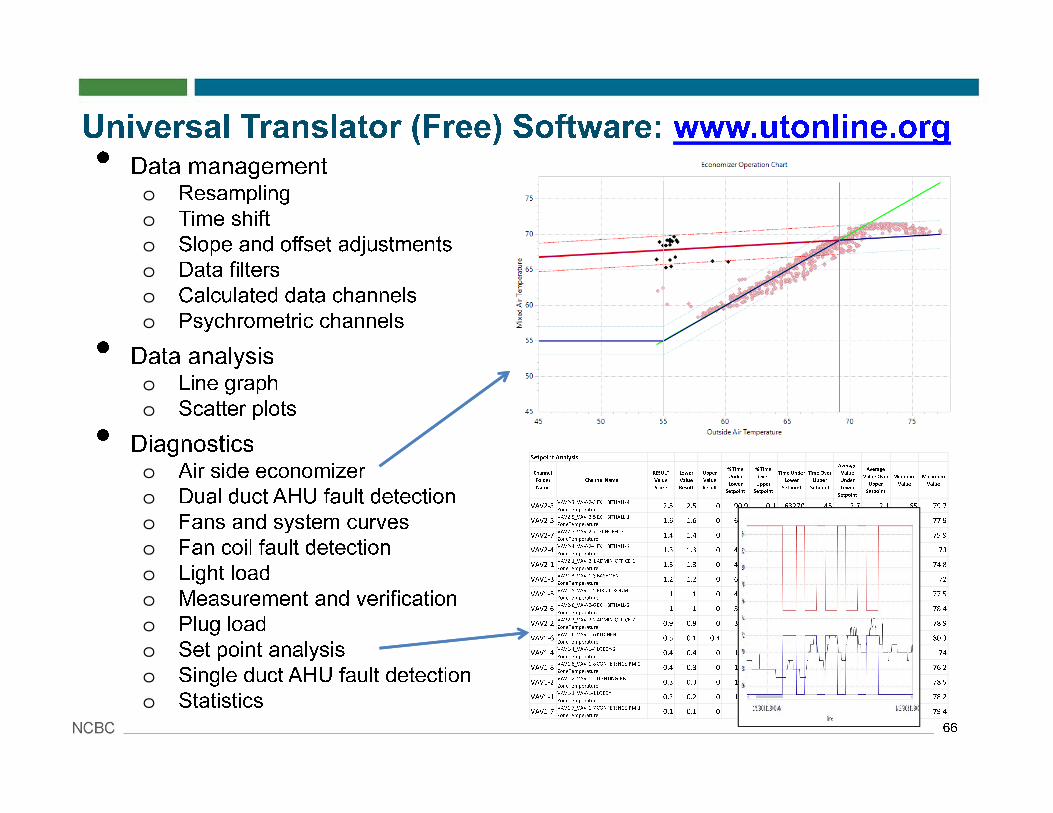
• Data managemento Resampling
o Time shift
o Slope and offset adjustments
o Data filters
o Calculated data channels
o Psychrometric channels
• Data analysiso Line graph
o Scatter plots
• Diagnosticso Air side economizer
o Dual duct AHU fault detection
o Fans and system curves
o Fan coil fault detection
o Light load
o Measurement and verification
o Plug load
o Set point analysis
o Single duct AHU fault detection
o Statistics66
Setpoint Analysis
Channel
Folder
Name
Channel Name
RESULT
Value
Score
Lower
Value
Result
Upper
Value
Result
% Time
Under
Lower
Setpoint
% Time
Over
Upper
Setpoint
Time Under
Lower
Setpoint
Time Over
Upper
Setpoint
Average
Value
Under
Lower
Setpoint
Average
Value Over
Upper
Setpoint
Minimum
Value
Maximum
Value
VAV2-3VAV2-3_VAV-2-3 EXHIBITHALL-4
ZoneTemperature2.5 2.5 0 90.9 0.1 63270 45 2.7 2.1 65 79.7
VAV2-5VAV2-5_VAV-2-5 EXHIBITHALL-1
ZoneTemperature1.6 1.6 0 64.7 0 45060 0 2.5 0 63 77.9
VAV2-7VAV2-7_VAV-2-7 TECHOFFICE
ZoneTemperature1.4 1.4 0 46 0 32055 0 3.1 0 62 75.9
VAV2-4VAV2-4_VAV-2-4 EXHIBITHALL-3
ZoneTemperature1.3 1.3 0 47.1 0 32805 0 2.8 0 64 73
VAV2-1VAV2-1_VAV-2-1 ADMIN-OFFICE-1
ZoneTemperature1.3 1.3 0 47.8 0 33285 0 2.7 0 63 74.8
VAV1-3VAV1-3_VAV-1-3 BASEMENT
ZoneTemperature1.2 1.2 0 65.4 0 45285 0 1.8 0 66 72
VAV1-5VAV1-5_VAV-1-5 BIRDIE-ROOM
ZoneTemperature1 1 0 42.9 0 29745 0 2.3 0 66 77.5
VAV2-6VAV2-6_VAV-2-6 EXHIBITHALL-2
ZoneTemperature1 1 0 39.9 0 27765 0 2.4 0 66 78.4
VAV2-2VAV2-2_VAV-2-2 ADMIN-OFFICE-2
ZoneTemperature0.9 0.9 0 39.9 0 27765 0 2.2 0 65 78.9
VAV1-6VAV1-6_VAV-1-6 KITCHEN
ZoneTemperature0.5 0.1 0.4 6.5 20.9 4530 14550 1.8 2 64.5 80.3
VAV1-4VAV1-4_VAV-1-4 LOBBY-2
ZoneTemperature0.4 0.4 0 15.2 0 10560 0 2.6 0 67 74
VAV1-8VAV1-8_VAV-1-8 CONFERENCE-RM-2
ZoneTemperature0.4 0.3 0 17.7 2.7 12300 1860 1.9 1 65 76.2
VAV1-2VAV1-2_VAV-1-2 LIGHTING-RM
ZoneTemperature0.3 0.3 0 19.2 0.1 13320 60 1.6 1 68 78.5
VAV1-1VAV1-1_VAV-1-1 LOBBY
ZoneTemperature0.2 0.2 0 13.2 0 9120 15 1.9 0.5 69 78.2
VAV1-7VAV1-7_VAV-1-7 CONFERENCE-RM-1
ZoneTemperature0.1 0.1 0 6 2.5 4185 1710 1.6 1.1 66 79.4
Universal Translator (Free) Software: www.utonline.org
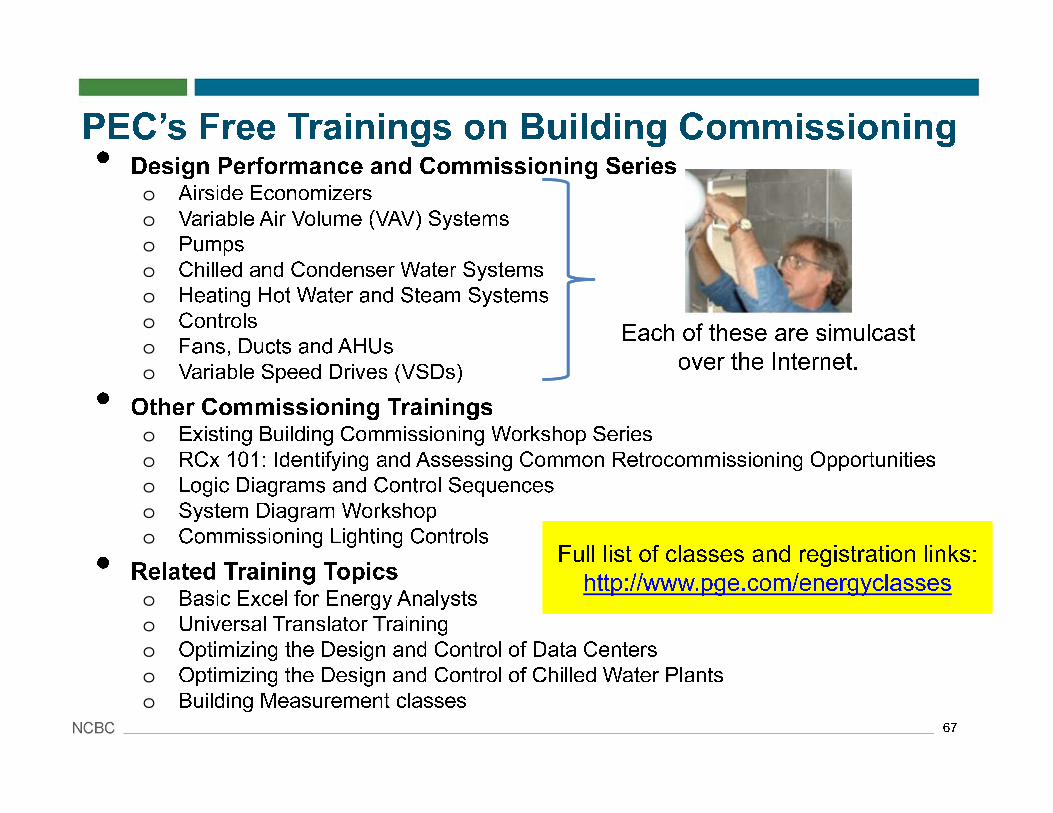
• Design Performance and Commissioning Serieso Airside Economizers
o Variable Air Volume (VAV) Systems
o Pumps
o Chilled and Condenser Water Systems
o Heating Hot Water and Steam Systems
o Controls
o Fans, Ducts and AHUs
o Variable Speed Drives (VSDs)
• Other Commissioning Trainingso Existing Building Commissioning Workshop Series
o RCx 101: Identifying and Assessing Common Retrocommissioning Opportunities
o Logic Diagrams and Control Sequences
o System Diagram Workshop
o Commissioning Lighting Controls
• Related Training Topicso Basic Excel for Energy Analysts
o Universal Translator Training
o Optimizing the Design and Control of Data Centers
o Optimizing the Design and Control of Chilled Water Plants
o Building Measurement classes67
PEC’s Free Trainings on Building Commissioning
Each of these are simulcast
over the Internet.
Full list of classes and registration links:
http://www.pge.com/energyclasses
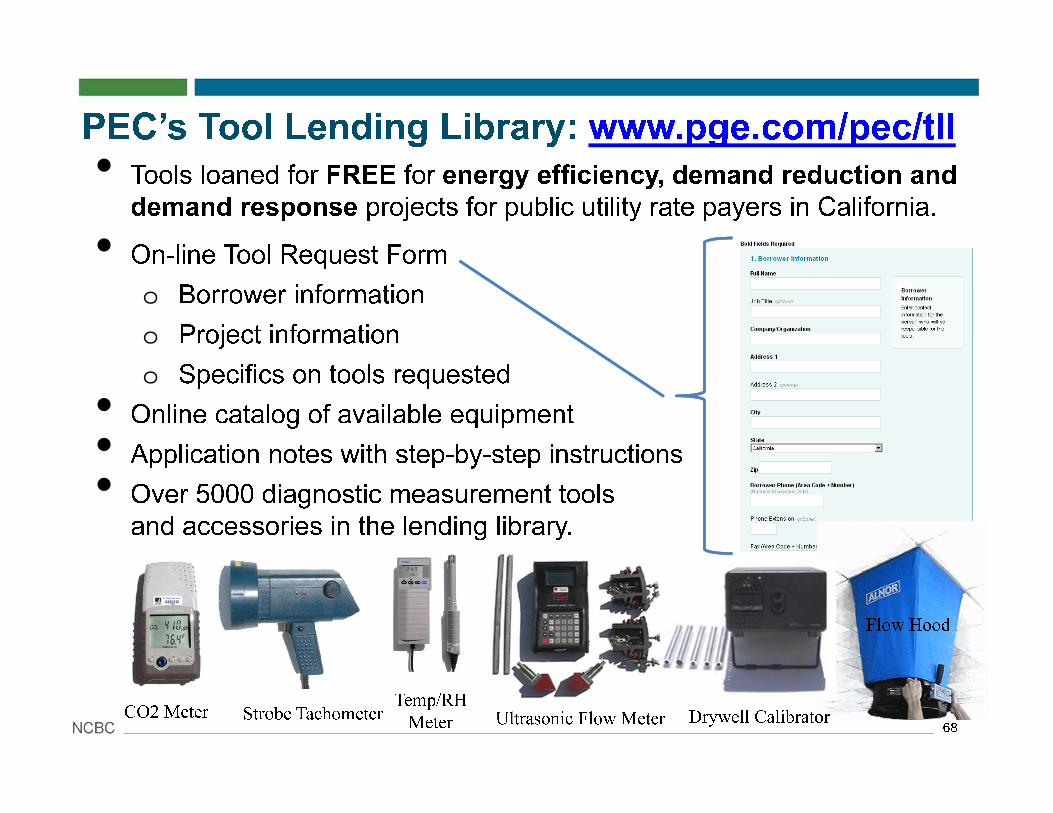
• Tools loaned for FREE for energy efficiency, demand reduction and
demand response projects for public utility rate payers in California.
• On-line Tool Request Form
o Borrower information
o Project information
o Specifics on tools requested
• Online catalog of available equipment
• Application notes with step-by-step instructions
• Over 5000 diagnostic measurement tools
and accessories in the lending library.
68
PEC’s Tool Lending Library: www.pge.com/pec/tll
Flow Hood
Drywell CalibratorCO2 MeterTemp/RH
MeterStrobe Tachometer Ultrasonic Flow Meter
Pacific Gas and Electric
PG&E Pacific Energy Center
www.pge.com/pec
Ryan Stroupe, Building Performance Program Coordinator