Embed Size (px)
Citation preview
Graphic Comparisons by Bars, Squares, Circles, and CubesAuthor(s): Frederick E. CroxtonSource: Journal of the American Statistical Association, Vol. 27, No. 177 (Mar., 1932), pp. 54-60Published by: American Statistical AssociationStable URL: http://www.jstor.org/stable/2277880 .
Accessed: 14/06/2014 20:53
Your use of the JSTOR archive indicates your acceptance of the Terms & Conditions of Use, available at .http://www.jstor.org/page/info/about/policies/terms.jsp
.JSTOR is a not-for-profit service that helps scholars, researchers, and students discover, use, and build upon a wide range ofcontent in a trusted digital archive. We use information technology and tools to increase productivity and facilitate new formsof scholarship. For more information about JSTOR, please contact [email protected].
.
American Statistical Association is collaborating with JSTOR to digitize, preserve and extend access to Journalof the American Statistical Association.
http://www.jstor.org
This content downloaded from 62.122.77.83 on Sat, 14 Jun 2014 20:53:44 PMAll use subject to JSTOR Terms and Conditions
54 American Statistical Association [54
GRAPHIC COMPARISONS BY BARS, SQUARES, CIRCLES, AND CUBES
BY FREDERICK 1. CROXTON, Columbia University, AND HAROLD STEIN, Brooklyn College 1
In an earlier issue of this JOURNAL an attempt was made to evaluate bar charts and pie diagrams as graphic devices for showing component parts.2 The present article deals with the relative merits of bars, squares, circles, and cubes for showing simple comparisons. Most users of statistical charts have been accustomed to believe that linear comparisons, represented by bar charts, can be judged with much more accuracy than can area comparisons, such as squares and circles, and that either is superior to volume comparisons, such as cubes. It is the purpose of this investigation to test these types of diagrams to ascer- tain which, if any, may be preferable from the point of view of the accuracy of the estimates made from them.
The relationships shown by the squares and circles used in this study were represented by the respective areas of the diagrams, while the relationships shown by the cubes were represented by their volumes. The fact that the actual volume of a solid can be only suggested by a two-dimension drawing may be one of the reasons why the accuracy of judgments based upon the drawings of cubes proved to be relatively low. In popular publications comparisons by circles, squares, cubes, and various pictorial means are frequently drawn on a linear basis rather than upon the proper area or volume basis. Furthermore, the reader is frequently at a loss to know upon what basis they are drawn. Careful computations have revealed that some diagrams, whether considered as linear, area, or volume comparisons, give only a very rough approximation of the figures which they undertake to present.
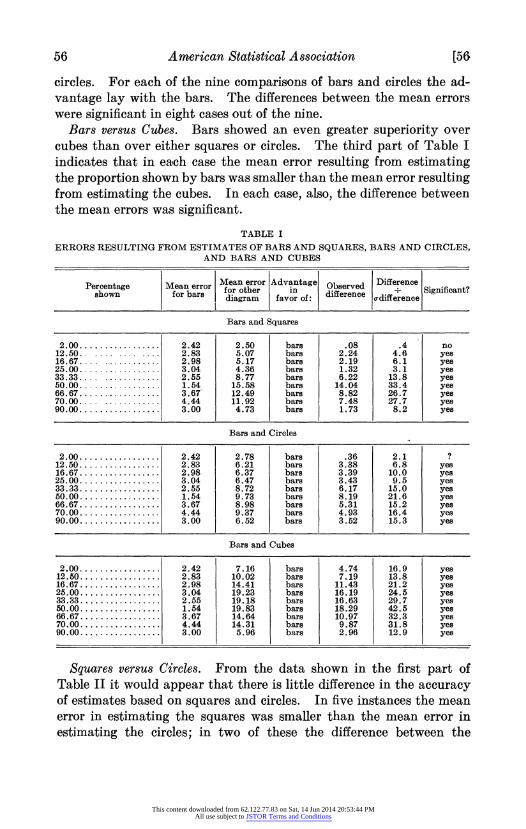
The data which follow are the results of estimates made by 550 ob- servers and the diagrams used were 40 in number. The 40 diagrams, each on a separate card, formed nine sets. Each set consisted of a comparison by means of bars, squares, circles, and cubes showing the same ratio, as shown in Chart I; in addition an alternate arrangement of squares and circles with the diagrams centered as in Chart II, was included in two of the sets. The diagrams were presented one at a
1 The writers wish to express their gratitude to those instructors and students who made it pos- sible to obtain the data used in this analysis and to Mr. William Madow and Mr. Charles H. Witt- mrann who assisted in the computations.
2 "Bar Charts Versus Circle Diagrams," by Frederick E. Croxton and Roy E. Stryker, this JOURNAL,
December, 1927.
This content downloaded from 62.122.77.83 on Sat, 14 Jun 2014 20:53:44 PMAll use subject to JSTOR Terms and Conditions
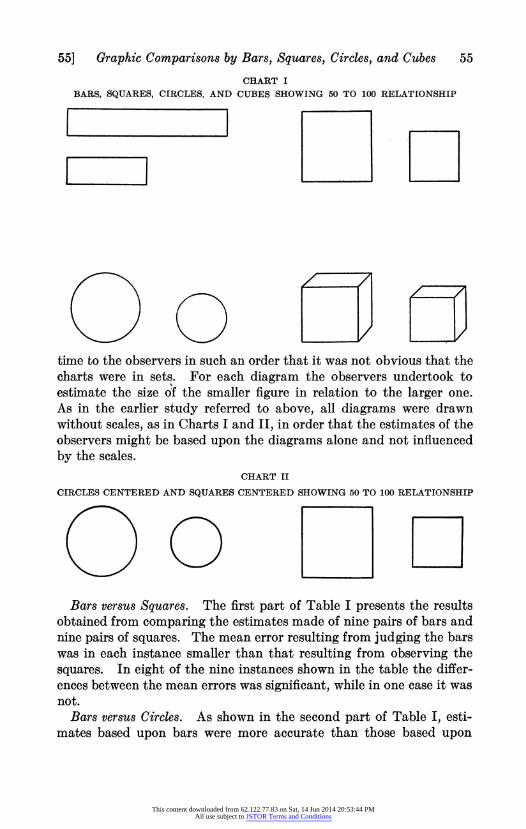
55] Graphic Comparisons by Bars, Squares, Circles, and Cubes 55
CIHART I BARS, SQUARES, CIRCLES, AND CUBES SHOWING 50 TO 100 RELATIONSHIP
I II.
time to the observers in such an order that it was not obvious that the charts were in sets. For each diagram the observers undertook to estimate the size of the smaller figure in relation to the larger one. As in the earlier study referred to above, all diagrams were drawn without scales, as in Charts I and II, in order that the estimates of the observers might be based upon the diagrams alone and not influenced by the scales.
CHART II
CIRCLES CENTERED AND SQUARES CENTERED SHOWING 50 TO 100 RELATIONSHIP
o? D0 Bars versus Squares. The first part of Table I presents the results
obtained from comparing the estimates made of nine pairs of bars and nine pairs of squares. The mean error resulting from judging the bars was in each instance smaller than that resulting from observing the squares. In eight of the nine instances shown in the table the differ- ences between the mean errors was significant, while in one case it was not.
Bars versus Circles. As shown in the second part of Table I, esti- mates based upon bars were more accurate than those based upon
This content downloaded from 62.122.77.83 on Sat, 14 Jun 2014 20:53:44 PMAll use subject to JSTOR Terms and Conditions
56 American Statistical Association [56
circles. For each of the nine comparisons of bars and circles the ad- vantage lay with the bars. The differences between the mean errors were significant in eight cases out of the nine.
Bars versus Cubes. Bars showed an even greater superiority over cubes than over either squares or circles. The third part of Table I indicates that in each case the mean error resulting from estimating the proportion shown by bars was smaller than the mean error resulting from estimating the cubes. In each case, also, the difference between the mean errors was significant.
TABLE I ERRORS RESULTING FROM ESTIMATES OF BARS AND SQUARES, BARS AND CIRCLES,
AND BARS AND CUBES
Percentage Mean error Mean error Advantage Observed Difference shown for bars for other in difference + Significant? diagram favor of adifference
Bars and Squares
2.00 ................. 2.42 2.50 bars .08 .4 no 12.50.. 2.83 5.07 bars 2.24 4.6 yes 16.67 .. ............ 2.98 5.17 bars 2.19 6.1 yes 25.00 ............... 3.04 4.36 bars 1.32 3.1 yes 33.33 .. ............ 2.55 8.77 bars 6.22 13.8 yes 50.00 ................. 1.54 15.58 bars 14.04 33.4 yes 66.67 ................. 3.67- 12.49 bars 8.82 26.7 yes 70.00 .... .4 4.44 11.92 bars 7.48 27.7 yes 90.00 ................. 3.00 4.73 bars 1.73 8.2 yes
Bars and Circles
2.00 ................. 2.42 2.78 bars .36 2.1 ? 12.50 ................. 2.83 6.21 bars 3.38 6.8 yes 16.67 ................. 2.98 6.37 bars 3.39 10.0 yes 25.00 ................. 3.04 6.47 bars 3.43 9.5 yes 33.33 ................. 2.55 8.72 bars 6.17 15.0 yes 50.00 ................. 1.54 9.73 bars 8.19 21.6 yes 66.67 ................. 3.67 8.98 bars 5.31 15.2 yes 70.00 ................. 4.44 9.37 bars 4.93 16.4 yes 90.00 ................. 3.00 6.52 bars 3.52 15.3 yes
Bars and Cubes
2.00 ................. 2.42 7.16 bars 4.74 16.9 yes 12.50 ................. 2.83 10.02 bars 7.19 13.8 yes 16.67 ................. 2.98 14.41 bars 11.43 21.2 yes 25.00 ................. 3.04 19.23 bars 16.19 24.5 yes 33.33 ................. 2.55 19.18 bars 16.63 29.7 yes 50.00 ................. 1.54 19.83 bars 18.29 42.5 yes 66.67 ................. 3.67 14.64 bars 10.97 32.3 yes 70.00 ................. 4.44 14.31 bars 9.87 31.8 yes 90.00 ................. 3.00 5.96 bars 2.96 12.9 yes
Squares versus Circles. From the data shown in the first part of Table II it would appear that there is little difference in the accuracy of estimates based on squares and circles. In five instances the mean error in estimating the squares was smaller than the mean error in estimating the circles; in two of these the difference between the
This content downloaded from 62.122.77.83 on Sat, 14 Jun 2014 20:53:44 PMAll use subject to JSTOR Terms and Conditions
571 Graphic Comparisons by Bars, Squares, Circles, and Cubes 57
means was significant and in a third it was probably significant. In four instances the mean error in estimating the circles was smaller than the mean error in estimating the squares; in three of these the difference between the means was significant.
Squares versus Cubes. Estimates based upon squares are clearly more accurate than those based upon cubes. The second part of Table II shows that in each instance the mean error in estimating the squares was smaller than that in estimating the cubes and that in each instance the difference between the mean errors was significant.
TABLE II ERRORS RESULTING FROM ESTIMATES OF SQUARES AND CIRCLES, AND SQUARES
AND CUBES
Percentage Mean error Mean error Advantage Observed Difference shown for squares f or other in difference + Significant? diagram favor of: adifference
Squares and Circles
2.00 ................. 2.50 2.78 squares .28 1.3 no 12.650 .5.07 6.21 squares 1.14 2.2 ? 16.67 ............... 5.17 6.37 squares 1.20 2.9 probably 25.00 ................ 4.36 6.47 squares 2.11 4.8 yes 33.33 ............. 8.77 8.72 circles .05 . 1 no 50.00 ................. 15.58 9.73 circles 5.85 10.8 yes 66.67 ................. 12.49 8.98 circles 3.51 9.2 yes 70.00 ................. 11.92 9.37 circles 2.55 7.3 yes 90.00 ................. 4.73 6.52 squares 1.97 7.8 yes
Squares and Cubes
2.00 ................. 2.50 7.16 squares 4.66 14.6 yes 12.50 ................. 5.07 10.02 squares 4.95 9.5 yes 16.67 ................. 5.17 14.41 squares 9.24 15.9 yes 25.00 ................. 4.36 19.23 squares 14.87 21.2 yes 33.33 ................. 8.77 19.18 squares 10.41 15.3 yes 50.00 ................. 15.58 19.83 squares 4.25 7.5 yes 66.67 .12.49 14.64 squares 2.15 5.8 yes 70 . .00............... 11.92 14.31 squares 2.39 6.8 yes 90.00 ................. 4.73 5.96 squares 1.23 5.3 yes
Circles versus Cubes. Estimates based upon circles seem to be more accurate than those based upon cubes. In Table III it may be seen
TABLE III ERRORS RESULTING FROM ESTIMATES OF CIRCLES AND CUBES
Percentage Mean error Mean error Advantage Observed Difference shown for for in difference Significant? circles cubes favor of: adifference
2.00 ................. 2.78 7.16 circles 4.38 14.6 yes 12.50 ................. 6.21 10.02 circles 3.81 7.1 yes 16.67 ................. 6.37 14.41 circles 8.04 14.1 yes 25.00 ................. 6.47 19.23 circles 12.76 19.3 yes 33.33 ................. 8.72 19.18 circles 10.46 16.1 yes 50.00 ................. 9.73 19.83 circles 10.10 18.4 yes 66.67 ................. 8.98 14.64 circles 5.66 14.5 yes 70.00 ................. 9.37 14.31 circles 4.94 13.4 yes 90.00 ................. 6.52 5.96 cubes .56 2.3 ?
This content downloaded from 62.122.77.83 on Sat, 14 Jun 2014 20:53:44 PMAll use subject to JSTOR Terms and Conditions
58 American Statistical Association [58
that in eight instances the mean error in estimating circles was smaller than the mean error in estimating cubes and that in esch of these in- stances the difference between the means was significant.
Squares centered versus other forms. As stated above, two diagrams of squares were included in which the squares were centered as in Chart II. As indicated in Table IV estimates made from bars appear to be more accurate than those made from squares centered, and esti- mates based upon squares centered are more accurate than those based upon cubes.
One reason for including squares centered was to ascertain if esti- mates made from them were more or less accurate than estimates made from squares drawn to the same base line. There seems to be no clear evidence in Table IV that either is superior. No conclusive statement can be made as to the relative merits of squares centered on the one hand and of circles, and circles centered on the other.
TABLE IV ERRORS RESULTING FROM ESTIMATES OF SQUARES
CENTERED AND OTHER DIAGRAMS
Mean error Mean 1 Percentage for error for Advantage Observed Difference..
shown squares other in difference + I Significant? centered diagram favor of: adifference
Squares Centered and Bars
25.0 . 3.99 3.04 bars .95 2.4 ? 50.0 . 12.10 1.54 bars 10.56 27.1 yes
Squares Centered and Squares
25.0 .3....... 3.99 4.36 squares .37 .8 no centered . n 50 .0. 12.10 15.58 squares 3.48 6.4 yes
centered I __ __ I I__
Squares Centered and Circles
25.0 .. .......... 3.99 6.47 squares T 2.48 6.2 T yes centeredI 50.0 .1.10..'.|........ 3 9.73 circles 2.37 4.6 yes
Squares Centered and Circles Centered
centered. ye 50.0 .. .......... 12.10 10.9 5 circlres 1.15 2. 2 ?
50.0 . 12.10 10.95 centered .1.
Squares Centered and Cubes
25 .0. 3.99 19.23 squares 15.24 22.4 yes
50.0 ... .... 12.10 19.83 squares 7.73 14.1 yes I ._ .centered
This content downloaded from 62.122.77.83 on Sat, 14 Jun 2014 20:53:44 PMAll use subject to JSTOR Terms and Conditions
59] Graphic Comparisons by Bars, Squares, Circles, and Cubes 59
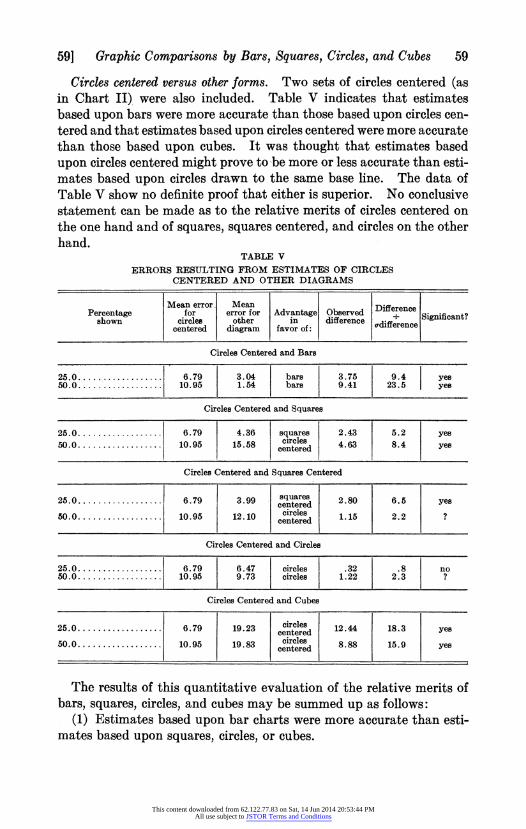
Circles centered versus other forms. Two sets of circles centered (as in Chart II) were also included. Table V indicates that estimates based upon bars were more accurate than those based upon circles cen- tered and that estimates based upon circles centered were more accurate than those based upon cubes. It was thought that estimates based upon circles centered might prove to be more or less accurate than esti- mates based upon circles drawn to the same base line. The data of Table V show no definite proof that either is superior. No conclusive statement can be made as to the relative merits of circles centered on the one hand and of squares, squares centered, and circles on the other hand.
TABLE V ERRORS RESULTING FROM ESTIMATES OF CIRCLES
CENTERED AND OTHER DIAGRAMS
Mean error Mean Dfeec Percentage for error for Advantage Observed Differen ig ant? shown circles other in difference + Significant centered diagram favor of: edifferene
Circles Centered and Bars
25 . 0 * ... . . . | 6.79 3.04 1 bars 3.75 9.4 yes 50.0 .1 10.95 1.54 bars 9.41 23.5 yes
Circles Centered and Squares
25.0 ................. 6.79 4.36 squares 2.43 5.2 yes 50.0 ................. 10.95 15.58 centered 4.63 8.4 yes
Circles Centered and Squares Centered
25.0 ..............7.. 6.79 3.99 squares 2.80 6.5 yes centered 50.0 .................. 10.95 12.10 circles 11 . 50 . 0 . 10 . 95 12 . 10 centered . 15 2.2
Circles Centered and Circles
25.0 .. ....... .. 6.79 6.47 circles .32 .8 no 50.0 .. 10.95 9.73 circles 1.22 2.3 ?
Circles Centered and Cubes
25.0 ... 6.79 19.23 circled 12.44 18.3 yes 50.0 .. ............ 10.95 19.83 cetrced 8.88 15.9 yes
The results of this quantitative evaluation of the relative merits of bars, squares, circles, and cubes may be summed up as follows:
(1) Estimates based upon bar charts were more accurate than esti- mates based upon squares, circles, or cubes.
This content downloaded from 62.122.77.83 on Sat, 14 Jun 2014 20:53:44 PMAll use subject to JSTOR Terms and Conditions
60 American Statistical Association [60
(2) Estimates based upon squares and estimates based upon circles showed no conclusive evidence that one form of presentation is superior to the other.
(3) Estimates based upon squares were more accurate than esti- mates based upon cubes.
(4) Estimates based upon circles were more accurate than estimates based upon cubes.
(5) Estimates based upon squares centered and upon circles cep- tered were more accurate than estimates based upon cubes, but less accurate than estimates based upon bars.
(6) In making comparisons by means of squares and circles it ap- pears (upon limited evidence) that it makes no difference in the accu- racy of estimates whether the figures be centered or drawn upon the same base line.
It will be noted (Chart I) that the bars used in this study were ar- ranged one above the other and that the other figures were arranged side by side. While this is the method of arrangement most frequently encountered, it raises several points which must be left for later deter- mination: Are estimates more accurate when based upon horizontal or vertical bars? If squares, circles, or cubes are to be used, is it pref- erable to arrange them side by side or one above the other? If vertical bars yield less accurate estimates than horizontal bars are they still clearly preferable to squares, circles, and cubes?
This content downloaded from 62.122.77.83 on Sat, 14 Jun 2014 20:53:44 PMAll use subject to JSTOR Terms and Conditions