Embed Size (px)
Citation preview

Graphene patent and technology landscape analysis
Making sense of an industry-disrupting material
Seven Sigma P.C. October 2016
© 2016 Seven Sigma P.C. All rights reserved

About this report
Graphene –a single layer of carbon atoms held together in a honeycomb structure– boasts extraordinary properties that could radically change our world, through transformational applications in electronics, telecommunications, aerospace, food packaging and virtually every other industry that can exploit its unique features.
In an attempt to delineate the current evolutionary state of graphene, provide adequate insight into global R&D investment and pinpoint technological areas for future development, the present patent landscape analysis was drafted. Patents are a unique source of information reflecting the level of current research and technology, long before a product reaches the market. Patent landscape is a search to understand a particular technology that provides a snapshot of the patent activity either within a given country or region, or globally. Depending on the case, hundreds or even thousands of patent records are screened. The results of this analysis are visualized in a way that allows for meaningful conclusions to be drawn.
This report was originally prepared for one of our clients and as such contained confidential information relating to strategic directions for capitalizing on the emerging technological potential of graphene. All this information has been excluded from the current version of the report.
2 © 2016 Seven Sigma P.C. All rights reserved

CONTENTS a. Graphene basics
b. Patent landscape analysis
c. Areas for future development
Appendix: about Seven Sigma

Graphene basics
5
Graphene is a single planar sheet of sp2-bonded carbon atoms. The carbon atoms are densely structured in honeycomb networks, arranged in 2-dimensional, hexagonal patterns called “benzene rings”. This honeycomb network is the basic building block of three-dimensional graphite.
Graphene is very strong, light and an excellent conductor of heat and electricity. Scientists claim that graphene’s extraordinary properties could be exploited in several industries and potentially lead to a technological revolution.
© 2016 Seven Sigma P.C. All rights reserved

Graphene’s properties
6 © 2016 Seven Sigma P.C. All rights reserved
Strong
200 times stronger than steel
Conductive
The world’s most conductive material
Thin
The thinnest material on earth – 1 million times thinner than a human hair
Two-dimensional
The world’s first 2D material
Source: http://www.graphene.manchester.ac.uk/explore/what-can-graphene-do/
Graphene is:
Graphene can be stretched by a quarter of its length and it’s stiffer than diamond. Because it’s only one atom thick, a gram of graphene can cover an entire football field. Graphene also demonstrates a high biocompatibility and can be used in biomedical applications. It also absorbs 2.3% of white light.

Graphene potential applications
7 © 2016 Seven Sigma P.C. All rights reserved
Solar industry Ultra-thin, lightweight solar cells, produced by using stacked sheets of graphene, could revolutionize the solar industry. Such solar cells have the potential to surpass any substance, aside from reactor-grade uranium, with respect to the energy produced per pound of material.
Bulletproof armor Researchers conducted miniature ballistic tests on sheets of graphene by firing a tiny silica sphere at it. A layer just an atom thick can absorb eight to ten times the impact that steel can.
Telecommunications Graphene allows for a particularly fast conversion of light into electrical signals. The use of graphene in optical data transmission could revolutionize telecommunications.
Cameras Graphene’s response to light makes it an ideal material for camera sensors. Graphene could be a game changer for the world of photography as it contains the ability to absorb light over a broad range of wavelengths.
Buildings Ultra-thin graphene surfaces could one day be used to develop a coating on the outside of buildings that would absorb sunlight and generate enough electricity to power all the appliances inside.
Computers More efficient transistors based on graphene could result in thinner computer chips which use less energy and work faster.
Sensors More sensitive and robust biotech sensor devices, environmental monitoring, oil and gas sensors.
Graphene

Methodology
9 © 2016 Seven Sigma P.C. All rights reserved
Understand • Reading background art
• Identifying main components
• Compiling keywords list
Search • Keyword based
• Class based
• Applicant based
• Country based
• Citation study
Analyze • Filtering
• Analyzing relevant records
• Advanced patent analytics

Patent dataset
10 © 2016 Seven Sigma P.C. All rights reserved
Number of patent publications 28,396
Number of patent families 20,858
Publication year range 01/01/2005 - 05/10/2016
Top applicant SAMSUNG ELECTRONICS CO LTD (637patents)
Country with most publications China (8,272 patents)
Year with most publications 2015 (7,245 patents)
Main group with most publications B82Y30/00; Nano-technology for materials or surface science (3,230 patents)
The following table presents a summary of the extracted and cleaned patent dataset used in the report. Numerous patent databases were utilized to compile the patent pool. Several analyses contained in the report are based on PatentInspiration.

Patent landscape analysis
Patent publications per year This graph shows the total number of published patents per year. The upward trend suggests that patenting in graphene has rapidly increased over the period (the numbers in the past two years (2015 and 2016) are under-represented, since patent applications may remain unpublished for up to 18 months).
The number of patents published per year about a technology is linked to the so-called S curve of that technology. When the curve is going up, the technology is evolving very fast and still in an early, if premature, phase. A decline in patenting activity may be a sign that the technology has advanced to a more mature state and could be exploited in additional commercial applications.
11 © 2016 Seven Sigma P.C. All rights reserved
0
1000
2000
3000
4000
5000
6000
7000
8000
2005 2006 2007 2008 2009 2010 2011 2012 2013 2014 2015 2016
Num
ber
of p
aten
t p
ublic
atio
ns

Patent landscape analysis
Patent publications per applicant per year This graph presents a timeline for the top 20 applicants’ publication activity (numbers for 2015 and 2016 may be under-represented). The different color shades designate the number of patents per applicant (the darker the color, the higher the number of patents published).
The graph shows a peak of patent publications in 2014 by Ocean’s King Lighting. However, Samsung remains the most active applicant.
The relatively high number of universities and research institutes in the top applicants list indicates that graphene is still in an exploratory research phase.
12 © 2016 Seven Sigma P.C. All rights reserved
2005 2006 2007 2008 2009 2010 2011 2012 2013 2014 2015 2016 Total
BAKER HUGHES INC 4 15 39 49 20 16 12 155
HARBIN INST OF TECHNOLOGY 2 5 32 20 48 54 27 188
HON HAI PREC IND CO LTD 13 61 53 29 21 7 184
IBM 1 1 1 3 7 34 85 105 110 54 25 426
JANG BOR Z 1 2 7 9 17 12 19 11 18 23 15 10 144
KOREA ADVANCED INST SCI & TECH 2 4 14 28 59 36 19 4 166
LOCKHEED CORP 1 3 3 10 26 35 52 15 145
OCEANS KING LIGHTING SCIENCE 4 54 132 237 8 435
SAMSUNG ELECTRONICS CO LTD 3 41 26 75 80 148 140 70 54 637
SAMSUNG TECHWIN CO LTD 22 31 35 37 13 1 139
SEMICONDUCTOR ENERGY LAB 29 105 33 30 26 223
TOSHIBA KK 1 1 11 30 27 29 36 20 155
UNIV RICE WILLIAM M 1 1 5 9 13 25 20 26 24 10 134
UNIV SHANGHAI 3 3 7 23 25 27 45 9 142
UNIV SHANGHAI JIAOTONG 2 8 7 41 31 37 25 12 163
UNIV SOUTHEAST 1 15 32 26 33 34 13 154
UNIV SUNGKYUNKWAN RES & BUS 24 56 52 30 10 172
UNIV TSINGHUA 7 24 61 76 40 51 23 282
UNIV ZHEJIANG 8 24 64 21 64 62 10 253
ZHAMU ARUNA 6 10 17 12 19 11 20 24 15 10 144

Patent landscape analysis
Connections This figure shows which applicants have cooperated with one another on graphene-related patents. The lines interconnect the applicants (line thickness corresponds to the number of patents in cooperation). The size of the applicant name indicates how many patents they have individually. The bigger the dot size, the more collaborations for an applicant.
We can see from this analysis that connections between industry and academia are quite pronounced (e.g. Samsung - Georgia Tech - Sungkyunkwan University - MIT etc.). This is consistent with the fact that graphene-based technologies have yet to reach the point of full-scale commercialization.
13 © 2016 Seven Sigma P.C. All rights reserved
Patent landscape analysis
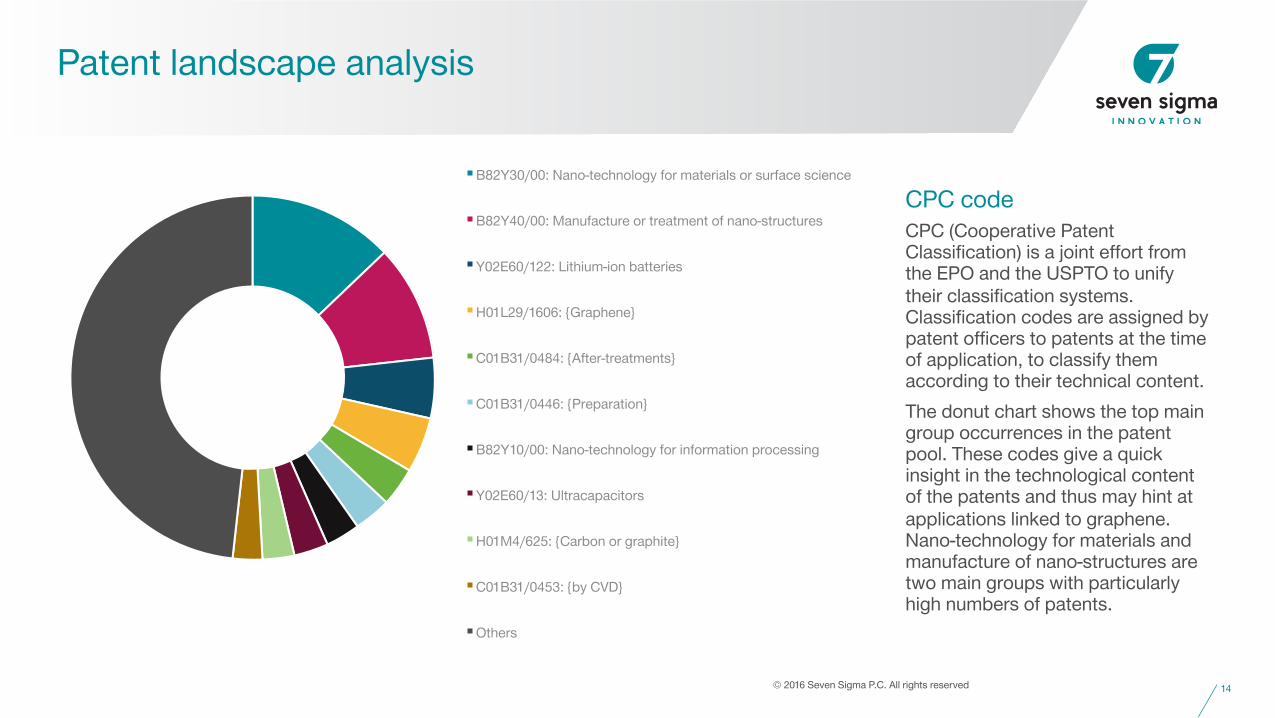
CPC code CPC (Cooperative Patent Classification) is a joint effort from the EPO and the USPTO to unify their classification systems. Classification codes are assigned by patent officers to patents at the time of application, to classify them according to their technical content.
The donut chart shows the top main group occurrences in the patent pool. These codes give a quick insight in the technological content of the patents and thus may hint at applications linked to graphene. Nano-technology for materials and manufacture of nano-structures are two main groups with particularly high numbers of patents.
14 © 2016 Seven Sigma P.C. All rights reserved
B82Y30/00: Nano-technology for materials or surface science
B82Y40/00: Manufacture or treatment of nano-structures
Y02E60/122: Lithium-ion batteries
H01L29/1606: {Graphene}
C01B31/0484: {After-treatments}
C01B31/0446: {Preparation}
B82Y10/00: Nano-technology for information processing
Y02E60/13: Ultracapacitors
H01M4/625: {Carbon or graphite}
C01B31/0453: {by CVD}
Others

Patent landscape analysis
Graphene vs. related codes (trend) This chart plots the graphene patenting activity trend against the activity of a pool comprising all patent records of the relevant codes presented in the previous figure (the trend lines were constructed using simple moving averages of the patent publications per quarter for each patent pool).
As it was made obvious from the previous analyses, the number of graphene patents rose exponentially during the last years, to the point of surpassing (in 2015) the cumulative patent pool of ten relevant main groups.
15 © 2016 Seven Sigma P.C. All rights reserved
0
500
1000
1500
2000
2500
2005 2006 2007 2008 2009 2010 2011 2012 2013 2014 2015 2016
Num
ber
of p
aten
t p
ublic
atio
ns p
er q
uart
er
Related codes
Graphene

Patent landscape analysis
Graphene vs. related codes (patent value) Taking the previous analysis one step further to investigate the potential of graphene, comparing the value of the two patent pools, we can see that overall graphene patents (in pink) score higher than the rest under the related codes.
For this analysis a patent value index was used, which is calculated based on text analytics and the number of forward citations a patent has received. The size of the bubbles represents the size of the patent families.
16 © 2016 Seven Sigma P.C. All rights reserved
-0,2
0
0,2
0,4
0,6
0,8
1
1,2
2002 2005 2008 2010 2013 2016
Pat
ent
valu
e in
dex
Related codes
Graphene

Patent landscape analysis
Patents per country This graph shows the patent application country distribution across the dataset. Each patent record has a field that mentions the country of the patent/applicant/inventor. If there are multiple applicants/inventors based in different countries for one patent, the patent will be included in each of the country counts.
Since the address of the patent usually corresponds to the R&D center of the applicant, this analysis can give an overview of where knowledge hubs are located in the world.
It is self-evident that China dominates the graphene patent landscape (about one-third of graphene patent records are Chinese).
17 © 2016 Seven Sigma P.C. All rights reserved
China (8243 patents)
United States (5631 patents)
Republic of Korea (3599 patents)
Japan (1802 patents)
Taiwan (882 patents)
Germany (600 patents)
United Kingdom (414 patents)
France (311 patents)
Others

Patent landscape analysis
Patents per country (2010) The map shows a snapshot of the patent application activity per country for the period 01/01/2005-31/12/2010. Juxtaposing this map with the one shown in the next page can be quite enlightening as to the exponentially increasing interest for graphene, whose tremendous properties and potential applications were not fully realized back in 2010.
18 © 2016 Seven Sigma P.C. All rights reserved
1-2000 2001-4000 4001-6000 6001-8000 > 8000

Patent landscape analysis
Patents per country (2016) Patent applications per country, as of 5 October 2016. Chinese applicants/inventors have vastly increased in number. There have been quite significant increases in US, Korean, Japanese and Taiwanese patents as well. The overall trend per country can be seen in the next chart.
19 © 2016 Seven Sigma P.C. All rights reserved
1-2000 2001-4000 4001-6000 6001-8000 > 8000

Patent landscape analysis
Patent application trend The patent application trend per geographical region showcases the increasing interest for graphene-related patents (numbers for 2016 are under-represented), as well as the Chinese domination. The chart also indicates that Europe may be late to the graphene party with a thin, moderately increasing patenting activity.
20 © 2016 Seven Sigma P.C. All rights reserved
0
500
1000
1500
2000
2500
3000
3500
4000
2005 2006 2007 2008 2009 2010 2011 2012 2013 2014 2015 2016
Num
ber
of p
aten
ts a
pp
licat
ions
China
USA
South Korea
Japan
Europe

European patent landscape
Patent publications per year (European applicants) As with the overall patent publication activity, the number of European patent publications progresses in an upward trend, peaking in 2015. However, it is also noticeable, as previously described, that the rise is not as intense (designated by the trend line’s slope).
21 © 2016 Seven Sigma P.C. All rights reserved
0
100
200
300
400
500
600
2005 2006 2007 2008 2009 2010 2011 2012 2013 2014 2015 2016
Num
ber
of p
aten
t p
ublic
atio
ns

European patent landscape
Patents per country Germany accounts for nearly 25% of European patent applications.
Traditionally, country analysis has been a good indicator of where the invention is actually taking place. In recent years, however, drawing conclusions from these data can be challenging, as strategic reasons (e.g. tax deductions) may influence the applicant’s decision regarding the country of filing.
22 © 2016 Seven Sigma P.C. All rights reserved
Germany (607 patents)
United Kingdom (472 patents)
France (315 patents)
Finland (195 patents)
Switzerland (180 patents)
Netherlands (138 patents)
Italy (112 patents)
Spain (107 patents)
Others
European patent landscape
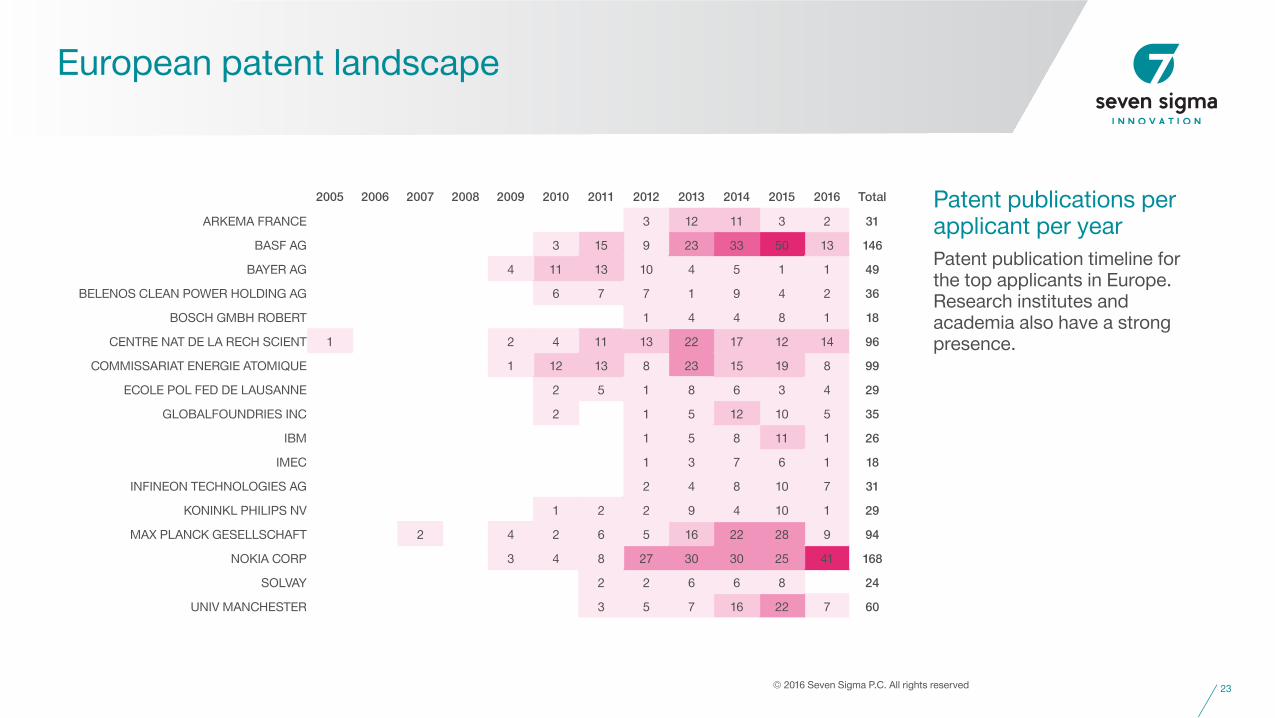
Patent publications per applicant per year Patent publication timeline for the top applicants in Europe. Research institutes and academia also have a strong presence.
23 © 2016 Seven Sigma P.C. All rights reserved
2005 2006 2007 2008 2009 2010 2011 2012 2013 2014 2015 2016 Total
ARKEMA FRANCE 3 12 11 3 2 31
BASF AG 3 15 9 23 33 50 13 146
BAYER AG 4 11 13 10 4 5 1 1 49
BELENOS CLEAN POWER HOLDING AG 6 7 7 1 9 4 2 36
BOSCH GMBH ROBERT 1 4 4 8 1 18
CENTRE NAT DE LA RECH SCIENT 1 2 4 11 13 22 17 12 14 96
COMMISSARIAT ENERGIE ATOMIQUE 1 12 13 8 23 15 19 8 99
ECOLE POL FED DE LAUSANNE 2 5 1 8 6 3 4 29
GLOBALFOUNDRIES INC 2 1 5 12 10 5 35
IBM 1 5 8 11 1 26
IMEC 1 3 7 6 1 18
INFINEON TECHNOLOGIES AG 2 4 8 10 7 31
KONINKL PHILIPS NV 1 2 2 9 4 10 1 29
MAX PLANCK GESELLSCHAFT 2 4 2 6 5 16 22 28 9 94
NOKIA CORP 3 4 8 27 30 30 25 41 168
SOLVAY 2 2 6 6 8 24
UNIV MANCHESTER 3 5 7 16 22 7 60

European patent landscape
Top applicants (companies) This tag cloud presents the companies with the most patents in the European patent pool. The larger the font size, the more patent applications for a company
Nokia and BASF are the most significant entries.
24 © 2016 Seven Sigma P.C. All rights reserved

European patent landscape
Top applicants (research institutes and academia) Similarly, this figure shows the most active European universities and research institutes.
The CNRS (France) and the University of Manchester (where graphene, as we know it today, originated from) are the most significant entries.
25 © 2016 Seven Sigma P.C. All rights reserved

Advanced patent analytics
Fields This sunburst diagram maps the fields mentioned in the graphene patent pool.
To compile this analysis, synonyms to specific words linked to each field are extracted from the patent texts. Then, the most recurring words are translated into the main fields where graphene has applications.
The chart can be particularly valuable if processes or functions are being explored, or if problems need to be solved. It gives an overview of possible ways to realize something and can introduce new trains of thought for a problem solving process.
26 © 2016 Seven Sigma P.C. All rights reserved

Advanced patent analytics
Technologies Similar to the fields analysis, the technologies chart shows the key technologies and industries described in the patent pool (technology fields are defined according Schmoch's classification (WIPO, 2010) and rely on the International Patent Classification (IPC) codes contained in the patent documents).
This analysis can be correlated to the CPC chart as well.
27 © 2016 Seven Sigma P.C. All rights reserved

Advanced patent analytics
Domains This analysis plots out the different domains found within the graphene patent pool. Each color and approximate position relates to a larger domain. The classification codes are extracted at subclass level and clustered into the domains.
This analysis indicates which domains are described in your patent pool. You can find different domains that are similar to yours based on their classification code combinations. If you have a specific problem, you could find which other similar domains have already solved your problem.
28 © 2016 Seven Sigma P.C. All rights reserved
Human needs Operations & transport
Chemistry & metallurgy Textile & paper Construction Physics Electricity New technologies
preparations for medical
specific applications of
nano-structures
layered products
subclasses b29b
joining of plastics; shaping of substances in
plastic state
processes for applying other fluent materials
to surface
physical processes
separation
general processes of compounding
macromolecular compounds obtained
otherwise than by reactions involving
unsaturated carbon-to-carbon bonds
heterocyclic compounds
carbocyclic compounds lime
treatment of water
indexing scheme
relating to structural
chemical features in the manufacture of
artificial filaments
earth drilling
electrical digital data processing
photomechanical production of
patterned surfaces
arrangements optical
elements
analyzing materials by
determining their physical
properties
printed circuits; manufacture of assemblages of
electrical components
electric heating; electric lighting not otherwise provided for
means
semiconductor devices; electric
solid state devices otherwise not provided for
cables; capacitors
conductors; insulators; of materials for
their conductive
technical subjects
covered by former
classification
technical subjects covered by former
USPC cross-reference
climate change mitigation
technologies related to
transportation
climate change mitigation
technologies in the processing
of goods
reduction of greenhouse
gases emission

Advanced patent analytics
Materials The most frequently used materials (as these are described in the patent documents) are extracted from the texts. Materials are shown in different slices of main categories with one or more subcategories.
This chart can hint at material combinations and applications that may be used by companies in relation to graphene.
29 © 2016 Seven Sigma P.C. All rights reserved
Advanced patent analytics
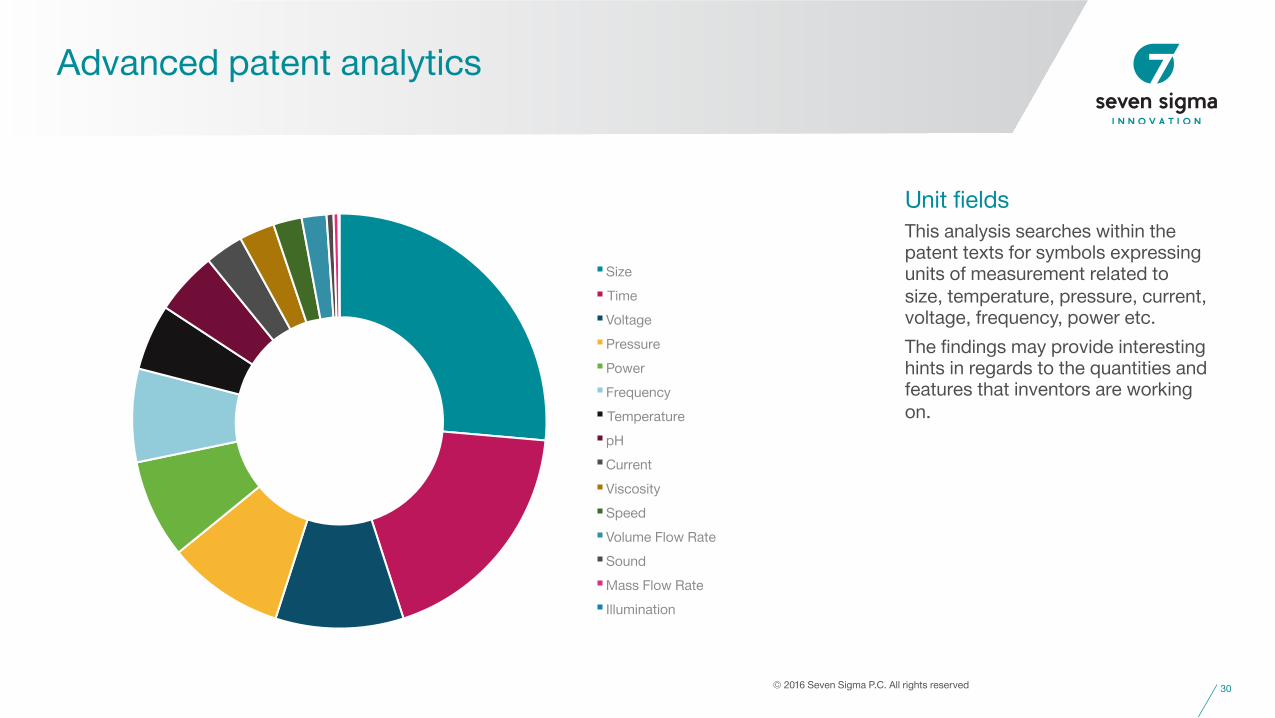
Unit fields This analysis searches within the patent texts for symbols expressing units of measurement related to size, temperature, pressure, current, voltage, frequency, power etc.
The findings may provide interesting hints in regards to the quantities and features that inventors are working on.
30 © 2016 Seven Sigma P.C. All rights reserved
Size
Time
Voltage
Pressure
Power
Frequency
Temperature
pH
Current
Viscosity
Speed
Volume Flow Rate
Sound
Mass Flow Rate
Illumination

Advanced patent analytics
Modifier This figure shows an overview of the topics that inventors are working on. The results are shown in three separate tag clouds (the larger the font size, the more patents related to the word –the exact number of patents is shown in the parentheses).
A list of synonyms is used to look within the patent pool for the things that inventors want to increase, decrease or stabilize.
This analysis, accompanied by the previous ones, can provide valuable insight for problem solving or ideation.
31 © 2016 Seven Sigma P.C. All rights reserved
Increase capacity (352)
concentration (452) conductivity (800) density (340) difficult (321)
efficiency (418) efficient (325)
electrical conductivity (513) energy (323) energy density (303)
graphite (682) layer (473) material (349)
performance (534) property (293) rate (323)
resistance (425) stable (309)
surface area (577)
temperature (1335) thermal conductivity (361) time (323) voltage (338) water (538)
Decrease agent (1145) atmosphere (316)
cost (542) damage (304) defect (244) expensive (215) go (244)
graphene (750)
graphene oxide (1402) graphite oxide (295) heat (220) impurity (244) layer (303) material (379) need (241) oxygen (221) particle (242)
pressure (475) resistance (293) size (355) substrate (341) temperature (384) thickness (215) time (270) water (378)
Change or stabilize agent (123) ceramic media (45) condition (25) conductivity (26) data (26) dispersion (58) film (27)
graphene (83) mixture (46) particle (28) plasma (45)
pressure (82) proper protection for the invention (36) reaction (28) solution (25) strict structural accuracy (52) structural integrity (31) structure (24) substrate (46) system (37)
temperature (293) vacuum (43) voltage (33) weight (63) zirconium oxide (47)

Advanced patent analytics
Value equation The last step for acquiring the whole picture in regards to the major topics and technological issues that arise from the patent pool, is the so-called value equation, shown below:
Value = P - (H + I + C)
where
P: Performance
H: Harm
I: Interface
C: Cost
A list of synonyms and phrases for describing the four components of the equation is searched throughout the patent texts. The results are then presented in the form of four tag clouds (the larger the font size, the more patents related to the word).
32 © 2016 Seven Sigma P.C. All rights reserved

Advanced patent analytics
Self Extending the previous analysis, the actions –deriving from the patent pool– that are done automatically are identified.
Value can be perceived through the notion of a self-operating system (i.e. a system that requires zero user involvement). This is linked to the general trend in technologies towards higher intelligence and automation.
By searching for functions that are done automatically, it is possible to pinpoint the attributes than can help lower the interface, thus creating more value.
33 © 2016 Seven Sigma P.C. All rights reserved

Advanced patent analytics
White space analysis This final analysis maps the standard properties of the graphene patent pool. These standard properties provide us with a roadmap informing us where we need to look for the future solutions most likely to deliver the ideal outcomes. This graph can be used to extrapolate existing solutions into the future and speculate on likely graphene-related solutions.
Each of the spokes represents a relevant property and all of the white space indicates jumps that are known from other technologies that haven’t been made within the graphene field, yet. The untapped evolutionary potential allows us to get a sense of what future generic solutions may look like.
Note: graphene’s evolutionary potential (as depicted in the current white space analysis) derives solely from the patent pool under scrutiny. A dedicated and more focused investigation can be conducted using the EvPot+ tool, which is part of the Systematic Innovation™ problem solving suite. Based on the Russian TRIZ problem solving methodology, the EvPot+ tool, through 3.7 million data-points, can give a clear insight into which technology types will ultimately win the evolutionary race to the ideal solution. For more information contact us.
34 © 2016 Seven Sigma P.C. All rights reserved
0
4000
8000
12000
16000
20000
Symmetry Liquid to spray
Information
Smell
Surface
Shape
Flexibility
Transparency
Liquid to foam
Sound
Fragmentation Coordination Porosity
Integration
Color
Components
State
Taste
Pulsation
Automation
Market
Senses
Fibres

Areas for future development
As previously stressed, graphene yields extraordinary properties that could be linked to applications with significant technological novelty. However, large-scale production still poses considerable risks and drawbacks. It is estimated that over two thirds graphene-producing organizations employ “top down” production methods (i.e. graphene made from the exfoliation of graphite by various patented methods to produce nano-platelets). The remaining third manufactures graphene by the “bottom up” method, i.e. growing graphene as a layer on a substrate of copper or silicon dioxide/carbide.
From this perspective, it’s safe to speculate that research around graphene, in the short and mid term, will primarily focus on the following:
Development of new processes that achieve large economies of scale.
Production of graphene in forms that address critical market needs.
Production of large sheets of graphene on a continuous process.
36 © 2016 Seven Sigma P.C. All rights reserved

Areas for future development
37 © 2016 Seven Sigma P.C. All rights reserved
For more information regarding the areas for future development, please contact us.
Utilizing the findings from the patent landscape analysis, we estimate that in the next 5 years, the technological areas and applications with the largest potential for graphene will be:

About Seven Sigma
39
Who we are We are an innovation consulting firm focused on helping our clients envision and build the future, instead of being overrun by it.
Leveraging proven methodologies and valuable expertise, our team of accomplished consultants works with organizations to outflank their toughest innovation challenges, skyrocket their innovation performance and ultimately boost their competitiveness and profitability.
© 2016 Seven Sigma P.C. All rights reserved

About Seven Sigma
40
Who we work with Organizations connect with us for:
Developing an innovation culture and advancing their innovation capabilities
Creating a winning innovation and technology strategy
Designing and implementing idea and product portfolio management processes
Our consulting network expands across the globe in the fields of creativity, inventive problem solving and change management. We also work with a large number of academic and research institutes –operating across a wide spectrum of domains– that can contribute their knowledge to addressing your challenges.
© 2016 Seven Sigma P.C. All rights reserved

Thank you for your attention
© 2016 Seven Sigma P.C. All rights reserved
120 Kyprou Str., 113 61 Athens, Greece T (+30) 210 8674100 F (+30) 210 8674111
E [email protected] www.sevensigma.gr


![BULK SYNTHESIS OF GRAPHENE NANOSHEETSethesis.nitrkl.ac.in/3654/1/sohan_choudhuri_thesis.pdf · 2012-05-14 · 1. INTRODUCTION [1.1] GRAPHENE Graphene is a single layer of carbon atoms](https://img.pdfslide.us/doc/110x75/5f222c82ef3c0b3478647122/bulk-synthesis-of-graphene-2012-05-14-1-introduction-11-graphene-graphene.jpg)