Embed Size (px)
Citation preview

Grape Detection in Vineyards
Ishay LeviEran Brill

Introduction
In our work we characterized areas that are likely to contain grapes as well as areas which don't. We characterized areas based on both statistic information we gathered from the database, and according to the shape their edges create.
Statistic analysis
The information was analyzed based not on a specific pixel but on a selected window, we examine:
• Gradient size• RGB values• General brightness

Statistic analysis - finding
Areas that contain grapes have:• High, but not an extreme, gradient magnitude• Average brightness• Round edges
Areas that don’t contain grapes have:• Extreme gradient values• Extreme brightness values • Non green RGB values

Gradient
Grapes have gradient magnitude between 2 and 35 .
Average gradient = 1.8
Average gradient = 7.4
Average gradient = 0.9

RGB values
Generally in a green pixel G>R G>BR =168 G =74 B =69
R =120 G =122 B =100
R =63 G =49 B =79
R =253 G =253 B =253

Shape recognition
After cleaning most non- grape section using image statistical analysis.
Second phase: cleaning using shape recognition.
As grape areas contain mainly two shapes:
Circles and ellipses.
Will use a method learned during the course for shape recognition.

Using Hough transform
A very short reminder:
Using Hough for detecting circles

Using Hough transform
Brief description of usage:1. edge detection2. Counting each edge point as an edge of a circle (using a pre
fixed limits for radius, and all angles).3. Finding for each circle center its most used radius.4. For each found circle (that passes a certain limit of edge
pointers), report all edge points in the picture that defines its edge.
5. Return only the reported edges from previous section.
Hough transform – some examples
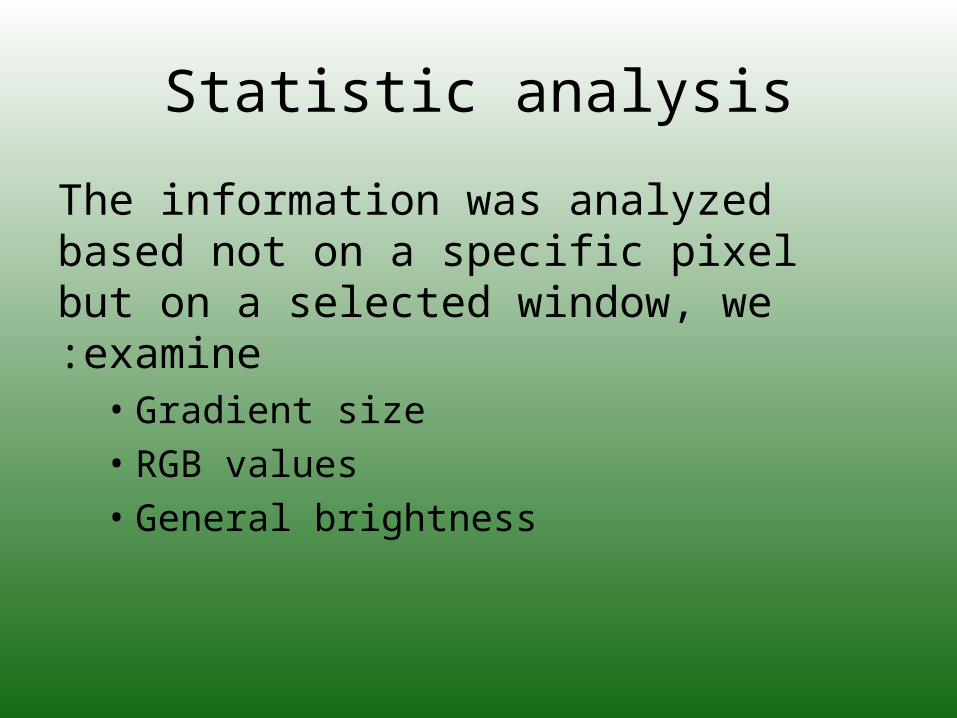
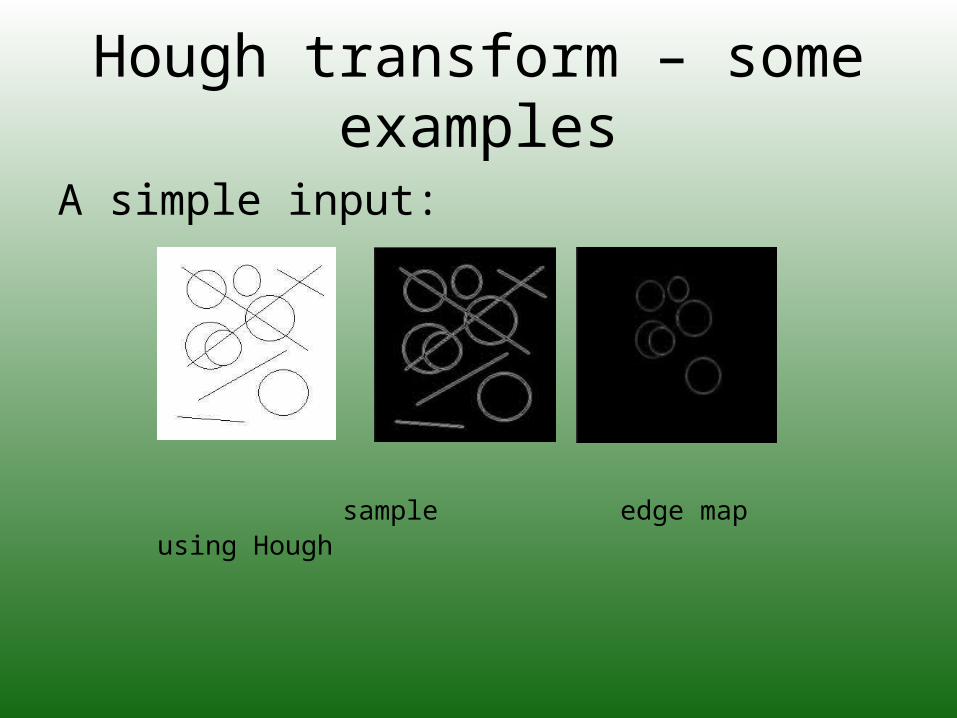
A simple input:
sample edge map using Hough

Hough transform – some examples
• A real Grape area
Sample edge detection using Hough

Final Results

Brightness filter

Gradient + RGB filter

Edge detection

Using Hough to remove edges

Final result

Result image

Correcting errors
Errors can accrue- i.e. a grape can have a small brown pixel.
Reducing and correcting errors:• using a window instead of single pixel.• Using correcting function (finding “remains”
and deleting them, filling small “holes” in grape area and with original picture.

conclusion
• Using correct statistical analysis removes high percentage of non- grape areas. Most grape areas are left untouched.
• As getting the correct values for the variables of this usage. Big database of samples is required
• This information can be adjusted to suit specific conditions: season, time in day, type and age of grapes – improving the analysis and results!

conclusion
• Using Hough transform improves results but cannot “stand alone”, Many areas in the images contain many circular-like shapes.
• In addition, its success relays on good edge detection, and correct radiuses input (as checking a large range cost running time, and not may causes errors).
• As in previous part, a good pre- analysis proves is the key for success.