Embed Size (px)
Citation preview
www.educationalpolicy.org 1
Grants for Students Educational Policy Institute
epiEducational Policy Institute
Canadian Education Report Series
Grants for Students
What They Do, Why They Work
Alex Usher
August 2006
www.educationalpolicy.org 2
Grants for Students Educational Policy Institute
Educational Policy Institute
Educational Policy Institute, Inc. (EPI) is a non-profit, non-partisan, and non-governmental
organization dedicated to policy-based research on educational opportunity for all students. With
offices in Virginia Beach, Virginia, Toronto, Ontario, and Melbourne, Australia, EPI is a collective
association of researchers and policy analysts from around the world dedicated to the mission of
enhancing our knowledge of critical barriers facing students and families throughout the educational
pipeline.
The mission of EPI is to expand educational opportunity for low-income and other
historicallyunderrepresented students through high-level research and analysis. By providing
educational leaders and policymakers with the information required to make prudent programmatic
and policy decisions, we believe that the doors of opportunity can be further opened for all students,
resulting in an increase in the number of students prepared for, enrolled in, and completing
postsecondary education.
For more information about the Educational Policy Institute, please visit our website:
http://www.educationalpolicy.org
EPI Australasia174 Wingrove St, Fairfield, 3078
Melbourne, Australia
61 3 9486 1334
EPI Canada20 Maud Street, Suite 300
Toronto, ON M5V 2M5
(416) 848-0215
EPI International2401 Seaboard Road, Suite 104
Virginia Beach, VA 23456
(757) 271-6380
www.educationalpolicy.org 3
Grants for Students Educational Policy Institute
About the Author
Alex Usher is the Vice-President of the Educational Policy Institute. Prior to joining the
Institute, he was the Director of Research and Program Development for the Canada Millen-
nium Scholarship Foundation, where he was in charge of Canada’s largest-ever research
project on access to post-secondary education. He is a native of Winnipeg, Manitoba, and
graduate of McGill University and Carleton University. ([email protected])
Suggested Citation:
Usher, A. (2006). Grants for Students: What They Do, Why They Work. Toronto, ON:
Educational Policy Institute.
www.educationalpolicy.org 4
Grants for Students Educational Policy Institute
Acknowledgments
Much of this text comes from a paper given in Bangkok in March 2006 for the
conference Higher Education Financing Policy to Support, the Accumulation
of Human Capital, which was co-financed by UNESCO and the Student Loan
Fund of Thailand. The author is grateful to the organizers, particularly Dr.
Prempracha Supsamout, Ms. Dominique Altner and Mr. Suvicha Pouaree for
the opportunity to do this research and speak at the event. Again, this should
not be taken in any way to suggest that the views expressed herein represent
those of UNESCO or of the Student Loan Fund of Thailand.
Dr. Hans Vossensteyn helped in locating data from Europe on grants; Lutz
Berkner, Brian Zucker and Don Heller were all of assistance in understanding
the US literature on grants. Comments on a very early draft from Lyndon
Simmons were also greatly appreciated. It is impossible to overstate the
importance of the many espresso-fuelled conversations with Ross Finnie which
have been crucial to shaping my research and thinking on this topic.
At the Educational Policy Institute, I am grateful for the assistance of Amy
Cervenan, Sean Junor, Massimo Savino and Watson Scott Swail for their
assistance and collaboration in researching, editing and publishing the report.
Needless to say, none of these wonderful and patient individuals bear any
responsibility for any errors of fact or interpretation contained herein; that
remains squarely with the author.
www.educationalpolicy.org 5
Grants for Students Educational Policy Institute
Introduction
Student aid policy around the developed world depends to varying degrees
on the idea that the cost of post-secondary education needs to be subsidized.
Despite the fact that governments around the world are spending hundreds
of billions of dollars to support and widen participation in higher education,
policymakers pay surprisingly little attention to what the research on these
subsidies actually says.
The purpose of this paper is simple: to summarize the literature with respect
to grants and their impact on access to education. As we shall see, the
evidence on this is neither simple nor straightforward; indeed, there are some
critical issues in the data that have not received adequate attention and pose
some serious questions of well-known economic theories. The paper’s
concluding sections will apply the lessons that can be drawn from the literature
to existing policy regimes in OECD countries.
www.educationalpolicy.org 6
Grants for Students Educational Policy Institute
1. What is a Grant?
Let us begin this investigation by defining what we mean by a “grant.” At its
broadest level, the term “grant” could be defined to include all forms of non-
repayable assistance designed to lower the cost of education for a student.
Such a broad definition would probably have include grants to institutions,
which are given to institutions in many countries in order to reduce or eliminate
any fees required of students. Because this is outside the traditional definition
of the term “grant,” however, these kinds of payments will be excluded from
the bulk of this survey, though the implications of subsidizing tuition fees in
this manner will be examined again in the conclusion.
A more restrictive definition of the term “grant” might include only non-
repayable assistance which is paid to the student (or his/her family). This
definition would certainly exclude tuition subsidies, but would still include
most forms of tax credits or family allowance payments. While these types of
aid are controversial policy instruments in Canada (Finnie, Schwartz and
Lascelles 2003, Finnie, Usher and Vossensteyn 2004), the United States
(Cooper 2005), Germany, Austria and Belgium, (Usher and Cervenan 2005),
they are still real non-repayable forms of assistance that reduce the real cost
of education by a significant amount. On the other hand, such a definition
would also eliminate loan remission programs, which are common but small
in the United States (NASSGAP 2005, Kirshstein, Berger, Benatar and Rhodes
2004) and common and large in Canada (Junor and Usher 2004), which are
clearly non-repayable forms of assistance, but technically are payable to a
student’s financial institution, not the student.
In its most restrictive and traditional form, the term “grants” traditionally means
payments made to an individual student (not the family) at the start of a
period of schooling. In some countries (e.g. Australia, the United Kingdom,
Canada, the United States and Germany), these payments are rationed to
lower-income students based on income or need; in others (e.g. Finland,
Sweden and the Netherlands) they form a basic kind of social assistancepayment made to all students regardless of financial need to ensure a
reasonable standard of living independent of one’s parents. This is how wedefine grants in this paper.
Grants perform two functions in terms of access to education. First, they
increase students’ purchasing power in the short-term, hence reducing the
“out-of-pocket” (i.e. the amount students pay from current income) costs ofeducation. They also reduce the net price1 of education in real terms. That is
to say, grants increase the benefit-to-cost ratio of education by offsetting
educational costs such as tuition and foregone income. This may seem likean idle distinction but it is far from that: student loans, for instance, reduce
out-of-pocket costs as easily as grants (and at a much lower cost to
1 In a nutshell, the concept of “net price” is as follows: tuition is a “price” for education. However, this
“price” is – for some students at least – offset by grants. As a result of this offsetting effect, grants
can be considered “negative tuition.” Tuition plus negative tuition therefore equals “net tuition” or
“net price.”
Grants
increase the
benefit-to-
cost ratio of
education by
offsetting
educational
costs such as
tuition and
foregone
income
www.educationalpolicy.org 7
Grants for Students Educational Policy Institute
government), but only grants can change net price and affect cost-benefit
ratios.
The ability of grants to change cost-benefit ratios, as we shall see in the
following section, is the crucial point in determining their effectiveness. At
this point, however, it is worth noting that although the rest of this paper will
be referring to the ability of “grants” in the traditional sense to perform these
tasks, it is worth keeping in mind that whatever is true of these policy
instruments is likely also to be true of other policy instruments which affect
student costs, such as tuition subsidies, tax credits and loan remission.
The ability of
grants to
change cost-
benefit
ratios, as we
shall see in
the following
section, is
the crucial
point in
determining
their
effectiveness
www.educationalpolicy.org 8
Grants for Students Educational Policy Institute
2. The Literature on Grants and Net Price
A distinguishing feature of the literature on grants is that much of it is actually
measuring something else entirely – that is, “net price.” The reason for this is
simple. Grant programs, per se, are difficult to study in isolation. They tend
not to lend themselves to experimental or quasi-experimental methodologies.
Moreover, to the extent that they provide money to people based on financial
need, the need itself becomes a confounding factor in the analysis – to the
extent one has detectable effects it is difficult to determine the extent to which
one is measuring the effect of the need or the effect of the intervention
designed to alleviate that need. Also, since a grant’s primary effect is financial,
it is important to know both sides of the cost equation and calculate costs
alongside subsidies.
For this reason, much of the literature on grants relies on analyses which look
at the combined effects of tuition and grants. This is useful because the
research kills two birds with one stone; what is true of grants in this literature
is necessarily the negative of what is true for tuition (and vice-versa).
There are really two types of literature on the related concepts of grants and
net prices: aggregate, jurisdiction-level studies and various types of micro-
analyses of responses to changes in net price. The former, very much smaller
than the latter, will be examined first. The latter will be examined in more
detail, looking first at the dominant US literature and then at the less extensive
international literature.
2.A – Jurisdiction-level studies
The aggregate, jurisdiction-level studies all aim to test the hypothesis that
lower levels of net price necessarily lead to “better” access to post-secondary
education, both in the sense of allowing more people to attend and providing
better access to people from disadvantaged backgrounds (however that may
be defined). For the most part, the answers have been negative. At theinternational level, Mateju (2003), Swail and Heller (2004) and Usher and
Cervenan (2005) have all shown that there is no evidence to suggest that theabsolute level of tuition in a particular jurisdiction in a particular year has any
bearing at all on national levels of enrolment, or on providing more “equal”
access to education.2 Junor and Usher (2002) and Usher (2004a) found
similar results looking at Canada, as did Swail (2004) when looking at the USand Canada combined. Thus, low- or zero-tuition jurisdictions may have high
or low participation rates, just as high-tuition jurisdictions may have high or
low participation rates. The two are simply uncorrelated.
This makes a certain intuitive sense since as Finnie (2004) has pointedout, “participation” is a function of both supply and demand. Since student
2 That said, Swail and Heller did find that year-on-year changes in tuition in specific U.S. states
generated the changes in year-on-year enrolment one would expect based on the evidence of micro-
analytic studies (below); however, they went that the US seemed to be anomalous in this respect and
that similar relationships did not appear to hold in other countries.
www.educationalpolicy.org 9
Grants for Students Educational Policy Institute
costs are only half of that equation – less if one takes account of such
factors as living expenses – it is hardly surprising that tuition, on its own,
has little effect on participation. At least as important, if not more, are
issues such as number of places, available professors, quality of secondary
schools, the secondary school completion rate, etc. These factors create
the “equilibrium conditions” in each jurisdiction.
However, just because the absolute breadth and levels of accessibility are
uncorrelated with the absolute levels of net price, that does not mean that
changes in net price (i.e. positive or negative changes in grants) will not
change the size or composition of enrolment in each jurisdiction at the
margin. It is to this question that we now turn.
2.B. – Micro-analytic Analyses
2.B.1 – Studies from the United States
Starting with the authors who might be considered “skeptics” on grants,
Hansen (1984) noted that between 1972 and 1982 that there had been no
change in the proportion of the student body coming from disadvantaged
backgrounds and hence implied that Pell Grants had failed to achieve their
purpose. As several commentators noted, this conclusion based on a pre-
post comparison, without controlling for other factors – notably for net price –
was too simplistic. Most commentators (e.g. Kane, 1994), when making the
case for grants, tend to focus on the coincidence of high government aid and
high participation rates among low-income and minority students in the 1970s
and the coincident fall in both indicators during the 1980s. St. John (2003),
in his review of literature and policy trends, while broadly agreeing with this
line of argument, cautions, however, that coincidence is not evidence of
causation and further suggests that school reforms and de-segregation efforts
in the 1960s were at least as responsible as grants for the upsurge in minority
enrolments in the 1970s.
Over the past 30 years, a number of American studies have looked at “Student
Price Response Co-efficients.” Jackson and Weatherby (1975), Manski and
Wise (1983) and Leslie and Brinkman (1987) all performed meta-analyses of
small-scale price-response studies. Each of the three studies found consistent
negative relationships between net price and enrolment. Heller (1999),analyzing a national database, came to the same conclusion, although he
found that the coefficient of response was somewhat lower, indicating perhaps
that over time net price was becoming less important (perhaps in response tothe growing returns to education). Heller also found, significantly, that grant
increases can fully offset the negative effects of tuition fees on enrolment.
He also found that the reverse was true, that “tuition increases that are not
offset by concomitant increases in financial aid appear to have the effect of
reducing access.” Looking at changes over time, Swail and Heller (2004) foundclear correlations between changes in tuition and enrolment in several US
states.
Since
student costs
are only half
of that
equation –
less if one
take account
of such
factors such
as living
expenses – it
is hardly
surprising
that tuition,
on its own,
has little
effect on
participation
www.educationalpolicy.org 10
Grants for Students Educational Policy Institute
But not all students seem to respond equally to changes in net price. One
constant across all research findings is that grants/reductions in net price
are much more effective among low-income students than among middle or
high income students.3 The size of the impact varies somewhat from study to
study but the general result does not. Leslie and Brinkman (1988) – found
that between 20 and 40 percent of total enrolments of low-income individuals
was due to grants.
In what are probably the most accurate series of studies conducted to date,
St. John (1992, 1994), St. John and Starkey (1995) and St. John and Paulsen
(2002) showed that changes in net prices had considerably different effects
on low-income students than on their more affluent peers when it came to
year-on-year retention.4 In fact, his studies showed that higher-income students
were virtually price insensitive when it came to education, but that changes
in net costs had a relatively important effect on the poor.
This all seems very conclusive; however, there is a flaw in net price
literature that needs to be underlined. Part of the problem with assessing
the effects of grants on participation and retention is that, inevitably, grants
are only part of the total student aid picture. The Institute for
Intergovernmental Relations (2003) has noted that there are in fact three
separate types of financial constraints - all of which must be satisfied if a
student is to attend tertiary education. The first barrier is what might be
called a “price constraint;” where an individual believes that the total price
or cost outweighs the benefits of a particular educational choice. The
second is a cash or liquidity constraint where an individual cannot obtain
sufficient funds to cover the immediate cost of obtaining an education. The
third barrier is debt aversion; a reluctance to incur debt in order to obtain
an education.
It is important to note that these three barriers are in effect sequential. If
someone is price-constrained, then cash constraints and debt aversion are
irrelevant. A cash constraint only applies to someone who has already
“overcome” the price barrier and decided that it is worthwhile (in a cost-
benefit sense) to attend post-secondary education. Debt aversion only
applies to someone who has already decided that going is worthwhile (in a
cost-benefit sense), has lined up the necessary short-term but, in the end,decides that too much of this short-term income comes in the form of
loans.
Applying this to the issue at hand, we realize that grants (or rather, net
prices) are primarily of use in overcoming the first barrier. But unless the
cash/liquidity barrier is also overcome, overcoming the first barrier is for
3 Indeed, some studies have even found a positive relationship at the institutional level between net
price and high income students, possibly as the result of education purchases at elite institutions
being a form of “conspicuous consumption”4 Again, this net price literature is sometimes misinterpreted to mean that tuition alone has this
effect. This is particularly the case in the Canadian literature where McKenzie (2004) and CAUT
(2006) both write about the effects of tuition as if student aid did not exist. As even a casual reading
of St. John’s work makes clear, he is talking about the effects of tuition after grants have been
subtracted.
One constant
across all
research
findings is
that grants or
reductions in
net price are
much more
effective
among low-
income
students
than among
middle or
high income
students
www.educationalpolicy.org 11
Grants for Students Educational Policy Institute
naught. In the United States and Canada, the liquidity constraint is largely
met through loans. Therefore, it follows that the total amount of all aid,
including both loans and grants, needs to be examined as a variable in any
sensible examination of access. Unfortunately, the most influential pieces
in net price theory, such as Manski and Wise (1983), Leslie and Brinkman
(1987) and McPherson and Schapiro (1991) failed to take into account size
of loans and size of total aid package as a variable separate from grant
size. Heller (1998) effectively omitted the same variables, although he
sagely warned in another article (1997) about the importance of taking the
different types of assistance into account.
This raises the question as to whether or not many price response studies
are actually examining the phenomenon they purport to be examining.
What these studies tell us is that grants to students, which add to total
assistance, (i.e. they expand purchasing power) are effective in increasing
attendance from low-income students. However, they do not tell us how
effective this assistance is compared to loans; neither does it tell us what
would happen if new grant money simply replaced loans and did not
increase the total assistance package (as is the case, for instance, with all
of Canada’s many loan remission programs). Put another way: these
studies tell us that if price and cash constraints are overcome
simultaneously, significant improvements in attendance result, but they do
not preclude the possibility that the real problem is cash constraint and
could be solved more cheaply and efficiently with loans. Only one study (St.
John, 1992) comes close to analyzing the differential effects of loans and
grants on enrolment, but since the study assumed at the outset that low-
income students will receive their package in the form of grants, the
relative efficacy of the two instruments was not actually tested.
Another consistent finding within the American net price literature is that
grants have a bigger impact on Blacks and Hispanics than on Whites.
Some authors have assumed that race is a good proxy for class and that
this is therefore evidence that grants work for all low-income students, butthis is a hypothesis rather than a fact. It may equally be the case that
different ethnic groups have different “tastes” for education, and hencedifferent views on the benefits of education. If this latter hypothesis is true,
then the evidence that a grant increases attendance presumably means
that grants are acting on the price barrier (where long-term benefits enterinto the calculation), not the cash constraint barrier (where they do not).
While the effects of grants on enrolments may not be clear-cut, the same
cannot be said of the effects of grants on persistence. This is because the
effects on persistence are, from an empirical point of view, much easier tocapture; more data is available on individual students and the outcomes
(stay in or drop-out) are easier to model than that for enrolments, where a
large number of different outcomes are possible (e.g., enroll now atinstitution A, enroll later at institution A, enroll at institution B, enroll at
institution B then transfer to institution C, don’t enroll, etc). Here, the
United States Government Accounting Office (1994) made an important
www.educationalpolicy.org 12
Grants for Students Educational Policy Institute
contribution when it noted that a shift in the loan-grant mix (note the
difference between this construct and the construct of net price theorists)
could improve retention among low-income students. The study also found
that this effect was limited to the first two years of study, after which time
students became insensitive to changes in the loan-grant mix.
In the early 1990s, Ed St. John began looking at the effects that different
aid products had on persistence decisions, both singly and in combination
with one another, an approach he termed “differentiated price response,”
as opposed to the more traditional “net price” theory. This work culminated
in St. John and Starkey (1995) which demonstrated rather clearly that
among lower-income students, grants were considerably more effective
than loans at improving persistence (all forms of aid were shown to be
negatively correlated with persistence because aid is a correlate of need;
however, the correlate was much smaller for grants than loans).
Wei and Horn (2002) compared low-income Pell Grant recipients to low-
income students without Pell grants. Based on background characteristics
alone, students with Pell Grants should have been less likely than non-
recipients to persist in their studies. However, a rigorous analysis of data
from the 1996 Beginning Postsecondary Study showed that Pell recipients’
persistence rates were identical to those of non-recipients. Given Pell
recipients’ background characteristics, this result suggests that the
presence of Pell Grants had a positive impact on persistence.
In St John’s (2002) authoritative summary of policy and literature on
college access in the United States, much of the literature says the decline
of grants in the 1980s fuelled a widening gap in post-secondary rates
between whites on the one hand and Blacks and Hispanics on the other.
Unfortunately, this case is not made directly. It is based on a number of
studies that look at the effects of net price generally (and loans and grants
separately) on persistence at the post-secondary level. Basically, what
these studies show is that loans are useful for persistence among middle-
and upper-income students, but ineffective among lower-income students,
while the converse is true for grants. On the basis of this quite solid finding
that grants are more effective than loans at promoting persistence amonglow-income students, St. John and others have made a logical but not
empirically proven leap to say that the same is true for enrolment decisions.
It is this analysis, which is empirically respectable if not entirely watertight,
which effectively forms the prevailing policy wisdom in the United States.
2.B.2 – Studies from outside the United States
While most of the literature on this topic has come from the United States, itis also worth looking at some of the international literature on this topic, too.
Non-US literature is in some ways distressingly thin (Sweden, for instance,
appears not to have any published literature on the effectiveness of grantsdespite distributing hundreds of millions of such dollars annually), but it tends

www.educationalpolicy.org 13
Grants for Students Educational Policy Institute
to confirm the basic hypothesis that grants do in fact make a measurable
difference at least in defined circumstances.
In Canada, the concept of net price is not well-understood and is not –
unfortunately – a subject of any serious research. As a result, there have
been no net-price studies looking at issues related to access, though Coelli
(2003) and Johnson and Rahman (2005), looking only at tuition found
statistically relevant effects of tuition on post-secondary participation during
the 1990s, at least among low-income youth, during the 1990s. However,
neither model incorporates the effects of grant, which may explain why Coelli’s
results (which are the stronger of the two) clash so strongly with Corak et. al
(2003) and Drolet (2005), which do not show these same effects.
There have, however, been serious attempts to look at the effects of grants
on retention, most notably by McElroy (2004, 2005). McElory’s two studies
came to different conclusions regarding the efficacy of grant aid. The first,
which simply attempted a pre-post analysis of the effects of adding two years
of grant eligibility (BC’s two-year grants program became a four-year grant
program when Millennium bursaries were introduced in 2000) seemed to
show that the introduction of an extra two years of grants had no effect on
completion, which declined over the period being monitored, though its finding
of correlation between unmet need and dropping out suggested that the size
of the total assistance package is a more important factor in persistence
than the loan-grant balance within that package.
The second study examined student records at six post-secondary institutions
and correlated the likelihood of persistence to the receipt of grants. This
study came up with results that were much more positive and showed that
even with the receipt of loans, students with grants were more likely to persist.
However, limitations on the source data from institutions’ effects made it
impossible to separate need-based grant aid from merit-based grant aid; hence
some of the effects McElroy describes are likely due to merit as opposed to
monetary factors.
In Australia, there have been no studies that look directly at the effects of
grants on participation. Due to the fact that both the original AUSTUDY andthe later Youth Allowance were given to students at both the secondary and
post-secondary level, the two major studies that were done on these programs
(Walker et. al, 2001, and FaCS 2002) emphasized the programs’ effects on
the under 19s (as in the UK, the official school-leaving age in Australia is 16).
While both studies showed that providing grants in return for school attendancewas an effective way of promoting retention, especially among lower income
groups, neither study makes a particularly compelling case that grants were
behind low-income students’ enrolment growth in post-secondary educationin the early 1980s and 1990s.
One study appears to show the effectiveness of grants, at least indirectly.
Birrell et al (2001) noted that in response to program changes that restricted
eligibility of grants since 1998, an increasing number of young, low-incomestudents have begun to take two years off full-time studies before applying to
www.educationalpolicy.org 14
Grants for Students Educational Policy Institute
post-secondary education in order to qualify as an “independent” student
and hence gain access to grants. This strongly suggests that low-income
students are dependent on grants to attend higher education in Australia
and that making them more widely available would increase participation
rates from lower-income families.
Perhaps the most direct piece of evidence on the importance of grants reducing
price comes not from a need-based program but a merit-based one. In 2000,
the Commonwealth government abandoned a merit-based equity scholarship
aimed primarily at aboriginal students. The year the program was abolished,
the number of newly-enrolled aboriginal students, which has been increasing
for two decades, fell by 15 percent. (see Phillips Curran, 2003).
In the United Kingdom, the only real evidence on the effectiveness of grants
is an experimental pilot project which began in 1999, known as the Education
Maintenance Allowance (EMA). The EMA provides funding to low-income 16-
18 year-olds in return for participation, retention and achievement in post-
compulsory schooling (where 16 is the official school-leaving age in the UK).
It is a means-tested allowance, providing either 30 or 40 pounds/week
(depending on the testing area) plus bonuses for retention and achievement.
Four variations of the EMA were introduced in different parts of the country
and a random longitudinal cohort evaluation scheme was put in place to
monitor its progress. As of the third year of the pilot, results seem to indicate
that grants can entice low-income participation to prolong their education
into the post-compulsory period (Middleton et. al, 2003). It does not, however,
seem to result in higher participation in post-secondary education, possibly
because the grant ends before further education takes place. This result
may suggest that increased preparation at the secondary level, in the absence
of adequate financial assistance at the post-secondary level, is not very
effective.
In Holland, Vossensteyn (2005) reports that although there have been a
number of studies on student choice behaviour that looked at the potentialrelationships between student financing policies and participation in tertiary
education. However, most of these studies indicated no clear relationshipsbetween changes in student finance and changes in student choice or in the
composition of the student body.
Finally, in Germany, American researcher Jon Oberg (1997) investigated the
“natural policy experiment” of the period 1983-1991 when grants were first
eliminated and then re-introduced. Oberg’s data suggests that the abolition
of grants was followed by a decrease in participation rates for students from
all socio-economic backgrounds and that the re-introduction of grants resultedin a large increase in participation across all socio-economic groups. In other
words, grants and participation rates moved in tandem: when one increased
or decreased, so did the other. While the effect was slightly more pronouncedfor youth from working-class back-grounds, and slightly less prominent for the
children of self-employed workers, the effect was remarkably similar across
all socio-economic groups – a result which has not been seen in studies in
other countries.
Oberg’s data
suggests that
the abolition
of grants was
followed by a
decrease in
participation
rates for
students
from all
socio-
economic
backgrounds
and that the
re-
introduction
of grants
resulted in a
large
increase in
participation
across all
socio-
economic
groups
www.educationalpolicy.org 15
Grants for Students Educational Policy Institute
The importance of Oberg’s result lies in the fact the German “experiment”
involved only a shift in the quality of money (that is, a shift from loans to
grants); total assistance amounts remained relatively constant over the period
in question. This appears to be fairly strong evidence that, in the German
case at least, reductions in net costs have a significant effect on participation
even when they do not change out-of-pocket costs.
2.C – Summarizing The Literature on Grants and Net Price
The evidence that grants and net price have an effect on retention would
appear to be fairly strong. The evidence that grants and net price have an
effect on access is not as strong both because it is inherently more difficult to
capture access effects and because those studies that have tried to measure
the effects have sometimes assumed away the alternate hypothesis that loans
might have an effect on access too. Nevertheless, the strength of the data on
retention makes it at least plausible that grants and net price do indeed have
an important impact on access.
A key point, though, is that with the exception of Oberg (1997), all the studies
find that the significant effects of net price and grants only occur among low-
income students. This might not sound like a particularly surprising result –
after all, low-income students are precisely the ones one would expect to
need money. But this is to pre-judge the nature of the financial barrier; yes,
one expects low-income students to need money in the short term, but this
could be provided with loans as easily as it could with grants – so why should
the form of money make a difference?
This is a bigger question than it appears at first glance. As we shall see, the
fact that grants do in fact make a difference to access for low-income students
violates a basic assumption of one of the most important economic theories
of our age. Understanding why it does so is key to understanding why grants
work.

www.educationalpolicy.org 16
Grants for Students Educational Policy Institute
3. Reconciling Human Capital Theory
with Evidence on Grants
3.A – What is Human Capital Theory?
One of the most well-known theories in late-twentieth century economics is
what is known as “Human Capital Theory” (HCT). Developed by Nobel prize-
winning economist Gary Becker in the early 1960s, HCT simply says that people
invest in their own training and education based on the same kinds of rate-of-
return calculations that they use when making other kinds of investments
(e.g. in stocks, bonds, etc.).
With respect to an investment in post-secondary education, this theory can
be represented in a simplified graphic fashion as it is below in Figure 1. The
top and bottom curves represent the income paths of an average university
and a high school graduate, respectively. The area “A” therefore represents
the amount of “benefit” that a university graduate receives from his/her
education. The area “B” represents the income foregone by a university
student while he/she is pursuing his/her studies, while area “C” represents
the cost of tuition and mandatory fees. According to HCT, provided that area
“A” is larger than areas “B” and “C” combined, then the educational investment
is “worth it” and the individual will pursue the course of study.
Figure 1 – Standard Human Capital Theory
Source: Usher, 2005.
HCT is sometimes lampooned for being overly theoretical in its assumptions
about how people make decisions. It is sometimes claimed that its proponents
www.educationalpolicy.org 17
Grants for Students Educational Policy Institute
believe that students in high school act as “adolescent econometricians.”
Backers of the Human Capital Theory are not naïve about young people’s
ability to make this investment. They are quite aware that some people might
wish to make an investment (i.e. they may believe that for a course of study
A> (B+C), but lack the funds to make it. This, in effect, is the entirety of the
justification for student loans as a means of helping student. By providing
capital to help cover the short-term costs of education, government student
loan programs allow individuals to invest appropriately in their own human
capital regardless of their income at the time they make the investment5.
HCT is a good theory and in many respects has been proven true. But it is
here that we begin to have trouble reconciling HCT with the research on
grants. As we have seen, there a significant body of research that shows
that the cost of education has a disproportionate effect on people from
lower-income backgrounds (see particularly St. John 2003). Now, HCT
clearly allows for the fact that a subsidy will make an educational
investment more attractive. But it does not allow for the possibility that a
subsidy might be more important to one group of potential students than to
another. All other things being equal, different responses to the same
incentive simply should not be possible. If HCT is true, then it should be
true for people from all backgrounds, not just people from particular
backgrounds.
So, what exactly is going on?
3.B – Possible Explanations
There are, as it turns out, a number of ways to reconcile the grants research
with HCT. In order for one group of students to respond differently from others
to a financial stimulus, one or more of the following four conditions must
apply:
1. The group has a rational reason to expect lower-than-average returns.
2. The group is systemically misestimating costs, returns or both.3. The group uses personal discount rate that are systematically higher
than those of other students.
4. The group has an economically-irrational aversion to borrowing.
We now proceed to verify whether or not these four conditions are presentamong lower-income students.
5 Arguably, this would be true of private student loan programs, too, but generally speaking
economists have converged on the view that private lenders would not invest in “human capital”
because of the lack of collateral; the resulting market failure is in fact the main argument for a
government role in the provision of student loans.
www.educationalpolicy.org 18
Grants for Students Educational Policy Institute
3.B.1 – Do Lower-Income Students Have Rational
Expectations of Lower Returns?
The distribution of benefits of education is highly unequal; one simulation
done by Statistics Canada and the federal department of Human Resources
found the rate of return was over 30 percent for the top quintile of university
graduates but actually negative for the bottom quintile of graduates (Boothby
and Rowe 2002). There is a continuing debate as to whether or not the
distribution of benefits is in fact tilted in favour of students from higher income
backgrounds.
Grayson (1997), looking at the very short-term (three months after graduation)
found systemically different labour market outcomes for lower-income families.
Rahman and Situ (2006), using CSLP-LAD6 data, found a similar gap in post-
graduation earnings by parental income. However, they concluded that since
these gaps exist both for students with a high-school education and those
with a university education, the “benefit” of post-secondary education (that
is, the boost to earning was constant even if the face value of post-graduation
wages was different) was actually the same for students of high-income and
low-income families. The Maritime Provinces Higher Education Council (2004)
went further, in fact, suggesting that two years after graduation, there was no
difference in labour market outcomes by parental education at all. A common
bias of all these studies, however, is that they look only at graduates: to the
extent that low-income students are more likely to drop-out, all these studies
will therefore overstate the benefits of PSE attendance for low-income students
to some extent.
All this data is useful, because it strongly suggests low-income students have
reason to worry that their investment might not pay off. But one could
legitimately question whether or not this empirical data actually plays a role
in student decision-making. The literature cited above is highly specialized –
it is highly unlikely that many teenagers contemplating their education have
digested its contents. Teenagers are therefore unlikely to know about these
diminished returns and would therefore be unlikely to make decisions basedupon them.
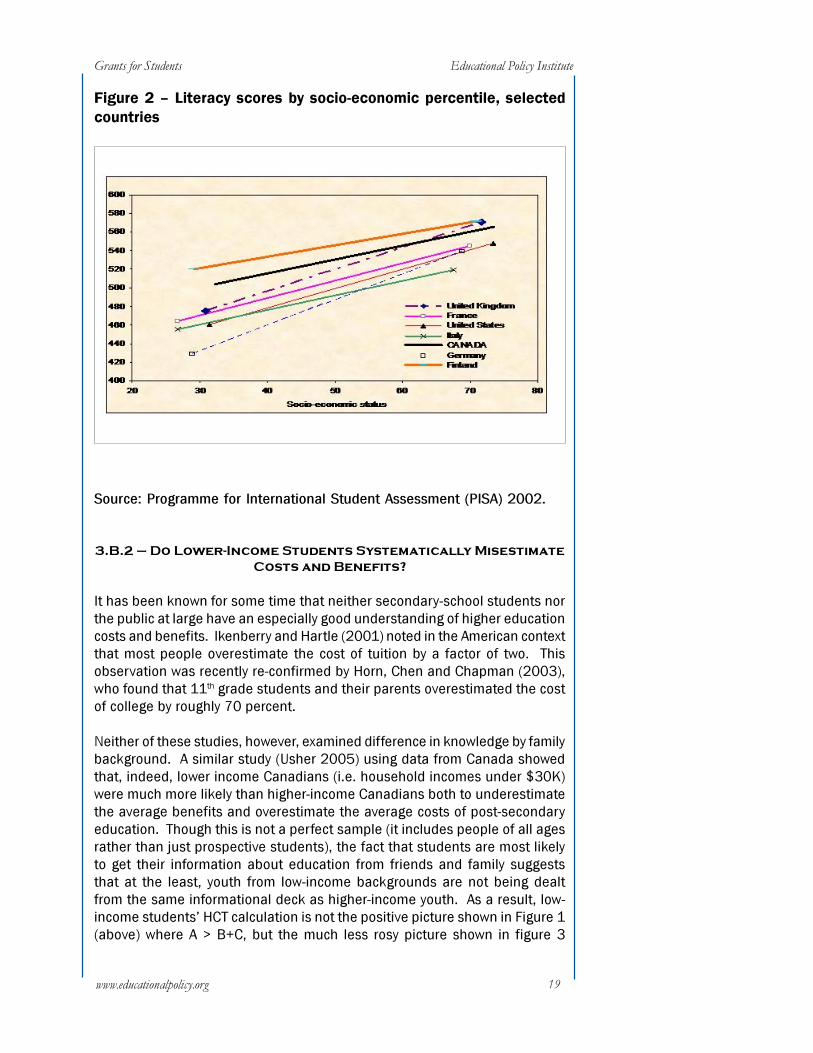
However, though they may be ignorant of the macro-level statistics
regarding returns to investment, low-income students are unlikely to be
unaware of their general place in the academic pecking order. As shownbelow in figure 2, students from low-income backgrounds tend, on average,
not to perform as well as students from higher-income backgrounds at the
secondary level. To the extent that they are aware of this fact, lower-performing students might rationally expect that they would get below-
average returns from education and hence would be less likely to invest in
education.
6 CSLP-LAD is a database which combines Canada Student Loans Program Administrative data with
data the Longitudinal Administrative Database, which contains data from individual tax files from a
20% sample of Canadians, selected randomly and then followed longitudinally.
There is a
continuing
debate as to
whether or
not the
distribution
of benefits is
in fact tilted
in favour of
students
from higher
income
backgrounds
www.educationalpolicy.org 19
Grants for Students Educational Policy Institute
Figure 2 – Literacy scores by socio-economic percentile, selected
countries
Source: Programme for International Student Assessment (PISA) 2002.
3.B.2 – Do Lower-Income Students Systematically Misestimate
Costs and Benefits?
It has been known for some time that neither secondary-school students nor
the public at large have an especially good understanding of higher education
costs and benefits. Ikenberry and Hartle (2001) noted in the American context
that most people overestimate the cost of tuition by a factor of two. This
observation was recently re-confirmed by Horn, Chen and Chapman (2003),
who found that 11th grade students and their parents overestimated the cost
of college by roughly 70 percent.
Neither of these studies, however, examined difference in knowledge by family
background. A similar study (Usher 2005) using data from Canada showed
that, indeed, lower income Canadians (i.e. household incomes under $30K)
were much more likely than higher-income Canadians both to underestimate
the average benefits and overestimate the average costs of post-secondaryeducation. Though this is not a perfect sample (it includes people of all ages
rather than just prospective students), the fact that students are most likely
to get their information about education from friends and family suggeststhat at the least, youth from low-income backgrounds are not being dealt
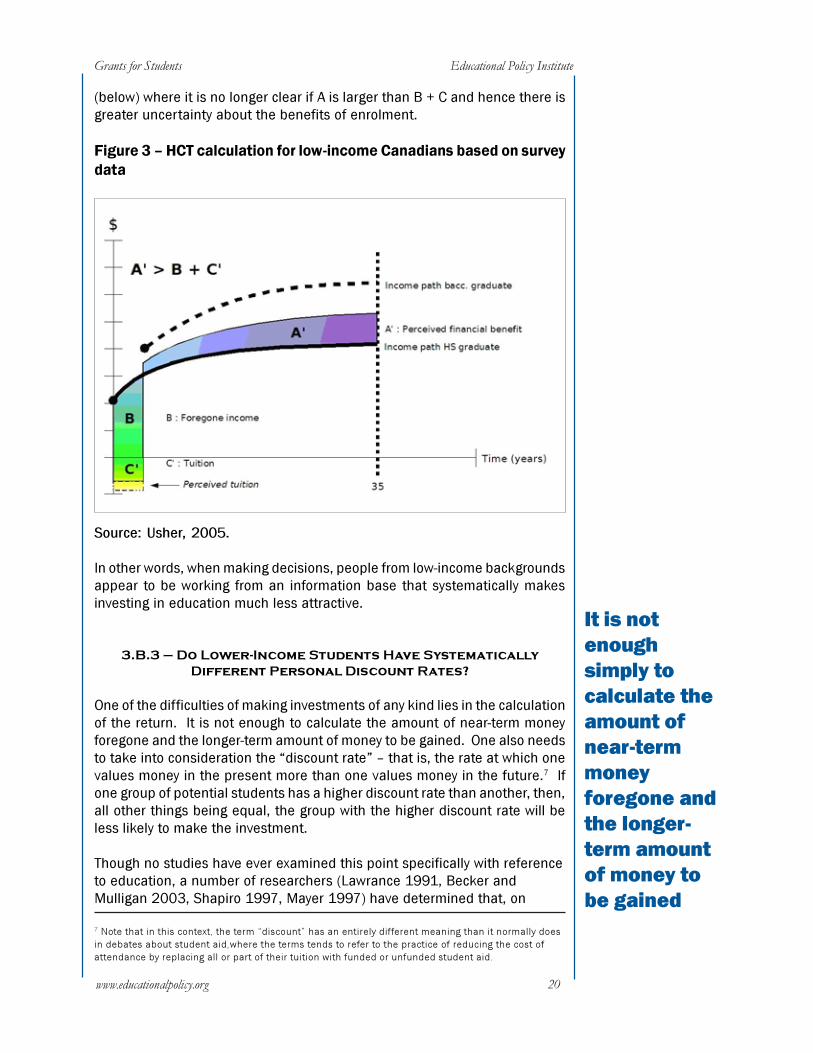
from the same informational deck as higher-income youth. As a result, low-
income students’ HCT calculation is not the positive picture shown in Figure 1
(above) where A > B+C, but the much less rosy picture shown in figure 3
www.educationalpolicy.org 20
Grants for Students Educational Policy Institute
(below) where it is no longer clear if A is larger than B + C and hence there is
greater uncertainty about the benefits of enrolment.
Figure 3 – HCT calculation for low-income Canadians based on survey
data
Source: Usher, 2005.
In other words, when making decisions, people from low-income backgrounds
appear to be working from an information base that systematically makes
investing in education much less attractive.
3.B.3 – Do Lower-Income Students Have Systematically
Different Personal Discount Rates?
One of the difficulties of making investments of any kind lies in the calculation
of the return. It is not enough to calculate the amount of near-term money
foregone and the longer-term amount of money to be gained. One also needsto take into consideration the “discount rate” – that is, the rate at which one
values money in the present more than one values money in the future.7 If
one group of potential students has a higher discount rate than another, then,
all other things being equal, the group with the higher discount rate will be
less likely to make the investment.
Though no studies have ever examined this point specifically with reference
to education, a number of researchers (Lawrance 1991, Becker andMulligan 2003, Shapiro 1997, Mayer 1997) have determined that, on
7 Note that in this context, the term “discount” has an entirely different meaning than it normally does
in debates about student aid,where the terms tends to refer to the practice of reducing the cost of
attendance by replacing all or part of their tuition with funded or unfunded student aid.
It is not
enough
simply to
calculate the
amount of
near-term
money
foregone and
the longer-
term amount
of money to
be gained
www.educationalpolicy.org 21
Grants for Students Educational Policy Institute
average, people from lower-income backgrounds have different discount
rates – that is, they have a different investment “horizon” – than people
with higher, more stable incomes. Simply put, the evidence shows that long-
term poverty encourages short-term thinking, and those who experience it
over time come to identify very strongly with the expression “one in the
hand is worth two in the bush.”
This outlook – perfectly understandable when income is low and irregular -
makes people from low-income backgrounds less likely to want to make any
investment whose return comes only in the long term. Since post-secondary
education – and particularly a university-level degree – takes a
considerable amount of time to acquire and an even longer period to show
a positive return on investment, it is easy to see how individuals who have
acquired shorter temporal preferences through poverty may be disinclined
to see education as a constructive use of their time. For some lower-
income youth, therefore, time preferences may be acting as a deterrent to
post-secondary education.
3.B.4 – Do Lower-Income Students Have Systematically
Different Views of Debt?
A fourth possible factor is that lower-income students are systematically (and
economically irrationally) averse to debt. Despite the frequency with which
this statement is put forward by analysts and lobby groups opposed to loans
or tuition fees, the evidence in favour of it is slim to non-existent.
Take, for instance, a recent policy paper from the University of California on
problems with student borrowing in the United States (Burdman 2005). Though
the entire thrust of the paper is about how to help students and families who
are fearful of debt, the paper produces nothing beyond anecdotes with respect
to the actual effect of borrowing on access. Major student position papers
(e.g. Canadian Federation of Students 2004) simply assert that low-income
students are averse to debt, and back it up with “facts” that, on closerinspection, actually describe the research on grants described in section 2 of
this report.8
Part of the problem is that “proving” that a fear of debt (which is an internal
state of mind that can only be measured through self-reports) actually
affects decision-making in an externally-observable sense is very difficult.
How can one reliably know, for instance, that someone chose not to attendpost-secondary education because of fear of debt? It is not obvious that
we can rely on self-reports for this – a student who answered “fear of debt”
might be telling the truth, but he/she might also be covering for the factthat his/her secondary school grades weren’t very good.
8 To be fair, the way the Canadian system of loans works encourages this kind of misinterpretation. In
Canada, grants until very recently were based solely on need, and required substantial amounts of
borrowing to qualify. Thus, results of US net-price research (effectively, the reaction of low-income
students to income-based grants - i.e. grants that are awarded without reference to “need” in the
Canadian sense) have interpreted incorrectly in the Canadian context as saying something about debt
aversion. An understandable mistake, but a mistake nonetheless.
www.educationalpolicy.org 22
Grants for Students Educational Policy Institute
It is of course possible to ask individuals’ views about debt and then
correlate the results with behaviour. A number of such studies have been
done either with current post-secondary education students or current
secondary school students. Both of these types of studies are, from a
methodological point of view, nearly useless. Asking post-secondary
education students about their views on debt will certainly reveal that
students dislike debt, but the mere fact that they are in the survey sample
guarantees that this dislike has not proved to be a barrier to access. Asking
secondary school students their views on debts and their future plans is
marginally better but still requires students to answer hypothetical
questions about their future behaviour.
Even the most sophisticated of these studies – that is, those conducted by
Claire Callender of South Bank University in the UK – explain less than they
appear to. Her most famous work on the subject, a report done for
Universities UK (Callender 2002), did not, as is sometime alleged, show
that fear of debt causes people to avoid post-secondary education. In fact,
her data showed that people who have fear of debt are no more or less
likely to say they will not go on to PSE than anyone else. What this report
actually showed was a correlation between a moralistic attitude towards
debt (i.e. debt is wrong) and an indication that they will not be likely to go
on. This correlation may indicate causation or it may not – there could be
unobserved variables causing both states of affairs. For instance, it could
be that there are cultural factors causing Bengali females in the UK to be
both uninterested in further education and moralistic about debt.
A more interesting piece of research from the UK comes from a 2002
survey of A-level and Further Education students taken at precisely the
time that applications were due for entrance to the following year’s
university courses (Callendar 2005). This one used more sophisticated
techniques (including multivariate analysis) to disaggregate views on debt
from decisions to determine the relationship between debt and application
to university. The result was inconclusive: while clear relationships existedbetween debt and social class, once academic results were taken into
account, the relationship disappeared. Possibly, this suggests that fear of
debt at the post-secondary level actually affects achievement at the
secondary level. More likely, the “fear of debt” observed among low-income
students in this study is in fact a reflection of the “fear of investment” thatis generated by having a high personal discount rate (see above).
This actually raises an interesting and frequently-ignored implication of the
personal discount rate factor described in the previous section. Recall that
having a high personal discount rate is akin to preferring “one in the hand”to “two in the bush.” While this characteristic makes people from low-
income backgrounds less likely to invest, it should also make them more
likely to borrow, because borrowing gives immediate benefits. Moreover,government student loans are one of the few types of credit for which low-
income individuals are automatically eligible. If anything, therefore, low-
What this
report
actually
showed was
a correlation
between a
moralistic
attitude
towards debt
(i.e. debt is
wrong) and
an indication
that they will
not be likely
to go on

www.educationalpolicy.org 23
Grants for Students Educational Policy Institute
income students should be less averse to student debt than youth from
higher income-brackets.
The best kind of sample for correlating views of debt and access decisions
are youth who finished secondary school but chose not to attend post-
secondary education. Very few such samples are available in major
industrialized country, and only one has systematically made use of it to
ask questions abut debt aversions. Canada’s Post-Secondary Education
and Participation Survey (PEPS) asked students and non-students alike
about their views on debt. As Junor and Usher (2004) reported, non-
students were no more likely than students to say they refused to take on
educational debt.
None of this is to say that debt aversion does not exist. Clearly, people have
different tolerances for debt. There are also cultural views of debt which
are very real and pose real barriers to education if funding is not available
other than through loans (e.g. Koranic prohibitions on Muslims taking
interest-bearing loans). It is to say that debt-aversion is a much murkier
and less proven phenomenon than commonly assumed, and cannot
reliably be described as a “barrier” for low-income students.
3.B.5 – Assessing the Evidence
It seems clear that of the three possible explanations why low-income students
deviate from classic human capital theory behaviour are true. They have
rational reasons to expect lower-than-average returns; they systematically
misestimate costs and benefits of education and they have systematically
higher personal discount rates than youth from wealthier backgrounds. Though
they do not appear to be systematically more debt averse than other students,
this does not detract from the overall point that there are systematic
differences between low-income youth and their wealthier counterparts. All
other things being equal, these differences make low-income youth
“subjectively” view education as a less beneficial investment than what might
appear “objectively” to be the case.
Accordingly, even if they are not credit-constrained, low-income students will
be less likely to attend post-secondary education unless they are given somekind of subsidy which would increase their subjective rate of return. These
subsidies – grants, in other words – are therefore much likelier to have an
effect on low-income students than on higher income students, who, on
average, already view education as a good investment.
Even if they
are not
credit-
constrained,
low-income
students will
be less likely
to attend PSE
unless they
are given
some kind of
subsidy
which would
increase
their
subjective
rate of return
www.educationalpolicy.org 24
Grants for Students Educational Policy Institute
4. Summary and Policy Conclusions
This review has found that grants appear to be effective at increasing retention
among low-income students, and by inference they are likely to be effective
at increasing access for low-income students. We have not been able to
determine how efficient grants are in achieving these tasks (that is, whether
the cost of providing grants is outweighed by the benefits of increasing low-
income students’ access to post-secondary education), but as this presumably
would be a function of program targeting, which necessarily varies from
program to program, this is a task that can be left to future research.9
Moreover, this review has shown why grants work for low-income students. It
is not because they are short of money at the time they go to post-secondary
education; if that were the problem, then loans would likely suffice since debt
aversion does not seem to be a problem. Rather, it is because low-income
youth evaluate the cost-benefit ratio of post-secondary education in a
systematically different way from wealthier youth. This makes them less likely
to see post-secondary education in a positive light and therefore more in need
of financial inducements to “tip the balance” of the decision in favour of
enrolling and remaining in PSE.
What policy conclusions can we draw from this? Recall from our discussion
of grant programs in section 1 that there are a number of different ways
that “grants” can be delivered to students. Aside from traditional “up-front”
grants, there are loan remissions, tax credits, and increased tuition
subsidies. Some of these types of subsidies are targeted in more or less
the way that the research says is best: towards low-income students.
Others are not targeted at all and result in substantial wastage resulting in
windfall gains for higher-income students who do not need the higher
subsidy in order to attend post-secondary education.
Within Canada, the policy balance-sheet is not very good. An increasing
percentage of Canada’s aid is now being distributed in “wasteful” ways,
mostly through tax credits (Junor and Usher 2004) but to an increasing
degree through funded tuition freezes/tuition reductions (Junor and Usher
2006). Of the remainder, most grant and remission aid is distributed onthe basis of need, which has been shown (Usher 2004b) to have
substantial leakage towards students from higher income backgrounds.
Only the federal government, the Canada Millennium Scholarship
Foundation and the Government of Ontario have programs that directly
target income, which the research suggests is the most efficient way tospend “non-repayable assistance.”
In the United States, the situation is somewhat better, as the means-tested
Pell Grant program continues to keep a laser-like focus on need, even if its
purchasing power continues to be eroded due to uneven funding fromCongress. As well, the Pell Grant suffers from “income creep,” caused by an
9 One of the Canada Millennium Scholarship Foundation’s pilot projects currently running in the
province of New Brunswick will come very close to answering this question. Results should be
available in the latter half of this decade.
Within
Canada, the
policy
balance-
sheet is not
very good.
An increasing
percentage
of Canada’s
aid is now
being
distributed in
“wasteful”
ways
www.educationalpolicy.org 25
Grants for Students Educational Policy Institute
increase in the maximum grant which, in turn, causes eligibility for the
program to move up the income scale due to the means-testing process.
But even in the US, politicans have moved toward wasteful “universal”
subsidies like tax credits, as was done during the Clinton administration
both federally (through the Taxpayer Relief Act of 1997) and at the state
level (through state-wide merit scholarships).
In much of Europe (e.g. France, Germany, Ireland Austria, Italy, Belgium),
the current situation combines low or nominal tuition fees with small
targeted grant programs (Usher and Cervenan 2005). This is good to the
extent that small grant programs are kept targeted, but bad to the extent
that a very expensive-to-maintain underlying tuition subsidy is for the most
part benefiting people who would attend higher education in any case. An
elimination of free tuition could free up money both to improve universities
in these countries and fund a major expansion of grants which could easily
offset any negative effects for lower-income students by giving them larger
grants and keeping their “net tuition” at zero, if not below.
Scandinavian countries, a term that in this instance includes the
Netherlands, are a bit more difficult to evaluate. Clearly, their free-tuition
systems are wasteful (in the same way as continental Europe) and could be
reformed in a similar way to the rest of Europe (the Netherlands are
effectively on their way to doing this already). In addition, these countries
have universal, non-need tested systems of grants. It is tempting to
condemn these as wasteful as well, and surely there are more efficient
ways of increasing participation. But it is wise to keep in mind that the
explicit policy goals of these grant programs are not simply to increase
participation, but to make students independent of their parents. Though
this policy goal might sound odd to North Americans or Southern
Europeans, we should not judge this policy in our terms.
Finally, the set of countries that appear to have at least the framework of
their grant programs “right” is Australia, the UK and New Zealand. In each
of these cases, they have moved away over time from wasteful universal
subsidies of tuition while at the same time not falling prey to the equally
wasteful North American practice of distributing tax credits left, right andcentre. Moreover, each has a grant program that is completely based on
income – though as some have noted (e.g. Dobson 2005) – much room for
improvement exists in the level at which these grant programs are funded.
As the journalist Henry Louis Mencken once said: “There is always an easysolution to every human problem—neat, plausible and wrong.” Much recent
student aid policy in North America – such as using tuition freezes, merit
aid and tax credits to improve access to education - falls into Mencken’sdefinition of an “easy solution.” As the research presented in this paper
shows, a sensible and efficient access policy would concentrate non-
repayable aid on low-income students rather than take the “easy” solution
of spreading it thinly across the entire population.
www.educationalpolicy.org 26
Grants for Students Educational Policy Institute
Bibliography
Becker, G. (1964). Human Capital: A theoretical and empirical analysis with
special reference to education. New York: National Bureau of Economic
Research.
Becker, G; Mulligan C. The endogenous determination of time preference.
Quarterly Journal of Economics, 112(3):729—758, August 1997.
Berkner, Lutz K., and Lisa Chavez. Access to Postsecondary Education for the
1992 High School Graduates (NCES 98–105). 1997.
Birrell, B, Ian R. Dobson, Virginia Rapson and T. Fred Smith (2001): Higher
Education at the Crossroads. Melbourne: Centre for Population and Urban
Research
Boothby, D and Rowe, G (2002) . Rate of Return to Education: A Distributional
Analysis Using the Lifepaths Model. Applied Research Branch, Srategic Policy,
Human Resources Development Canada W-02-8E. Ottawa.
Burdman (2005) The Student Debt Dilemma: Debt Aversion as a Barrier to
College. A Discussion Paper for The Institute for College Access and Success.
Callender, C (2002). Attitudes to Debt. London: Universities UK
Callender, C (2005). “Access to Higher Education in Britain: The Impact of
Tuition Fees and Financial Assistance,” in Cost-Sharing and Accessibility in
Higher Education: A Fairer Deal? edited by Teixeira, Pedro N.; Johnstone, D.
Bruce; Rosa, Maria J and Hans Vossensteyn. Dordrecht: Springer
Canadian Association of University Teachers (CAUT) (2006), The Economics
of Access. Ottawa: author.
Canadian Federation of Students (2004). Lower Tuition Fees for Lower Student
Debt. Toronto: author
Choy, S. (2002) Access and persistence: Findings from 10 Years of Longitudinal
Research on Students. Washington, DC: American Council on Education
Christie and Munro (2003). “The Logic of Loans: students’ perceptions of the
costs and benefits of the student loan.” British Journal of Sociology of
Education. Volume 24, Number 5 / November 2003
Coelli (2005). Tuition, Rationing and Equality of Opportunity. Working paper,
University of Melbourne
Cooper, M.A. (2005) College Access and Tax Credits. Washington: National
Association of Student Financial Aid Administrators.,
www.educationalpolicy.org 27
Grants for Students Educational Policy Institute
Corak, M; Lipps G and Zhao J (2003). Family Income and Participation in
Post-Secondary Education. Ottawa: Statistics Canada
Drolet, Marie, 2005. “Participation in Post-secondary Education in Canada:
Has the Role of Parental Income and Education Changed over the 1990s?,”Analytical Studies Branch Research Paper Series 2005243e, Statistics
Canada, Analytical Studies Branch
FaCS (2002), Youth Allowance Evaluation: Final Report, Department of Family
and Community Services, Canberra.
Finnie, R (2004). The Role of Loans and Grants. School of Policy Studies
Working paper # 27. Kingston: Queen’s University
Finnie, Ross, Saul Schwartz, and Eric Lascelles. 2003. “Smart Money?
Government Spending on Student Financial Aid in Canada.” In How Ottawa
Spends 2003–2004: Regime Change and Policy Shift, edited by Bruce Doern.
Toronto: Oxford University Press.
Finnie, R. Alex Usher and J.J. Vossensteyn (2004): Meeting the Need: A New
Architecture for Canada’s Student Financial Aid System. Policy Matters, vol.5,
no.7. Montreal: Institute for Research on Public Policy, 2004.
Gödde, I and Reinhold Schnabel (2002) Does Family Background Matter? -
Returns to Education and Family Characteristics in Germany University of
Mannheim, Germany1 SFB 504 Discussion Paper # 98-60
Grayson, J.P. (1997) Who Gets Jobs? Initial Labour Market Experiences of
York Graduates. Toronto: York University Institute for Social Research
Hansen, W.L. (1983). Impact of student financial aid on access. In J. Froomkin
(Ed.), The crisis in higher education (pp. 84-96). New York: The Academy of
Political Science.
Heller, D.E. (1997). Student price response in higher education: An update to
Leslie and Brinkman. Journal of Higher Education, 68 (6): 624-659.
Heller, D.E. (1999). The effects of tuition and state financial aid on public
college enrollment. Review of Higher Education, 23 (1): 65-89.
Ikenberry, S and Hartle, T. (2001) Taking Stock: How Americans Judge Quality,Affordability, and Leadership at U.S. Colleges and Universities. Washington:
American Council on Education
Institute for Intergovernmental Relations (2003) The Canada Millennium
Scholarship Foundation: Evaluation of the Foundation’s Performance 1998-
2002. Montreal: Canada Millennium Scholarship Foundation.
Jackson, G.A. & Weathersby, G.B. (1975). Individual demand for highereducation. Journal of Higher Education, 46 (6): 623-652.
www.educationalpolicy.org 28
Grants for Students Educational Policy Institute
Johnson, D. and F. Rahman (2005), The Role of Economic Factors, Including
the Level of Tuition, in Individual University Participation Decisions in Canada.
Working Paper. Wilfrid Laurier University.
Junor, S. and A. Usher (2004) The Price of Knowledge. Montreal: Canada
Millennium Scholarship Foundation
Junor, S. and A. Usher (2006) The Student Aid Time-Bomb. Toronto:
Educational Policy Institute
McKenzie, H. (2004). Funding Post-secondary Education in Ontario: Beyond
the Path of Least Resistance. Toronto: Ontario Confederation of University
Faculty Associations
Kane, T. (1999a). The Price of Admission: Rethinking How Americans Pay for
College. Washington, DC: Brookings, and New York: Russell Sage.
Kirshstein, R. A. Berger, E. Benatar and D. Rhodes (2004), Workforce
Contingent Financial Aid: How States Link Financial Aid to Employment.
Indianapolis: American Institutes for Research and the Lumina Foundation
for Education.
Lamb, S. and Johnson, T. (2000), The Influence of Youth Allowance on
participation in study, training and work. Results from the Longitudinal Surveys
of Australian Youth, Report prepared for FaCS, ACER Press, Camberwell,
Victoria.
Lawrance, Emily C (1991) Poverty and the Rate of Time Preference: Evidence
from Panel Data. Journal of Political Economy, U of C Press, February 1991
Leslie, L.L. & Brinkman, P.T. (1987). Student price response in higher
education: The student demand studies. Journal of Higher Education, 58 (2):
181-203.
Leslie, L.L. & Brinkman, P.T. (1988). The Economic Value of Higher Education.
New York: American Council on Education and Macmillan.
Long, M & M. Hayden (2001). Paying their way: A Survey of Australian
Undergraduate University Student Finances 2000. Canberra: Australian Vice-
Chancellors Committee.
Manski, C.F. & Wise, D.A. (1983). College choice in America. Cambridge, MA:
Harvard University Press.
Maritime Provinces Higher Education Council (2004). A Lasting Legacy: TheImpact of Family Background on Gradaute Incomes. Author: Fredericton
Mateju, P (2004). Tertiary Education: Models of Financing, Opportunity and
Participation in an International comparative Perspective. Presentation at
www.educationalpolicy.org 29
Grants for Students Educational Policy Institute
the CMEC-OECD-Canada Seminar on Student Financial Assistance. Quebec
City, May 3, 2004.
Mayer, S. (1997). What Money Can’t Buy: Family Income and Children’s Life
Chances. Chicago: Universitry of Chicago Press.
McElroy, L (2004). The Millennium Bursary in British Columbia: Exploring its
Impact. Montreal: Canada Millennium Scholarship Foundation.
McElroy L (2005). Student Aid and University Persistence: Does Debt Matter?.
Montreal: Canada Millennium Scholarship Foundation.
McPherson, M.S. & Schapiro, M.O. (1991a). Does student aid affect college
enrollment? New evidence on a persistent controversy. American Economic
Review, 81 (1): 309-318.
McPherson, M.S. & Schapiro, M.O. (1998). The student aid game: Meeting
need and rewarding talent in American higher education. Princeton, NJ:
Princeton University Press.
Middleton, S, Maguire, S. Ashworth, K. Legge, K, Allen, T., Perrin, K., Battistin
E., Dearden L., Emmerson C., Fitzsimons E. & Meghir C. (2003) The Evaluation
of Education Maintenance Allowance Pilots: Three Years Evidence A
Quantitative Evaluation. London, UK: Department for Education and Skills
Mumper, M. (1996). Removing College Price Barriers: What Government Has
Done and Why It Hasn’t Worked. Albany, NY: State University of New York
Press.
National Association of State Student Grant Aid Providers (NASSGAP) (2005),
35th Annual Survey of State-Sponsored Student Aid.
Oberg, J (1997). “Finding Evidence of the Student Grant Effect in a Natural
Experiment”. In Journal of Student Financial Aid vol. no.
Phillips Curran Consulting (2003). Independent Study of the Higher Education
Review: Stage 2 Report.
Rahman and Situ (2006). Higher Education and the Relationship Between
Earnings and Parental Income. Unpublished draft.
Rasmussen, C (2003) To Go Or Not To Go: How the Perceived Costs and
Benefits of Higher Education Influence College Decision-Making For Low-
Income Students. Unpublished, Center for the Study of Higher andPostsecondary Education, University of Michigan.
Schnitzer, K, W. Isserstedt, P. Mussig-Trapp & J. Schreiber (1999). Student
Life in Germany: the Socio-Economic Picture. Summary of the 15th Social
Survey of the Deutsches Studentenwerk (DSW). Bonn: Federal Ministry ofEducation and Research.
www.educationalpolicy.org 30
Grants for Students Educational Policy Institute
Schnitzer, K, W. Isserstedt, E. Middendorff (2002). Economic and Social
Conditions of Student Life in Germany. Summary of the 16th Social Survey of
the Deutsches Studentenwerk (DSW). Bonn: Federal Ministry of Education
and Research.
Shapiro, J (2003) : Why are the Poor So Hungry? Time Preference, Altruism,
and the Food Stamp Nutrition Cycle. Working Paper, Department of Economics,
Harvard University
St. John, E.P. (1990). Price response in enrollment decisions: An analysis of
the High School and Beyond sophomore cohort. Research in Higher Education,
31 (2): 161-176.
St. John, E.P (1993) Untangling the Web. Using Price Response Measures in
Enrollment Projections. Journal of Higher Education 64(6): 676-695.
St. John, E.P. (1994). Assessing tuition and student aid strategies: Using
price-response measures to simulate pricing alternatives. Research in Higher
Education, 35 (3): 301-334.
St. John, E.P (2003). Refinancing the College Dream: Access, Equal
Opportunity and Justice for Taxpayers. Baltimore: Johns Hopkins University
Press
St. John, E.P. & Starkey, J.B. (1995). An alternative to net price: Assessing the
influence of prices and subsidies on within-year persistence. Journal of Higher
Education, 66 (2): 156-186.
Swail, W.S and Heller, D (2004). Changes in Tuition Policy: Natural Policy
Experiments in Five Countries. Montreal: Canada Millennium Scholarship
Foundation.
United States General Accounting Office (1994). Restructuring Student Aid
Could Reduce Low-Income Student Dropout Rate. Washington: author
Universities UK (2003). Higher Education Facts and Figures. London: UUK
Usher, A. (2004a): Are the Poor Needy? Are the Needy Poor? Toronto:
Educational Policy Institute. http://www.educationalpolicy.org/pdf/
PoorNeedy.pdf
Usher, A (2004b): A New Measuring Stick: Is Access to Higher Education in
Canada Equitable? Toronto: Educational Policy Institute.
Usher, A (2005) A Little Knowledge is a Dangerous Thing. Toronto: Educational
Policy Institute.
Usher, A. and A. Cervenan (2005) – Global Higher Education Rankings:
Accessibility and Affordability in Comparative Perspective. Toronto: Educational
Policy Institute

www.educationalpolicy.org 31
Grants for Students Educational Policy Institute
Vossensteyn, J.J. (2005, forthcoming) – The effects of student financing in
the Netherlands. In Catalano and Biggieri (eds) The impact of student financing
policies on students and access in higher education
Walker, A, P. Johnson & K. Osei (2001). Austudy 1987 to 1997: the effect of
Commonwealth Income Support on Educational Participation. NATSEM,
University of Canberra. Canberra: Australia.
Wei, C.C and L. Horn (2002) Persistence and Attainment of Beginning Students
with Pell Grants. Washington D.C: National Centre for Education Statistics

www.educationalpolicy.org
Copyright 2006