Embed Size (px)
Citation preview
Grant Agreement nº.SCS8-GA-2009-234061
Coordination and support action (Coordinating)
FP7-TRANSPORT SST.2008.3.1.4. Urban delivery systems
Project acronym: TURBLOG_ww
Project title: Transferability of urban logistics concepts and practices from a worldwide perspective
Deliverable 2
Business Concepts and Models for urban
logistics
Due date of deliverable: 30th of July 2011
Submission date: 6th of October 2011
Start date of project: October 2009 Duration: 24months
TIS.pt – Transportes, Inovação e Sistemas, S.A.
Version 1.0
Project co-funded by the European Commission within the Seventh Framework Programme
Dissemination Level
PU Public X
PP Restricted to other programme participants (including the Commission Services)
RE Restricted to a group specified by the consortium (including the Commission Services)
CO Confidential, only for members of the consortium (including the Commission Services)
TURBLOG D2: Business Concepts and Models for Urban Logistics ii
Foreword
This TURBLOG Deliverable 2 was produced by TIS.PT (Rosário Macário, Maria Rodrigues, and Ana Gama)
and received contributions from the following members of the consortium:
Cesar Lama, PTL UNI, Peru
Paul Timms, ITS Leeds, UK
Marcelo Cintra do Amaral, BHTRANS, Brazil
Geraldo Abranches, BHTRANS, Brazil
Jarl Schoemaker, NEA, Netherlands
Nathaly Tromp, NEA, Netherlands
The review of the document was made by Nathaly Tromp, NEA.
This document is set to be Published and should be referenced as:
“TURBLOG (2011), Transferability of urban logistics concepts and practices from a worldwide
perspective. Deliverable 2: Business Concepts and models for urban logistics”.
QUALITY CONTROL INFORMATION:
Version Date Description
0.1 20/08/2011 Draft version of TURBLOG D2 for partners comments
0.2 10/09/2011 Draft version of TURBLOG D2 after partners comments
0.3 16/09/2011 Final version of TURBLOG D 2
0.4 30/09/2011 Final version TURBLOG D2 for quality control
0.5 5/10/2011 Final version TURBLOG D2 after quality control
Final 1.0 6/10/2011 Submission of TURBLOG D2 final version to the EC
TURBLOG D2: Business Concepts and Models for Urban Logistics iii
TABLE OF CONTENTS
Executive summary .......................................................................................................... 7
1 Introduction ............................................................................................................. 9
1.1 Overview .......................................................................................................... 9
1.1.1 Objective of the report ..................................................................................... 10
1.1.2 Methodological approach of WP2 ......................................................................... 10
1.2 Scope of the report ............................................................................................. 13
1.3 Report structure ................................................................................................ 15
2 Applying business models to urban logistics ...................................................................... 16
2.1 Objectives ........................................................................................................ 16
2.2 Definition of business models ................................................................................. 17
2.2.1 What is a business model? .................................................................................. 17
2.2.2 Why apply business model definition and components to urban logistics? ........................ 17
2.2.3 Business model Theoretical framework .................................................................. 20
2.2.4 Role of Public Policies ...................................................................................... 24
2.3 Methodological approach of business models .............................................................. 25
2.4 Comparison of case studies business models ............................................................... 27
2.4.1 General Comparison of the Case Studies Business Models ............................................ 27
2.4.2 Main findings from the Comparison ....................................................................... 31
3 Definition and establishment of logistic profiles ................................................................ 34
3.1 Objectives ........................................................................................................ 34
3.2 MethodologIcal Approach of logistic profiles .............................................................. 35
3.2.1 City area features ........................................................................................... 36
3.2.2 Product characteristics ..................................................................................... 36
3.2.3 Agents profile / Deliveries profile ........................................................................ 37

TURBLOG D2: Business Concepts and Models for Urban Logistics iv
3.3 Definition and characterisation of the logistic profiles .................................................. 38
3.3.1 Profile A: Cluster of shops specialised in one specific type of service/product .................. 41
3.3.2 Profile B: Hotels, restaurants, small grocery stores, small neighborhood markets .............. 42
3.3.3 Profile C: Business centre .................................................................................. 43
3.3.4 Profile D: Large commercial stores ....................................................................... 44
3.3.5 Profile E: Residential areas with local trade............................................................ 45
3.3.6 Main differences between logistic profiles .............................................................. 46
3.4 Comparison of case studies logistic profiles ............................................................... 48
4 Adjusting business models to logistic profiles .................................................................... 53
5 Identification of dynamic mechanisms for BM implementation and transferability ....................... 56
6 Concluding remarks ................................................................................................... 63
7 References .............................................................................................................. 66
8 Annexes ................................................................................................................. 67
8.1 Annex A ........................................................................................................... 67
8.2 Annex B ........................................................................................................... 67
8.3 Annex C ........................................................................................................... 67

TURBLOG D2: Business Concepts and Models for Urban Logistics v
INDEX OF TABLES
Table 1 – Comparison of Business Models’ characteristics ........................................................... 28
Table 2 – City area features ............................................................................................... 36
Table 3 – Product characteristics ........................................................................................ 37
Table 4 – Agents profile/deliveries profile ............................................................................. 37
Table 5 – Logistic Profiles.................................................................................................. 39
Table 6 – Characteristics of Profile A .................................................................................... 41
Table 7 – Characteristics of Profile B .................................................................................... 42
Table 8 – Characteristics of Profile C .................................................................................... 43
Table 9 – Characteristics of Profile D .................................................................................... 44
Table 10 – Characteristics of Profile E .................................................................................. 45
Table 11 – Comparison between logistic profiles’ characteristics .................................................. 47
Table 12 – Logistic profiles identification and comparison .......................................................... 50
Table 13 - Relationship between Logistic Profiles and Business Models........................................... 53
Table 14 - Combination of Logistic Profiles with the most suitable business models ........................... 54
Table 15 – Comparison of the policies adopted, logistic profile identified, the business model main
characteristics and the impacts evaluation per good practice case study. ................................. 58
Table 16 – Policies according to the combination of logistics profiles with the most suitable business
models ................................................................................................................... 61
INDEX OF FIGURES
Figure 1- Methodological approach of WP2 ............................................................................. 10
Figure 2 - Methodological approach of Work package 2.............................................................. 12
Figure 3 - Selected cities for the case studies ......................................................................... 14
Figure 4 – Agents from urban logistics and land use system ......................................................... 19
Figure 5 – Core areas of a business model .............................................................................. 20
TURBLOG D2: Business Concepts and Models for Urban Logistics vi
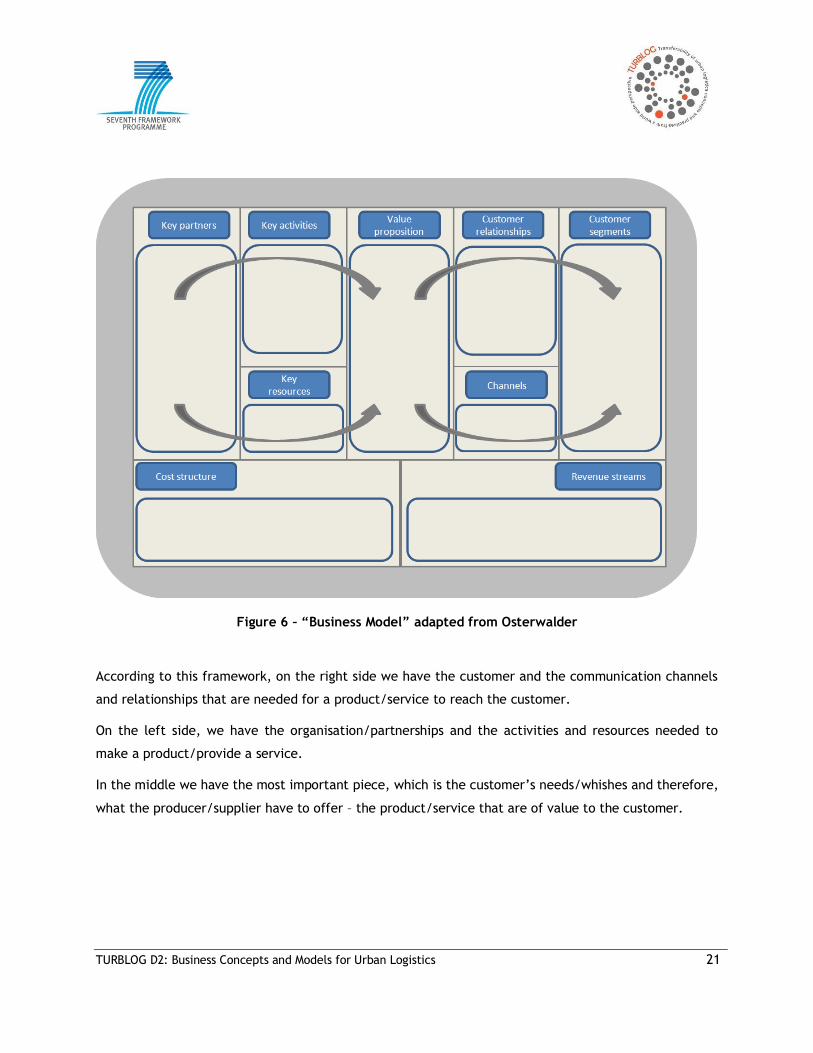
Figure 6 – “Business Model” adapted from Osterwalder ............................................................. 21
Figure 7 – Urban Logistics Business Model .............................................................................. 26
Figure 8 – Definition of logistics profile ................................................................................. 34
Figure 9 – Relation between business models and logistic profiles................................................. 54
Figure 10 – Relationship between business models, logistic profiles and impacts from the measures ...... 56
TURBLOG D2: Business Concepts and Models for Urban Logistics 7
EXECUTIVE SUMMARY
From a general point of view the objectives on urban freight can be grouped along the following aspects:
Economic (income, price, market share, system wide effects), Efficiency (minimising transport costs),
Safety, Environmental, Infrastructure. Such dimensions constitute the core issue under which a
comparison of different business concepts and models was undertaken in this research work. For the
characterisation and comparison of business models the Osterwalder’ (2004) business model was used as a
starting point. By applying this business model canvas, the first drawback faced relates to the lack of
reference to externalities which is a very relevant outcome of urban freight transport that cannot be
ignored. Therefore, the business model was adapted to include a 10th building block to cover
“externalities” generated.
Logistic profiles were defined. This concept is based on Macário (2007) who supported the hypothesis
that, within a city, it is possible to identify areas with homogenous groups in terms of logistical needs,
based on three key variables: the urban characteristics of the area, the requirements of the logistic
agents, and the characteristics of the products they transact / type of delivery. Five Logistic Profiles
were defined:
Profile A: cluster of shops specialized in one specific type of service/product;
Profile B: Hotels, restaurants, small grocery stores, small neighbourhood markets;
Profile C: Business Centre;
Profile D: Large commercial stores;
Profile E: Residential areas with local trade;
The application of these two tools for enhancement, together with the cross comparison of the main
impact of the selected measures, enabled us to draw conclusions and identify the following:
Which business models are best targeted for urban logistics;
The logistic profiles of the case studies;
The dynamic mechanisms that can be applied.
Both analyses were elaborated with the different case studies presented in D3 as a reference,
incorporating the following case studies:
Paris, France: Chronopost Concorde, La Petit Reine, Monoprix and the Freight Oriented Urban
Master Plan of Paris;
Utrecht, the Netherlands: four measures that are part of a greater urban distribution policy
package. These are the Low Emission Zone; the City Distribution Centres; the Beer Boat and the
Cargohopper;
TURBLOG D2: Business Concepts and Models for Urban Logistics 8
Belo Horizonte, Brazil: Requirements of loading and unloading spaces inside companies with
large traffic movements and Internet/telephone sales and deliveries from producer to customer
through planned routes;
Mexico City Metropolitan Area, Mexico: Public policies for urban logistics;
Santiago de Chile, Chile: Abertis Logistics Park;
Tokyo, Japan: Shinjuku joint delivery systems;
Beijing, People's Republic of China: Beijing Tobacco Logistics Centre;
New York, United States of America: Off-hour delivery program programme;
Mumbai, India: the Mumbai Dabbawalas.
Most of the urban logistic practices that were presented in case studies and that were used to test our
methodologies refer to urban city centres (Profile C), which usually face problems such as bad logistic
accesses and high levels of congestion. At the end of this report, the logistic profiles were crossed
referenced with the business models, which were then grouped into three different types of urban
logistics solutions:
Optimisation/Intermodal distribution
Logistic Parks/Centres
Last mile solutions/Micrologistics Centre
From this analysis, it was possible to analyse the relationship between the types of business models, the
types of logistic profiles and the impact evaluations of the measures from the selected case studies.
Furthermore, it was possible to identify the measures with positive impacts and the associated business
models, logistic profiles and policies that allowed the identification of better targeted policies towards
urban logistics.
The main findings of this report show that the most suitable logistic solution is defined not only by the
business characteristics, but also by the delivery, product and city area features (logistic profile), as well
as the policies adopted/to be adopted for the city. It is the combination of these three pillars that
constitute the backbone of the decision making for best urban logistics solutions.
TURBLOG D2: Business Concepts and Models for Urban Logistics 9
1 INTRODUCTION
1.1 OVERVIEW
Although urban mobility involves the movement of both people and goods, in most cities, those who are
responsible for urban transport policy and planning have historically paid more attention to the
movement of people (developing many explicit ways of facilitation) and less attention to the movement
of goods. In spite of this general observation many cities around the world have tackled aspects of urban
freight in an attempt to solve particular or local issues or have used urban freight policy to help
contribute to the broader transport or urban objectives. As Ogden (1992) states the “explicit
consideration of urban goods movements has the potential to contribute in a useful and positive way to
achieving both the goals of urban transport and some of the broader goals of urban policy and planning”.
As acknowledged by the European Commission Thematic Strategy on Urban Environment, urban freight
represents typically between 20% and 25% of road space use (space used x hours) contributing to between
10% and 20% of urban road traffic (vehicle x kilometres). This clearly highlights how indispensable urban
freight is for the economy of the city, but also how it may significantly affect the attractiveness and
quality of life in urban areas (i.e. noise, pollution, congestion).
From a general point of view the objectives on urban freight can be grouped along the following aspects:
Economic (income, price, market share, system wide effects), Efficiency (minimising transport costs),
Safety, Environmental, Infrastructure and Urban Structure. Such dimensions constitute the core issues
under which a comparison of different business concepts and models will be realised. This will be done
using the different case studies as a reference.
From that assessment, a definition and establishment of logistic profiles will be done. This concept is
based on the hypothesis that, within a city, it is possible to identify areas with homogenous groups in
terms of logistic needs, based on three key variables: the urban characteristics of the area, the
requirements of the logistic agents, and the characteristics of the products they transact / type of
delivery (Macário, 2007). Furthermore, the definition of these profiles will be done taking as the overall
background, its contribution for the urban sustainability, as seen from the 3 P’s perspective - people,
planet, and profit.
TURBLOG D2: Business Concepts and Models for Urban Logistics 10
1.1.1 OBJECTIVE OF THE REPORT
The objective of this report is to describe the work undertaken under work package 2 and to present the
main findings about the identification of which business models are best targeted for urban logistics, the
identification of the logistic profiles of the case studies and the identification of the dynamic mechanisms
that can be applied for business models implementation and transferability. This will be done using the
selected case studies from Deliverable D3 as a reference.
The main goals are twofold:
Compare the different business concepts and models identified in the different case
studies, taking also into account the different organisational and institutional settings
behind it, and
Contribute to the definition and establishment of logistic profiles taking into account the
three key variables that frame those logistic profiles (agent needs, characteristics of the
urban area and characteristics of the products/type of delivery).
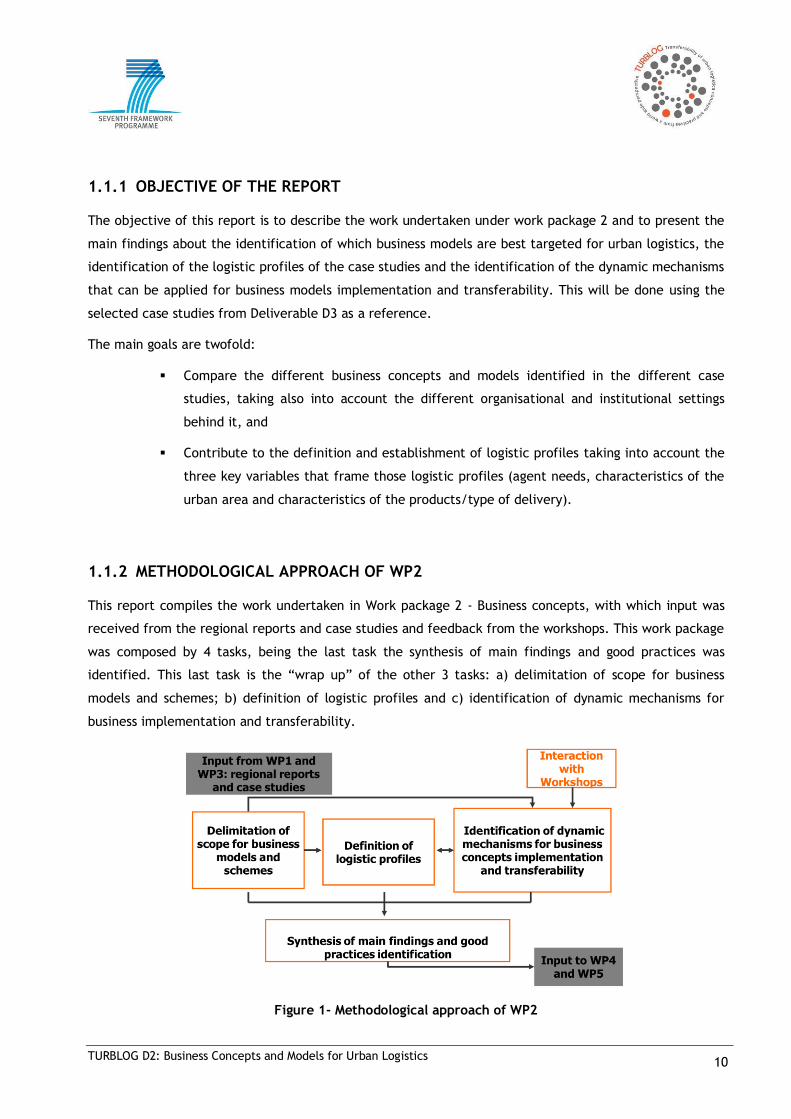
1.1.2 METHODOLOGICAL APPROACH OF WP2
This report compiles the work undertaken in Work package 2 - Business concepts, with which input was
received from the regional reports and case studies and feedback from the workshops. This work package
was composed by 4 tasks, being the last task the synthesis of main findings and good practices was
identified. This last task is the “wrap up” of the other 3 tasks: a) delimitation of scope for business
models and schemes; b) definition of logistic profiles and c) identification of dynamic mechanisms for
business implementation and transferability.
Figure 1- Methodological approach of WP2
TURBLOG D2: Business Concepts and Models for Urban Logistics 11
To accomplish the objectives presented in chapter 1.1.1, the adopted methodological approach of WP2 is
illustrated in the figure below (see 1.1.2).
Regarding the definition of the business models, a theoretical framework was adapted and the business
model canvas was applied to the case studies on good practices taken from Deliverable D3 (available at
www.turblog.eu), defining the scope and each case study business model.
For the logistic profile definition, a classification scale was determined and five logistic profiles were
established. An excel based tool for the logistic profile identification was designed and applied to all
selected case studies from Deliverable D3.
The application of these two tools for enhancement, together with the cross comparison of the main
impact of the selected measures, enabled us to draw conclusions and identify the following:
• Which business models are best targeted for urban logistics;
• The logistic profiles of the case studies;
• The dynamic mechanisms that can be applied.
TURBLOG D2: Business Concepts and Models for Urban Logistics 12
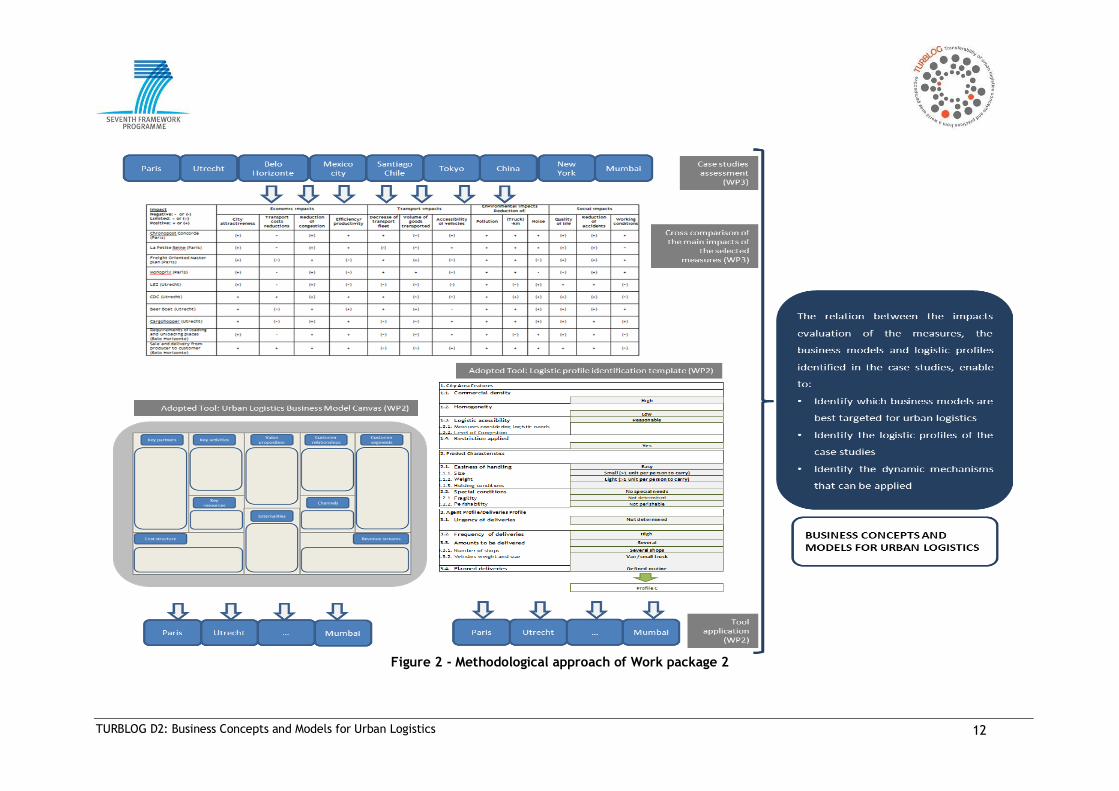
Figure 2 - Methodological approach of Work package 2
TURBLOG D2: Business Concepts and Models for Urban Logistics 13
1.2 SCOPE OF THE REPORT
As it is presented in the previous chapter, this report has applied two different tools - Urban Logistic
Business Model and Logistic Profile Template – to the case studies selected in Deliverable 3 (see figure 2)
to be able to compare business models and logistic profiles:
Paris, France: Chronopost Concorde, La Petit Reine, Monoprix;
Utrecht, the Netherlands: from the four measures that are part of a greater urban distribution
policy package, the selected good practices were: the Beer Boat and the Cargohopper;
Belo Horizonte, Brazil: Internet/telephone sales and deliveries from producer to customer through
planned routes;
Santiago de Chile, Chile: Abertis Logistics Park;
Tokyo, Japan: Shinjuku joint delivery systems;
Beijing, People's Republic of China: Beijing Tobacco Logistics Centre;
New York, United States of America: Off-hour delivery program programme;
Mumbai, India: the Mumbai Dabbawalas.
The definition of the business models is done according to a methodology that cannot be applied to
policies and/or regulations and therefore some case studies could not be considered. Also, the logistic
profile characterisation is done according to the city area features, the agent profile/deliveries profile
and product characteristics, and due to that, some good practices from the case studies could not be
considered as they are not associated to a product or service or to a specific area. This is the case of the
regulations investigated, such as:
Mexico City Metropolitan Area, Mexico: Freight Transport Regulation Programme and Vehicle
Verification Programme (Public policies for urban logistics);
Belo Horizonte: Requirements of loading and unloading spaces inside companies with large traffic
movements;
Paris: Freight Oriented Urban Master Plan of Paris;
Utrecht, the Netherlands: Low Emission Zone; the City Distribution Centres definition.
TURBLOG D2: Business Concepts and Models for Urban Logistics 14
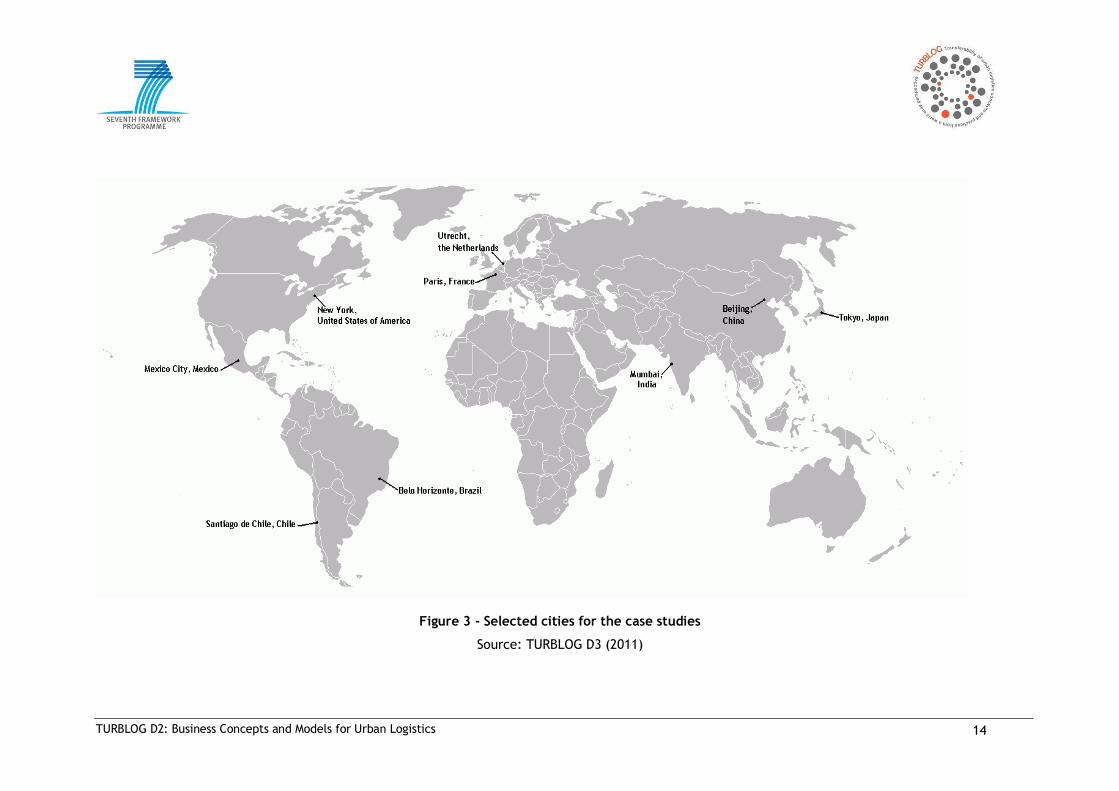
Figure 3 - Selected cities for the case studies
Source: TURBLOG D3 (2011)
TURBLOG D2: Business Concepts and Models for Urban Logistics 15
As Deliverable D3 has already been mentioned, it is important to note that there might be better
practices known in other cities or countries in the world. However, the cities mentioned above have
been selected for a number of reasons. First, in order to present a broad variety of urban logistics
practices around the world, both in developed countries as well as in less developed countries. Each
city is also different with regard to its characteristics (for instance size, important economic sectors,
transport infrastructure and traditions). Each case study also presents one or more types of good
practices, which vary from the practices presented in the other case studies. Some of the cases were
also consciously chosen due to the “specialty” of country. For example, Mumbai is well-known for its
lunchbox delivery system and Tokyo for its co-operative distribution systems.
The next chapters describe the work developed in work package 2 and the findings from the results
achieved.
1.3 REPORT STRUCTURE
The structure of this report involves the following chapters. Chapter 2 describes the adopted business
model framework that was applied to the case studies and makes a comparison of the case study
business models.
Chapter 3 consists of the definition and establishment of five logistic profiles based in the a) city area
features, b) product characteristics and c) agents profile/deliveries profile. It also presents the case
studies logistic profile characterisation and their comparison.
Chapter 4 presents how the business models and the logistic profiles are related and identifies the
business models that are more suitable to the logistic profiles established.
Chapter 5 identifies the dynamic mechanisms for business model implementation through the relation
between impact evaluations, business models, and logistic profiles. This relation enables the
identification of the more adequate policies to each business model and logistic profile, according to
the impact evaluation that was made in Deliverable D3.
Finally, Chapter 6 provides the concluding remarks of the work developed within WP2, identifying which
business models are best targeted for urban logistics, the logistic profiles of the case studies and the
dynamic mechanisms that can be applied.
TURBLOG D2: Business Concepts and Models for Urban Logistics 16
2 APPLYING BUSINESS MODELS TO URBAN LOGISTICS
2.1 OBJECTIVES
The purpose of applying business model concepts to urban freight logistics is derived from the
similarities between the business model definition and components, and the urban freight logistics
processes.
The objective is to identify which business models are best targeted for urban logistics through the
analysis of the business models of the case studies from Deliverable D3 (available at www.turblog.eu).
To accomplish this objective, the case study business models had to be described according to a
common framework – business model canvas from Osterwalder. This methodological framework is
based on 9 building blocks (see chapter 2.2.3), related to a set of parameters that include:
the products and/or services to be provided,
the means by which such products/services will be provided,
the mechanisms by which opportunities could be exploited,
the different actors / agents, roles and relationships,
the financial flows, investments and incentives.
After the description of the business model of each case study, a comparison of the business model
characteristics has been performed in order to compare the different business models from the case
studies, finding similarities and differences among them (see chapter 2.4).
The next chapters present the methodological approach that has been used, adopted definition of the
business model, the rationale of why applying business models to urban logistics, the theoretical
framework for describing the business model of a case study and characteristics that could be
evaluated to compare business models.

TURBLOG D2: Business Concepts and Models for Urban Logistics 17
2.2 DEFINITION OF BUSINESS MODELS
2.2.1 WHAT IS A BUSINESS MODEL?
Based on the literature review of business models, there is no universal definition, neither consensus
on the definition and components of a “business model”.
Diversity in the available definitions poses substantive challenges for delimiting the nature and
components of a model and determining what constitutes a good model. It also leads to confusion in
terminology, as business model, strategy, business concept, revenue model, and economic model are
often used interchangeably. Moreover, the business model has been referred to as architecture,
design, pattern, plan, method, assumption, and statement. (Morris, M.; Schindehutte, M., Allen, J.
2003)
As no consensus exists for the definition and components of a “business model”, in TURBLOG the
definition from Osterwalder & Yves Pigneur (2010) was adopted where “a business model describes the
rationale of how an organisation creates, delivers, and captures value.”
2.2.2 WHY APPLY BUSINESS MODEL DEFINITION AND COMPONENTS TO URBAN
LOGISTICS?
In general, in urban logistics, it is possible to identify 3 common goals of all agents in urban logistics:
Efficiency of urban freight transportation;
Reduce traffic congestion;
Mitigate environmental impacts.
Although urban mobility involves the movement of both people and goods, in most cities, those who
are responsible for urban transport policy and planning have historically paid more attention to the
movement of people (developing many explicit ways of facilitation) and less attention to the
movement of goods. In spite of this general observation many cities around the world have tackled
aspects of urban freight in an attempt to solve particular or local issues or have used urban freight
policy to contribute to broader transport or urban objectives. As Ogden (1992) states the explicit
consideration of urban goods movements has the potential to contribute in a useful and positive way
TURBLOG D2: Business Concepts and Models for Urban Logistics 18
to achieving both the goals of urban transport and some of the broader goals of urban policy and
planning.
If we consider that a business model describes the rationale of how an organisation creates, delivers,
and captures value, there is a huge similarity with the urban freight delivery process. In the urban
freight delivery process there is an organisation (private or public or both businesses) creating,
delivering and capturing value through a product or a service.
To a greater degree, the study of urban freight tasks is enormously complex and heterogeneous,
involving an interdisciplinary engagement as a consequence of the difficulty to identify the common
features between the requirements of different users and vehicle operators. Furthermore, urban
freight is strongly interrelated with many other aspects of the urban system: urban passenger system,
land use, regional development, socio-economic environment, employment, etc. Thus, it is necessary,
when considering urban freight planning, to devote some effort towards understanding its integration
within urban mobility planning. As pointed out by Macário and Caiado (2005), acting on urban logistics
domains implies intervening in different aspects of urban mobility management, particularly
institutional, regulatory, social, infrastructural and technological, therefore requiring the joint and
coordinated action of the different stakeholders in the urban logistics arena.
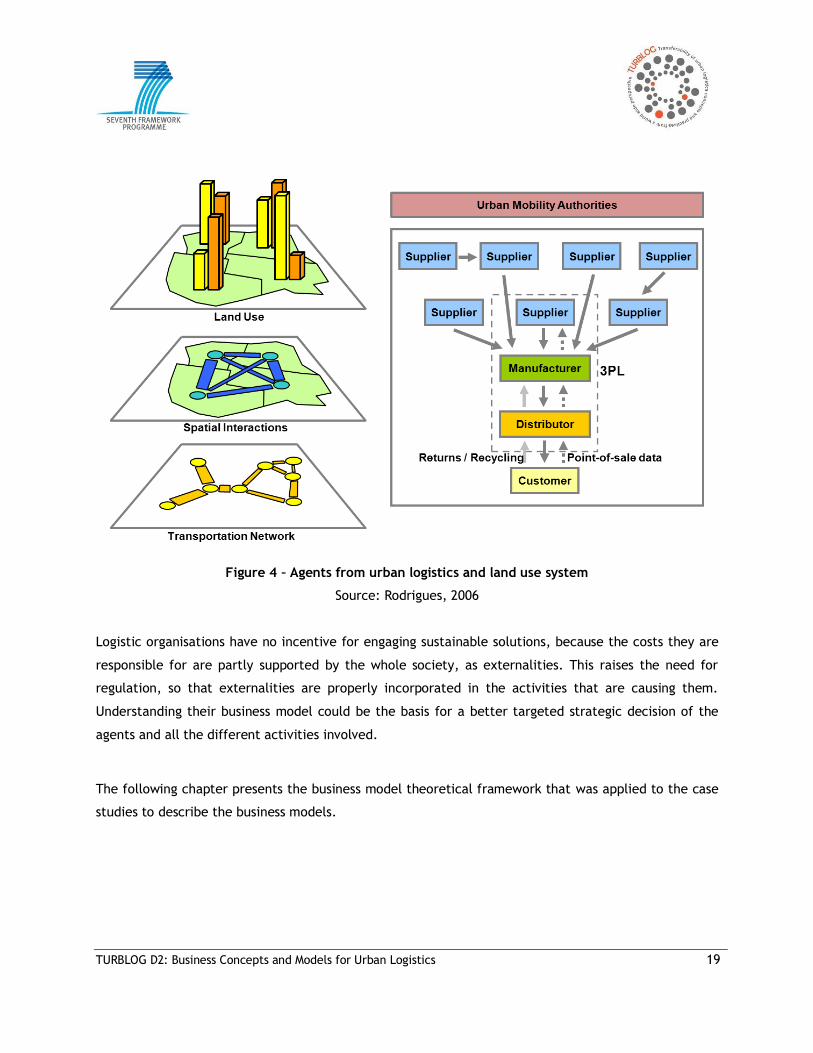
The scheme below illustrates the relationships between the agents related to urban freight, together
with the layers that correspond to the components of transportation and land use systems.
Understanding the relationships between the agents of the logistics activities and the major elements
that influence the urban logistics is very important to know the functioning of the urban system and
define the most feasible “logistic business”.
TURBLOG D2: Business Concepts and Models for Urban Logistics 19
Figure 4 – Agents from urban logistics and land use system
Source: Rodrigues, 2006
Logistic organisations have no incentive for engaging sustainable solutions, because the costs they are
responsible for are partly supported by the whole society, as externalities. This raises the need for
regulation, so that externalities are properly incorporated in the activities that are causing them.
Understanding their business model could be the basis for a better targeted strategic decision of the
agents and all the different activities involved.
The following chapter presents the business model theoretical framework that was applied to the case
studies to describe the business models.
TURBLOG D2: Business Concepts and Models for Urban Logistics 20
2.2.3 BUSINESS MODEL THEORETICAL FRAMEWORK
The theoretical background that represents the departure base for our analysis is the business model
framework developed by Osterwalder (2004). This framework has already been successfully applied and
validated in several organisations such as IBM, Delloite, Erickson and so on. The logic within this
methodology is to describe the business model through nine building blocks that show how an
organisation creates, delivers, and captures value.
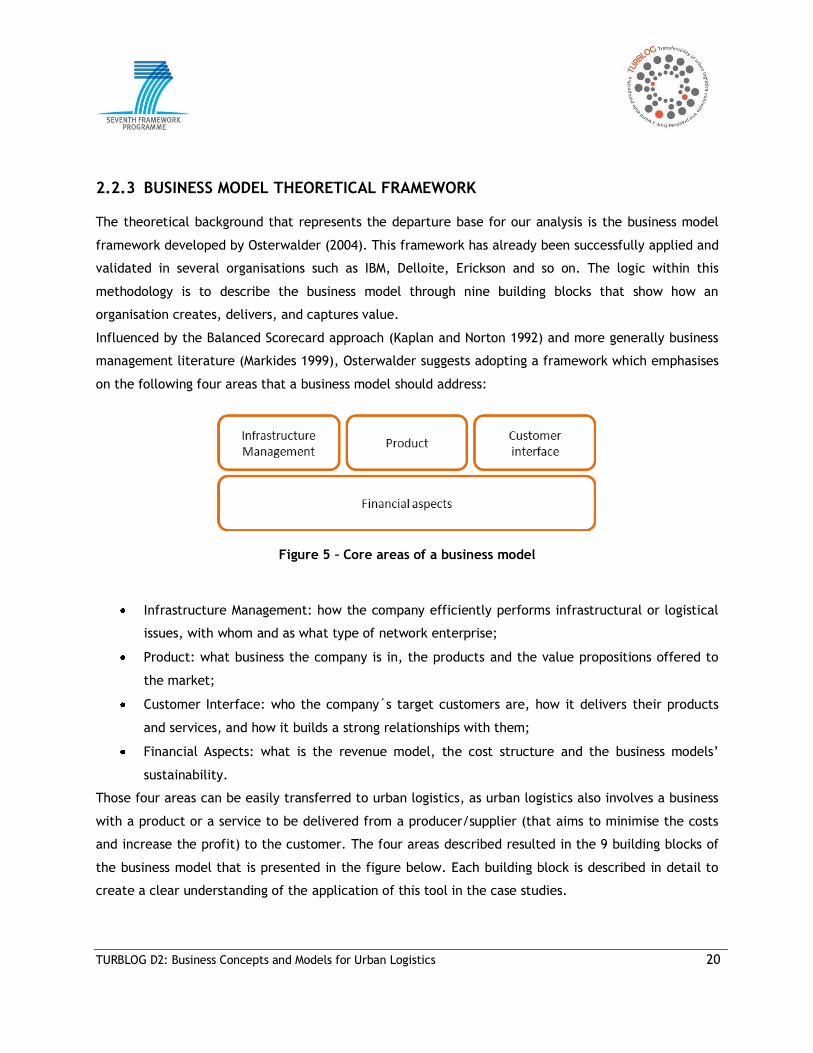
Influenced by the Balanced Scorecard approach (Kaplan and Norton 1992) and more generally business
management literature (Markides 1999), Osterwalder suggests adopting a framework which emphasises
on the following four areas that a business model should address:
Figure 5 – Core areas of a business model
Infrastructure Management: how the company efficiently performs infrastructural or logistical
issues, with whom and as what type of network enterprise;
Product: what business the company is in, the products and the value propositions offered to
the market;
Customer Interface: who the company´s target customers are, how it delivers their products
and services, and how it builds a strong relationships with them;
Financial Aspects: what is the revenue model, the cost structure and the business models’
sustainability.
Those four areas can be easily transferred to urban logistics, as urban logistics also involves a business
with a product or a service to be delivered from a producer/supplier (that aims to minimise the costs
and increase the profit) to the customer. The four areas described resulted in the 9 building blocks of
the business model that is presented in the figure below. Each building block is described in detail to
create a clear understanding of the application of this tool in the case studies.
TURBLOG D2: Business Concepts and Models for Urban Logistics 21
Figure 6 – “Business Model” adapted from Osterwalder
According to this framework, on the right side we have the customer and the communication channels
and relationships that are needed for a product/service to reach the customer.
On the left side, we have the organisation/partnerships and the activities and resources needed to
make a product/provide a service.
In the middle we have the most important piece, which is the customer’s needs/whishes and therefore,
what the producer/supplier have to offer – the product/service that are of value to the customer.
TURBLOG D2: Business Concepts and Models for Urban Logistics 22
For whom is the organisation creating value?
Starting by the right side, the customer segments are defined by the people or groups of people that
the organisation1 aims to reach with their product/service. To better satisfy the customers, an
organisation can group them according to similar needs and behaviours. In TURBLOG, the customer
segment types are: mass market, segmented and multi side market.
What value does the organisation deliver to the customer?
The value proposition corresponds to the product or service that the organisation has to create for the
customer. This is a rather important element because it has to solve a problem and/or satisfy a need.
In TURBLOG, the elements that we considered that can contribute to the value creation are:
performance/efficiency, customization, reliability, price, cost reduction and accessibility.
How does the organisation reach the customer?
The channels can be defined as the ways the organisation uses to get in touch with the customer. The
channels are a valuable communication tool to raise awareness about the product/service, to enable
the customer to buy the product/service, etc. In TURBLOG, three types of channels are considered, the
direct channels (e.g. sales force), the indirect channels (e.g. wholesaler) and the informal channels.
What type of relationship is established between the organisation and the customer?
Besides the channels, the other building block that makes the “bridge” between the value proposition
and the customer is designated by customer relationship and describes the type of relationships that
exists. In TURBLOG three types of relationships are considered: personal assistance, self-
service/automated services and collaborative.
1 For the description of the framework, whenever we would like to mention the producer/supplier of the urban
logistic chain, we will mention the “organisation”.
TURBLOG D2: Business Concepts and Models for Urban Logistics 23
What value are the customers paying?
The revenue streams describe how an organisation makes money. In TURBLOG, there are three ways of
generating revenues streams, namely: asset sale, service and advertising.
What does the organisation need to create value?
The key resources are the “inputs” that are needed in a business model to make it work. The key
resources can be physical, financial, human and “know how”.
What are the key activities that must be taken?
There are key activities/actions that should be performed so that the organisation operates
successfully. The difference between key resources and key activities is that the resources are often
needed to perform the activities. In urban logistics we consider three types of activities: production,
distribution and supporting activities.
Who are the “organisation” partners?
The “organisation” is often made up of a cooperative network of suppliers/producers/wholesalers/city
authorities and so on that create alliances according to each partner’s needs/wishes, to optimize their
business model, reduce the risk or acquire resources. The type of partnerships can be: strategic
alliances between non competitors, partnerships between competitors, joint ventures to develop new
businesses or buyer-supplier relationships.
What are the costs associated to the business model?
The cost structure represents all the costs incurred by the organisation to run the business model,
namely with the key partnerships, key resources and key activities. In TURBLOG, the costs can be
classified as fixed costs, variable costs, and sunk costs.
The definitions of the elements used to characterise each one of the building blocks used to describe
the business model can be consulted in Annex B.
TURBLOG D2: Business Concepts and Models for Urban Logistics 24
2.2.4 ROLE OF PUBLIC POLICIES
While the role of private companies (e.g., producer, supplier, transport operators, retailer, etc) is the
production and the transport of urban freight, the role of the public policy is regulation and
facilitation.
The role of the private sector consists in the private initiatives, such as cooperation amongst agents
and can be part of an urban freight transport policy (cooperation between public and private parties),
particularly when public measures are taken to support this. Usually, technology issues and design and
implementation of information systems can be public or private. The implementation of measures can
be supported by making correct behaviour more attractive (financial support and licensing) or by
discouraging other behaviour (pricing and regulation). The implementation of these public policies
makes use of those 3 tools a) pricing, b) licensing and regulation and c) financial support.
Being known in the field of (urban) freight transport it is necessary to contemplate not only the
existence of several types of stakeholders but also a considerable number of public policies. In
TURBLOG the types of public policies considered are:
Enforcement and promotion, e.g. law and regulations enforcement;
Traffic management (+ vehicle), e.g. vehicle size/type and time window restrictions for vehicle
emissions movement standards, subsidies for low emission vehicle, fuel taxes;
Access conditions, e.g. loading and unloading duration, time and access restrictions;
Land use management, e.g. zoning for logistic activities, land use pricing/subsidies;
Public infrastructure, e.g. new infrastructure for freight, truck routes.
TURBLOG D2: Business Concepts and Models for Urban Logistics 25
2.3 METHODOLOGICAL APPROACH OF BUSINESS MODELS
To fulfil the objective of identifying the business models better targeted for urban logistics, the
canvas described in chapter 2.2.3 was applied to the case studies of Deliverable D3 (available at
www.turblog.eu), identifying the 9 building blocks of each case study and taking into account the
different organisational and institutional settings.
When applying the BM canvas, the first finding is that this business model is profit oriented, however in
urban logistics the cities have other concerns that are translated into policies that imposes that the
business models take environmental and social impacts into account. The policies targeted to urban
logistics that a city can adopt are;
Environmental impacts
o Reduce pollution;
o Reduce the freight vehicles trips (- km);
o Reduce noise;
Social impacts
o Improve the quality of life;
o Reduce accidents;
o Reduce congestion;
o Improve working conditions.
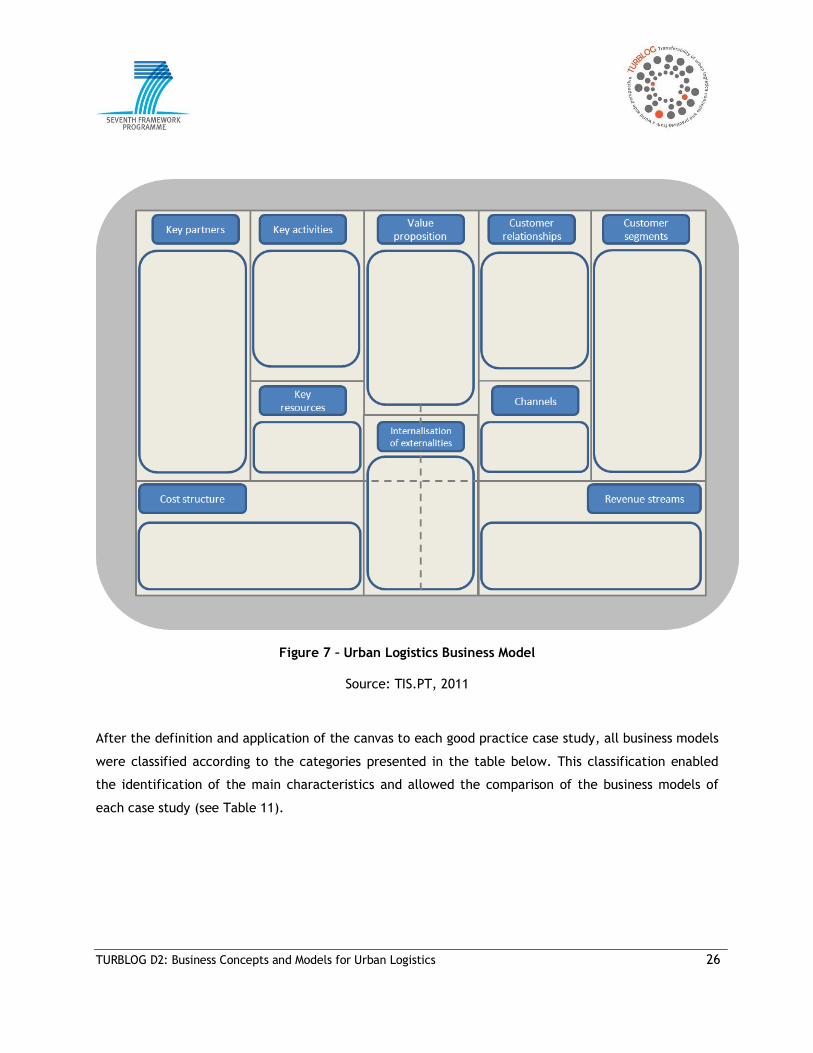
These impacts were considered “externalities” and so the BM was adapted to include a 10th building
block to cover these issues (see the business model adapted to urban logistics in the figure below).
TURBLOG D2: Business Concepts and Models for Urban Logistics 26
Figure 7 – Urban Logistics Business Model
Source: TIS.PT, 2011
After the definition and application of the canvas to each good practice case study, all business models
were classified according to the categories presented in the table below. This classification enabled
the identification of the main characteristics and allowed the comparison of the business models of
each case study (see Table 11).
TURBLOG D2: Business Concepts and Models for Urban Logistics 27
2.4 COMPARISON OF CASE STUDIES BUSINESS MODELS
2.4.1 GENERAL COMPARISON OF THE CASE STUDIES BUSINESS MODELS
According to the methodology described above, the analysis and comparison between the several
businesses models presented in the nine case studies from Deliverable D3 has been completed. This
analysis of the business model characteristics was done using the framework developed by
Osterwalder, as a starting point and as presented below.
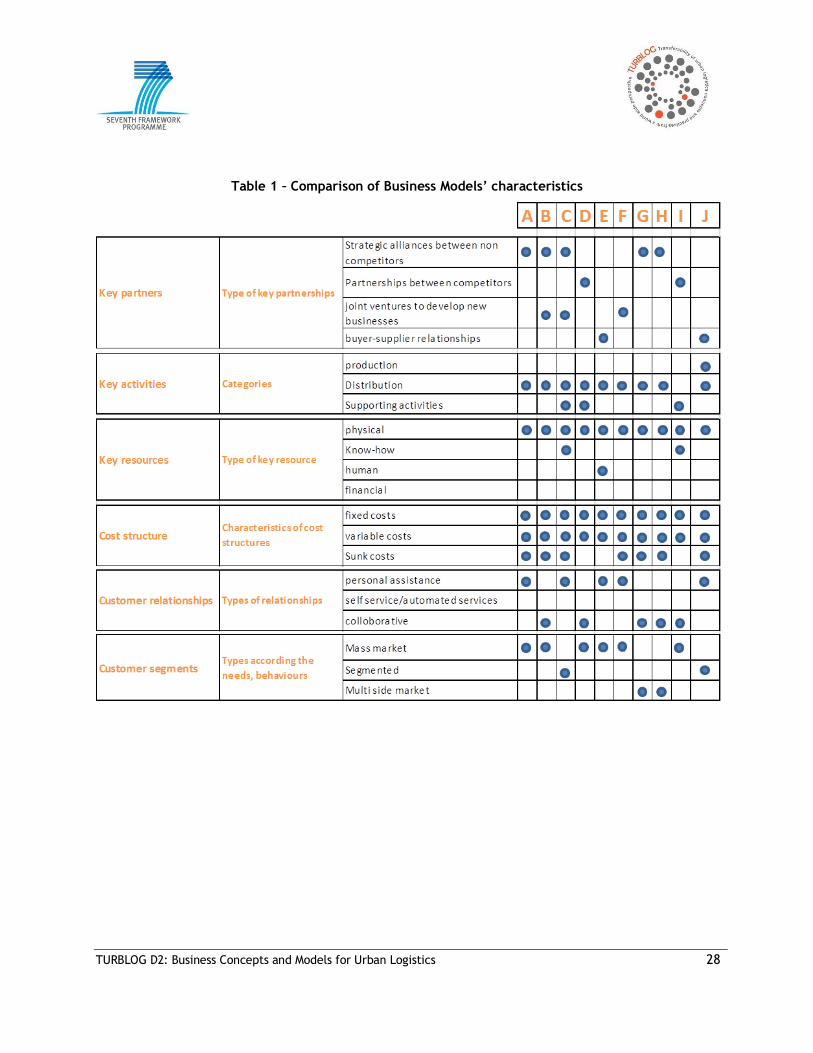
After the definition and application of the Urban Logistics business model canvas to each good practice
case study, all business models were classified according to the categories presented in the table
below. This table presents a summary of all business models characteristics with the major outputs of
each case study allowing the comparison of the results between all business models. The definitions of
each business model building block classification item is presented in Annex A.
TURBLOG D2: Business Concepts and Models for Urban Logistics 28
Table 1 – Comparison of Business Models’ characteristics
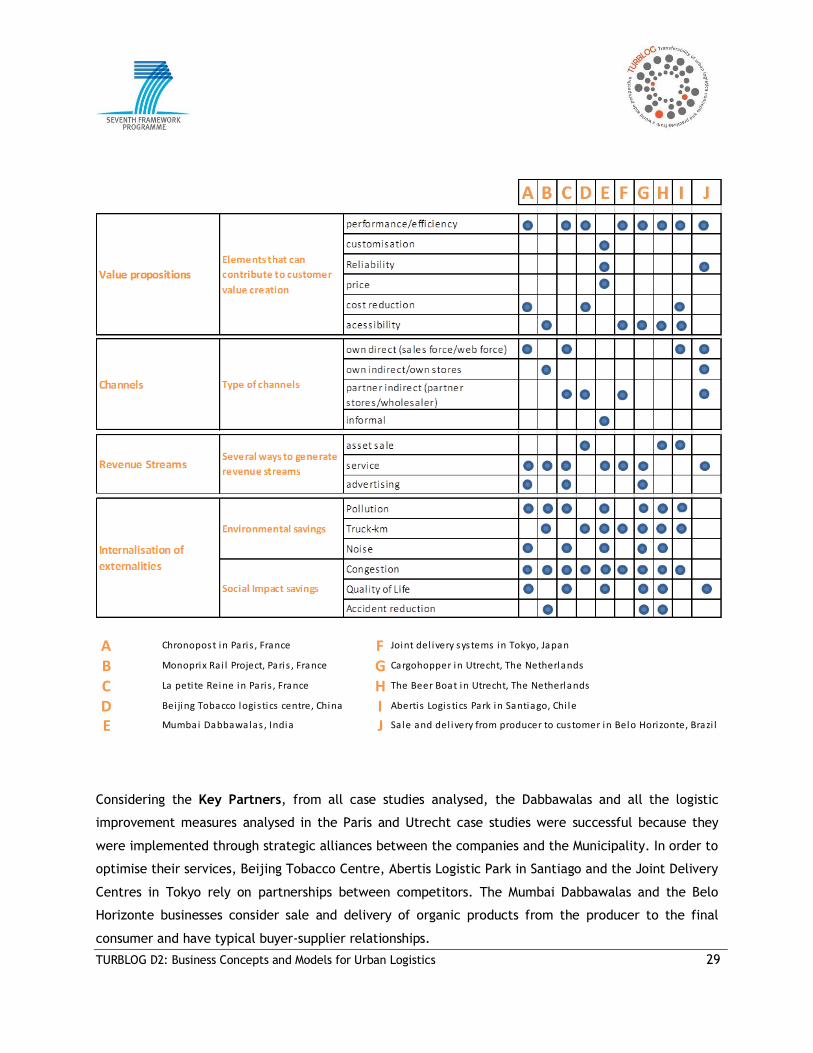
TURBLOG D2: Business Concepts and Models for Urban Logistics 29
A Chronopost in Paris , France F Joint del ivery systems in Tokyo, Japan
B Monoprix Rai l Project, Paris , France G Cargohopper in Utrecht, The Netherlands
C La peti te Reine in Paris , France H The Beer Boat in Utrecht, The Netherlands
D Bei jing Tobacco logistics centre, China I Abertis Logistics Park in Santiago, Chi le
E Mumbai Dabbawalas , India J Sale and del ivery from producer to customer in Belo Horizonte, Brazi l
Considering the Key Partners, from all case studies analysed, the Dabbawalas and all the logistic
improvement measures analysed in the Paris and Utrecht case studies were successful because they
were implemented through strategic alliances between the companies and the Municipality. In order to
optimise their services, Beijing Tobacco Centre, Abertis Logistic Park in Santiago and the Joint Delivery
Centres in Tokyo rely on partnerships between competitors. The Mumbai Dabbawalas and the Belo
Horizonte businesses consider sale and delivery of organic products from the producer to the final
consumer and have typical buyer-supplier relationships.
TURBLOG D2: Business Concepts and Models for Urban Logistics 30
Key Activities were divided into Production, Distribution and Supporting Activities. All logistic
practices analysed consider “distributions” as a key activity, with the exception of Abertis Logistic Park
which only involves warehousing and other supporting activities. Besides the distribution activity, the
Belo Horizonte logistic business also considers production. The Monoprix rail project in Paris and Beijing
Tobacco Centres also comprise more than one activity, adding to the distribution supporting activities,
mainly related to warehousing operations.
Key Resources are mostly physical resources but also human and know-how (Dabbawalas in Mumbai
have their own code system; Abertis Logistics Park in Santiago takes advantage of the most up-to-date
construction standards).
The Cost Structure is very similar in most of these businesses; they all have fixed costs (salaries,
renting and so on.) and variable costs (for example some operating costs such as combustibles).
Logistic measures considering last mile solutions (Paris and Utrecht and Tokyo case studies) also have
sunk costs related with the internalisation of the externalities, as will be further described.
In regards to the Customer Relationship, there are no logistic practices with self-service or automated
services. So, the business models studied have a customer relationship divided into personal assistance
(Chronopost and La Petite Reine in Paris, Mumbai Dabbawalas, Joint Delivery Centres in Tokyo, Belo
Horizonte sale and distribution of organic products) and collaborative (Monoprix in Paris, Beijing
Tobacco Centre, Cargohopper and Beer Boat in Utrecht, and Abertis Logistic Park in Santiago).
Concerning the Customer Segments, most of the logistic practices presented have their businesses
directed towards the mass market. La Petite Reine in Paris and Belo Horizonte analysed and divided
their customers into different segments. As the Cargohopper and the Beer Boat (Utrecht) serve two or
more interdependent Customer Segments, it was considered a “multi-faceted market”.
The most referenced Value Propositions of these businesses is performance/efficiency. However, in
urban logistics solutions cost reductions and accessibility increases are also major targets, especially
concerning logistic Parks such as the Tobacco Centre in Beijing and Abertis Logistic Park in Santiago.
Cost reduction was also a value proposition induced from the Chronopost Case Study business model
(Paris). For the Mumbai Dabbawala customers, the most added value of this service is customisation,
reliability and price of the product.
From the Case Studies presented in Deliverable 3, is not possible to conclude the Channels used in the
Utrecht business models. Monoprix rail project (Paris) and Belo Horizonte organic food sale and
TURBLOG D2: Business Concepts and Models for Urban Logistics 31
delivery have their own stores. The last practice also sells its products through web force and
wholesalers. The company La Petite Reine in Paris uses its own direct channels and indirect partners
(partner stores/wholesaler), while Chronopost Concord only refers to its own direct channels. Mumbai
Dabbawalas is the only service that relies solely on informal communication with the customer.
The main Revenue Streams are service fees, in some cases supplemented with advertising (Chronopost
Concord and La Petite Reine in Paris, Cargohopper in Utrecht). The exceptions are the warehousing
services with asset sales (Beijing Tobacco Centre and Abertis Logistic Park) and the Beer Boat in
Utrecht.
All of the business models studied present concerns related to the Internalisation of Externalities,
especially concerning congestion and decrease of truck-km.
2.4.2 MAIN FINDINGS FROM THE COMPARISON
In the Mumbai Dabbawalas case study the partnership between the suppliers and Dabbawalas is a co-
operative movement whose communication with the costumer has remained unchanged for decades,
and is exclusively informal, meaning, without any structured communication policy. The urban logistic
practice selected in the case study of Belo Horizonte presents a service that provides organic food
products through planned routes directly from the producer to the final consumer. However, from the
analysis of the different examples of successful urban logistic measures, it is possible to conclude that
most of the innovative business concepts presented rely on partnerships other than the typical buyer-
supplier relationship, with the expectation to improve performance (efficiency) and accessibility of
their services as core value propositions.
Moreover, some business concepts were only effectively implemented because they were sustained by
public administration policies, which provided availability of warehouse spaces or accessibilities and, in
some cases, financial incentives, resulting in partnerships with the municipality or other government
administrations. It is the case of the new Monoprix logistics organisation including a rail segment within
the transport chain, whose feasibility study was conducted on the initiative of the Direction Régionale
de l'Equipement and the Chronopost and La Petite Reine companies, which developed with the
Municipality of Paris the “Urban Logistic Space” concept. In order to meet the municipality
environmental requirements and restrictions, and also looking forward towards improving the service
performance, some companies developed joint ventures to develop these new services. This is also the
TURBLOG D2: Business Concepts and Models for Urban Logistics 32
case of the La Petite Reine company, which specifically developed the tricycle needed for its business
with a local manufacturer, and the Beer Boat that is operating in the City of Utrecht. The need to
optimise resources and to also obtain other supporting services and infrastructures, leads to
partnerships among competitors, such as in the case study of Japan, where the key partners are
exclusively private. In these cases, the relationship with the costumer (business-business) is called
collaborative, meaning, they share infrastructures and services expecting to exchange knowledge and
problem solving, which are common to other logistic companies.
In these business model comparisons three key activities in urban logistics were considered: Production
(which basically consists in the design and processing of goods subject to a certain service),
Distribution and Supporting Activities such as warehouse renting. With the exception of the Abertis
Logistic Park located in Santiago (Chile), all the businesses considered are mainly focused in the
distribution section of the logistics chain.
Key resources are therefore physical resources but also human and know-how (Dabbawalas in Mumbai
have their own code system, Abertis Logistics Park in Santiago takes advantage of the most up-to-date
construction standards). Some business models combine more than one activity such as the Beijing case
study regarding the Tobacco Logistics Centre, which performs a uniform storage, centralised sorting
and graded distribution of tobacco for the whole city.
This distribution service can be an undifferentiated service, serving a large group of customers with
broadly similar needs and problems (no costumer segments – mass market), by providing differences in
the service considering groups of costumers with similar needs (for example La petite Reine has
containers designed to carry refrigerated goods), or by serving two or more interdependent Customer
Segments, and in this case the customer segment is defined as a multi-faceted market (for example the
Beer Boat in Utrecht serves different Companies according to the day of the week).
Considering the cost structure of the businesses studied, besides fixed and variable costs, in addition,
costs related to the internalisation of externalities, such as environmental and social costs are key
issues. This especially in “last mile” services, due to the strict municipality restrictions concerning
environmental regulations in cities, such as Utrecht and Paris within the city centre. These investments
are sunk costs. The revenues are mainly obtained through service fees, but some cases have advertising
as a second revenue, namely the Cargohopper (Utrecht case study) and the companies Chronopost and
La Petite Reine (Paris case study).
TURBLOG D2: Business Concepts and Models for Urban Logistics 33
As was already explained, several of the logistics improvement measures had to make investments in
non-pollutant vehicles and noise reduction equipment that represent an increase of their transport
costs but don’t increase their profit, due to environmental regulations and/or circulation restrictions of
the city policies. Therefore, another block was added to the business model named “Internalisation of
externalities”. These externalities represent not only a cost, but also a value proposition for these
businesses once they win a competitive advantage for “being environmentally friendly”: The
Cargohopper is a delivery solution that is allowed to enter into the environmental zone at any time in
the City of Utrecht and the Chronopost Concorde and La Petite Reine have the possibility to rent Urban
Logistic Spaces at low prices because they use green vehicles. These environmental investments are
also used as publicity and as a communication channel with customers and represent revenues to
society in general, once they contribute to the overall environment.
TURBLOG D2: Business Concepts and Models for Urban Logistics 34
3 DEFINITION AND ESTABLISHMENT OF LOGISTIC PROFILES
3.1 OBJECTIVES
The objective of this chapter to undertake an assessment of the case studie’s best approaches and
more adequate participation formats, in order to define and establish the logistic profiles and the best
solutions for each type.
The logistic profile concept is based on the hypothesis that it is possible to identify, for some well-
defined areas inside a city, reasonably homogeneous groups of logistic needs, based on three key
points: the urban characteristics of the area, the requirements of the logistic agents (i.e., the
requirements concerning the type of delivery), and the characteristics of the products being
transacted. The logistic profile of a given urban area is thus defined by the interaction of these three
key aspects. The definition of the logistic profile can therefore be summarised as a homogeneous group
with similar logistical needs (Macário et al., (2007)).
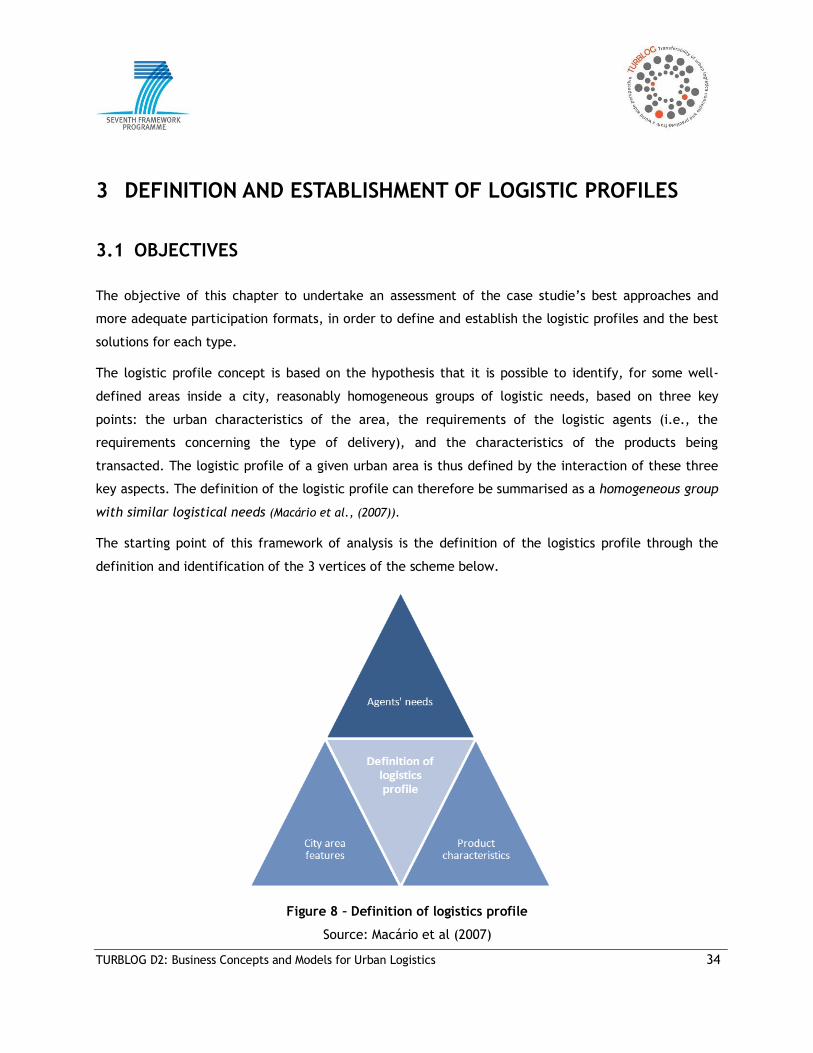
The starting point of this framework of analysis is the definition of the logistics profile through the
definition and identification of the 3 vertices of the scheme below.
Figure 8 – Definition of logistics profile
Source: Macário et al (2007)

TURBLOG D2: Business Concepts and Models for Urban Logistics 35
3.2 METHODOLOGICAL APPROACH OF LOGISTIC PROFILES
For the definition of logistic profiles it is necessary to identify the characteristics that will define the
city area features, the products’ characteristics and the deliveries profile in the first phase. For the
characterisation of the city area it is necessary to identify the features that can represent any possible
constraints, but also give a picture of the actual state of the art in terms of logistic conditions, such as
commercial density and homogeneity, logistic accessibility, or if there are any restrictions applied. The
product characteristics are the ones that can determine the type of vehicle to be used or if there are
any restrictions, such as easiness of handling and special conditions; and finally the agents’ needs or
delivery profiles (for example ,frequency and urgency of deliveries).
Second, for the classification of the logistic profiles, it was necessary to set a scale, in order to
quantify (or qualify) each of the features identified. Based on this classification, conditions are met to
identify and characterise the logistic profiles. These logistics profiles intend to be as comprehensive as
possible, so, there are some features considered crucial for the definition of the type of profile, while
others can be left undefined. These undefined features were called “grey areas”. It is however very
important to compare all profiles, to ensure that they are independent from one another.
The purpose of the definition of logistics profiles is to identify what the features are that best suit the
conditions to the definition of the logistics profile. For each of these features a scale was set, as
described in the following sub-chapters.
After the profiles are clearly identified and characterised, the methodology has been applied to the
case studies addressed in D3 (available at www.turblog.eu ). The goal is to define the most appropriate
logistic profile, for each case study, in order to identify what measures optimise the logistics system,
given the characteristics of the area, product and agent or deliveries’ profile. By doing this exercise, it
is possible to take the examples of successful measures in urban logistics, and associate them to the
profiles’ main features, so that in the end it is possible to identify the dynamic mechanisms for
business concepts, implementation and transferability (see chapter 5).
TURBLOG D2: Business Concepts and Models for Urban Logistics 36
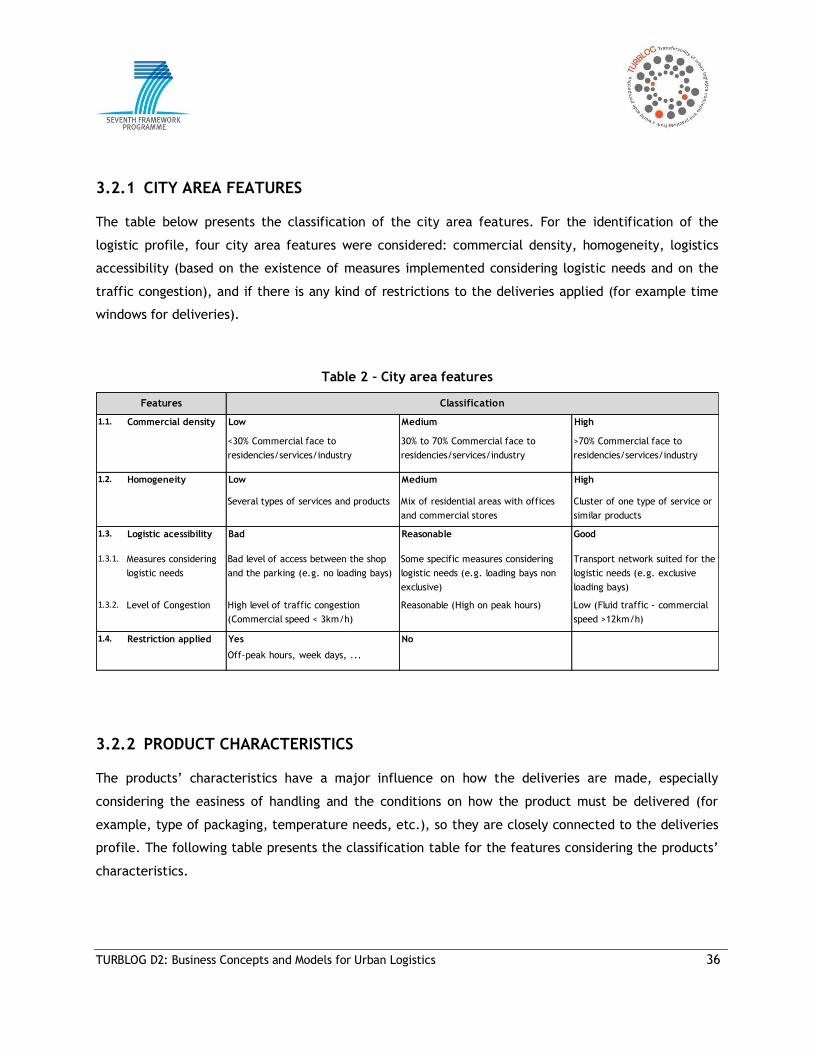
3.2.1 CITY AREA FEATURES
The table below presents the classification of the city area features. For the identification of the
logistic profile, four city area features were considered: commercial density, homogeneity, logistics
accessibility (based on the existence of measures implemented considering logistic needs and on the
traffic congestion), and if there is any kind of restrictions to the deliveries applied (for example time
windows for deliveries).
Table 2 – City area features
1.1. Commercial density Low Medium High
<30% Commercial face to
residencies/services/industry
30% to 70% Commercial face to
residencies/services/industry
>70% Commercial face to
residencies/services/industry
1.2. Homogeneity Low Medium High
Several types of services and products Mix of residential areas with offices
and commercial stores
Cluster of one type of service or
similar products
1.3. Logistic acessibility Bad Reasonable Good
1.3.1. Measures considering
logistic needs
Bad level of access between the shop
and the parking (e.g. no loading bays)
Some specific measures considering
logistic needs (e.g. loading bays non
exclusive)
Transport network suited for the
logistic needs (e.g. exclusive
loading bays)
1.3.2. Level of Congestion High level of traffic congestion
(Commercial speed < 3km/h)
Reasonable (High on peak hours) Low (Fluid traffic - commercial
speed >12km/h)
1.4. Restriction applied Yes No
Off-peak hours, week days, ...
Features Classification
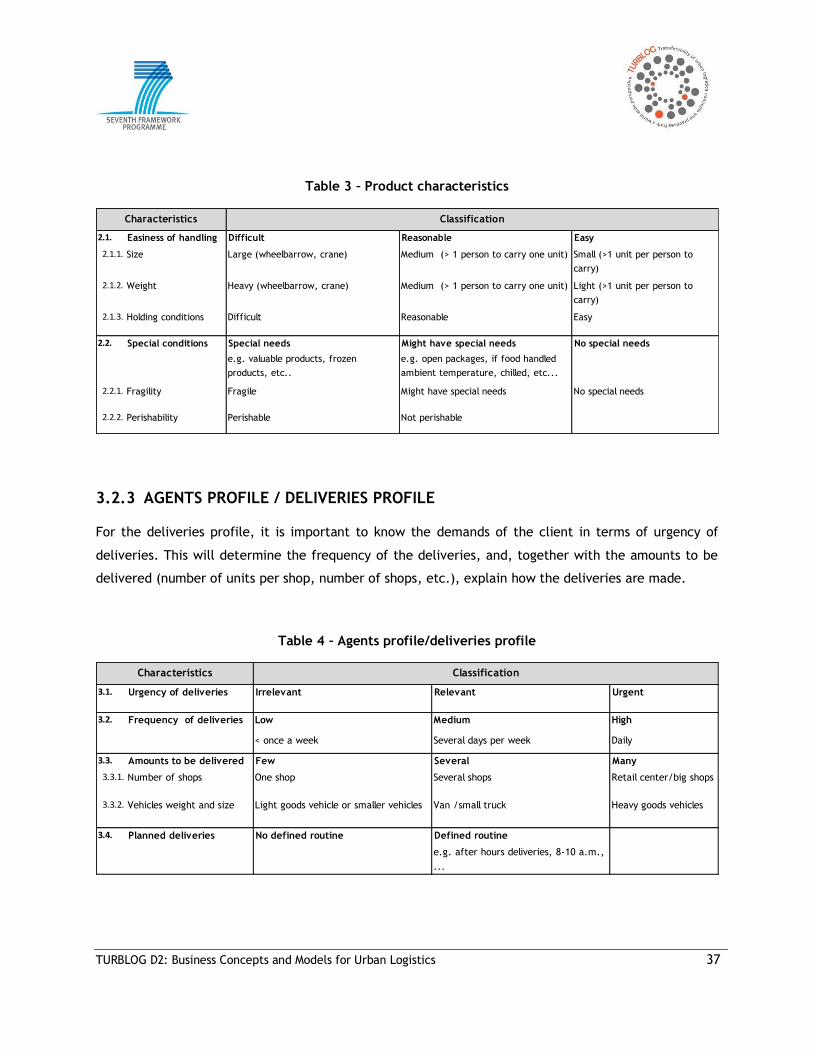
3.2.2 PRODUCT CHARACTERISTICS
The products’ characteristics have a major influence on how the deliveries are made, especially
considering the easiness of handling and the conditions on how the product must be delivered (for
example, type of packaging, temperature needs, etc.), so they are closely connected to the deliveries
profile. The following table presents the classification table for the features considering the products’
characteristics.
TURBLOG D2: Business Concepts and Models for Urban Logistics 37
Table 3 – Product characteristics
2.1. Easiness of handling Difficult Reasonable Easy
2.1.1. Size Large (wheelbarrow, crane) Medium (> 1 person to carry one unit) Small (>1 unit per person to
carry)
2.1.2. Weight Heavy (wheelbarrow, crane) Medium (> 1 person to carry one unit) Light (>1 unit per person to
carry)
2.1.3. Holding conditions Difficult Reasonable Easy
2.2. Special conditions Special needs Might have special needs No special needs
e.g. valuable products, frozen
products, etc..
e.g. open packages, if food handled
ambient temperature, chilled, etc...
2.2.1. Fragility Fragile Might have special needs No special needs
2.2.2. Perishability Perishable Not perishable
Characteristics Classification
3.2.3 AGENTS PROFILE / DELIVERIES PROFILE
For the deliveries profile, it is important to know the demands of the client in terms of urgency of
deliveries. This will determine the frequency of the deliveries, and, together with the amounts to be
delivered (number of units per shop, number of shops, etc.), explain how the deliveries are made.
Table 4 – Agents profile/deliveries profile
3.1. Urgency of deliveries Irrelevant Relevant Urgent
3.2. Frequency of deliveries Low Medium High
< once a week Several days per week Daily
3.3. Amounts to be delivered Few Several Many
3.3.1. Number of shops One shop Several shops Retail center/big shops
3.3.2. Vehicles weight and size Light goods vehicle or smaller vehicles Van /small truck Heavy goods vehicles
3.4. Planned deliveries No defined routine Defined routine
e.g. after hours deliveries, 8-10 a.m.,
...
Characteristics Classification
TURBLOG D2: Business Concepts and Models for Urban Logistics 38
3.3 DEFINITION AND CHARACTERISATION OF THE LOGISTIC PROFILES
The objective of the identification and characterisation of the logistic profiles is to clearly identify
similarities between characteristics that are common to various locations, product types and deliveries
profile in order to be able to identify examples of measures that can be transferred and replicated
elsewhere. Taking into account the classification of each of the factors considered in the previous sub-
chapters, five different profiles were established.
For the characterisation of the logistic profiles, there were some features that were considered
determinant to its classification. Most of these features are related with the city area characteristics
such as commercial density and homogeneity, logistic accessibility and restrictions applied to the
circulation of goods vehicles. However, there is one profile that differs from the others, due to the
particularities of perishable products such as grocery articles (greens, fruits and other foodstuffs).
These products are commonly related to grocery stores, markets, cafeterias, restaurants and hotels.
Thus, there were established the following logistics profiles:
Profile A: cluster of shops specialised in one specific type of service/product;
Profile B: Hotels, restaurants, small grocery stores, small neighbourhood markets;
Profile C: Business Centre;
Profile D: Large commercial stores;
Profile E: Residential areas with local trade;
The definition of these profiles intends only to represent one example of one area/type of product that
fulfils the requirements to fit in the profile, in other words, the definitions’ objective is intentionally
as broad as possible, so there are some characteristics that were considered as key features to define
the profile, while others can be left open (considered “grey areas”).
TURBLOG D2: Business Concepts and Models for Urban Logistics 39
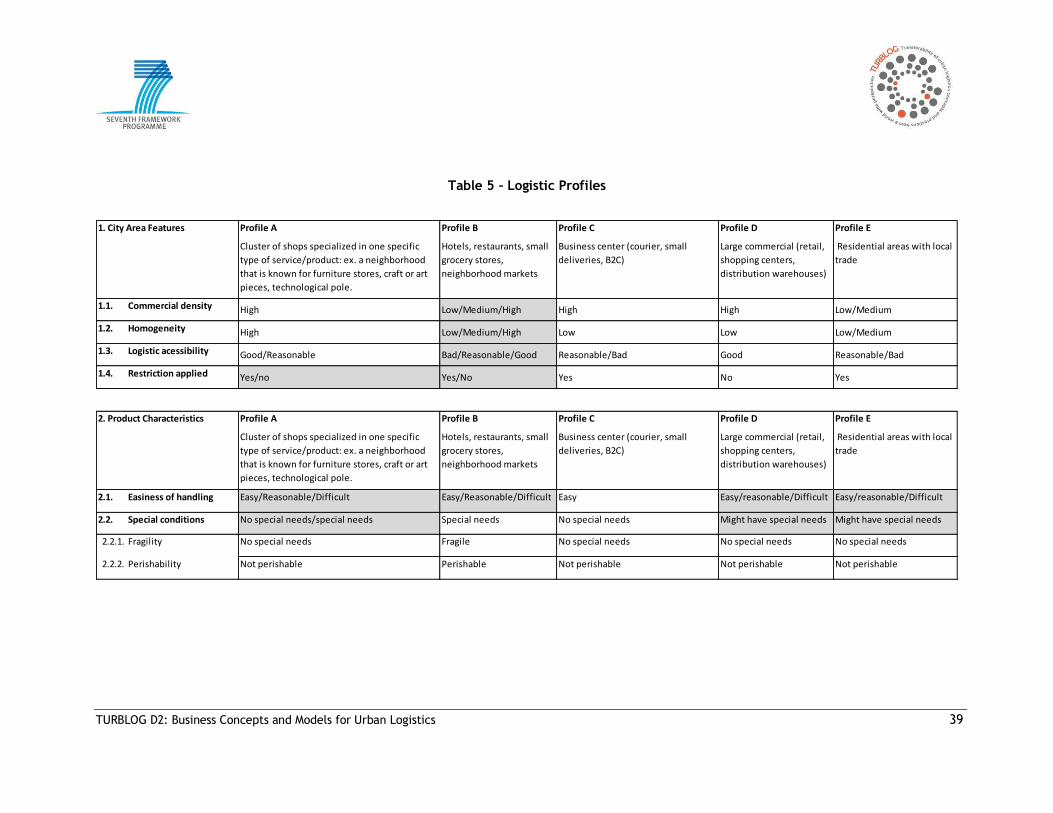
Table 5 – Logistic Profiles
Profile A Profile B Profile C Profile D Profile E
Cluster of shops specialized in one specific
type of service/product: ex. a neighborhood
that is known for furniture stores, craft or art
pieces, technological pole.
Hotels, restaurants, small
grocery stores,
neighborhood markets
Business center (courier, small
deliveries, B2C)
Large commercial (retail,
shopping centers,
distribution warehouses)
Residential areas with local
trade
1.1. Commercial density High Low/Medium/High High High Low/Medium
1.2. Homogeneity High Low/Medium/High Low Low Low/Medium
1.3. Logistic acessibility Good/Reasonable Bad/Reasonable/Good Reasonable/Bad Good Reasonable/Bad
1.4. Restriction applied Yes/no Yes/No Yes No Yes
Profile A Profile B Profile C Profile D Profile E
Cluster of shops specialized in one specific
type of service/product: ex. a neighborhood
that is known for furniture stores, craft or art
pieces, technological pole.
Hotels, restaurants, small
grocery stores,
neighborhood markets
Business center (courier, small
deliveries, B2C)
Large commercial (retail,
shopping centers,
distribution warehouses)
Residential areas with local
trade
2.1. Easiness of handling Easy/Reasonable/Difficult Easy/Reasonable/Difficult Easy Easy/reasonable/Difficult Easy/reasonable/Difficult
2.2. Special conditions No special needs/special needs Special needs No special needs Might have special needs Might have special needs
2.2.1. Fragility No special needs Fragile No special needs No special needs No special needs
2.2.2. Perishability Not perishable Perishable Not perishable Not perishable Not perishable
1. City Area Features
2. Product Characteristics
TURBLOG D2: Business Concepts and Models for Urban Logistics 40
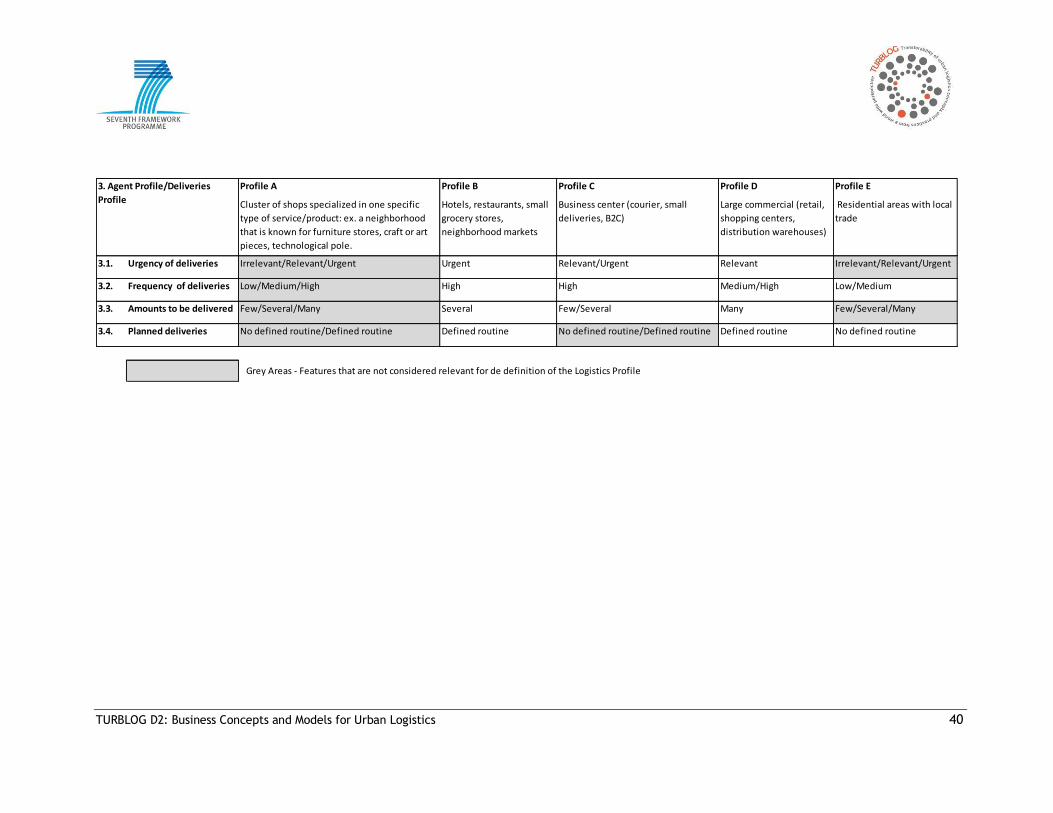
Profile A Profile B Profile C Profile D Profile E
Cluster of shops specialized in one specific
type of service/product: ex. a neighborhood
that is known for furniture stores, craft or art
pieces, technological pole.
Hotels, restaurants, small
grocery stores,
neighborhood markets
Business center (courier, small
deliveries, B2C)
Large commercial (retail,
shopping centers,
distribution warehouses)
Residential areas with local
trade
3.1. Urgency of deliveries Irrelevant/Relevant/Urgent Urgent Relevant/Urgent Relevant Irrelevant/Relevant/Urgent
3.2. Frequency of deliveries Low/Medium/High High High Medium/High Low/Medium
3.3. Amounts to be delivered Few/Several/Many Several Few/Several Many Few/Several/Many
3.4. Planned deliveries No defined routine/Defined routine Defined routine No defined routine/Defined routine Defined routine No defined routine
Grey Areas - Features that are not considered relevant for de definition of the Logistics Profile
3. Agent Profile/Deliveries
Profile
TURBLOG D2: Business Concepts and Models for Urban Logistics 41
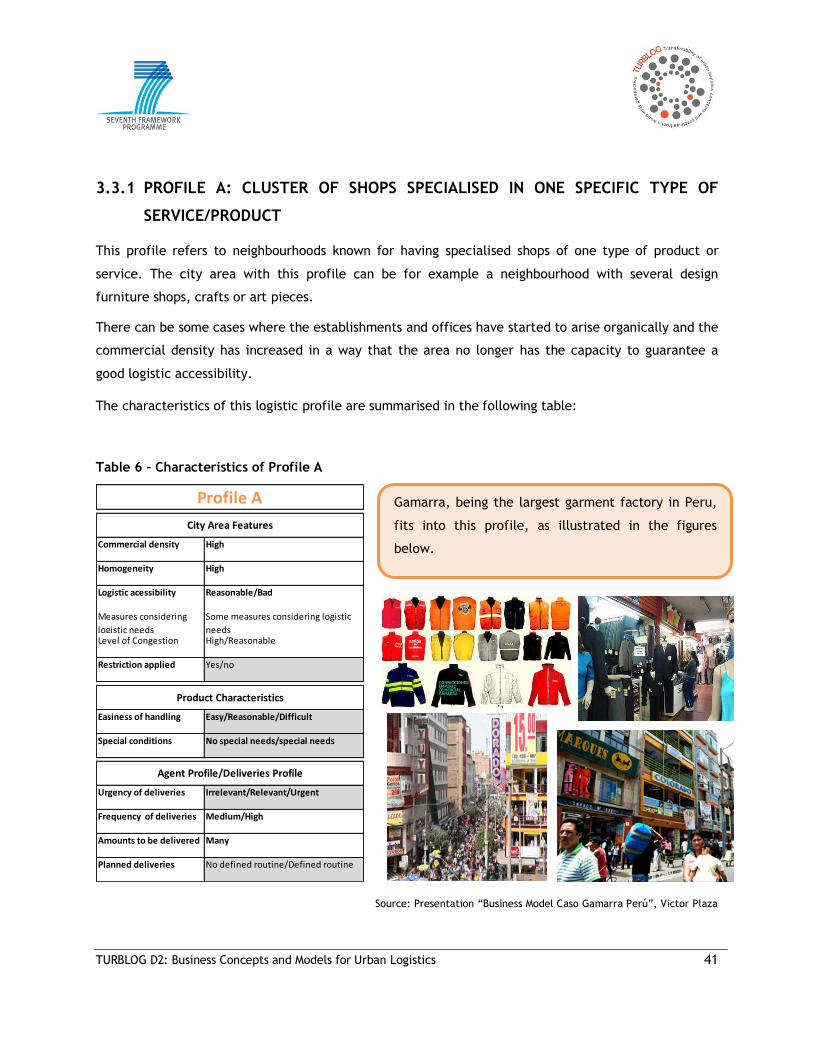
3.3.1 PROFILE A: CLUSTER OF SHOPS SPECIALISED IN ONE SPECIFIC TYPE OF
SERVICE/PRODUCT
This profile refers to neighbourhoods known for having specialised shops of one type of product or
service. The city area with this profile can be for example a neighbourhood with several design
furniture shops, crafts or art pieces.
There can be some cases where the establishments and offices have started to arise organically and the
commercial density has increased in a way that the area no longer has the capacity to guarantee a
good logistic accessibility.
The characteristics of this logistic profile are summarised in the following table:
Table 6 – Characteristics of Profile A
Source: Presentation “Business Model Caso Gamarra Perú”, Victor Plaza
Commercial density High
Homogeneity High
Logistic acessibility Reasonable/Bad
Measures considering
logistic needs
Some measures considering logistic
needsLevel of Congestion High/Reasonable
Restriction applied Yes/no
Easiness of handling Easy/Reasonable/Difficult
Special conditions No special needs/special needs
Urgency of deliveries Irrelevant/Relevant/Urgent
Frequency of deliveries Medium/High
Amounts to be delivered Many
Planned deliveries No defined routine/Defined routine
Profile A
Product Characteristics
Agent Profile/Deliveries Profile
City Area Features
Gamarra, being the largest garment factory in Peru,
fits into this profile, as illustrated in the figures
below.
TURBLOG D2: Business Concepts and Models for Urban Logistics 42
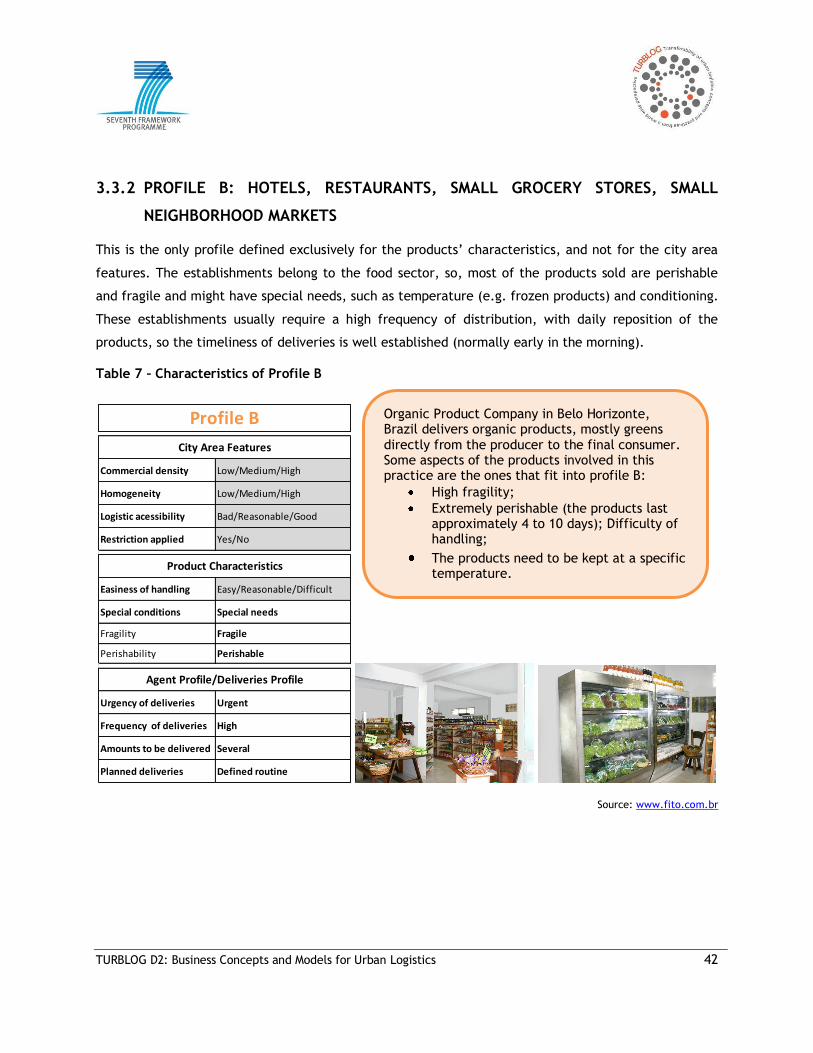
3.3.2 PROFILE B: HOTELS, RESTAURANTS, SMALL GROCERY STORES, SMALL
NEIGHBORHOOD MARKETS
This is the only profile defined exclusively for the products’ characteristics, and not for the city area
features. The establishments belong to the food sector, so, most of the products sold are perishable
and fragile and might have special needs, such as temperature (e.g. frozen products) and conditioning.
These establishments usually require a high frequency of distribution, with daily reposition of the
products, so the timeliness of deliveries is well established (normally early in the morning).
Table 7 – Characteristics of Profile B
Commercial density Low/Medium/High
Homogeneity Low/Medium/High
Logistic acessibility Bad/Reasonable/Good
Restriction applied Yes/No
Easiness of handling Easy/Reasonable/Difficult
Special conditions Special needs
Fragility Fragile
Perishability Perishable
Urgency of deliveries Urgent
Frequency of deliveries High
Amounts to be delivered Several
Planned deliveries Defined routine
Profile B
City Area Features
Product Characteristics
Agent Profile/Deliveries Profile
Source: www.fito.com.br
Organic Product Company in Belo Horizonte, Brazil delivers organic products, mostly greens directly from the producer to the final consumer. Some aspects of the products involved in this practice are the ones that fit into profile B:
High fragility;
Extremely perishable (the products last approximately 4 to 10 days); Difficulty of handling;
The products need to be kept at a specific temperature.
TURBLOG D2: Business Concepts and Models for Urban Logistics 43
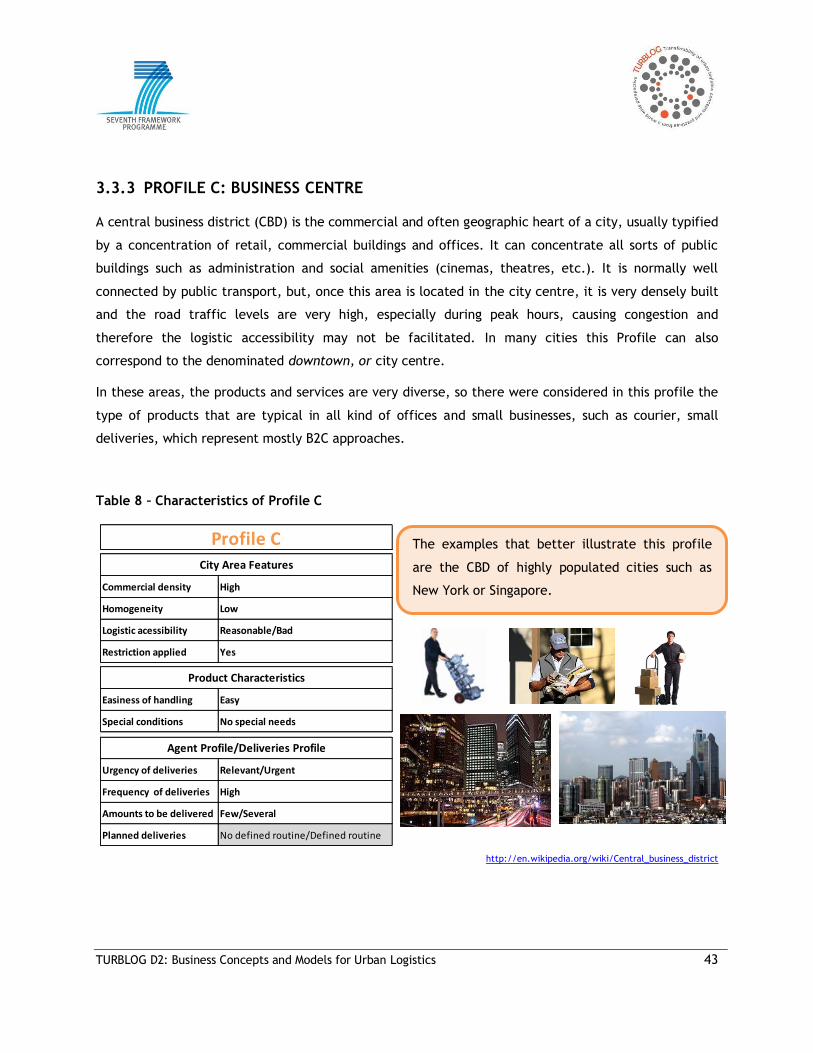
3.3.3 PROFILE C: BUSINESS CENTRE
A central business district (CBD) is the commercial and often geographic heart of a city, usually typified
by a concentration of retail, commercial buildings and offices. It can concentrate all sorts of public
buildings such as administration and social amenities (cinemas, theatres, etc.). It is normally well
connected by public transport, but, once this area is located in the city centre, it is very densely built
and the road traffic levels are very high, especially during peak hours, causing congestion and
therefore the logistic accessibility may not be facilitated. In many cities this Profile can also
correspond to the denominated downtown, or city centre.
In these areas, the products and services are very diverse, so there were considered in this profile the
type of products that are typical in all kind of offices and small businesses, such as courier, small
deliveries, which represent mostly B2C approaches.
Table 8 – Characteristics of Profile C
Commercial density High
Homogeneity Low
Logistic acessibility Reasonable/Bad
Restriction applied Yes
Easiness of handling Easy
Special conditions No special needs
Urgency of deliveries Relevant/Urgent
Frequency of deliveries High
Amounts to be delivered Few/Several
Planned deliveries No defined routine/Defined routine
Profile CCity Area Features
Product Characteristics
Agent Profile/Deliveries Profile
http://en.wikipedia.org/wiki/Central_business_district
The examples that better illustrate this profile
are the CBD of highly populated cities such as
New York or Singapore.
TURBLOG D2: Business Concepts and Models for Urban Logistics 44
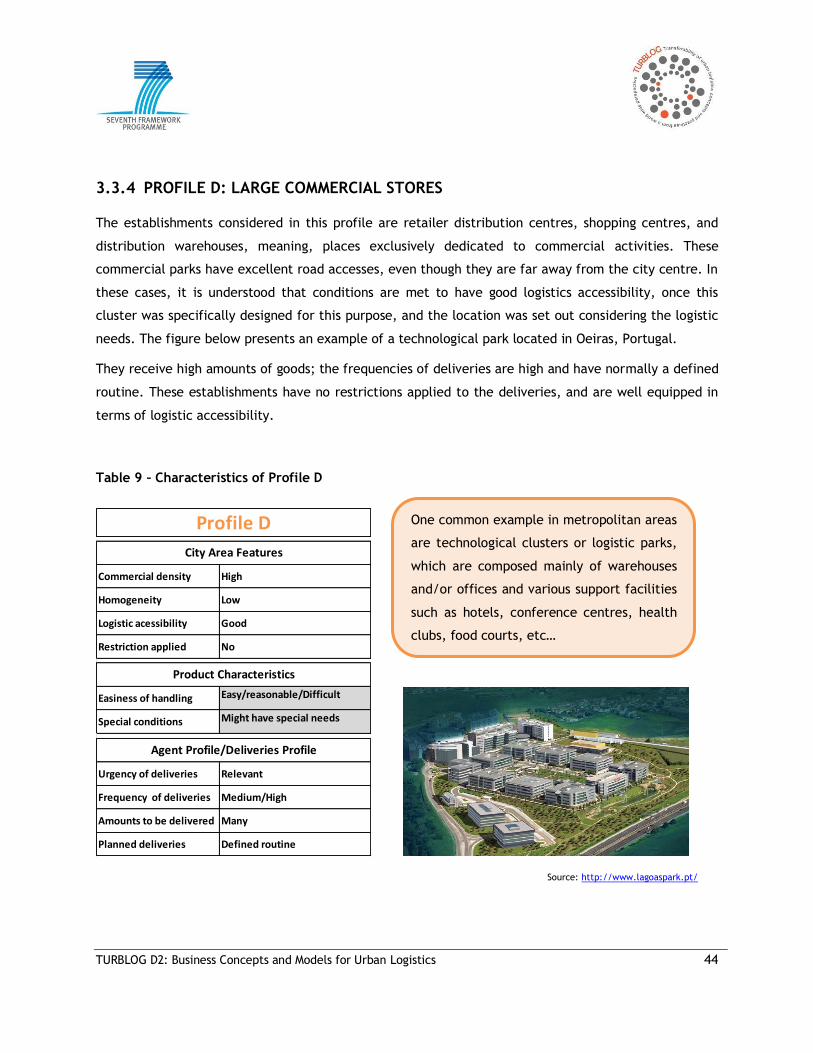
3.3.4 PROFILE D: LARGE COMMERCIAL STORES
The establishments considered in this profile are retailer distribution centres, shopping centres, and
distribution warehouses, meaning, places exclusively dedicated to commercial activities. These
commercial parks have excellent road accesses, even though they are far away from the city centre. In
these cases, it is understood that conditions are met to have good logistics accessibility, once this
cluster was specifically designed for this purpose, and the location was set out considering the logistic
needs. The figure below presents an example of a technological park located in Oeiras, Portugal.
They receive high amounts of goods; the frequencies of deliveries are high and have normally a defined
routine. These establishments have no restrictions applied to the deliveries, and are well equipped in
terms of logistic accessibility.
Table 9 – Characteristics of Profile D
Commercial density High
Homogeneity Low
Logistic acessibility Good
Restriction applied No
Easiness of handling Easy/reasonable/Difficult
Special conditions Might have special needs
Urgency of deliveries Relevant
Frequency of deliveries Medium/High
Amounts to be delivered Many
Planned deliveries Defined routine
Profile D
City Area Features
Product Characteristics
Agent Profile/Deliveries Profile
Source: http://www.lagoaspark.pt/
One common example in metropolitan areas
are technological clusters or logistic parks,
which are composed mainly of warehouses
and/or offices and various support facilities
such as hotels, conference centres, health
clubs, food courts, etc…
TURBLOG D2: Business Concepts and Models for Urban Logistics 45
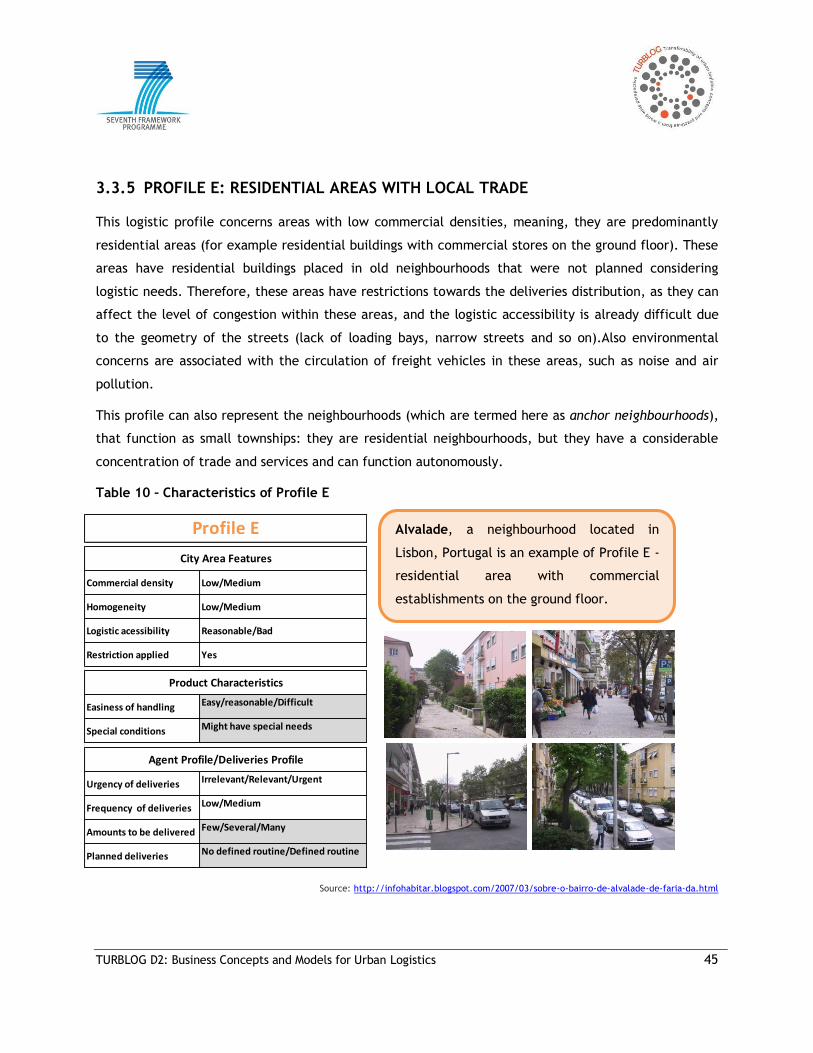
3.3.5 PROFILE E: RESIDENTIAL AREAS WITH LOCAL TRADE
This logistic profile concerns areas with low commercial densities, meaning, they are predominantly
residential areas (for example residential buildings with commercial stores on the ground floor). These
areas have residential buildings placed in old neighbourhoods that were not planned considering
logistic needs. Therefore, these areas have restrictions towards the deliveries distribution, as they can
affect the level of congestion within these areas, and the logistic accessibility is already difficult due
to the geometry of the streets (lack of loading bays, narrow streets and so on).Also environmental
concerns are associated with the circulation of freight vehicles in these areas, such as noise and air
pollution.
This profile can also represent the neighbourhoods (which are termed here as anchor neighbourhoods),
that function as small townships: they are residential neighbourhoods, but they have a considerable
concentration of trade and services and can function autonomously.
Table 10 – Characteristics of Profile E
Source: http://infohabitar.blogspot.com/2007/03/sobre-o-bairro-de-alvalade-de-faria-da.html
Commercial density Low/Medium
Homogeneity Low/Medium
Logistic acessibility Reasonable/Bad
Restriction applied Yes
Easiness of handling Easy/reasonable/Difficult
Special conditions Might have special needs
Urgency of deliveries Irrelevant/Relevant/Urgent
Frequency of deliveries Low/Medium
Amounts to be delivered Few/Several/Many
Planned deliveries No defined routine/Defined routine
Profile E
City Area Features
Product Characteristics
Agent Profile/Deliveries Profile
Alvalade, a neighbourhood located in
Lisbon, Portugal is an example of Profile E -
residential area with commercial
establishments on the ground floor.
TURBLOG D2: Business Concepts and Models for Urban Logistics 46
3.3.6 MAIN DIFFERENCES BETWEEN LOGISTIC PROFILES
The table below provides a cross-analysis between the logistic profiles in order to identify what the
main characteristics are that distinguish them, considering the defined characteristics for the city
area, products and type of deliveries. Thus, it is intended to further clarify the distinction of each
profile, and ensure that each type of logistics profile is independent and represents a completely
different reality from the rest. Therefore, this table compares all the profiles two by two in a
symmetric matrix, in order to identify the main differences between them. For example, the main
differences between Profile A and Profile D are city area features, such as commercial homogeneity
and logistics accessibility.
Most of the logistic profiles were defined according to the city area features, and so, these are the
main characteristics that are relevant to the identification of the logistic profile. The only exception is
Profile B, which is distinct due to the products’ characteristics, namely because it refers to perishable
(and therefore also fragile) products.
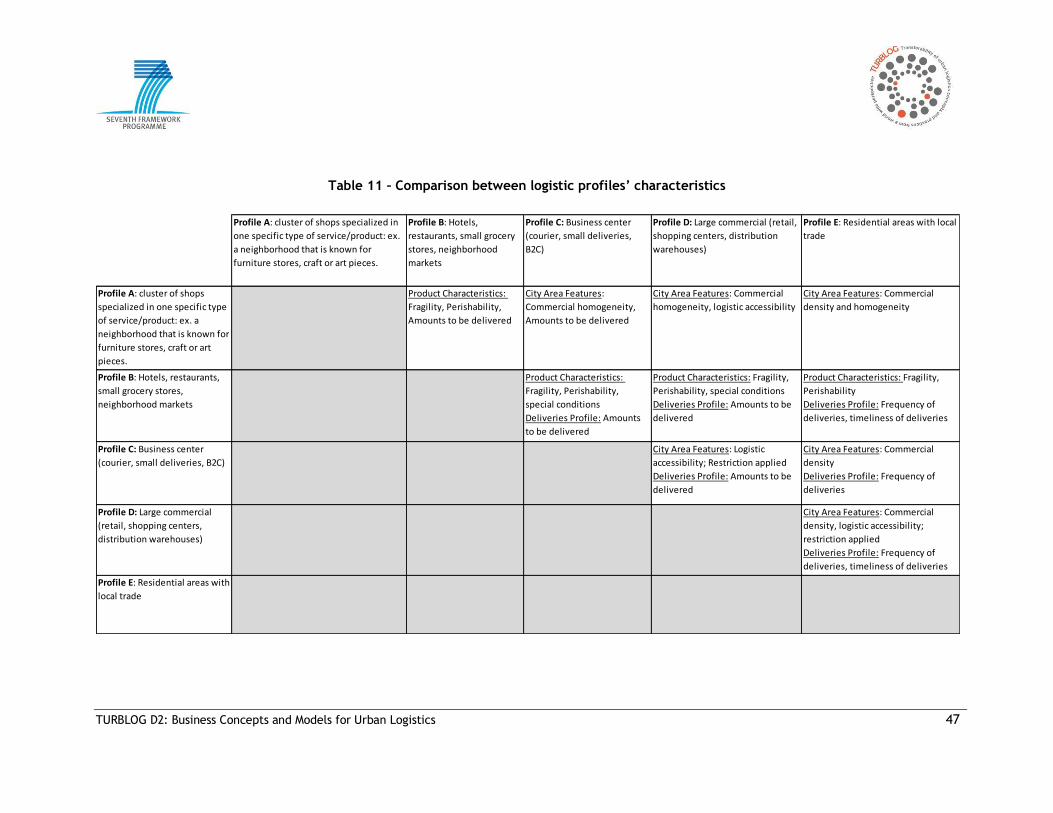
TURBLOG D2: Business Concepts and Models for Urban Logistics 47
Table 11 – Comparison between logistic profiles’ characteristics
Profile A: cluster of shops specialized in
one specific type of service/product: ex.
a neighborhood that is known for
furniture stores, craft or art pieces.
Profile B: Hotels,
restaurants, small grocery
stores, neighborhood
markets
Profile C: Business center
(courier, small deliveries,
B2C)
Profile D: Large commercial (retail,
shopping centers, distribution
warehouses)
Profile E: Residential areas with local
trade
Profile A: cluster of shops
specialized in one specific type
of service/product: ex. a
neighborhood that is known for
furniture stores, craft or art
pieces.
Product Characteristics:
Fragility, Perishability,
Amounts to be delivered
City Area Features:
Commercial homogeneity,
Amounts to be delivered
City Area Features: Commercial
homogeneity, logistic accessibility
City Area Features: Commercial
density and homogeneity
Profile B: Hotels, restaurants,
small grocery stores,
neighborhood markets
Product Characteristics:
Fragility, Perishability,
special conditions
Deliveries Profile: Amounts
to be delivered
Product Characteristics: Fragility,
Perishability, special conditions
Deliveries Profile: Amounts to be
delivered
Product Characteristics: Fragility,
Perishability
Deliveries Profile: Frequency of
deliveries, timeliness of deliveries
Profile C: Business center
(courier, small deliveries, B2C)
City Area Features: Logistic
accessibility; Restriction applied
Deliveries Profile: Amounts to be
delivered
City Area Features: Commercial
density
Deliveries Profile: Frequency of
deliveries
Profile D: Large commercial
(retail, shopping centers,
distribution warehouses)
City Area Features: Commercial
density, logistic accessibility;
restriction applied
Deliveries Profile: Frequency of
deliveries, timeliness of deliveries
Profile E: Residential areas with
local trade
TURBLOG D2: Business Concepts and Models for Urban Logistics 48
3.4 COMPARISON OF CASE STUDIES LOGISTIC PROFILES
The definition and characterisation of the logistic profiles help to identify the relevant conditionings for
the organisation of the logistics distribution. Through the identification of the conditions that optimise
the logistics system, it is possible to outline the business models that best suit each logistic profile, which
can have several forms.
Therefore, logistic characteristics are induced from the case studies in order to determine which logistic
profile fits into each case study analysed. Further in this report, the logistic profiles, together with the
main characteristics of the business models of each logistic measure analysed, will help to identify the
measures with the most transferability potential according to its main logistic profile features. The table
below presents the comparison between the logistic features of the following good practice examples
taken from Deliverables 3.1 to 3.9 (available at www.tublog.eu):
City of Paris (France):
o Chronopost Concorde;
o La Petite Reine;
o Monoprix Rail Project;
Beijing Tobacco Logistics Centre (China);
Mumbai Case Study (India):
o Mumbai Dabbawalas
Joint delivery systems in Tokyo (Japan);
New York City Off-Hour Delivery Project (USA);
City of Utrecht (The Netherlands);
City of Belo Horizonte (Brazil):
o Sale and delivery of organic products directly from the producer to the customer;
Truck Regulation and the Abertis Logistics Park in Santiago-Chile (Chile);
Regulations investigated, such as the environmental zone in Utrecht and the requirements of loading
and unloading places in Belo Horizonte weren’t considered because they can’t be directly associated
with one type of product or service, as well as a homogeneous area and the city. For that purpose the
Mexico City Case Study also wasn’t considered in this analysis due to the fact that this case study
TURBLOG D2: Business Concepts and Models for Urban Logistics 49
concerns a set of regulations such as the Vehicle Verification Programme, that are not directly
associated with one type of product or service, as well as a homogeneous area and the city.

TURBLOG D2: Business Concepts and Models for Urban Logistics 50
Table 12 – Logistic profiles identification and comparison
Chronopost in Paris,
France
Monoprix Rail Project,
Paris, France
La petite Reine in Paris,
FranceBeijing, China Mumbai , India Tokyo, Japan New York, USA
Utrecht , The
Netherlands
Belo Horizonte,
Brasil
Commercial density High Not determined High High High High High Medium High
Homogeneity Low Not determined Low Low Low Low Low Low Low
Logistic acessibility Reasonable Reasonable Reasonable Reasonable Bad Bad Reasonable Reasonable Reasonable
Measures considering
logistic needs
Some specific
measuresSome specific measures Some specific measures
Some specific
measures
Some specific
measures
Some specific
measures
Some specific
measures
Some specific
measures
Some specific
measures
Level of Congestion Reasonable Not determined Not determined Bad Bad Bad Bad Reasonable Reasonable
Restriction applied Yes Not determined Not determined Yes Yes Yes Yes Yes Yes
Easiness of handling Easy Not determined Easy Easy Easy Easy Easy Reasonable Easy
WeightLight (>1 unit per
person to carry)Not determined
Light (>1 unit per person
to carry)
Light (>1 unit per
person to carry)
Light (>1 unit per
person to carry)
Light (>1 unit
per person to
carry)
Small (>1 unit per
person to carry)
Medium (> 1 person to
carry one unit)
Small (>1 unit per
person to carry)
SizeSmall (>1 unit per
person to carry)Not determined
Small (>1 unit per person
to carry)
Small (>1 unit per
person to carry)
Small (>1 unit per
person to carry)
Small (>1 unit
per person to
carry)
Light (>1 unit per
person to carry)
Medium (> 1 person to
carry one unit)
Light (>1 unit per
person to carry)
Holding Conditions Easy Not determined Easy Easy Reasonable Easy Easy Reasonable Easy
Special conditions No special needs No special needs Might have special needs No special needs Special needs No special
needsNo special needs
Might have special
needs Special needs
Fragility Not determined No special needs Might have special needs No special needs Fragile No special needs No special needsMight have special
needsFragile
Perishability Not perishable Not determined Both perishable and not Not perishable Perishable Not perishable Not perishable Not determined Perishable
Urgency of deliveries Not determined Relevant Relevant Relevant Urgent Urgent Relevant Relevant Urgent
Frequency of deliveries High High High High High High High High High
Amounts to be delivered Several Many Few Several Several Several Several Several Several
Number of shops Several shops Retail center/big shops Several shops Several shops Several shops Several shops Several shops Several shops Several shops
Vehicles weight and size Van/small truck Heavy goods vehiclesLight goods vehicle or
smaller vehiclesVan/small truck
Light goods vehicle
or smaller vehiclesVan/small truck Not determined Van/small truck
Light goods vehicle
or smaller vehicles
Planned deliveries Defined routine Defined routine Defined routine Defined routineDefined routine Defined routine
Defined routine Defined routine No defined routine
PROFILE C PROFILE D PROFILE C PROFILE C PROFILE B PROFILE C PROFILE C PROFILE E PROFILE BLogistic Profile
Agent Profile /
Deliveries
Profile
Product
Characteristics
City Area
Features

TURBLOG D2: Business Concepts and Models for Urban Logistics 51
Most of the urban logistic practices that were presented in the case studies (Deliverable D3) refer to
urban city centres (Profile C) that usually face problems, such as bad logistic accessibility and high levels
of congestion. Also major urban city centres have to deal with the impacts from goods vehicles on the
urban environment, such as noise, congestion and air pollution. Therefore, the logistic measures
identified in Paris, New York City, Beijing and Tokyo concern restrictions towards the circulation of goods
vehicles, such as time windows or vehicle dimensions. In addition, some innovative measures are being
tested as last mile solutions, such as low-emission transport modes introduced by Chronopost and La
Petite Reine in Paris.
Concerning Profile B, the key issue of this profile is the special conditions that the distribution of
perishable goods require, as well as the distribution concerns that are common in most urban centres,
such as congestion during rush hours. The special needs from perishable products may imply temperature
conditions (chilled, frozen, ambient temperature…) or conditioning needs such as, for example, open
packages. Therefore, the urgency of deliveries is very relevant and the frequency of deliveries is normally
high (on a daily basis). In the Mumbai case study some time and access restrictions to the freight
circulation are considered in local transport policies and therefore, the Mumbai Dabbawalas Operation
System is presented as a successful logistics model that cut-crosses these restrictions, because it is based
on door-to-door food delivery services that uses public transport and non-pollutant vehicles (bicycles) for
their daily deliveries. Moreover, the solution presented in the case study Belo Horizonte (Brazil) includes
innovations on Business-to-Consumer approaches, namely the distribution directly from the producer to
the final consumer.
Profile D regards greater amounts of goods to supply large retail shops, such as supermarkets. The
Monoprix rail train was designed to supply all Monoprix’s supermarkets within Paris. This profile is also
applied to big warehouses and distribution centres, as presented in the Santiago do Chile case study. The
Abertis Logistics Park is a modern logistics park located in the Metropolitan Region and has good access to
the main highways of the city and routes to two major ports in the country, with no restrictions applied.
For areas that are predominantly residential (Profile E), the geometry of the streets is, in most of the
cases, not prepared for commercial supply, such as loading bays exclusive for commercial establishments,
especially in historical city centres. In Utrecht, the solutions for urban logistics include private-public
partnerships, programmes between municipalities/groups of municipalities, and municipality regulations
(vehicle restrictions/time windows/city distribution centres/logistic routes). Cargohopper is an example
of a solution for the constraints caused by the geometry of the streets. This train like vehicle produces
zero emissions and is allowed to circulate in the inner city at any time and any place.
There are some logistic measures that are transversal to all logistic profiles, such as the off-hour delivery
programme presented in the New-York case study. These logistic measures can be loading/unloading
regulations or urban master plans which have a wide application within the city. These wide scope
TURBLOG D2: Business Concepts and Models for Urban Logistics 52
logistic measures can sometimes neutralise other measures that are specific for one determined area,
product or delivery type. In other cases urban regulations can foresee and encourage innovative urban
logistic actions, as for example, the Paris Freight Oriented Master plan, on which the preservation of land
is foreseen, in order to develop logistic facilities with railway or waterway access and the identification
of areas to tranship goods from a boat/ship to a delivery vehicle during certain times of the day.
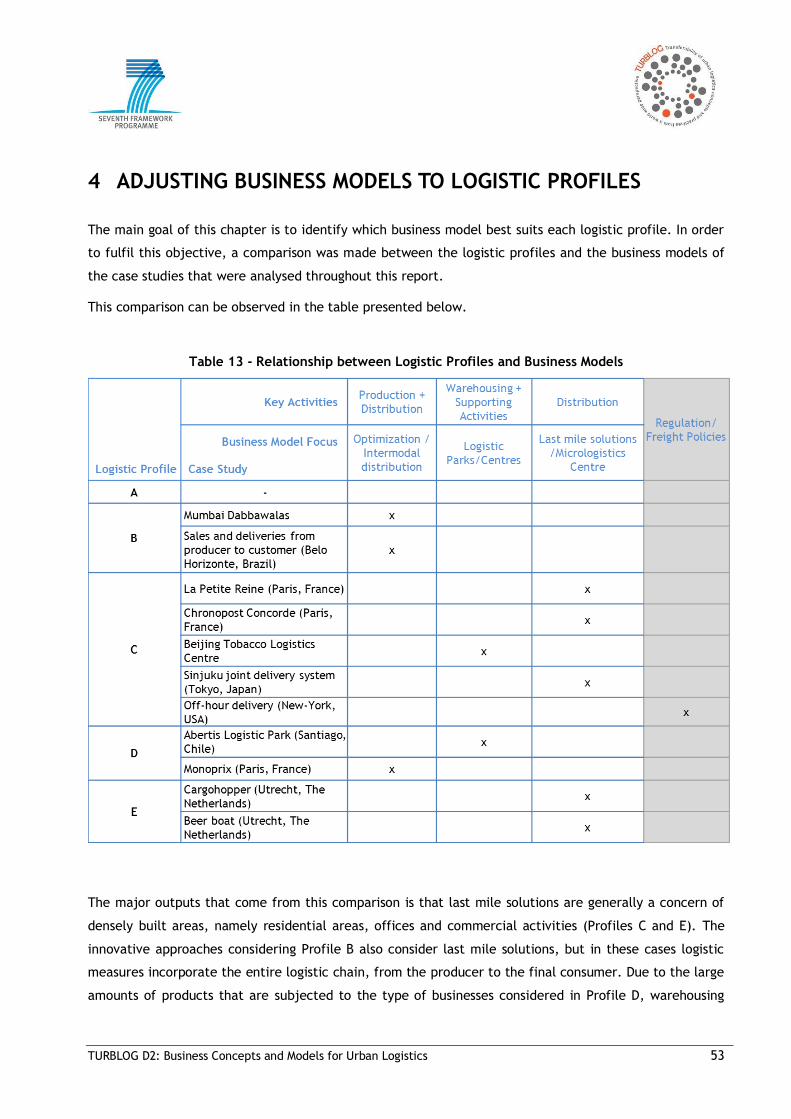
TURBLOG D2: Business Concepts and Models for Urban Logistics 53
4 ADJUSTING BUSINESS MODELS TO LOGISTIC PROFILES
The main goal of this chapter is to identify which business model best suits each logistic profile. In order
to fulfil this objective, a comparison was made between the logistic profiles and the business models of
the case studies that were analysed throughout this report.
This comparison can be observed in the table presented below.
Table 13 - Relationship between Logistic Profiles and Business Models
The major outputs that come from this comparison is that last mile solutions are generally a concern of
densely built areas, namely residential areas, offices and commercial activities (Profiles C and E). The
innovative approaches considering Profile B also consider last mile solutions, but in these cases logistic
measures incorporate the entire logistic chain, from the producer to the final consumer. Due to the large
amounts of products that are subjected to the type of businesses considered in Profile D, warehousing
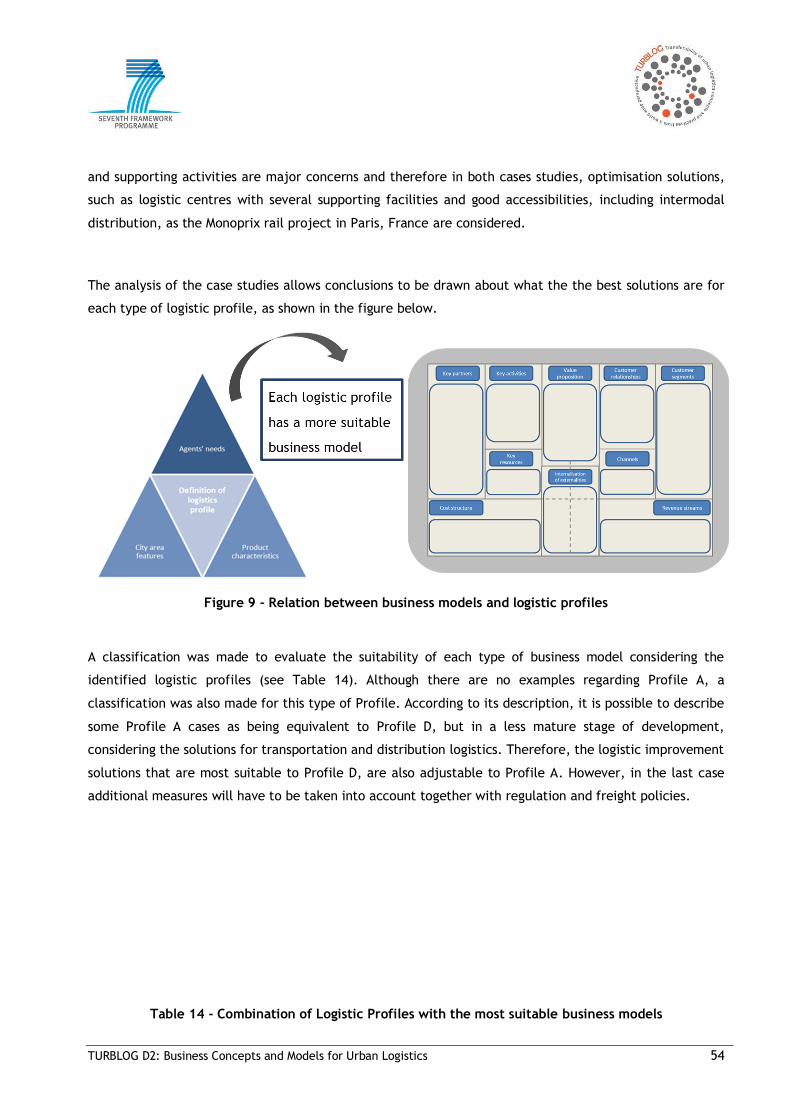
TURBLOG D2: Business Concepts and Models for Urban Logistics 54
and supporting activities are major concerns and therefore in both cases studies, optimisation solutions,
such as logistic centres with several supporting facilities and good accessibilities, including intermodal
distribution, as the Monoprix rail project in Paris, France are considered.
The analysis of the case studies allows conclusions to be drawn about what the the best solutions are for
each type of logistic profile, as shown in the figure below.
Figure 9 – Relation between business models and logistic profiles
A classification was made to evaluate the suitability of each type of business model considering the
identified logistic profiles (see Table 14). Although there are no examples regarding Profile A, a
classification was also made for this type of Profile. According to its description, it is possible to describe
some Profile A cases as being equivalent to Profile D, but in a less mature stage of development,
considering the solutions for transportation and distribution logistics. Therefore, the logistic improvement
solutions that are most suitable to Profile D, are also adjustable to Profile A. However, in the last case
additional measures will have to be taken into account together with regulation and freight policies.
Table 14 - Combination of Logistic Profiles with the most suitable business models

TURBLOG D2: Business Concepts and Models for Urban Logistics 55
The suitability of services ranges from:
+++ 'Service well suited to profile' to 0 'Service is not appropriate for this profile
From the table above it is possible to conclude that for logistic profiles that involve a great amount of
goods deliveries (profile A and D), the best business models are the ones that aim to optimise the
distributions, such as intermodal distribution and the concentration of related services in specialised
areas, such as logistic parks/centres, as the successful logistic practices of Monoprix and Abertis Logistic
Park showed.
The case studies that fit into Profile B are the Dabbawalas in Mumbai, and the organic products sale and
delivery in Belo Horizonte, Brazil. These examples present good solutions to deliver perishable products
using alternative modes of transport and to deliver products straight from the producer to the final
consumer. Therefore, business models involving optimisation and intermodal distribution were considered
as the most adequate for this profile.
Profiles C and E usually correspond to areas that face problems related to congestion and accessibility,
and therefore business models regarding last mile solutions are the ones considered with more potential
to be implemented within areas with these features.
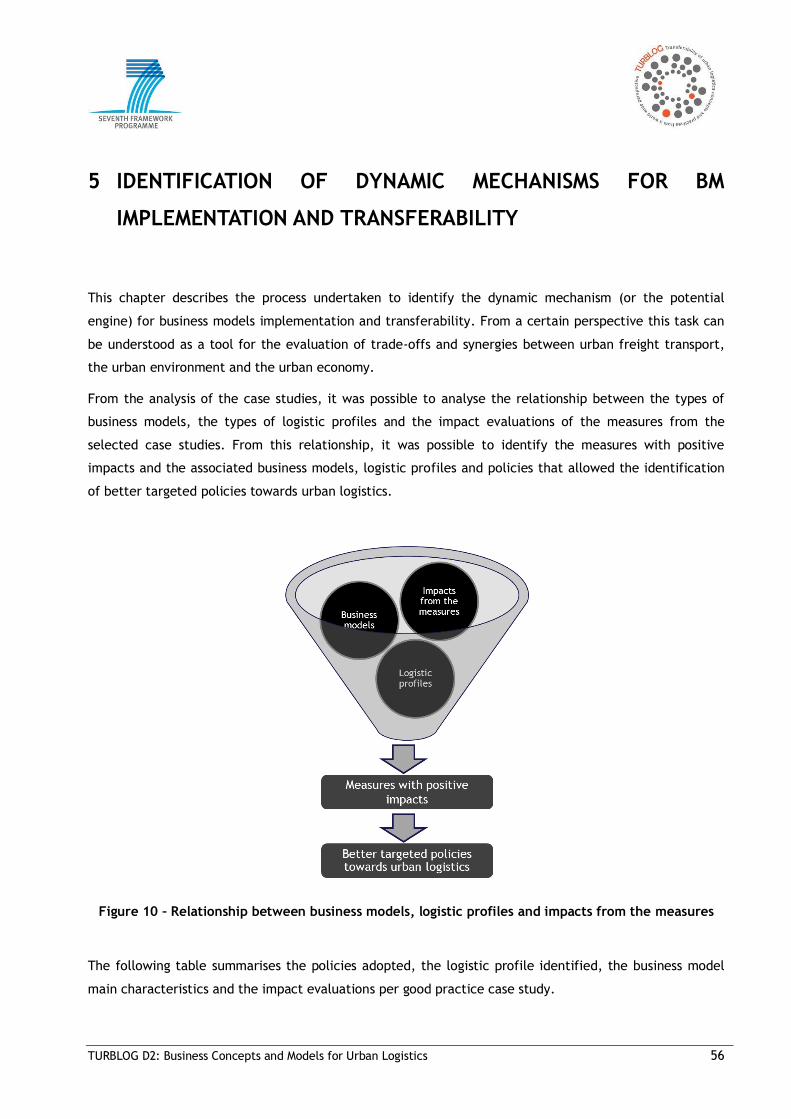
TURBLOG D2: Business Concepts and Models for Urban Logistics 56
5 IDENTIFICATION OF DYNAMIC MECHANISMS FOR BM
IMPLEMENTATION AND TRANSFERABILITY
This chapter describes the process undertaken to identify the dynamic mechanism (or the potential
engine) for business models implementation and transferability. From a certain perspective this task can
be understood as a tool for the evaluation of trade-offs and synergies between urban freight transport,
the urban environment and the urban economy.
From the analysis of the case studies, it was possible to analyse the relationship between the types of
business models, the types of logistic profiles and the impact evaluations of the measures from the
selected case studies. From this relationship, it was possible to identify the measures with positive
impacts and the associated business models, logistic profiles and policies that allowed the identification
of better targeted policies towards urban logistics.
Figure 10 – Relationship between business models, logistic profiles and impacts from the measures
The following table summarises the policies adopted, the logistic profile identified, the business model
main characteristics and the impact evaluations per good practice case study.
TURBLOG D2: Business Concepts and Models for Urban Logistics 57
The green symbols represent the positive impacts that the selected good practices had. The red symbols
represent negative impacts caused by the implementation of the measures and the grey symbols
represent measures with limited or almost no impacts shown. If the symbols have a pattern, this means
that no quantitative and/or qualitative data was available in the case studies and that an assumption has
been made regarding the impact. The purpose of this comparison is to give a broad overview of the
expected main impacts of the different measures and to show the type of impacts that can be expected
with the application of those measures, with the adoption of that type of policy, according to that
logistic profile and most suitable business model.
As the impact of measures shows, in general, all measures contribute towards making the city more
attractive and the environment more sustainable.
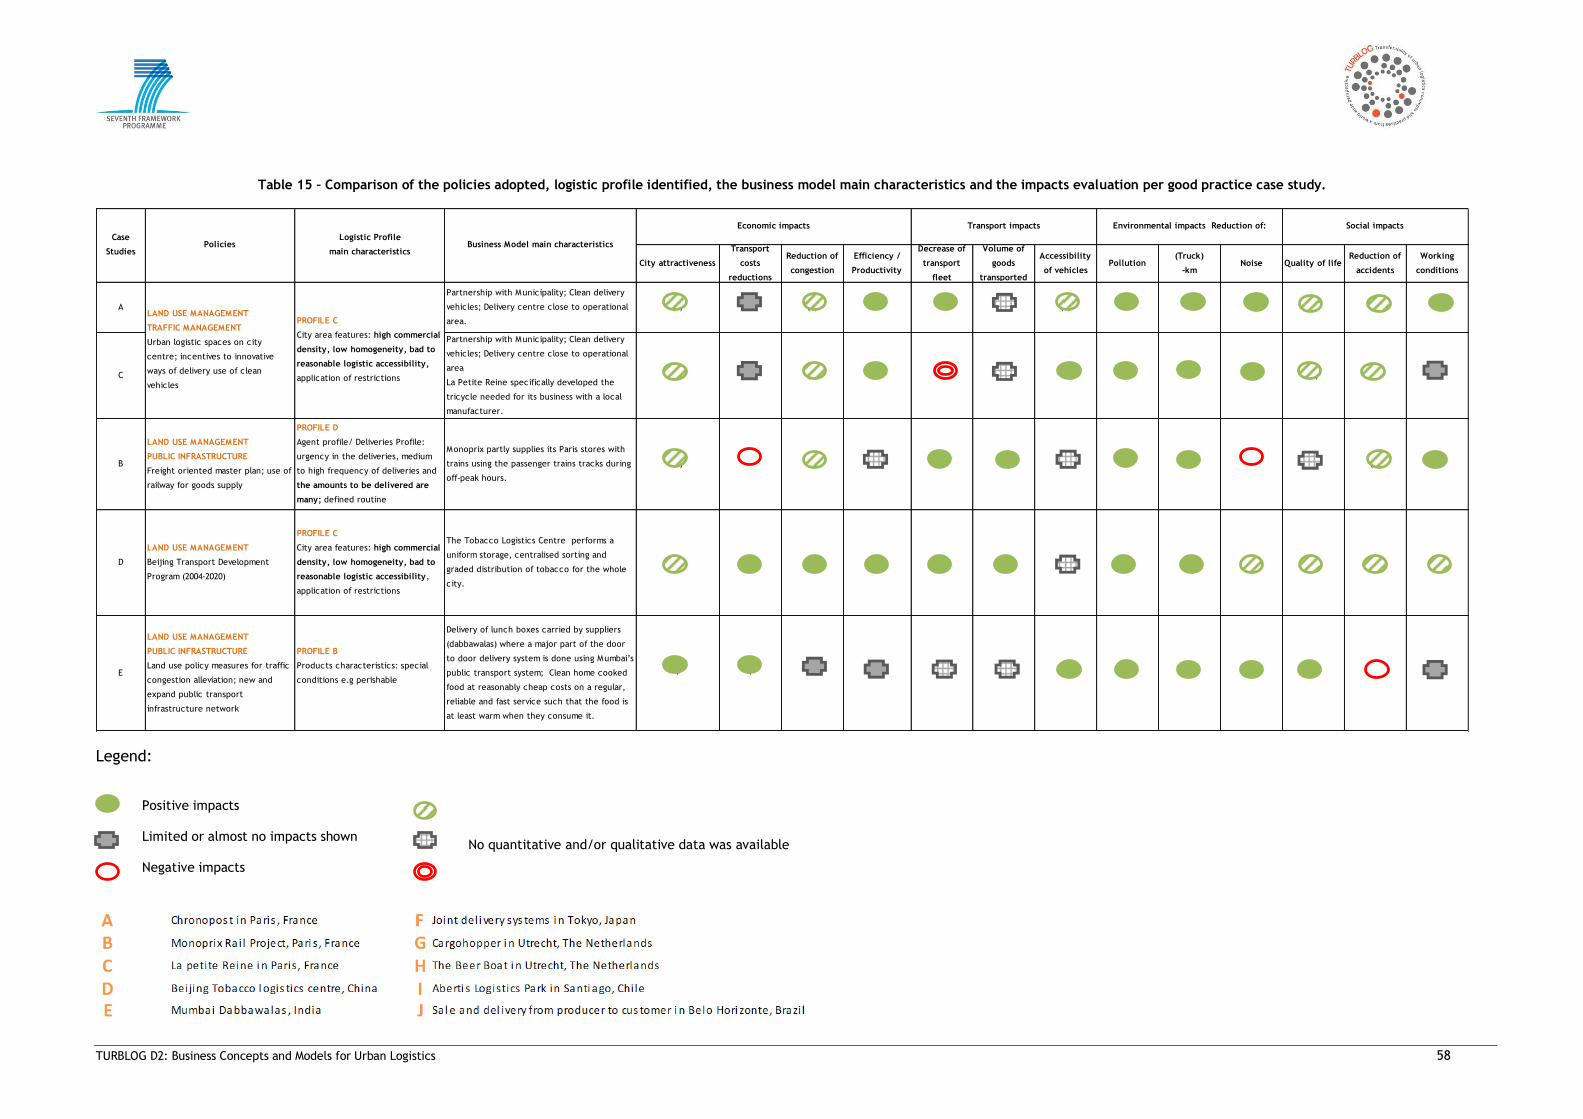
TURBLOG D2: Business Concepts and Models for Urban Logistics 58
Table 15 – Comparison of the policies adopted, logistic profile identified, the business model main characteristics and the impacts evaluation per good practice case study.
City attractiveness
Transport
costs
reductions
Reduction of
congestion
Efficiency /
Productivity
Decrease of
transport
fleet
Volume of
goods
transported
Accessibility
of vehiclesPollution
(Truck)
-kmNoise Quality of life
Reduction of
accidents
Working
conditions
A
Partnership with Municipality; Clean delivery
vehicles; Delivery centre close to operational
area.
(+) ~ (+) + + (~) (+) + + + (+) (+) +
C
Partnership with Municipality; Clean delivery
vehicles; Delivery centre close to operational
area
La Petite Reine specifically developed the
tricycle needed for its business with a local
manufacturer.
(+) ~ (+) + (-) (~) + + + + (+) (+) ~
B
LAND USE MANAGEMENT
PUBLIC INFRASTRUCTURE
Freight oriented master plan; use of
railway for goods supply
PROFILE D
Agent profile/ Deliveries Profile:
urgency in the deliveries, medium
to high frequency of deliveries and
the amounts to be delivered are
many; defined routine
Monoprix partly supplies its Paris stores with
trains using the passenger trains tracks during
off-peak hours.
(+) - (+) (~) + + (~) + + - (~) (+) +
D
LAND USE MANAGEMENT
Beijing Transport Development
Program (2004-2020)
PROFILE C
City area features: high commercial
density, low homogeneity, bad to
reasonable logistic accessibility,
application of restrictions
The Tobacco Logistics Centre performs a
uniform storage, centralised sorting and
graded distribution of tobacco for the whole
city.
(+) + + + + + (~) + + (+) (+) (+) (+)
E
LAND USE MANAGEMENT
PUBLIC INFRASTRUCTURE
Land use policy measures for traffic
congestion alleviation; new and
expand public transport
infrastructure network
PROFILE B
Products characteristics: special
conditions e.g perishable
Delivery of lunch boxes carried by suppliers
(dabbawalas) where a major part of the door
to door delivery system is done using Mumbai’s
public transport system; Clean home cooked
food at reasonably cheap costs on a regular,
reliable and fast service such that the food is
at least warm when they consume it.
+ + ~ ~ (~) (~) + + + + + - ~
Environmental impacts Reduction of: Social impacts
LAND USE MANAGEMENT
TRAFFIC MANAGEMENT
Urban logistic spaces on city
centre; incentives to innovative
ways of delivery use of clean
vehicles
PROFILE C
City area features: high commercial
density, low homogeneity, bad to
reasonable logistic accessibility,
application of restrictions
Case
StudiesPolicies
Logistic Profile
main characteristicsBusiness Model main characteristics
Economic impacts Transport impacts
Legend:
Positive impacts
Limited or almost no impacts shown
Negative impacts
No quantitative and/or qualitative data was available
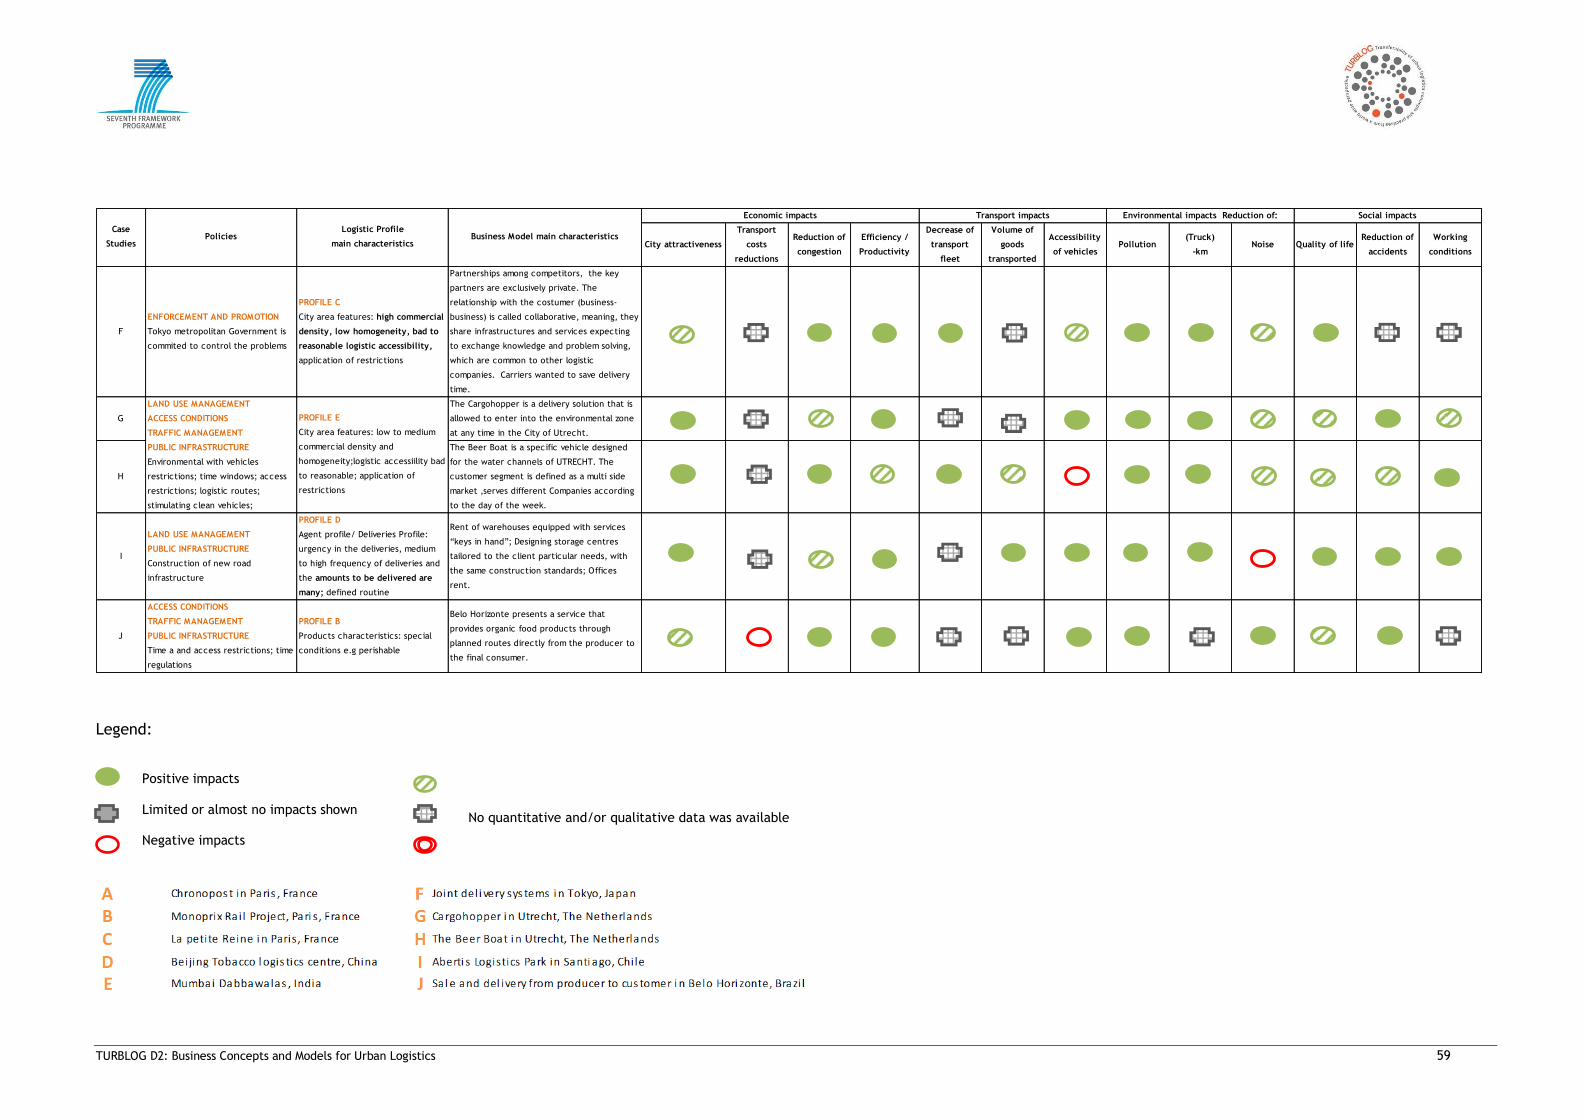
TURBLOG D2: Business Concepts and Models for Urban Logistics 59
City attractiveness
Transport
costs
reductions
Reduction of
congestion
Efficiency /
Productivity
Decrease of
transport
fleet
Volume of
goods
transported
Accessibility
of vehiclesPollution
(Truck)
-kmNoise Quality of life
Reduction of
accidents
Working
conditions
F
ENFORCEMENT AND PROMOTION
Tokyo metropolitan Government is
commited to control the problems
PROFILE C
City area features: high commercial
density, low homogeneity, bad to
reasonable logistic accessibility,
application of restrictions
Partnerships among competitors, the key
partners are exclusively private. The
relationship with the costumer (business-
business) is called collaborative, meaning, they
share infrastructures and services expecting
to exchange knowledge and problem solving,
which are common to other logistic
companies. Carriers wanted to save delivery
time.
(+) (~) + + + (~) (+) + + (+) + (~) (~)
G
The Cargohopper is a delivery solution that is
allowed to enter into the environmental zone
at any time in the City of Utrecht.
+ (~) (+) + (~) (~) + + + (+) (+) + (+)
H
The Beer Boat is a specific vehicle designed
for the water channels of UTRECHT. The
customer segment is defined as a multi side
market ,serves different Companies according
to the day of the week.
+ (~) + (+) + (+) - + + (+) (+) (+) +
I
LAND USE MANAGEMENT
PUBLIC INFRASTRUCTURE
Construction of new road
infrastructure
PROFILE D
Agent profile/ Deliveries Profile:
urgency in the deliveries, medium
to high frequency of deliveries and
the amounts to be delivered are
many; defined routine
Rent of warehouses equipped with services
“keys in hand”; Designing storage centres
tailored to the client particular needs, with
the same construction standards; Offices
rent.
+ (~) (+) + (~) + + + + - + + +
J
ACCESS CONDITIONS
TRAFFIC MANAGEMENT
PUBLIC INFRASTRUCTURE
Time a and access restrictions; time
regulations
PROFILE B
Products characteristics: special
conditions e.g perishable
Belo Horizonte presents a service that
provides organic food products through
planned routes directly from the producer to
the final consumer.
(+) - + + (~) (~) + + (~) + (+) + (~)
Environmental impacts Reduction of: Social impacts
Case
StudiesPolicies
Logistic Profile
main characteristicsBusiness Model main characteristics
Economic impacts
LAND USE MANAGEMENT
ACCESS CONDITIONS
TRAFFIC MANAGEMENT
PUBLIC INFRASTRUCTURE
Environmental with vehicles
restrictions; time windows; access
restrictions; logistic routes;
stimulating clean vehicles;
PROFILE E
City area features: low to medium
commercial density and
homogeneity;logistic accessiility bad
to reasonable; application of
restrictions
Transport impacts
Legend:
Positive impacts
Limited or almost no impacts shown
Negative impacts
No quantitative and/or qualitative data was available
TURBLOG D2: Business Concepts and Models for Urban Logistics 60
From the case study comparisons, it should be mentioned that the type of policies land use management
and traffic management adopted by business models based in last mile solutions/micrologistics centres
(logistic profiles C and E), present positive environmental impacts. These positive impacts are amongst
others, reduction of pollution, less km travelled by truck, positive social impacts and positive economic
impacts such as city attractiveness, reduction of congestion and efficiency/productivity. All these good
practices combine distribution centres and clean vehicles/ deliveries for the last mile distribution in
residential areas densely built, with commerce and services.
The type of policies adopted in Profile B and D show that land use management and public infrastructure
have a positive impact especially in the environmental impacts and city attractiveness.
The Cargohopper and Beer boat are clean electric vehicles adapted to the city area features (narrow
streets, water channels and restrictions applied (size, type of vehicle and time windows)) and operate
mainly in residential areas, with commercial activities. This logistic profile (Profile E) combines the four
types of policies and presents positive impacts in the city attractiveness, congestion reduction, the
environment and social impacts.
Only two case studies present positive transport costs reduction, namely the case studies from Mumbai
and the Tobacco Logistcs centre and both adopted policies related to land use management (in the case
of the Logistic centre, it also involved public infrastructure).
The following table illustrates which type of policies should be recommended for the combination of
logistic profiles with the most suitable business models, according to the findings from the good practices
that were assessed.
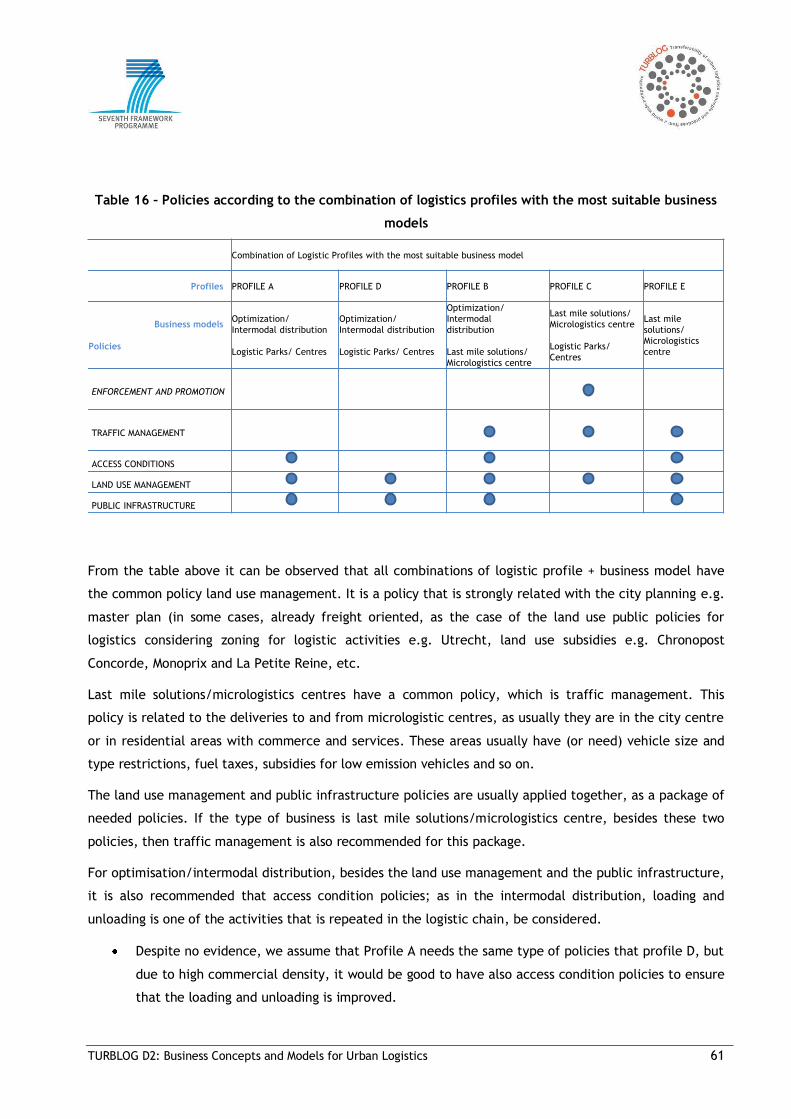
TURBLOG D2: Business Concepts and Models for Urban Logistics 61
Table 16 – Policies according to the combination of logistics profiles with the most suitable business
models
Combination of Logistic Profiles with the most suitable business model
Profiles PROFILE A PROFILE D PROFILE B PROFILE C PROFILE E
Business models
Policies
Optimization/
Intermodal distribution
Logistic Parks/ Centres
Optimization/
Intermodal distribution
Logistic Parks/ Centres
Optimization/
Intermodal
distribution
Last mile solutions/
Micrologistics centre
Last mile solutions/
Micrologistics centre
Logistic Parks/
Centres
Last mile
solutions/
Micrologistics
centre
ENFORCEMENT AND PROMOTION
TRAFFIC MANAGEMENT
ACCESS CONDITIONS
LAND USE MANAGEMENT
PUBLIC INFRASTRUCTURE
From the table above it can be observed that all combinations of logistic profile + business model have
the common policy land use management. It is a policy that is strongly related with the city planning e.g.
master plan (in some cases, already freight oriented, as the case of the land use public policies for
logistics considering zoning for logistic activities e.g. Utrecht, land use subsidies e.g. Chronopost
Concorde, Monoprix and La Petite Reine, etc.
Last mile solutions/micrologistics centres have a common policy, which is traffic management. This
policy is related to the deliveries to and from micrologistic centres, as usually they are in the city centre
or in residential areas with commerce and services. These areas usually have (or need) vehicle size and
type restrictions, fuel taxes, subsidies for low emission vehicles and so on.
The land use management and public infrastructure policies are usually applied together, as a package of
needed policies. If the type of business is last mile solutions/micrologistics centre, besides these two
policies, then traffic management is also recommended for this package.
For optimisation/intermodal distribution, besides the land use management and the public infrastructure,
it is also recommended that access condition policies; as in the intermodal distribution, loading and
unloading is one of the activities that is repeated in the logistic chain, be considered.
Despite no evidence, we assume that Profile A needs the same type of policies that profile D, but
due to high commercial density, it would be good to have also access condition policies to ensure
that the loading and unloading is improved.

TURBLOG D2: Business Concepts and Models for Urban Logistics 62
In general, these findings enable us to draft the following recommendations for the successful
implementation of the measures:
For the implementation of logistic parks/centres and micrologistics centres, it is recommended to
adopt land use management policies, to define zoning for logistic activities and land use pricing
and/or subsidies. For logistic parks/centres, it is also recommended to adopt public
infrastructure policies, such as new infrastructure for freight, new transport network
infrastructure, etc;
For the optimisation/Intermodal distribution, the key activities are production and distribution
and the main characteristic of the business model is related to the product characteristics,
therefore the policies related to access conditions and traffic management, together with the
land use management and public infrastructure, have presented a successful implementation of
the measures assessed in this project as good practices;
TURBLOG D2: Business Concepts and Models for Urban Logistics 63
6 CONCLUDING REMARKS
This deliverable has provided a methodology to identify the dynamic mechanisms for business concepts,
implementation and transferability, based on the case studies addressed in Deliverable D3.
One of the outputs that came from the business model analysis is that the “building blocks” of
Osterwalders’ approach are not sufficient enough to fully understand the motives as to why a logistics
company invests in such innovative solutions. Several of the logistics improvement measures that needed
to be made were investments in non-pollutant vehicles and noise reduction equipment that represent an
increase on their transport costs but don’t increase their profit, due to environmental regulations and/or
circulation restrictions of the city policies. Urban Policies are therefore a major player in the urban
logistics business. Therefore, another block was added to the business model named “Internalisation of
externalities”. These externalities represent not only a cost, but also a value proposition for these
businesses once they win a competitive advantage for “being environmentally friendly”: The Cargohopper
is a delivery solution that is allowed to enter into the environmental zone at any time in the City of
Utrecht, and the Chronopost Concorde and La Petite Reine have the possibility to rent Urban Logistic
Spaces at low prices because they use green vehicles. These environmental investments are also used as
publicity and as a communication channel with customers, and represent revenues to society in general
once they contribute to the overall environment.
From the analysis of the different examples of successful urban logistic measures, is possible to conclude
that most of the innovative business concepts presented rely on partnerships other than the typical
buyer-supplier relationship, with the expectation to improve performance (efficiency) and accessibility of
their services as core value propositions. Moreover, some business concepts were only effectively
implemented because they were sustained by public administration policies, which provided availability
of warehouse spaces or accessibilities and, in some cases, financial incentives, resulting in partnerships
with the municipality or other government administrations (e.g. Monoprix, Chronopost, La Petite Reine).
In order to meet the municipal environmental requirements and restrictions and also looking towards
improving service performance, some companies developed joint ventures to develop these new services
(e.g. La Petite Reine, that developed the tricycle needed for its business with a local manufacturer, and
the Beer Boat that is operating in the City of Utrecht). The need to optimise resources and also to obtain
other supporting services and infrastructures, leads to partnerships among competitors, such as in the
case study of Japan, where the key partners are exclusively private. In these cases, the relationship with
the customer (business-business) is called collaborative, meaning, they share infrastructures and services
expecting to exchange knowledge and problem solving, which are common to other logistic companies.
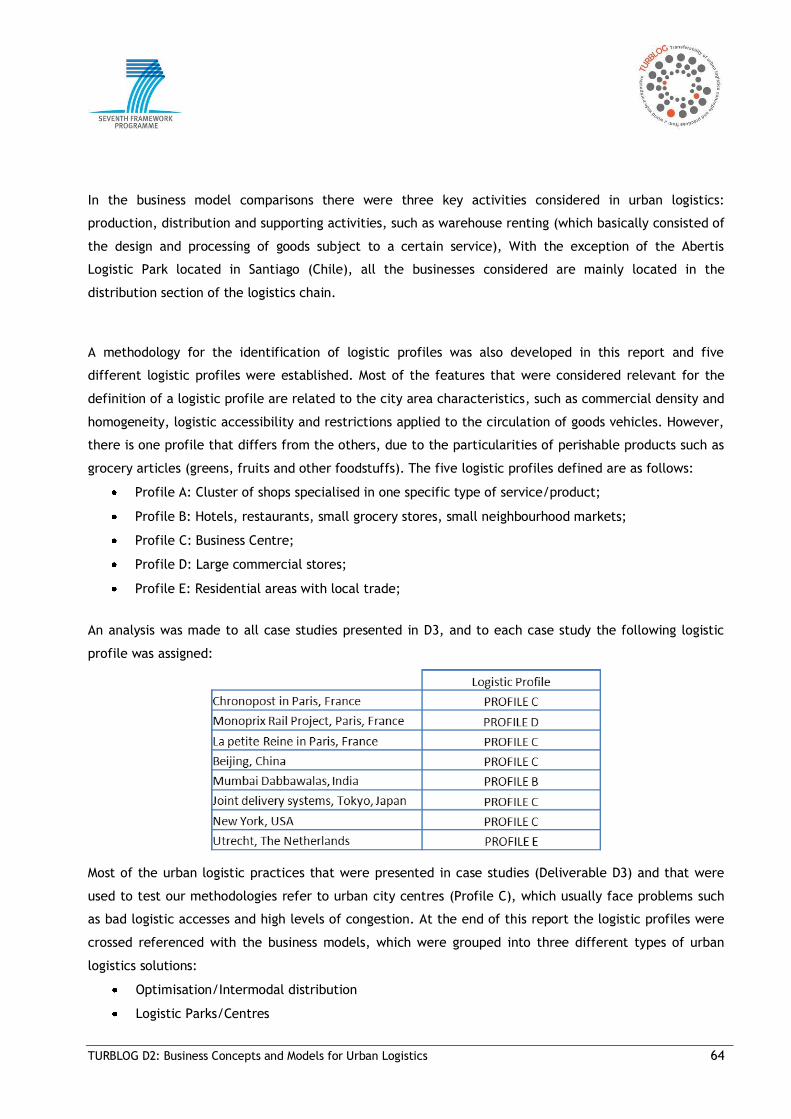
TURBLOG D2: Business Concepts and Models for Urban Logistics 64
In the business model comparisons there were three key activities considered in urban logistics:
production, distribution and supporting activities, such as warehouse renting (which basically consisted of
the design and processing of goods subject to a certain service), With the exception of the Abertis
Logistic Park located in Santiago (Chile), all the businesses considered are mainly located in the
distribution section of the logistics chain.
A methodology for the identification of logistic profiles was also developed in this report and five
different logistic profiles were established. Most of the features that were considered relevant for the
definition of a logistic profile are related to the city area characteristics, such as commercial density and
homogeneity, logistic accessibility and restrictions applied to the circulation of goods vehicles. However,
there is one profile that differs from the others, due to the particularities of perishable products such as
grocery articles (greens, fruits and other foodstuffs). The five logistic profiles defined are as follows:
Profile A: Cluster of shops specialised in one specific type of service/product;
Profile B: Hotels, restaurants, small grocery stores, small neighbourhood markets;
Profile C: Business Centre;
Profile D: Large commercial stores;
Profile E: Residential areas with local trade;
An analysis was made to all case studies presented in D3, and to each case study the following logistic
profile was assigned:
Most of the urban logistic practices that were presented in case studies (Deliverable D3) and that were
used to test our methodologies refer to urban city centres (Profile C), which usually face problems such
as bad logistic accesses and high levels of congestion. At the end of this report the logistic profiles were
crossed referenced with the business models, which were grouped into three different types of urban
logistics solutions:
Optimisation/Intermodal distribution
Logistic Parks/Centres
TURBLOG D2: Business Concepts and Models for Urban Logistics 65
Last mile solutions/Micrologistics Centre
The main findings of this report show that the most suitable logistic solution is defined not only by the
business characteristics, but also by the delivery, product and city area features (logistic profile), as well
as the policies adopted/to be adopted for the city. It is the combination of these three pillars that
constitute the backbone of the decision making for best urban logistics solutions.
After identifying the most suitable business model for each logistic profile, they were then related to the
five types of policies:
Enforcement and promotion
Traffic management
Access conditions
Land use management
Public infrastructure
The main outcome from the relationships of these policies with the urban solutions and logistic profiles
can enable us to draft the following recommendations for the successful implementation of the measures:
For the implementation of logistic parks/centres and micrologistics centres, it is recommended to
adopt land use management policies, to define zoning for logistic activities, land use pricing
and/or subsidies. For logistic parks/centres, it is also recommended to adopt public
infrastructure policy, such as new infrastructure for freight, new transport network infrastructure
and so on;
For the optimisation/Intermodal distribution, the key activities are production and distribution
and the main characteristic of the business model is related to the product characteristics. Due
to this, the policies related to access conditions and traffic management, together with the land
use management and public infrastructure, have presented a successful implementation of the
measures assessed in this project as good practices.
From the analysis it is possible to induce that entrepreneurship is a key factor for the
enhancement of urban freight solutions but it requires also the intervention of public policies to
encourage that entrepreneurship.
TURBLOG D2: Business Concepts and Models for Urban Logistics 66
7 REFERENCES
LINDER, J. and CANTRELL, S. (2000), Changing Business Models: Surveying the Landscape;
Accenture, Institute for Strategic Change. Accenture; Cambridge, Massachusetts. 2000.
OSTERWALDER, Alexander (2004), The Business Model Ontology - A proposition in a Design
Science Approach, These pour l’obtention du grade de Docteur en Informatique de Gestion.
Ecole des Hautes Etudes Commerciales de l’Université de Lausanne. 2004.
OSTERWALDER A, PIGNEUR Y. (2010), Business Model Generation - A Handbook for Visionaries,
Game Changers, and Challengers. Published by John Wiley & Sons, Inc., Hoboken. New Jersey.
2010.
OSTERWALDER A, PIGNEUR Y. and TUCCI C.L. (2005), Clarifying Business Models: Origins,
Present, and Future of the Concept. Communications of the Association for Information Systems
(AIS) Las Vegas, USA. 2005.
MAGRETTA, Joan (2002), Why Business Models Matter, Harvard Business Review. 2002.
Stähler, P. (2002) Business Models as an Unit of Analysis for Strategizing. International Workshop
on Business Models. Lausanne, Switzerland.2002.
Morris, M.; Schindehutte, M., Allen, J (2003). The entrepreneur’s business model: toward a
unified perspective. Elsevier, Journal of Business Research. 2003.
MACÁRIO R. et al. (2007), Logurb - Optimização de Sistemas Logísticos de Distribuição de
Mercadorias em Meio Urbano - state of the art da logistica urbana, Fundação de Ciência e
Tecnologia, Lisboa, Portugal.2007.
OECD - Organisation for Economic Co-operation and Development Delivering the Goods (2003),
21st Century Challenges to Urban Goods Transport. 2003.
HENSHER, D.A. E PUCKETT, S. M. (2005), Refocusing the modelling of freight distribution:
Development of an economic-based framework to evaluate supply chain behaviour in response to
congestion charging. 2005.
Rodrigue, J. (2006), Freight and the City: An Overview of Urban Freight Distribution and City
Logistics, Maritime Infrastructure Engineering and Management Program, Rutgers University,
April 2006.
TURBLOG D2: Business Concepts and Models for Urban Logistics 67
8 ANNEXES
8.1 ANNEX A
Definitions of the characteristics of the business models
8.2 ANNEX B
Urban business model canvas of each case study
8.3 ANNEX C
Logistic profile identification of each case study
TURBLOG D2: Business Concepts and Models for Urban Logistics
8.1 ANNEX A
Definitions of the characteristics of the business models
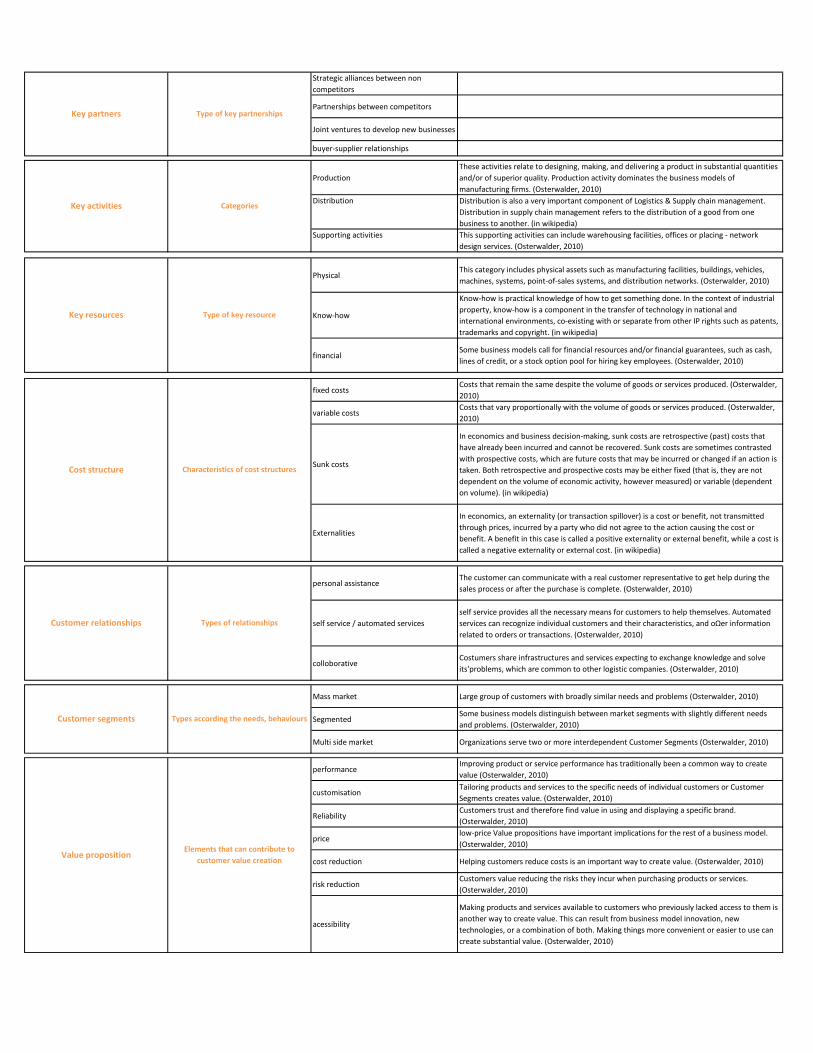
Strategic alliances between non
competitors
Partnerships between competitors
Joint ventures to develop new businesses
buyer-supplier relationships
Production
These activities relate to designing, making, and delivering a product in substantial quantities
and/or of superior quality. Production activity dominates the business models of
manufacturing firms. (Osterwalder, 2010)
Distribution Distribution is also a very important component of Logistics & Supply chain management.
Distribution in supply chain management refers to the distribution of a good from one
business to another. (in wikipedia)
Supporting activities This supporting activities can include warehousing facilities, offices or placing - network
design services. (Osterwalder, 2010)
PhysicalThis category includes physical assets such as manufacturing facilities, buildings, vehicles,
machines, systems, point-of-sales systems, and distribution networks. (Osterwalder, 2010)
Know-how
Know-how is practical knowledge of how to get something done. In the context of industrial
property, know-how is a component in the transfer of technology in national and
international environments, co-existing with or separate from other IP rights such as patents,
trademarks and copyright. (in wikipedia)
financialSome business models call for financial resources and/or financial guarantees, such as cash,
lines of credit, or a stock option pool for hiring key employees. (Osterwalder, 2010)
fixed costsCosts that remain the same despite the volume of goods or services produced. (Osterwalder,
2010)
variable costsCosts that vary proportionally with the volume of goods or services produced. (Osterwalder,
2010)
Sunk costs
In economics and business decision-making, sunk costs are retrospective (past) costs that
have already been incurred and cannot be recovered. Sunk costs are sometimes contrasted
with prospective costs, which are future costs that may be incurred or changed if an action is
taken. Both retrospective and prospective costs may be either fixed (that is, they are not
dependent on the volume of economic activity, however measured) or variable (dependent
on volume). (in wikipedia)
Externalities
In economics, an externality (or transaction spillover) is a cost or benefit, not transmitted
through prices, incurred by a party who did not agree to the action causing the cost or
benefit. A benefit in this case is called a positive externality or external benefit, while a cost is
called a negative externality or external cost. (in wikipedia)
personal assistanceThe customer can communicate with a real customer representative to get help during the
sales process or after the purchase is complete. (Osterwalder, 2010)
self service / automated services
self service provides all the necessary means for customers to help themselves. Automated
services can recognize individual customers and their characteristics, and oΩer information
related to orders or transactions. (Osterwalder, 2010)
colloborativeCostumers share infrastructures and services expecting to exchange knowledge and solve
its'problems, which are common to other logistic companies. (Osterwalder, 2010)
Mass market Large group of customers with broadly similar needs and problems (Osterwalder, 2010)
SegmentedSome business models distinguish between market segments with slightly different needs
and problems. (Osterwalder, 2010)
Multi side market Organizations serve two or more interdependent Customer Segments (Osterwalder, 2010)
performanceImproving product or service performance has traditionally been a common way to create
value (Osterwalder, 2010)
customisationTailoring products and services to the specific needs of individual customers or Customer
Segments creates value. (Osterwalder, 2010)
ReliabilityCustomers trust and therefore find value in using and displaying a specific brand.
(Osterwalder, 2010)
pricelow-price Value propositions have important implications for the rest of a business model.
(Osterwalder, 2010)
cost reduction Helping customers reduce costs is an important way to create value. (Osterwalder, 2010)
risk reductionCustomers value reducing the risks they incur when purchasing products or services.
(Osterwalder, 2010)
acessibility
Making products and services available to customers who previously lacked access to them is
another way to create value. This can result from business model innovation, new
technologies, or a combination of both. Making things more convenient or easier to use can
create substantial value. (Osterwalder, 2010)
Key partners Type of key partnerships
Key activities Categories
Key resources Type of key resource
Cost structure Characteristics of cost structures
Customer relationships Types of relationships
Customer segments Types according the needs, behaviours
Value propositionElements that can contribute to
customer value creation
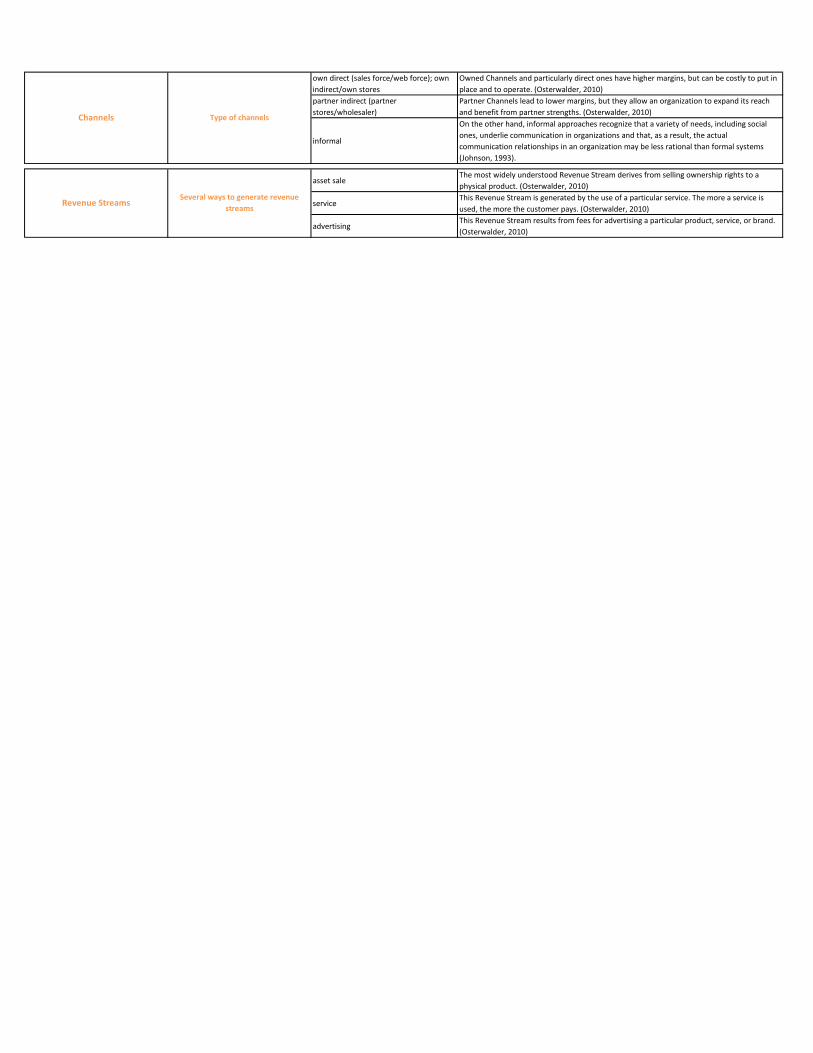
own direct (sales force/web force); own
indirect/own stores
Owned Channels and particularly direct ones have higher margins, but can be costly to put in
place and to operate. (Osterwalder, 2010)
partner indirect (partner
stores/wholesaler)
Partner Channels lead to lower margins, but they allow an organization to expand its reach
and benefit from partner strengths. (Osterwalder, 2010)
informal
On the other hand, informal approaches recognize that a variety of needs, including social
ones, underlie communication in organizations and that, as a result, the actual
communication relationships in an organization may be less rational than formal systems
(Johnson, 1993).
asset saleThe most widely understood Revenue Stream derives from selling ownership rights to a
physical product. (Osterwalder, 2010)
serviceThis Revenue Stream is generated by the use of a particular service. The more a service is
used, the more the customer pays. (Osterwalder, 2010)
advertisingThis Revenue Stream results from fees for advertising a particular product, service, or brand.
(Osterwalder, 2010)
Channels Type of channels
Revenue StreamsSeveral ways to generate revenue
streams

TURBLOG D2: Business Concepts and Models for Urban Logistics
8.2 ANNEX B
Urban business model canvas of each case study
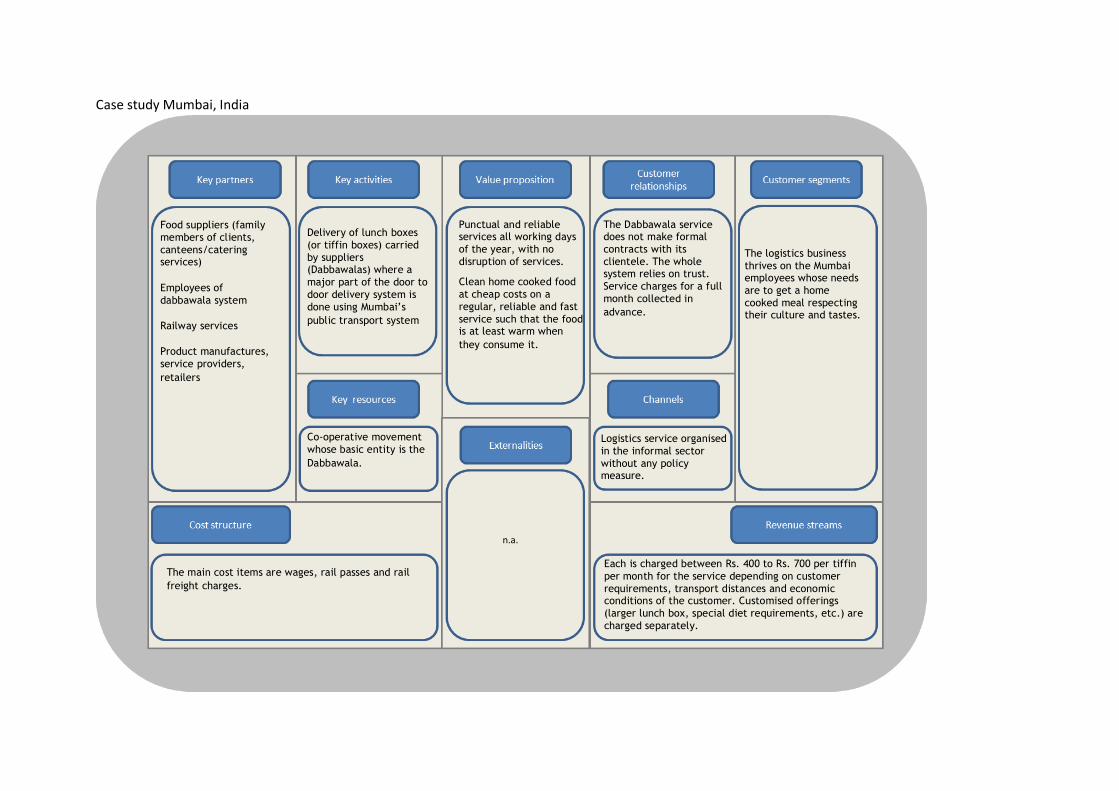
Case study Mumbai, India
Food suppliers (family
members of clients,
canteens/catering services)
Employees of
dabbawala system
Railway services
Product manufactures,
service providers,
retailers
Delivery of lunch boxes
(or tiffin boxes) carried
by suppliers (Dabbawalas) where a
major part of the door to
door delivery system is
done using Mumbai‟s
public transport system
Punctual and reliable services all working days
of the year, with no
disruption of services.
Clean home cooked food
at cheap costs on a
regular, reliable and fast
service such that the food is at least warm when
they consume it.
The Dabbawala service does not make formal
contracts with its
clientele. The whole system relies on trust.
Service charges for a full
month collected in
advance.
The logistics business
thrives on the Mumbai employees whose needs
are to get a home
cooked meal respecting their culture and tastes.
Logistics service organised
in the informal sector
without any policy measure.
Co-operative movement
whose basic entity is the
Dabbawala.
The main cost items are wages, rail passes and rail
freight charges.
Each is charged between Rs. 400 to Rs. 700 per tiffin
per month for the service depending on customer
requirements, transport distances and economic conditions of the customer. Customised offerings
(larger lunch box, special diet requirements, etc.) are
charged separately.
n.a.
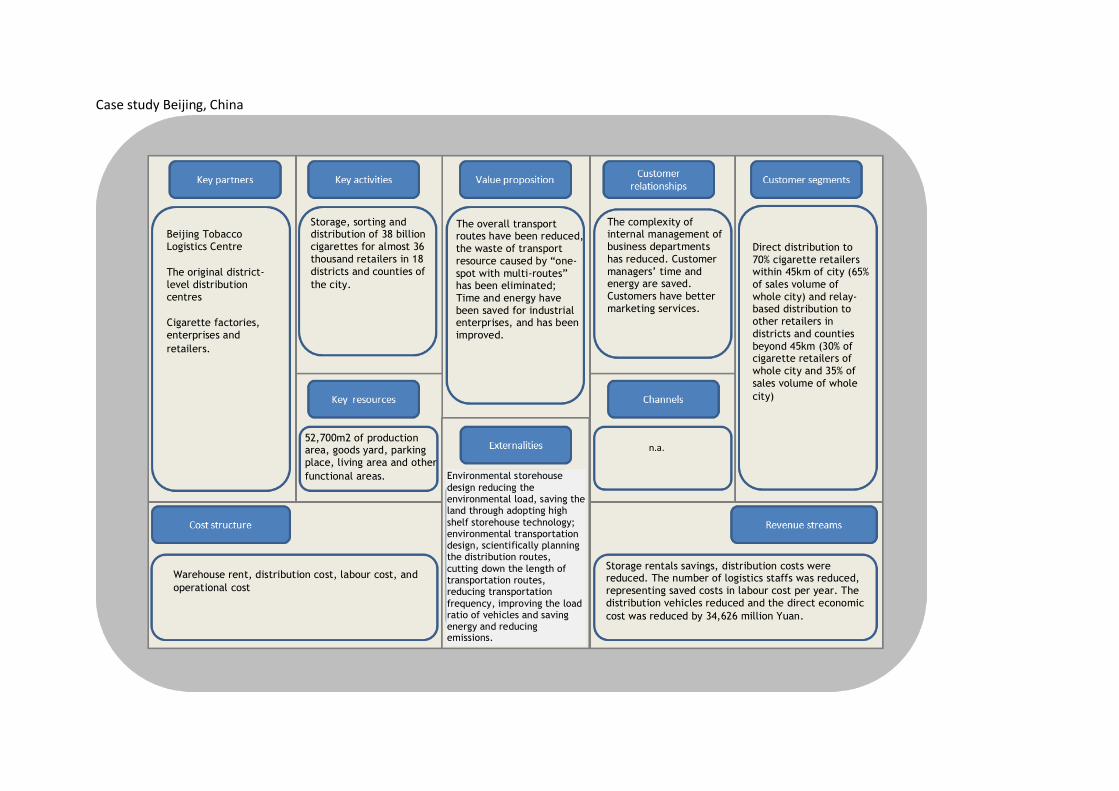
Case study Beijing, China
Food suppliers (family members of clients, canteens/catering services)
Employees of dabbawala system
Railway services
Product manufactures, service providers, retailers
Beijing Tobacco
Logistics Centre
The original district-
level distribution
centres
Cigarette factories,
enterprises and
retailers.
Storage, sorting and distribution of 38 billion
cigarettes for almost 36
thousand retailers in 18
districts and counties of
the city.
52,700m2 of production area, goods yard, parking
place, living area and other
functional areas.
The overall transport routes have been reduced,
the waste of transport
resource caused by “one-
spot with multi-routes” has been eliminated;
Time and energy have
been saved for industrial enterprises, and has been
improved.
The complexity of internal management of
business departments
has reduced. Customer
managers‟ time and energy are saved.
Customers have better
marketing services.
Direct distribution to
70% cigarette retailers within 45km of city (65%
of sales volume of
whole city) and relay-based distribution to
other retailers in
districts and counties
beyond 45km (30% of cigarette retailers of
whole city and 35% of
sales volume of whole
city)
Storage rentals savings, distribution costs were reduced. The number of logistics staffs was reduced,
representing saved costs in labour cost per year. The
distribution vehicles reduced and the direct economic
cost was reduced by 34,626 million Yuan.
Warehouse rent, distribution cost, labour cost, and
operational cost
n.a.
Environmental storehouse
design reducing the environmental load, saving the land through adopting high
shelf storehouse technology; environmental transportation design, scientifically planning the distribution routes,
cutting down the length of transportation routes, reducing transportation
frequency, improving the load ratio of vehicles and saving energy and reducing emissions.
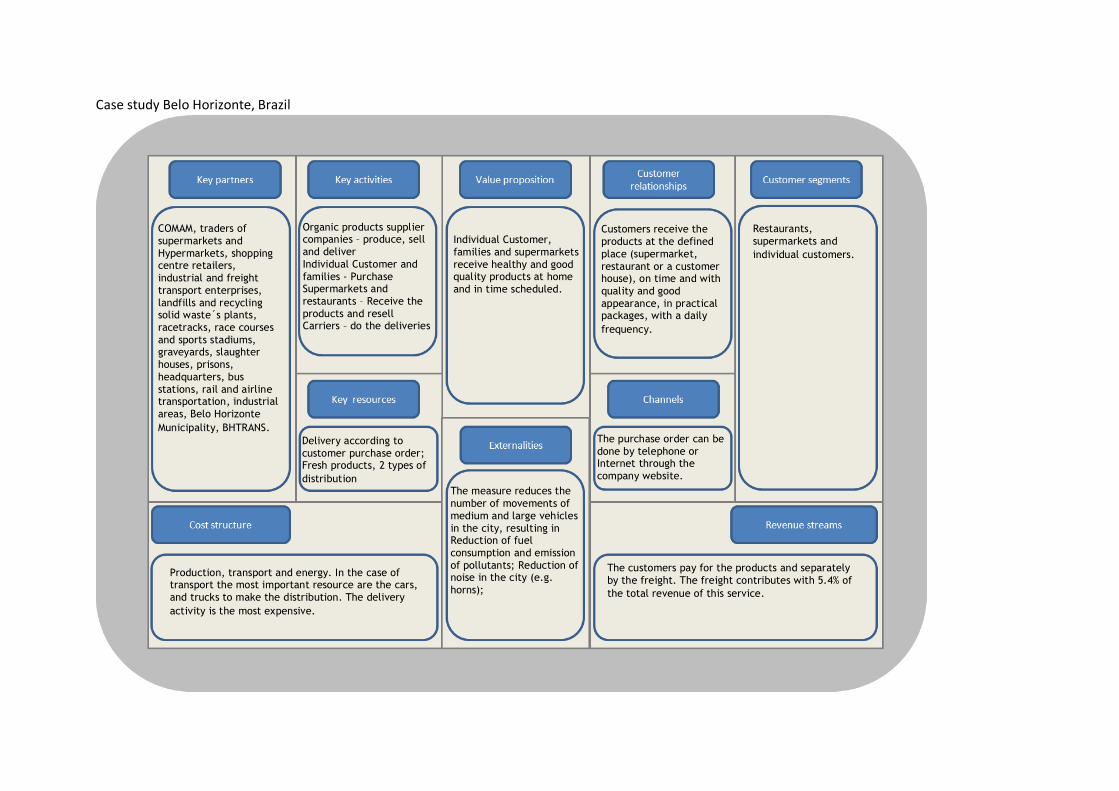
Case study Belo Horizonte, Brazil
COMAM, traders of
supermarkets and
Hypermarkets, shopping centre retailers,
industrial and freight
transport enterprises,
landfills and recycling solid waste´s plants,
racetracks, race courses
and sports stadiums, graveyards, slaughter
houses, prisons,
headquarters, bus
stations, rail and airline transportation, industrial
areas, Belo Horizonte
Municipality, BHTRANS.
Organic products supplier companies – produce, sell
and deliver
Individual Customer and
families - Purchase Supermarkets and
restaurants – Receive the
products and resell Carriers – do the deliveries
Delivery according to
customer purchase order; Fresh products, 2 types of
distribution
Individual Customer,
families and supermarkets
receive healthy and good quality products at home
and in time scheduled.
Customers receive the
products at the defined
place (supermarket,
restaurant or a customer house), on time and with
quality and good
appearance, in practical packages, with a daily
frequency.
The purchase order can be
done by telephone or Internet through the
company website.
Restaurants,
supermarkets and
individual customers.
The customers pay for the products and separately
by the freight. The freight contributes with 5.4% of
the total revenue of this service.
Production, transport and energy. In the case of transport the most important resource are the cars,
and trucks to make the distribution. The delivery
activity is the most expensive.
The measure reduces the
number of movements of
medium and large vehicles
in the city, resulting in Reduction of fuel
consumption and emission
of pollutants; Reduction of noise in the city (e.g.
horns);
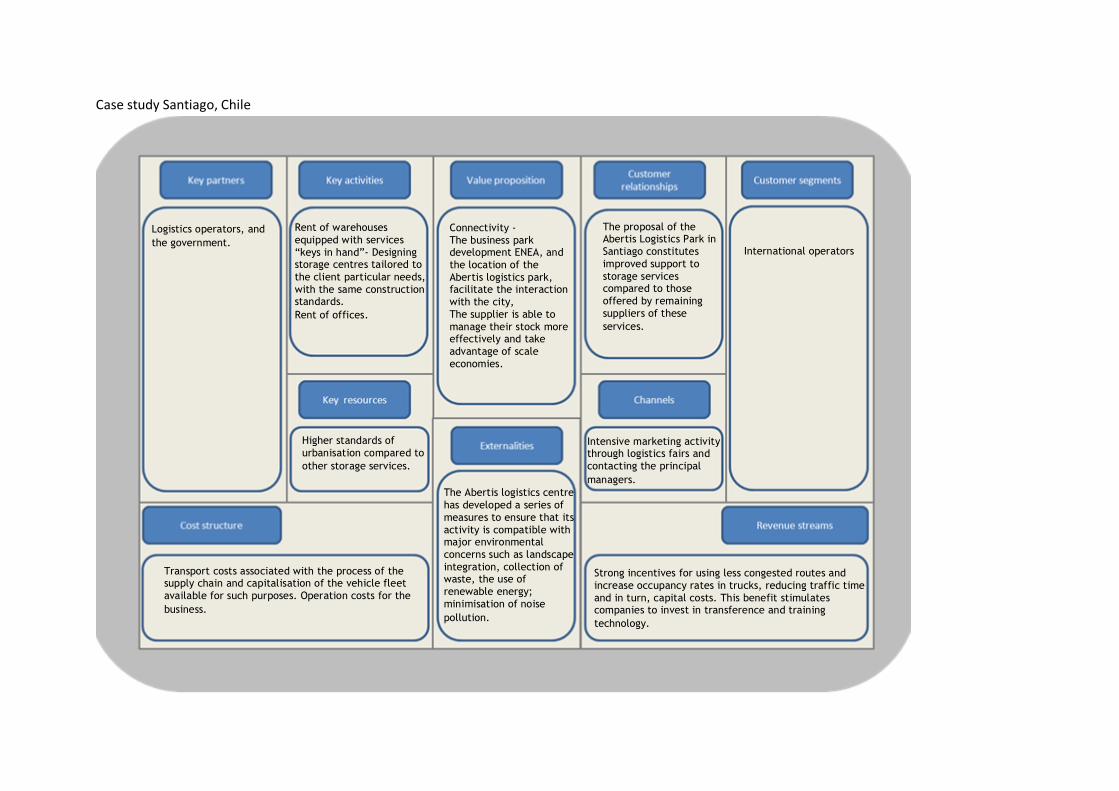
Case study Santiago, Chile
Logistics operators, and
the government.
Rent of warehouses
equipped with services
“keys in hand”- Designing storage centres tailored to
the client particular needs,
with the same construction standards.
Rent of offices.
Higher standards of
urbanisation compared to
other storage services.
Connectivity -
The business park development ENEA, and
the location of the
Abertis logistics park, facilitate the interaction
with the city,
The supplier is able to
manage their stock more effectively and take
advantage of scale
economies.
The proposal of the Abertis Logistics Park in
Santiago constitutes
improved support to
storage services compared to those
offered by remaining
suppliers of these
services.
Intensive marketing activity through logistics fairs and
contacting the principal
managers.
International operators
Strong incentives for using less congested routes and
increase occupancy rates in trucks, reducing traffic time
and in turn, capital costs. This benefit stimulates companies to invest in transference and training
technology.
Transport costs associated with the process of the supply chain and capitalisation of the vehicle fleet
available for such purposes. Operation costs for the
business.
The Abertis logistics centre
has developed a series of
measures to ensure that its
activity is compatible with major environmental
concerns such as landscape
integration, collection of waste, the use of
renewable energy;
minimisation of noise
pollution.
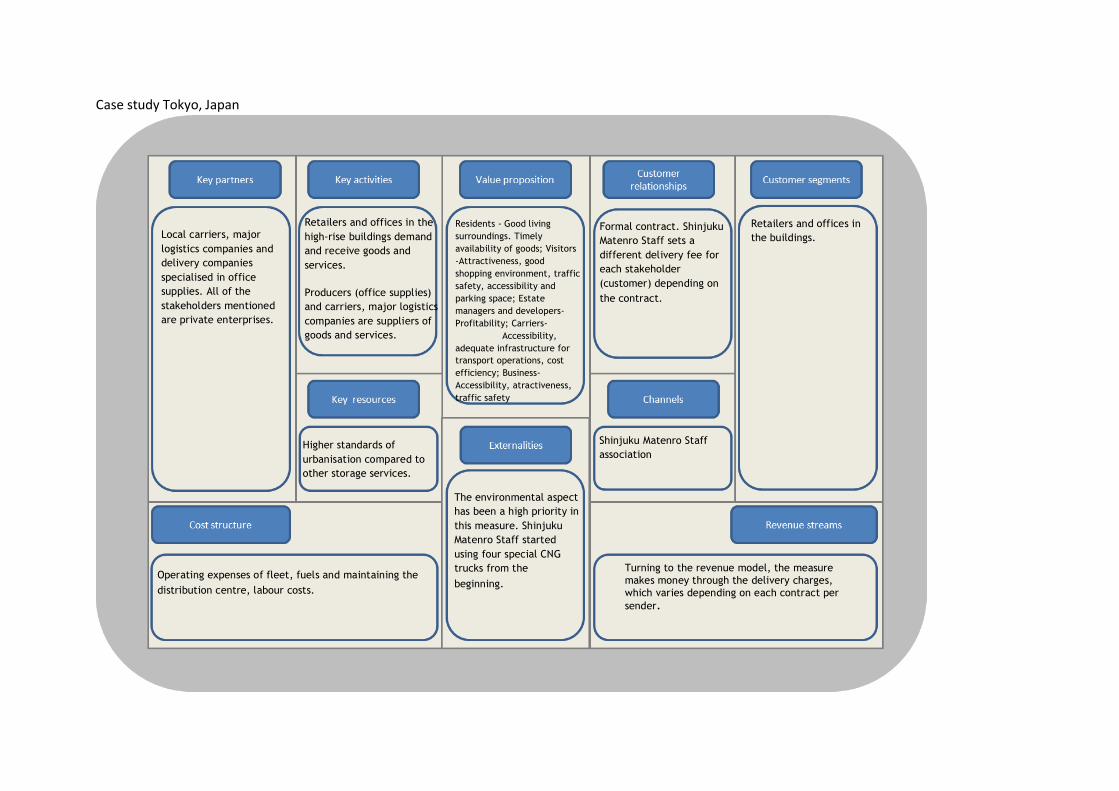
Case study Tokyo, Japan
Local carriers, major
logistics companies and
delivery companies
specialised in office
supplies. All of the
stakeholders mentioned
are private enterprises.
Retailers and offices in the
high-rise buildings demand
and receive goods and
services.
Producers (office supplies)
and carriers, major logistics
companies are suppliers of
goods and services.
Higher standards of
urbanisation compared to
other storage services.
Residents - Good living
surroundings. Timely
availability of goods; Visitors
-Attractiveness, good
shopping environment, traffic
safety, accessibility and
parking space; Estate
managers and developers-
Profitability; Carriers-
Accessibility,
adequate infrastructure for
transport operations, cost
efficiency; Business-
Accessibility, atractiveness,
traffic safety
Formal contract. Shinjuku
Matenro Staff sets a
different delivery fee for
each stakeholder
(customer) depending on
the contract.
Shinjuku Matenro Staff
association
Retailers and offices in
the buildings.
Turning to the revenue model, the measure
makes money through the delivery charges,
which varies depending on each contract per
sender.
Operating expenses of fleet, fuels and maintaining the
distribution centre, labour costs.
The environmental aspect
has been a high priority in
this measure. Shinjuku
Matenro Staff started
using four special CNG
trucks from the
beginning.
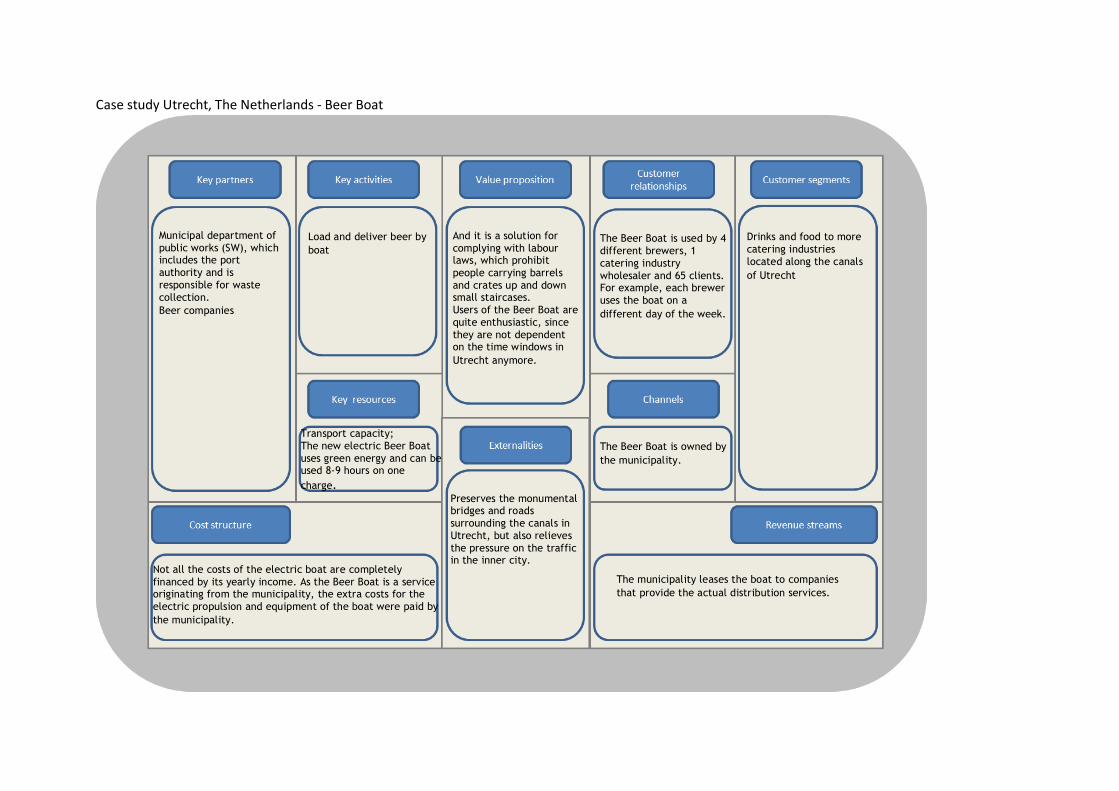
Case study Utrecht, The Netherlands - Beer Boat
Municipal department of
public works (SW), which includes the port
authority and is
responsible for waste
collection.
Beer companies
Load and deliver beer by
boat
Transport capacity;
The new electric Beer Boat
uses green energy and can be used 8-9 hours on one
charge.
And it is a solution for
complying with labour laws, which prohibit
people carrying barrels
and crates up and down small staircases.
Users of the Beer Boat are
quite enthusiastic, since
they are not dependent on the time windows in
Utrecht anymore.
The Beer Boat is used by 4
different brewers, 1
catering industry
wholesaler and 65 clients. For example, each brewer
uses the boat on a
different day of the week.
The Beer Boat is owned by
the municipality.
Drinks and food to more
catering industries
located along the canals
of Utrecht
The municipality leases the boat to companies
that provide the actual distribution services.
Not all the costs of the electric boat are completely
financed by its yearly income. As the Beer Boat is a service originating from the municipality, the extra costs for the
electric propulsion and equipment of the boat were paid by
the municipality.
Preserves the monumental bridges and roads
surrounding the canals in
Utrecht, but also relieves
the pressure on the traffic in the inner city.
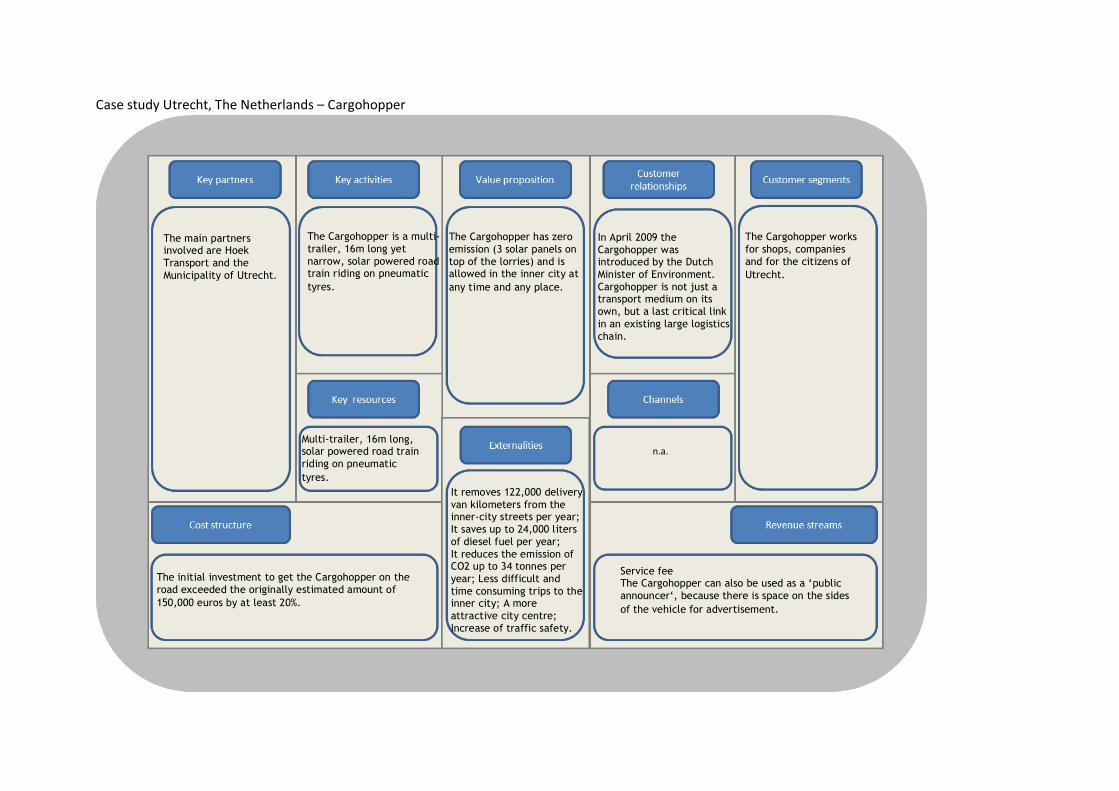
Case study Utrecht, The Netherlands – Cargohopper
The main partners involved are Hoek
Transport and the
Municipality of Utrecht.
The Cargohopper is a multi-
trailer, 16m long yet
narrow, solar powered road train riding on pneumatic
tyres.
Multi-trailer, 16m long, solar powered road train
riding on pneumatic
tyres.
The Cargohopper has zero
emission (3 solar panels on
top of the lorries) and is allowed in the inner city at
any time and any place.
In April 2009 the
Cargohopper was introduced by the Dutch
Minister of Environment.
Cargohopper is not just a transport medium on its
own, but a last critical link
in an existing large logistics
chain.
The Cargohopper works
for shops, companies
and for the citizens of
Utrecht.
Service fee The Cargohopper can also be used as a „public
announcer„, because there is space on the sides
of the vehicle for advertisement.
The initial investment to get the Cargohopper on the
road exceeded the originally estimated amount of
150,000 euros by at least 20%.
n.a.
It removes 122,000 delivery
van kilometers from the inner-city streets per year;
It saves up to 24,000 liters
of diesel fuel per year;
It reduces the emission of CO2 up to 34 tonnes per
year; Less difficult and
time consuming trips to the inner city; A more
attractive city centre;
Increase of traffic safety.

Case study Paris – Chronopost
Chronopost
Municipality of Paris
Other stakeholders
involved:
Fire brigade and a
national body in charge of police enforcement
Electricity distribution
company of France
Ademe (French
Environment and Energy Management Agency)
Express deliveries in the 7th
and 8th boroughs of Paris.
57% of them are deliveries
and 43% are pick-ups.
Provides transhipment
facilities within the city
walls, the Urban
Logistics Spaces (ULS).
It has a hub outside of
Paris and it uses a fleet of electric vehicles for
the final deliveries.
Concorde ULS gives
Chronopost the advantage of being very close to its
clients (city centre).
B2B and B2C. Publicity of Chronocity and electric
vehicles provide a good
image to public.
High density commercial
areas customer with express deliveries of
parcels up to 30kg and
pick up.
1,9
0 m
1,9
0 m
The balance between additional costs and savings
was null. 41.000 km/year of fuel powered vehicles are saved by using electric vehicles. The average gain
for private car parking space location is 80€/m²/year
in Paris.
Chronopost has invested €500,000 in the logistic facility,
including civil work. The City of Paris decided to rent the underground logistic facility at the regional average
price of logistics facilities.
No wasted time in
congestion; decrease of emissions by 16.6 tonnes;
Over one year of activity,
local emissions of NOx had
decreased; The use of electrical vehicles have an
impact on noise emissions
in the city.
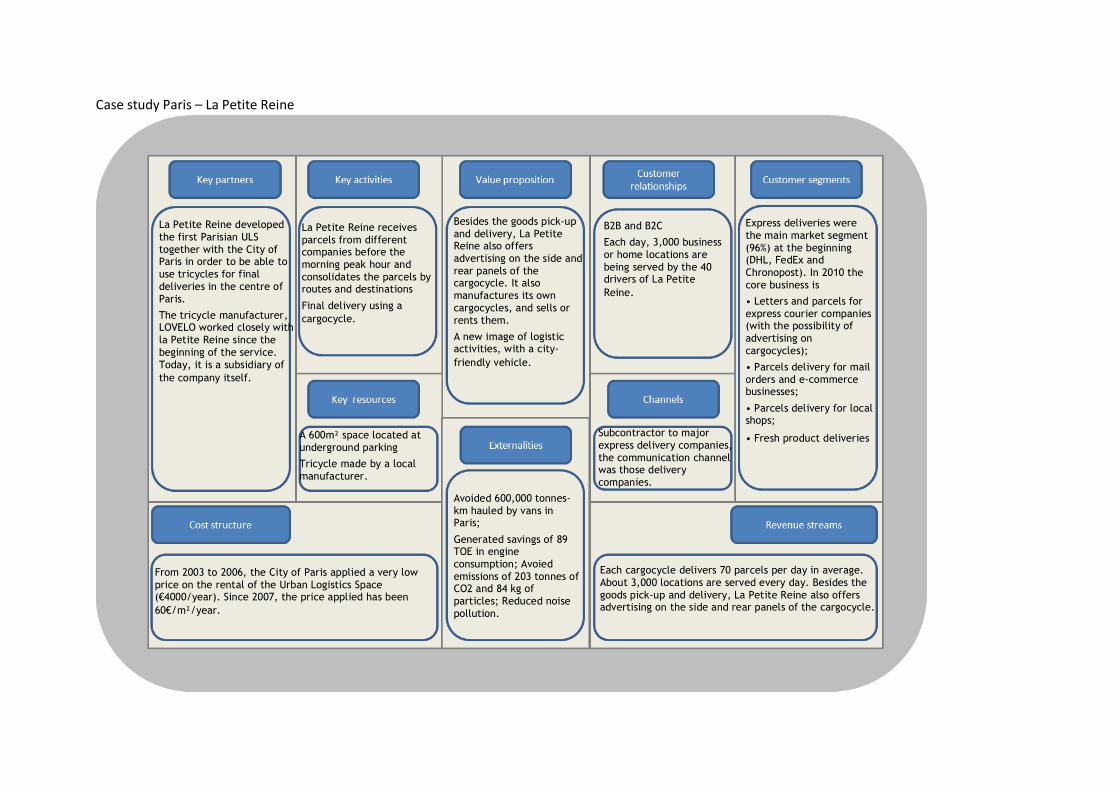
Case study Paris – La Petite Reine
La Petite Reine developed
the first Parisian ULS
together with the City of Paris in order to be able to
use tricycles for final
deliveries in the centre of
Paris.
The tricycle manufacturer, LOVELO worked closely with
la Petite Reine since the
beginning of the service.
Today, it is a subsidiary of
the company itself.
La Petite Reine receives
parcels from different companies before the
morning peak hour and
consolidates the parcels by routes and destinations
Final delivery using a
cargocycle.
A 600m² space located at
underground parking
Tricycle made by a local
manufacturer.
Besides the goods pick-up
and delivery, La Petite Reine also offers
advertising on the side and
rear panels of the cargocycle. It also
manufactures its own
cargocycles, and sells or
rents them.
A new image of logistic activities, with a city-
friendly vehicle.
B2B and B2C
Each day, 3,000 business
or home locations are
being served by the 40 drivers of La Petite
Reine.
Subcontractor to major
express delivery companies,
the communication channel was those delivery
companies.
Express deliveries were
the main market segment
(96%) at the beginning (DHL, FedEx and
Chronopost). In 2010 the
core business is
• Letters and parcels for
express courier companies (with the possibility of
advertising on
cargocycles);
• Parcels delivery for mail
orders and e-commerce businesses;
• Parcels delivery for local shops;
• Fresh product deliveries
Each cargocycle delivers 70 parcels per day in average.
About 3,000 locations are served every day. Besides the
goods pick-up and delivery, La Petite Reine also offers advertising on the side and rear panels of the cargocycle.
From 2003 to 2006, the City of Paris applied a very low
price on the rental of the Urban Logistics Space (€4000/year). Since 2007, the price applied has been
60€/m²/year.
Avoided 600,000 tonnes-
km hauled by vans in Paris;
Generated savings of 89 TOE in engine
consumption; Avoied
emissions of 203 tonnes of CO2 and 84 kg of
particles; Reduced noise
pollution.
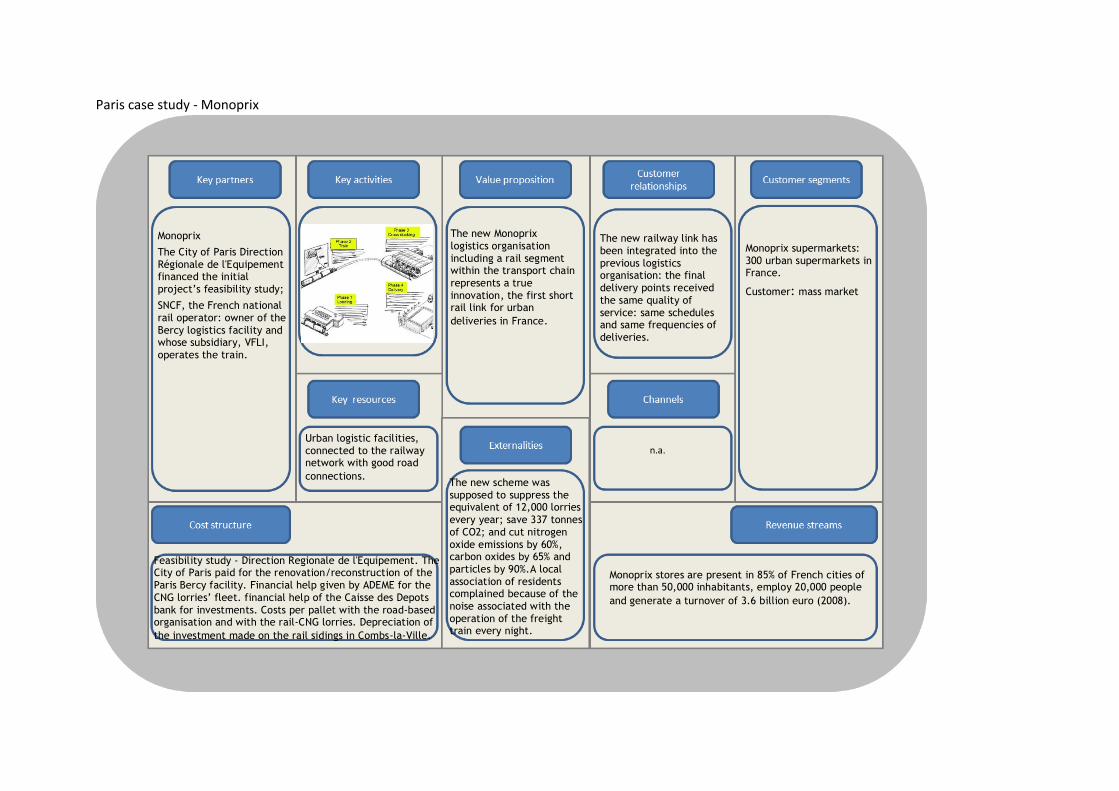
Paris case study - Monoprix
Monoprix
The City of Paris Direction
Régionale de l'Equipement financed the initial
project‟s feasibility study;
SNCF, the French national
rail operator: owner of the
Bercy logistics facility and whose subsidiary, VFLI,
operates the train.
Urban logistic facilities,
connected to the railway network with good road
connections.
The new Monoprix
logistics organisation
including a rail segment within the transport chain
represents a true
innovation, the first short rail link for urban
deliveries in France.
The new railway link has
been integrated into the
previous logistics organisation: the final
delivery points received
the same quality of
service: same schedules and same frequencies of
deliveries.
Monoprix supermarkets:
300 urban supermarkets in France.
Customer: mass market
Monoprix stores are present in 85% of French cities of more than 50,000 inhabitants, employ 20,000 people
and generate a turnover of 3.6 billion euro (2008).
Feasibility study - Direction Regionale de l'Equipement. The City of Paris paid for the renovation/reconstruction of the
Paris Bercy facility. Financial help given by ADEME for the
CNG lorries‟ fleet. financial help of the Caisse des Depots
bank for investments. Costs per pallet with the road-based organisation and with the rail-CNG lorries. Depreciation of
the investment made on the rail sidings in Combs-la-Ville.
The new scheme was
supposed to suppress the equivalent of 12,000 lorries
every year; save 337 tonnes
of CO2; and cut nitrogen
oxide emissions by 60%, carbon oxides by 65% and
particles by 90%.A local
association of residents complained because of the
noise associated with the
operation of the freight train every night.
n.a.
TURBLOG D2: Business Concepts and Models for Urban Logistics
8.3 ANNEX C
Logistic profile identification of each case study
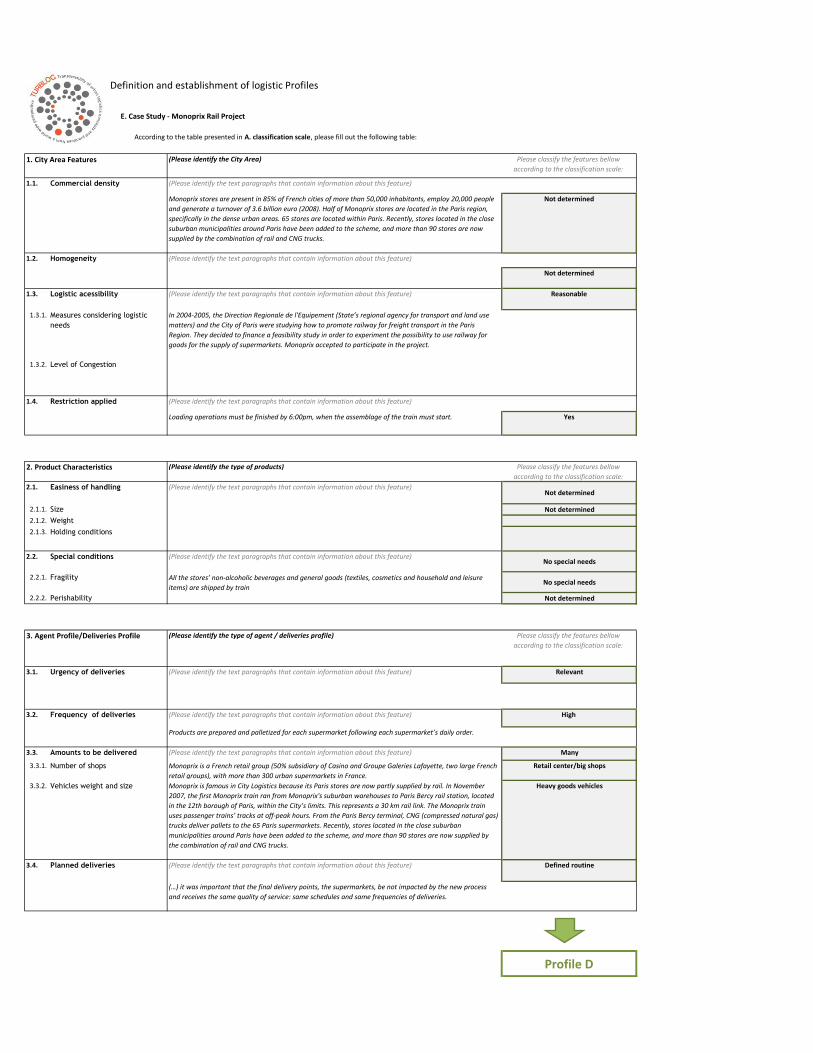
(Please identify the City Area)
1.1. Commercial density (Please identify the text paragraphs that contain information about this feature)
Monoprix stores are present in 85% of French cities of more than 50,000 inhabitants, employ 20,000 people
and generate a turnover of 3.6 billion euro (2008). Half of Monoprix stores are located in the Paris region,
specifically in the dense urban areas. 65 stores are located within Paris. Recently, stores located in the close
suburban municipalities around Paris have been added to the scheme, and more than 90 stores are now
supplied by the combination of rail and CNG trucks.
Not determined
1.2. Homogeneity (Please identify the text paragraphs that contain information about this feature)
Not determined
1.3. Logistic acessibility (Please identify the text paragraphs that contain information about this feature) Reasonable
1.3.1. Measures considering logistic
needs
In 2004-2005, the Direction Regionale de l'Equipement (State’s regional agency for transport and land use
matters) and the City of Paris were studying how to promote railway for freight transport in the Paris
Region. They decided to finance a feasibility study in order to experiment the possibility to use railway for
goods for the supply of supermarkets. Monoprix accepted to participate in the project.
1.3.2. Level of Congestion
1.4. Restriction applied (Please identify the text paragraphs that contain information about this feature)
Loading operations must be finished by 6:00pm, when the assemblage of the train must start. Yes
(Please identify the type of products)
2.1. Easiness of handling (Please identify the text paragraphs that contain information about this feature)Not determined
2.1.1. Size Not determined
2.1.2. Weight
2.1.3. Holding conditions
2.2. Special conditions (Please identify the text paragraphs that contain information about this feature)No special needs
2.2.1. Fragility All the stores’ non-alcoholic beverages and general goods (textiles, cosmetics and household and leisure
items) are shipped by trainNo special needs
2.2.2. Perishability Not determined
(Please identify the type of agent / deliveries profile)
3.1. Urgency of deliveries (Please identify the text paragraphs that contain information about this feature) Relevant
3.2. Frequency of deliveries (Please identify the text paragraphs that contain information about this feature) High
Products are prepared and palletized for each supermarket following each supermarket’s daily order.
3.3. Amounts to be delivered (Please identify the text paragraphs that contain information about this feature) Many
3.3.1. Number of shops Monoprix is a French retail group (50% subsidiary of Casino and Groupe Galeries Lafayette, two large French
retail groups), with more than 300 urban supermarkets in France.
Retail center/big shops
3.3.2. Vehicles weight and size Monoprix is famous in City Logistics because its Paris stores are now partly supplied by rail. In November
2007, the first Monoprix train ran from Monoprix's suburban warehouses to Paris Bercy rail station, located
in the 12th borough of Paris, within the City’s limits. This represents a 30 km rail link. The Monoprix train
uses passenger trains’ tracks at off-peak hours. From the Paris Bercy terminal, CNG (compressed natural gas)
trucks deliver pallets to the 65 Paris supermarkets. Recently, stores located in the close suburban
municipalities around Paris have been added to the scheme, and more than 90 stores are now supplied by
the combination of rail and CNG trucks.
Heavy goods vehicles
3.4. Planned deliveries (Please identify the text paragraphs that contain information about this feature) Defined routine
(…) it was important that the final delivery points, the supermarkets, be not impacted by the new process
and receives the same quality of service: same schedules and same frequencies of deliveries.
Profile D
3. Agent Profile/Deliveries Profile Please classify the features bellow
according to the classification scale:
According to the table presented in A. classification scale, please fill out the following table:
1. City Area Features Please classify the features bellow
according to the classification scale:
2. Product Characteristics Please classify the features bellow
according to the classification scale:
E. Case Study - Monoprix Rail Project
Definition and establishment of logistic Profiles
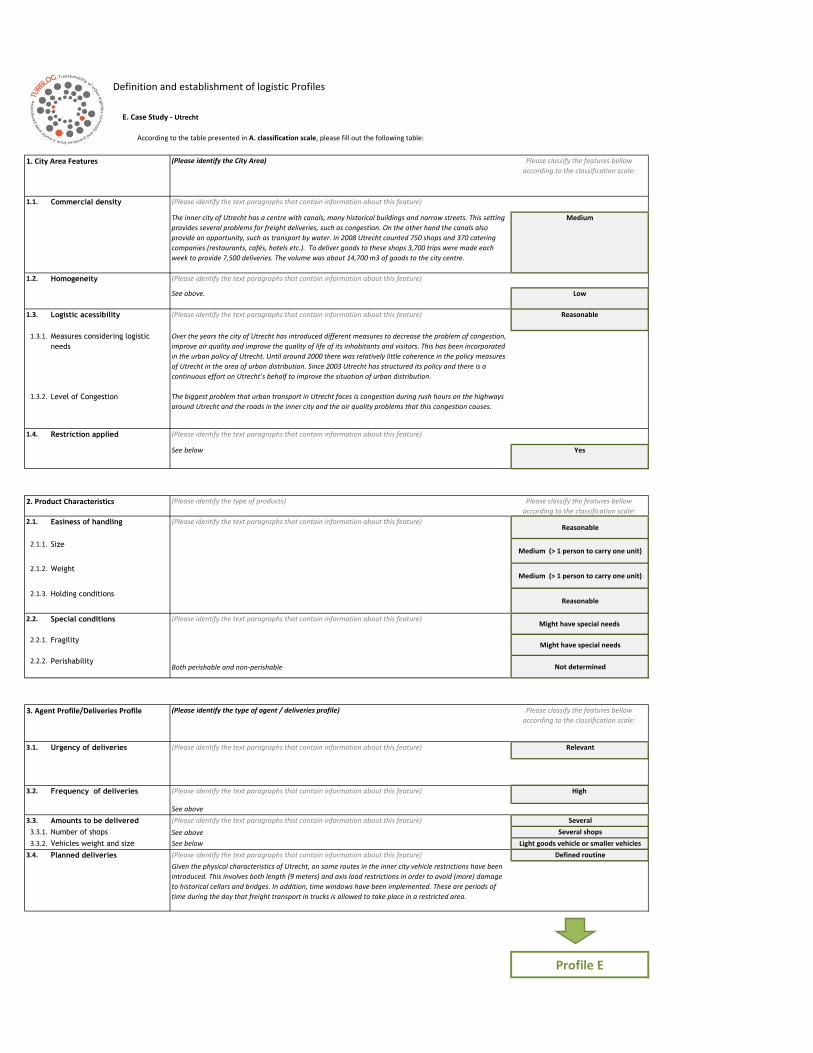
(Please identify the City Area)
1.1. Commercial density (Please identify the text paragraphs that contain information about this feature)
The inner city of Utrecht has a centre with canals, many historical buildings and narrow streets. This setting
provides several problems for freight deliveries, such as congestion. On the other hand the canals also
provide an opportunity, such as transport by water. In 2008 Utrecht counted 750 shops and 370 catering
companies (restaurants, cafés, hotels etc.). To deliver goods to these shops 3,700 trips were made each
week to provide 7,500 deliveries. The volume was about 14,700 m3 of goods to the city centre.
Medium
1.2. Homogeneity (Please identify the text paragraphs that contain information about this feature)
See above. Low
1.3. Logistic acessibility (Please identify the text paragraphs that contain information about this feature) Reasonable
1.3.1. Measures considering logistic
needs
Over the years the city of Utrecht has introduced different measures to decrease the problem of congestion,
improve air quality and improve the quality of life of its inhabitants and visitors. This has been incorporated
in the urban policy of Utrecht. Until around 2000 there was relatively little coherence in the policy measures
of Utrecht in the area of urban distribution. Since 2003 Utrecht has structured its policy and there is a
continuous effort on Utrecht’s behalf to improve the situation of urban distribution.
1.3.2. Level of Congestion The biggest problem that urban transport in Utrecht faces is congestion during rush hours on the highways
around Utrecht and the roads in the inner city and the air quality problems that this congestion causes.
1.4. Restriction applied (Please identify the text paragraphs that contain information about this feature)
See below Yes
(Please identify the type of products)
2.1. Easiness of handling (Please identify the text paragraphs that contain information about this feature)Reasonable
2.1.1. Size Medium (> 1 person to carry one unit)
2.1.2. WeightMedium (> 1 person to carry one unit)
2.1.3. Holding conditionsReasonable
2.2. Special conditions (Please identify the text paragraphs that contain information about this feature)Might have special needs
2.2.1. FragilityMight have special needs
2.2.2. PerishabilityBoth perishable and non-perishable Not determined
(Please identify the type of agent / deliveries profile)
3.1. Urgency of deliveries (Please identify the text paragraphs that contain information about this feature) Relevant
3.2. Frequency of deliveries (Please identify the text paragraphs that contain information about this feature) High
See above
3.3. Amounts to be delivered (Please identify the text paragraphs that contain information about this feature) Several
3.3.1. Number of shops See above Several shops
3.3.2. Vehicles weight and size See below Light goods vehicle or smaller vehicles
3.4. Planned deliveries (Please identify the text paragraphs that contain information about this feature) Defined routine
Given the physical characteristics of Utrecht, on some routes in the inner city vehicle restrictions have been
introduced. This involves both length (9 meters) and axis load restrictions in order to avoid (more) damage
to historical cellars and bridges. In addition, time windows have been implemented. These are periods of
time during the day that freight transport in trucks is allowed to take place in a restricted area.
Profile E
3. Agent Profile/Deliveries Profile Please classify the features bellow
according to the classification scale:
According to the table presented in A. classification scale, please fill out the following table:
1. City Area Features Please classify the features bellow
according to the classification scale:
2. Product Characteristics Please classify the features bellow
according to the classification scale:
Definition and establishment of logistic Profiles
E. Case Study - Utrecht
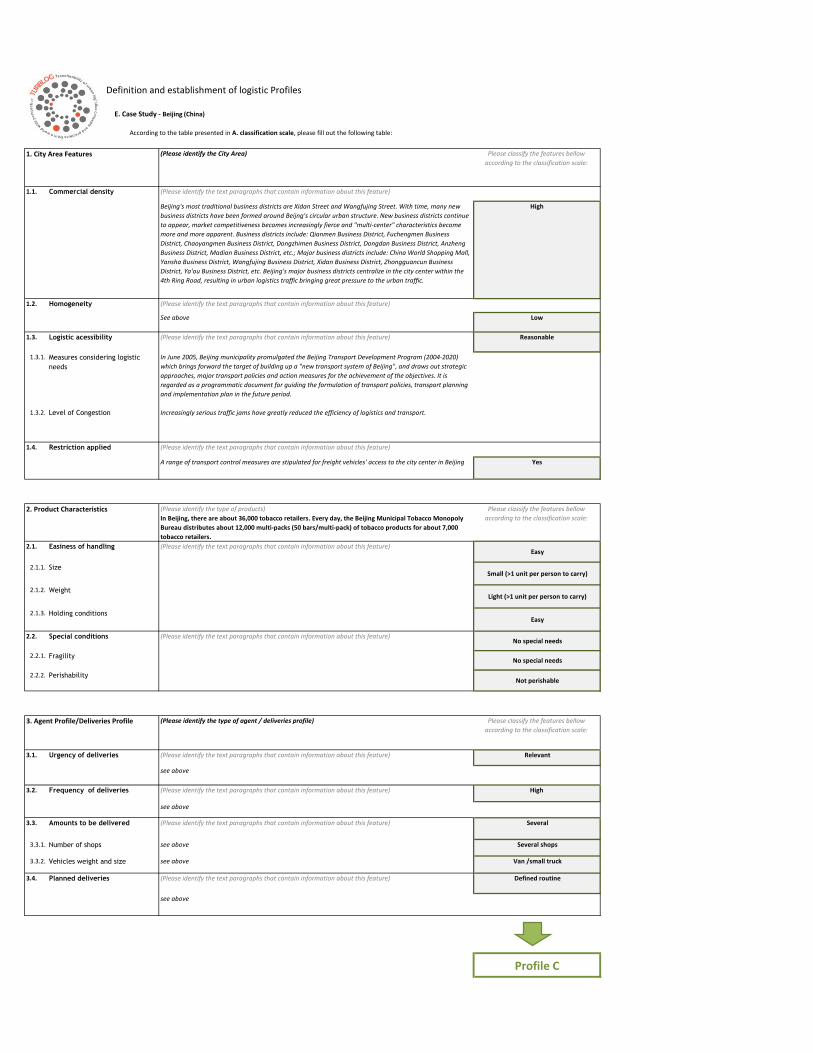
(Please identify the City Area)
1.1. Commercial density (Please identify the text paragraphs that contain information about this feature)
Beijing's most traditional business districts are Xidan Street and Wangfujing Street. With time, many new
business districts have been formed around Beijng's circular urban structure. New business districts continue
to appear, market competitiveness becomes increasingly fierce and "multi-center" characteristics become
more and more apparent. Business districts include: Qianmen Business District, Fuchengmen Business
District, Chaoyangmen Business District, Dongzhimen Business District, Dongdan Business District, Anzheng
Business District, Madian Business District, etc.; Major business districts include: China World Shopping Mall,
Yansha Business District, Wangfujing Business District, Xidan Business District, Zhongguancun Business
District, Ya'ou Business District, etc. Beijing's major business districts centralize in the city center within the
4th Ring Road, resulting in urban logistics traffic bringing great pressure to the urban traffic.
High
1.2. Homogeneity (Please identify the text paragraphs that contain information about this feature)
See above Low
1.3. Logistic acessibility (Please identify the text paragraphs that contain information about this feature) Reasonable
1.3.1. Measures considering logistic
needs
In June 2005, Beijing municipality promulgated the Beijing Transport Development Program (2004-2020)
which brings forward the target of building up a "new transport system of Beijing", and draws out strategic
approaches, major transport policies and action measures for the achievement of the objectives. It is
regarded as a programmatic document for guiding the formulation of transport policies, transport planning
and implementation plan in the future period.
1.3.2. Level of Congestion Increasingly serious traffic jams have greatly reduced the efficiency of logistics and transport.
1.4. Restriction applied (Please identify the text paragraphs that contain information about this feature)
A range of transport control measures are stipulated for freight vehicles' access to the city center in Beijing Yes
(Please identify the type of products)
In Beijing, there are about 36,000 tobacco retailers. Every day, the Beijing Municipal Tobacco Monopoly
Bureau distributes about 12,000 multi-packs (50 bars/multi-pack) of tobacco products for about 7,000
tobacco retailers.
2.1. Easiness of handling (Please identify the text paragraphs that contain information about this feature)Easy
2.1.1. Size Small (>1 unit per person to carry)
2.1.2. WeightLight (>1 unit per person to carry)
2.1.3. Holding conditionsEasy
2.2. Special conditions (Please identify the text paragraphs that contain information about this feature)No special needs
2.2.1. FragilityNo special needs
2.2.2. PerishabilityNot perishable
(Please identify the type of agent / deliveries profile)
3.1. Urgency of deliveries (Please identify the text paragraphs that contain information about this feature) Relevant
see above
3.2. Frequency of deliveries (Please identify the text paragraphs that contain information about this feature) High
see above
3.3. Amounts to be delivered (Please identify the text paragraphs that contain information about this feature) Several
3.3.1. Number of shops see above Several shops
3.3.2. Vehicles weight and size see above Van /small truck
3.4. Planned deliveries (Please identify the text paragraphs that contain information about this feature) Defined routine
see above
Profile C
3. Agent Profile/Deliveries Profile Please classify the features bellow
according to the classification scale:
According to the table presented in A. classification scale, please fill out the following table:
1. City Area Features Please classify the features bellow
according to the classification scale:
2. Product Characteristics Please classify the features bellow
according to the classification scale:
E. Case Study - Beijing (China)
Definition and establishment of logistic Profiles
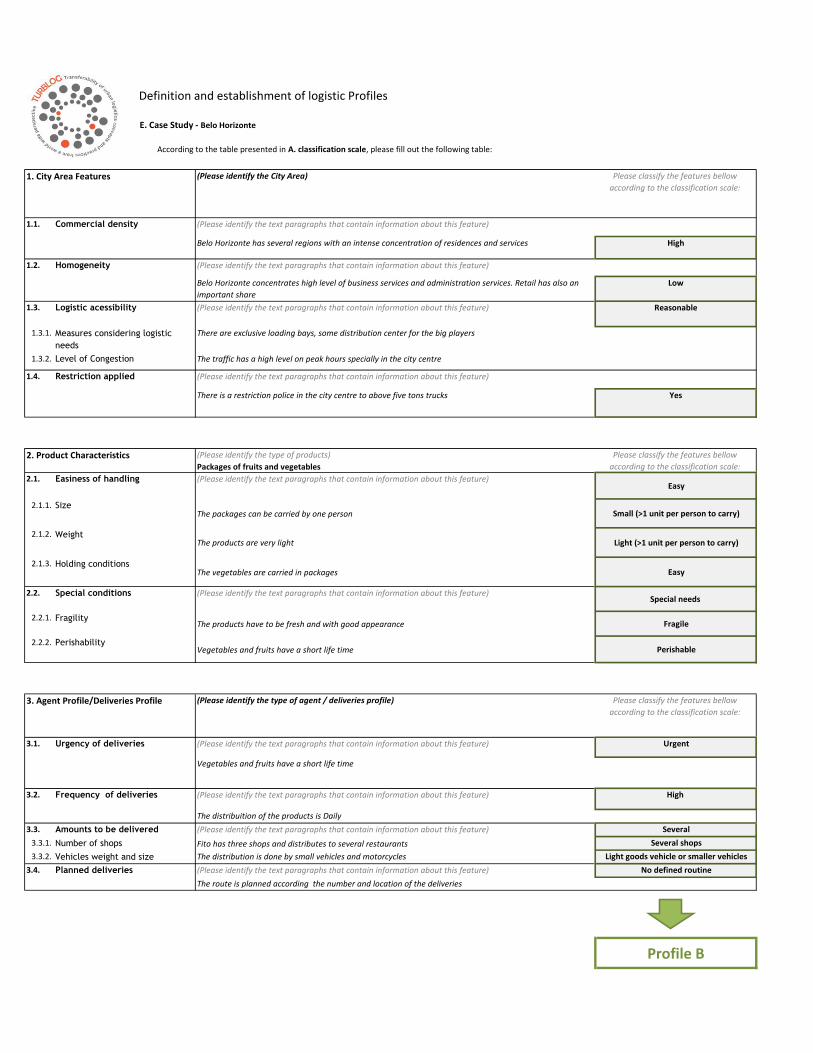
(Please identify the City Area)
1.1. Commercial density (Please identify the text paragraphs that contain information about this feature)
Belo Horizonte has several regions with an intense concentration of residences and services High
1.2. Homogeneity (Please identify the text paragraphs that contain information about this feature)
Belo Horizonte concentrates high level of business services and administration services. Retail has also an
important share
Low
1.3. Logistic acessibility (Please identify the text paragraphs that contain information about this feature) Reasonable
1.3.1. Measures considering logistic
needs
There are exclusive loading bays, some distribution center for the big players
1.3.2. Level of Congestion The traffic has a high level on peak hours specially in the city centre
1.4. Restriction applied (Please identify the text paragraphs that contain information about this feature)
There is a restriction police in the city centre to above five tons trucks Yes
(Please identify the type of products)
Packages of fruits and vegetables
2.1. Easiness of handling (Please identify the text paragraphs that contain information about this feature)Easy
2.1.1. Size The packages can be carried by one person Small (>1 unit per person to carry)
2.1.2. WeightThe products are very light Light (>1 unit per person to carry)
2.1.3. Holding conditionsThe vegetables are carried in packages Easy
2.2. Special conditions (Please identify the text paragraphs that contain information about this feature)Special needs
2.2.1. FragilityThe products have to be fresh and with good appearance Fragile
2.2.2. PerishabilityVegetables and fruits have a short life time Perishable
(Please identify the type of agent / deliveries profile)
3.1. Urgency of deliveries (Please identify the text paragraphs that contain information about this feature) Urgent
Vegetables and fruits have a short life time
3.2. Frequency of deliveries (Please identify the text paragraphs that contain information about this feature) High
The distribuition of the products is Daily
3.3. Amounts to be delivered (Please identify the text paragraphs that contain information about this feature) Several
3.3.1. Number of shops Fito has three shops and distributes to several restaurants Several shops
3.3.2. Vehicles weight and size The distribution is done by small vehicles and motorcycles Light goods vehicle or smaller vehicles
3.4. Planned deliveries (Please identify the text paragraphs that contain information about this feature) No defined routine
The route is planned according the number and location of the deliveries
Profile B
3. Agent Profile/Deliveries Profile Please classify the features bellow
according to the classification scale:
According to the table presented in A. classification scale, please fill out the following table:
1. City Area Features Please classify the features bellow
according to the classification scale:
2. Product Characteristics Please classify the features bellow
according to the classification scale:
E. Case Study - Belo Horizonte
Definition and establishment of logistic Profiles
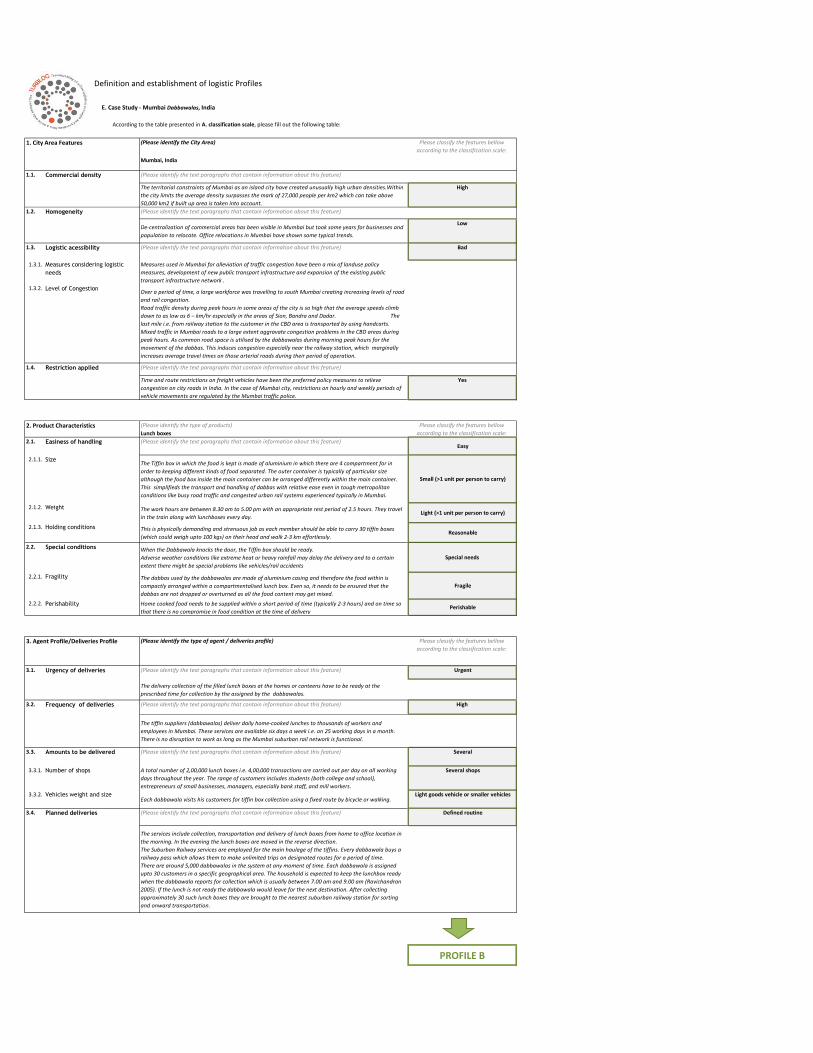
(Please identify the City Area)
Mumbai, India
1.1. Commercial density (Please identify the text paragraphs that contain information about this feature)
The territorial constraints of Mumbai as an island city have created unusually high urban densities.Within
the city limits the average density surpasses the mark of 27,000 people per km2 which can take above
50,000 km2 if built up area is taken into account.
High
1.2. Homogeneity (Please identify the text paragraphs that contain information about this feature)
De-centralization of commercial areas has been visible in Mumbai but took some years for businesses and
population to relocate. Office relocations in Mumbai have shown some typical trends.
Low
1.3. Logistic acessibility (Please identify the text paragraphs that contain information about this feature) Bad
1.3.1. Measures considering logistic
needs
Measures used in Mumbai for alleviation of traffic congestion have been a mix of landuse policy
measures, development of new public transport infrastructure and expansion of the existing public
transport infrastructure network .
1.3.2. Level of CongestionOver a period of time, a large workforce was travelling to south Mumbai creating increasing levels of road
and rail congestion.
Road traffic density during peak hours in some areas of the city is so high that the average speeds climb
down to as low as 6 – km/hr especially in the areas of Sion, Bandra and Dadar. The
last mile i.e. from railway station to the customer in the CBD area is transported by using handcarts.
Mixed traffic in Mumbai roads to a large extent aggravate congestion problems in the CBD areas during
peak hours. As common road space is utilised by the dabbawalas during morning peak hours for the
movement of the dabbas. This induces congestion especially near the railway station, which marginally
increases average travel times on those arterial roads during their period of operation.
1.4. Restriction applied (Please identify the text paragraphs that contain information about this feature)
Time and route restrictions on freight vehicles have been the preferred policy measures to relieve
congestion on city roads in India. In the case of Mumbai city, restrictions on hourly and weekly periods of
vehicle movements are regulated by the Mumbai traffic police.
Yes
(Please identify the type of products)
Lunch boxes
2.1. Easiness of handling (Please identify the text paragraphs that contain information about this feature)Easy
2.1.1. Size The Tiffin box in which the food is kept is made of aluminium in which there are 4 compartment for in
order to keeping different kinds of food separated. The outer container is typically of particular size
although the food box inside the main container can be arranged differently within the main container.
This simplifieds the transport and handling of dabbas with relative ease even in tough metropolitan
conditions like busy road traffic and congested urban rail systems experienced typically in Mumbai.
Small (>1 unit per person to carry)
2.1.2. Weight The work hours are between 8.30 am to 5.00 pm with an appropriate rest period of 2.5 hours. They travel
in the train along with lunchboxes every day. Light (>1 unit per person to carry)
2.1.3. Holding conditions This is physically demanding and strenuous job as each member should be able to carry 30 tiffin boxes
(which could weigh upto 100 kgs) on their head and walk 2-3 km effortlessly. Reasonable
2.2. Special conditions When the Dabbawala knocks the door, the Tiffin box should be ready.
Adverse weather conditions like extreme heat or heavy rainfall may delay the delivery and to a certain
extent there might be special problems like vehicles/rail accidents
Special needs
2.2.1. Fragility The dabbas used by the dabbawalas are made of aluminium casing and therefore the food within is
compactly arranged within a compartmentalised lunch box. Even so, it needs to be ensured that the
dabbas are not dropped or overturned as all the food content may get mixed.
Fragile
2.2.2. Perishability Home cooked food needs to be supplied within a short period of time (typically 2-3 hours) and on time so
that there is no compromise in food condition at the time of deliveryPerishable
(Please identify the type of agent / deliveries profile)
3.1. Urgency of deliveries (Please identify the text paragraphs that contain information about this feature) Urgent
The delivery collection of the filled lunch boxes at the homes or canteens have to be ready at the
prescribed time for collection by the assigned by the dabbawalas.
3.2. Frequency of deliveries (Please identify the text paragraphs that contain information about this feature) High
The tiffin suppliers (dabbawalas) deliver daily home-cooked lunches to thousands of workers and
employees in Mumbai. These services are available six days a week i.e. on 25 working days in a month.
There is no disruption to work as long as the Mumbai suburban rail network is functional.
3.3. Amounts to be delivered (Please identify the text paragraphs that contain information about this feature) Several
3.3.1. Number of shops A total number of 2,00,000 lunch boxes i.e. 4,00,000 transactions are carried out per day on all working
days throughout the year. The range of customers includes students (both college and school),
entrepreneurs of small businesses, managers, especially bank staff, and mill workers.
Several shops
3.3.2. Vehicles weight and size Each dabbawala visits his customers for tiffin box collection using a fixed route by bicycle or walking.
Light goods vehicle or smaller vehicles
3.4. Planned deliveries (Please identify the text paragraphs that contain information about this feature) Defined routine
The services include collection, transportation and delivery of lunch boxes from home to office location in
the morning. In the evening the lunch boxes are moved in the reverse direction.
The Suburban Railway services are employed for the main haulage of the tiffins. Every dabbawala buys a
railway pass which allows them to make unlimited trips on designated routes for a period of time.
There are around 5,000 dabbawalas in the system at any moment of time. Each dabbawala is assigned
upto 30 customers in a specific geographical area. The household is expected to keep the lunchbox ready
when the dabbawala reports for collection which is usually between 7.00 am and 9.00 am (Ravichandran
2005). If the lunch is not ready the dabbawala would leave for the next destination. After collecting
approximately 30 such lunch boxes they are brought to the nearest suburban railway station for sorting
and onward transportation.
PROFILE B
3. Agent Profile/Deliveries Profile Please classify the features bellow
according to the classification scale:
According to the table presented in A. classification scale, please fill out the following table:
1. City Area Features Please classify the features bellow
according to the classification scale:
2. Product Characteristics Please classify the features bellow
according to the classification scale:
Definition and establishment of logistic Profiles
E. Case Study - Mumbai Dabbawalas, India
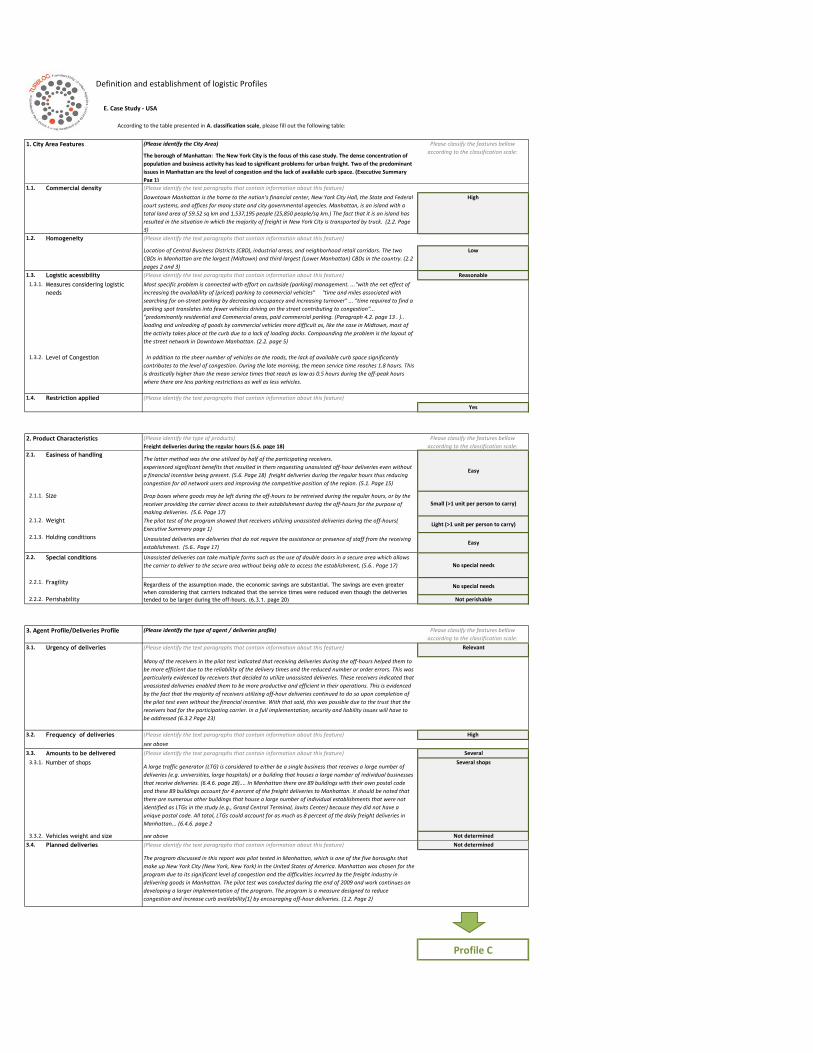
(Please identify the City Area)
The borough of Manhattan: The New York City is the focus of this case study. The dense concentration of
population and business activity has lead to significant problems for urban freight. Two of the predominant
issues in Manhattan are the level of congestion and the lack of available curb space. (Executive Summary
Pag 1)
1.1. Commercial density (Please identify the text paragraphs that contain information about this feature)
Downtown Manhattan is the home to the nation’s financial center, New York City Hall, the State and Federal
court systems, and offices for many state and city governmental agencies. Manhattan, is an island with a
total land area of 59.52 sq km and 1,537,195 people (25,850 people/sq km.) The fact that it is an island has
resulted in the situation in which the majority of freight in New York City is transported by truck. (2.2. Page
3)
High
1.2. Homogeneity (Please identify the text paragraphs that contain information about this feature)
Location of Central Business Districts (CBD), industrial areas, and neighborhood retail corridors. The two
CBDs in Manhattan are the largest (Midtown) and third largest (Lower Manhattan) CBDs in the country. (2.2
pages 2 and 3)
Low
1.3. Logistic acessibility (Please identify the text paragraphs that contain information about this feature) Reasonable
1.3.1. Measures considering logistic
needs
Most specific problem is connected with effort on curbside (parking) management. ..."with the net effect of
increasing the availability of (priced) parking to commercial vehicles" "time and miles associated with
searching for on-street parking by decreasing occupancy and increasing turnover" ... "time required to find a
parking spot translates into fewer vehicles driving on the street contributing to congestion"...
"predominantly residential and Commercial areas, paid commercial parking. (Paragraph 4.2. page 13 . )..
loading and unloading of goods by commercial vehicles more difficult as, like the case in Midtown, most of
the activity takes place at the curb due to a lack of loading docks. Compounding the problem is the layout of
the street network in Downtown Manhattan. (2.2. page 5)
1.3.2. Level of Congestion In addition to the sheer number of vehicles on the roads, the lack of available curb space significantly
contributes to the level of congestion. During the late morning, the mean service time reaches 1.8 hours. This
is drastically higher than the mean service times that reach as low as 0.5 hours during the off-peak hours
where there are less parking restrictions as well as less vehicles.
1.4. Restriction applied (Please identify the text paragraphs that contain information about this feature)
Yes
(Please identify the type of products)
Freight deliveries during the regular hours (5.6. page 18)
2.1. Easiness of handlingThe latter method was the one utilized by half of the participating receivers.
experienced significant benefits that resulted in them requesting unassisted off-hour deliveries even without
a financial incentive being present. (5.6. Page 18) freight deliveries during the regular hours thus reducing
congestion for all network users and improving the competitive position of the region. (5.1. Page 15)
Easy
2.1.1. Size Drop boxes where goods may be left during the off-hours to be retreived during the regular hours, or by the
receiver providing the carrier direct access to their establishment during the off-hours for the purpose of
making deliveries. (5.6. Page 17)
Small (>1 unit per person to carry)
2.1.2. Weight The pilot test of the program showed that receivers utilizing unassisted deliveries during the off-hours(
Executive Summary page 1)Light (>1 unit per person to carry)
2.1.3. Holding conditions Unassisted deliveries are deliveries that do not require the assistance or presence of staff from the receiving
establishment. (5.6.. Page 17)Easy
2.2. Special conditions Unassisted deliveries can take multiple forms such as the use of double doors in a secure area which allows
the carrier to deliver to the secure area without being able to access the establishment, (5.6.. Page 17) No special needs
2.2.1. FragilityNo special needs
2.2.2. Perishability Not perishable
(Please identify the type of agent / deliveries profile)
3.1. Urgency of deliveries (Please identify the text paragraphs that contain information about this feature) Relevant
Many of the receivers in the pilot test indicated that receiving deliveries during the off-hours helped them to
be more efficient due to the reliability of the delivery times and the reduced number or order errors. This was
particularly evidenced by receivers that decided to utilize unassisted deliveries. These receivers indicated that
unassisted deliveries enabled them to be more productive and efficient in their operations. This is evidenced
by the fact that the majority of receivers utilizing off-hour deliveries continued to do so upon completion of
the pilot test even without the financial incentive. With that said, this was possible due to the trust that the
receivers had for the participating carrier. In a full implementation, security and liability issues will have to
be addressed (6.3.2 Page 23)
3.2. Frequency of deliveries (Please identify the text paragraphs that contain information about this feature) High
see above
3.3. Amounts to be delivered (Please identify the text paragraphs that contain information about this feature) Several
3.3.1. Number of shopsA large traffic generator (LTG) is considered to either be a single business that receives a large number of
deliveries (e.g. universities, large hospitals) or a building that houses a large number of individual businesses
that receive deliveries. (6.4.6. page 28).... In Manhattan there are 89 buildings with their own postal code
and these 89 buildings account for 4 percent of the freight deliveries to Manhattan. It should be noted that
there are numerous other buildings that house a large number of individual establishments that were not
identified as LTGs in the study (e.g., Grand Central Terminal, Javits Center) because they did not have a
unique postal code. All total, LTGs could account for as much as 8 percent of the daily freight deliveries in
Manhattan... (6.4.6. page 2
Several shops
3.3.2. Vehicles weight and size see above Not determined
3.4. Planned deliveries (Please identify the text paragraphs that contain information about this feature) Not determined
The program discussed in this report was pilot tested in Manhattan, which is one of the five boroughs that
make up New York City (New York, New York) in the United States of America. Manhattan was chosen for the
program due to its significant level of congestion and the difficulties incurred by the freight industry in
delivering goods in Manhattan. The pilot test was conducted during the end of 2009 and work continues on
developing a larger implementation of the program. The program is a measure designed to reduce
congestion and increase curb availability[1] by encouraging off-hour deliveries. (1.2. Page 2)
Profile C
3. Agent Profile/Deliveries Profile Please classify the features bellow
according to the classification scale:
According to the table presented in A. classification scale, please fill out the following table:
1. City Area Features Please classify the features bellow
according to the classification scale:
2. Product Characteristics Please classify the features bellow
according to the classification scale:
Regardless of the assumption made, the economic savings are substantial. The savings are even greater
when considering that carriers indicated that the service times were reduced even though the deliveries
tended to be larger during the off-hours. (6.3.1. page 20)
Definition and establishment of logistic Profiles
E. Case Study - USA
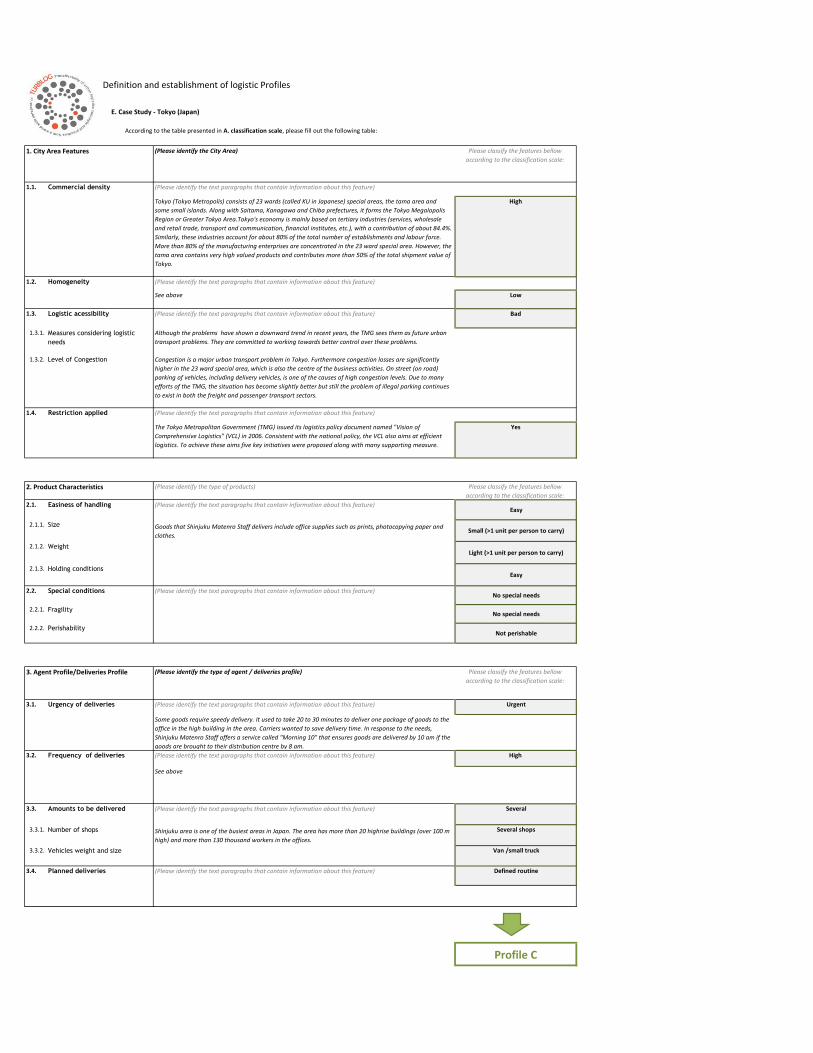
(Please identify the City Area)
1.1. Commercial density (Please identify the text paragraphs that contain information about this feature)
Tokyo (Tokyo Metropolis) consists of 23 wards (called KU in Japanese) special areas, the tama area and
some small islands. Along with Saitama, Kanagawa and Chiba prefectures, it forms the Tokyo Megalopolis
Region or Greater Tokyo Area.Tokyo's economy is mainly based on tertiary industries (services, wholesale
and retail trade, transport and communication, financial institutes, etc.), with a contribution of about 84.4%.
Similarly, these industries account for about 80% of the total number of establishments and labour force.
More than 80% of the manufacturing enterprises are concentrated in the 23 ward special area. However, the
tama area contains very high valued products and contributes more than 50% of the total shipment value of
Tokyo.
High
1.2. Homogeneity (Please identify the text paragraphs that contain information about this feature)
See above Low
1.3. Logistic acessibility (Please identify the text paragraphs that contain information about this feature) Bad
1.3.1. Measures considering logistic
needs
Although the problems have shown a downward trend in recent years, the TMG sees them as future urban
transport problems. They are committed to working towards better control over these problems.
1.3.2. Level of Congestion Congestion is a major urban transport problem in Tokyo. Furthermore congestion losses are significantly
higher in the 23 ward special area, which is also the centre of the business activities. On street (on road)
parking of vehicles, including delivery vehicles, is one of the causes of high congestion levels. Due to many
efforts of the TMG, the situation has become slightly better but still the problem of illegal parking continues
to exist in both the freight and passenger transport sectors.
1.4. Restriction applied (Please identify the text paragraphs that contain information about this feature)
The Tokyo Metropolitan Government (TMG) issued its logistics policy document named "Vision of
Comprehensive Logistics" (VCL) in 2006. Consistent with the national policy, the VCL also aims at efficient
logistics. To achieve these aims five key initiatives were proposed along with many supporting measure.
Yes
(Please identify the type of products)
2.1. Easiness of handling (Please identify the text paragraphs that contain information about this feature)Easy
2.1.1. Size Goods that Shinjuku Matenro Staff delivers include office supplies such as prints, photocopying paper and
clothes. Small (>1 unit per person to carry)
2.1.2. WeightLight (>1 unit per person to carry)
2.1.3. Holding conditionsEasy
2.2. Special conditions (Please identify the text paragraphs that contain information about this feature)No special needs
2.2.1. FragilityNo special needs
2.2.2. PerishabilityNot perishable
(Please identify the type of agent / deliveries profile)
3.1. Urgency of deliveries (Please identify the text paragraphs that contain information about this feature) Urgent
Some goods require speedy delivery. It used to take 20 to 30 minutes to deliver one package of goods to the
office in the high building in the area. Carriers wanted to save delivery time. In response to the needs,
Shinjuku Matenro Staff offers a service called "Morning 10" that ensures goods are delivered by 10 am if the
goods are brought to their distribution centre by 8 am.
3.2. Frequency of deliveries (Please identify the text paragraphs that contain information about this feature) High
See above
3.3. Amounts to be delivered (Please identify the text paragraphs that contain information about this feature) Several
3.3.1. Number of shops Shinjuku area is one of the busiest areas in Japan. The area has more than 20 highrise buildings (over 100 m
high) and more than 130 thousand workers in the offices.
Several shops
3.3.2. Vehicles weight and size Van /small truck
3.4. Planned deliveries (Please identify the text paragraphs that contain information about this feature) Defined routine
Profile C
3. Agent Profile/Deliveries Profile Please classify the features bellow
according to the classification scale:
According to the table presented in A. classification scale, please fill out the following table:
1. City Area Features Please classify the features bellow
according to the classification scale:
2. Product Characteristics Please classify the features bellow
according to the classification scale:
Definition and establishment of logistic Profiles
E. Case Study - Tokyo (Japan)
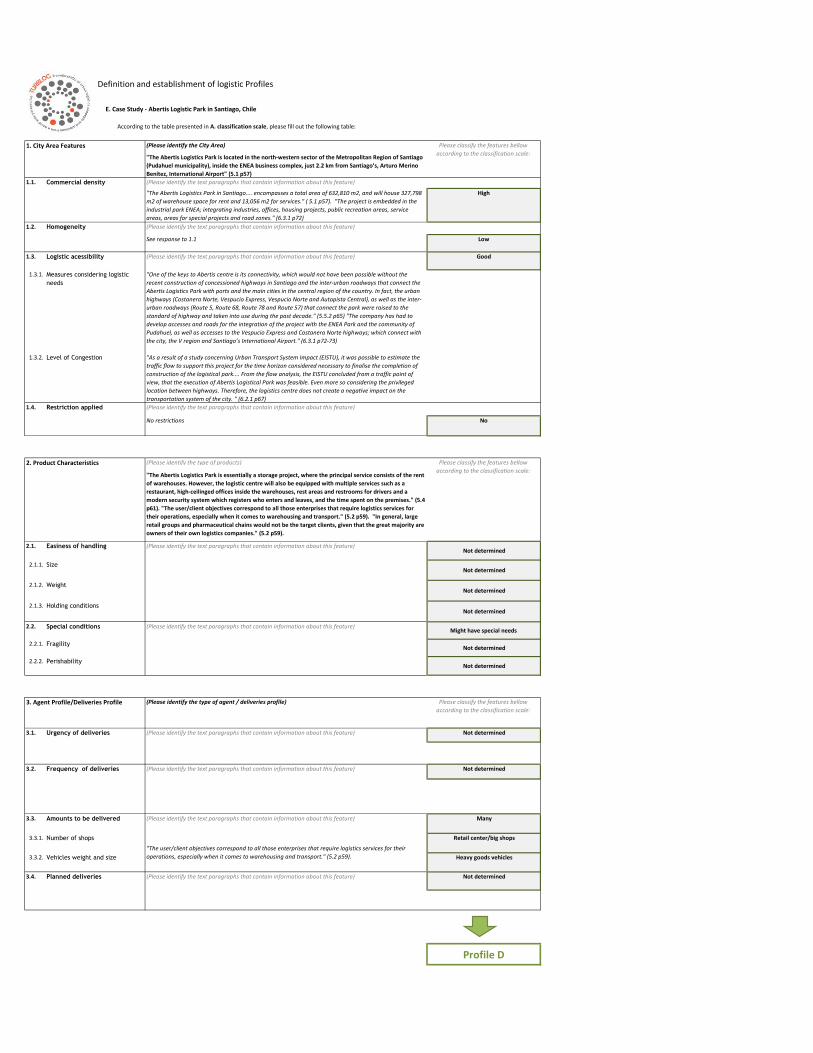
(Please identify the City Area)
"The Abertis Logistics Park is located in the north-western sector of the Metropolitan Region of Santiago
(Pudahuel municipality), inside the ENEA business complex, just 2.2 km from Santiago’s, Arturo Merino
Benítez, International Airport" (5.1 p57)
1.1. Commercial density (Please identify the text paragraphs that contain information about this feature)
"The Abertis Logistics Park in Santiago.... encompasses a total area of 632,810 m2, and will house 327,798
m2 of warehouse space for rent and 13,056 m2 for services." ( 5.1 p57). "The project is embedded in the
industrial park ENEA; integrating industries, offices, housing projects, public recreation areas, service
areas, areas for special projects and road zones." (6.3.1 p72)
High
1.2. Homogeneity (Please identify the text paragraphs that contain information about this feature)
See response to 1.1 Low
1.3. Logistic acessibility (Please identify the text paragraphs that contain information about this feature) Good
1.3.1. Measures considering logistic
needs
"One of the keys to Abertis centre is its connectivity, which would not have been possible without the
recent construction of concessioned highways in Santiago and the inter-urban roadways that connect the
Abertis Logistics Park with ports and the main cities in the central region of the country. In fact, the urban
highways (Costanera Norte, Vespucio Express, Vespucio Norte and Autopista Central), as well as the inter-
urban roadways (Route 5, Route 68, Route 78 and Route 57) that connect the park were raised to the
standard of highway and taken into use during the past decade." (5.5.2 p65) "The company has had to
develop accesses and roads for the integration of the project with the ENEA Park and the community of
Pudahuel, as well as accesses to the Vespucio Express and Costanera Norte highways; which connect with
the city, the V region and Santiago’s International Airport." (6.3.1 p72-73)
1.3.2. Level of Congestion "As a result of a study concerning Urban Transport System Impact (EISTU), it was possible to estimate the
traffic flow to support this project for the time horizon considered necessary to finalise the completion of
construction of the logistical park.... From the flow analysis, the EISTU concluded from a traffic point of
view, that the execution of Abertis Logistical Park was feasible. Even more so considering the privileged
location between highways. Therefore, the logistics centre does not create a negative impact on the
transportation system of the city. " (6.2.1 p67)
1.4. Restriction applied (Please identify the text paragraphs that contain information about this feature)
No restrictions No
(Please identify the type of products)
"The Abertis Logistics Park is essentially a storage project, where the principal service consists of the rent
of warehouses. However, the logistic centre will also be equipped with multiple services such as a
restaurant, high-ceilinged offices inside the warehouses, rest areas and restrooms for drivers and a
modern security system which registers who enters and leaves, and the time spent on the premises." (5.4
p61). "The user/client objectives correspond to all those enterprises that require logistics services for
their operations, especially when it comes to warehousing and transport." (5.2 p59). "In general, large
retail groups and pharmaceutical chains would not be the target clients, given that the great majority are
owners of their own logistics companies." (5.2 p59).
2.1. Easiness of handling (Please identify the text paragraphs that contain information about this feature)Not determined
2.1.1. Size Not determined
2.1.2. WeightNot determined
2.1.3. Holding conditionsNot determined
2.2. Special conditions (Please identify the text paragraphs that contain information about this feature)Might have special needs
2.2.1. FragilityNot determined
2.2.2. PerishabilityNot determined
(Please identify the type of agent / deliveries profile)
3.1. Urgency of deliveries (Please identify the text paragraphs that contain information about this feature) Not determined
3.2. Frequency of deliveries (Please identify the text paragraphs that contain information about this feature) Not determined
3.3. Amounts to be delivered (Please identify the text paragraphs that contain information about this feature) Many
3.3.1. Number of shops Retail center/big shops
3.3.2. Vehicles weight and size Heavy goods vehicles
3.4. Planned deliveries (Please identify the text paragraphs that contain information about this feature) Not determined
Profile D
"The user/client objectives correspond to all those enterprises that require logistics services for their
operations, especially when it comes to warehousing and transport." (5.2 p59).
3. Agent Profile/Deliveries Profile Please classify the features bellow
according to the classification scale:
According to the table presented in A. classification scale, please fill out the following table:
1. City Area Features Please classify the features bellow
according to the classification scale:
2. Product Characteristics Please classify the features bellow
according to the classification scale:
Definition and establishment of logistic Profiles
E. Case Study - Abertis Logistic Park in Santiago, Chile
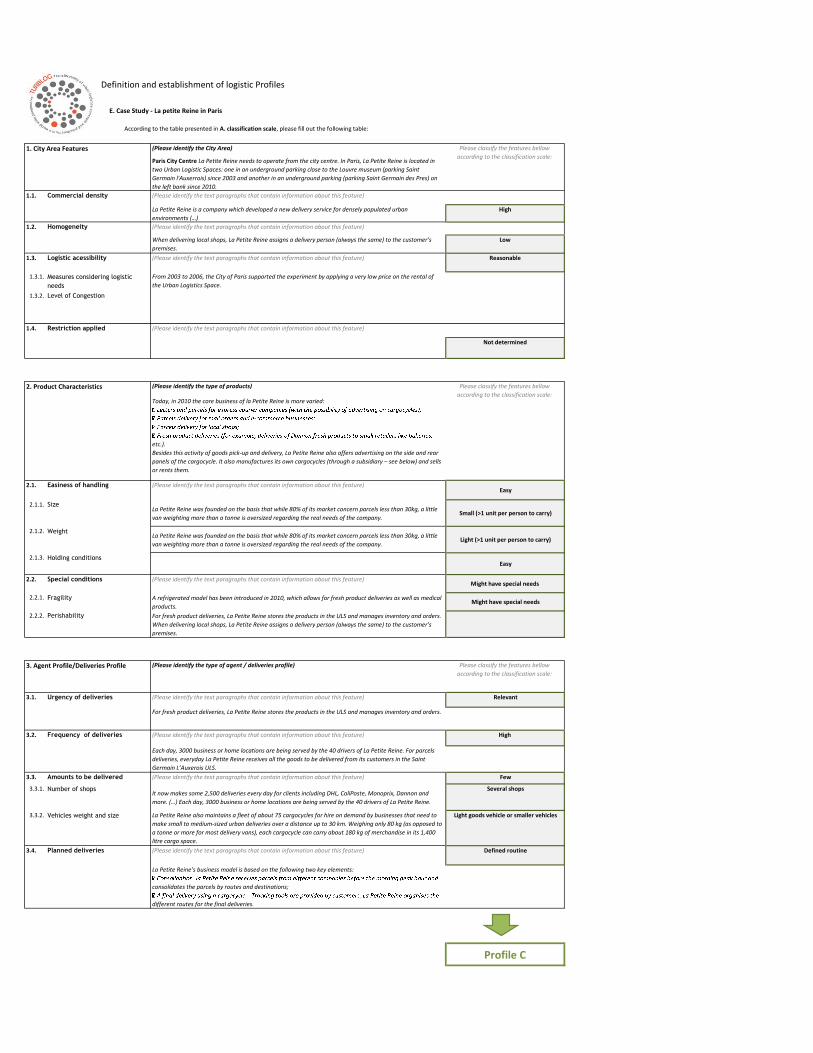
(Please identify the City Area)
Paris City Centre La Petite Reine needs to operate from the city centre. In Paris, La Petite Reine is located in
two Urban Logistic Spaces: one in an underground parking close to the Louvre museum (parking Saint
Germain l'Auxerrois) since 2003 and another in an underground parking (parking Saint Germain des Pres) on
the left bank since 2010.
1.1. Commercial density (Please identify the text paragraphs that contain information about this feature)
La Petite Reine is a company which developed a new delivery service for densely populated urban
environments (…)
High
1.2. Homogeneity (Please identify the text paragraphs that contain information about this feature)
When delivering local shops, La Petite Reine assigns a delivery person (always the same) to the customer’s
premises.
Low
1.3. Logistic acessibility (Please identify the text paragraphs that contain information about this feature) Reasonable
1.3.1. Measures considering logistic
needs
From 2003 to 2006, the City of Paris supported the experiment by applying a very low price on the rental of
the Urban Logistics Space.
1.3.2. Level of Congestion
1.4. Restriction applied (Please identify the text paragraphs that contain information about this feature)
Not determined
(Please identify the type of products)
Today, in 2010 the core business of la Petite Reine is more varied:
etc.).
Besides this activity of goods pick-up and delivery, La Petite Reine also offers advertising on the side and rear
panels of the cargocycle. It also manufactures its own cargocycles (through a subsidiary – see below) and sells
or rents them.
2.1. Easiness of handling (Please identify the text paragraphs that contain information about this feature)Easy
2.1.1. Size La Petite Reine was founded on the basis that while 80% of its market concern parcels less than 30kg, a little
van weighting more than a tonne is oversized regarding the real needs of the company. Small (>1 unit per person to carry)
2.1.2. WeightLa Petite Reine was founded on the basis that while 80% of its market concern parcels less than 30kg, a little
van weighting more than a tonne is oversized regarding the real needs of the company. Light (>1 unit per person to carry)
2.1.3. Holding conditionsEasy
2.2. Special conditions (Please identify the text paragraphs that contain information about this feature)Might have special needs
2.2.1. Fragility A refrigerated model has been introduced in 2010, which allows for fresh product deliveries as well as medical
products.Might have special needs
2.2.2. Perishability For fresh product deliveries, La Petite Reine stores the products in the ULS and manages inventory and orders.
When delivering local shops, La Petite Reine assigns a delivery person (always the same) to the customer’s
premises.
(Please identify the type of agent / deliveries profile)
3.1. Urgency of deliveries (Please identify the text paragraphs that contain information about this feature) Relevant
For fresh product deliveries, La Petite Reine stores the products in the ULS and manages inventory and orders.
3.2. Frequency of deliveries (Please identify the text paragraphs that contain information about this feature) High
Each day, 3000 business or home locations are being served by the 40 drivers of La Petite Reine. For parcels
deliveries, everyday La Petite Reine receives all the goods to be delivered from its customers in the Saint
Germain L’Auxerois ULS.
3.3. Amounts to be delivered (Please identify the text paragraphs that contain information about this feature) Few
3.3.1. Number of shopsIt now makes some 2,500 deliveries every day for clients including DHL, ColiPoste, Monoprix, Dannon and
more. (…) Each day, 3000 business or home locations are being served by the 40 drivers of La Petite Reine.
Several shops
3.3.2. Vehicles weight and size La Petite Reine also maintains a fleet of about 75 cargocycles for hire on demand by businesses that need to
make small to medium-sized urban deliveries over a distance up to 30 km. Weighing only 80 kg (as opposed to
a tonne or more for most delivery vans), each cargocycle can carry about 180 kg of merchandise in its 1,400
litre cargo space.
Light goods vehicle or smaller vehicles
3.4. Planned deliveries (Please identify the text paragraphs that contain information about this feature) Defined routine
La Petite Reine’s business model is based on the following two key elements:
consolidates the parcels by routes and destinations;
different routes for the final deliveries.
Profile C
3. Agent Profile/Deliveries Profile Please classify the features bellow
according to the classification scale:
According to the table presented in A. classification scale, please fill out the following table:
1. City Area Features Please classify the features bellow
according to the classification scale:
2. Product Characteristics Please classify the features bellow
according to the classification scale:
Definition and establishment of logistic Profiles
E. Case Study - La petite Reine in Paris