Embed Size (px)
Citation preview

Michigan Livable Communities Demonstration Project Grand Vision
Mobility Management & Coordination -Report Supplements- October 2013
Completed in collaboration with the Michigan Department of Transportation and Michigan State Housing Development Authority.

Acknowledgements Many individuals and organizations contributed their time and expertise to the preparation of this report.
Project Leadership Matt Skeels Northwest Michigan Council of Governments Roger Millar Vice President, Smart Growth America Rayla Bellis Project Manager, Smart Growth America
Project Stakeholder Group James Bruckbauer MLUI Jim Moore Disability Network Mike Coy Cadillac Steve Feringa GT Band of Ottawa and Chippewa Indians Jay Zollinger Acme Township Doug Dornbos Cherry Capital Cab Company Tom Menzel BATA Susan Miller Benzie Bus Jim Lively MLUI Valerie Schultz MDOT Patty O’Donnell MDOT Ron Kea Kalkaska Public Transit Authority Janet Cox Kalkaska Public Transit Authority Scott Gest NWMCOG Kimberly Pontius Traverse Area Association of Realtors Carol Moorman Goodwill Dan Sal Cherry Capital Airport Vance Edwards Cadillac-Wexford Transit Authority Bob Carstens Acme Township John Rogers GT Road Commission Chad Hollenbeck Benzie Transportation Authority Susan Onan Brickways Russ Soyring City of Traverse City Carrie Thompson BATA
Project Team Lisa Ballard, Principal Current Transportation Solutions Ted Lange, Planner Current Transportation Solutions

This report was produced with the generous support of the Rockefeller Foundation. The Rockefeller Foundation fosters innovative solutions to many of the world’s most pressing challenges, affirming its mission, since 1913, to “promote the well-being” of humanity. Today, the Foundation works to ensure that more people can tap into the benefits of globalization while strengthening resilience to its risks. Foundation initiatives include efforts to mobilize an agricultural revolution in Sub-Saharan Africa, bolster economic security for American workers, inform equitable, sustainable transportation policies in the United States, ensure access to affordable and high-quality health systems in developing countries, accelerate the impact investing industry’s evolution, and develop strategies and services that help vulnerable communities cope with the impacts of climate change. For more information, please visit www.rockefellerfoundation.org. The Rockefeller Foundation, 420 Fifth Avenue, New York, NY 10018 The cover image was created using http://www.tagxedo.com. Any errors and all interpretations are the responsibility of Smart Growth America. Please direct questions about this report to Roger Millar, PE, AICP, Vice President: [email protected], (406) 544-1963.

Grand Traverse | Mobility Management Strategies Michigan Livable Communities Demonstration Project
Smart Growth America | iv
Table of Contents Acknowledgements .................................................................................................................. ii
Table of Contents ..................................................................................................................... iv
Supplement A: Federal Programs and Guidance ............................................................... A-1
Supplement B: Mobility Management & Coordination Partners ........................................ B-1
Supplement C: Northwest Oregon Transit Alliance & Maine’s Shoreline Explorer ......... C-1
Supplement D: Fare Coordination ....................................................................................... D-1
Supplement E: Standard Practice for Calculating the Cost of a Ride .............................. E-1
Supplement F: Creating High Quality Web Resources ...................................................... F-1
Supplement G: Humboldt Transportation Services Guide ................................................ G-1
Supplement H: Transportation Services in Glacier National Park ..................................... H-1
Supplement I: Ferry Transportation Concepts .................................................................... I-1
Supplement J: Integrating Transportation with Regional Planning ...................................J-1
Supplement K: Coordinating with Human Service Transportation ................................... K-1
The information in this document supplements the Grand Vision Mobility Management planning and guidance led by Smart Growth America. This information includes examples from other communities, best practices, and other useful information to consider when implementing strategies recommended in the final report.

Grand Traverse | Mobility Management Strategies Michigan Livable Communities Demonstration Project
Smart Growth America | A-1
Supplement A: Federal Programs and Guidance Non-FTA Programs In 2007 the Office of Management and Budget identified sixty-two federal programs that fund transportation. The following table lists the possible uses for these programs according to United We Ride.
Federal Transportation Service Matrix
Reim
burs
ed C
osts
(F
ares
, Gas
, Bus
Pa
ss, e
tc.)
Mob
ility
Mgt
/ Tr
avel
Tra
inin
g/ O
an
d M
Ope
rate
Veh
icle
s (D
irect
or C
ontr
act)
Purc
hase
Veh
icle
s (p
ublic
/non
prof
it)
HEALTH AND HUMAN SERVICES Administration for Children and Families
Social Service Block Grant X X X Child Care and Development Block Grant X Head Start X X Refugee and Entrant Assistant Discretionary Grants Refugee and Entrant Asst. State Administered Programs X Refugee and Entrant Targeted Assistance X Refugee and Entrant Asst. Voluntary Agency Programs X State Developmental Disabilities Council and Protection & Advocacy X X X Temporary Assist to Needy Families X Community Services Block Grant X Promoting Safe and Stable Families X
Administration on Aging Grants for Supportive Services and Senior Centers X Programs for American Indian, Alaskan Native and Native Hawaii X
Centers for Medicaid and Medicare Medicaid X State Health Insurance Program X Home and Community Based Waiver X X
Health Resources and Services Administration Community Health Centers X X Healthy Communities Program X X HIV Care Formula X X Maternal and Child Health Block Grant X Rural Health Care Network X X X Rural Health Care Outreach Program X Healthy Start Initiative X Ryan White Care Act Programs
Substance Abuse and Mental Health Services Administration Community Mental Health Services Block Grant X X Prevention and Texas Block Grant X X
DEPARTMENT OF EDUCATION Voluntary Public School Choice X X IDEA X Centers for Independent Living X Independent Living for Older individuals Who are Blind X Independent Living State Grants X Vocational Rehab Grants X
DEPARTMENT OF LABOR Bureau of Indian Affairs

Grand Traverse | Mobility Management Strategies Michigan Livable Communities Demonstration Project
Smart Growth America | A-2
Reim
burs
ed C
osts
(F
ares
, Gas
, Bus
Pa
ss, e
tc.)
Mob
ility
Mgt
/ Tr
avel
Tra
inin
g/ O
an
d M
Ope
rate
Veh
icle
s (D
irect
or C
ontr
act)
Purc
hase
Veh
icle
s (p
ublic
/non
prof
it)
Indian Employment Training and Related Services X X Indian Employment Services X X
Employment and Training Administration Job Corps X X Migrant and Seasonal Farm Worker X X Native American Employment and Training X X Trade Adjustment Assistance for Workers X X Welfare to Work Grants for Tribes X X Welfare to Work for States and Locals X X Work Incentive Grants X X Workforce Investment Act Adult Services Program X Workforce Investment Act Adult Dislocated Worker Program X Workforce Investment Act Youth Activities X
Veterans Programs Veterans Employment Program X Homeless Vet Project
DEPARTMENT OF TRANSPORTATION Elderly and Persons with Disability X Job Access Reverse Commute (consolidated under MAP-21) X X Non-Urbanized Formula (rural) X X Urbanized Formula X New Freedom Program (consolidated under MAP-21) X X Capital Discretionary Program X X
HOUSING AND URBAN DEVELOPMENT Community Planning and Development
Community Development Block Grant X X Housing for Ind. w/AIDS X X X Supportive Housing Programs X Principal and Interest Revitalization of Severely Distressed Housing X
Veteran Affairs Homeless Provider Grants X X Medical Care Benefits X X X
Social Security Administration Ticket to Work Program X
U.S. Department of Agriculture Food stamp and Employment Training Program X
Source: (United We Ride, 2007)
The Role of Technology Technology plays a critical role in effective customer communications, and internal management of daily operations as well as longer term planning decisions. It is tightly related to operations, performance monitoring, marketing, social media strategy, and good information design. The same technological capabilities that make it possible to provide real time bus tracking, automated stop announcements and other accurate, user-friendly information to the public are also necessary for critical management challenges such as assessing on-time performance, analyzing ridership and deciding how to allocate resources when increasing or cutting service. Additionally, technology is essential for effective mobility management, helping professional staff coordinate the services of multiple providers and guide customers who are trying to find a ride.

Grand Traverse | Mobility Management Strategies Michigan Livable Communities Demonstration Project
Smart Growth America | A-3
An intelligent transportation system (ITS) is the combination of technologies used to achieve these functions. Different software, hardware, spreadsheets, and back-end databases can be used as long as they are coordinated. USDOT requires transit systems to use a systems engineering process when using FTA funding to design and implement transit management system technology. The systems engineering analysis should be commensurate with the size and scope of the project being developed (23 CFR §940.11).
Simply stated, systems engineering is an integrated planning, design and implementation process that involves users and ITS developers in a team effort with the goal of providing a quality product that meets all user and technical needs. The process ensures the collaboration, iteration, and feedback that most ITS projects typically require between the design and implementation phases. It should be possible to scale and tailor the process to apply to projects of all sizes and complexity.
This is an important, but widely neglected policy. Transit operators commonly invest FTA funding in a wide range of ITS applications. However, a study of costs for 44 projects found a 50% average cost overrun on projects without systems engineering, and a clear trend towards better cost performance with systems engineering. (FHWA-California Division and Caltrans, 2009) Systems engineering reduces the risk of schedule and cost overruns and increases the likelihood that the implementation will meet the user's needs. Other benefits include:
• improved stakeholder participation • more adaptable, resilient systems • verified functionality and fewer defects • higher level of reuse from one project to the next, and • better documentation.
FHWA and FTA recommend that the systems engineering process for transit ITS should follow the Vee Development Model as shown in Figure 2-5. While the benefits are persuasive, it is easy to see that the process can be complex, time consuming, costly and require expertise that many communities do not have available. A properly scaled process touching on each element of the Vee should reduce risk in purchasing or developing appropriate tools for mobility management and transit ITS.

Grand Traverse | Mobility Management Strategies Michigan Livable Communities Demonstration Project
Smart Growth America | A-4
Figure A-1: ITS design process Vee diagram (FHWA-California Division and Caltrans, 2009)

Grand Traverse | Mobility Management Strategies Michigan Livable Communities Demonstration Project
Smart Growth America | B-1
Supplement B: Mobility Management & Coordination Partners Effective mobility management requires coordination between all transportation providers – public transit, human service agencies, non-profit organizations, church based services and private for-profit providers – as well as a wide range of partners that do not directly provide transportation services. This supplement includes information about a variety of transportation providers and other potential mobility management partners in the region.
Public Transportation The Grand Traverse area has seven public transportation providers. Of these, five were included in the Grand Vision. Charlevoix and Manistee Counties have been added to regional discussions in more recent years. Information from the MDOT 2011 ridership report is shown in Table B-1
Table B-1: Public Transportation in the Region Agency Contact 2011 Ridership Antrim County Transportation 231-533-8644 46,067 Bay Area Transportation Authority 231-941-2324;
www.bata.net 539,384
Benzie Bus 231-325-3000; www.benziebus.com
69,852
Cadillac/Wexford Transit Authority 231-779-0123 132,511 Charlevoix County Transit 231-582-6900, (231-
448-2026 on Beaver Island)
94,081
Kalkaska Public Transit Authority 231-258-6808 105,907 Manistee County Transportation 231-723-6561 112,932
Other Transportation Providers In many communities, gaps in public transportation services are filled to varying degrees by private NEMT and taxi services. One of the goals of mobility management is to identify all transportation choices and foster communication and coordination between public and private providers to maximize the efficiency, effectiveness and quality of the services provided and to identify ways to address unmet needs. In the Grand Traverse region, information about the private transportation options is currently not centralized. The team identified the following providers and organizational descriptions from a variety of information sources including 2-1-1 and web searches.

Grand Traverse | Mobility Management Strategies Michigan Livable Communities Demonstration Project
Smart Growth America | B-2
Non-Emergency Medical Transportation (NEMT) Providers Lake to Lake Transportation Company, LLC 2353 S. LaChance Road Lake City, MI 49651 231-779-5373 http://www.lakestransport.com/aboutus.html Lake to Lake Transportation’s mission is to provide safe, friendly, caring, personal and reliable transportation services to the growing underserved communities located in rural areas of northern Michigan. We intend to fill the “missing link” between rural homes and urban areas to accommodate every person who is living without the ability to drive to their non-emergent medical or personal appointments, errands and events.
Taxi Services Cherry Capital Cab Company Traverse City, Michigan 231-946-8294
Chippewa Cab Traverse City, Michigan (231) 946-4688
Dan’s Airport Transportation Traverse City, Michigan (231) 645-9696
Northern Michigan Medical Transport Inc.
Traverse City, Michigan (231) 275-3759
BACK Country Taxi Cab Company Big Rapids, Michigan (231) 408-2449 Affordable Taxi Cab Incorporated Big Rapids, MI (231) 796-3001 All City Cab (231) 796-1800 Big Rapids, MI
Further research and interviews with social service providers would be needed to determine whether northwest Michigan has similar issues to many other communities around the nation where low-cost, unregulated taxis are providing the majority of Medicaid-funded transportation with no minimum standards for safety and quality of service due no requirement for driver background checks and driver training, and limited vehicle inspections.
Businesses that charge on a per-ride basis as opposed to a meter are considered limousine services and are required to register with the state. We did not determine whether such businesses provide a significant number of rides in northwest Michigan.
Grand Vision Transit Focus Group List NWMCOG provided the team with their Grand Vision Transit Focus Group List. Organizations are listed below. The list appears robust for the purpose of a regional discussion of mobility management, but it is possible that we will also want to involve some of the stakeholders listed in other Grand Vision efforts and not included in this list.

Grand Traverse | Mobility Management Strategies Michigan Livable Communities Demonstration Project
Smart Growth America | B-2
Grand Vision Transit Focus Group Organizations Organization Notes
Bay Area Transportation Authority BATA Cadillac-Wexford Transportation Authority CWTA Antrim County Transportation Kalkaska Public Transit Authority Benzie Bus Goodwill GT County Collaborative Human Service Antrim/Kalkaska Collaborative Human Service Leelanau County Family Coordination Council Human Service Traverse Bay Area Intermediate School District TBAISD Other districts? Traverse City Chamber Munson Medical Center Michigan Dept. of Transportation MDOT Grand Traverse County Road Commission Leelanau County Road Commission Benzie County Road Commission Wexford County Road Commission Kalkaska County Road Commission Antrim County Road Commission Traverse City Cadillac Suttons Bay Kingsley Village Kalkaska Village Acme Township Interlochen/Green Lake Township Buckley Village Michigan Land Use Institute Disability Network Traverse Area Recreational Trails TART Northwestern Michigan College NMC Traverse City Downtown Development Authority TC-DDA Poverty Reduction Initiative PRI Area Agency on Aging Traverse City Area Public Schools TCAPS Cherry Capital Cab Cab Companies Traverse Area Association of Realtors TAAR Grand Traverse County Planning
Grand Traverse | Mobility Management Strategies Michigan Livable Communities Demonstration Project
Smart Growth America | B-3
Organization Notes Grand Traverse Band of Ottawa and Chippewa Indians Grand Traverse Band of Ottawa and Chippewa Indians Brickways Independent Living Centers Northern Lakes Community Mental Health Protection agencies GV Housing Solutions Housing Agencies Cherry Capital Airport
Grand Vision Regional Planning Partners For FY 2011 a HUD Sustainable Communities Regional Planning grant pre-application was submitted for the “Grand Vision to Grand Action: Regional Plan for Sustainable Development”. This document includes a list of regional partner organizations with brief organizational descriptions. The following organizations included in that list appear to be important mobility management partners or potential partners. We have moved NWMCOG and MLUI to the top of the list as both are lead partners who are already playing important mobility management roles.
Northwest Michigan Council of Governments The Northwest Michigan Council of Governments (NWMCOG) is a regional organization serving units of government, businesses, non-profits, community organizations, and individuals in a ten county region of northwest Michigan. The primary service categories are: regional planning and community development; workforce development; business and economic development; and community safety with particular emphasis on partnerships, economy of scale, and leveraging resources to address common concerns among multiple organizations or across sectors. The regional planning and community development division includes housing, transportation, land use, environmental, economic development, and energy planning and implementation programs and projects.
Michigan Land Use Institute The Michigan Land Use Institute (MLUI) works with citizens, officials, and other organizations to build a prosperous new economy in Michigan, one that expands opportunity by improving our health and environment. Specifically, we promote people-friendly, regional planning; healthy food from local farms; and Michigan's leadership in the new green-energy and clean-water economy.
Northwest Michigan WORKS! As the workforce development arm of the Northwest Michigan Council of Governments, Northwest Michigan WORKS! provides a wide variety of services to every sector of our economy. These services include: business services, job seeker services, learning labs, youth services.
Grand Traverse Band of Ottawa and Chippewa Indians On May 27, 1980 the Tribe was re-recognized by the federal government as the Grand Traverse Band of Ottawa and Chippewa Indians. The Tribe has developed Tribal programs to serve the membership and established an Economic Development Corporation.

Grand Traverse | Mobility Management Strategies Michigan Livable Communities Demonstration Project
Smart Growth America | B-4
Tribal members living in their six county service area on reservation lands and non-reservation land will provide valuable input.
Traverse Bay Economic Development Corporation The Traverse Bay Economic Development Corporation (Traverse Bay EDC) serves as the economic division of the Traverse City Area Chamber of Commerce and exists to promote and bolster the regional economy of Benzie, Grand Traverse, Kalkaska, and Leelanau Counties. The Traverse Bay EDC is a voice of encouragement for the expansion of existing industry, attracting new businesses to the region, and assisting communities with job-producing and tax-broadening projects.
Northern Lakes Economic Alliance The Northern Lakes Economic Alliance is a public/private non-profit organization serving Antrim, Charlevoix, Cheboygan and Emmet Counties in Michigan. Established in 1984, the NLEA mission is to serve as a resource to local communities and businesses to retain and create jobs.
SEEDS Inc. SEEDS provides after school programming at select school in northwest Michigan that provides learning opportunities and access to healthy role models, mentors, and community advisors. Programs are designed specifically to supplement the school day making learning hands-on and fun.
Northwestern Michigan College NMC has become a source of education in the largest sense, - a source of meaningful new knowledge, skills and experiences. Their mission is to “provide lifelong learning opportunities to our communities.”
Northwestern Michigan College (231) 941-2324 https://www.nmc.edu/about/maps/public-transportation.html Four main campus stops on BATA’s Tom’s East Bay fixed route and one at the Traverse City Senior Center, next door to the Great Lakes Campus. Students are eligible for reduced fares.
NorthSky NorthSky is a nonprofit program of Rotary Charities of Traverse City that assists northern Michigan nonprofit organizations strengthen their capabilities through capacity building and sustainability support. It provides a wide range of services and resources to help nonprofit organizations deliver programs effectively and efficiently. It also serves as an advocate—securing state and national support and technical and financial resources, bringing them home to the nonprofits in its region.
Traverse Bay Poverty Reduction Initiative (PRI) Citizens from Antrim, Benzie, Grand Traverse, Kalkaska and Leelanau counties have created a response to poverty in their midst. After analyzing data and defining priorities, this group identified six issues for further study and action: jobs and economy; education and training;

Grand Traverse | Mobility Management Strategies Michigan Livable Communities Demonstration Project
Smart Growth America | B-5
affordable housing; health care; social attitudes; early childhood development. PRI seeks to link and support regional activities related to poverty and not to duplicate existing programs.
Disability Network The Disability Network serves people with disabilities, their families, and the northwest Lower Michigan community. The staff provides information, referrals, and support to people with a wide variety of disabilities. They also work on a larger scale, helping governments, businesses, and other organizations make changes that improve life for everyone in the community. Their mission: To promote personal empowerment and positive social change for persons with disabilities.
Human Services Collaborative Boards Boards exist in Antrim, Kalkaska, Grand Traverse, Leelanau, Benzie, and Wexford Counties.
Veterans’ Services Transportation to and from veterans’ medical facilities can be through VA programs or through public transportation options. Two facilities are within the Grand Traverse region, and veterans with specialized needs must travel to regional facilities.
Cadillac VA Community Based Outpatient Clinic 1909 N. Mitchell St.Cadillac, MI 49601 1-888-838-6446 http://www.saginaw.va.gov/visitors/Cadillac.asp Clare VA Community Based Outpatient Clinic 11775 N. Isabella RdClare, MI 48617 1-800-649-4812 http://www.saginaw.va.gov/visitors/Clare.asp The above clinics provide community-based outpatient service. The U.S. Department of Veterans Affairs webpage for this clinic gives driving directions but no information about public transportation or other transportation assistance/options.
The parent facility is Aleda E. Lutz VA Medical Center, Saginaw, Michigan, approximately 60 miles away. Oscar G. Johnson VA Medical Center serves veterans from a 32-county area in the upper peninsula of Michigan and northeastern Wisconsin.1
Transportation assistance is available to and from scheduled appointments through the Center Transportation Coordinator at 1-800-215-8262 or 906-774-3300, ext. 33849.
1 http://www.ironmountain.va.gov/services/

Grand Traverse | Mobility Management Strategies Michigan Livable Communities Demonstration Project
Smart Growth America | C-1
Supplement C: Northwest Oregon Transit Alliance & Maine’s Shoreline Explorer Northwest Oregon Transit Alliance (NWOTA) The five public transit agencies who are partners in the Northwest Oregon Transit Alliance (NWOTA) are implementing a wide range of actions to foster collaboration, improve transit connections between communities, and share resources to improve the cost effectiveness of their services and programs. Following is additional information about NWOTA that was not included in the main document. This information is taken from their recently published Northwest Oregon Transit Alliance Funding Plan.
Our contacts with NWOTA are the Executive Director of Sunset Empire Transportation District and Northwest Ride Center, and the project consultant, David Evans and Associates. Both have offered to share as much info as he can about the project.
Centralized Website NWOTA has created a centralized website with a regional trip planner and links to each individual service’s website along with other information: http://www.nworegontransit.org/

Grand Traverse | Mobility Management Strategies Michigan Livable Communities Demonstration Project
Smart Growth America | C-2

Grand Traverse | Mobility Management Strategies Michigan Livable Communities Demonstration Project
Smart Growth America | C-3
Leadership NWOTA has established a Coordinating Committee to improve inter-agency coordination. The partnership’s top priority for the next one to two years is to continue administrative support for this committee. They are considering a part time contracted position to staff this effort. The estimated cost is $20,000 potentially funded through state mobility management funding. Their Funding Plan states that, “Transit agency staffs have many competing demands on their time and little extra time available to take on oversight of large regional projects. In some cases, the Alliance may wish to retain an independent representative to oversee technical work prepared by contractors and ensure NWOTA’s funding responsibilities are met. Depending on the type of project, this could be done by temporarily increasing the scope of NWOTA’s administrative support contract, or by retaining another representative to assist.”
Fare Coordination and Revenue Sharing Negotiating regional fare coordination and revenue sharing will be one of the most complex challenges facing the Grand Traverse region and NWOTA’s efforts in this area will provide valuable guidance. This is especially true because NWOTA may be the only case study in the nation that is a close parallel to the Grand Vision’s regional transportation effort. The NWOTA partners found that their five-county system is unique. In researching other regional coordination efforts the only systems they encountered that covered multiple agencies were in urban areas with highly integrated, technological data collection systems, such as a SMART card system. They determined that this approach was not viable for their region, especially because they found that even with large amounts of data, sophisticated technological tracking, and personnel to process and analyze the data, these other systems encountered problems in administering interagency fare systems.
Regional Pass Follow-up Study Their five-year funding plan states that “inadequate information is currently available to forecast fare recovery from a regional pass program for all five agencies.” Therefore, the plan includes a follow-up study “to quantify and evaluate the benefits and/or financial impacts of regional fares… An expected outcome is refinement of the regional fare policy structure to improve geographic fairness and sustainability.” This follow up study is budgeted at $300,000. (David Evans and Associates, 2012)
Non-Profit 501(c)(3) Foundation In addition to the Coordinating Committee, the partnership has created the North by Northwest Transportation Foundation, a non-profit 501(c)(3) organization that will serve as a “friends of transit” group assisting with fundraising for multi-modal transportation projects and programs within the five-county area. The foundation is governed by a board of community members representing businesses, higher education and other civic interests in all five counties. The partnership’s Funding Plan states that, “A close partnership between the Foundation and the transit alliance Coordinating Committee is essential for the continued success and sustainability of the CONNECTOR system. As the transit alliance identifies needs that the Foundation might

Grand Traverse | Mobility Management Strategies Michigan Livable Communities Demonstration Project
Smart Growth America | C-4
be able to help fund, a formal request to the Foundation should be made for each individual project or activity.”
Creation of this foundation is part of a long term goal of overhauling the current grant-dependent funding model for transit and achieving true sustainability through a departure from dependence on unsecure revenue sources and the creation of reliable funding streams.
City-Sponsored Hotel/Motel Programs The partnership has identified hotel/motel programs as a potential funding source for individual agencies. One of the partner agencies (Lincoln County Transit) currently has an informal agreement with the City of Newport to provide bus service to hotels and motels concentrated along the beach. The City reimburses LCT $90,000 annually for this service. The City also prints the transit passes and distributes them to the hotels and motels. The hotel clerk writes the name of the hotel on the pass, and the bus driver accepts the pass as payment. As passengers disembark, the driver gives them tokens to use as transfers for the remainder of the day. Any city hotels or motels can participate in the program and as of December 13, 2011 31 hotels and motels were participating. The lodging establishments are enthusiastic about the passes because they alleviate parking problems and represent a perk that the hotels and motels provide to their customers free of charge.
Human Service Agency Partnerships One of the partner agencies (Sunset Empire Transportation District) is the NEMT provider for three of the counties in the transit alliance and reports that, “It works great because it provides administrative cost support to their district, as well as providing some contract revenue to the three participating county districts.”
Tribal Partnerships Currently one of the partner agencies (LCT) has an excellent partnership with the Siletz Tribe, which provides federal tribal transit dollars for transit service. Discussions are underway with another tribe in the region.
Shoreline Explorer, Maine Another regional coordination model that could be researched further is Maine’s Shoreline Explorer. This service is a public-private partnership between a regional public transit service, intercity bus, Amtrak and three private trolley services. It features unified branding, a centralized website, coordinated schedules and mobility management by a non-profit human services agency.

Grand Traverse | Mobility Management Strategies Michigan Livable Communities Demonstration Project
Smart Growth America | C-5
Shoreline Explorer, Maine www.shorelineexplorer.com/
The Shoreline Explorer connects the coastal communities in York County, Maine and is operated by the York County Community Action Corporation (YCCAC). YCCAC delivers a range of transportation services including trolley, demand-response, and deviated fixed-routes (flex routes). YCCAC also relies on a large volunteer driver system to fill gaps in service. The Shoreline Explorer serves key area tourist destinations in coastal communities, and also includes coordinated connections with local and regional private transportation providers, along with Amtrak’s Downeaster trains between Portland and Boston. The service is provided with six trolley buses, and began operations in 2006.
Located on the southern end of Maine the county and is home to approximately 197,000 residents with small towns, widely separated from each other, many of which do not have a grocery store, bank, or other basic services. Tourism is a major driver for the local economy, however the service workers tend to live in inland communities with high unemployment. The YCCAC, in collaboration with the chambers of commerce and other stakeholders, created the Shoreline Explorer with the goal of providing a transportation option that would help residents get to work and connect the various communities together. Their goal was not only to increase access to jobs for residents, but also to contribute to the economic viability of local businesses. They focused on creating mobility for three target groups: tourists, workers, and local residents with children, who needed a way to go shopping, visit the beach, or go to the museum. (Reconnecting America and Community Trasportation Association of America, 2012)

Grand Traverse | Mobility Management Strategies Michigan Livable Communities Demonstration Project
Smart Growth America | D-1
Supplement D: Fare Coordination TCRP Report Information about this topic is included in the Transit Cooperative Research Program’s (TCRP) report: "Fare Policies, Structures, and Technologies: Update (Multisystems, Inc. et.al., 2003)." The report states that the integration of card/revenue management functions from several agencies can be challenging.
“Complex partnership agreements must be developed to address responsibilities, ownership, and allocation of costs and revenues. A clearinghouse or payment settlement process can be established to manage these processes, but all participating agencies must come to agreement on revenue management policies and procedures. The types of issues and requirements that must be considered in developing a regional fare system generally fall under the following categories:
• Overall Policy and Business Rules. Establishing the business structure, including the financial and governance framework and system procurement strategy; addressing customer concerns; setting fare policy for the region.
• Technical Requirements. Developing system architecture and technology standards; identifying effective implementation staging.
• Administrative and Customer Support Functions. Establishing revenue settlement and data-sharing procedures, as well as customer service functions.”
Caltrans Transit Wiki Another resource that discusses differential fare structures and automated fare media is the Caltrans Transit Wiki (Bergstein, 2012).

Grand Traverse | Mobility Management Strategies Michigan Livable Communities Demonstration Project
Smart Growth America | D-2
Intercity Bus Example The intercity bus industry offers another example of fare coordination between carriers that does not rely on electronic payment media. Ticket prices are based on a per-mile cost, and any ticket agent that is part of the national ticketing system can arrange a ticket for their own carrier’s service with connections to another carrier. For example, a rider can purchase a ticket from Traverse City to Minneapolis through Indian Trails, for a standard fare of $89. The rider would start their trip on an Indian Trails bus then transfer to Greyhound. Indian Trails would retain revenue ($38.27) based on the 43% of the miles on Indian Trails; the remainder would be owed to Greyhound for their portion of the ride. At the end of the month, Indian Trails tallies up how much it owes Greyhound and posts that amount on the national clearinghouse; Greyhound does the same; the net difference is calculated, and that amount is transferred between the two organizations’ bank accounts (i.e., one company writes a check to the other for the amount owed).
A similar mileage-based system could work for the Grand Traverse region in cases where passes are sold for a single ride. However, for multi-ride passes, a mileage-based revenue-allocation system would require implementing electronic pass cards.
Grand Traverse | Mobility Management Strategies Michigan Livable Communities Demonstration Project
Smart Growth America | E-1
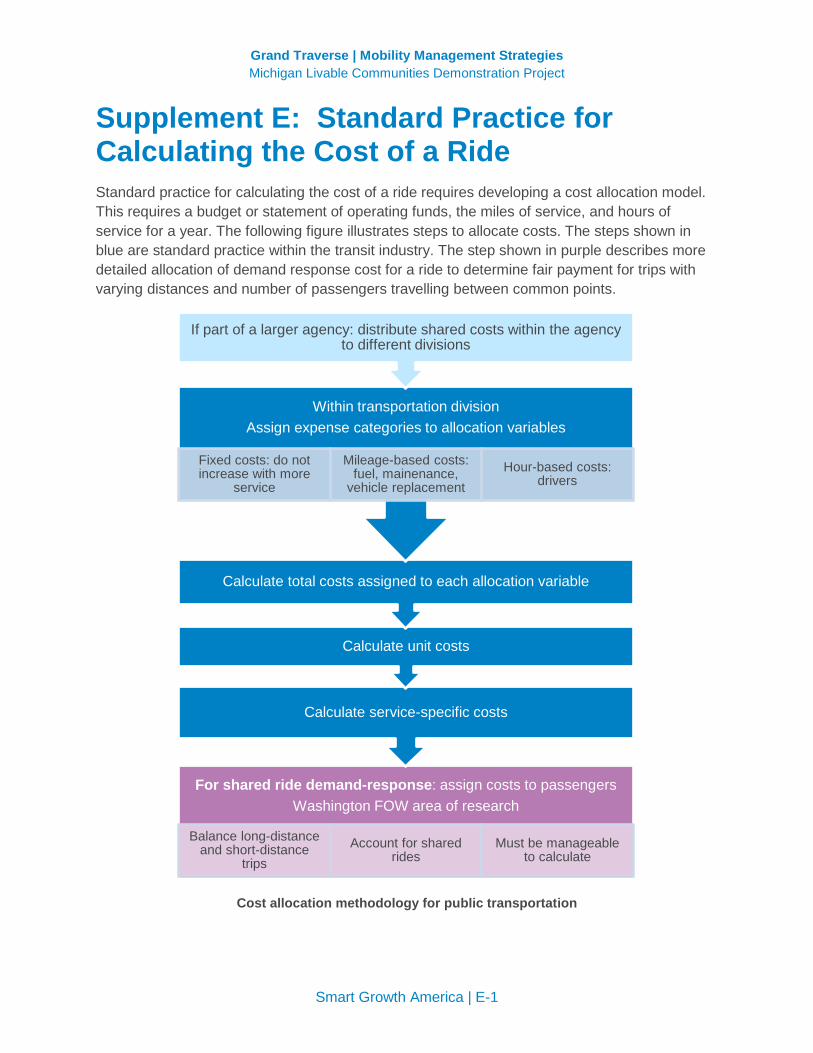
Supplement E: Standard Practice for Calculating the Cost of a Ride Standard practice for calculating the cost of a ride requires developing a cost allocation model. This requires a budget or statement of operating funds, the miles of service, and hours of service for a year. The following figure illustrates steps to allocate costs. The steps shown in blue are standard practice within the transit industry. The step shown in purple describes more detailed allocation of demand response cost for a ride to determine fair payment for trips with varying distances and number of passengers travelling between common points.
Cost allocation methodology for public transportation
For shared ride demand-response: assign costs to passengers Washington FOW area of research
Balance long-distance and short-distance
trips Account for shared
rides Must be manageable
to calculate
Calculate service-specific costs
Calculate unit costs
Calculate total costs assigned to each allocation variable
Within transportation division Assign expense categories to allocation variables
Fixed costs: do not increase with more
service
Mileage-based costs: fuel, mainenance,
vehicle replacement Hour-based costs:
drivers
If part of a larger agency: distribute shared costs within the agency to different divisions

Grand Traverse | Mobility Management Strategies Michigan Livable Communities Demonstration Project
Smart Growth America | E-2
As an example, the cost allocation model for a transit agency we recently worked with is summarized by the following equation from the costs and associated categories in the agency’s budget.
2012 Operating Cost = 1.45 ( $34.90 x
# of Hours in Service
+ $0.87 x # of Miles in Service)
The cost of providing transportation could vary between different organizations if one organization has higher overhead or driver salary costs than another. Such cost variations could result from differences in overall organizational efficiency. Any other significant difference would likely result from accounting practices that do not capture the full cost of the ride. Generally, staffing costs and overhead are more significant factors than fuel costs.
The cost allocation model shown above follows a standard transportation cost allocation models and includes only operating costs. Values for the cost model are calculated as follows:
The average cost per hour of service is $72.31. The average cost per mile of service is $4.20.
When the hours and miles for a special service are estimated, these numbers can be plugged into the formula to estimate cost, which in turn can be used to negotiate contracts.
In addition to allowing an agency to know the true cost of the services provided, a fully allocated cost model also allows equal comparison of costs between varying types of service, such as a commuter service that covers a longer distance at a higher average speed, and an in-town route that travels at a lower average speed with more stops. When combined with ridership, this establishes a baseline for developing a fair contract for service, or multi-agency fare structure.
The cost of providing transportation could vary between different organizations if one organization has higher overhead or driver salary costs than another. Such cost variations could result from differences in overall organizational efficiency. Any other significant difference would likely result from accounting practices that do not capture the full cost of the ride. Generally, staffing costs per hour and overhead are more significant factors than fuel efficiency.
Shared Ride Allocation Cost allocation for shared ride demand response is not yet established in standard practice. Whenever two or more customers are being transported in a vehicle at the same time and those

Grand Traverse | Mobility Management Strategies Michigan Livable Communities Demonstration Project
Smart Growth America | E-3
customers are sponsored by different funding sources, each sponsoring organization is obligated to ensure that it only pays for its share of the service and that it is not subsidizing the transportation of the other riders. This requirement starts at the federal level, according to 42 CFR Part 440.170.
Many recognize that a shared seat allocation, which can be based on time or miles, is an equitable cost allocation methodology. This also happens to be the most complicated methodology to implement and automate, and a major subject of research for the Washington Federal Opportunities Workgroup.

Grand Traverse | Mobility Management Strategies Michigan Livable Communities Demonstration Project
Smart Growth America | F-1
Supplement F: Creating High Quality Web Resources A transit system’s website is one of its most important communication tools. Many riders and potential riders will look for information on the website before they look at a printed schedule. Good website design for transit follows a few simple principles. The information that is most important to the rider should be “above the fold” at the top of the homepage. This can include a trip planner, a map of services, time tables, real-time bus location, and any special announcements about route or schedule changes.
Website Assessment Tool The following table is a useful tool for conducting a quick assessment of a transit website. The sample notes in the table are a website assessment we conducted recently for a city/county service that serves a small city in a rural county.
Website assessment tool with sample notes from another region ELEMENT Y/N STATUS NOTES
Stand-alone website
Y Could be much more attractive and inviting
Website should not be buried in a City or County website and should include good branding. Example: http://actr-vt.org/
Important information above the fold on homepage
N Many features are missing
See notes below
Trip Planner N missing GTFS has not been implemented so don’t have capability to offer a trip planner. The site includes some elements to search schedules. A trip planner powered by Google Transit should be a prominent feature on the home page, especially because many people have a hard time understanding even the best designed schedules and timetables.
Real Time Bus Tracking
N Missing Transit service does not have this capability.
Mobile Interface N Missing Transit service does not have this capability
Riders Guide: How to ride information
N Missing This is a standard feature of transit websites that is particularly helpful for first time riders. A couple good examples are: http://actr-vt.org/riders-guide/#usingtheschedules or “Riding the Bus” link on homepage at www.mountainline.com/

Grand Traverse | Mobility Management Strategies Michigan Livable Communities Demonstration Project
Smart Growth America | F-2
ELEMENT Y/N STATUS NOTES
ADA Compliant Design
N Much of the essential information on the website is not accessible by vision-impaired users.
Examples include the PDF route maps and the route link buttons on the Fixed Routes page. Resources for making websites ADA accessible include: http://usability.com.au/2005/06/accessible-data-tables-2005/#data http://www.ada.gov/pcatoolkit/chap5toolkit.htm
Fare Information Y Incomplete and hard to find
Homepage states that “Tickets and monthly or quarterly passes are available at a discount for regular riders.” But there is no information about how to purchase passes. Also, much of the fare info is buried with schedules. It’s not obvious how to find this info.
Route Maps Y Fairly easy to read and easy to find on website
Maps are unconventional but seem easy to understand. However, there is a lot of visual clutter. It would be better to have all info about stormy weather, fares, etc. on a separate “riders guide” page (see notes & examples above).
Schedules Y Easy to find on website, but somewhat hard to understand.
Design could be improved. Many examples are available on other transit websites. Portland’s Tri-Met system has a reputation of leading the country in technology deployment and information design http://trimet.org/index.htm
Route/Schedule changes special announcements
? ? None are posted so we don’t know if this is a regular practice and what it looks like when/if such notices are posted.
Images N Only one small image on homepage
Pictures really are worth a thousand words and are one of the most effective ways to combat the stigma of riding the bus – the perception that “people like me” don’t ride buses, and riders are all homeless people etc. Every page should have a relatively large photo, ideally with people in it, conveying the message that the bus is safe, modern, convenient, and clean. It would be a much better use of space than the visually distracting little animated bus icon that drives across the bottom of the screen.
Links N Missing No links to other transportation providers and resources such as: services in neighboring counties, find-a-ride resources, social service transportation, ridesharing, etc.
Web-based find-a-ride information The web – accessed from either a computer or a mobile device – is generally the first source where people will look for transportation information. The first priority for transportation providers is to provide complete, up-to-date, easy-to-use, information about their services. Ideally, this

Grand Traverse | Mobility Management Strategies Michigan Livable Communities Demonstration Project
Smart Growth America | F-3
information should include a GTFS-based interactive trip planner for all fixed routes and real time tracking information for all services.
An important second priority should be to include links to other providers in the region. These links should include any one-stop-shop web resources as well as the regional rideshare website: http://old.nwm.org/nmride.asp.
As the region’s public transportation providers move toward a more closely coordinated regional system, all relevant websites should include information about how to make transit connections throughout the region. This could take the form of a “regional connections” webpage on each partner website and/or a centralized, one call – one click website similar to the North by Northwest Connector website in Oregon.
As illustrated in the figure below, and as described by CTAA in its One Call-One Click Toolkit, the goal of a one-call or one-click service is to simplify access for customers and match their varied needs with appropriate options. It can also help communities build a team approach to using their resources, resulting in more mobility.
The investment in staffing resources to achieve this goal can vary widely. At one end of the spectrum, staffing can be limited to maintaining a website. At the other end of the spectrum it can include answering calls from customers and helping them navigate various transportation options. Creating a brokerage is the most staffing-intensive alternative.

Grand Traverse | Mobility Management Strategies Michigan Livable Communities Demonstration Project
Smart Growth America | F-4
High quality trip planning resources are essential for implementing the one-call one-click mobility management vision of providing customer centered service. The goal is to make it easy for customers to find the ride that best meets their needs, whether that ride is provided by public transportation, a private operator, a human service agency or a ridesharing program. Ideally find-a-ride services should also provide information about bicycle-pedestrian options.
Find-a-ride resources should address all stages of trip planning. For example, the first stage of trip planning could be a tourist planning their trip several weeks in advance and searching the web to determine whether they can combine public transportation with a bike ride they would like to do; Or it could be a commuter who is researching whether it would work to try the bus for the first time. The final stage of trip planning would be the tourist or commuter standing at a bus stop and using their smart phone to determine when the bus will arrive. For demand-response services, an important middle stage of trip planning is calling to reserve a ride.
Integrating bicycle and pedestrian information Web based information as well as hard copy material and signage should all be considered. Where relevant this could include information about trails that are good transportation options and/or recreational destinations. For bus stops and transfer locations information about sidewalk and bike lane access would be important to provide. For some areas it may be equally important to highlight significant gaps in safe bicycle/pedestrian connectivity. While it may only be possible to provide this information using static maps and text, capabilities are currently evolving for incorporating this information into automated trip planning. In particular, pathways can now be entered into Google Maps.
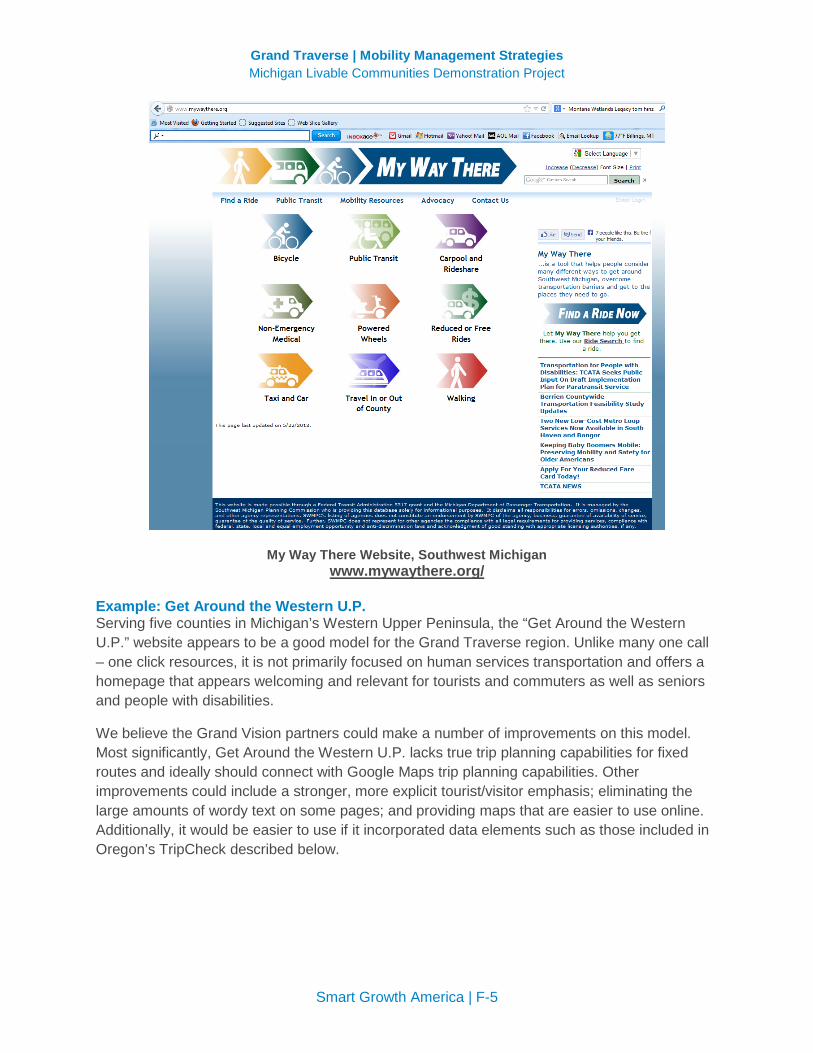
Example: My Way There, Southwest Michigan Southwest Michigan’s “My Way There” website has an attractive, easy to navigate design with content that includes all transportation options. A similar design could work well for The Grand Traverse Region. To add a stronger tourist appeal, an attractive photo could be added to the homepage with a link to a visitors’ transportation guide.
Grand Traverse | Mobility Management Strategies Michigan Livable Communities Demonstration Project
Smart Growth America | F-5
My Way There Website, Southwest Michigan www.mywaythere.org/
Example: Get Around the Western U.P. Serving five counties in Michigan’s Western Upper Peninsula, the “Get Around the Western U.P.” website appears to be a good model for the Grand Traverse region. Unlike many one call – one click resources, it is not primarily focused on human services transportation and offers a homepage that appears welcoming and relevant for tourists and commuters as well as seniors and people with disabilities.
We believe the Grand Vision partners could make a number of improvements on this model. Most significantly, Get Around the Western U.P. lacks true trip planning capabilities for fixed routes and ideally should connect with Google Maps trip planning capabilities. Other improvements could include a stronger, more explicit tourist/visitor emphasis; eliminating the large amounts of wordy text on some pages; and providing maps that are easier to use online. Additionally, it would be easier to use if it incorporated data elements such as those included in Oregon’s TripCheck described below.

Grand Traverse | Mobility Management Strategies Michigan Livable Communities Demonstration Project
Smart Growth America | F-6
Trip planner example from the Upper Peninsula
http://www.getaroundwup.com/
Example: Oregon TripCheck Oregon’s Trip Check was among the first in the country to take on regional trip planning including human service transportation. As described in a 2003 planning document,
“The long term goal is to develop a system that will allow anyone wishing to take a trip within the region to log on to an internet site, access a kiosk, or from their PDA and easily get information on multiple travel options, plan the trip itinerary, and reserve/pay for that trip. In the event that no public transit services are available or the user is interested in other available options, the system will be able to provide rideshare, carpool or shuttle/taxi choices.”

Grand Traverse | Mobility Management Strategies Michigan Livable Communities Demonstration Project
Smart Growth America | F-7
Oregon Trip Check
TripCheck has been developed in stages. The first stage was a web-based clearinghouse. As stated in its System Recommendations document, it included:
• Interactive tools to locate appropriate service provider: o Map based interface to identify a list of transit service providers by clicking on a
map of the state o Zone-to-zone intercity carrier identification based on the trip origin and
destination (trip origins/destinations can be selected via a map or through a pick list of cities)
o Map based interface to identify demand responsive/dial-a-ride service providers through a map of service area boundaries
• List of all public/private transit service providers within the State of Oregon, organized by sub-regions, including:
o Heavy rail

Grand Traverse | Mobility Management Strategies Michigan Livable Communities Demonstration Project
Smart Growth America | F-8
o Long distance bus service o Local public fixed route service providers (IntraCity) o Private fixed route intercity providers o Demand responsive services o Special need brokerages o Shuttle/taxi services o Web-based rideshare or service planning services offered by partner agencies o Links to sites with useful content o Comprehensive transit data for each of the transit providers o Announcements/holiday schedules o General service area map and description o Contact information, service hours, etc. o Routes, schedules, stops, time points, fare structures, connection points o Maps of routes/patterns o Maps of stop locations o Ticket sale locations o Interactive GIS maps and tools o Service area boundaries for all transportation providers o Bike maps and trails o Key landmarks and activity locations.
For a website like this, carefully planned data collection and database design is essential for achieving the vision. One of the lessons learned from the implementation of this project was that ODOT identified the importance of using automated tools for importing and maintaining the data.
The second phase of TripCheck’s trip planning capabilities allowed the traveler to automatically generate a trip from their origin to their destination. This capability included trips using multiple providers. (Kamm 2003)
This was made more feasible by Google Transit coming onto the scene in 2007. Oregon assisted all of its transit providers in developing a GTFS feed by putting together a contract for developing those feeds; northern California and Idaho also put together contracts for this data development. As a result, more west coast transit systems have GTFS feeds than anywhere else in the country. According to City go Round, as of April 23, 2013, 62 of 128 California transit agencies have open GTFS data; 30 of 39 Oregon transit agencies have open data; 14 of 30 Washington agencies have open data; all Idaho transit agencies use GTFS but none have open data.
We recommend that transit services be described with data elements that match those that are used by Oregon Trip Check human service providers, and that all fixed routes are put into GTFS.
The Ride Connection example below shows TripCheck’s trip planning capability for options within or near Bend. Options for travelling between cities look similar to those within a city but include a trip planner and links to the transportation options within the communities where the
Grand Traverse | Mobility Management Strategies Michigan Livable Communities Demonstration Project
Smart Growth America | F-9
trip begins and ends. Public transportation options between cities utilize the Google trip planner. If the option is Greyhound or Amtrak, Trip Check links to their trip planners.
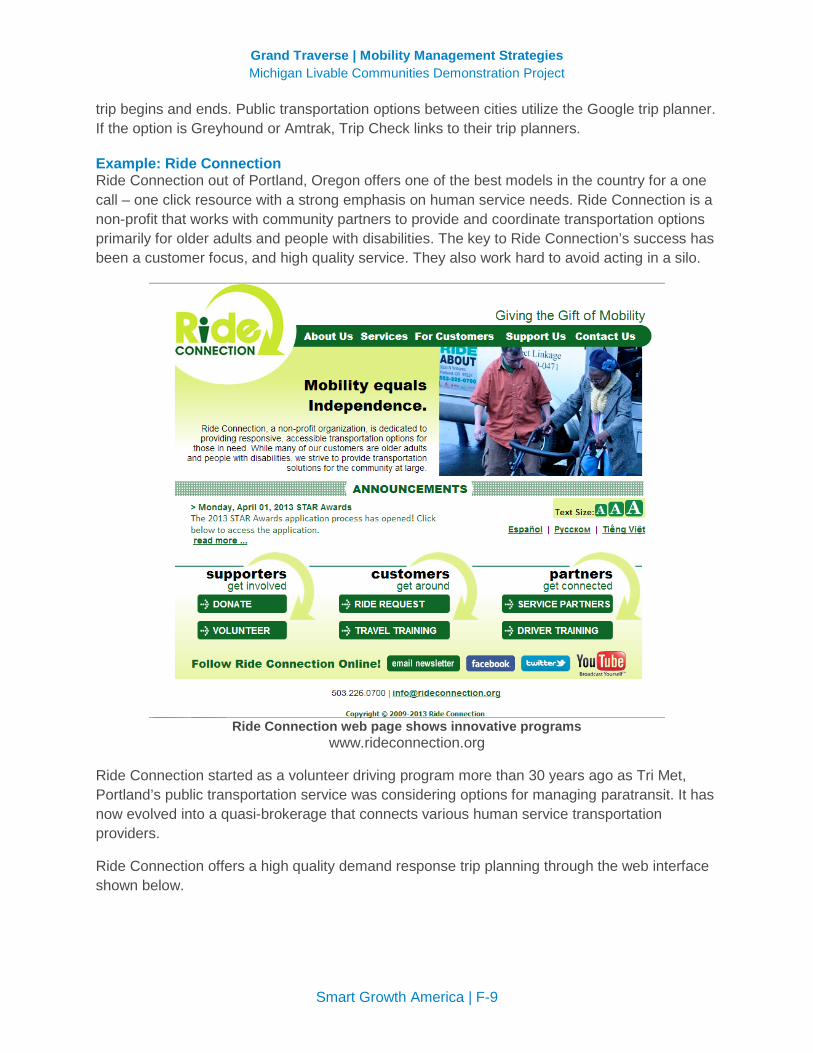
Example: Ride Connection Ride Connection out of Portland, Oregon offers one of the best models in the country for a one call – one click resource with a strong emphasis on human service needs. Ride Connection is a non-profit that works with community partners to provide and coordinate transportation options primarily for older adults and people with disabilities. The key to Ride Connection’s success has been a customer focus, and high quality service. They also work hard to avoid acting in a silo.
Ride Connection web page shows innovative programs
www.rideconnection.org
Ride Connection started as a volunteer driving program more than 30 years ago as Tri Met, Portland’s public transportation service was considering options for managing paratransit. It has now evolved into a quasi-brokerage that connects various human service transportation providers.
Ride Connection offers a high quality demand response trip planning through the web interface shown below.
Grand Traverse | Mobility Management Strategies Michigan Livable Communities Demonstration Project
Smart Growth America | F-10
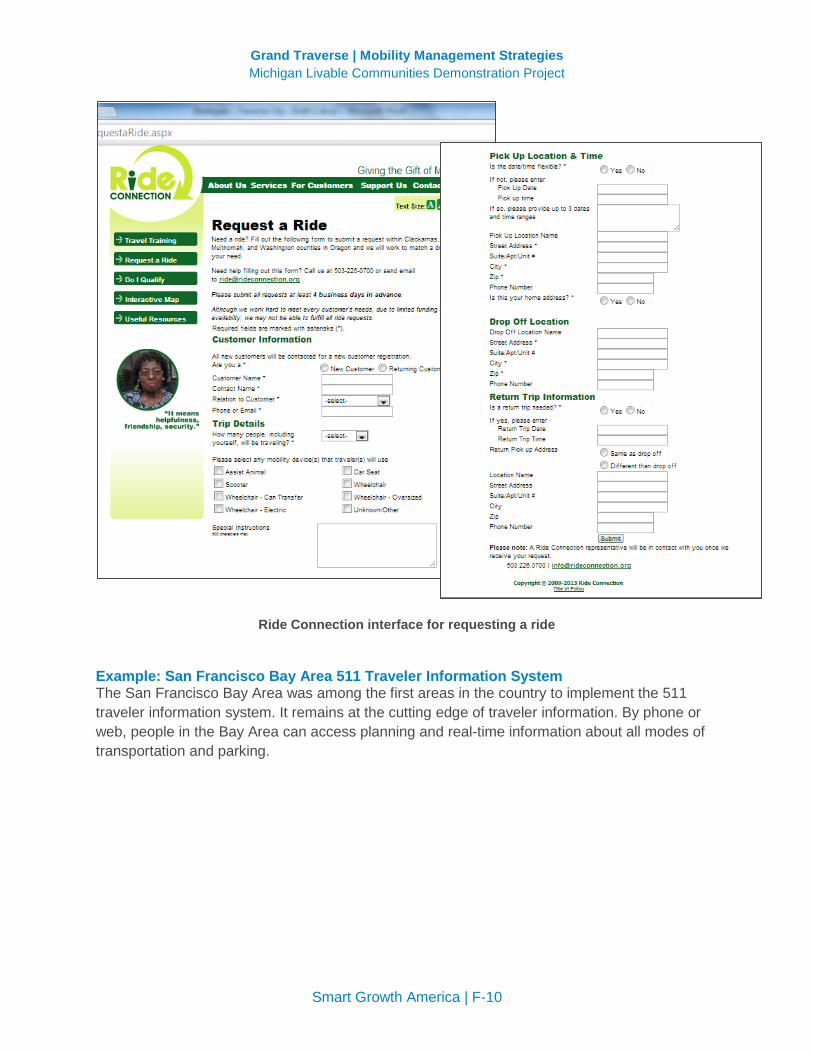
Ride Connection interface for requesting a ride
Example: San Francisco Bay Area 511 Traveler Information System The San Francisco Bay Area was among the first areas in the country to implement the 511 traveler information system. It remains at the cutting edge of traveler information. By phone or web, people in the Bay Area can access planning and real-time information about all modes of transportation and parking.

Grand Traverse | Mobility Management Strategies Michigan Livable Communities Demonstration Project
Smart Growth America | F-11
511 transit trip planner for the San Francisco Bay Area
Example: Michigan MI Commute Website MI Commute is Michigan’s statewide trip planning one call – one click resource. It includes good educational content. However, it’s effectiveness for helping people find rides is dependent on the quality of the local websites it links to.

Grand Traverse | Mobility Management Strategies Michigan Livable Communities Demonstration Project
Smart Growth America | F-12
Mi Commute

Grand Traverse | Mobility Management Strategies Michigan Livable Communities Demonstration Project
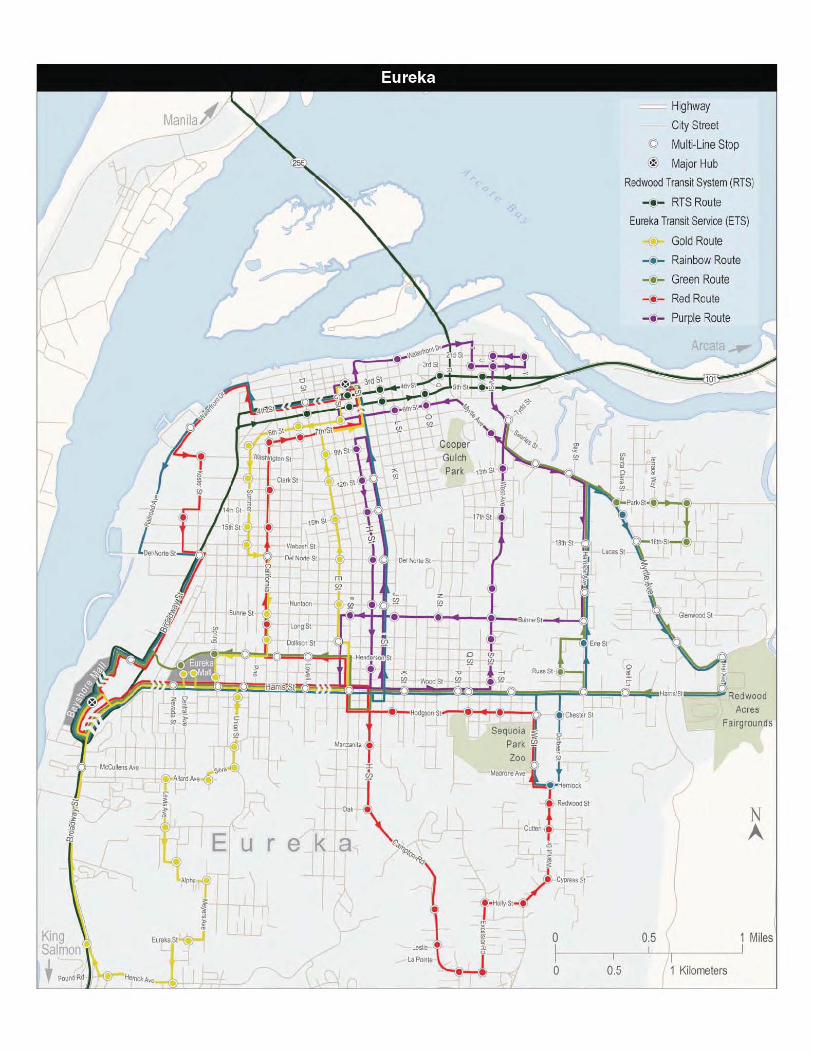
Smart Growth America | G-1
Supplement G: Humboldt Transportation Services Guide Web-based information can be supplemented with hard copy resources. Washington, Oregon, and coastal northern California offer printed (and PDF) public transportation directories, for example the Washington State Public Transportation Directory (Washington State Department of Transportation, 2013).
The coastal northern California example is included here.
http://www.trilliumtransit.com/trillium-wordpress/wp-content/uploads/2010/01/Humboldt-County-Transportation-Guide-FINAL-low-resolution.pdf


4 Humboldt County Transportation Services Guide
FaresRegional transit passes
$10 or $20 stored value magnetic media cards that allow you to ride the four regional transit systems at a discounted rate.
Your magnetic pass can be used on any system at any time. Just swipe the card when you board the bus and it will deduct the correct discounted rate for that system. Let the driver know if you are entiled to a reduced fare before you board.Day passes & month passes
Day & Month Passes are valid for unlimited rides until the date and time of expiration printed on the back of the pass. Each time you wish to use the pass after purchasing it, simply swipe it through the card reader.Transfers
Free transfers are provided between routes of the same system for a single trip. No free inter-agency transfers are available. For example, if you transfer from one ETS to another ETS route, then the transfer is free. However, for a transfer from Redwood Transit System to the Eureka Transit Service, passengers are required to pay the full one-way fare when boarding the ETS bus.
Tell the driver you want a transfer when you board the bus. You can only get a transfer upon boarding. To use a transfer when you board a bus on another route simply insert it into the card reader. When you hear a beep the transfer is recognized as valid and you may proceed to board the bus.Purchasing passes
You can puchase passes online with a credit card and have them mailed to you. See the HTA online store (www.hta.org).
You can purchase passes from the bus driver using cash. Important note: If you are not paying a cash fare do not put your money in the farebox until you tell the driver what you want to buy. You will not be refunded for money placed in farebox accidently.
Passes can also be purchased at the Humboldt Transit Authority office at 133 V Street in Eureka using Visa, Mastercard, or a personal check. Passes can also be purchased at the Arcata Transit Center at 925 E Street, Arcata.Using the fareboxes
Have your exact fare ready to insert into the farebox before boarding the bus. Neither the driver nor the new farebox can make change or refund money put into the farebox by accident.
Paper money (bills) - Feed unfolded bills into the bill slot. The farebox will not accept bills larger than $20.
Coins - Drop coins, one at a time, into the coin slot. Coins accepted are: nickels, dimes, quarters, halves & small dollar coins. Fareboxes do not accept pennies or large dollar coins.
A digital display shows the exact amount deposited. When you hear a beep you have paid the correct fare and may proceed to board the bus. If you are entitled to a reduced cash fare be sure to tell the driver before you place your money in the farebox.Humboldt State University students ride RTS, ETS, AMRTS free
Matriculated Students: If you are registered for the current semester, swipe your HSU ID card in the card reader as you board the bus for a free “Jack Pass” ride. Extended Ed students, OLLI students, faculty, and staff may purchase the Jack Pass privilege to be linked to their ID card each semester at HSU’s Student and Business Services Building (SBSB).
College of the Redwoods students ride with discountsInquire with parking and transportation services for further information.
Use “commuter checks” to apply tax-free income to commuter expenses
For more information, see www.hta.org/commuter_benefits.html
Fare type 1 ride Multi-ride rate(Transit pass)
Monthlypass
Adult (18-62) $2.50 $1.50 $50Youth (3-17) $2.25 $1.25 $45Senior (62+) $2.25 $1.25 $45Disabled (with valid ID card) $2.25 $1.25 $45
Other fares:In-town $1.50 - cash only (rides taking place inside only 1 city)
Fare type 1 ride Multi-ride rate(Transit pass)
Monthlypass
GARBERVILLE/EUREKA INTERCITY SERVICEAdult (18-62) $4.50 $3.00 $90Youth (3-17) $4.00 $2.50 $80Senior (62+) $4.00 $2.50 $80Disabled (with valid ID card) $4.00 $2.50 $80
LOCAL SOUTHERN HUMBOLDT SERVICEAdult (18-62) $1.25 $1.00Youth (3-17) $1.00 $0.75Senior (62+) $1.00 $0.75Disabled (with valid ID card) $1.00 $0.75
Fare type 1 ride Multi-ride rate(Transit pass)
Monthlypass
Adult (18-62) $3.50 $2.50 $70Youth (3-17) $3.00 $2.00 $65Senior (62+) $3.00 $2.00 $65Disabled (with valid ID card) $3.00 $2.00 $65
Fare type 1 ride Mult-ride rate(Transit pass)
Monthlypass
Adult (18-62) $1.40 $1.10 $43Youth (3-17) $1.10 $0.80 $38Senior (62+) $1.10 $0.80 $38Disabled (with valid ID card) $1.10 $0.80 $38
Fare type 1 ride Multi-ride rate(Transit pass)
Monthlypass
Adult (18-62) $1.40 $0.75 $30Youth (3-17) $0.75 $0.60 $25Senior (62+) $0.75 $0.60 $25Disabled (with valid ID card) $0.75 $0.60 $25
Fare type 1 ride Day pass10 one-way tickets
Adult $2.00 $3.00 $13Reduced $1.75 $2.75 $12
Adult $3.00 $4.00 $17Reduced $2.75 $3.75 $16
Adult $2.00 $3.00 $13Reduced $1.75 $2.75 $12
Mainline RTS service (Scotia/Trinidad)
Southern Humboldt Transit System
Day Passes $4.00 - give you unlimited travel anywhere between Scotia and Trinidad. See purchasing passes, below.
Arcata and Mad River Transit System
RTS Extension: Willow Creek service
KT-NET reduced fares for youth (3-12), senior (62+), and disabled (with valid ID)
Eureka Transit Service
Klamath-Trinity Non-emergency Transportation
BETWEEN WILLOW CREEK AND HOOPA
BETWEEN WILLOW CREEK AND WEITCHPEC
BETWEEN HOOPA AND WEITCHPEC

5Humboldt County Transportation Services Guide
Simple steps you can follow that help make your trip a safe one:
• Plan your route ahead of time.• Locate your origin and destination bus stops prior to your first day of commuting on the bus.
• Get to the bus stop at least five minutes early. If you’re sitting on a bench, stand when you see the bus approaching to signal the driver to stop.
• Never walk directly in front of or behind a bus. The operator and other drivers may not see you.
• Check the headsign listed above the windshield to make sure you board the right bus.
• Have your correct fare ready. Drivers cannot take checks and do not carry change.
• When the bus arrives, step aboard through the front door. If you need any assistance with a connecting route, ask the driver. Once completed, find a comfortable location for your ride.
• In slippery winter conditions, be extra careful getting on and off the bus.
• Depending on the bus, there may be different mechanisms to request your stop. As your stop approaches, press the yellow strip or pull the signal cord located along the interior windows. You will hear a chime and see the “stop requested” sign illuminate. This signals the driver to stop at the next stop.
• Exit through the rear door.
Bus stop locations
Bus stop signs are installed for most stops on Redwood Transit System, Arcata and Mad River Transit, and Eureka Transit Service routes. These signs indicate where to wait for and board the bus. On Redwood Transit System the bus headsign will display the location farthest north or south that the bus will travel. Since there may be other people standing by the stop who do not want to ride the bus, be sure to wave at the bus as it approaches. Flagging eliminates unnecessary stops and enables faster, more efficient service.
Bike racks
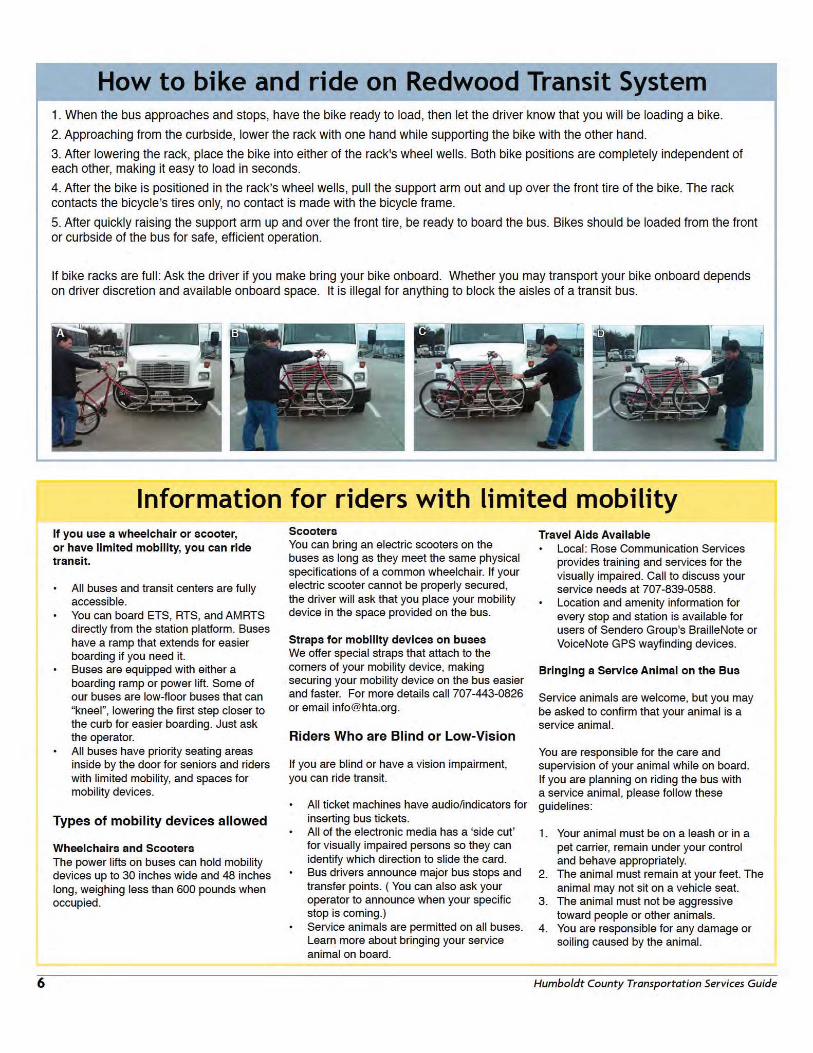
RTS buses are all equipped with bike racks in front of the bus, each holding two bikes. See “How to bike and ride on Redwood Transit System,” next page for more information on how to utilize these racks. ETS and AMRTS buses do not have bike racks.
How To Ride The Bus
New Year's Day No serviceMartin Luther King, Jr. Day Saturday serviceMemorial Day Saturday serviceLabor Day Saturday serviceIndependence Day No serviceThanksgiving Day No serviceDay after Thanksgiving Saturday serviceChristmas Day No serviceDay after Christmas Saturday service
New Year's Day No serviceMartin Luther King, Jr. Day No serviceMemorial Day No serviceLabor Day No serviceIndependence Day No serviceThanksgiving Day No serviceDay after Thanksgiving No serviceChristmas Day No serviceDay after Christmas No service
New Year's Day No serviceMartin Luther King, Jr. Day Saturday serviceMemorial Day Saturday serviceLabor Day Saturday serviceIndependence Day No serviceThanksgiving Day No serviceDay after Thanksgiving Saturday serviceChristmas Day No serviceDay after Christmas Saturday service
New Year's Day No serviceMartin Luther King, Jr. Day Saturday serviceMemorial Day Saturday serviceLabor Day Saturday serviceIndependence Day No serviceThanksgiving Day No serviceDay after Thanksgiving Saturday serviceChristmas Day No service
Redwood Transit System Mainline holidays
RTS Willow Creek Extension and Southern Humboldt Transit
System holidays
Eureka Transit Service holidays
Arcata and Mad River Transit holidays
On the bus
• Keep the aisle clear of tripping hazards such as bags, backpacks, and briefcases.
• Stand back from the front of the bus so the operator has a clear view of the doorway and mirrors.
• Sit where you can see your upcoming stop.
For safety reasons, you cannot go barefoot on the bus, nor wear skates or rollerblades.
Children
• Take extra care when traveling with young children. Hold their hand when boarding and exiting. Keep them seated to avoid falls and bumps, and watch that they don’t put their hands and head out the window.
• Hold strollers securely, put on their brakes and keep the aisle clear, or hold your child and fold the stroller.
Lost and found
Please check your seat before leaving the bus and make sure you have all your belongings.However, if you do leave something on RTS or ETS, you may call the HTA office at (707) 443-0826. For Arcata and Mad River Transit, phone (707) 822-3775. Every attempt will be made to recover your lost item. Items will be kept up to 30 days, so please pick up your items within that time.
Reduced fares for seniors & disabled
Reduced fares on fixed route buses are available to senior citizens and disabled persons who have been certified. Forms are available at the HTA office. I.D. cards from other systems will be honored.
We can help
• If you feel uncomfortable because of other individuals onboard, or are unsure about stops and bus riding logistics, sit near the front of the bus.
• If you’re lost or feel sick, harassed or threatened, speak to the operator who will help or radio for help.
If you have any concerns please call HTA at 707-443-0826.

7Humboldt County Transportation Services Guide
Yourmessagehere.
Let transit riders know you are are on the way.Your business or organization can purchase advertising in future editions of this guide.
For more information, contact Humboldt Transit Authority.(707) [email protected]
Advertise in this guide

8 Humboldt County Transportation Services Guide
RTS Mainline: SouthboundWeekday
2 4 6 8 10* 12 14 16 18 20 22 24 26 28 30Trinidad Park & Ride 6:52 9:12 11:346th Ave at Spring Ln, Westhaven 6:56 9:16 11:38Scenic Dr. at Moonstone Beach Rd 6:59 9:19 11:41Clam Beach Road 7:03 9:23 11:45Central Ave at Grange Road 7:06 9:26 11:48Arcata/Eureka Airport 5:59 7:09 7:56 9:29 10:01 11:23 11:51Central & Murray, McKinleyville 6:03 7:13 8:00 9:33 10:05 11:25 11:55McKinleyville High School 6:05 7:05* 7:15 8:02 9:35 10:07 11:27 11:57Railroad Drive & Central Ave 6:07 7:07* 7:17 8:05 9:37 10:09 11:29 11:59McKinleyville Shopping Center 6:10 7:10* 7:20 8:08 9:40 10:12 11:32 12:02School Road, McKinleyville 6:12 7:12* 7:22 8:10 9:43 10:14 11:36 12:04Bella Vista Avenue 6:14 7:14* 7:24 8:12 9:44 10:16 11:38 12:06Valley West Blvd 6:19 8:17 10:22 11:42 12:11Valley East Blvd 6:22 8:20 10:25 11:45 12:14HSU Library Circle 6:28 7:10 7:21* 7:31 8:08 8:26 8:57 9:53 10:31 11:40 11:51 12:2014th & B Streets, Arcata 6:30 7:12 7:25* 7:33 8:10 8:28 8:59 9:55 10:33 11:42 11:53 12:22Arcata Transit Center 6:33 7:16 7:29* 7:37 8:14 8:33 9:03 9:59 10:37 11:46 11:57 12:26H & 6th, Arcata 6:35 7:18 7:39 8:16 8:35 9:05 10:01 10:39 11:48 11:59 12:28Manila Community Center 6:44 8:44 12:374th & U Streets, Eureka 7:29 7:42* 7:50 8:27 9:16 10:13 10:50 12:00 12:11Greyhound Station 6:52 7:30 7:43* 7:52 8:28 8:52 9:17 10:15 10:52 12:02 12:13 12:454th & K Streets, Eureka 6:54 7:32 7:45* 7:54 8:30 8:54 9:19 10:16 10:54 12:04 12:15 12:474th & H Streets, Eureka 6:57 7:33 7:46* 7:57 8:31 8:57 9:20 10:19 10:57 12:07 12:18 12:504th & D Streets, Eureka 6:58 7:34 7:47* 7:58 8:32 8:58 9:21 10:20 10:58 12:08 12:19 12:51Broadway & Del Norte, Eureka 7:03 7:39 7:52* 8:03 8:37 9:03 9:26 10:25 11:03 12:13 12:24 12:56Bayshore Mall 6:05 7:08 7:20 7:44 7:57* 8:08 8:42 9:08 9:31 10:30 11:30 11:08 12:18 12:31 1:01Broadway St & McCullen Ave 7:10 7:46 7:59* 8:10 8:44 9:10 9:33 10:32 11:10 12:20 12:33 1:03Spruce Point / Humboldt Hill 8:14 10:36 12:24King Salmon Avenue 8:16 10:38 12:26Fields Landing Dr & Central Ave 7:15 8:17 9:15 10:39 11:15 12:27 12:38 1:08College of the Redwoods 7:20 7:54 8:07* 8:22 8:52 9:20 9:41 10:44 11:40 11:21 12:32 12:43 1:13Scenic and Loleta Drive 8:33 9:31 11:32 1:24Fernbridge Dr @ Rt 211 8:38 9:36 11:37 1:29Plamer Creek Rd @ Palmer Blvd, Fortuna 8:41 9:39 11:40 1:3211th & N Streets, Fortuna 6:25 7:35 7:40 8:45 9:43 9:56 10:59 11:55 11:44 12:58 1:36Fortuna Blvd. & Smith Lane 6:28 7:38 7:43 8:48 9:46 9:59 11:02 11:58 11:47 1:01 1:39Redwood Village Shopping Center, Fortuna 6:30 7:40 7:45 9:48 12:00 1:41Redwood Memorial Hospital, Fortuna 6:31 7:41 7:46 9:49 12:01 1:42Rohnerville Rd. & School St., Fortuna 7:45 9:53 1:46Campton Heights Market, Fortuna 7:46 9:54 1:47S. Fortuna Blvd (Kragen Auto Parts) 8:50 10:01 11:04 11:49 1:03Kenmar Rd (Fortuna Overlook) 7:50 8:53 9:58 10:04 11:07 11:52 1:06 1:51Rigby Ave & Center Street, Rio Dell 8:02 10:08 2:03Rigby Ave & Davis Street 8:04 10:09 2:05Wildwood & Davis (Rio Dell City Hall) 8:05 10:10 2:06Hobyʼs Market, Scotia 8:08 10:13 2:09Weott offramp 7:01 8:16 12:31Myers Flat 7:07 8:22 12:37Miranda offramp 7:14 8:29 12:44Shop Smart, Redway 7:24 8:39 12:54Melville and Redwood Dr, Garberville 7:34 8:49 1:04
* Trip 10 is Monday - Thursday, and only when HSU is in session (Spring + Fall semseter)
PM times in bold.RTS MAINLINE SOUTHBOUND WEEKDAY SCHEDULE CONTINUED ON NEXT PAGE
Redwood Transit System - Weekday schedule www.redwoodtransit.org(707) 443-0826

[Timetables removed for brevity]


20 Humboldt County Transportation Services Guide
H & 3rd :59 H & 3rd :00 H & 3rd :00Waterfront & L :00 6th & G :02 4th & D Streets :013rd & T :03 6th & C :03 Waterfront & Marina :023rd & V :04 Summer & 7th :04 Koster & Washington :042nd & Y :04 Summer & Clark :05 Short near W 15th :052nd & V :05 Summer & 15th :06 Broadway & Del Norte :06Tydd near West :09 Summer & Wabash :07 Bayshore Way :08Myrtle & Sunny :11 California & Del Norte :08 Bayshore Mall :14Myrtle & Dean :12 California & Buhne :09 Harris & Nevada :16Harrison & 18th :13 California & Dollison :09 Harris & Elizabeth :16General Hospital Campus :15 Henderson & Summer :10 Harris & Summer :17Buhne & Harrison :16 Spring & Harris :12 Harris & Lowell :17Buhne & S :17 Union & West Everding :13 F & Harris (arrives) :18Buhne & N :18 Union & Highland :13 F & Harris (departs) :27Buhne & J :19 Union & Silva :14 H & Manzanita :28Buhne & F :20 Spring near Allard :15 H & Oak :29E & Dollison :21 Little Fairfield & Allard :15 Moose Lodge on Campton :31F & Harris (arrives) :24 Little Fairfield & Sea :16 Campton & Leslie :31F & Harris (departs) :32 Bingen & Lewis :16 Campton & Herron :32I & Huntoon :33 Alpha & Myers :19 Excelsior & Campton :32I & Del Norte :34 Eureka & Leonard :20 Excelsior & Holly :33I & 15th :35 Vance & Herrick :21 Holly & Walnut :33I & 12th :35 Herrick & Elk River Rd. :22 Walnut & Cypress :34H & 9th :37 K Mart :24 Walnut & Fern :35H & 12th :37 Broadway St & McCullen Ave :26 Walnut & Redwood :35H & 15th :38 Bayshore Mall :31 Sequoia Park on W :36H & Del Norte :38 Eureka Mall :35 W & Chester :36H & Huntoon :39 Central near W Henderson :36 Hodgson & T :37H & Russ :39 Harris & Elizabeth :37 Hodgson & Q :38F & Harris :44 Harris & Summer :38 Hodgson & J :39Harris & K :44 Harris & Lowell :38 F & Harris :45Harris & Q :45 F & Harris (arrives) :40 Henderson & Lowell :46S & Wood :46 F & Harris (departs) :48 Henderson & A :47S & Carson :46 E & Dollison :49 California & Long :48S & Huntoon :47 E & Huntoon :50 California & Del Norte :49West & 17th :48 E & Del Norte :51 California & 15th :50West & 13th :48 E & 15th :52 California & Simpson :51Myrtle & Tydd :49 E & Clark :53 California & 7th :526th & O :51 E & 9th :53 7th & C :526th & L :52 H & 3rd :59 H & 3rd :59H & 3rd :59
Purple Route Gold Route Red Route
Weekdays, Purple Route begins service at H & 9th @ 6:39 A.M. and ends service at H & 3rd @ 7:00 P.M. Saturdays, Purple Route begins service at H & 3rd at 10 A.M. and ends at H & 3rd @ 5:00 P.M.
Gold Route begins service on weekdays at Adult Ed School @ 6:15 a.m. and ends service @ 7:00 p.m. at H & 3rd. The Gold Route also operates on Saturday, beginning at H & 3rd at 10am and running until 5pm.
The Red Route runs on weekdays only, beginning service at H & Manzanita @ 6:28 a.m. and ends service @7:00 p.m. at H & 3rd.
Eureka Transit ServiceWeekday services: Purple, Gold, Red, GreenSaturday services: Purple, Gold, RainbowGeneral fare: $1.40map is on previous page
www.eurekatransit.org(707) 443-0826

21Humboldt County Transportation Services Guide
Buhne & Harrison :01 H & 3rd :00Harrison & 18th :02 4th & D Streets :02Tydd near West :09 Waterfront & Marina :03Myrtle & Sunny :10 Broadway & Del Norte :06Myrtle & Dean :11 Bayshore Way :08Park & Myrtle :12 Bayshore Mall :14Park near Vernon :13 Harris & Nevada :18Park & Nedra :14 Harris & Elizabeth :19Nedra & 18th :14 Harris & Summer :2018th & Myrtle :15 Harris & Lowell :21Myrtle & Glenwood :16 F & Harris :22Myrtle & Hubbard :16 Harris & K :23Myrtle & Hall :17 Harris & Q :24Hall & Viale :18 Harris & U :25Harris & Granada :19 Dolbeer & Chester :26Harris & U :20 Hemlock & Walnut :27Harris & P :21 Sequoia Park on W :28Harris & K :22 W & Chester :29F & Harris :26 Harrison & Harris :30F & Harris (departs) :28 Harrison & Erie :31Henderson & Lowell :29 General Hospital Campus :33Henderson & A :30 Harrison & 18th :34Henderson & Summer :30 Myrtle near Vernon :35Henderson & Spring :31 18th & Myrtle :37Henderson & Central :31 Myrtle & Hubbard :37Bayshore Way :34 Myrtle & Hall :38Bayshore Mall :37 Hall & Viale :39Harris & Nevada :39 Harris & Granada :40Harris & Elizabeth :40 Harris & U :41Harris & Summer :41 Harris & P :42Harris & Lowell :41 Harris & K :43F & Harris (arrives) :44 F & Harris (arrives) :44F & Harris (departs) :52 F & Harris (departs) :52Harris & K :52 I & Huntoon :54Harris & Q :53 I & Del Norte :55Harris & U :54 I & 15th :56Harrison & Harris :56 I & 12th :56St. Joseph's Hospital :58 H & 3rd :59General Hospital Campus :59
Green Route Rainbow Route
Green Route begins at Bayshore Mall @ 6:37 a.m. and ends service @ 6:44 @ Harris & F
The rainbow route operates on Saturdays only, beginning at H & 3rd at 10am, and running hourly until 5pm.
For location… Use bus stop:Adorni Center Waterfront & L
served by Purple RouteAdult Education School Walnut & Cypress
RedBurre Center Myrtle & Tydd
PurpleCostco Short near W. 15th
RedEureka Zoo W near Chester
Red, RainbowDept. of Motor Vehicles Summer & 15th
GoldForest Service Bayshore Way
Red, Green, RainbowH & 3rdGold, Purple, Rainbow, Red
Moose Lodge Moose Lodge on CamptonRed
Myrtletown Shops Myrtle near VernonRainbow
Redwood Acres Harris & HallGreen, Rainbow
Senior Resouce Center California & SonomaGold, Red
Sequoia Park Sequoia Park on W StRed, Rainbow
Social Services Koster and WashingtonRed
Silvercrest Tydd near WestPurple, Green
St. Joseph Hospital Dolbeer & RussGreen
Target 2nd and YPurple
Wharfinger Building Waterfront Drive & Marina WayRed, Rainbow
WinCo Harris & ElizabethGold, Red, Green, Rainbow
Zane Junior High S & HuntoonPurple
Eureka Transit landmarks
Humboldt County Courthouse
Eureka Transit Service www.eurekatransit.org(707) 443-0826
Weekday services: Purple, Gold, Red, GreenSaturday services: Purple, Gold, RainbowGeneral fare: $1.40map is on page 18
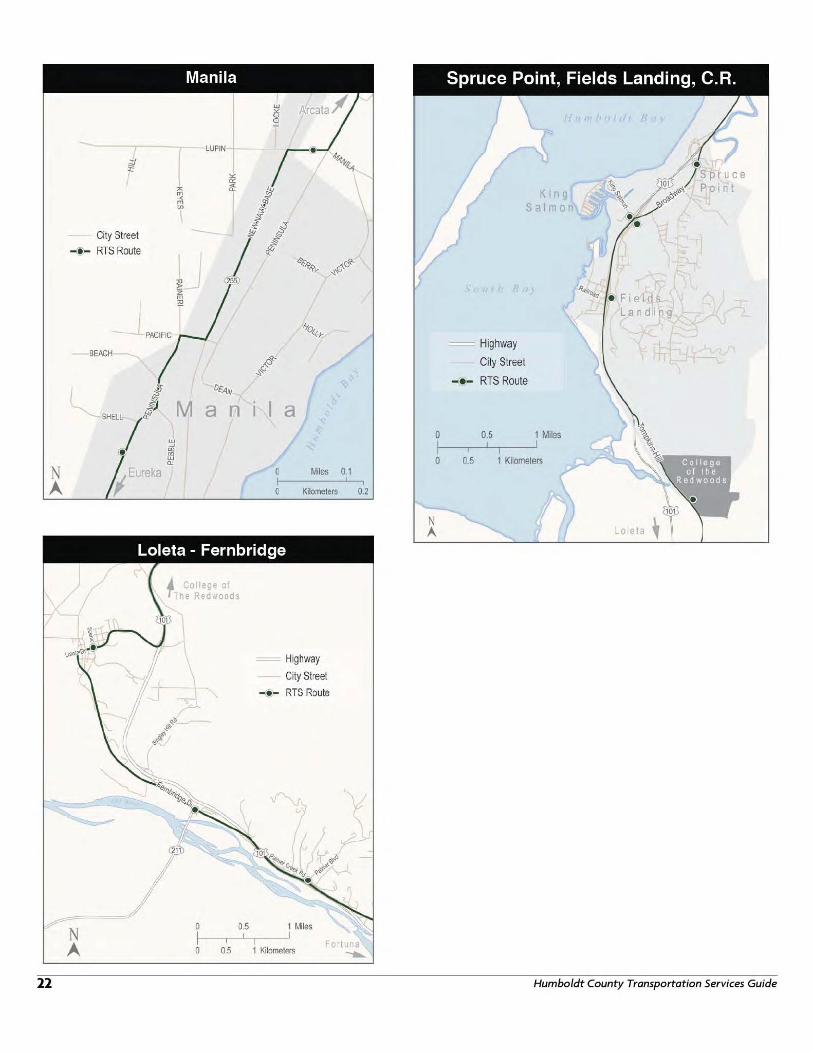


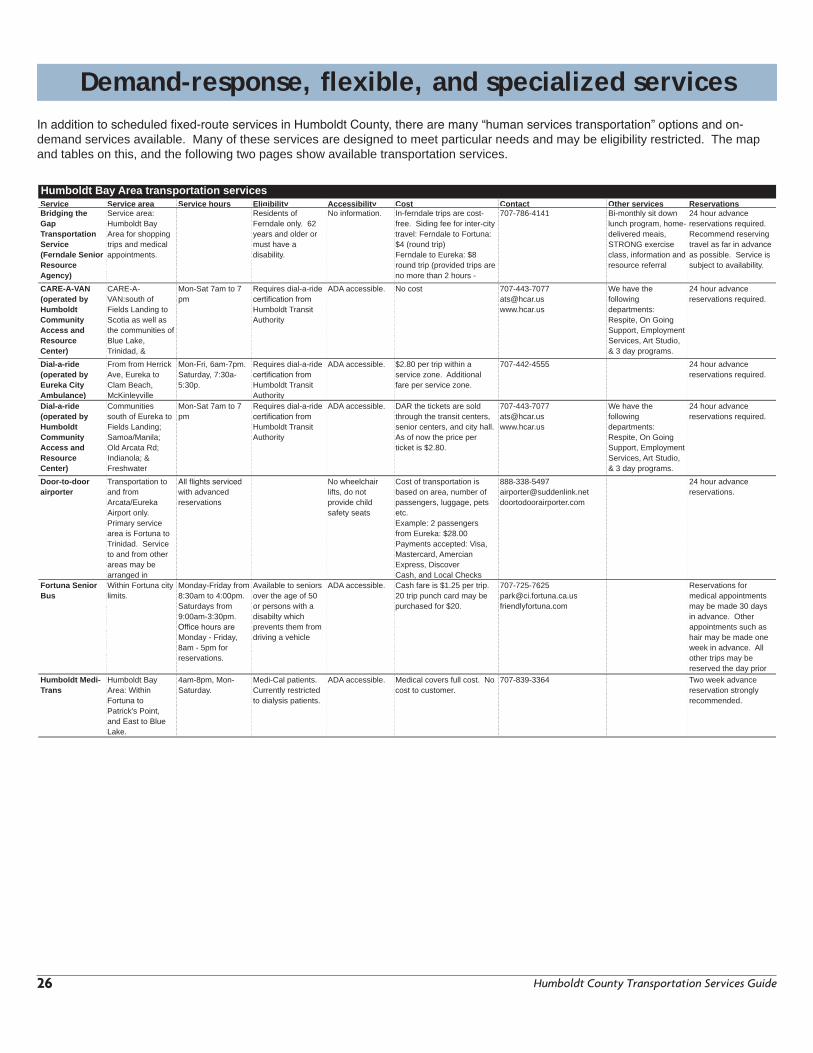
26 Humboldt County Transportation Services Guide
Demand-response, flexible, and specialized services
Service Service area Service hours Eligibility Accessibility Cost Contact Other services ReservationsBridging the GapTransportation Service(Ferndale Senior ResourceAgency)
Service area: Humboldt Bay Area for shopping trips and medical appointments.
Residents of Ferndale only. 62 years and older or must have a disability.
No information. In-ferndale trips are cost-free. Siding fee for inter-city travel: Ferndale to Fortuna: $4 (round trip)Ferndale to Eureka: $8 round trip (provided trips are no more than 2 hours -
707-786-4141 Bi-monthly sit down lunch program, home-delivered meais, STRONG exercise class, information and resource referral
24 hour advance reservations required.Recommend reserving travel as far in advance as possible. Service is subject to availability.
CARE-A-VAN (operated by HumboldtCommunityAccess and ResourceCenter)
CARE-A-VAN:south of Fields Landing to Scotia as well as the communities of Blue Lake, Trinidad, &
Mon-Sat 7am to 7 pm
Requires dial-a-ride certification from Humboldt Transit Authority
ADA accessible. No cost [email protected]
We have the following departments:Respite, On Going Support, Employment Services, Art Studio, & 3 day programs.
24 hour advance reservations required.
Dial-a-ride(operated by Eureka City Ambulance)
From from Herrick Ave, Eureka to Clam Beach, McKinleyville
Mon-Fri, 6am-7pm.Saturday, 7:30a-5:30p.
Requires dial-a-ride certification from Humboldt Transit Authority
ADA accessible. $2.80 per trip within a service zone. Additional fare per service zone.
707-442-4555 24 hour advance reservations required.
Dial-a-ride(operated by HumboldtCommunityAccess and ResourceCenter)
Communitiessouth of Eureka to Fields Landing; Samoa/Manila;Old Arcata Rd; Indianola; & Freshwater
Mon-Sat 7am to 7 pm
Requires dial-a-ride certification from Humboldt Transit Authority
ADA accessible. DAR the tickets are sold through the transit centers, senior centers, and city hall.As of now the price per ticket is $2.80.
We have the following departments:Respite, On Going Support, Employment Services, Art Studio, & 3 day programs.
24 hour advance reservations required.
Door-to-doorairporter
Transportation to and from Arcata/EurekaAirport only. Primary service area is Fortuna to Trinidad. Service to and from other areas may be arranged in
All flights serviced with advanced reservations
No wheelchair lifts, do not provide child safety seats
Cost of transportation is based on area, number of passengers, luggage, pets etc.Example: 2 passengers from Eureka: $28.00Payments accepted: Visa, Mastercard, Amercian Express, DiscoverCash, and Local Checks
24 hour advance reservations.
Fortuna Senior Bus
Within Fortuna city limits.
Monday-Friday from 8:30am to 4:00pm.Saturdays from 9:00am-3:30pm.Office hours are Monday - Friday, 8am - 5pm for reservations.
Available to seniors over the age of 50 or persons with a disabilty which prevents them from driving a vehicle
ADA accessible. Cash fare is $1.25 per trip.20 trip punch card may be purchased for $20.
Reservations for medical appointments may be made 30 days in advance. Other appointments such as hair may be made one week in advance. All other trips may be reserved the day prior
Humboldt Medi-Trans
Humboldt Bay Area: Within Fortuna to Patrick's Point, and East to Blue Lake.
4am-8pm, Mon-Saturday.
Medi-Cal patients.Currently restricted to dialysis patients.
ADA accessible. Medical covers full cost. No cost to customer.
707-839-3364 Two week advance reservation strongly recommended.
Humboldt Bay Area transportation services
In addition to scheduled fixed-route services in Humboldt County, there are many “human services transportation” options and on-demand services available. Many of these services are designed to meet particular needs and may be eligibility restricted. The map and tables on this, and the following two pages show available transportation services.

27Humboldt County Transportation Services Guide
Southern Humboldt transportation servicesService Service area Service hours Eligibility Accessibility Cost Contact Other services ReservationsCommunity Cornerstone Inc.
From Redway South to Laytonville, from Redway North to Weott. From Redway East to Briceland.
Hours are from 9am to 3pm Monday through Friday
Clients of Community Cornerstone, Inc. only
No information. [email protected]
Supportive Living Skills And a day program for disabled adults.
Bridgeville Community Center Van
Provides transportation from Bridgeville to Eureka and Fortuna. Will pick up passengers on the way in Carlotta and Hydesville.
Thursdays only. Depart from Bridgeville at 9:30a. Depart from Eureka ~3:30p.
All are eligible to use service.Priorities given for medical and social service appointments.
No information. Suggested donation of $5.
707-777-1775cstanley@humboldt.k12.ca.uswww.bridgevillecommunitycenter.org
Call at least one day ahead to reserve a seat.
Southern Trinity Health Services
Highway 36 Corridor:Dinsmore, Mad River, Ruth, Hettenshaw Valley, Bridgeville. Service to Eureka and Fortuna
Monday through Friday, schedule varies
No eligibility requirements
No information. Request donations: Suggested $5 for longer run routes. $1 for local routes.
707-574-6616www.sthsclinic.org/transportation.php
Food commodities, primary health care, counseling, and dental health care.
Demand-response, flexible, and specialized services
Service Services Service area Service hours
Eligibility Contact Other services
California StateDepartment ofRehabilitation
Financial resources for transportation: provide transportation funds (gas money, bus tickets) to achieve vocational goals.
Monday - Friday, 9-5pm.
Must have diagnosed impairment with impediments that restrict them from attaining, retaining, or advancing in employment.
707-445-6300www.dor.ca.gov
St. Joseph HealthSystem Blue Lake Community Resource Center
Monthly passes for travel on BLRTS.
Blue Lake residents. Low income. Must be used to go to school or work.
707-668-5239 Community Resource Center provides food, phone, fax, and resource referral.
ArcataEndeavor
Bus passes provided on a case-by-case basis through the Transportation Assistance Program.
n/a 9am-3pmMon-Fri (drop-in hours) @ 501 9th Street
707-822-5008
HumboldtDomestic ViolenceServices
Transportation assistance to law enforcement, medical, and other services. Assistance for transportation services for clients and their families who wish to leave the area.
General client needs - Monday throughFriday from 9:00 am to 4:00 pm.
Must be a client of agency to receive transportation assistance.
24 hour crisis line, emergency shelter, safe house,counseling, food, and clothing for clients and their children.
Financial assistance for transportation


Grand Traverse | Mobility Management Strategies Michigan Livable Communities Demonstration Project
Smart Growth America | H-1
Supplement H: Transportation Services in Glacier National Park Traveler Information Glacier National Park (and other national parks) offers some of the best models for a tourist-oriented service seeking to integrate traveler information and interpretive information. In 2007, Glacier’s Dave Restivo received a national award from NPS for his interpretive work related to the shuttle. He and his team created a series of innovative interpretive exhibits for the park’s Going-to-the-Sun Road that convey trip planning information while also providing visitors with information about things to and experience at each stop. Following is an example of the type of information provided on the Glacier web site regarding bus stops – information that could also be included in a brochure or at visitor center kiosks. Each bus stop also includes an activity for kids (e.g., how many different types of plants can you see from here), and a footprint of a Glacier animal.
The Loop The Loop represents a very significant location on the Going-to-the-Sun Road. This is the only switchback on the Going-to-the-Sun Road and contains many architectural features. The Trapper Fire of 2003 swept through this area and opened up vistas of distant mountains. Heavens Peak dominates the landscape and a hiking trail at this spot maps the course to hikers to the historic Granite Park Chalet. Specific Location: Next to the restrooms. Restrooms: Yes Drinking Water: No - please plan accordingly and bring plenty of water with you to this destination. Day Hikes (one-way): Granite Park Chalet - 4.0 mi. (one-way) Logan Pass via The Loop and Highline Trails - 11.6 mi. Catch another shuttle at Logan Pass. Besides the signs, the Glacier project incorporated technology in a variety of ways – some of which would be more realistic for Grand Vision effort than others. For each stop they developed an iTunes podcast and the main transit center include interactive computer kiosks and flat-panel LCD screens.
The picture to the right shows the shelter at the main transit center on the west side of Glacier. Instead of separate benches, seating is built into the structure. Interpretive displays provide enough information to keep riders occupied while waiting for the next bus. Next bus departure signs were installed but are not always functioning due
Apgar Transit Center, Dave Restivo, NPS

Grand Traverse | Mobility Management Strategies Michigan Livable Communities Demonstration Project
Smart Growth America | H-2
to factors that would not apply in the Grand Traverse region – such as the need to run off radio signals in an area with complex topography that creates dead zones.
Mix of Transportation Services The strategies report discusses the ability of Glacier National Park to provide good information to the rider, which led to discussion during the strategies meeting about operational details. Different services are described here.
Glacier National Park offers both shuttle service and interpretive tours.
The National Park Service Shuttle System provides transportation in the most congested parts of the park. Once the normal entrance fee is paid, visitors have free and unlimited access to the shuttle. The system is operated under a cooperative agreement with Eagle Transit and Flathead County. In turn, Eagle Transit cooperates with the Blackfeet Tribe to hire tribal members for supervisor and driver positions on the east side bordering the reservation.
The selection of a smaller vehicle on the alpine section of the west side was dictated by the narrow width of the road. Standard sized buses are used on the east side and lower portions of the west side. Operating costs are funded with a $7 per car entrance fee. Capital costs were funded through a combination of federal highways and transit programs.
SAFETEA-LU included the Paul S. Sarbanes Transit in the Parks program, which for the first time established DOT funds for the capital costs of transit. This program did not cover operating costs and was eliminated under MAP-21. Operating costs within a national park are eligible for other FTA programs, such as 5311 rural grants program, if the service is operated by an eligible sub-recipient, a.k.a. a local government or non-profit organization such as BATA, but using this funding source puts the park in competition with all other transit needs, and where there are limited resources.
A list of funding programs for which alternative transportation projects in and around fedral lands may be eligible is available at the TRIPTAC web site:
http://www.triptac.org/TRIPTACResources/OtherFundingSources/Default.html

Grand Traverse | Mobility Management Strategies Michigan Livable Communities Demonstration Project
Smart Growth America | H-3
Primary options after the repeal of the Transit in the Parks program in MAP 21 are FTA’s tribal transportation program, FTA’s other programs such as the rural transit program (5311), and Federal Highways Federal Land Program.
The tours are operated under a contractual agreement between the park and the concessionaire. The red bus tour is part of the contract with Glacier Park Incorporated, the largest concessionaire in the park. The historic red jammers were restored from 2000-2002 by Ford Motor Company and are owned by the park and leased to GPI. A typical fee for a 4-hour tour is $60.
Besides this tour service, GPI provides lodging accommodations, food and beverage services, retail operations, and taxi-like transportation between the park and the Amtrak station. It also
operates a fee-based shuttle connecting the less-visited points away from the Going to the Sun Road and into Waterton National Park in Canada.
GPI does not make money on their transportation operations but provides it based on contractual obligation to the park service. In effect, profits from other part of the concessionaire’s contract cover the transportation losses.
The second tour operations, Sun Tours, also operates as a concessionaire. The business is owned by a member of the Blackfeet tribe and provides a Blackfeet perspective tour over the Going-to-thepSun Road. The buses are owned and operated by Sun Tours. A typical price for a 4-hour tour is $40.

Grand Traverse | Mobility Management Strategies Michigan Livable Communities Demonstration Project
Smart Growth America | I-1
Supplement I: Ferry Transportation Concepts The following tables show model output for the route shown in orange between Peshawbestown and Old Mission. We assumed 60 passengers per day and 3 round trips, then used the model’s default values. A summary of model outputs:
• Between $360 and $501 per vessel hour including operating and capital costs, depending on boat size.
• If assumptions are correct, the cost per passenger trip is $19 to $27. • Three 12-30 passenger skiffs or two 31-50 passenger pontoons would be required to
operate this route, including a spare. • $130,000 per year to operate 114 days per year, 3 hours per day using passenger skiffs.
This equates to 3 round trips. • The more service, the lower the cost per hour because of efficiencies of scale. • If passenger loads or safety considerations lead to larger boats, the cost per vessel hour
increases; cost per passenger may not since costs are divided between more passengers. The ability to transport cars increases costs.

Grand Traverse | Mobility Management Strategies Michigan Livable Communities Demonstration Project
Smart Growth America | I-2
User Inputs
ENTER VALUE SELECT APPROPRIATE VALUE (OR DEFAULT)Is this a new service, or will it be a new route added to an existing system?
New Service Service Speed/ Max Speed= 0.8
What is the estimated round-trip route distance in nautical miles?
12 Stop Time (min) 5
How many stops will there be? 2 Labor Overhead Rate 20%Will the ferry transport vehicles? No Crew Hours/Vessel Operating Hours 1.25If yes, how many during the peak hour? Captain Hourly Wage Rate 21.23$ Peak Season Deckhand Hourly Wage Rate 12.89$ How many days in the peak season? 90 Diesel Fuel Cost/Gallon 2.95$ What is the estimated peak hour passenger demand on the peak segment?
25 Annual Change in diesel cost/gallon 10%
What is the estimated daily passenger demand? 60 Lubricant Cost/Gallon 8.00$ How many hours per day will the service operate during peak season?
3 Annual Vessel Depreciation (as % of vessel purchase price)
2.3%
Shoulder Season Annual inflation 2.0%How many days in the shoulder season? 24 Loan period (years) 20 What is the estimated peak hour passenger demand on the peak segment?
25 Loan Interest rate 6%
What is the estimated daily passenger demand? 60 Annual Marketing, Admin cost per passenger 0.60$ How many hours per day will the service operate during shoulder season?
3 Is a spare vessel needed? Yes
Can spare vessels be used elsewhere during the shoulder season?
NoVessel owner equity / down payment (as % of vessel costs)
20%
Off-SeasonOn average, how old will the vessels used for the service be?
6-10 Years
Will the service operate year-round? NoIf not: How many days will the vessels operate on other routes/services?
-
What is the estimated annual passenger demand 6,840 Average age of purchased vessels 7.5Total operating hours on this route/service 365 Price of vessels as % of new price 83%
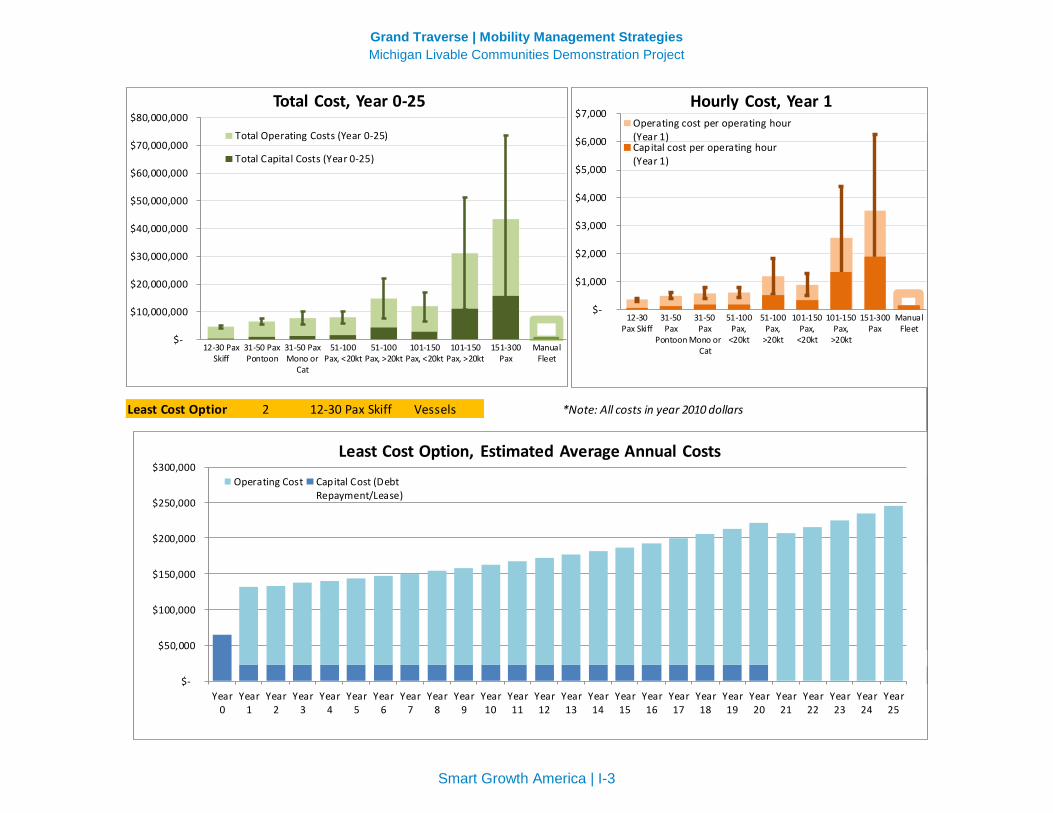
Grand Traverse | Mobility Management Strategies Michigan Livable Communities Demonstration Project
Smart Growth America | I-3
Least Cost Option 2 12-30 Pax Skiff Vessels *Note: All costs in year 2010 dollars
$-
$10,000,000
$20,000,000
$30,000,000
$40,000,000
$50,000,000
$60,000,000
$70,000,000
$80,000,000
12-30 PaxSkiff
31-50 PaxPontoon
31-50 PaxMono or
Cat
51-100Pax, <20kt
51-100Pax, >20kt
101-150Pax, <20kt
101-150Pax, >20kt
151-300Pax
ManualFleet
Total Cost, Year 0-25
Total Operating Costs (Year 0-25)
Total Capital Costs (Year 0-25)
$-
$1,000
$2,000
$3,000
$4,000
$5,000
$6,000
$7,000
12-30Pax Skiff
31-50Pax
Pontoon
31-50Pax
Mono orCat
51-100Pax,
<20kt
51-100Pax,
>20kt
101-150Pax,
<20kt
101-150Pax,
>20kt
151-300Pax
ManualFleet
Hourly Cost, Year 1Operating cost per operating hour(Year 1)Capital cost per operating hour(Year 1)
$-
$50,000
$100,000
$150,000
$200,000
$250,000
$300,000
Year0
Year1
Year2
Year3
Year4
Year5
Year6
Year7
Year8
Year9
Year10
Year11
Year12
Year13
Year14
Year15
Year16
Year17
Year18
Year19
Year20
Year21
Year22
Year23
Year24
Year25
Least Cost Option, Estimated Average Annual Costs
Operating Cost Capital Cost (DebtRepayment/Lease)

Grand Traverse | Mobility Management Strategies Michigan Livable Communities Demonstration Project
Smart Growth America | I-4
AVERAGE COSTS
12-30 Pax Skiff31-50 Pax Pontoon
31-50 Pax Mono or Cat
51-100 Pax, <20kt
51-100 Pax, >20kt
101-150 Pax, <20kt
101-150 Pax, >20kt
151-300 Pax
Service OverviewNumber of Vessels
(including spare) 2 2 2 2 2 2 2 2
Service Speed (knots ) 20 14 16 13 22 14 22 21
Round-Trip time (min) 64 76 72 81 61 76 61 63 Minimum Headway
(min) 64 76 72 81 61 76 61 63
Maximum Headway (min) 64 76 72 81 61 76 61 63
Average Cost SummaryEstimated Cost per
Vessel 160,000$ 330,000$ 480,000$ 510,000$ 1,430,000$ 910,000$ 3,600,000$ 5,060,000$
Equi ty Investment 64,545$ 132,400$ 193,635$ 202,738$ 570,975$ 364,100$ 1,439,850$ 2,022,410$ Payment 22,300$ 45,600$ 66,700$ 69,800$ 196,400$ 125,300$ 495,200$ 695,600$
Di rect Operating Costs 1,169,000$ 2,215,000$ 2,450,000$ 2,630,000$ 4,043,000$ 4,192,000$ 7,418,000$ 11,287,000$
Indi rect Operating Costs 2,610,000$ 2,858,000$ 3,083,000$ 3,116,000$ 4,465,000$ 3,707,000$ 7,647,000$ 9,780,000$
Fixed Operating Costs 283,000$ 501,000$ 697,000$ 726,000$ 1,906,000$ 1,243,000$ 4,689,000$ 6,555,000$
Total Cost (Year 0-25) 4,600,000$ 6,600,000$ 7,800,000$ 8,100,000$ 14,900,000$ 12,000,000$ 31,100,000$ 43,600,000$ NPV of Total Cost
(Year 0-15) 3,300,000$ 4,800,000$ 5,600,000$ 5,800,000$ 10,600,000$ 8,600,000$ 21,900,000$ 30,700,000$
Total Operating Costs (Year 0-25 ) 4,100,000$ 5,600,000$ 6,200,000$ 6,500,000$ 10,400,000$ 9,100,000$ 19,800,000$ 27,600,000$
Total Capital Costs (Year 0-25 ) 500,000$ 1,000,000$ 1,500,000$ 1,600,000$ 4,500,000$ 2,900,000$ 11,300,000$ 15,900,000$
Operating cost per operating hour (Year 1) 299$ 376$ 414$ 422$ 655$ 551$ 1,203$ 1,642$
Capital cost per operating hour (Year 1) 61$ 125$ 183$ 191$ 538$ 343$ 1,358$ 1,907$
Cost per passenger trip (Year 1) 19.19$ 26.70$ 31.82$ 32.72$ 63.66$ 47.70$ 136.58$ 189.26$
Cost per vessel -hour (Year 1) 360$ 501$ 597$ 614$ 1,194$ 894$ 2,561$ 3,549$
Depreciated Fleet Va lue after Year 25 137,000$ 281,000$ 411,000$ 431,000$ 1,213,000$ 774,000$ 3,060,000$ 4,298,000$

Grand Traverse | Mobility Management Strategies Michigan Livable Communities Demonstration Project
Smart Growth America | J-1
Supplement J: Integrating Transportation with Regional Planning Working with MDOT to overcome barriers to siting bus stops on state highways Michigan DOT and the Federal Highway Administration provide road design guidance with enough flexibility to build and maintain state highways that also serve as community arterials and places where community buses can safely stop and pick up passengers. Concerns primarily relate to the safe recovery zone for motorists who veer off the road, also known as the clear zone; a secondary concern is the safe stopping of the bus and re-entry into the traffic flow.
Transportation engineers are tasked with designing safe roads; when on federally funded roads, they use the design guidelines of the Michigan Road Design Manual (Michigan Department of Transportation, 2013). Derived from national guidelines including the Roadside Design Guide (American Association of State Highway and Transportation Officials, 2011) the manual includes roadside clear zone guides based on the principle of providing a safe recovery area for motorists. The goal is to place roadside infrastructure as far as is feasible from the travel way.
To avoid stops on state highways, often transit agencies will place stops on side roads or in parking lots. This has the negative side effect of increasing travel time of the bus, and often it can lead to pedestrian conflicts within the parking lots. The best option is for road design to accommodate a bus stop on the road, and for site design to accommodate safe pedestrian access from the road to the building.
Applicable bus stop infrastructure guidance can be interpreted from Section 9 of the Michigan Road Design Manual as it relates to the placement of utility poles. In a Central Business District where speed limits are under 35 mph and there are curbs and sidewalks, benches and shelters can be places as little as 2 feet
From Oregon DOT

Grand Traverse | Mobility Management Strategies Michigan Livable Communities Demonstration Project
Smart Growth America | J-2
from the curb. Where the speed limit exceeds 35 mph, the suggested clear zone distance varies from 18 to 30 feet from the edge of travel way, depending on design speed. Standards from other states such as Florida, Delaware, and Oregon more explicitly address bus stops following this same clear zone principle.
Michigan guidance does not address buses stopping in the travel lane, on the shoulder, or in a bus pull-out, but other state design guides such as Oregon DOT suggest bus bays on roads with speed limits above 35 mph.
As stated and reinforced in FHWA guidelines relating to context sensitive design, complete streets, and flexibility in highway design, the AASHTO Green Book and the Michigan Road Design Manual are guidelines, not standards:
“It should be recognized that this is a guideline and that individual cases may arise which require special treatment such as: traffic signal installations; locations demonstrating fixed-object accident patterns; and locations with unique design problems, sight distance restrictions, high pedestrian activity, or unique environmental conditions. Departmental review procedures will take these factors into account.” (Michigan Department of Transportation, 2013, Section 9.03.01A)
When travel speeds are below 35 mph local transit operators could have few problems working with MDOT to accommodate on-street bus stops. Where design speeds are at 35 mph and above local representatives could work with MDOT to explore options including:
• Traffic calming tactics to lower speeds below 35 mph such as road diets, curb bulbs, or narrower lanes,
• Using shoulders or bus bays to accommodate bus stops while placing benches and shelters outside of the clear zone,
• Using a breakaway design within the clear zone, • Applying another special treatment to accommodate bus stops.
Transfer facilities, park-and-ride locations and bus stops as place-making and economic development opportunities. Section 3.6 of the 2011 BATA Study includes good recommendations for designing and siting transfer facilities. The four counties outside BATA’s service area should consider these recommendations for transfer and park and ride facilities they develop. For place-making and economic development, particularly important siting considerations include bicycle and pedestrian accessibility and adjacent land uses. Ideally these facilities would be incorporated into commercial nodes with complementary businesses such as grocery stores, pharmacies, restaurants or tourist oriented shops if a route is likely to be used by tourists. These commercial nodes should be safely accessible for bicyclists and pedestrians travelling from residential areas and/or from lodging facilities.
Place-making at bus stop is important on many levels. Attractive bus stops are a very effective marketing tool, increasing awareness of the service and conveying a sense that public

Grand Traverse | Mobility Management Strategies Michigan Livable Communities Demonstration Project
Smart Growth America | J-3
transportation is an essential part of the community. By offering riders convenience and comfort, well designed bus stops can significantly increase ridership. To achieve these goals, bus stops should include street furniture (benches and shelters), good signage, lighting, and an ADA accessible concrete pad. Complete sidewalks, safe bicycle access, and bike racks are also important components.
Creative resource sharing may play an important role in creating a high quality regional transportation network. Attractive, well-sited transfer facilities will be important for gaining ridership by commuters and tourists. Siting decisions should be made based on benefit and convenience for riders, not based on whether a facility will benefit one county or another. Developing a high quality transfer facility may require investment from one or more adjacent counties in addition to the county in which the facility is located.
Bus stop infrastructure elements
Components of a bus stop http://www.mtnapa.org/images/Montana%20Complete%20Streets%20Toolkit-August_23_small.pdf
Bus Stop Signs Bus stop signs are an important element of a transit system, making the system easier to use for customers, especially new riders. Bus stop signs are also one of the most cost effective forms of marketing. Unlike advertisements or brochures, they provide permanent visibility with minimal ongoing cost. Moreover, they target potential customers in a specific area served by the bus. Stop signs, wherever possible, should be placed even with the front door of the bus to let riders know where to stand and to serve as a guide for the operator. Trash receptacles may be mounted on the sign posts as well.

Grand Traverse | Mobility Management Strategies Michigan Livable Communities Demonstration Project
Smart Growth America | J-4
Bus Pull-outs We recommended seeking bus pullout locations in safe sites along the road and working with MDOT and other roads project managers when roads are redesigned.
Seating at Bus Stops Seating is an important infrastructure at bus stops. For many elderly and disabled riders they are essential, and overall they make a bus system more convenient, more visible, and more enjoyable. Many low-maintenance, vandal-proof designs have been developed in communities around the country.
Shelters The need for shelters at high-use bus stops was frequently cited in our public and stakeholder input. We recommend budgeting to install shelters at Marq-Tran and MSU’s most important bus stops as well as locations that receive high use by seniors and that are more exposed to wind. More than any other bus stop infrastructure, attractive bus shelters provide effective high-visibility marketing, creating awareness of the bus system and sending the message that public transportation is an important part of the community.
Nine or ten shelters should be provided in the first year of service followed by additional shelters in future years. Costs can vary significantly; low-cost shelters are estimated to cost approximately $8,000 per shelter. Larger shelters, shelters with protection on three sides, and shelters with an architectural design to tie into a development’s architecture or a historical district can cost more than twice that amount.
Lighting at Bus Stops Lighting is an important consideration for high-use bus stops with benches or shelters. Lighting is important for customer safety, and is also important for marketing as it improves visibility and public awareness and helps create a welcoming atmosphere at bus stops.
Bike Racks Transit systems nationwide are seeing increased use by bicyclists, leading to the common occurrence of demand for on-board bike racks exceeding capacity. Besides using 3-bike racks instead of 2-bike racks on the front of the bus, bike racks should be installed at stops with high bicycle use.

Grand Traverse | Mobility Management Strategies Michigan Livable Communities Demonstration Project
Smart Growth America | J-5
Accessibility improvements at a bus stop Transit in Small Cities: A Primer for Planning ... - State of Oregon www.oregon.gov/LCD/TGM/docs/fulltransitprimer4-4-13.pdf Apr 4, 2013 –

Grand Traverse | Mobility Management Strategies Michigan Livable Communities Demonstration Project
Smart Growth America | J-6
Bus Stop and Shelter Sample Designs
Cost ranges for one bus shelter (from 2008 estimates)
Description Cost Low High
1- Shelter $5,000 $12,500 2- Solar panel none $3,500 3. Bench $450 $2,200 Wood, plastic, or steel 4- Map frame or totem none $375 32" x 32" Bike rack none $500 Trash receptacle none $500 Load and transport none $1,752 Concrete foundation $320 $320 Installation $3,500 $6,300
Total $9,270 $27,947
Maintenance estimate per shelter
Janitorial cost estimatesCleans per week 1Weeks per month 4.33Cleans per month 4.33
Time per cleaning 0.75 hours
Salary 12.00$ per hourOverhead multiplier 1.75Cost per hour 21.00$
Estimated monthly cost 68.20$
Error value per month 20.46$ 30%
Monthly janitorial cost estimate per shelter 88.66$

Grand Traverse | Mobility Management Strategies Michigan Livable Communities Demonstration Project
Smart Growth America | J-7
Brasco 5’ x 10’shelter with tinted acrylic hip roof, powder coated blue. Charlotte NC. Cost: about $5,000, not including installation, concrete pad, power, bike rack (not shown) trash receptacle
Locally designed and sourced bus shelter in Bozeman, Montana. Cost estimate: $17,000 including installation, concrete pad, trash receptacle, and bike rack.

Grand Traverse | Mobility Management Strategies Michigan Livable Communities Demonstration Project
Smart Growth America | J-8
Custom shelters for Jackson, Wyoming were selected to maximize transparency and minimize elements that could obstruct scenic views. Cost: $24,300 installed.
Enseicom 85” x 144” shelter, solar panel, bench, map frame, & transport: $18,000 (not installed). Double shelter: 85” x 276”: $32,000 (not installed). Jackson has stringent design standards; design minimizes elements that would obstruct views of the mountains that surround town.
Options for increasing capacity to serve bicyclists Accommodating bicycles is important for many riders, especially on routes serving tourist destinations. The high quality paved trails in the Grand Traverse area likely generate increased demand from bicyclists. Including bike racks at bus stops is an important component of transit oriented place-making. However, as noted in the first stakeholders’ meeting, the biggest obstacle is accommodating more than three bikes on buses. Our research indicates that there are examples from other communities such as the two below that can be explored further. Decisions should be made on a case by case basis for every route weighing the benefits of transporting more than three bikes against the delays that will result from loading and unloading bicycles.

Grand Traverse | Mobility Management Strategies Michigan Livable Communities Demonstration Project
Smart Growth America | J-9
Lawrence Berkeley National Laboratory (California) has shuttle buses which take two bikes in the front in a conventional style and another 5 or 6 in the rear hanging vertically.
San Luis Obispo County (California) Regional Transit Authority‘s fixed route buses have bike racks for 6 bikes – three in front and three in back: http://www.slorta.org/information/rideguide
Planning and development review processes In many communities, opportunities to install bicycle/pedestrian and bus stop infrastructure are routinely missed because these facilities are left out of planning documents as well as the development review process. Public transportation and bicycle/pedestrian needs can be, at best, an afterthought if they are considered at all when important plans and decisions are being made – such as facility siting decisions.
We have worked in communities where transit needs are acknowledged in planning documents, but no standards or requirements have been codified. As a result, many opportunities are missed – especially for construction of bus stop infrastructure. For example, in a community where we recently worked, planners and engineers were frustrated that they could not require installation of a bus pull-out with a shelter and lighting when a large commercial development was proposed at an important intersection. They felt their hands were tied because the transit operator did not participate in the development review process, there were no regulations in the city codes nor any engineering standards for installing such infrastructure, and the bus stop was not included in any plans for the street even though buses are currently stopping there by pulling onto the shoulder in 45 mph traffic.
To prevent a similar scenario in the Grand Traverse region will require a multi-stage process implemented over a number of years:
Develop infrastructure plans and engineering standards The first step is to develop detailed plans for desired bicycle/pedestrian connections (sidewalks, paths and bike lanes) and bus stop locations and get these plans adopted by the appropriate
Six-bike rack used by Lawrence Berkley National Laboratory
http://www.lbl.gov/LBL-Work/Facilities/Support/Busses/bicyclists.html

Grand Traverse | Mobility Management Strategies Michigan Livable Communities Demonstration Project
Smart Growth America | J-10
government bodies. Engineering standards for paved trails, bike lanes and bus stop infrastructure are also important to codify.
Embed infrastructure plans in other planning documents Over time, work to embed the infrastructure plans in as many other community planning documents as possible – from regional growth plans to neighborhood plans. Don’t assume that because you’ve already written a plan and gotten it adopted it will be automatically or adequately considered in other planning efforts.
Actively track and participate in development review processes Whenever a development or a road project is proposed that includes an important infrastructure element it is important to participate in the development review process starting at the earliest stage possible. That later in the process you get involved the more difficult it will be to have your infrastructure element included in the process. In many cases it may be possible to get the infrastructure element included without having to find additional funding. For example, a hotel developer may be happy to have a bus stop in front of their hotel because it will be an asset to their business, and they may be willing to pay to install it as long as the idea is suggested early in the design process. While this step is more effective once the first two steps have been completed, that should not stop bicycle, pedestrian and transit advocates from beginning to implement this step immediately. Much can often be accomplished just by participating in the process.
In combination, over time, these three steps will achieve a paradigm shift through which mobility management stakeholders can gradually change organizational cultures so that whenever there is a relevant public discussion, there will be an assumption that public transportation and bicycle/pedestrian needs will be part of the discussion and that representatives of these interests should be at the table. Consistent, constructive participation in these processes is also a great way to develop relationships with decision-makers and business community leaders.

Grand Traverse | Mobility Management Strategies Michigan Livable Communities Demonstration Project
Smart Growth America | K-1
Supplement K: Coordinating with Human Service Transportation Inventorying human service transportation services and needs It is valuable to inventory all existing human service transportation services, as well as human services agencies that do not have the resources to provide transportation assistance, but whose clients have significant transportation needs. A next step is to compile an inventory of funding amounts, vehicles and specific services provided by the various human services agencies. Government, tribal and non-profit agencies should both be included, along with any private transportation providers who are paid or contracted to provide rides.
To assess the area’s unmet human service transportation needs, useful tools include interviews, surveys and group discussions.
Working with non-emergency medical transportation (NEMT) and human service organizations to streamline funding and expand service for all customers. As discussed in the NWOTA and Shoreline Explorer examples, partnerships with human service providers can help to fund transit services that benefit disadvantaged populations as well as the general public. To identify specific opportunities for the Grand Traverse region, it would first be necessary to complete an inventory and assessment of human service providers and human service needs.
Many human services agencies use significant amounts of funding for providing and/or purchasing transportation for their clients. Efficiencies can be achieved, and opportunities to leverage new funding can be identified through coordination among these agencies and between human services and public transportation. However this is a complex task that requires developing detailed knowledge of both the region’s human services agencies and their funding sources. The connection is a primary reason that mobility management staffing is often focused on human service needs.
Designing effective strategies requires a sophisticated understanding of different federal programs and their regulations. Developing this understanding requires researching the barriers to coordination that may be connected to different funding sources. Barriers fall into three categories:
• Barriers to pooling resources and developing contracts for service. • Barriers to steering human service and NEMT riders toward public transportation if
appropriate. • Barriers to using a funding source as match for FTA funding.
Addressing these barriers requires a combination of surveying and interviewing human service agencies, and communicating with federal officials at the regional and federal levels.
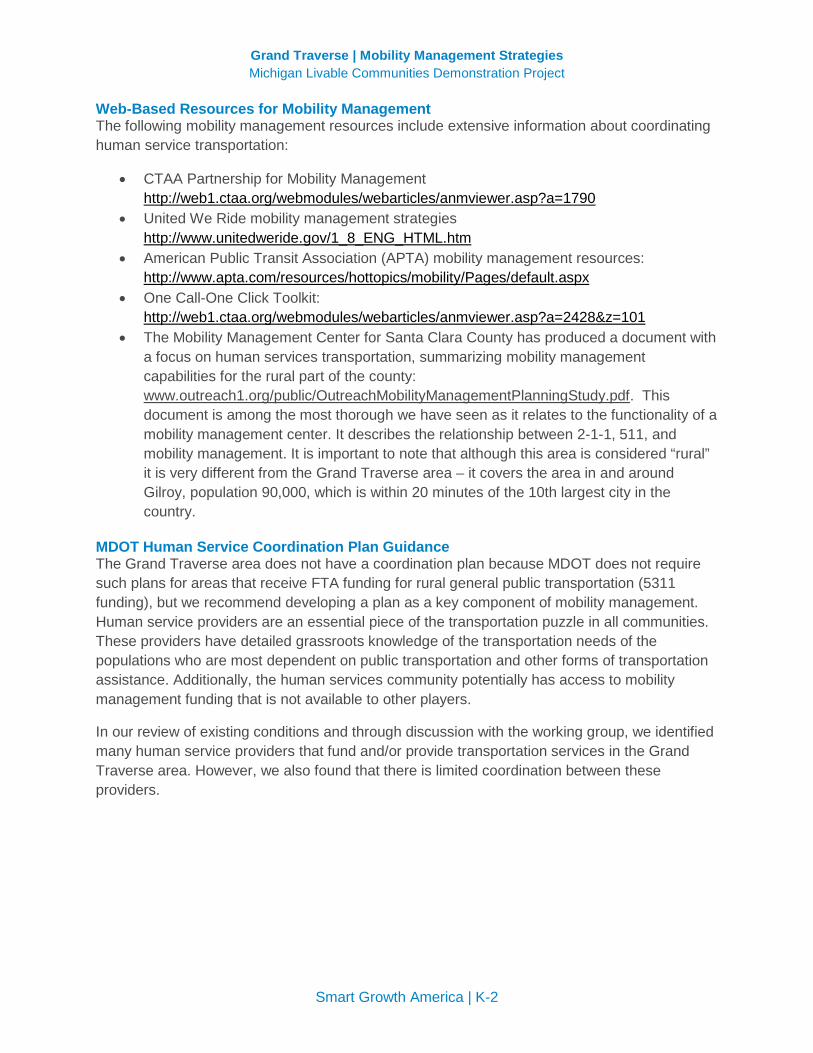
Grand Traverse | Mobility Management Strategies Michigan Livable Communities Demonstration Project
Smart Growth America | K-2
Web-Based Resources for Mobility Management The following mobility management resources include extensive information about coordinating human service transportation:
• CTAA Partnership for Mobility Management http://web1.ctaa.org/webmodules/webarticles/anmviewer.asp?a=1790
• United We Ride mobility management strategies http://www.unitedweride.gov/1_8_ENG_HTML.htm
• American Public Transit Association (APTA) mobility management resources: http://www.apta.com/resources/hottopics/mobility/Pages/default.aspx
• One Call-One Click Toolkit: http://web1.ctaa.org/webmodules/webarticles/anmviewer.asp?a=2428&z=101
• The Mobility Management Center for Santa Clara County has produced a document with a focus on human services transportation, summarizing mobility management capabilities for the rural part of the county: www.outreach1.org/public/OutreachMobilityManagementPlanningStudy.pdf. This document is among the most thorough we have seen as it relates to the functionality of a mobility management center. It describes the relationship between 2-1-1, 511, and mobility management. It is important to note that although this area is considered “rural” it is very different from the Grand Traverse area – it covers the area in and around Gilroy, population 90,000, which is within 20 minutes of the 10th largest city in the country.
MDOT Human Service Coordination Plan Guidance The Grand Traverse area does not have a coordination plan because MDOT does not require such plans for areas that receive FTA funding for rural general public transportation (5311 funding), but we recommend developing a plan as a key component of mobility management. Human service providers are an essential piece of the transportation puzzle in all communities. These providers have detailed grassroots knowledge of the transportation needs of the populations who are most dependent on public transportation and other forms of transportation assistance. Additionally, the human services community potentially has access to mobility management funding that is not available to other players.
In our review of existing conditions and through discussion with the working group, we identified many human service providers that fund and/or provide transportation services in the Grand Traverse area. However, we also found that there is limited coordination between these providers.

BPT-TSS-GL Coordination Plan Template October 16, 2008 1
Coordinated Public Transit-Human Services Transportation Plan Guidance Michigan Department of Transportation
Bureau of Passenger Transportation May 2007
The Michigan Department of Transportation’s (MDOT) Bureau of Passenger Transportation is providing this information to assist transit agencies in development of their Coordinated Public Transit-Human Services Transportation Plan. We have included both federal requirements and MDOT guidance for plan development. Coordinated Plan Overview The Safe, Affordable, Flexible, Efficient Transportation Equity Act, A Legacy for Users (SAFETEA-LU) requires that projects selected for funding under the Elderly Individuals and Individuals with Disabilities Program (Section 5310); the Job Access Reverse Commute (JARC) (Section 5316); and the New Freedom Program (Section 5317) be derived from a locally developed, coordinated public transit-human services transportation plan. The plan is to be developed through a process that includes representatives of public, private, and non-profit and human services transportation providers and participation by the public. Plan Participants While the plan is only required in communities seeking funding under one or more of the three specified Federal Transit Administration (FTA) programs, FTA expects public transit systems funded under both the Section 5307 and Section 5311 formula programs to participate in the local planning process for coordinated public transit-human service transportation in those areas applying for funds under Sections 5310, 5316, or 5317. To the extent feasible other transportation providers, advocacy groups, human service agencies, and passengers are encouraged to participate and coordinate with recipients of FTA assistance for New Freedom, Job Access and Reverse Commute, and the Elderly Individuals and Individuals with Disabilities (Section 5310) programs in the planning for and delivery of special transportation services. FTA also encourages the inclusion of intercity bus mobility needs in the coordinated planning process. Plan Definition A locally developed, coordinated, public transit-human services transportation plan identifies the transportation needs of individuals with disabilities, older adults, and people with low incomes, provides strategies for meeting those local needs, and prioritizes transportation services for funding and implementation. A coordinated plan

BPT-TSS-GL Coordination Plan Template October 16, 2008 2
should also incorporate activities offered under other transportation programs sponsored by Federal, State, and Local agencies to greatly strengthen its impact. Lead Agency Each county or region needs to determine which agency will have the lead for the development and coordination of the planning process. The lead agency may be different from the agency that will serve as the designated recipient in urbanized areas. MDOT strongly encourages the public transit provider, or the Section 5310 recipient in counties that do not have a public transit agency, to act as the lead agency for development of this coordination plan. In the large urbanized areas of the state, the Metropolitan Planning Organization (MPO) will also be involved. Required Coordinated Plan Elements The following elements at a level consistent with available resources and the complexity of the local institutional environment are required for the coordination plan and must be submitted to MDOT:
1. Description of outreach showing a good faith effort to get participation from the identified stakeholders. Please include a list of identified stakeholders and their level of participation.
2. An assessment of available services that identifies current providers (public,
private, and nonprofit);
3. An assessment of transportation needs for individuals with disabilities, older adults, and people with low incomes. This assessment may be based on the experiences and perceptions of the planning partners or on more sophisticated data collection efforts, and gaps in service (Note: If a community does not intend to seek funding for a particular program, (Section 5310, JARC, or New Freedom), then the community is not required to include an assessment of the targeted population in its coordinated plan.);
4. Strategies and/or activities to address the identified gaps between current
services and needs, as well as opportunities to achieve efficiencies in service delivery; and
5. Priorities for implementation based on resources, time, and feasibility for
implementing specific strategies/activities identified.
6. Describe the plan adoption process – who was involved, what was approved, how it was approved, etc.
Required Coordinated Plan Elements The following elements at a level consistent with available resources and the complexity of the local institutional environment are required for the coordination plan and must be submitted to MDOT:
1. Description of outreach showing a good faith effort to get participation from the identified stakeholders. Please include a list of identified stakeholders and their level of participation.
2. An assessment of available services that identifies current providers (public,
private, and nonprofit);
3. An assessment of transportation needs for individuals with disabilities, older adults, and people with low incomes. This assessment may be based on the experiences and perceptions of the planning partners or on more sophisticated data collection efforts, and gaps in service (Note: If a community does not intend to seek funding for a particular program, (Section 5310, JARC, or New Freedom), then the community is not required to include an assessment of the targeted population in its coordinated plan.);
4. Strategies and/or activities to address the identified gaps between current
services and needs, as well as opportunities to achieve efficiencies in service delivery; and
5. Priorities for implementation based on resources, time, and feasibility for
implementing specific strategies/activities identified.
6. Describe the plan adoption process – who was involved, what was approved, how it was approved, etc.

BPT-TSS-GL Coordination Plan Template October 16, 2008 3
Planning Process Identify Stakeholders Outreach is a very important aspect of the process. Every effort should be made to get broad participation in the coordination process. It would be a good idea to start with the membership of your Local Advisory Council or Coordination Committee. However, based on the participant listing below, additional agencies and/or individuals will need to be added to either of these groups to meet the intent of the coordinated plan process. Consideration should be given to including groups and organizations such as the following in the coordinated planning process if present in the community:
(1) Transportation partners:
(a) Area transportation planning agencies, including MPOs, States, and local governments;
(b) Public transportation providers (including ADA paratransit providers and agencies administering the projects funded under the FTA urbanized and non-urbanized programs);
(c) Private transportation providers, including private transportation brokers, taxi operators, vanpool providers, and intercity bus operators;
(d) Non-profit transportation providers; (e) Past or current organizations funded under the JARC, the Elderly
Individuals and Individuals with Disabilities, and/or the New Freedom programs; and
(f) Human service agencies funding, operating, and/or providing access to transportation services.
(2) Passengers and advocates (Note: Inclusion of this group has been
emphasized by FTA):
(a) Existing and potential riders, including both general and targeted population passengers (individuals with disabilities, older adults, and people with low incomes);
(b) Protection and advocacy organizations; (c) Representatives from independent living centers; and (d) Advocacy organizations working on behalf of targeted populations.
(3) Human service partners:
(a) Agencies that administer health, employment, or other support programs for targeted populations. Examples of such agencies include but are not limited to Departments of Social/Human Services, Employment One-Stop Services; Vocational Rehabilitation, Medicaid, Community Action Programs, Agency on Aging; Developmental Disability Council, Community Services Board;

BPT-TSS-GL Coordination Plan Template October 16, 2008 4
(b) Non-profit human service provider organizations that serve the targeted populations;
(c) Job training and placement agencies; (d) Housing agencies; (e) Health care facilities; and (f) Mental health providers.
(4) Others:
(a) Security and emergency management agencies; (b) Tribes and tribal representatives; (c) Economic development organizations; (d) Faith-based and community-based organizations; (e) Representatives of the business community (e.g. employers); (f) Appropriate local or State officials and elected officials; (g) School districts; and (h) Policy analysts or experts.
Please note that the required participants include not only transportation providers but also providers of human services, and members of the public (e.g., individuals with disabilities, older adults, and individuals with low incomes) who can provide insights into local transportation needs. It is important that stakeholders be included in the development and implementation of the local coordinated public transit-human services transportation plan. Please invite the MDOT project manager to your initial meeting (they will attend if possible). Development of Outreach Plan Participants in your planning process will include the groups and organizations you have identified from the list above. As described under “Planning Process,” MDOT recommends you conduct one or more meetings/workshops and perform some data gathering activities to complete your plan. However, you may also need additional methods to involve your participants. You will need to develop an outreach plan to make contact with your participants. At a minimum you will need to develop a mailing list to invite your participants to your meeting(s)/workshop(s) and to solicit information from them. You should also strive to ensure everyone in your area is aware of the planning process and has the opportunity to participate. You may want to use the following outreach strategies to make others aware of the planning process and to inform them of how they can get involved.
• Notice or flyers in centers of community activities • Newspaper or radio announcements • Articles in local newsletters or newspapers • Web postings

BPT-TSS-GL Coordination Plan Template October 16, 2008 5
In addition to participating in the meeting(s)/workshop(s) other methods should be made available for people to participate, such as sending in ideas or information by letter or reviewing and providing comments on the draft plan. Attachment 1 includes a sample meeting/workshop invitation letter. You can excerpt information from this letter and use it to produce a flyer, a newspaper notice and or a posting on your website. Just add information about how the public can get involved – i.e., attend the meeting, sending in ideas by letter or requesting a copy of the draft plan to review. Please remember that not all potential participants have access to the Internet and you should not rely exclusively on electronic communications to provide information or to seek comments. Track and Document Participation Keep track of individuals that have RSVP’ed for the meetings/workshops or that have opted to provide input through other methods. Communities will have different types of participants depending on population and size of community, geographic location, and services provided at the local level. If groups or individuals that you had identified as stakeholders in the planning are not participating, you should make contact by telephone to reach out and encourage participation in the plan. Participation may remain low, however be sure you have made a good faith effort to involve passengers, representatives of public, private, and non-profit transportation and human services providers, and others. The lead agency convening the coordinated planning process should document the efforts they utilized, including keeping a log showing to whom and when letters were sent out and what replies were received if any. FTA further proposes that recipients demonstrate a good faith effort to reach out to specific targeted partners by maintaining copies of notices, newspaper ads, letters, etc., to document their outreach efforts. Federal guidance on participation in the planning process emphasizes: (1) Ensuring adequate outreach efforts; (2) recognition of outreach efforts; and (3) participation from non-DOT funded partner agencies and organizations. Meeting/Workshop Arrangements Any public meetings regarding the plan should be held in a location and time where accessible transportation services can be made available and adequately advertised to the general public using techniques such as those listed above. Additionally, interpreters for individuals with hearing impairments and English as a second language and accessible formats (e.g., large print, Braille, electronic versions) should be provided as required by law. Pre-Meeting Data Collection Your meeting/workshop participants, in particular service providers, will be an important source of information for your plan. Therefore, MDOT recommends you solicit specific information from your participants prior to the meeting/workshop. An example

BPT-TSS-GL Coordination Plan Template October 16, 2008 6
“information sheet” of the information you should solicit from each participant prior to the meeting/workshop is included with the sample invitation letter in Attachment 1. Developing Plan Content Planning Meeting/Workshop
See Attachment 1 for a sample meeting/workshop invitation letter and participant information sheet.
Be sure you provide adequate lead time for this mailing – remember you want people to provide you information prior to the meeting/workshop that you will need to compile. SAMPLE FIRST MEETING/WORKSHOP AGENDA 1. Introductions, Purpose of Meeting/Workshop
2. Coordinated Plan Requirements
3. How Stakeholders Were Notified
4. Assessment of Available Services
5. Transportation Services That Are Doing Well
6. Assessment of Transportation Needs
7. Transportation Services We Need to do Better
8. Identify Gaps
9. Develop Strategies to Address the Gaps
10. Develop Priorities for Implementation Based on Resources, Time, and Feasibility
11. Put Coordination Plan Together
It is expected that planning participants will have an active role in the development, adoption, and implementation of the plan, so your meeting/workshop should be structured to ensure their active participation. Consult the United We Ride Framework for Action: Facilitators Guide for tips on how to conduct the meeting. An Assessment of Available Services (Element 2) Prior to the meeting/workshop, compile the information about existing services that you received from the information sheets sent in by stakeholders. Provide copies at the meeting/workshop and review the materials to ensure it is complete. Be sure the information shows all service that is being provided, highlights the things that are being

BPT-TSS-GL Coordination Plan Template October 16, 2008 7
done well, and helps you see where there is duplication and gaps. If the information is incomplete, you may need to take additional efforts after the meeting/workshop to collect the information. This information will result in an “Assessment of Available Services” which is one of the required elements of your plan (Element 2). See Attachment 2 for a Sample Assessment of Available Services. An Assessment of Transportation Needs (for individuals with disabilities, older adults, and people with low incomes) (Element 3) Prior to the meeting/workshop, compile the information about needs that you received from the information sheets sent in by stakeholders. Provide copies at the meeting/workshop and use the information to have an active discussion about transportation needs. Use the professional and personal experience of the people attending the meeting/workshop to develop a comprehensive list of needs. Discuss/determine if there are common origins and destinations that people requiring transportation services need. Also determine if there are any existing planning documents that address transportation mobility issues these should be made available at the meeting/workshop. If you had made an initial decision to have the plan only focus on the needs of one or two of the targeted population groups, you may receive feedback at the meeting/workshop that the plan should be expanded to address all three targeted population groups. It is likely that meeting/workshop participants may decide that additional information should be gathered regarding needs. For example, they may decide that a survey of existing transportation users should be completed to obtain further information regarding existing service and unmet transportation needs. If the need information is incomplete (or if you are missing key stakeholders at the meeting/workshop), you may need to take additional efforts after the meeting/workshop to collect the information. Once you have compiled all the information on needs you will use it to prepare an “Assessment of Transportation Needs, which is a required element of your plan (Element 3). See Attachment 3 for a sample assessment of transportation needs. Strategies and/or Activities to Address the Identified Gaps (Element 4) One of the primary goals of your meeting/workshop will be to prepare a list of strategies or activities that will address gaps in service. It is recommended you compile an initial list prior to the meeting/workshop to initiate discussion. See Attachment 4 for a sample listing of strategies and/or activities to address identified gaps in service. Customize this list to be reflective of your area and hand it out at the meeting/workshop. The final list you prepare at the meeting/workshop will be included as one of the elements of the plan.

BPT-TSS-GL Coordination Plan Template October 16, 2008 8
Priorities for Implementation Based on Resources, Time, and Feasibility (Element 5) Engage the group in a discussion to prioritize the strategies and/or activities above. Classify each strategy or activity as a high, medium, or low priority. Establish timelines and action steps for high priority strategies and assign the responsibility for carrying them out. Some strategies may be immediate (something you implement right away) and therefore are more detailed; others may be ideas that need more thought or development. Remember, agencies that intend to apply to MDOT (or a large urban transit agency) for funding under the Elderly Individuals and Individuals with Disabilities Program (Section 5310); the Job Access Reverse Commute (JARC) (Section 5316); and the New Freedom Program (Section 5317) have to show that their application was derived from this plan. Therefore, the high priority strategies should clearly support any intended funding applications. Writing and Updating Your Plan At the close or your meeting/workshop, you should have a good beginning on your plan content. The meeting/workshop participants should determine the following:
• What additional data gathering is needed to complete the plan? • Who is responsible for that data gathering? • Are additional meetings/workshops needed? • Who is responsible for writing the plan? • What will the process be for review and comment on the draft plan?
o By meeting/workshop participants o By Others
• What is the timeline for submitting the plan to MDOT? • What will the process be for adopting the plan? • How often will the plan be updated? • What will the process be for updating the plan? • How will implementation of the plan be monitored?
Remember – coordination is an ongoing process – it does not end with the plan. You may want to form a smaller, permanent implementation group to oversee plan activities as they progress. You must submit to MDOT the Required Coordinated Plan Elements listed on Page 2 of this document.

BPT-TSS-GL Coordination Plan Template October 16, 2008 9
ATTACHMENT 1
Sample Meeting/workshop Invitation Letter
Date of Letter You are invited to participate in a meeting/workshop to identify the human service transportation needs of Midville County. The meeting/workshop will be held on date of meeting, time of meeting, place of meeting. Please RSVP to: (insert name and contact information of person to RSVP to). The Safe, Affordable, Flexible, Efficient Transportation Equity Act, A Legacy for Users (SAFETEA‐LU) requires that projects selected for funding under the Elderly Individuals and Individuals with Disabilities Program (Section 5310); the Job Access Reverse Commute (JARC) (Section 5316); and/or the New Freedom Program (Section 5317) be derived from a locally developed, coordinated public transit‐human services transportation plan, and that the plan be developed through a process that includes representatives of public, private, and non‐profit and human services transportation providers and participation by the public. Insert a paragraph describing why this plan is important to your community, such as – it is required for your agency to apply for federal and state funds to continue existing transportation to work services your agency is providing (describe them briefly)… or it will allow you to make application for new federal funds for new or expanded transportation services aimed at low income individuals and/or persons with disabilities… or it is required for your agency to apply for federal and state funds to replace vehicles currently be used by ….. For services aimed at persons with disabilities and the elderly. In addition to making us eligible to apply for federal and state funds, coordinated planning is important to our community on a long term basis. Remember the old adage, “the whole is greater than the sum of its parts?” The effect of a coordinated system multiples the service provided by individual providers. There are unmet transportation needs in all communities that we should be working together to meet. Repeated studies identify the lack of transportation as among the top obstacles to employment and full participation in community life for older adults, persons with disability, low income families and others. Coordination is the best way to stretch scare transportation resources and improve mobility for everyone. You have been identified as a provider of transportation or someone interested in transportation issues for people living in the county. We are inviting you to participate

BPT-TSS-GL Coordination Plan Template October 16, 2008 10
in a meeting/workshop to develop a plan to identify the transportation needs of the county and to help improve services. To facilitate discussion at the meeting/workshop, we would like to gather some information prior to the meeting/workshop. Part of the process is an assessment or inventory of available services in the county. Please complete the attached information sheet regarding any transportation services you provide. The plan will also identify transportation needs in the county and develop priorities to address the needs. Please provide an explanation of any needs and ideas to address these needs. The information sheets are due on (insert date that sheets should be returned by). We look forward to seeing you at the meeting/workshop. Sincerely, Enclosure: Information Sheet

BPT-TSS-GL Coordination Plan Template October 16, 2008 11
Coordinated Plan – Stakeholder Information Sheet Please complete this sheet and submit it to (insert name and address) by (insert due date): Name of Person/Agency: For Service Providers: Service Area: Type of Service (DR, Fixed Route, Vanpool, etc): Customers: (Elderly, Disabled, General Public, etc.): Trip Purpose(s): (Employment, Shopping, Medical, etc.): Funding Sources: (5310, 5307, 5311, Non FTA, Specialized Services, etc.): Fares: Service Hours: Miles per year: Trips per year: Hours per year: List of Vehicles (include size, lifts, etc.) For all Stakeholders: What do you see as the public transportation needs in our area, specifically the needs of individuals with disabilities, older adults, and people with low income? What do you see as the priority actions/strategies we must take to address these needs:

BPT-TSS-GL Coordination Plan Template October 16, 2008 12
ATTACHMENT 2
Sample Assessment of Current Services The total county population, according to the 2000 US Census, is 100,000. The following table provides an indication of the number of transportation disadvantaged persons in Midville County. TABLE I Transportation Disadvantaged Population, Midville County Actual Percent of Total Elderly (age 65 and over) 12,000 12 Persons with Disabilities 4,000 4 Unemployed Individuals 5,000 5 Households with incomes below poverty level 3,000 10 Households with no automobile available 1,500 5
Source: U.S. CENSUS OF POPULATION, 2000 U.S. Bureau of the Census. Of the total county population, 40,000 (40 percent) persons reside in urban places greater than 7,500, and 60,000 (60 percent) reside in rural areas. The city of Midville (population 30,000) is the seat of county government and houses the majority of retail businesses, health care facilities, governmental services, human service agencies, and employers in Midville County. Many elderly persons and persons with disabilities reside in isolated rural areas of the county. The lack of mobility has prevented significant numbers of these individuals from obtaining essential goods and services. 1,500, or 50 percent of the households with incomes below the poverty level also live in the rural areas of the county. 4,000, or 80 percent of unemployed individuals live in the rural area or can’t find transportation to go to and from jobs in the city. The great majority of travel demand is, therefore, for service from rural outlying county areas to the city of Midville. There also exists a need, however, to transport persons to senior citizen nutrition program meal sites in the smaller communities of Normal, Parker, and Williams.1 Demand also exists for social and recreational group outings to various county locations. Proposed additions to the Midville Community Hospital in the city of Midville include 1 See accompanying location map.

BPT-TSS-GL Coordination Plan Template October 16, 2008 13
plans to add a physical therapy/rehabilitation unit which is expected to generate additional travel demand from out‐county areas. Cooper Tire Company is going to build a manufacturing plant in the city that will employ 450 people. Existing Transit Services The city of Midville has had public transportation since November 1976 when a public demand‐responsive (door‐to‐door) service was initiated. The Midville Transit System provides service to city residents with a fleet of five 8 to 12 passenger small buses, three of which are equipped to accommodate wheelchair users. This system has provided city residents a high level of public transportation service. It operates seven days a week during the following hours: Monday ‐ Friday 6:00 a.m. to 6:00 p.m. Saturday ‐ Sunday 7:30 a.m. to 6:00 p.m. Its fare structure is $1.50 for adults and students, and 75 cents for the elderly or persons with disabilities and children under 12 years. The Salvation Army has two 5310 vehicles, one station wagon and one 8 passenger van, which are used in support of that agencyʹs programs. The vehicles are driven by volunteers with no charge to the passenger. The transportation provided by the Salvation Army program is on an ʺas‐neededʺ basis and is not regularly scheduled. Most trips occur within the City of Midville. The Midville County Council on Aging has two Section 5310 lift‐equipped small buses. These vehicles are used mainly for trips within the city. Many times the Salvation Army and the Council on Aging vehicles travel to the same places when they take their clients for medical appointments and other things. At present, no transit services are available in any area of the county outside of the City of Midville.

BPT-TSS-GL Coordination Plan Template October 16, 2008 14
ATTACHMENT 3
Sample Assessment of Transportation Needs There is a demonstrated need for transportation service in rural portions of Midville County to accommodate elderly persons, persons with disabilities, and low income individuals. The use of volunteer drivers, reimbursed for driving their own vehicles, has been considered to help in the transportation of elderly persons and persons with disabilities. There is not a sufficient number of these drivers to meet existing needs, nor is such a practice deemed sufficiently reliable to provide the needed level of service. Volunteer drivers do not have accessible vehicles that would be needed for people with disabilities. There is also a great need for reliable transportation for low income individuals seeking employment in the city, especially with the opening of the new tire manufacturing plant. The service provided for employment will have to include late hours and weekends to accommodate different shifts at the plant. The plant has agreed to help defray the cost of some of the services provided. By identifying the unmet needs of the county, stakeholders were able to ascertain the services that are most appropriate and useful to provide access to the community. In light of the unmet needs, an array of service alternatives to accommodate varying transportation needs of the area was considered.

BPT-TSS-GL Coordination Plan Template October 16, 2008 15
ATTACHMENT 4
Sample Listing of Strategies and/or Activities to Address Identified Gaps.
• Coordinated effort to inform the public of all transportation alternatives in the
county. • Explore ways that the Midville Transit System can expand its service to start
providing service outside the city. One suggestion was for the transit system to become a county wide transit authority.
• Fixed routes going from the city and back to bring people in for jobs and
services.
• Coordinating all scheduling and dispatching functions under the transit system to eliminate duplication of service.
• Provide demand response service outside of the city.
• Provide transportation to jobs in the city, especially to the new tire
manufacturing plant.
• Coordinate scheduling with tire manufacturing plant.
• Provide better coordination of 5310 vehicles to avoid duplication of service.
• Purchase more vehicles.
• Employer vanpool services.