Embed Size (px)
Citation preview
FINAL REPORT
Grand Rapids Case Study—Community and Economic Benefits of Bicycling
Michigan Department of Transportation
Final Report
June 2014
Grand Rapids Case Study—Community and Economic Benefits of Bicycling
Prepared for Michigan Department of Transportation 425 West Ottawa Street Lansing, Michigan 48933-1532 Prepared by BBC Research & Consulting 1999 Broadway, Suite 2200 Denver, Colorado 80202-9750 303.321.2547 fax 303.399.0448 www.bbcresearch.com [email protected]
BBC RESEARCH & CONSULTING GRAND RAPIDS CASE STUDY PAGE 1
Grand Rapids Case Study – Community and Economic Benefits of Bicycling
Introduction
This report on the community and economic impacts of bicycling in Grand Rapids is one of five
case studies developed for the Michigan Department of Transportation (MDOT) by BBC Research
& Consulting and R. Neuner Consulting (the study team). The research on Grand Rapids was
conducted as part of the first phase of a study of economics and bicycling throughout Michigan.
The study objectives include:
1. Estimating the community and economic benefits of bicycling in Michigan;
2. Estimating the community and economic benefits of bicycling in five case study communities throughout the state;
3. Providing in-depth qualitative information on links between bicycling and the economy according to business owners, government officials and bicycling advocates;
4. Estimating the economic benefits to Michigan from out-of-state participation in bicycling events; and
5. Estimating the economic benefits to Michigan from bicycle-related tourism.
Phase I of the project addressed the first three objectives and Phase II addresses the fourth and
fifth objectives. The combination of the statewide and community specific research provides an
opportunity to examine the specific ways policies and infrastructure impact local businesses and
residents in the context of bicycling statewide. Additionally, the diverse nature of bicycling in the
five case study communities gives stakeholders throughout Michigan an understanding of the
many roles bicycling can play in a local economy. As a result, the case study reports can be a
useful starting place for residents in investigating the economic benefits of bicycling in
communities that were not studied as a part of this research.
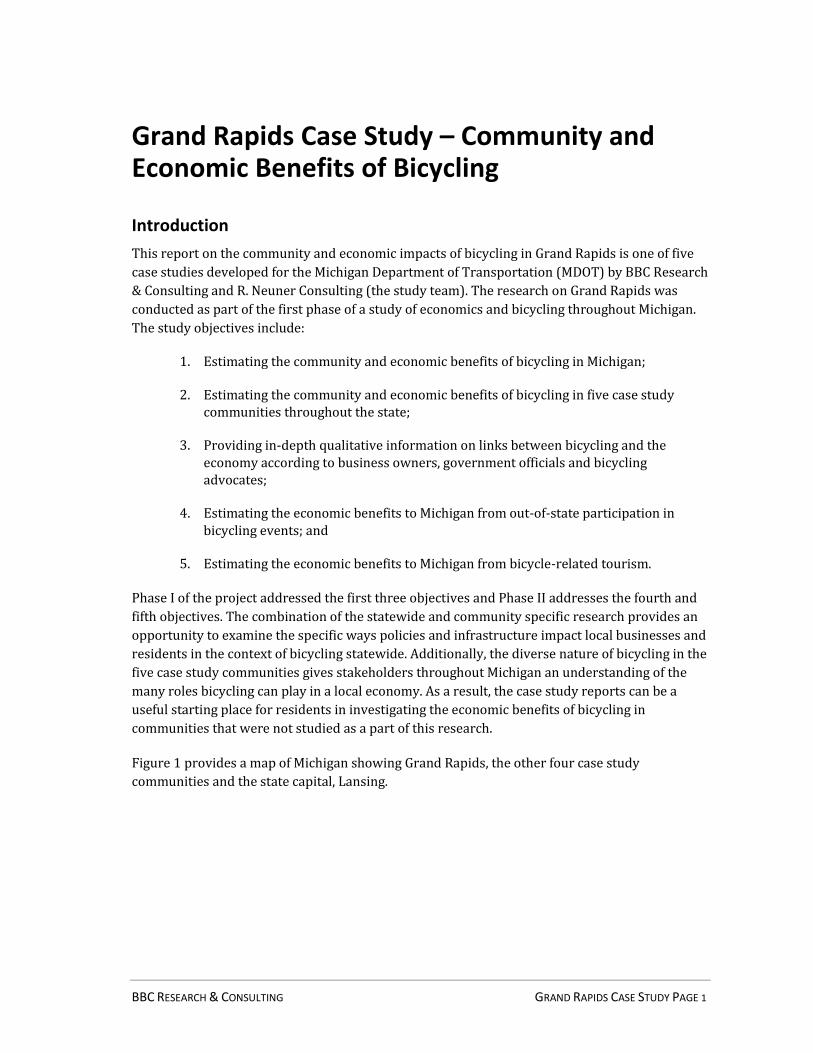
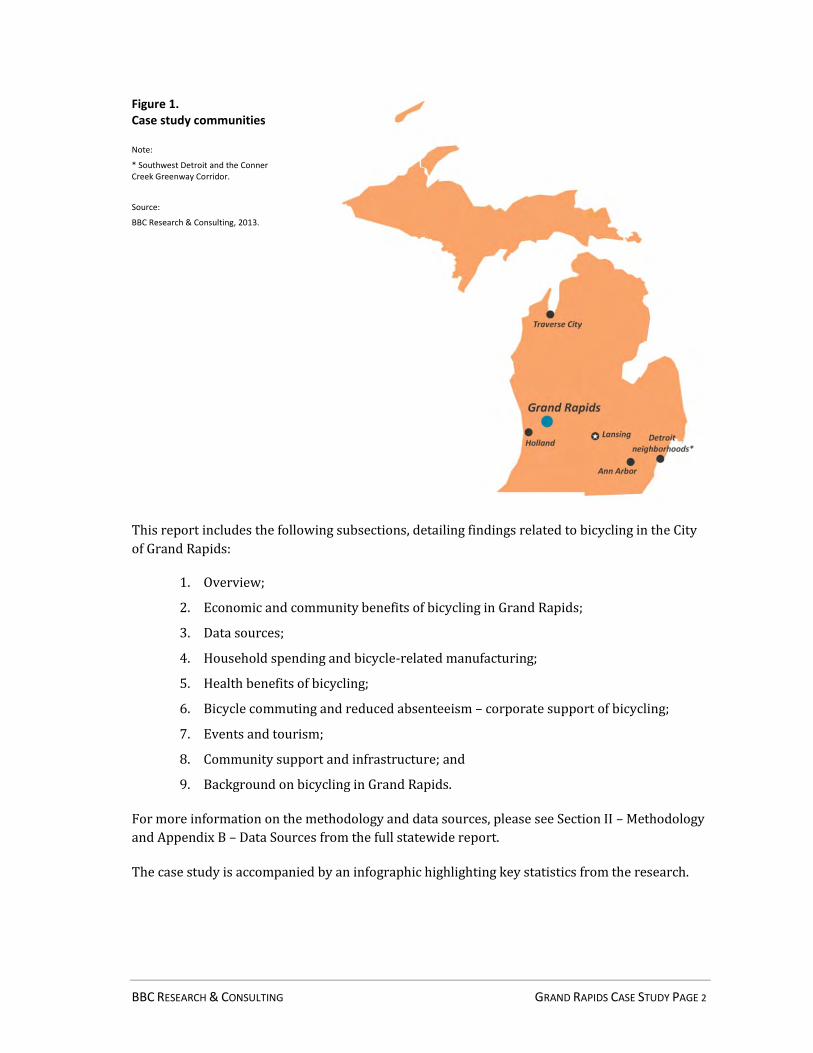
Figure 1 provides a map of Michigan showing Grand Rapids, the other four case study
communities and the state capital, Lansing.
BBC RESEARCH & CONSULTING GRAND RAPIDS CASE STUDY PAGE 2
Figure 1. Case study communities
Note:
* Southwest Detroit and the Conner Creek Greenway Corridor.
Source:
BBC Research & Consulting, 2013.
This report includes the following subsections, detailing findings related to bicycling in the City
of Grand Rapids:
1. Overview;
2. Economic and community benefits of bicycling in Grand Rapids;
3. Data sources;
4. Household spending and bicycle-related manufacturing;
5. Health benefits of bicycling;
6. Bicycle commuting and reduced absenteeism – corporate support of bicycling;
7. Events and tourism;
8. Community support and infrastructure; and
9. Background on bicycling in Grand Rapids.
For more information on the methodology and data sources, please see Section II – Methodology
and Appendix B – Data Sources from the full statewide report.
The case study is accompanied by an infographic highlighting key statistics from the research.
BBC RESEARCH & CONSULTING GRAND RAPIDS CASE STUDY PAGE 3
1- Overview
The City of Grand Rapids is the second largest city in Michigan with a total population of nearly
190,000 residents. It serves as the central city in a metropolitan area containing more than
1,000,000 residents. It is located in western Lower Michigan and is home to a number of colleges
and universities. It was recently ranked by the W.E. Upjohn Institute as the leader in job creation
in the Midwest for large cities. Grand Rapids has made substantial investments recently in
bicycle facilities and has a goal of installing 100 miles of bicycle lanes by 2015.
This case study provides an estimate of the community and economic benefits of bicycling in the
City of Grand Rapids along with key information from local residents detailing the links between
the economy and bicycling. This combination of data helps the reader quantify the impacts of
bicycling on the economy while providing background and context from key Grand Rapids
stakeholders on how bicycling enhances the Grand Rapids economy.
Given the relative lack of specific data on bicycling in Grand Rapids, the analysis relies on
information from a variety of sources including:
Numerous stakeholder interviews with Grand Rapids officials, business owners, residents
and bicycle advocates;
A household survey conducted with city residents; and
A variety of secondary data sources including the United States Census Bureau’s American
Community Survey, the Michigan Department of Community Health, and the United States
Centers for Disease Control and Prevention.
BBC RESEARCH & CONSULTING GRAND RAPIDS CASE STUDY PAGE 4
2- Economic and Health Benefits of Bicycling in Grand Rapids
Below is a summary of the annual economic and health benefits estimated for Grand Rapids
associated with bicycling:
Household spending on bicycling related items (from bike-specific and general retail
establishments) - $8.3 million;
Manufacturing - $2.6 million;
Avoided health care costs - $13.5 million;
Reduced absenteeism - $10.3 million; and
Event and tourism spending - $4.3 million.
These benefits total to approximately $39.1 million annually. The remainder of the report
provides more information on each of the key components of the overall economic and
community benefits.
Along with the substantial benefits documented above, several key themes emerged from
interviews with stakeholders in Grand Rapids that show the connections between bicycling and
economic success as viewed by local officials, the business community and bicycling advocates:1
Bicycling is a key component of placemaking and a strategy that many in the business
community embrace as a tool for talent attraction and to position Grand Rapids as a
competitive, vibrant city.
The region has the largest bicycle industry presence in the state, including two
international firms.
Local government commitment has led to major strides in bicycling infrastructure in a short
period of time.
Bicycling fits into a larger commitment to sustainability in Grand Rapids. Grand Rapids has
the most LEED certified buildings per capita in the United States and was named "America's
Greenest City" by Fast Company magazine.
There is a strong and growing bicycle racing culture in the Grand Rapids region. The
relationship between racing and recent investments in bicycling is an area that warrants
further study.
In the words of Matt Ruiter, general manager at Velocity Cycles, a custom bicycle rim and wheel
manufacturer:
“Bicycling is a viable form of transportation in Grand Rapids. Riding a bike isn’t just about
getting somewhere and saving gas, it makes people healthier, hungrier … From a local
economic perspective, there’s a serious trickle-down effect.”
1 While qualitative information collected from various stakeholders in Grand Rapids proved to be of great value, the views and
opinions expressed by stakeholders cited in this report do not necessary represent those of MDOT.

BBC RESEARCH & CONSULTING GRAND RAPIDS CASE STUDY PAGE 5
3- Data Sources
A number of data sources were used in calculating the overall economic and community benefits
and reporting on bicycling in Grand Rapids including:
The American Community Survey (ACS) – The ACS is a survey conducted by the United
States Census Bureau on an ongoing basis. It provides statistically reliable information on
residents throughout the United States for a variety of topics including basic demographics,
employment, transportation and payments for essential goods and services.2
2013 Michigan Department of Transportation Household Survey on Bicycling – As
part of the study, an online household survey was conducted to collect information from
Michigan residents about their bicycling habits and spending. Responses were collected through
outreach to statewide bicycle organizations, social media, cards distributed in each of the case
study communities and post cards mailed to a random selection of households in Grand Rapids.
A total of 314 responses from households in Grand Rapids were collected. Estimates regarding
bicycling participation among all Grand Rapids households were calculated using the 132
responses collected from the mailed post card surveys. A copy of the survey instrument is
included Appendix C of the Phase I report.
Michigan Department of Community Health (MDCH) – The Michigan Department of
Community Health provides health services to millions of Michigan residents each year and
maintains information on the rate of certain diseases and medical conditions such as stroke and
heart disease. MDCH data estimating the number of stroke and heart disease cases and the
average direct and indirect costs associated per case were used to estimate the number of such
cases and costs incurred in Grand Rapids. These estimated costs were applied to the World
Health Organization’s estimate of the percent of stroke and heart disease cases attributable to
inactivity, thereby allowing an estimation of costs avoided by active cyclists (those who ride two
days a week or more).
The Centers for Disease Control and Prevention (CDC) – The CDC is operated by the
United States Department of Health and Human Services and collects data on health problems
throughout the country. CDC data were used in calculating avoided health benefits due to
bicycling, as described above.
Dun & Bradstreet (D&B) – D&B provides information on businesses by industry and location.
Data from Hoovers, a D&B subsidiary, provides information on the revenues and employment of
bicycle-related manufacturers and retailers throughout the state.
Where appropriate, this case study provides comparisons between other economic research
related to bicycling and the results of this study.
2For commuting by bicycle data were taken from the U.S. Census Bureau; American Community Survey; 2008-2012 5-Year
Estimates, Table S0801 Commuting Characteristics by Sex. For information on the population and number of households in
Michigan, data were taken from U.S. Census Bureau; American Community Survey; 2008-2012 5-Year Estimates, Table DP02
Selected Social Characteristics in the United States. Both tables were accessed at http://factfinder2.census.gov/.
BBC RESEARCH & CONSULTING GRAND RAPIDS CASE STUDY PAGE 6
In-depth stakeholder interviews. – As a part of this study, key public officials, business
owners and representatives of community organizations were interviewed about bicycling and
the local economy. A list of interview participants is included in Appendix D of the statewide
report.
4- Household Spending and Bicycle-related Manufacturing
In the household survey, respondents were asked to quantify their total annual household
spending on bicycling. Spending on bicycling includes bicycles, components, equipment and
maintenance. A significant amount of households do not spend money on bicycling, but
approximately one-quarter of households reported spending at least $100 annually, while a
handful of households spend considerably more than $100 annually.
Based on the distribution of spending, the average Grand Rapids household spent roughly $114
on bicycle-related equipment in 2013. This is slightly above the national $90 per-household
spending reported by the Outdoor Industry Association in 2012, and it is higher than the
statewide average of $46 per household.3 Using the average household spending from the survey
along with ACS data regarding the total number of households in Grand Rapids (72,785), the
total spending on bicycle-related retail purchases in 2013 was approximately $8.3 million.4
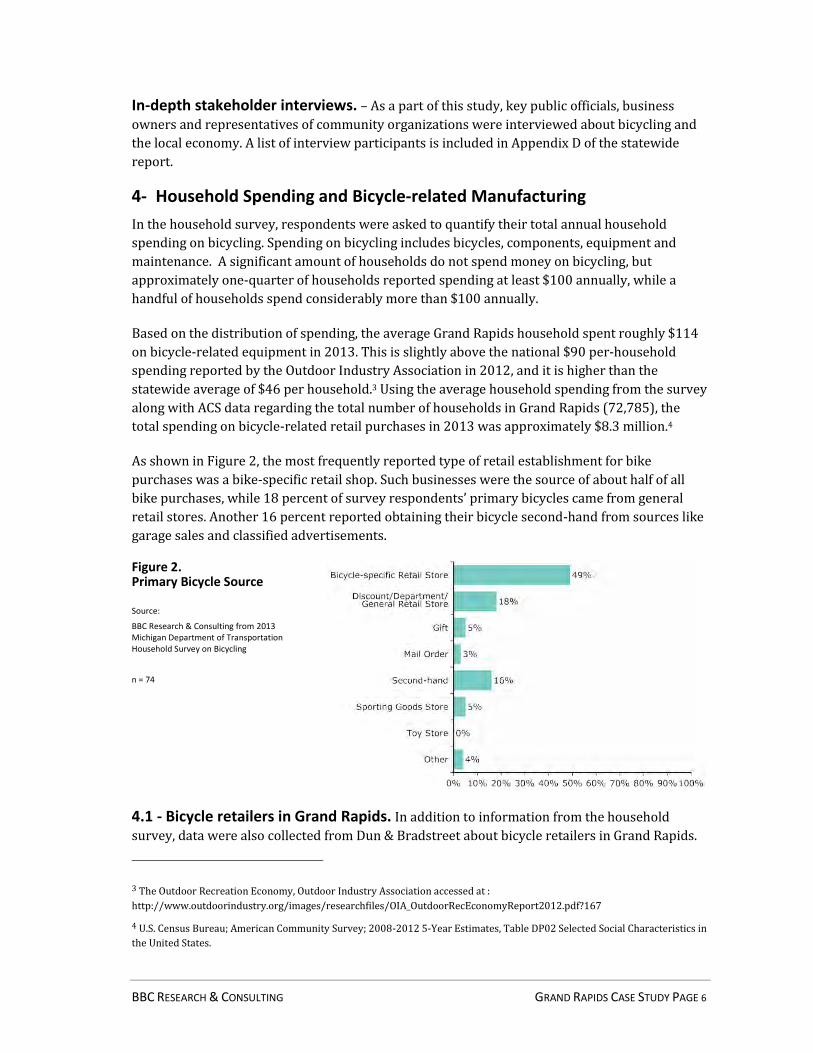
As shown in Figure 2, the most frequently reported type of retail establishment for bike
purchases was a bike-specific retail shop. Such businesses were the source of about half of all
bike purchases, while 18 percent of survey respondents’ primary bicycles came from general
retail stores. Another 16 percent reported obtaining their bicycle second-hand from sources like
garage sales and classified advertisements.
Figure 2. Primary Bicycle Source
Source:
BBC Research & Consulting from 2013 Michigan Department of Transportation Household Survey on Bicycling
n = 74
4.1 - Bicycle retailers in Grand Rapids. In addition to information from the household
survey, data were also collected from Dun & Bradstreet about bicycle retailers in Grand Rapids.
3 The Outdoor Recreation Economy, Outdoor Industry Association accessed at :
http://www.outdoorindustry.org/images/researchfiles/OIA_OutdoorRecEconomyReport2012.pdf?167
4 U.S. Census Bureau; American Community Survey; 2008-2012 5-Year Estimates, Table DP02 Selected Social Characteristics in
the United States.
BBC RESEARCH & CONSULTING GRAND RAPIDS CASE STUDY PAGE 7
Dun & Bradstreet maintains business listings for the United States and reports information such
as revenue and employment. Using these data, BBC collected information on bicycle-related
retail establishments in Grand Rapids. The average three-year revenue for these businesses in
Grand Rapids was more than $1.7 million. Dun & Bradstreet also reported that these businesses
employ approximately 21 individuals. These data serve as a conservative estimate of the bike-
specific retail sales and employment in Grand Rapids given that there may be new businesses
founded since the data were collected and that many establishments that might be bike-specific
shops may be categorized more broadly by Dun & Bradstreet (for example as a sporting goods
retailer).
Bicycle retailers interviewed for the study reported that increased bicycling is having an impact
on the bicycle retail environment in the city and region. According to Nate Phelps, the owner of
Central District Cyclery,
“This community is developing an identity around biking and livability. Five years ago that
would not have happened. People are talking about Grand Rapids as its own thing, putting
its own spin on things.”
Representatives from Grand Rapids’ bicycle industry firms reported growing sales figures, but
did not provide specific data on the increase in revenues. One representative reported that their
company had increased the number of dealers they supply by 25 percent in the past year and
that they had to turn dealers away in 2013.
4.2 - Non-bicycle-specific retail spending. Given that there are many types of retailers in
Grand Rapids that sell bicycles, the study team used results from the household survey on
bicycle spending along with the reported distribution of type of establishment to estimate to
total bicycle-related spending at general retail establishments. Using this information, bicycle
related spending by Grand Rapids households represents approximately $2.2 million in annual
sales.
4.3 - Bicycle-related manufacturing in Grand Rapids. Grand Rapids is home to a diverse
bicycle industry, including global bicycle manufacturing and component firms, including
CycleSafe, Velocity USA, Inc., and TerraTrike / WizWheels, Inc.
Local firms pointed to West Michigan’s legacy in furniture making and Michigan’s manufacturing
base as providing competitive advantages. Several firms use Michigan suppliers to meet their
production needs, including protyping, welding, powdercoating, and other manufacturing
services. According to Richard Hartger, CEO of CycleSafe, a Grand Rapids secure bicycle parking
manufacturer:
“It is really important for us to find good quality suppliers, including those that are ISO
9001 certified. Our partners in West Michigan are great and reflect the kind of production
capability we have here.”
As reported by Dun & Bradstreet, Grand Rapids bicycle-related manufacturers have at
approximately $2.6 million annually in revenues and account for 23 jobs in the local economy. As
with bicycle retailers, some bicycle-related manufacturing may be classified in a broader
BBC RESEARCH & CONSULTING GRAND RAPIDS CASE STUDY PAGE 8
industry category and thus this represents a conservative estimate of the manufacturing-related
benefits from bicycling in Grand Rapids.
5- Health Benefits of Bicycling
The study team used information from a variety of sources to estimate the health and workplace
benefits derived from bicycling in Grand Rapids.
5.1 - Health benefits from physical activity. Physical activity helps reduce the risk of a
number of costly medical conditions. Several studies quantified the value of physical activity in
terms of avoided health costs. The study team quantified benefits to Grand Rapids from physical
activity based on avoided costs for treatment of strokes and heart disease. The information came
from a variety of sources including:
Data on the proportion of the conditions caused by physical inactivity from the World
Health Organization;5
The annual number of cases of these conditions in Michigan from the Centers for Disease
Control and Prevention (CDC) (strokes) and the Michigan Department of Community Health
(MDCH) (heart disease);
The annual direct and indirect costs per case from the Michigan Department of Community
Health; and
The proportion of residents who reported riding their bike two or more days each week in
the household survey.
Using statewide heart disease and stroke case data from CDC and MDCH, it was estimated that
Grand Rapids experiences approximately 540 cases of stroke and 2,100 cases of heart disease
annually that require hospitalization. These case numbers were applied to MDCH’s cost per case
estimates of about $90,000 for stroke and $88,000 for heart disease and the World Health
Organization’s (WHO’s) estimation that 10 percent of stroke cases and 20 percent of heart
disease cases are attributable to inactivity.
Applying the rates and costs of cases for Michigan to the proportion of active bicyclists in Grand
Rapids, the study team estimates that the total avoided costs for strokes and heart disease in
Grand Rapids due to bicycling is approximately $13.5 million. A number of other costly medical
conditions can also be linked to reduced physical activity including diabetes and some forms of
cancer. The study team was not able to find adequate data to estimate the potential avoided
health costs for these diseases.
6- Bicycle Commuting and Reduced Absenteeism - Corporate Support of Bicycling
2012 American Community Survey (ACS) also provides some data on bicycle commuting in
Grand Rapids, reporting the total commute share at 0.9 percent.6 The ACS asks participants to
5 The World Health Report 2002: Reducing Risks, Promoting Healthy Life.

BBC RESEARCH & CONSULTING GRAND RAPIDS CASE STUDY PAGE 9
report their commute by asking how respondents “usually” commuted to work over the past
week and directs respondents to only report the type of transportation which accounts for the
majority of the distance. As a result, it may underreport the prevalence of bike commuting in
Grand Rapids given that some individuals may not “usually” bike and that many bike commuters
may combine their bike commute with other types of transportation including transit and
carpooling.
The study team also asked cyclists in the household survey about how often they use their
bicycle for commuting or other types of transportation. Results are shown in Figure 3 below.
While most responding cyclists report never commuting to work or school by bicycle, about one-
third do so at least occasionally. Non-work/school transportation by bicycle, including running
errands or attending social events, is more common.
Figure 3. Average Frequency of Commuting and Non-work/school transportation among Bicyclists
Source: BBC Research & Consulting from 2013 Michigan Department of Transportation Household Survey on Bicycling
n = 74; 75
Local businesses have helped encourage increased commuting in Grand Rapids, such as
Steelcase, Inc., a global company headquartered in Grand Rapids that develops and manufactures
furniture products and services for workplaces. Steelcase has an employee presence on the
Active Commute Week planning team, and is a key corporate partner in promoting bicycling in
the Grand Rapids region. In 2012, they added an indoor bike storage facility for employees at
their global headquarters, which serves more than 900 employees. The parking facility is a
designated, secure room with easy access to the outside of the building, and includes storage
6 U.S. Census Bureau; American Community Survey; 2008-2012 5-Year Estimates, Table S0801 Commuting Characteristics by
Sex.
BBC RESEARCH & CONSULTING GRAND RAPIDS CASE STUDY PAGE 10
bins and clothing / helmet hooks. Steelcase representatives indicated that the use of the room
has been increasing according to data monitoring the card access system in the facility.
Sean Fahey, a Steelcase representative, cited several reasons for investing in this kind of
infrastructure, including reducing employee health care costs, promoting sustainability, and
attracting talented employees:
“Our mission is to create great experiences wherever work happens. If you take a walk
around our building or look at what we’re involved in, it is about creating a great
experience for our employees.”
One local stakeholder pointed out that other large employers are starting to support bicycling by
promoting biking to work, including the GGRBC’s Active Commute Week.
6.1 - Reduced absenteeism. Increase bicycling for transportation or recreation can have
benefits for employers. The London School of Economics estimates that active cyclists in the
workplace miss one fewer day of work per year than non-bicycling workers,7 and research
published in the Journal of Occupational and Environmental Medicine estimates that one work
day absence equates to an average of $341 in lost productivity. Using the proportion of active
cyclists in Grand Rapids along with an estimate of the cost of absenteeism per day, the study
estimated that the total benefits to Grand Rapids due to reduced absenteeism are approximately
$10.3 million.
7- Events and Tourism
Grand Rapids has a strong bicycle racing culture, backed up by several major bicycling events.
Major events include the Gran Fondo, the Kisscross Cyclocross Series, the Lumberjack 100, and
the Barry-Roubaix.
The Kisscross race series has grown to a total of 6 to 8 races a season. The race series started
with about 35 people at their first event in 2005, to a record of 201 at an event in 2012. In 2013
they averaged 150-160 racers per event.
Another are race, the Barry-Roubaix, is now the largest gravel road race in the United States. In
2013, the race had just fewer than 3,000 registrants (the race started in 2009 with 290
registrants). 29% of the 2013 registrants were from outside Michigan, including more than 400
riders from Illinois and nearly 200 from Indiana. Since the race began in 2009, racers have
attended from 28 states and from Ontario. Race organizers estimated that the 2013 event has a
total economic impact of more than $407,000.8
Bicycling is fitting into non-bike related events, as well. One local bike shop offered tours of
ArtPrize, an international art competition in Grand Rapids with more than $500,000 in prizes.
7 The British Cycling Economy Gross Cycling Product Report. London School of Economics
8 The Founders Brewing Barry-Roubaix 2013 Event Summary. Provided by the event organizers. The report makes assumptions
about meal and transportation costs for all racers and lodging costs for riders traveling more than 200 miles and applies those
estimates to the number of participants.
BBC RESEARCH & CONSULTING GRAND RAPIDS CASE STUDY PAGE 11
Additionally, several large, regional employers have been involved in the bicycling community
for the last decade by sponsoring bicycle events and racing teams, including Spectrum Health
and Priority Health.
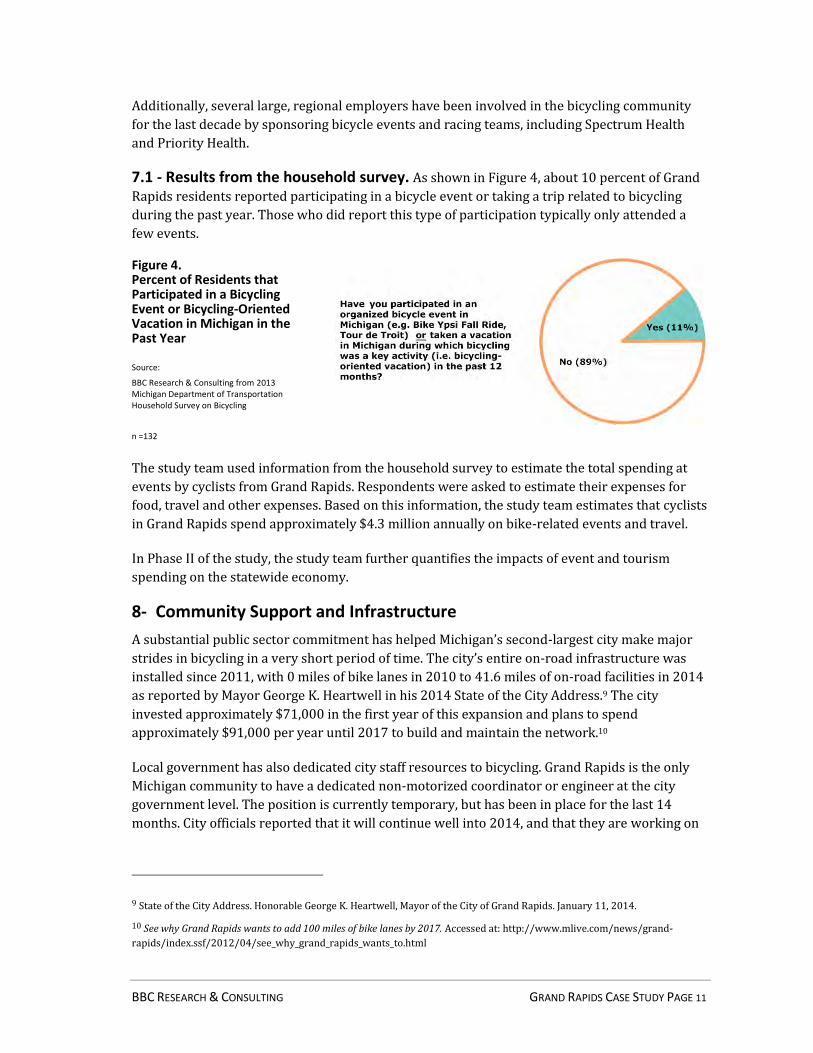
7.1 - Results from the household survey. As shown in Figure 4, about 10 percent of Grand
Rapids residents reported participating in a bicycle event or taking a trip related to bicycling
during the past year. Those who did report this type of participation typically only attended a
few events.
Figure 4. Percent of Residents that Participated in a Bicycling Event or Bicycling-Oriented Vacation in Michigan in the Past Year
Source:
BBC Research & Consulting from 2013 Michigan Department of Transportation Household Survey on Bicycling
n =132
The study team used information from the household survey to estimate the total spending at
events by cyclists from Grand Rapids. Respondents were asked to estimate their expenses for
food, travel and other expenses. Based on this information, the study team estimates that cyclists
in Grand Rapids spend approximately $4.3 million annually on bike-related events and travel.
In Phase II of the study, the study team further quantifies the impacts of event and tourism
spending on the statewide economy.
8- Community Support and Infrastructure
A substantial public sector commitment has helped Michigan’s second-largest city make major
strides in bicycling in a very short period of time. The city’s entire on-road infrastructure was
installed since 2011, with 0 miles of bike lanes in 2010 to 41.6 miles of on-road facilities in 2014
as reported by Mayor George K. Heartwell in his 2014 State of the City Address.9 The city
invested approximately $71,000 in the first year of this expansion and plans to spend
approximately $91,000 per year until 2017 to build and maintain the network.10
Local government has also dedicated city staff resources to bicycling. Grand Rapids is the only
Michigan community to have a dedicated non-motorized coordinator or engineer at the city
government level. The position is currently temporary, but has been in place for the last 14
months. City officials reported that it will continue well into 2014, and that they are working on
9 State of the City Address. Honorable George K. Heartwell, Mayor of the City of Grand Rapids. January 11, 2014.
10 See why Grand Rapids wants to add 100 miles of bike lanes by 2017. Accessed at: http://www.mlive.com/news/grand-
rapids/index.ssf/2012/04/see_why_grand_rapids_wants_to.html
BBC RESEARCH & CONSULTING GRAND RAPIDS CASE STUDY PAGE 12
funding to make it permanent. Despite funding challenges, Suzanne Schulz, the Director of the
Planning Department for the City of Grand Rapids, says that this investment is critical:
“The Grand Rapids community has not found funding challenges to be an acceptable
answer for waiting to build a more accessible transportation system. We need to build an
accessible system. Our city demands that of us, and it is becoming an expectation of how we
do business. Money is a challenge, but it can’t be an excuse.”
Policy changes that include bicycling as a component of planning decisions underpin some of the
City’s bicycling growth. The City re-wrote its zoning ordinance in 2007, adding requirements for
bicycle parking, and adopted a complete streets resolution in March 2011.
A number of Grand Rapids stakeholders, including city officials, see bicycling as a relatively low-
cost path to economic development and talent attraction for Grand Rapids. Officials at the City of
Grand Rapids see a multitude of benefits from improving bicycle facilities in the City, including
direct fiscal benefits, and less road and car parking infrastructure to maintain. They also see a
host of indirect benefits. As Piotr Lewak, a Senior Project Engineer for the City of Grand Rapids,
said:
“If we cut total vehicle miles traveled down by a certain percentage, we can have a
dramatic impact on air pollution, obesity, congestion, and our quality of life. People can live
closer to work because they have another mode of transportation to choose from.”
The City is not alone in its increased commitment to bicycling. At the regional level, the Grand
Valley Metro Council recently added CMAQ as an eligible funding source for non-motorized
projects. This is a “major step forward” for addressing the growing bicycle ridership in the
region, according to Abed Itani, the director of transportation planning for the Council.
Previously, communities had to rely solely on local road funding for bicycle-related projects.
8.1 - Talent attraction and placemaking. Another important aspect of bicycling according
to many of the stakeholders interviewed is that making Grand Rapids more bike-friendly will
help businesses attract a talented workforce. A recent study from the University of Michigan
suggested that one reason for reduced driving among young adults in the U.S. was the preference
for biking and walking11. While more research is needed on the link between planning decisions
and talent attraction, many of the business representatives interviewed see bicycling as
important their recruiting:
“That business case for retaining and attracting talent is something people in Grand Rapids
understand. City leaders get it. Downtown Grand Rapids, Inc. gets it. Any employer that
needs innovative people gets that. They support bicycling because it’s a key component of
talent attraction.” – Tom Tilma, Greater Grand Rapids Bicycling Coalition
11 The Reasons for the Recent Decline in Young Driver Licensing in the U.S. Brandon Schoettle and Michael Sivak, The University
of Michigan Transportation Research Institute, August 2013.
BBC RESEARCH & CONSULTING GRAND RAPIDS CASE STUDY PAGE 13
The growth of downtown Grand Rapids as a residential and entertainment destination has
included bicycle infrastructure improvements. The Downtown Development Authority (DDA)
has an on-street bicycle parking corral program, and creates a yearly parking plan. Businesses
across the City are asking to get bike parking facilities for their customers and employees. In
2013, the DDA implemented a plan to install six on-street bike corrals for four months in
different areas of downtown Grand Rapids. The total cost for installing the 6 on-street corrals
and 139 U-shaped racks was approximately $55,350. The city also spent $5,000 on a marketing
campaign to tell residents about the increase in bike parking in the downtown area.12
As Suzanne Schulz said,
“We’re seeing a greater push toward secure bike parking. More developers are adding this,
because people are demanding it.”
The impact of parking infrastructure on the number of cyclists visiting local businesses in the
downtown area has not been documented in Michigan; a few studies have documented benefits
from increased bike parking.13 Further research could help better quantify the impacts of such
facilities on businesses in communities like Grand Rapids.
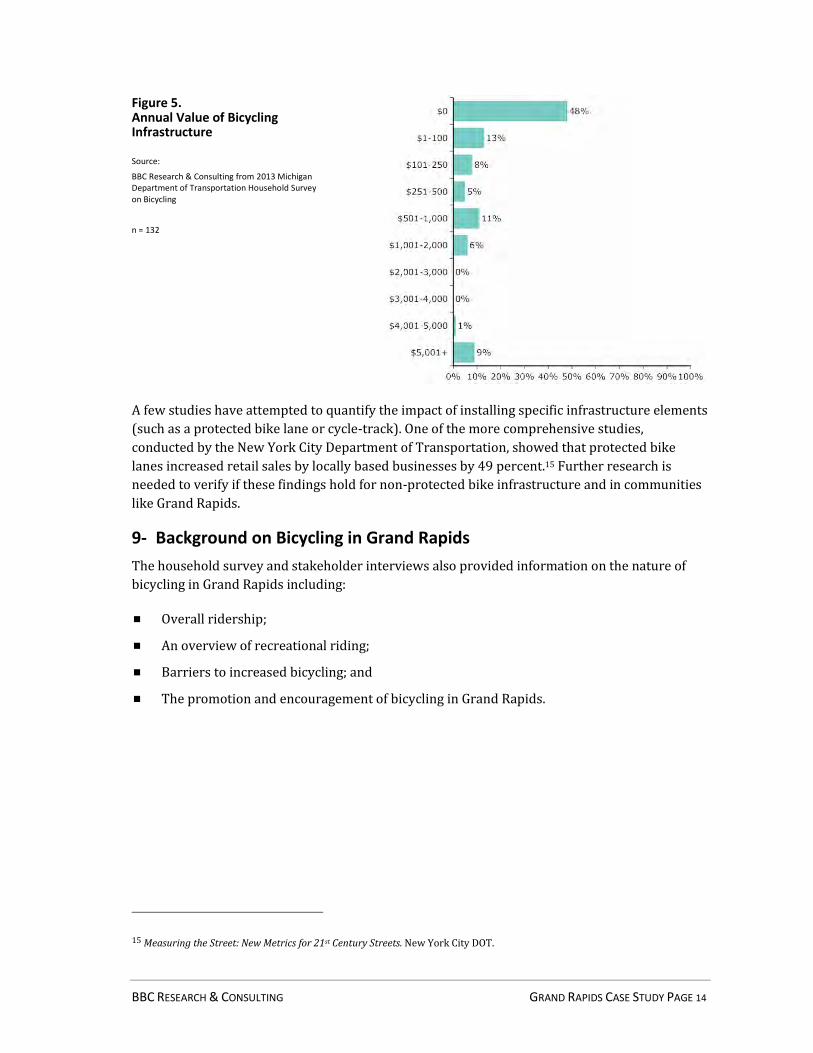
8.2 - Value of bicycle infrastructure. Residents in Grand Rapids also report substantial
value from the availability of quality bicycle infrastructure. Survey respondents were asked to
quantify the value placed on bicycle-specific infrastructure such as bicycle lanes, cycle tracks and
shared-use pathways. As shown in Figure 5, about 40 percent of residents placed an annual
value of accessing bicycle infrastructure at more than $100. Nine percent of respondents even
placed an annual value of more than $5,000 on the ability to use bicycle infrastructure.14
12 Each U-rack cost $250 while the bike corrals, which provide parking for 12-18 bikes cost $2,100. Source: More than 200
bicycle parking spots coming to downtown Grand Rapids, Accessed: http://www.mlive.com/news/grand-
rapids/index.ssf/2013/02/more_than_200_bicycle_parking.html and Downtown Grand Rapids bike corrals to displace 6 metered
parking spaces for 12 months. Accessed at: http://www.mlive.com/news/grand-
rapids/index.ssf/2013/02/downtown_grand_rapids_bike_cor.html
13 Researchers in Portland report that business owners cite increased customers, improved seating opportunities, and better
visibility of their businesses from the street Bike Corrals: Local Business Impacts, Benefits, and Attitudes. Drew Meisel, Portland
State University School of Urban Studies and Planning. In Melbourne, Australia research suggests that converting a car parking
space to a bicycle corral is an effective way to increase revenue in business districts. Economic impact of bicycle corral parking
in Melbourne, Australia, Simon Stainsby.
14 It is important to note that while respondents reported a high value for a network of bicycling infrastructure, this does not
suggest that Grand Rapids should implement taxes or fees for residents to access this infrastructure. Bicycle registration and
fee collection have been considered by a few jurisdictions in the past decade and have not been implemented or have been
repealed for a variety of reasons (Ottawa: http://www.ottawasun.com/2012/01/13/staff-to-council-no-bicycle-licences; San
Diego: http://calbike.org/san-diego-repeals-bicycle-license-law/ ; Minneapolis and Minnesota:
http://www.dot.state.mn.us/bike/other.html, Long Beach: http://latimesblogs.latimes.com/lanow/2011/02/long-beach-
eliminates-bike-registration-law-that-dealt-steep-fines.html).
BBC RESEARCH & CONSULTING GRAND RAPIDS CASE STUDY PAGE 14
Figure 5. Annual Value of Bicycling Infrastructure
Source:
BBC Research & Consulting from 2013 Michigan Department of Transportation Household Survey on Bicycling
n = 132
A few studies have attempted to quantify the impact of installing specific infrastructure elements
(such as a protected bike lane or cycle-track). One of the more comprehensive studies,
conducted by the New York City Department of Transportation, showed that protected bike
lanes increased retail sales by locally based businesses by 49 percent.15 Further research is
needed to verify if these findings hold for non-protected bike infrastructure and in communities
like Grand Rapids.
9- Background on Bicycling in Grand Rapids
The household survey and stakeholder interviews also provided information on the nature of
bicycling in Grand Rapids including:
Overall ridership;
An overview of recreational riding;
Barriers to increased bicycling; and
The promotion and encouragement of bicycling in Grand Rapids.
15 Measuring the Street: New Metrics for 21st Century Streets. New York City DOT.

BBC RESEARCH & CONSULTING GRAND RAPIDS CASE STUDY PAGE 15
9.1 - Overall ridership. As shown in Figure 6, slightly more than half of the adult residents of
Grand Rapids reported riding a bike in the past year. Those respondents who report having
ridden a bicycle in the past 12 months are considered “bicyclists” in this report.
Figure 6. Residents Who Have Ridden in the Past Year
Source:
BBC Research & Consulting from 2013 Michigan Department of Transportation Household Survey on Bicycling
n = 131
According to the stakeholder interviews, the recent investment in bicycle infrastructure is
having a positive impact on the number of people choosing to bicycle in Grand Rapids.
Stakeholders reported that a combination of off-road trails and on-road facilities are having a
positive influence on the City’s growing bicycle ridership.
“I see more everyday riders than I see people in spandex. I see more and more bikes all the time. It’s more than the upwardly mobile. It’s a mode of transportation that is affordable and reliable. You don’t have to wait for a bus. It’s growing across the community in every economic sector and it is happening because of the increased infrastructure you see all over this city.” – Keith Winn, Catalyst Partners
The Greater Grand Rapids Bicycle Coalition has organized four bike counts at the same location
over the past three years. The total number of riders has increased from 437 in fall of 2011 to
688 in fall of 2013; an increase of 60 percent. The counts also showed a substantial decrease in
sidewalk use by cyclists on one corridor where a bike lane was installed and a smaller decrease
on a on another corridor where a bike lane was installed.16 Across all years of the count, more
than 40 percent of bicyclists indicated that they would have used an automobile if they were not
using a bicycle.
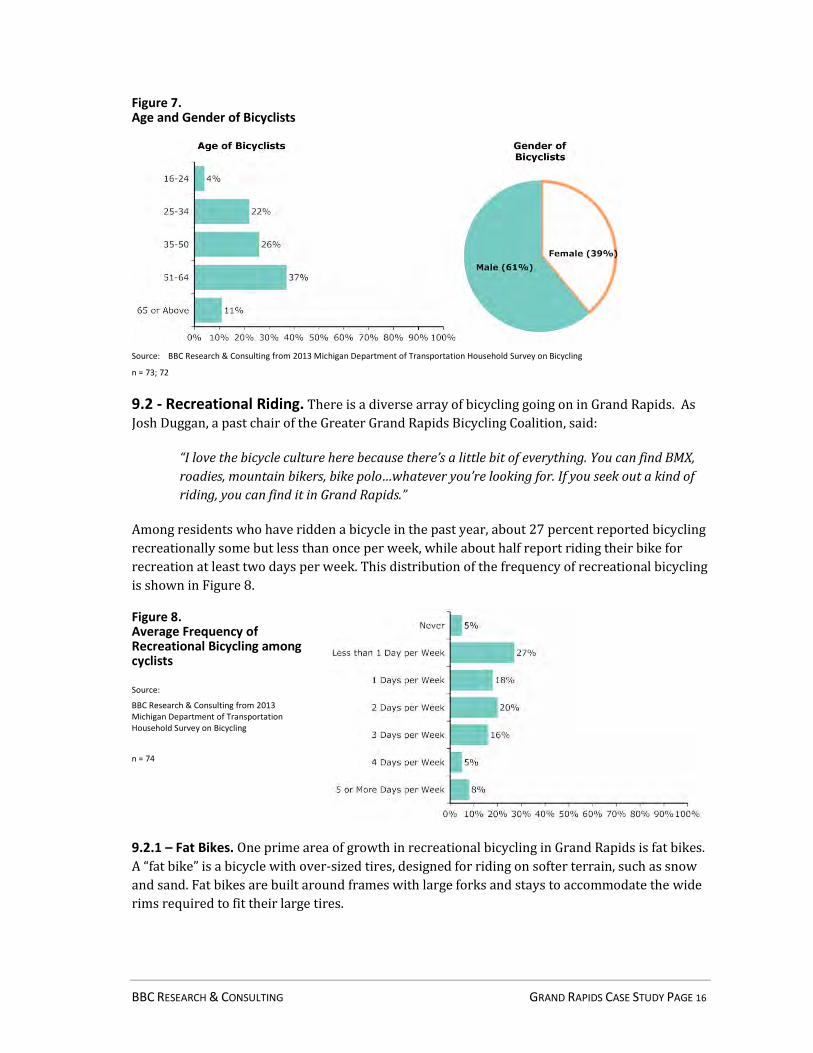
9.1.1 - Demographics. The household survey provides demographic information about residents
who reported riding in the last year. As seen in Figure 7, approximately 60 percent of cyclists in
Grand Rapids were male, and more than 70 percent were 35 years or older.
16 Bicycle Traffic Count. Greater Grand Rapids Bicycle Coalition. Accessed at: http://www.bikegrandrapids.org/programs-and-
projects/bicycle-traffic-count-results/
BBC RESEARCH & CONSULTING GRAND RAPIDS CASE STUDY PAGE 16
Figure 7. Age and Gender of Bicyclists
Source: BBC Research & Consulting from 2013 Michigan Department of Transportation Household Survey on Bicycling
n = 73; 72
9.2 - Recreational Riding. There is a diverse array of bicycling going on in Grand Rapids. As
Josh Duggan, a past chair of the Greater Grand Rapids Bicycling Coalition, said:
“I love the bicycle culture here because there’s a little bit of everything. You can find BMX,
roadies, mountain bikers, bike polo…whatever you’re looking for. If you seek out a kind of
riding, you can find it in Grand Rapids.”
Among residents who have ridden a bicycle in the past year, about 27 percent reported bicycling
recreationally some but less than once per week, while about half report riding their bike for
recreation at least two days per week. This distribution of the frequency of recreational bicycling
is shown in Figure 8.
Figure 8. Average Frequency of Recreational Bicycling among cyclists
Source:
BBC Research & Consulting from 2013 Michigan Department of Transportation Household Survey on Bicycling
n = 74
9.2.1 – Fat Bikes. One prime area of growth in recreational bicycling in Grand Rapids is fat bikes.
A “fat bike” is a bicycle with over-sized tires, designed for riding on softer terrain, such as snow
and sand. Fat bikes are built around frames with large forks and stays to accommodate the wide
rims required to fit their large tires.

BBC RESEARCH & CONSULTING GRAND RAPIDS CASE STUDY PAGE 17
Bike shop representatives and stakeholders alike highlighted the growing popularity of fat bikes
in Grand Rapids and across West Michigan. According to a local bicycle race promoter,
Michigan’s natural amenities provide an opportunity to take advantage of this new bicycling
trend:
“I brushed it [fat bikes] off as dumb novelty at first, but I’m seeing more and more of them,
now that they’re able to mass produce the bikes, and keep costs reasonable. We’re in
Michigan, and there’s a lot of sand and snow. It makes sense why they are growing in
popularity here.” – Rick Plite, promoter for Krisscross and Barry Roubaix
The fat bike trend is having a positive impact on the Grand Rapids region bicycle industry as
well. Velocity Cycles reported that they are seeing an increase in sales of rims for fat bikes and
fat bike tires through their wheel-building subsidiary, but did not provide any specific sales
numbers. Sales are helping level off a typically slow winter season. The relative growth of fat
bikes is an area where more research is needed. Beyond anecdotal information, there is little
information, even on the national market, regarding this trend.
9.3 - Barriers to increased bicycling. In the household survey, residents were asked about
barriers to riding more overall as well as barriers specific to commuting by bicycle. Respondents
were able to cite multiple barriers rather than indicating only the largest barrier. Addressing and
mitigating the most commonly stated barriers to bicycling is an effective approach to increasing
ridership. The most frequently cited barriers to increased bicycling in Grand Rapids were
weather conditions (47%) and safety concerns (41%).
BBC RESEARCH & CONSULTING GRAND RAPIDS CASE STUDY PAGE 18
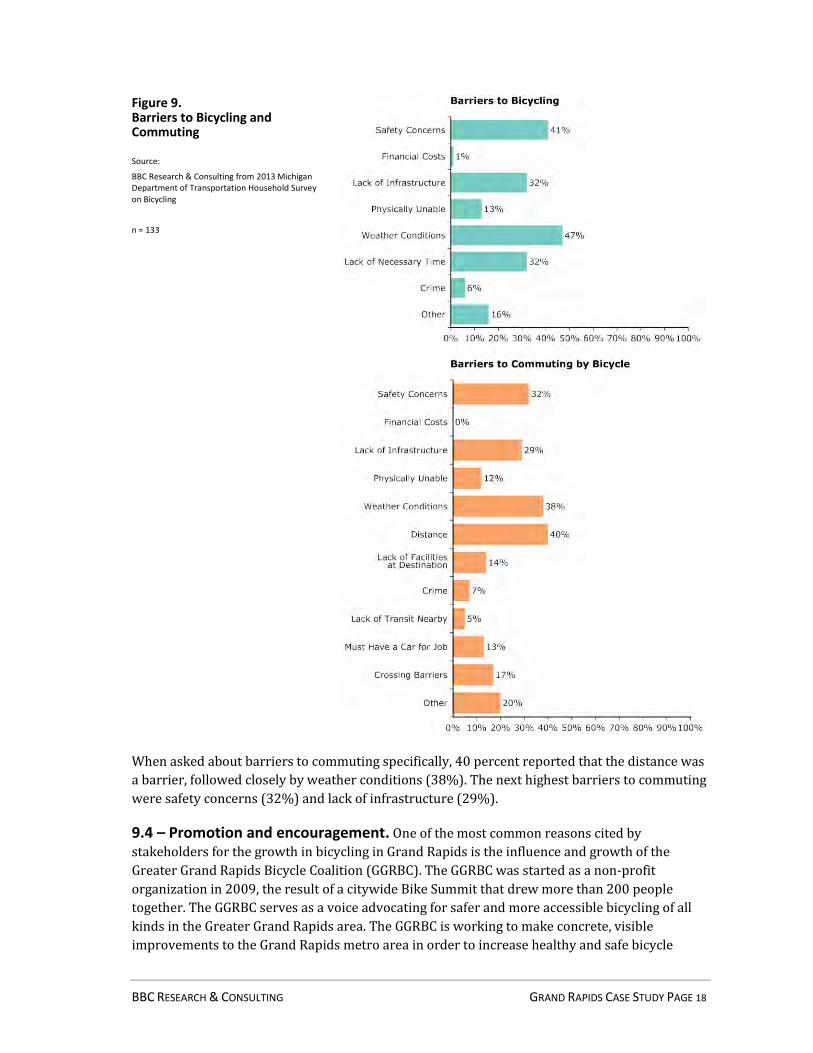
Figure 9. Barriers to Bicycling and Commuting
Source:
BBC Research & Consulting from 2013 Michigan Department of Transportation Household Survey on Bicycling
n = 133
When asked about barriers to commuting specifically, 40 percent reported that the distance was
a barrier, followed closely by weather conditions (38%). The next highest barriers to commuting
were safety concerns (32%) and lack of infrastructure (29%).
9.4 – Promotion and encouragement. One of the most common reasons cited by
stakeholders for the growth in bicycling in Grand Rapids is the influence and growth of the
Greater Grand Rapids Bicycle Coalition (GGRBC). The GGRBC was started as a non-profit
organization in 2009, the result of a citywide Bike Summit that drew more than 200 people
together. The GGRBC serves as a voice advocating for safer and more accessible bicycling of all
kinds in the Greater Grand Rapids area. The GGRBC is working to make concrete, visible
improvements to the Grand Rapids metro area in order to increase healthy and safe bicycle

BBC RESEARCH & CONSULTING GRAND RAPIDS CASE STUDY PAGE 19
opportunities through advocacy and education. The GGRBC Room to Ride campaign is currently
actively advocating for 100 miles of bike lanes in Grand Rapids by 2015.
The GGRBC has a staff of two, and meets with City planning officials on a monthly basis to
prospect projects and discuss bicycling-related issues. In the words of Suzanne Schulz, “The
GGRBC is having a real impact in pushing the City to be more bicycle-friendly.”
Bicycling in GRAND RAPIDS
Population: 189,340
Miles of existing infrastructure: 42
Residents who place an annual value of at least $100 on the ability to use bicycle infrastructure
Total annual economic impact of bicycling
Bicycling retail revenue
People employed by bicycling industry: 32
Key barriers to bicycling
Bicyclists who bike at least twice a week
Bicyclists who commute by bicycle at least twice a week
Total annual spending associated with bicycling events and vacations in Michigan
$1.7 million
$4.3 million
$39.1 million
39%55%18%11%
Top primary bicycle types
For more information contact Josh DeBruyn, MDOT Bicycle and Pedestrian Coordinator at [email protected]
“Riding a bike isn’t just about getting somewhere and saving gas...From a local economic
perspective, there’s a serious trickle-down e�ect.”- Matt Ruiter, Velocity Cycles
Study funded by
Bicycle FriendlyCommunitySM Rating
Bronze
Residents who participated in a bicycling event or bicycle-oriented vacation in Michigan in the past year
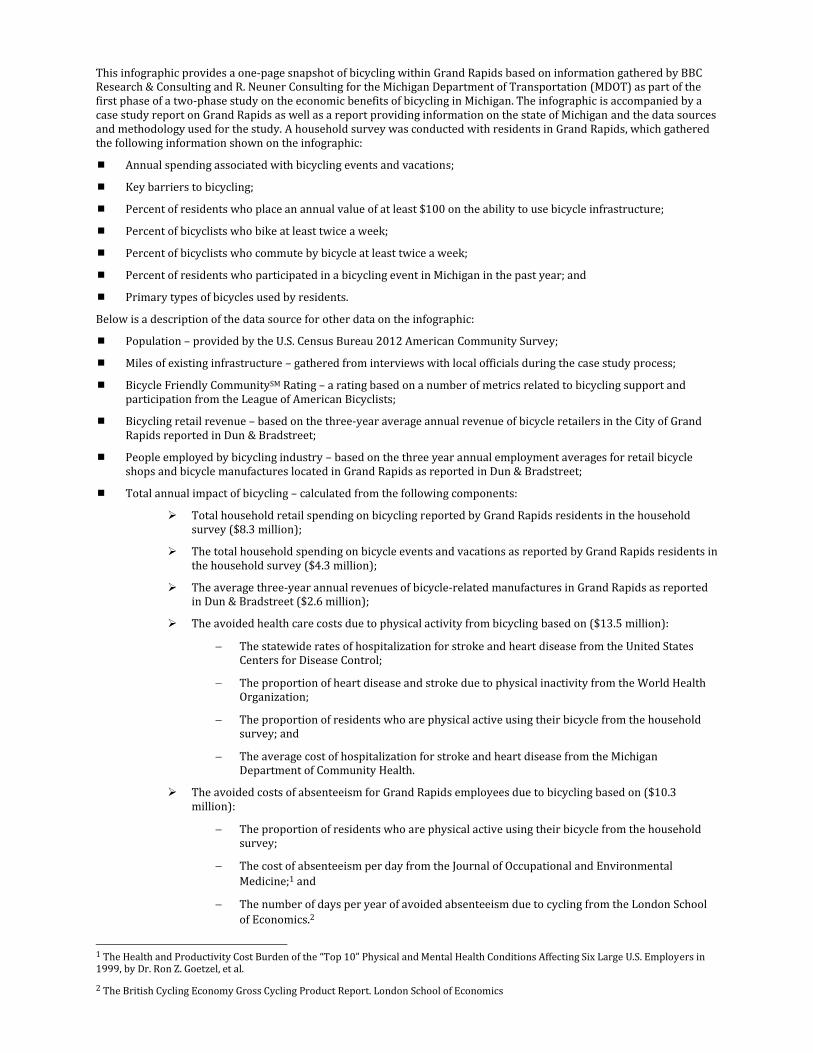
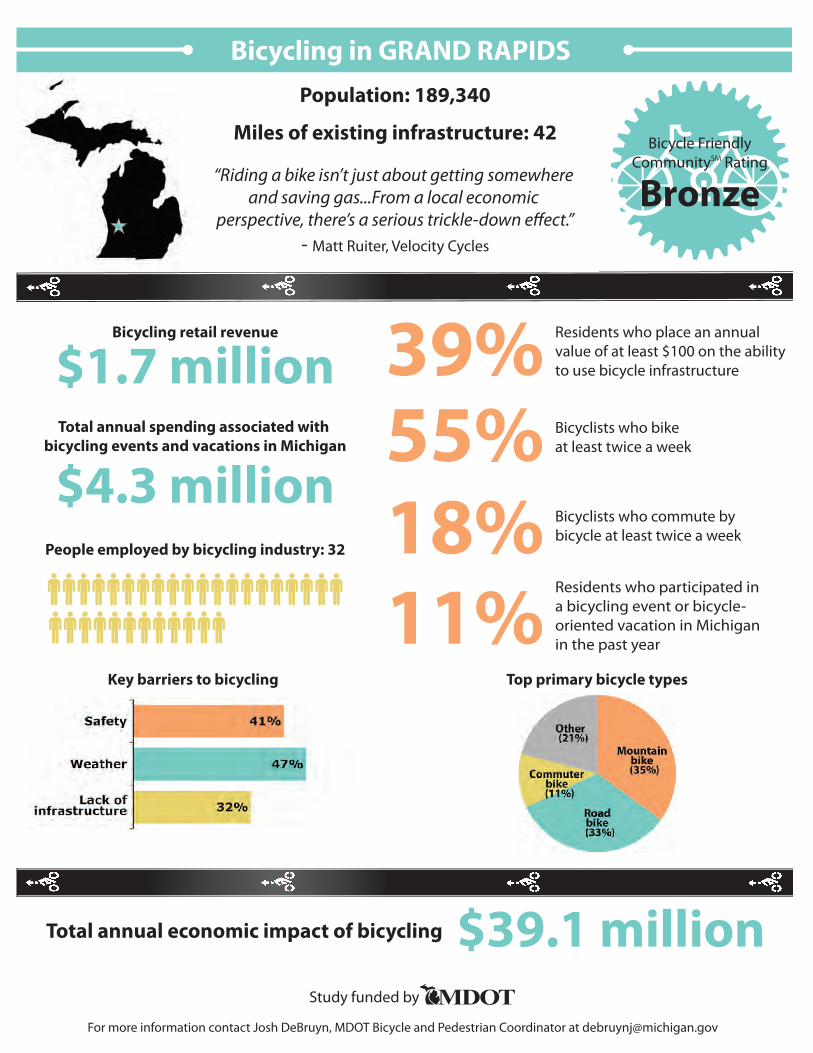
This infographic provides a one-page snapshot of bicycling within Grand Rapids based on information gathered by BBC Research & Consulting and R. Neuner Consulting for the Michigan Department of Transportation (MDOT) as part of the first phase of a two-phase study on the economic benefits of bicycling in Michigan. The infographic is accompanied by a case study report on Grand Rapids as well as a report providing information on the state of Michigan and the data sources and methodology used for the study. A household survey was conducted with residents in Grand Rapids, which gathered the following information shown on the infographic:
Annual spending associated with bicycling events and vacations;
Key barriers to bicycling;
Percent of residents who place an annual value of at least $100 on the ability to use bicycle infrastructure;
Percent of bicyclists who bike at least twice a week;
Percent of bicyclists who commute by bicycle at least twice a week;
Percent of residents who participated in a bicycling event in Michigan in the past year; and
Primary types of bicycles used by residents.
Below is a description of the data source for other data on the infographic:
Population – provided by the U.S. Census Bureau 2012 American Community Survey;
Miles of existing infrastructure – gathered from interviews with local officials during the case study process;
Bicycle Friendly CommunitySM Rating – a rating based on a number of metrics related to bicycling support and participation from the League of American Bicyclists;
Bicycling retail revenue – based on the three-year average annual revenue of bicycle retailers in the City of Grand Rapids reported in Dun & Bradstreet;
People employed by bicycling industry – based on the three year annual employment averages for retail bicycle shops and bicycle manufactures located in Grand Rapids as reported in Dun & Bradstreet;
Total annual impact of bicycling – calculated from the following components:
Total household retail spending on bicycling reported by Grand Rapids residents in the household survey ($8.3 million);
The total household spending on bicycle events and vacations as reported by Grand Rapids residents in the household survey ($4.3 million);
The average three-year annual revenues of bicycle-related manufactures in Grand Rapids as reported in Dun & Bradstreet ($2.6 million);
The avoided health care costs due to physical activity from bicycling based on ($13.5 million):
The statewide rates of hospitalization for stroke and heart disease from the United States Centers for Disease Control;
The proportion of heart disease and stroke due to physical inactivity from the World Health Organization;
The proportion of residents who are physical active using their bicycle from the household survey; and
The average cost of hospitalization for stroke and heart disease from the Michigan Department of Community Health.
The avoided costs of absenteeism for Grand Rapids employees due to bicycling based on ($10.3 million):
The proportion of residents who are physical active using their bicycle from the household survey;
The cost of absenteeism per day from the Journal of Occupational and Environmental
Medicine;1 and
The number of days per year of avoided absenteeism due to cycling from the London School
of Economics.2
1 The Health and Productivity Cost Burden of the “Top 10” Physical and Mental Health Conditions Affecting Six Large U.S. Employers in 1999, by Dr. Ron Z. Goetzel, et al.
2 The British Cycling Economy Gross Cycling Product Report. London School of Economics