Embed Size (px)
Citation preview
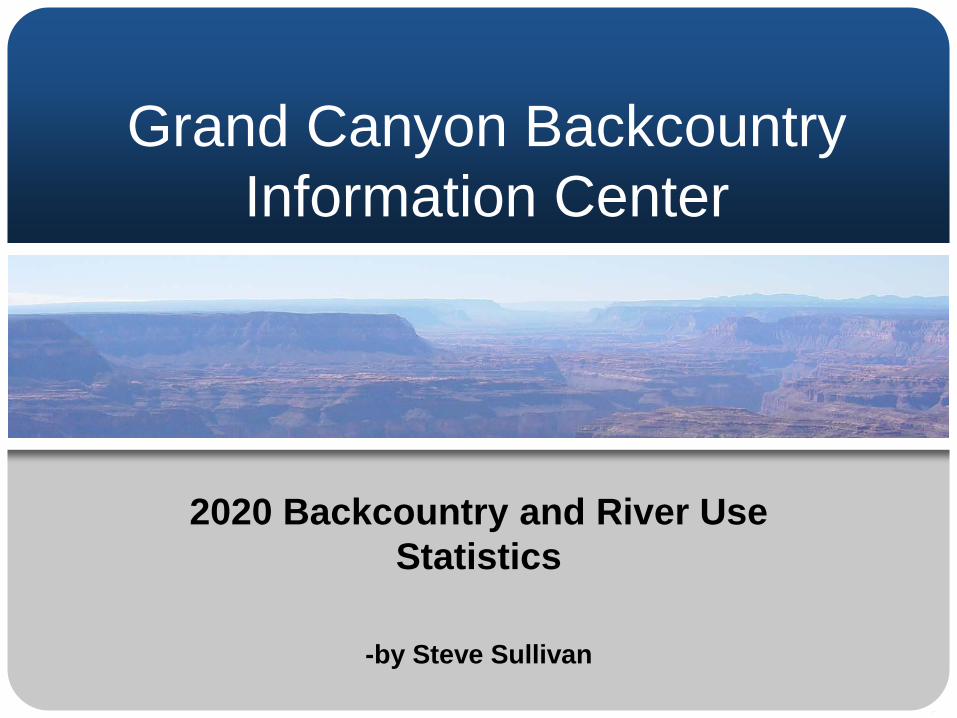
Grand Canyon Backcountry Information Center
2020 Backcountry and River Use Statistics
-by Steve Sullivan
Page 2
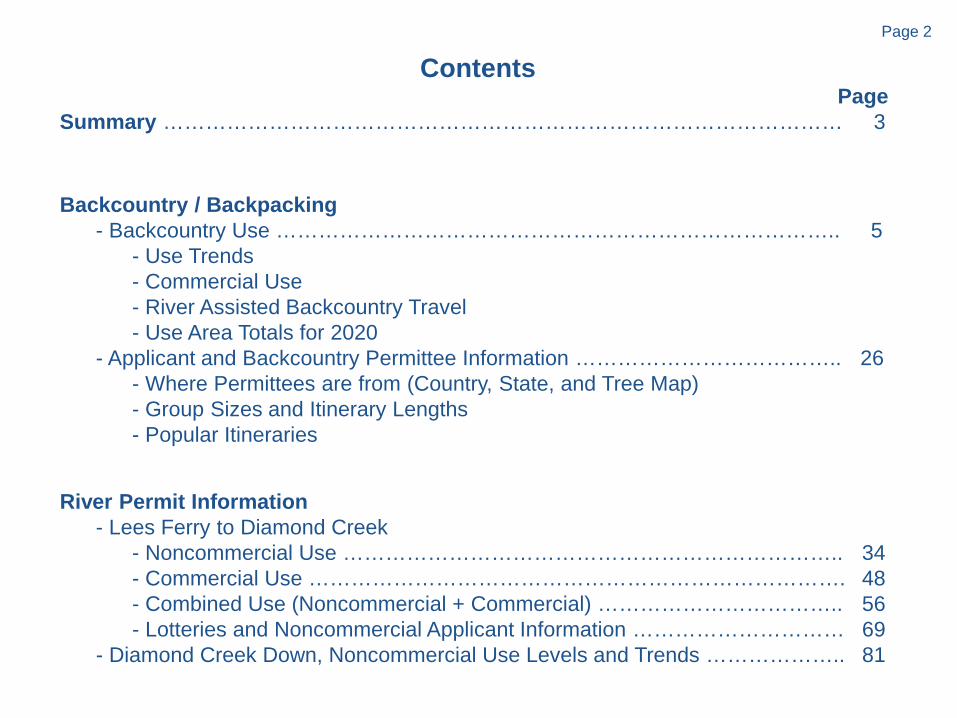
Contents Page
Summary …………………………………………………………………………………… 3
Backcountry / Backpacking- Backcountry Use …………………………………………………………………….. 5
- Use Trends- Commercial Use - River Assisted Backcountry Travel- Use Area Totals for 2020
- Applicant and Backcountry Permittee Information ……………………………….. 26- Where Permittees are from (Country, State, and Tree Map)- Group Sizes and Itinerary Lengths- Popular Itineraries
River Permit Information- Lees Ferry to Diamond Creek
- Noncommercial Use …………………………………………………………….. 34- Commercial Use …………………………………………………………………. 48- Combined Use (Noncommercial + Commercial) …………………………….. 56- Lotteries and Noncommercial Applicant Information ………………………… 69
- Diamond Creek Down, Noncommercial Use Levels and Trends ……………….. 81
Page 3
Summary Overview
Calendar year 2020 was far from normal, and this is reflected in the following pages, numbers, and graphs. A few issues deserve a special note:
COVID-19: Grand Canyon National Park shut down in the early stages of the pandemic at the advice of Government and Health Officials. River trips previously scheduled to launch between March 24th
and June 13th were cancelled/rescheduled to exactly two years later, and busy season use after that time was reduced to 75% of normal. No new backcountry permits were issued between March 23rd
and late July. In late July backcountry permit requests for September and later once again could be considered.
Bright Angel Limits: Due to an ongoing sewage treatment plant issue, on June 30th the Park decided to restrict all use at Bright Angel Campground and at Phantom Ranch to ½ capacity. This reduction remains in place and is expected to continue through all of calendar year 2021.
Technology Challenges: In February the NPS changed workplace software. Links and existing scripts quit working, and this resulted in a great amount of staffing time needed to learn and adapt to the new platform, find old documents, re-create broken documents, re-organize, and re-program scripts as needed.
Magnum Fire: On June 8th a 71,000 acre fire on the North Kaibab caused temporary closure of the North Rim and continued road closures through mid-November 2020.
Readers will see evidence of all the above within the following pages, numbers, and graphs.
Page 4
Overview
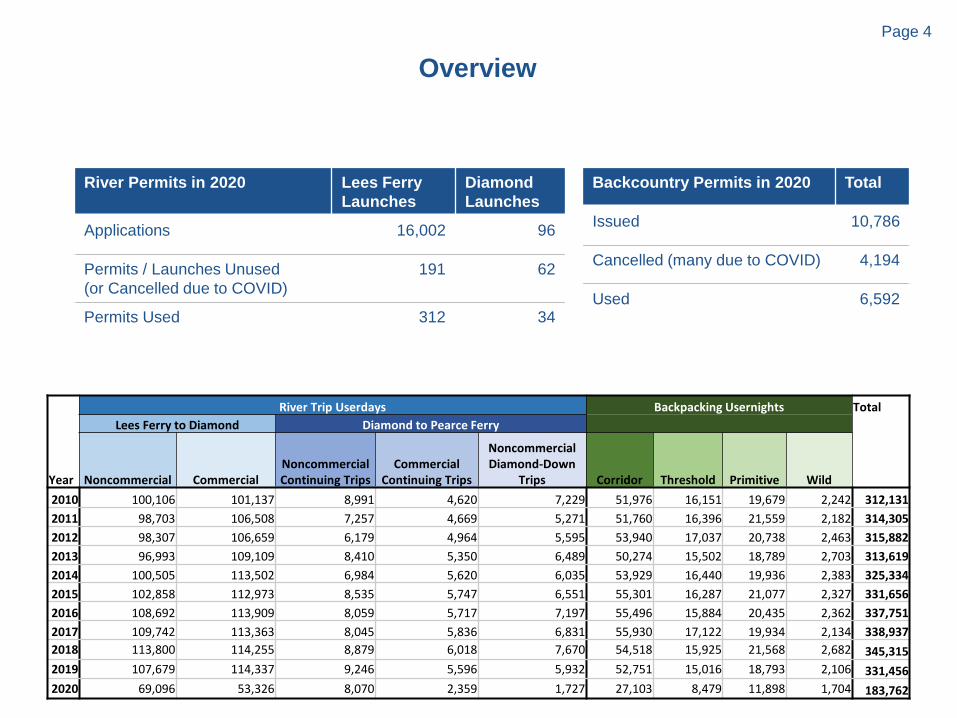
River Permits in 2020 Lees Ferry Launches
Diamond Launches
Applications 16,002 96
Permits / Launches Unused (or Cancelled due to COVID)
191 62
Permits Used 312 34
Backcountry Permits in 2020 Total
Issued 10,786
Cancelled (many due to COVID) 4,194
Used 6,592
River Trip Userdays Backpacking Usernights TotalLees Ferry to Diamond Diamond to Pearce Ferry
Year Noncommercial CommercialNoncommercial Continuing Trips
CommercialContinuing Trips
Noncommercial Diamond-Down
Trips Corridor Threshold Primitive Wild2010 100,106 101,137 8,991 4,620 7,229 51,976 16,151 19,679 2,242 312,1312011 98,703 106,508 7,257 4,669 5,271 51,760 16,396 21,559 2,182 314,3052012 98,307 106,659 6,179 4,964 5,595 53,940 17,037 20,738 2,463 315,8822013 96,993 109,109 8,410 5,350 6,489 50,274 15,502 18,789 2,703 313,6192014 100,505 113,502 6,984 5,620 6,035 53,929 16,440 19,936 2,383 325,3342015 102,858 112,973 8,535 5,747 6,551 55,301 16,287 21,077 2,327 331,6562016 108,692 113,909 8,059 5,717 7,197 55,496 15,884 20,435 2,362 337,7512017 109,742 113,363 8,045 5,836 6,831 55,930 17,122 19,934 2,134 338,9372018 113,800 114,255 8,879 6,018 7,670 54,518 15,925 21,568 2,682 345,3152019 107,679 114,337 9,246 5,596 5,932 52,751 15,016 18,793 2,106 331,4562020 69,096 53,326 8,070 2,359 1,727 27,103 8,479 11,898 1,704 183,762
Page 5
Backcountry / Backpacking
Backcountry Use
Page 6
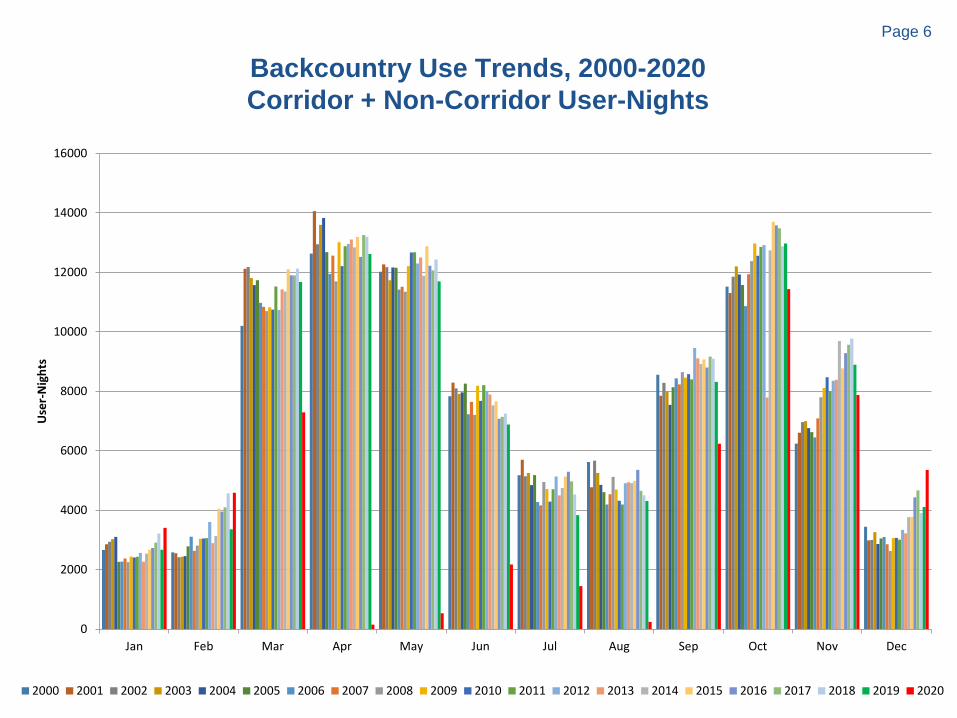
Backcountry Use Trends, 2000-2020Corridor + Non-Corridor User-Nights
0
2000
4000
6000
8000
10000
12000
14000
16000
Jan Feb Mar Apr May Jun Jul Aug Sep Oct Nov Dec
Use
r-N
ight
s
2000 2001 2002 2003 2004 2005 2006 2007 2008 2009 2010 2011 2012 2013 2014 2015 2016 2017 2018 2019 2020
Page 7
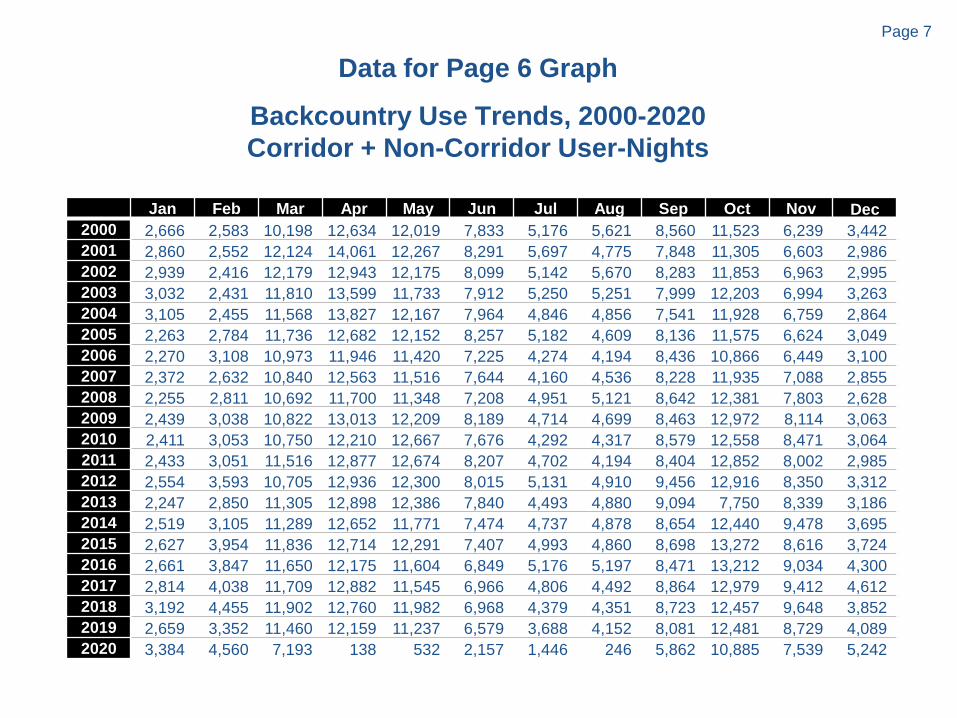
Data for Page 6 Graph
Backcountry Use Trends, 2000-2020Corridor + Non-Corridor User-Nights
Jan Feb Mar Apr May Jun Jul Aug Sep Oct Nov Dec2000 2,666 2,583 10,198 12,634 12,019 7,833 5,176 5,621 8,560 11,523 6,239 3,4422001 2,860 2,552 12,124 14,061 12,267 8,291 5,697 4,775 7,848 11,305 6,603 2,9862002 2,939 2,416 12,179 12,943 12,175 8,099 5,142 5,670 8,283 11,853 6,963 2,9952003 3,032 2,431 11,810 13,599 11,733 7,912 5,250 5,251 7,999 12,203 6,994 3,2632004 3,105 2,455 11,568 13,827 12,167 7,964 4,846 4,856 7,541 11,928 6,759 2,8642005 2,263 2,784 11,736 12,682 12,152 8,257 5,182 4,609 8,136 11,575 6,624 3,0492006 2,270 3,108 10,973 11,946 11,420 7,225 4,274 4,194 8,436 10,866 6,449 3,1002007 2,372 2,632 10,840 12,563 11,516 7,644 4,160 4,536 8,228 11,935 7,088 2,8552008 2,255 2,811 10,692 11,700 11,348 7,208 4,951 5,121 8,642 12,381 7,803 2,6282009 2,439 3,038 10,822 13,013 12,209 8,189 4,714 4,699 8,463 12,972 8,114 3,0632010 2,411 3,053 10,750 12,210 12,667 7,676 4,292 4,317 8,579 12,558 8,471 3,0642011 2,433 3,051 11,516 12,877 12,674 8,207 4,702 4,194 8,404 12,852 8,002 2,9852012 2,554 3,593 10,705 12,936 12,300 8,015 5,131 4,910 9,456 12,916 8,350 3,3122013 2,247 2,850 11,305 12,898 12,386 7,840 4,493 4,880 9,094 7,750 8,339 3,1862014 2,519 3,105 11,289 12,652 11,771 7,474 4,737 4,878 8,654 12,440 9,478 3,6952015 2,627 3,954 11,836 12,714 12,291 7,407 4,993 4,860 8,698 13,272 8,616 3,7242016 2,661 3,847 11,650 12,175 11,604 6,849 5,176 5,197 8,471 13,212 9,034 4,3002017 2,814 4,038 11,709 12,882 11,545 6,966 4,806 4,492 8,864 12,979 9,412 4,6122018 3,192 4,455 11,902 12,760 11,982 6,968 4,379 4,351 8,723 12,457 9,648 3,8522019 2,659 3,352 11,460 12,159 11,237 6,579 3,688 4,152 8,081 12,481 8,729 4,0892020 3,384 4,560 7,193 138 532 2,157 1,446 246 5,862 10,885 7,539 5,242
Page 8
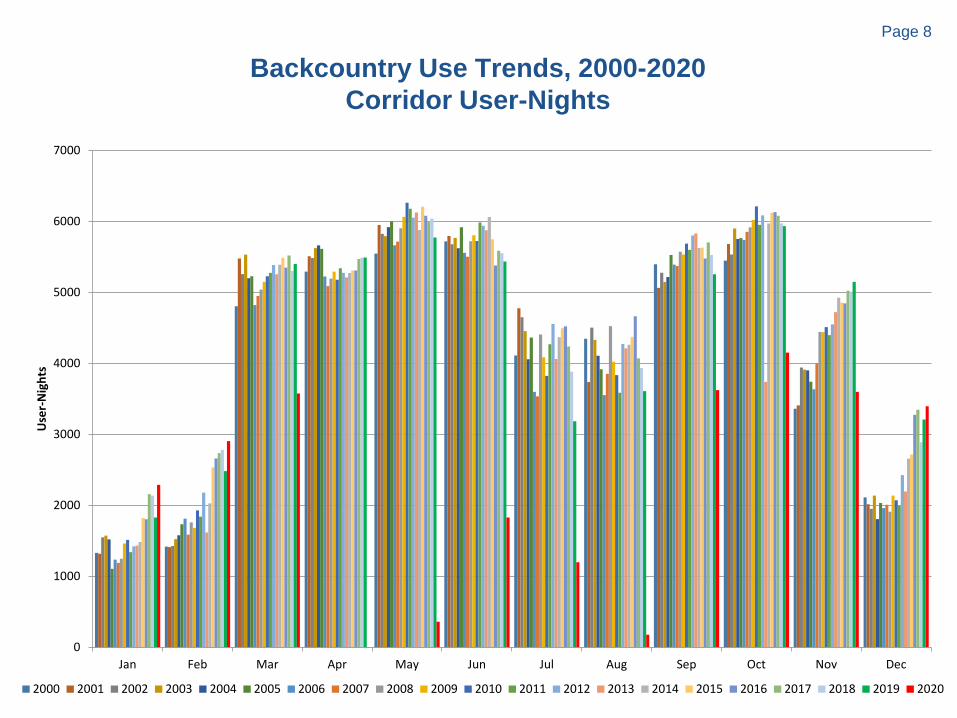
Backcountry Use Trends, 2000-2020Corridor User-Nights
0
1000
2000
3000
4000
5000
6000
7000
Jan Feb Mar Apr May Jun Jul Aug Sep Oct Nov Dec
Use
r-N
ight
s
2000 2001 2002 2003 2004 2005 2006 2007 2008 2009 2010 2011 2012 2013 2014 2015 2016 2017 2018 2019 2020
Page 9
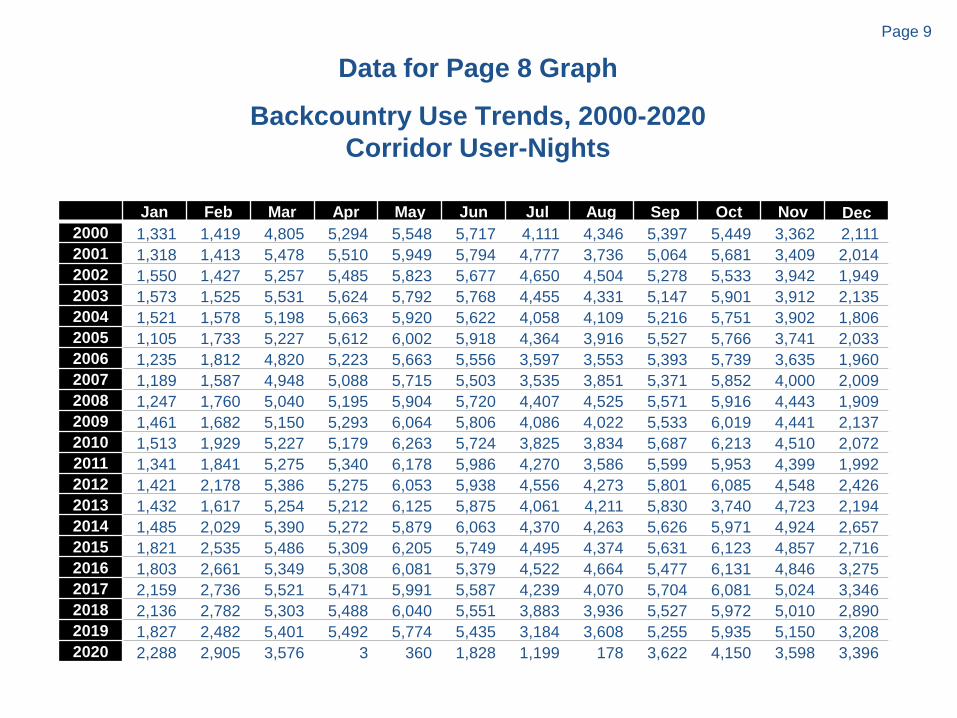
Data for Page 8 Graph
Backcountry Use Trends, 2000-2020Corridor User-Nights
Jan Feb Mar Apr May Jun Jul Aug Sep Oct Nov Dec2000 1,331 1,419 4,805 5,294 5,548 5,717 4,111 4,346 5,397 5,449 3,362 2,1112001 1,318 1,413 5,478 5,510 5,949 5,794 4,777 3,736 5,064 5,681 3,409 2,0142002 1,550 1,427 5,257 5,485 5,823 5,677 4,650 4,504 5,278 5,533 3,942 1,9492003 1,573 1,525 5,531 5,624 5,792 5,768 4,455 4,331 5,147 5,901 3,912 2,1352004 1,521 1,578 5,198 5,663 5,920 5,622 4,058 4,109 5,216 5,751 3,902 1,8062005 1,105 1,733 5,227 5,612 6,002 5,918 4,364 3,916 5,527 5,766 3,741 2,0332006 1,235 1,812 4,820 5,223 5,663 5,556 3,597 3,553 5,393 5,739 3,635 1,9602007 1,189 1,587 4,948 5,088 5,715 5,503 3,535 3,851 5,371 5,852 4,000 2,0092008 1,247 1,760 5,040 5,195 5,904 5,720 4,407 4,525 5,571 5,916 4,443 1,9092009 1,461 1,682 5,150 5,293 6,064 5,806 4,086 4,022 5,533 6,019 4,441 2,1372010 1,513 1,929 5,227 5,179 6,263 5,724 3,825 3,834 5,687 6,213 4,510 2,0722011 1,341 1,841 5,275 5,340 6,178 5,986 4,270 3,586 5,599 5,953 4,399 1,9922012 1,421 2,178 5,386 5,275 6,053 5,938 4,556 4,273 5,801 6,085 4,548 2,4262013 1,432 1,617 5,254 5,212 6,125 5,875 4,061 4,211 5,830 3,740 4,723 2,1942014 1,485 2,029 5,390 5,272 5,879 6,063 4,370 4,263 5,626 5,971 4,924 2,6572015 1,821 2,535 5,486 5,309 6,205 5,749 4,495 4,374 5,631 6,123 4,857 2,7162016 1,803 2,661 5,349 5,308 6,081 5,379 4,522 4,664 5,477 6,131 4,846 3,2752017 2,159 2,736 5,521 5,471 5,991 5,587 4,239 4,070 5,704 6,081 5,024 3,3462018 2,136 2,782 5,303 5,488 6,040 5,551 3,883 3,936 5,527 5,972 5,010 2,8902019 1,827 2,482 5,401 5,492 5,774 5,435 3,184 3,608 5,255 5,935 5,150 3,2082020 2,288 2,905 3,576 3 360 1,828 1,199 178 3,622 4,150 3,598 3,396
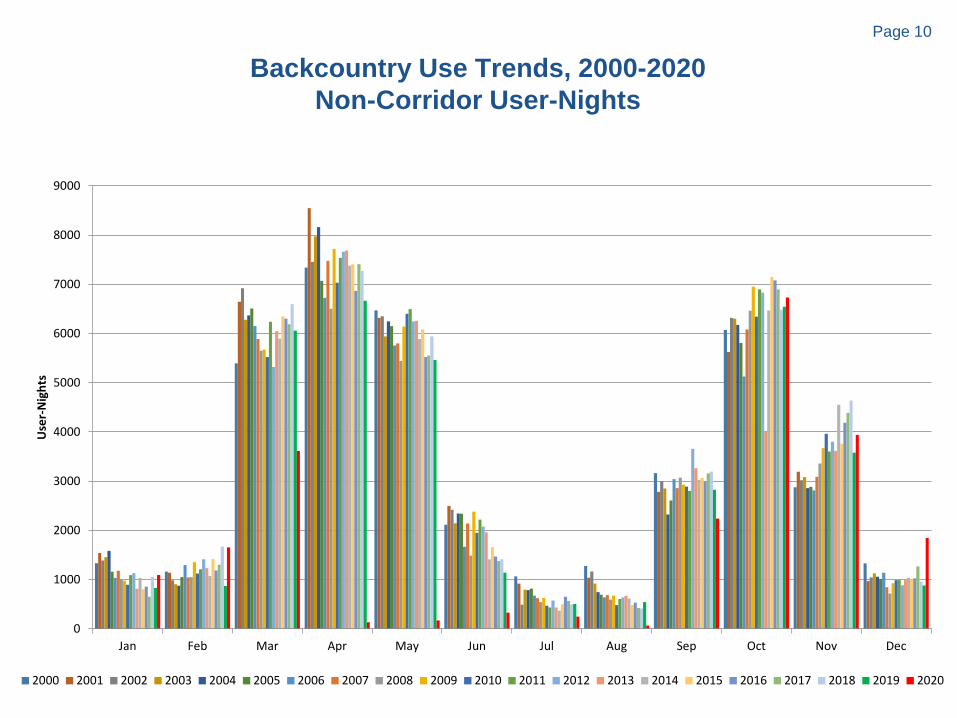
Page 10
Backcountry Use Trends, 2000-2020Non-Corridor User-Nights
0
1000
2000
3000
4000
5000
6000
7000
8000
9000
Jan Feb Mar Apr May Jun Jul Aug Sep Oct Nov Dec
Use
r-N
ight
s
2000 2001 2002 2003 2004 2005 2006 2007 2008 2009 2010 2011 2012 2013 2014 2015 2016 2017 2018 2019 2020
Page 11
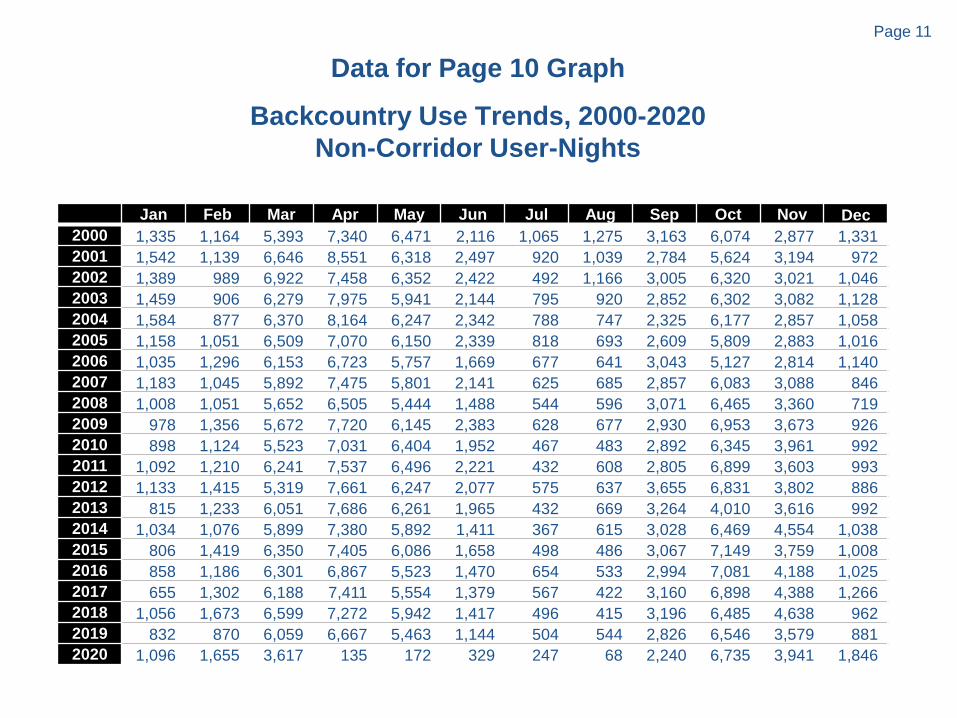
Data for Page 10 Graph
Backcountry Use Trends, 2000-2020Non-Corridor User-Nights
Jan Feb Mar Apr May Jun Jul Aug Sep Oct Nov Dec2000 1,335 1,164 5,393 7,340 6,471 2,116 1,065 1,275 3,163 6,074 2,877 1,3312001 1,542 1,139 6,646 8,551 6,318 2,497 920 1,039 2,784 5,624 3,194 9722002 1,389 989 6,922 7,458 6,352 2,422 492 1,166 3,005 6,320 3,021 1,0462003 1,459 906 6,279 7,975 5,941 2,144 795 920 2,852 6,302 3,082 1,1282004 1,584 877 6,370 8,164 6,247 2,342 788 747 2,325 6,177 2,857 1,0582005 1,158 1,051 6,509 7,070 6,150 2,339 818 693 2,609 5,809 2,883 1,0162006 1,035 1,296 6,153 6,723 5,757 1,669 677 641 3,043 5,127 2,814 1,1402007 1,183 1,045 5,892 7,475 5,801 2,141 625 685 2,857 6,083 3,088 8462008 1,008 1,051 5,652 6,505 5,444 1,488 544 596 3,071 6,465 3,360 7192009 978 1,356 5,672 7,720 6,145 2,383 628 677 2,930 6,953 3,673 9262010 898 1,124 5,523 7,031 6,404 1,952 467 483 2,892 6,345 3,961 9922011 1,092 1,210 6,241 7,537 6,496 2,221 432 608 2,805 6,899 3,603 9932012 1,133 1,415 5,319 7,661 6,247 2,077 575 637 3,655 6,831 3,802 8862013 815 1,233 6,051 7,686 6,261 1,965 432 669 3,264 4,010 3,616 9922014 1,034 1,076 5,899 7,380 5,892 1,411 367 615 3,028 6,469 4,554 1,0382015 806 1,419 6,350 7,405 6,086 1,658 498 486 3,067 7,149 3,759 1,0082016 858 1,186 6,301 6,867 5,523 1,470 654 533 2,994 7,081 4,188 1,0252017 655 1,302 6,188 7,411 5,554 1,379 567 422 3,160 6,898 4,388 1,2662018 1,056 1,673 6,599 7,272 5,942 1,417 496 415 3,196 6,485 4,638 9622019 832 870 6,059 6,667 5,463 1,144 504 544 2,826 6,546 3,579 8812020 1,096 1,655 3,617 135 172 329 247 68 2,240 6,735 3,941 1,846
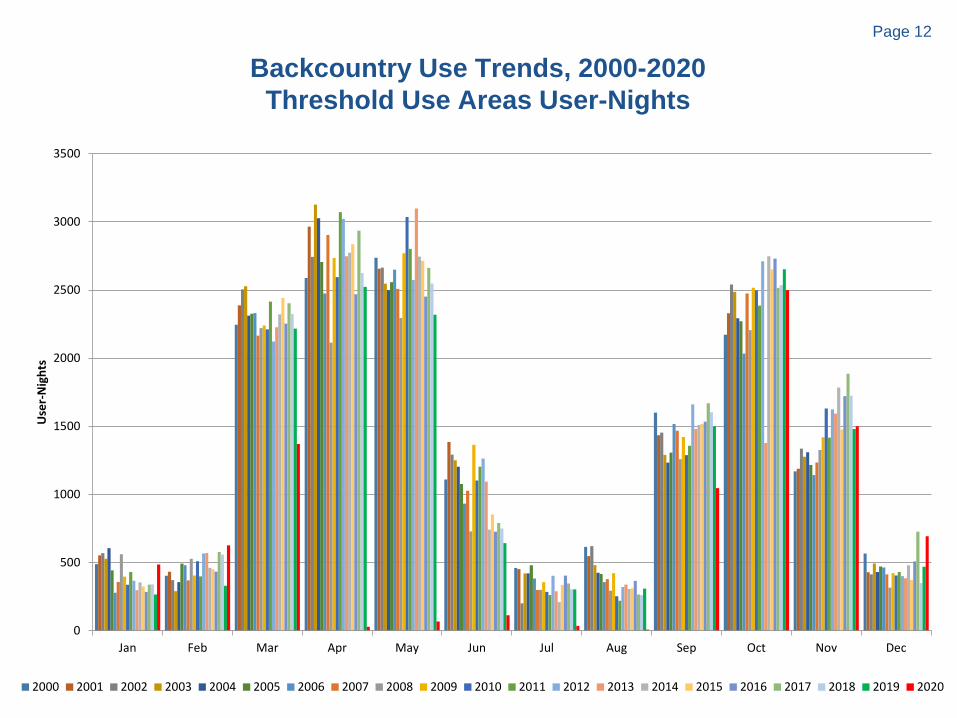
Page 12
Backcountry Use Trends, 2000-2020Threshold Use Areas User-Nights
0
500
1000
1500
2000
2500
3000
3500
Jan Feb Mar Apr May Jun Jul Aug Sep Oct Nov Dec
Use
r-N
ight
s
2000 2001 2002 2003 2004 2005 2006 2007 2008 2009 2010 2011 2012 2013 2014 2015 2016 2017 2018 2019 2020
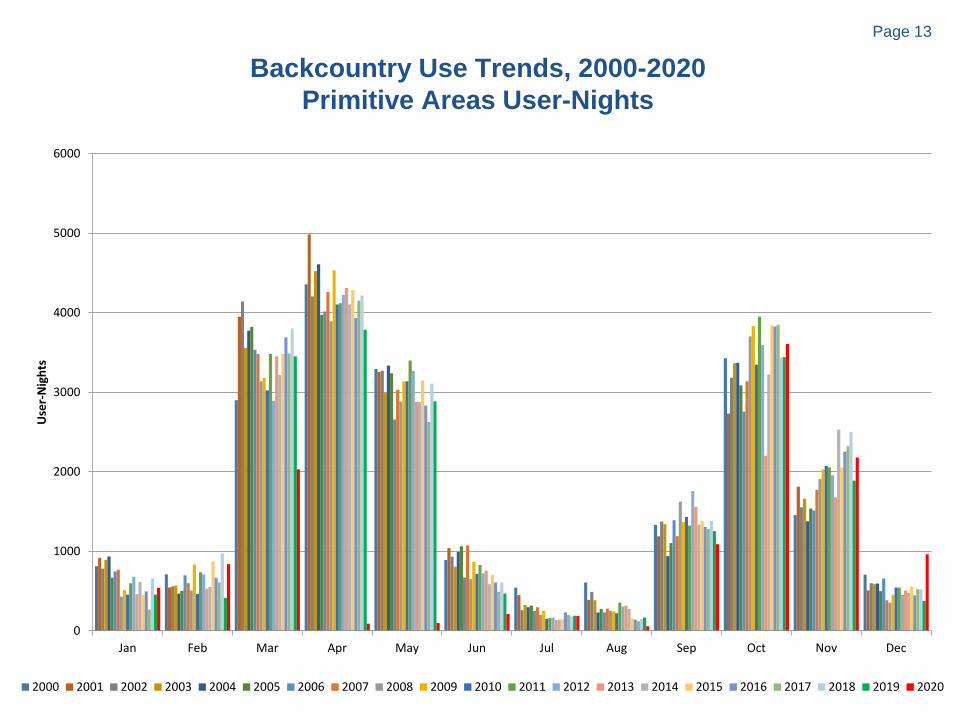
Page 13
Backcountry Use Trends, 2000-2020Primitive Areas User-Nights
0
1000
2000
3000
4000
5000
6000
Jan Feb Mar Apr May Jun Jul Aug Sep Oct Nov Dec
Use
r-N
ight
s
2000 2001 2002 2003 2004 2005 2006 2007 2008 2009 2010 2011 2012 2013 2014 2015 2016 2017 2018 2019 2020
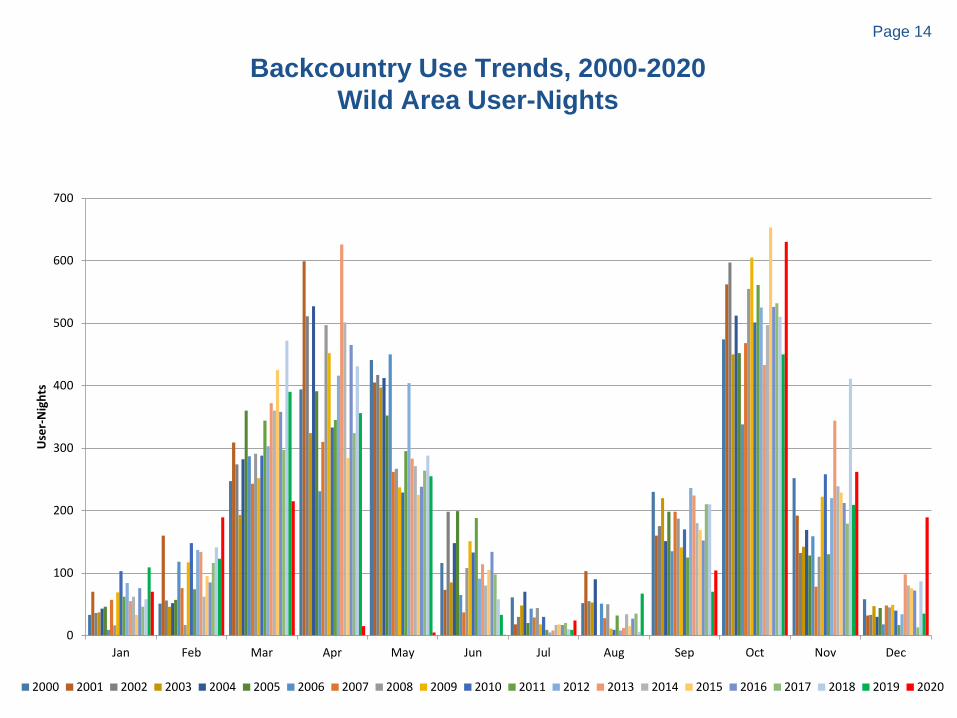
Page 14
Backcountry Use Trends, 2000-2020Wild Area User-Nights
0
100
200
300
400
500
600
700
Jan Feb Mar Apr May Jun Jul Aug Sep Oct Nov Dec
Use
r-N
ight
s
2000 2001 2002 2003 2004 2005 2006 2007 2008 2009 2010 2011 2012 2013 2014 2015 2016 2017 2018 2019 2020
Page 15
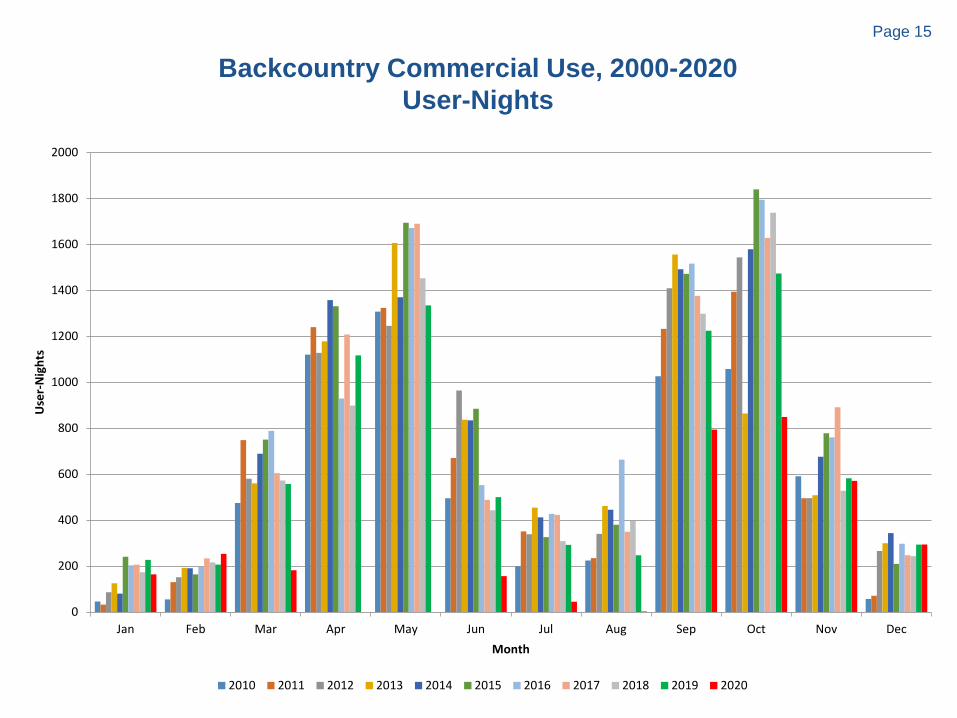
Backcountry Commercial Use, 2000-2020User-Nights
0
200
400
600
800
1000
1200
1400
1600
1800
2000
Jan Feb Mar Apr May Jun Jul Aug Sep Oct Nov Dec
Use
r-N
ight
s
Month
2010 2011 2012 2013 2014 2015 2016 2017 2018 2019 2020
Page 16
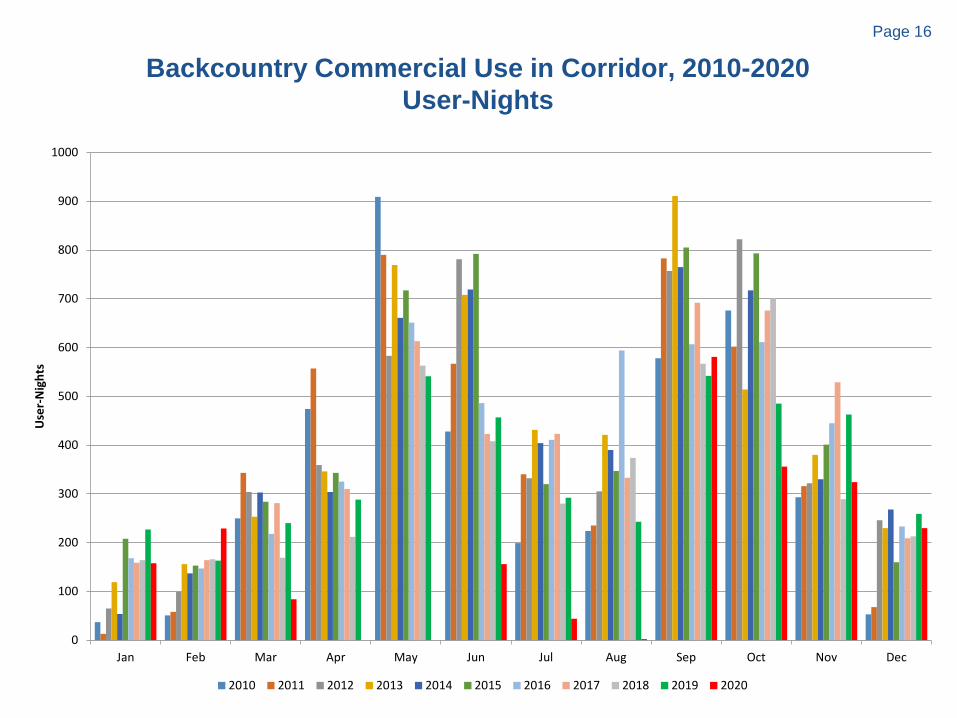
Backcountry Commercial Use in Corridor, 2010-2020User-Nights
0
100
200
300
400
500
600
700
800
900
1000
Jan Feb Mar Apr May Jun Jul Aug Sep Oct Nov Dec
Use
r-N
ight
s
2010 2011 2012 2013 2014 2015 2016 2017 2018 2019 2020
Page 17
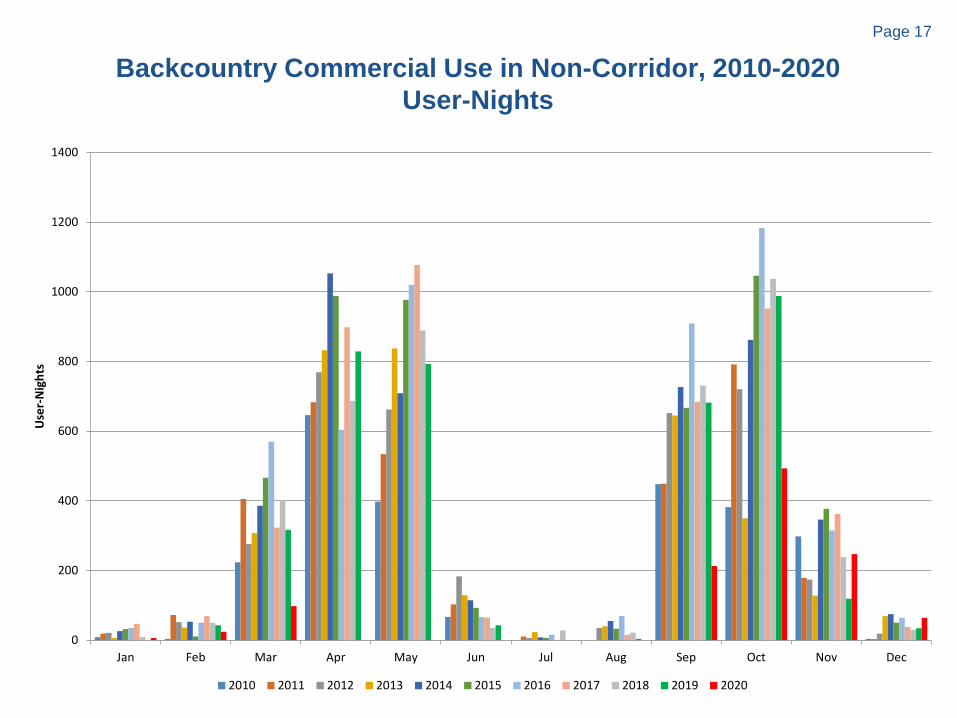
Backcountry Commercial Use in Non-Corridor, 2010-2020User-Nights
0
200
400
600
800
1000
1200
1400
Jan Feb Mar Apr May Jun Jul Aug Sep Oct Nov Dec
Use
r-N
ight
s
2010 2011 2012 2013 2014 2015 2016 2017 2018 2019 2020
Page 18
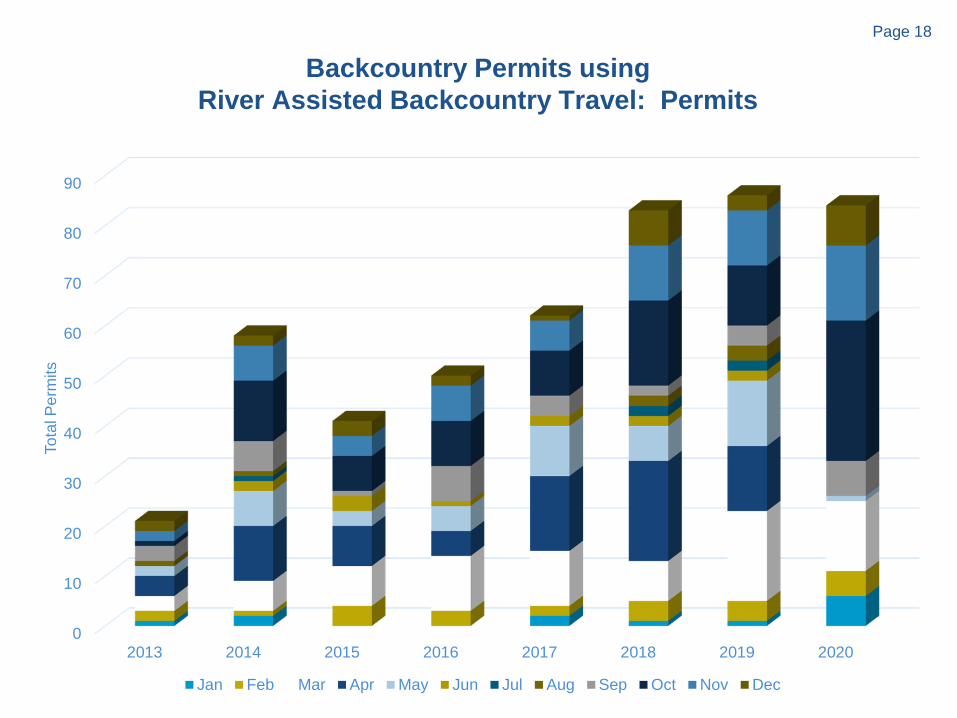
Backcountry Permits using River Assisted Backcountry Travel: Permits
0
10
20
30
40
50
60
70
80
90
2013 2014 2015 2016 2017 2018 2019 2020
Tota
l Per
mits
Jan Feb Mar Apr May Jun Jul Aug Sep Oct Nov Dec
Page 19
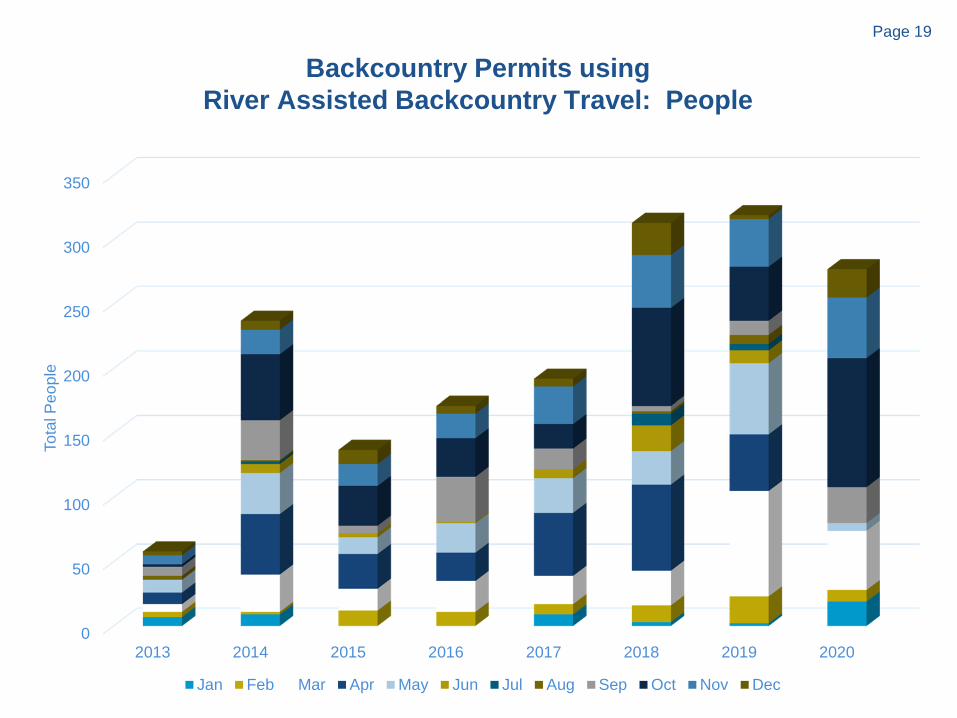
Backcountry Permits using River Assisted Backcountry Travel: People
0
50
100
150
200
250
300
350
2013 2014 2015 2016 2017 2018 2019 2020
Tota
l Peo
ple
Jan Feb Mar Apr May Jun Jul Aug Sep Oct Nov Dec
Page 20
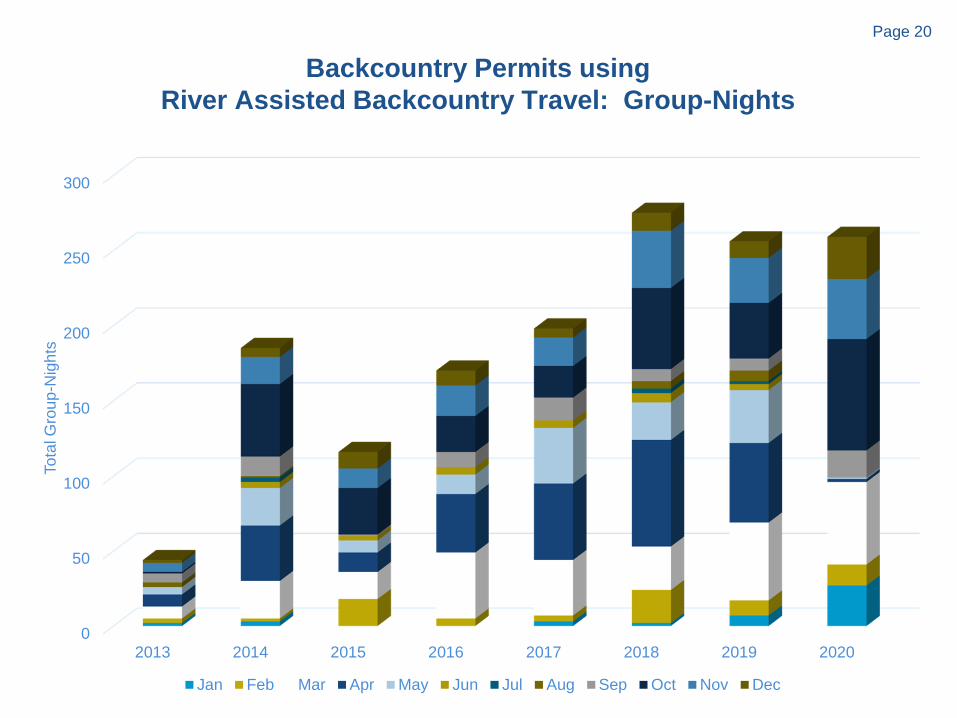
Backcountry Permits using River Assisted Backcountry Travel: Group-Nights
0
50
100
150
200
250
300
2013 2014 2015 2016 2017 2018 2019 2020
Tota
l Gro
up-N
ight
s
Jan Feb Mar Apr May Jun Jul Aug Sep Oct Nov Dec
Page 21
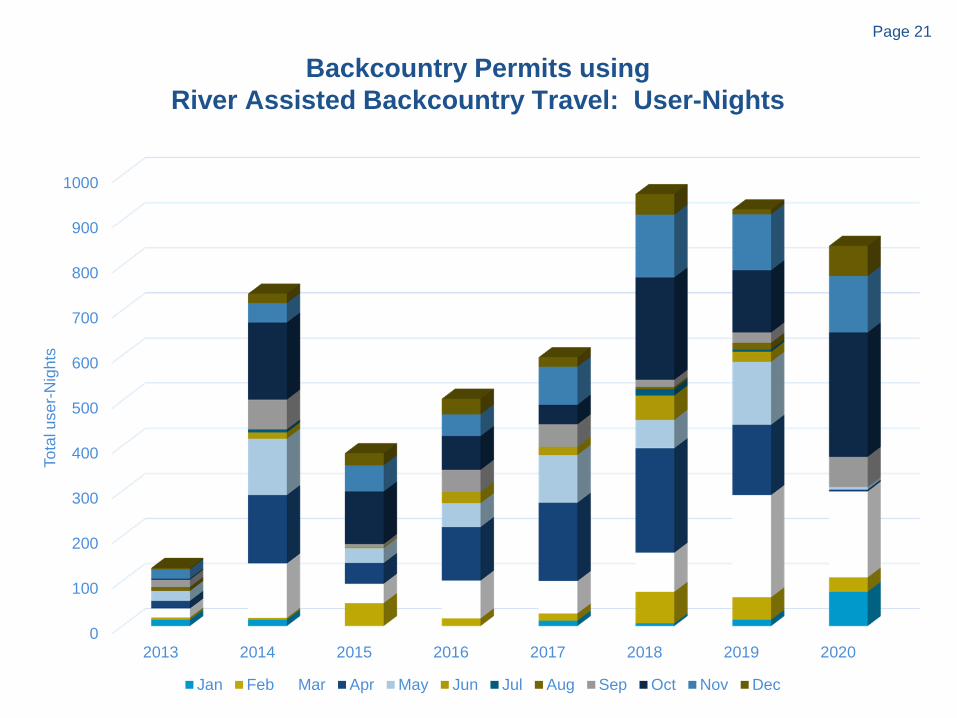
Backcountry Permits using River Assisted Backcountry Travel: User-Nights
0
100
200
300
400
500
600
700
800
900
1000
2013 2014 2015 2016 2017 2018 2019 2020
Tota
l use
r-Nig
hts
Jan Feb Mar Apr May Jun Jul Aug Sep Oct Nov Dec
Page 22
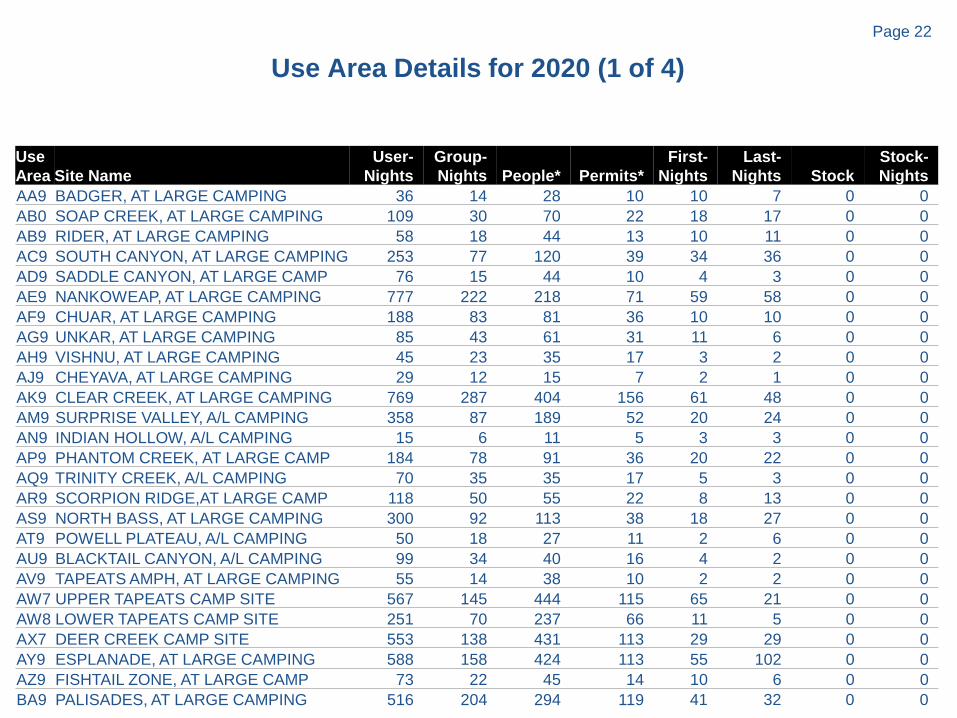
Use Area Details for 2020 (1 of 4)
Use Area Site Name
User-Nights
Group-Nights People* Permits*
First-Nights
Last-Nights Stock
Stock-Nights
AA9 BADGER, AT LARGE CAMPING 36 14 28 10 10 7 0 0AB0 SOAP CREEK, AT LARGE CAMPING 109 30 70 22 18 17 0 0AB9 RIDER, AT LARGE CAMPING 58 18 44 13 10 11 0 0AC9 SOUTH CANYON, AT LARGE CAMPING 253 77 120 39 34 36 0 0AD9 SADDLE CANYON, AT LARGE CAMP 76 15 44 10 4 3 0 0AE9 NANKOWEAP, AT LARGE CAMPING 777 222 218 71 59 58 0 0AF9 CHUAR, AT LARGE CAMPING 188 83 81 36 10 10 0 0AG9 UNKAR, AT LARGE CAMPING 85 43 61 31 11 6 0 0AH9 VISHNU, AT LARGE CAMPING 45 23 35 17 3 2 0 0AJ9 CHEYAVA, AT LARGE CAMPING 29 12 15 7 2 1 0 0AK9 CLEAR CREEK, AT LARGE CAMPING 769 287 404 156 61 48 0 0AM9 SURPRISE VALLEY, A/L CAMPING 358 87 189 52 20 24 0 0AN9 INDIAN HOLLOW, A/L CAMPING 15 6 11 5 3 3 0 0AP9 PHANTOM CREEK, AT LARGE CAMP 184 78 91 36 20 22 0 0AQ9 TRINITY CREEK, A/L CAMPING 70 35 35 17 5 3 0 0AR9 SCORPION RIDGE,AT LARGE CAMP 118 50 55 22 8 13 0 0AS9 NORTH BASS, AT LARGE CAMPING 300 92 113 38 18 27 0 0AT9 POWELL PLATEAU, A/L CAMPING 50 18 27 11 2 6 0 0AU9 BLACKTAIL CANYON, A/L CAMPING 99 34 40 16 4 2 0 0AV9 TAPEATS AMPH, AT LARGE CAMPING 55 14 38 10 2 2 0 0AW7 UPPER TAPEATS CAMP SITE 567 145 444 115 65 21 0 0AW8 LOWER TAPEATS CAMP SITE 251 70 237 66 11 5 0 0AX7 DEER CREEK CAMP SITE 553 138 431 113 29 29 0 0AY9 ESPLANADE, AT LARGE CAMPING 588 158 424 113 55 102 0 0AZ9 FISHTAIL ZONE, AT LARGE CAMP 73 22 45 14 10 6 0 0BA9 PALISADES, AT LARGE CAMPING 516 204 294 119 41 32 0 0
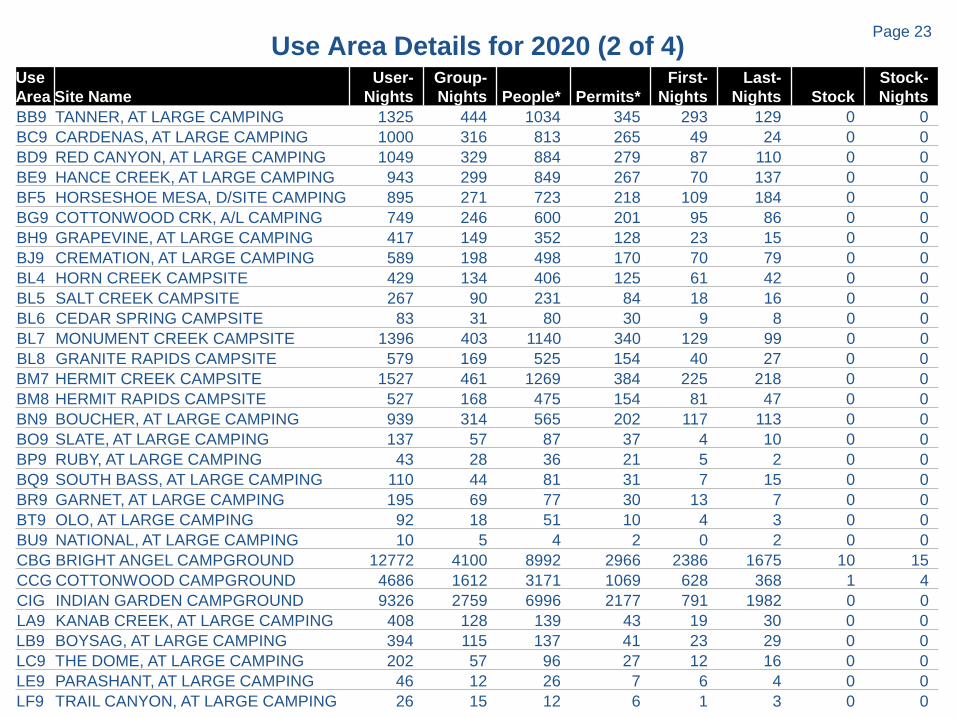
Page 23Use Area Details for 2020 (2 of 4)Use Area Site Name
User-Nights
Group-Nights People* Permits*
First-Nights
Last-Nights Stock
Stock-Nights
BB9 TANNER, AT LARGE CAMPING 1325 444 1034 345 293 129 0 0BC9 CARDENAS, AT LARGE CAMPING 1000 316 813 265 49 24 0 0BD9 RED CANYON, AT LARGE CAMPING 1049 329 884 279 87 110 0 0BE9 HANCE CREEK, AT LARGE CAMPING 943 299 849 267 70 137 0 0BF5 HORSESHOE MESA, D/SITE CAMPING 895 271 723 218 109 184 0 0BG9 COTTONWOOD CRK, A/L CAMPING 749 246 600 201 95 86 0 0BH9 GRAPEVINE, AT LARGE CAMPING 417 149 352 128 23 15 0 0BJ9 CREMATION, AT LARGE CAMPING 589 198 498 170 70 79 0 0BL4 HORN CREEK CAMPSITE 429 134 406 125 61 42 0 0BL5 SALT CREEK CAMPSITE 267 90 231 84 18 16 0 0BL6 CEDAR SPRING CAMPSITE 83 31 80 30 9 8 0 0BL7 MONUMENT CREEK CAMPSITE 1396 403 1140 340 129 99 0 0BL8 GRANITE RAPIDS CAMPSITE 579 169 525 154 40 27 0 0BM7 HERMIT CREEK CAMPSITE 1527 461 1269 384 225 218 0 0BM8 HERMIT RAPIDS CAMPSITE 527 168 475 154 81 47 0 0BN9 BOUCHER, AT LARGE CAMPING 939 314 565 202 117 113 0 0BO9 SLATE, AT LARGE CAMPING 137 57 87 37 4 10 0 0BP9 RUBY, AT LARGE CAMPING 43 28 36 21 5 2 0 0BQ9 SOUTH BASS, AT LARGE CAMPING 110 44 81 31 7 15 0 0BR9 GARNET, AT LARGE CAMPING 195 69 77 30 13 7 0 0BT9 OLO, AT LARGE CAMPING 92 18 51 10 4 3 0 0BU9 NATIONAL, AT LARGE CAMPING 10 5 4 2 0 2 0 0CBG BRIGHT ANGEL CAMPGROUND 12772 4100 8992 2966 2386 1675 10 15CCG COTTONWOOD CAMPGROUND 4686 1612 3171 1069 628 368 1 4CIG INDIAN GARDEN CAMPGROUND 9326 2759 6996 2177 791 1982 0 0LA9 KANAB CREEK, AT LARGE CAMPING 408 128 139 43 19 30 0 0LB9 BOYSAG, AT LARGE CAMPING 394 115 137 41 23 29 0 0LC9 THE DOME, AT LARGE CAMPING 202 57 96 27 12 16 0 0LE9 PARASHANT, AT LARGE CAMPING 46 12 26 7 6 4 0 0LF9 TRAIL CANYON, AT LARGE CAMPING 26 15 12 6 1 3 0 0
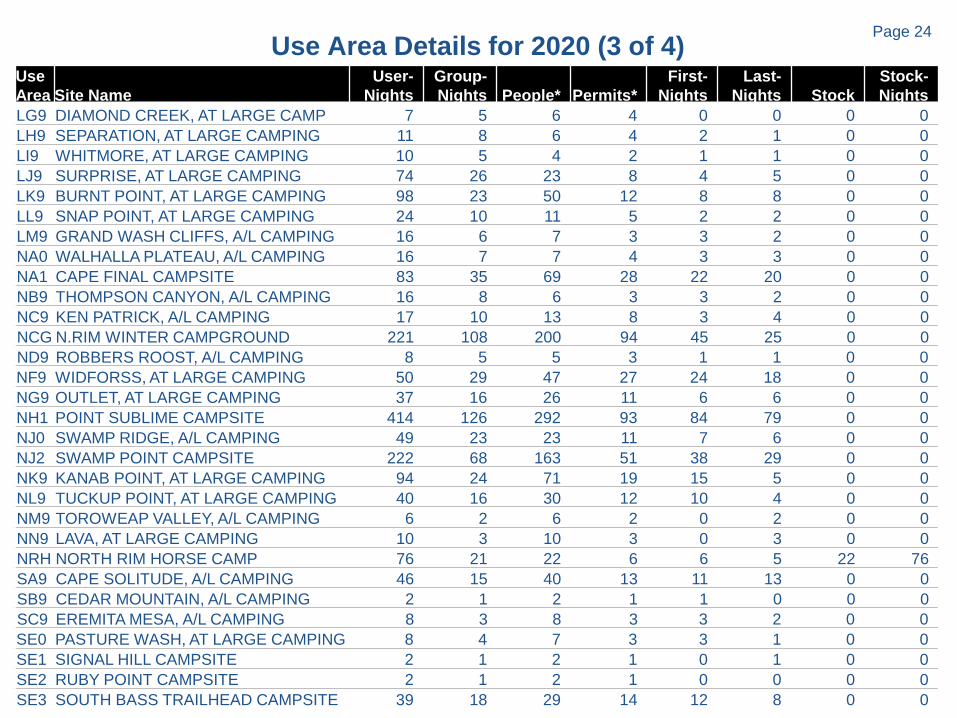
Page 24Use Area Details for 2020 (3 of 4)Use Area Site Name
User-Nights
Group-Nights People* Permits*
First-Nights
Last-Nights Stock
Stock-Nights
LG9 DIAMOND CREEK, AT LARGE CAMP 7 5 6 4 0 0 0 0LH9 SEPARATION, AT LARGE CAMPING 11 8 6 4 2 1 0 0LI9 WHITMORE, AT LARGE CAMPING 10 5 4 2 1 1 0 0LJ9 SURPRISE, AT LARGE CAMPING 74 26 23 8 4 5 0 0LK9 BURNT POINT, AT LARGE CAMPING 98 23 50 12 8 8 0 0LL9 SNAP POINT, AT LARGE CAMPING 24 10 11 5 2 2 0 0LM9 GRAND WASH CLIFFS, A/L CAMPING 16 6 7 3 3 2 0 0NA0 WALHALLA PLATEAU, A/L CAMPING 16 7 7 4 3 3 0 0NA1 CAPE FINAL CAMPSITE 83 35 69 28 22 20 0 0NB9 THOMPSON CANYON, A/L CAMPING 16 8 6 3 3 2 0 0NC9 KEN PATRICK, A/L CAMPING 17 10 13 8 3 4 0 0NCG N.RIM WINTER CAMPGROUND 221 108 200 94 45 25 0 0ND9 ROBBERS ROOST, A/L CAMPING 8 5 5 3 1 1 0 0NF9 WIDFORSS, AT LARGE CAMPING 50 29 47 27 24 18 0 0NG9 OUTLET, AT LARGE CAMPING 37 16 26 11 6 6 0 0NH1 POINT SUBLIME CAMPSITE 414 126 292 93 84 79 0 0NJ0 SWAMP RIDGE, A/L CAMPING 49 23 23 11 7 6 0 0NJ2 SWAMP POINT CAMPSITE 222 68 163 51 38 29 0 0NK9 KANAB POINT, AT LARGE CAMPING 94 24 71 19 15 5 0 0NL9 TUCKUP POINT, AT LARGE CAMPING 40 16 30 12 10 4 0 0NM9 TOROWEAP VALLEY, A/L CAMPING 6 2 6 2 0 2 0 0NN9 LAVA, AT LARGE CAMPING 10 3 10 3 0 3 0 0NRH NORTH RIM HORSE CAMP 76 21 22 6 6 5 22 76SA9 CAPE SOLITUDE, A/L CAMPING 46 15 40 13 11 13 0 0SB9 CEDAR MOUNTAIN, A/L CAMPING 2 1 2 1 1 0 0 0SC9 EREMITA MESA, A/L CAMPING 8 3 8 3 3 2 0 0SE0 PASTURE WASH, AT LARGE CAMPING 8 4 7 3 3 1 0 0SE1 SIGNAL HILL CAMPSITE 2 1 2 1 0 1 0 0SE2 RUBY POINT CAMPSITE 2 1 2 1 0 0 0 0SE3 SOUTH BASS TRAILHEAD CAMPSITE 39 18 29 14 12 8 0 0
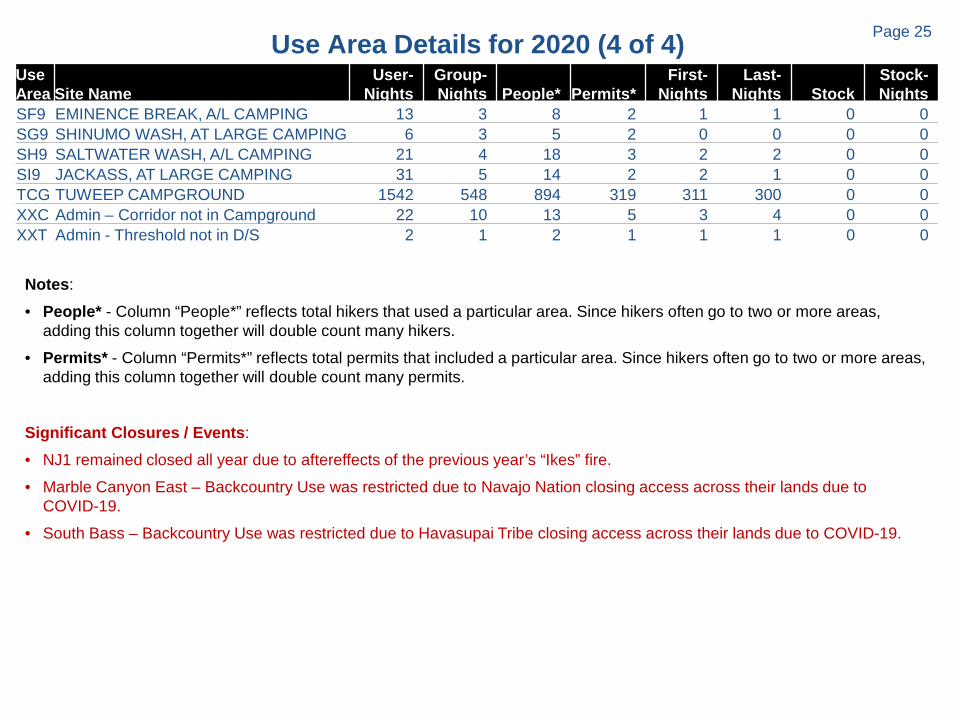
Page 25Use Area Details for 2020 (4 of 4)Use Area Site Name
User-Nights
Group-Nights People* Permits*
First-Nights
Last-Nights Stock
Stock-Nights
SF9 EMINENCE BREAK, A/L CAMPING 13 3 8 2 1 1 0 0SG9 SHINUMO WASH, AT LARGE CAMPING 6 3 5 2 0 0 0 0SH9 SALTWATER WASH, A/L CAMPING 21 4 18 3 2 2 0 0SI9 JACKASS, AT LARGE CAMPING 31 5 14 2 2 1 0 0TCG TUWEEP CAMPGROUND 1542 548 894 319 311 300 0 0XXC Admin – Corridor not in Campground 22 10 13 5 3 4 0 0XXT Admin - Threshold not in D/S 2 1 2 1 1 1 0 0
Notes:• People* - Column “People*” reflects total hikers that used a particular area. Since hikers often go to two or more areas,
adding this column together will double count many hikers.• Permits* - Column “Permits*” reflects total permits that included a particular area. Since hikers often go to two or more areas,
adding this column together will double count many permits.
Significant Closures / Events:• NJ1 remained closed all year due to aftereffects of the previous year’s “Ikes” fire.• Marble Canyon East – Backcountry Use was restricted due to Navajo Nation closing access across their lands due to
COVID-19.• South Bass – Backcountry Use was restricted due to Havasupai Tribe closing access across their lands due to COVID-19.
Page 26
Backcountry / Backpacking
Applicant and Permittee Information
Page 27
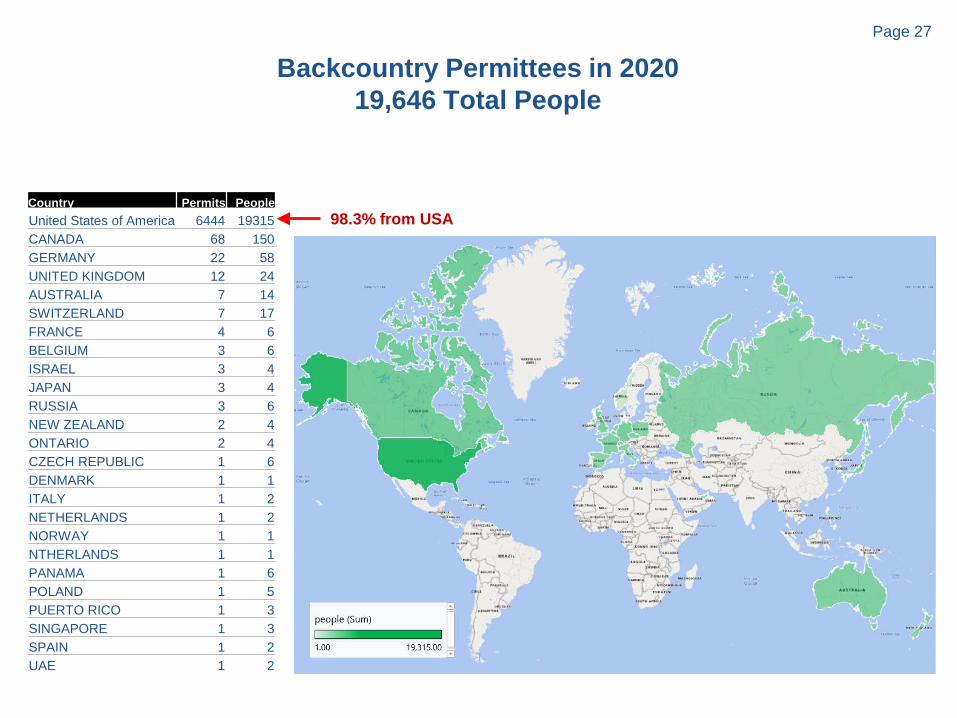
Backcountry Permittees in 202019,646 Total People
Country Permits PeopleUnited States of America 6444 19315CANADA 68 150GERMANY 22 58UNITED KINGDOM 12 24AUSTRALIA 7 14SWITZERLAND 7 17FRANCE 4 6BELGIUM 3 6ISRAEL 3 4JAPAN 3 4RUSSIA 3 6NEW ZEALAND 2 4ONTARIO 2 4CZECH REPUBLIC 1 6DENMARK 1 1ITALY 1 2NETHERLANDS 1 2NORWAY 1 1NTHERLANDS 1 1PANAMA 1 6POLAND 1 5PUERTO RICO 1 3SINGAPORE 1 3SPAIN 1 2UAE 1 2
98.3% from USA
Page 28
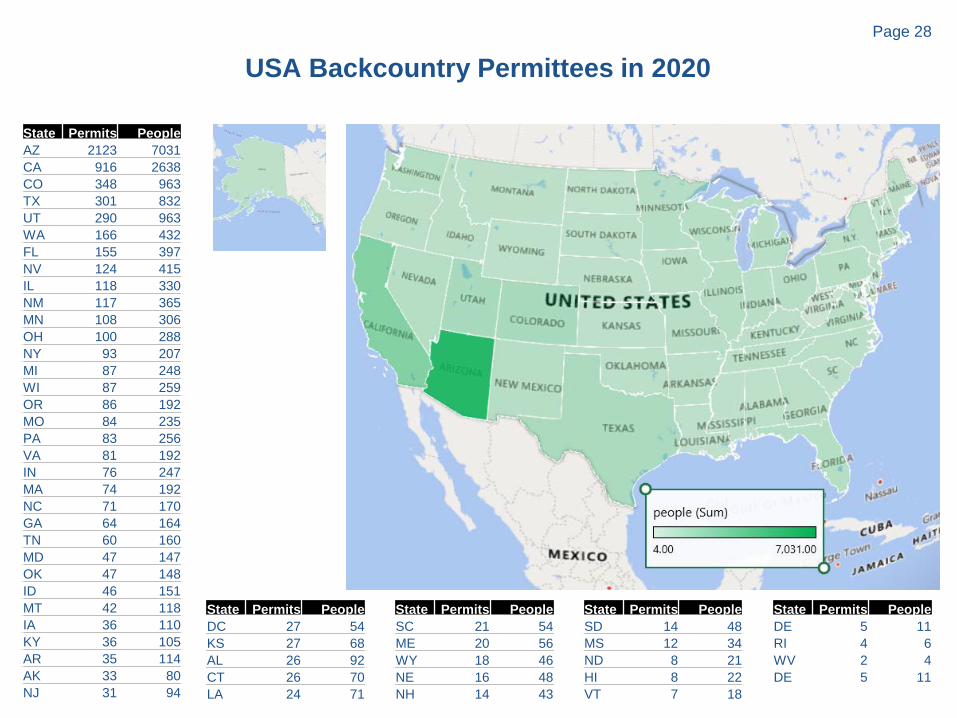
USA Backcountry Permittees in 2020
State Permits PeopleAZ 2123 7031CA 916 2638CO 348 963TX 301 832UT 290 963WA 166 432FL 155 397NV 124 415IL 118 330NM 117 365MN 108 306OH 100 288NY 93 207MI 87 248WI 87 259OR 86 192MO 84 235PA 83 256VA 81 192IN 76 247MA 74 192NC 71 170GA 64 164TN 60 160MD 47 147OK 47 148ID 46 151MT 42 118IA 36 110KY 36 105AR 35 114AK 33 80NJ 31 94
State Permits PeopleDC 27 54KS 27 68AL 26 92CT 26 70LA 24 71
State Permits PeopleSC 21 54ME 20 56WY 18 46NE 16 48NH 14 43
State Permits PeopleSD 14 48MS 12 34ND 8 21HI 8 22VT 7 18
State Permits PeopleDE 5 11RI 4 6WV 2 4DE 5 11
Page 29
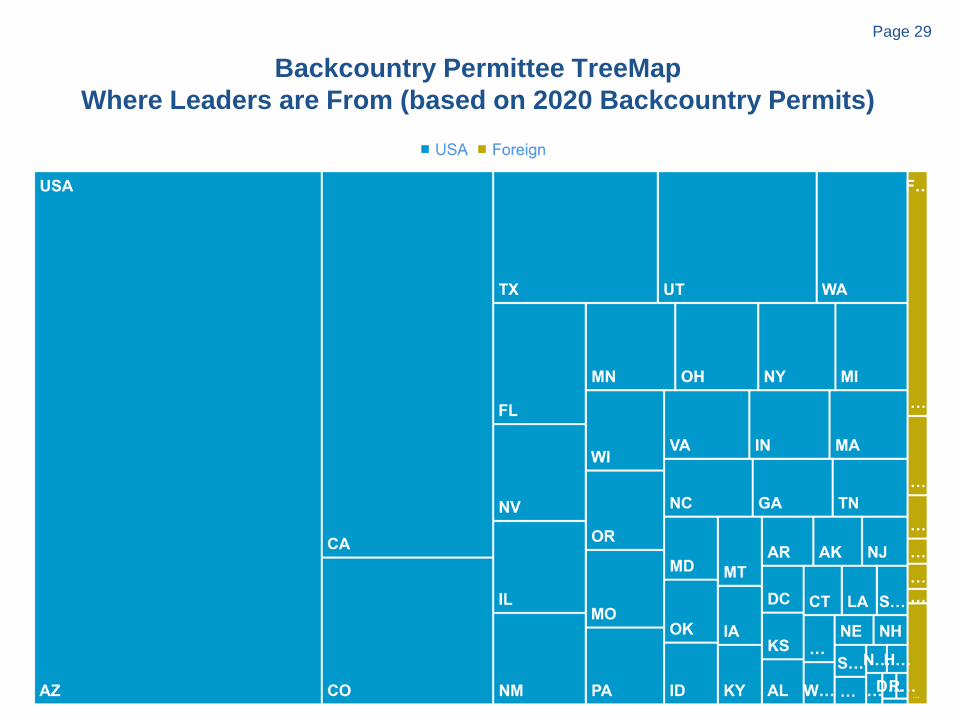
Backcountry Permittee TreeMapWhere Leaders are From (based on 2020 Backcountry Permits)
Page 30
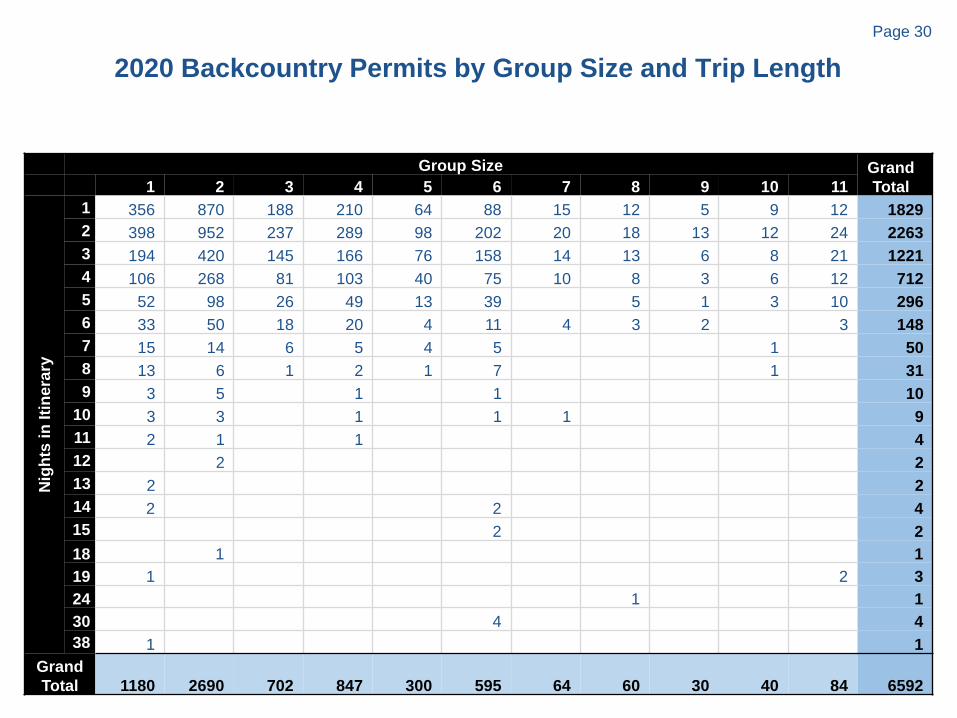
2020 Backcountry Permits by Group Size and Trip Length
Group Size Grand Total1 2 3 4 5 6 7 8 9 10 11
Nig
hts
in It
iner
ary
1 356 870 188 210 64 88 15 12 5 9 12 18292 398 952 237 289 98 202 20 18 13 12 24 22633 194 420 145 166 76 158 14 13 6 8 21 12214 106 268 81 103 40 75 10 8 3 6 12 7125 52 98 26 49 13 39 5 1 3 10 2966 33 50 18 20 4 11 4 3 2 3 1487 15 14 6 5 4 5 1 508 13 6 1 2 1 7 1 319 3 5 1 1 10
10 3 3 1 1 1 911 2 1 1 412 2 213 2 214 2 2 415 2 218 1 119 1 2 324 1 130 4 438 1 1
Grand Total 1180 2690 702 847 300 595 64 60 30 40 84 6592
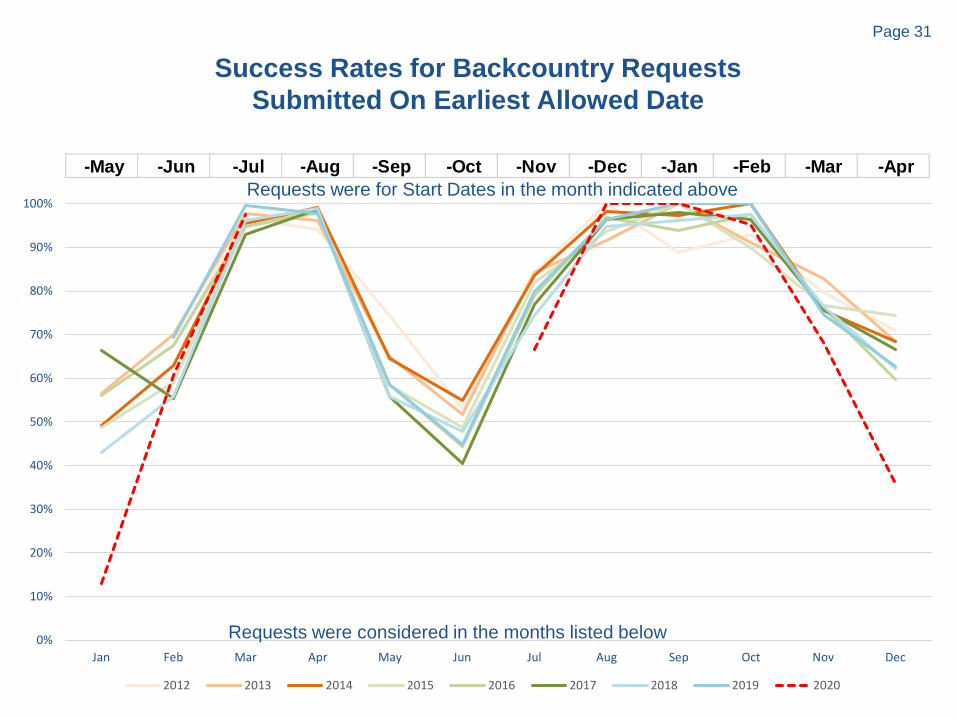
Page 31
Success Rates for Backcountry RequestsSubmitted On Earliest Allowed Date
0%
10%
20%
30%
40%
50%
60%
70%
80%
90%
100%
Jan Feb Mar Apr May Jun Jul Aug Sep Oct Nov Dec
2012 2013 2014 2015 2016 2017 2018 2019 2020
-May -Jun -Jul -Aug -Sep -Oct -Nov -Dec -Jan -Feb -Mar -Apr
Requests were considered in the months listed below
Requests were for Start Dates in the month indicated above
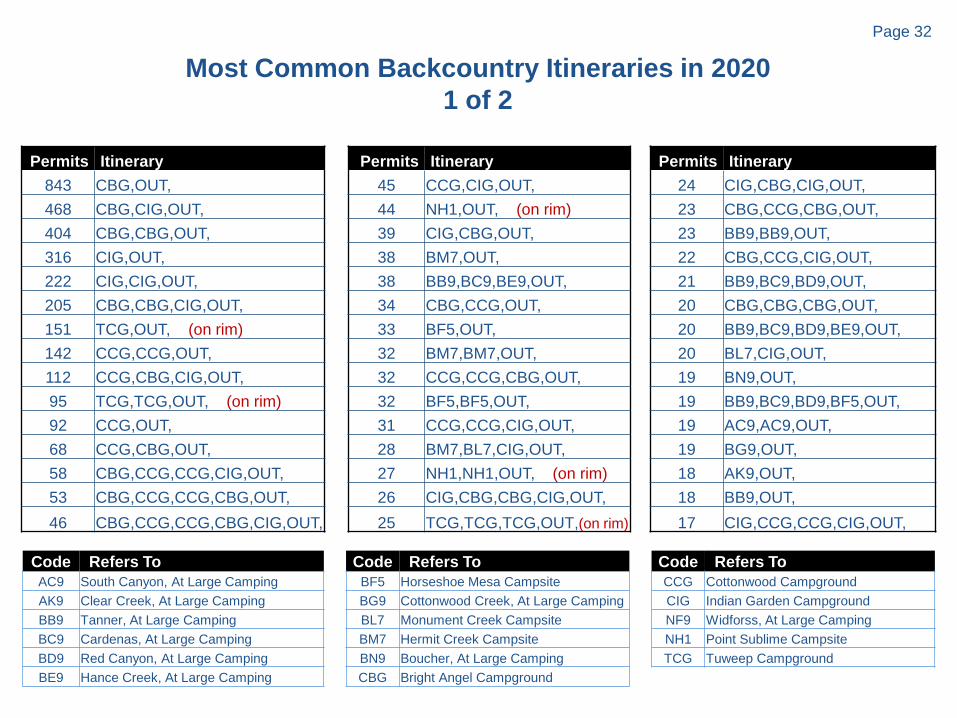
Page 32
Most Common Backcountry Itineraries in 20201 of 2
Permits Itinerary Permits Itinerary Permits Itinerary843 CBG,OUT, 45 CCG,CIG,OUT, 24 CIG,CBG,CIG,OUT,468 CBG,CIG,OUT, 44 NH1,OUT, (on rim) 23 CBG,CCG,CBG,OUT,404 CBG,CBG,OUT, 39 CIG,CBG,OUT, 23 BB9,BB9,OUT,316 CIG,OUT, 38 BM7,OUT, 22 CBG,CCG,CIG,OUT,222 CIG,CIG,OUT, 38 BB9,BC9,BE9,OUT, 21 BB9,BC9,BD9,OUT,205 CBG,CBG,CIG,OUT, 34 CBG,CCG,OUT, 20 CBG,CBG,CBG,OUT,151 TCG,OUT, (on rim) 33 BF5,OUT, 20 BB9,BC9,BD9,BE9,OUT,142 CCG,CCG,OUT, 32 BM7,BM7,OUT, 20 BL7,CIG,OUT,112 CCG,CBG,CIG,OUT, 32 CCG,CCG,CBG,OUT, 19 BN9,OUT,95 TCG,TCG,OUT, (on rim) 32 BF5,BF5,OUT, 19 BB9,BC9,BD9,BF5,OUT,92 CCG,OUT, 31 CCG,CCG,CIG,OUT, 19 AC9,AC9,OUT,68 CCG,CBG,OUT, 28 BM7,BL7,CIG,OUT, 19 BG9,OUT,58 CBG,CCG,CCG,CIG,OUT, 27 NH1,NH1,OUT, (on rim) 18 AK9,OUT,53 CBG,CCG,CCG,CBG,OUT, 26 CIG,CBG,CBG,CIG,OUT, 18 BB9,OUT,46 CBG,CCG,CCG,CBG,CIG,OUT, 25 TCG,TCG,TCG,OUT,(on rim) 17 CIG,CCG,CCG,CIG,OUT,
Code Refers ToAC9 South Canyon, At Large CampingAK9 Clear Creek, At Large CampingBB9 Tanner, At Large CampingBC9 Cardenas, At Large CampingBD9 Red Canyon, At Large CampingBE9 Hance Creek, At Large Camping
Code Refers ToBF5 Horseshoe Mesa CampsiteBG9 Cottonwood Creek, At Large CampingBL7 Monument Creek CampsiteBM7 Hermit Creek CampsiteBN9 Boucher, At Large CampingCBG Bright Angel Campground
Code Refers ToCCG Cottonwood CampgroundCIG Indian Garden CampgroundNF9 Widforss, At Large CampingNH1 Point Sublime CampsiteTCG Tuweep Campground
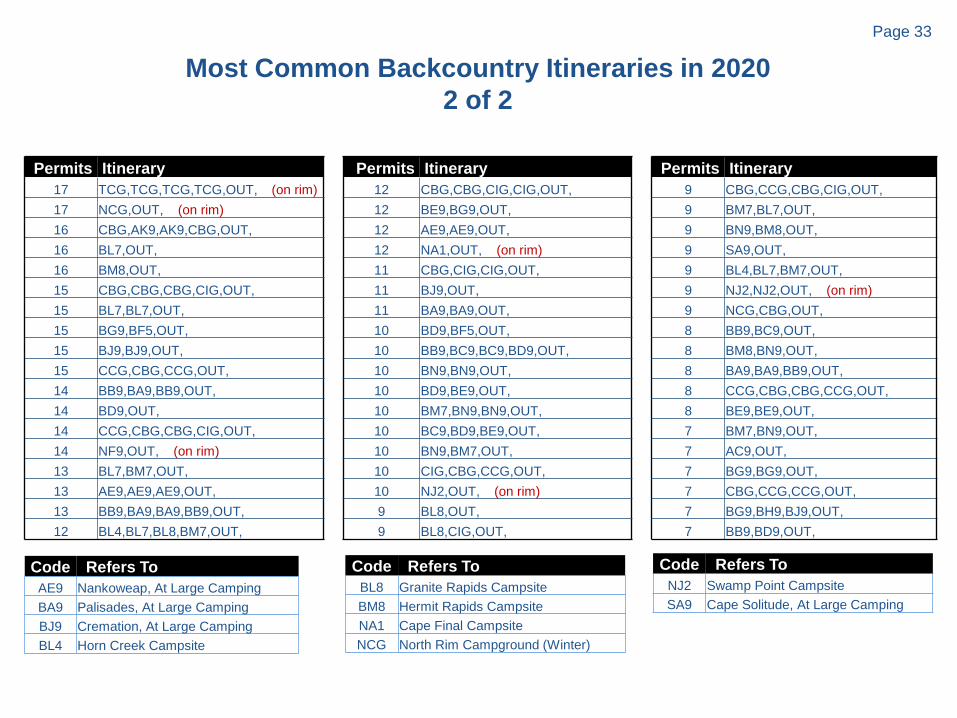
Page 33
Most Common Backcountry Itineraries in 20202 of 2
Permits Itinerary Permits Itinerary Permits Itinerary17 TCG,TCG,TCG,TCG,OUT, (on rim) 12 CBG,CBG,CIG,CIG,OUT, 9 CBG,CCG,CBG,CIG,OUT,17 NCG,OUT, (on rim) 12 BE9,BG9,OUT, 9 BM7,BL7,OUT,16 CBG,AK9,AK9,CBG,OUT, 12 AE9,AE9,OUT, 9 BN9,BM8,OUT,16 BL7,OUT, 12 NA1,OUT, (on rim) 9 SA9,OUT,16 BM8,OUT, 11 CBG,CIG,CIG,OUT, 9 BL4,BL7,BM7,OUT,15 CBG,CBG,CBG,CIG,OUT, 11 BJ9,OUT, 9 NJ2,NJ2,OUT, (on rim)15 BL7,BL7,OUT, 11 BA9,BA9,OUT, 9 NCG,CBG,OUT,15 BG9,BF5,OUT, 10 BD9,BF5,OUT, 8 BB9,BC9,OUT,15 BJ9,BJ9,OUT, 10 BB9,BC9,BC9,BD9,OUT, 8 BM8,BN9,OUT,15 CCG,CBG,CCG,OUT, 10 BN9,BN9,OUT, 8 BA9,BA9,BB9,OUT,14 BB9,BA9,BB9,OUT, 10 BD9,BE9,OUT, 8 CCG,CBG,CBG,CCG,OUT,14 BD9,OUT, 10 BM7,BN9,BN9,OUT, 8 BE9,BE9,OUT,14 CCG,CBG,CBG,CIG,OUT, 10 BC9,BD9,BE9,OUT, 7 BM7,BN9,OUT,14 NF9,OUT, (on rim) 10 BN9,BM7,OUT, 7 AC9,OUT,13 BL7,BM7,OUT, 10 CIG,CBG,CCG,OUT, 7 BG9,BG9,OUT,13 AE9,AE9,AE9,OUT, 10 NJ2,OUT, (on rim) 7 CBG,CCG,CCG,OUT,13 BB9,BA9,BA9,BB9,OUT, 9 BL8,OUT, 7 BG9,BH9,BJ9,OUT,12 BL4,BL7,BL8,BM7,OUT, 9 BL8,CIG,OUT, 7 BB9,BD9,OUT,
Code Refers ToAE9 Nankoweap, At Large CampingBA9 Palisades, At Large CampingBJ9 Cremation, At Large CampingBL4 Horn Creek Campsite
Code Refers ToBL8 Granite Rapids CampsiteBM8 Hermit Rapids CampsiteNA1 Cape Final CampsiteNCG North Rim Campground (Winter)
Code Refers ToNJ2 Swamp Point CampsiteSA9 Cape Solitude, At Large Camping
Page 34
River
Lees Ferry to Diamond Creek UseNoncommercial Trips
Page 35
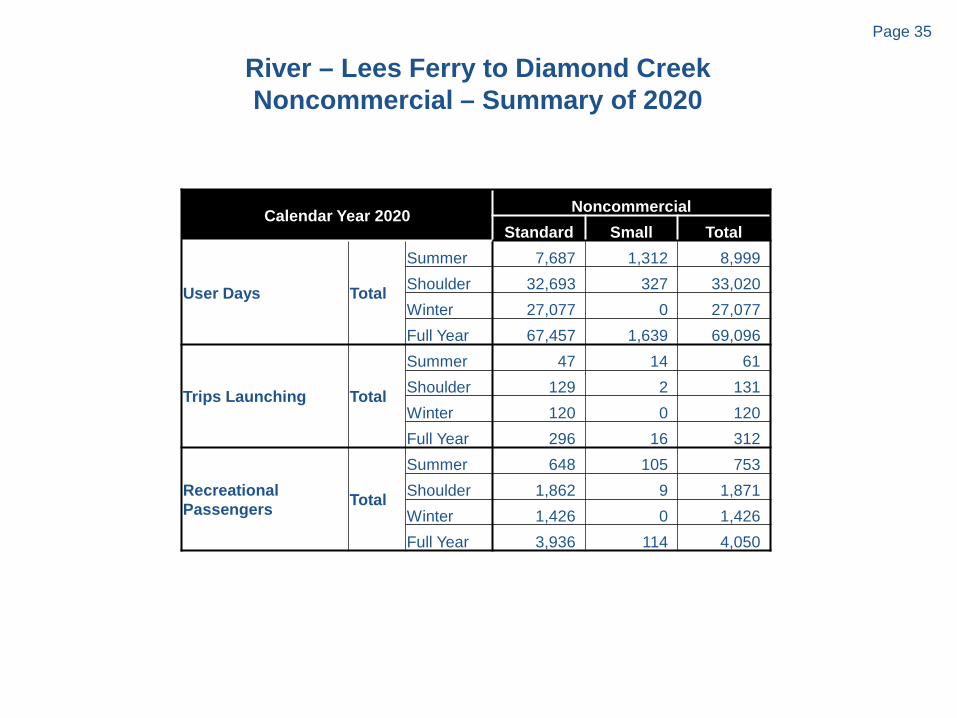
River – Lees Ferry to Diamond CreekNoncommercial – Summary of 2020
Calendar Year 2020 NoncommercialStandard Small Total
User Days Total
Summer 7,687 1,312 8,999Shoulder 32,693 327 33,020Winter 27,077 0 27,077Full Year 67,457 1,639 69,096
Trips Launching Total
Summer 47 14 61Shoulder 129 2 131Winter 120 0 120Full Year 296 16 312
Recreational Passengers Total
Summer 648 105 753Shoulder 1,862 9 1,871Winter 1,426 0 1,426Full Year 3,936 114 4,050
Page 36
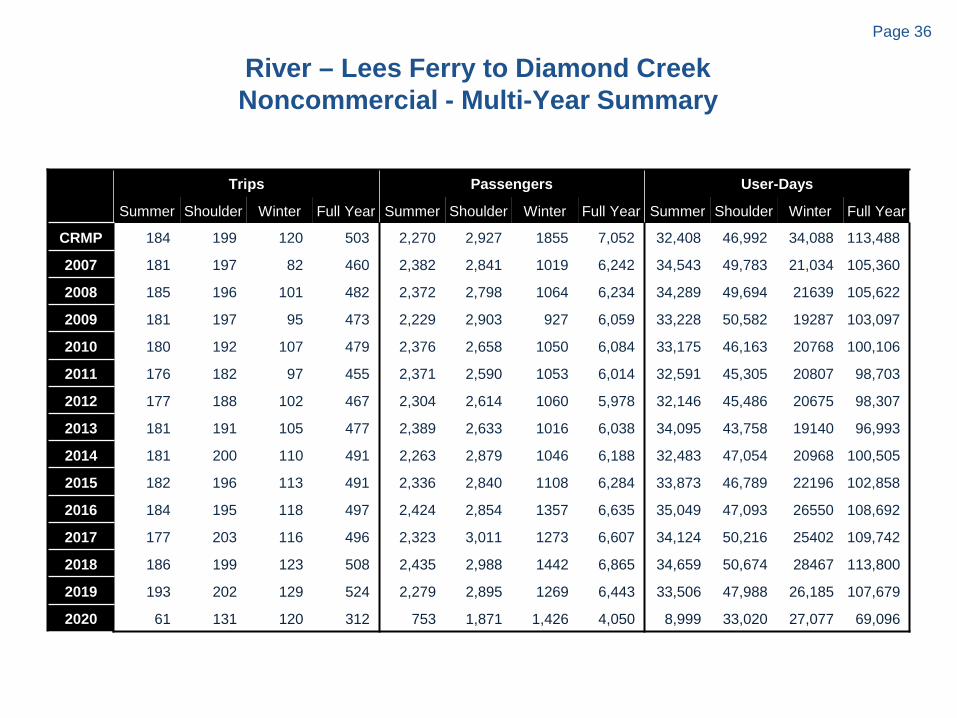
River – Lees Ferry to Diamond CreekNoncommercial - Multi-Year Summary
Trips Passengers User-Days
Summer Shoulder Winter Full Year Summer Shoulder Winter Full Year Summer Shoulder Winter Full Year
CRMP 184 199 120 503 2,270 2,927 1855 7,052 32,408 46,992 34,088 113,488
2007 181 197 82 460 2,382 2,841 1019 6,242 34,543 49,783 21,034 105,360
2008 185 196 101 482 2,372 2,798 1064 6,234 34,289 49,694 21639 105,622
2009 181 197 95 473 2,229 2,903 927 6,059 33,228 50,582 19287 103,097
2010 180 192 107 479 2,376 2,658 1050 6,084 33,175 46,163 20768 100,106
2011 176 182 97 455 2,371 2,590 1053 6,014 32,591 45,305 20807 98,703
2012 177 188 102 467 2,304 2,614 1060 5,978 32,146 45,486 20675 98,307
2013 181 191 105 477 2,389 2,633 1016 6,038 34,095 43,758 19140 96,993
2014 181 200 110 491 2,263 2,879 1046 6,188 32,483 47,054 20968 100,505
2015 182 196 113 491 2,336 2,840 1108 6,284 33,873 46,789 22196 102,858
2016 184 195 118 497 2,424 2,854 1357 6,635 35,049 47,093 26550 108,692
2017 177 203 116 496 2,323 3,011 1273 6,607 34,124 50,216 25402 109,742
2018 186 199 123 508 2,435 2,988 1442 6,865 34,659 50,674 28467 113,800
2019 193 202 129 524 2,279 2,895 1269 6,443 33,506 47,988 26,185 107,679
2020 61 131 120 312 753 1,871 1,426 4,050 8,999 33,020 27,077 69,096
Page 37
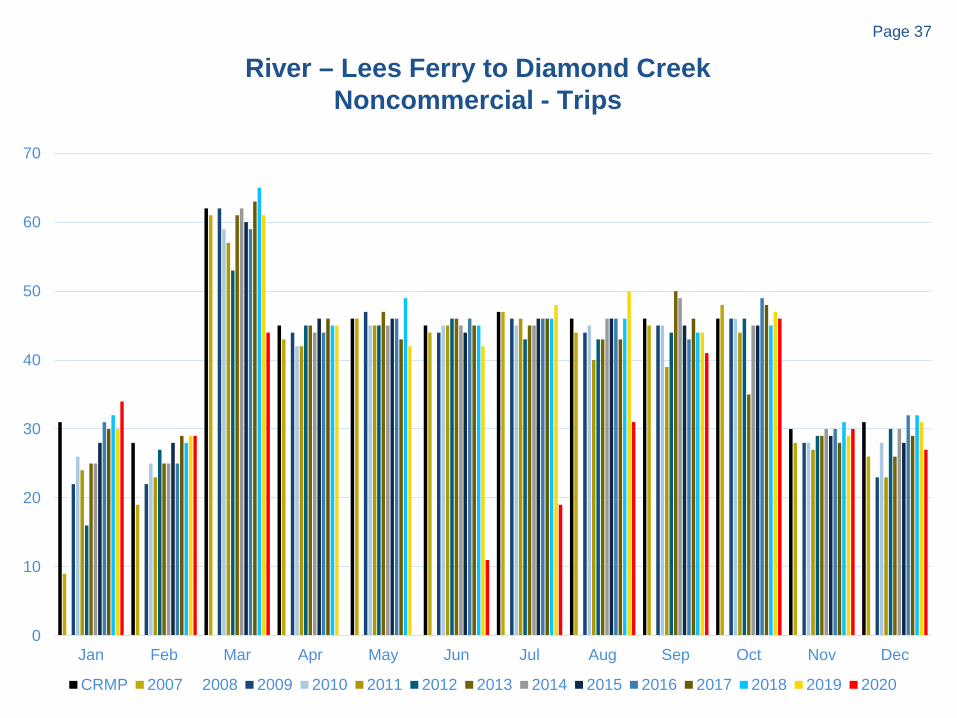
River – Lees Ferry to Diamond CreekNoncommercial - Trips
0
10
20
30
40
50
60
70
Jan Feb Mar Apr May Jun Jul Aug Sep Oct Nov Dec
CRMP 2007 2008 2009 2010 2011 2012 2013 2014 2015 2016 2017 2018 2019 2020
Page 38
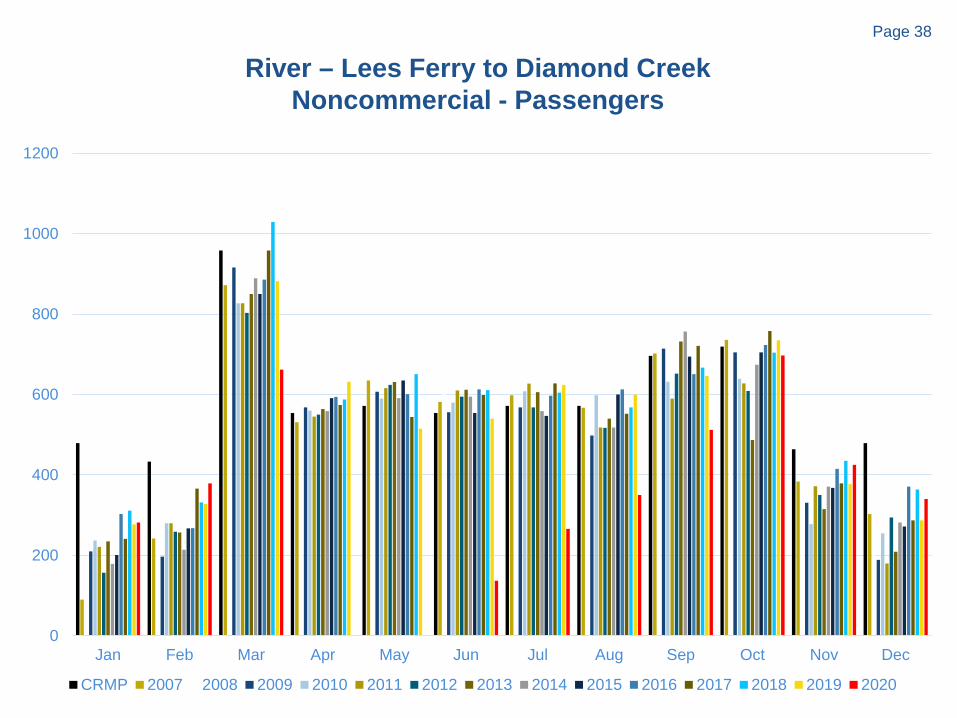
River – Lees Ferry to Diamond CreekNoncommercial - Passengers
0
200
400
600
800
1000
1200
Jan Feb Mar Apr May Jun Jul Aug Sep Oct Nov Dec
CRMP 2007 2008 2009 2010 2011 2012 2013 2014 2015 2016 2017 2018 2019 2020
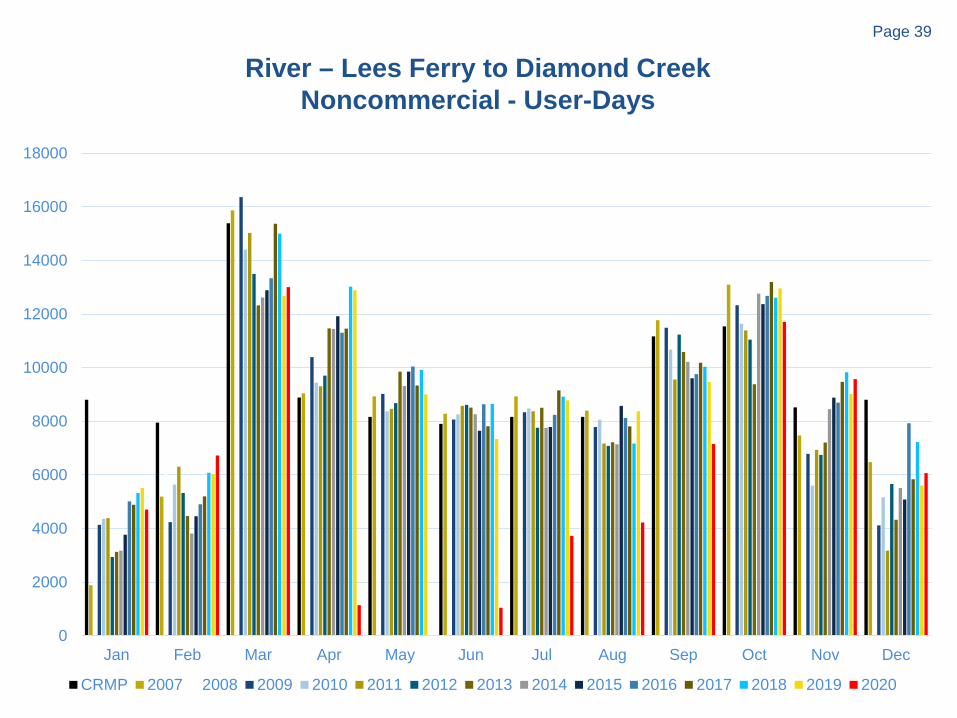
Page 39
River – Lees Ferry to Diamond CreekNoncommercial - User-Days
0
2000
4000
6000
8000
10000
12000
14000
16000
18000
Jan Feb Mar Apr May Jun Jul Aug Sep Oct Nov Dec
CRMP 2007 2008 2009 2010 2011 2012 2013 2014 2015 2016 2017 2018 2019 2020
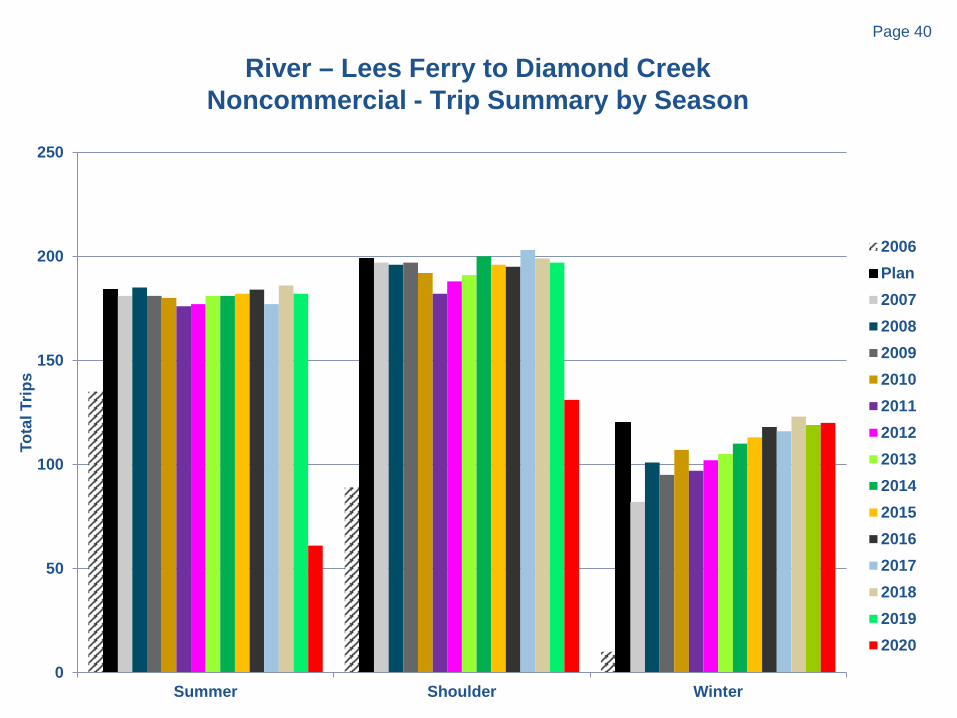
Page 40
River – Lees Ferry to Diamond CreekNoncommercial - Trip Summary by Season
0
50
100
150
200
250
Summer Shoulder Winter
Tota
l Trip
s
2006Plan20072008200920102011201220132014201520162017201820192020
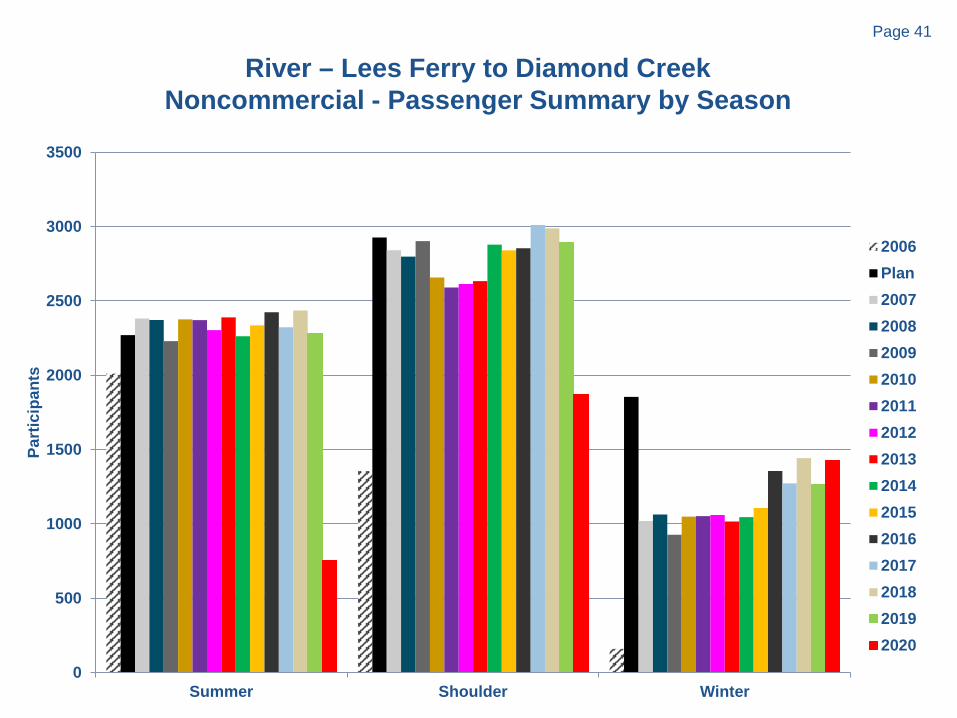
Page 41
River – Lees Ferry to Diamond CreekNoncommercial - Passenger Summary by Season
0
500
1000
1500
2000
2500
3000
3500
Summer Shoulder Winter
Part
icip
ants
2006Plan20072008200920102011201220132014201520162017201820192020
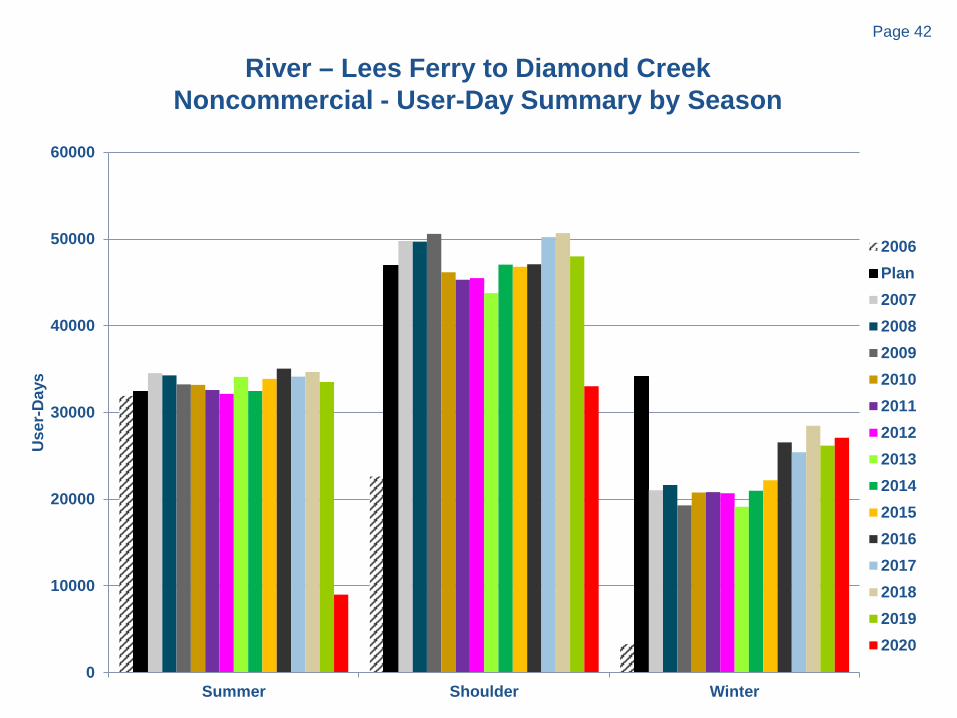
Page 42
River – Lees Ferry to Diamond CreekNoncommercial - User-Day Summary by Season
0
10000
20000
30000
40000
50000
60000
Summer Shoulder Winter
Use
r-D
ays
2006Plan20072008200920102011201220132014201520162017201820192020
Page 43
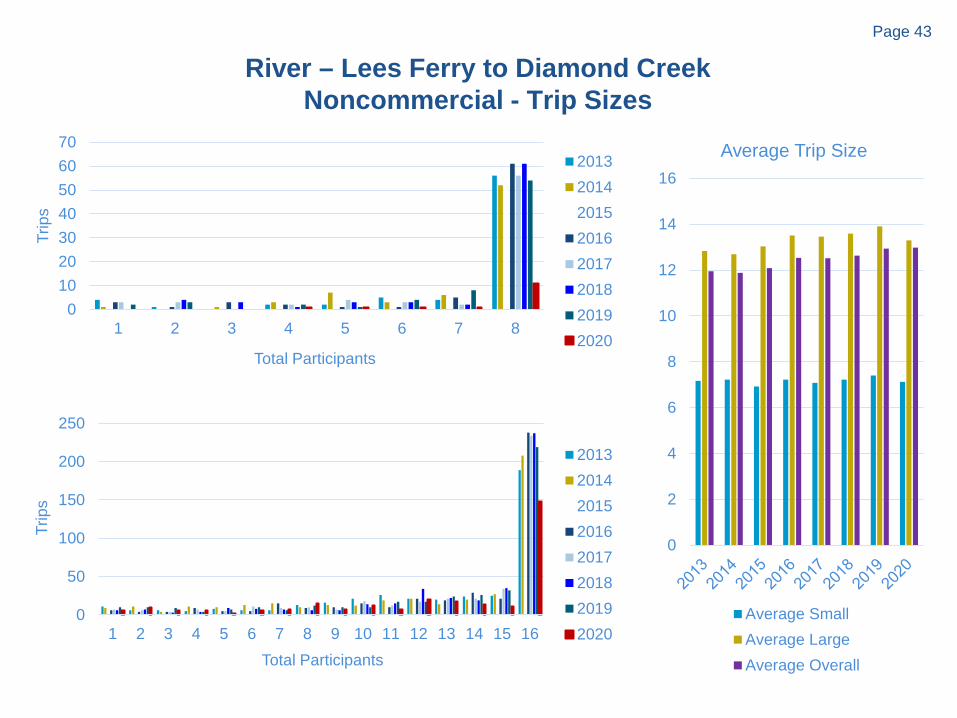
River – Lees Ferry to Diamond CreekNoncommercial - Trip Sizes
010203040506070
1 2 3 4 5 6 7 8
Trip
s
Total Participants
20132014201520162017201820192020
0
50
100
150
200
250
1 2 3 4 5 6 7 8 9 10 11 12 13 14 15 16
Trip
s
Total Participants
20132014201520162017201820192020
0
2
4
6
8
10
12
14
16Average Trip Size
Average SmallAverage LargeAverage Overall
Page 44
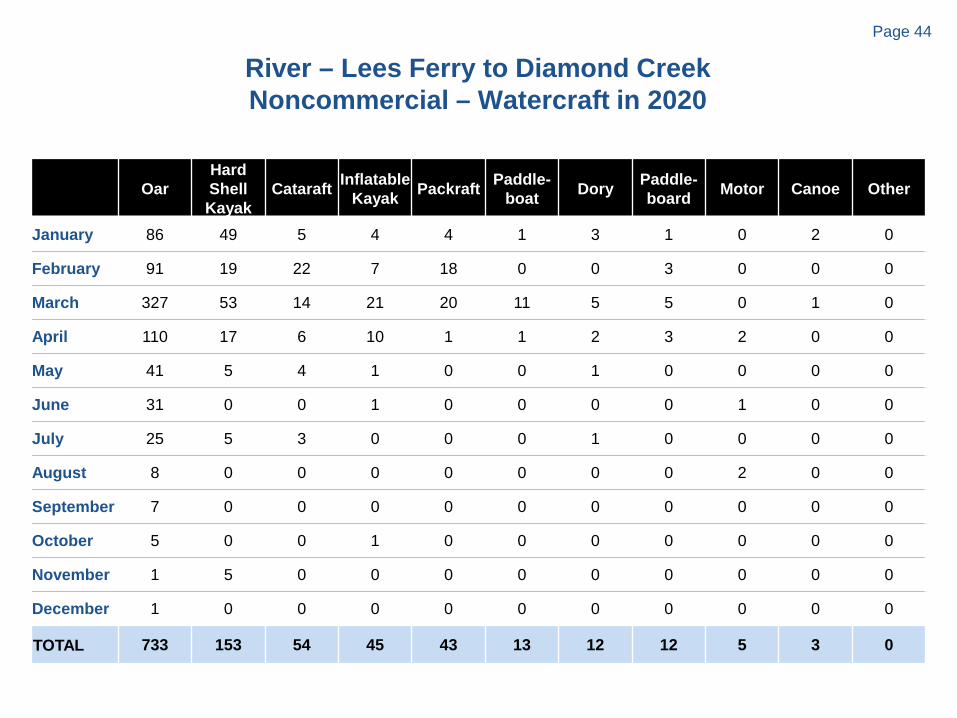
River – Lees Ferry to Diamond CreekNoncommercial – Watercraft in 2020
OarHard Shell Kayak
Cataraft Inflatable Kayak Packraft Paddle-
boat Dory Paddle-board Motor Canoe Other
January 86 49 5 4 4 1 3 1 0 2 0
February 91 19 22 7 18 0 0 3 0 0 0
March 327 53 14 21 20 11 5 5 0 1 0
April 110 17 6 10 1 1 2 3 2 0 0
May 41 5 4 1 0 0 1 0 0 0 0
June 31 0 0 1 0 0 0 0 1 0 0
July 25 5 3 0 0 0 1 0 0 0 0
August 8 0 0 0 0 0 0 0 2 0 0
September 7 0 0 0 0 0 0 0 0 0 0
October 5 0 0 1 0 0 0 0 0 0 0
November 1 5 0 0 0 0 0 0 0 0 0
December 1 0 0 0 0 0 0 0 0 0 0
TOTAL 733 153 54 45 43 13 12 12 5 3 0
Page 45
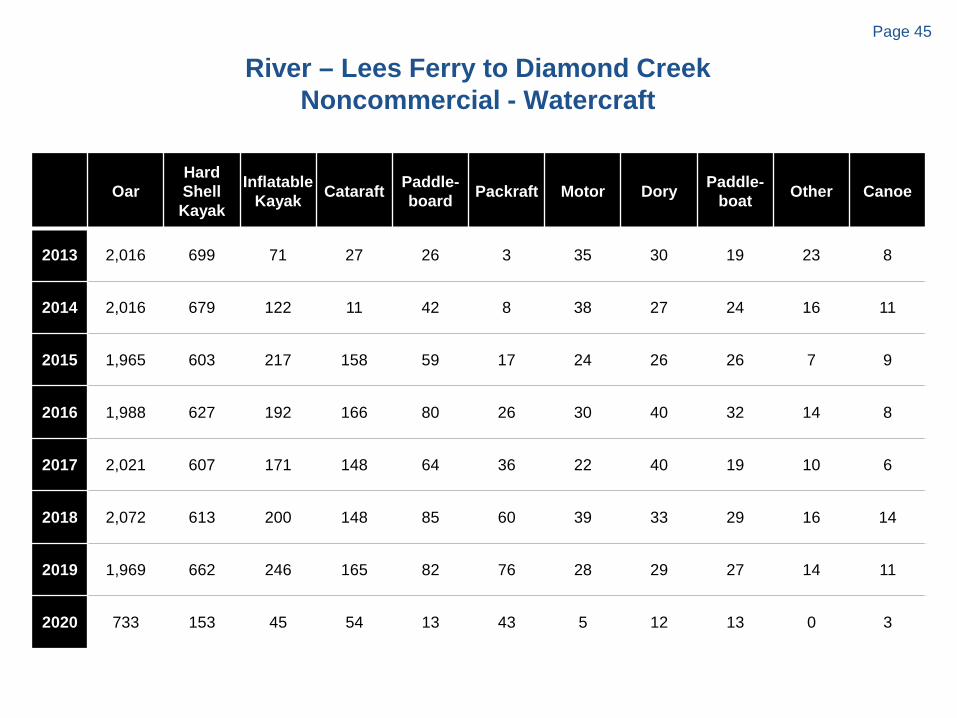
River – Lees Ferry to Diamond CreekNoncommercial - Watercraft
OarHard Shell Kayak
Inflatable Kayak Cataraft Paddle-
board Packraft Motor Dory Paddle-boat Other Canoe
2013 2,016 699 71 27 26 3 35 30 19 23 8
2014 2,016 679 122 11 42 8 38 27 24 16 11
2015 1,965 603 217 158 59 17 24 26 26 7 9
2016 1,988 627 192 166 80 26 30 40 32 14 8
2017 2,021 607 171 148 64 36 22 40 19 10 6
2018 2,072 613 200 148 85 60 39 33 29 16 14
2019 1,969 662 246 165 82 76 28 29 27 14 11
2020 733 153 45 54 13 43 5 12 13 0 3
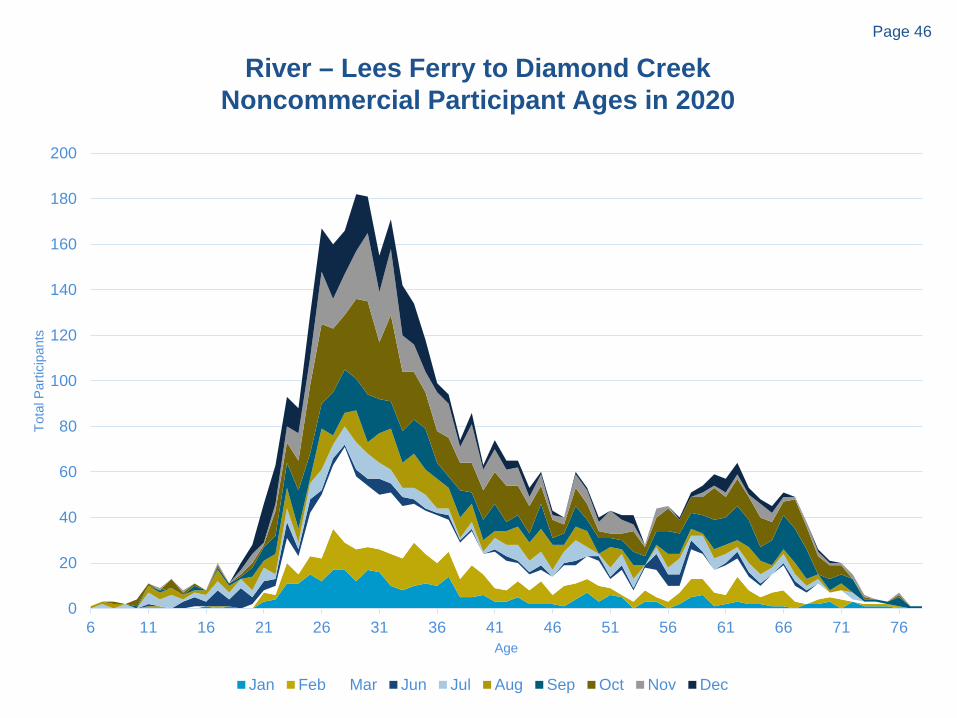
Page 46
River – Lees Ferry to Diamond CreekNoncommercial Participant Ages in 2020
0
20
40
60
80
100
120
140
160
180
200
6 11 16 21 26 31 36 41 46 51 56 61 66 71 76
Tota
l Par
ticip
ants
Age
Jan Feb Mar Jun Jul Aug Sep Oct Nov Dec
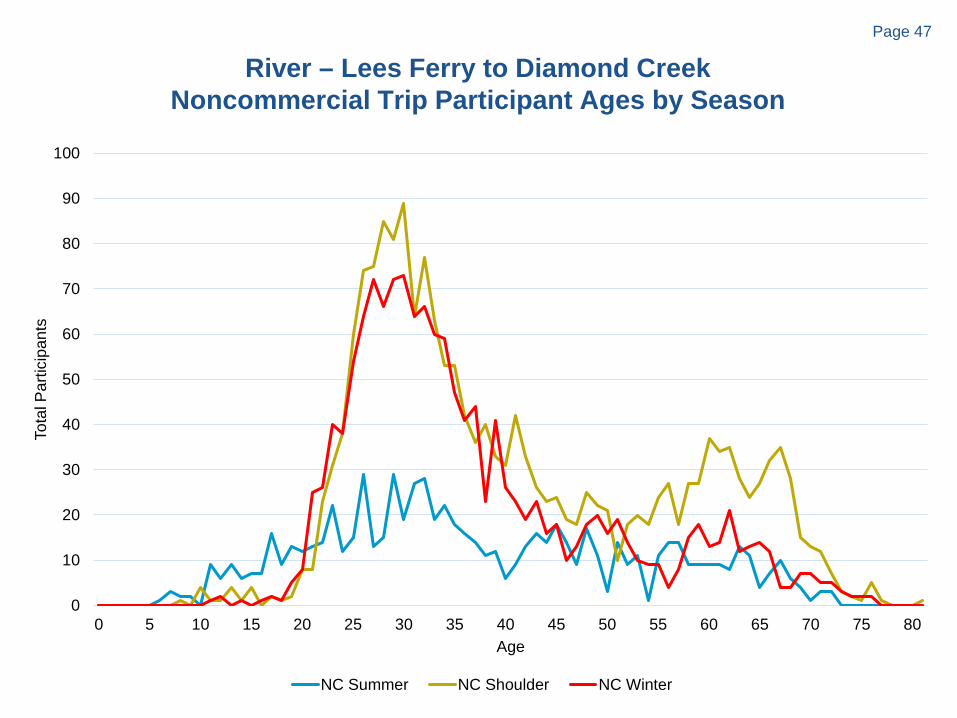
Page 47
River – Lees Ferry to Diamond CreekNoncommercial Trip Participant Ages by Season
0
10
20
30
40
50
60
70
80
90
100
0 5 10 15 20 25 30 35 40 45 50 55 60 65 70 75 80
Tota
l Par
ticip
ants
Age
NC Summer NC Shoulder NC Winter
Page 48
River
Lees Ferry to Diamond Creek UseCommercial Trips
Page 49
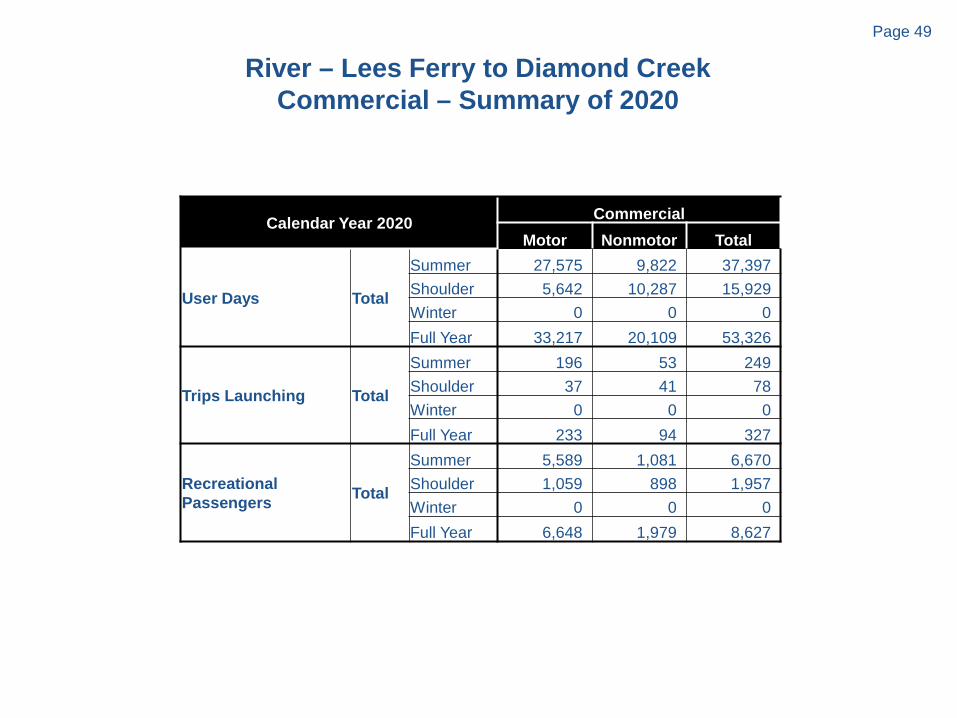
River – Lees Ferry to Diamond CreekCommercial – Summary of 2020
Calendar Year 2020 CommercialMotor Nonmotor Total
User Days Total
Summer 27,575 9,822 37,397Shoulder 5,642 10,287 15,929Winter 0 0 0Full Year 33,217 20,109 53,326
Trips Launching Total
Summer 196 53 249Shoulder 37 41 78Winter 0 0 0Full Year 233 94 327
Recreational Passengers Total
Summer 5,589 1,081 6,670Shoulder 1,059 898 1,957Winter 0 0 0Full Year 6,648 1,979 8,627
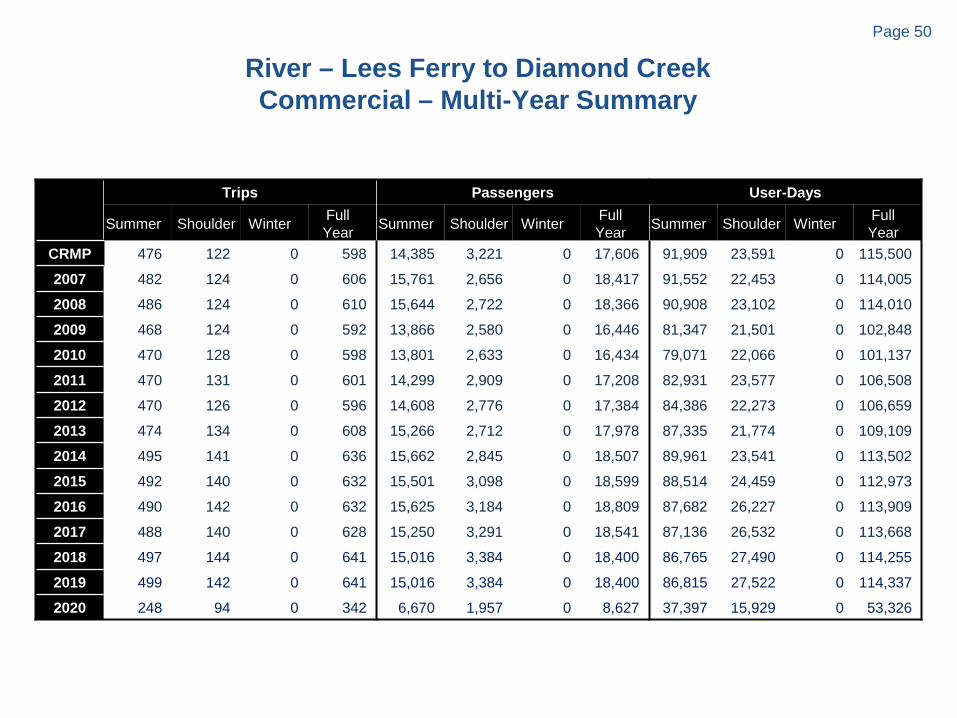
Page 50
River – Lees Ferry to Diamond CreekCommercial – Multi-Year Summary
Trips Passengers User-Days
Summer Shoulder Winter Full Year Summer Shoulder Winter Full
Year Summer Shoulder Winter Full Year
CRMP 476 122 0 598 14,385 3,221 0 17,606 91,909 23,591 0 115,500
2007 482 124 0 606 15,761 2,656 0 18,417 91,552 22,453 0 114,005
2008 486 124 0 610 15,644 2,722 0 18,366 90,908 23,102 0 114,010
2009 468 124 0 592 13,866 2,580 0 16,446 81,347 21,501 0 102,848
2010 470 128 0 598 13,801 2,633 0 16,434 79,071 22,066 0 101,137
2011 470 131 0 601 14,299 2,909 0 17,208 82,931 23,577 0 106,508
2012 470 126 0 596 14,608 2,776 0 17,384 84,386 22,273 0 106,659
2013 474 134 0 608 15,266 2,712 0 17,978 87,335 21,774 0 109,109
2014 495 141 0 636 15,662 2,845 0 18,507 89,961 23,541 0 113,502
2015 492 140 0 632 15,501 3,098 0 18,599 88,514 24,459 0 112,973
2016 490 142 0 632 15,625 3,184 0 18,809 87,682 26,227 0 113,909
2017 488 140 0 628 15,250 3,291 0 18,541 87,136 26,532 0 113,668
2018 497 144 0 641 15,016 3,384 0 18,400 86,765 27,490 0 114,255
2019 499 142 0 641 15,016 3,384 0 18,400 86,815 27,522 0 114,337
2020 248 94 0 342 6,670 1,957 0 8,627 37,397 15,929 0 53,326
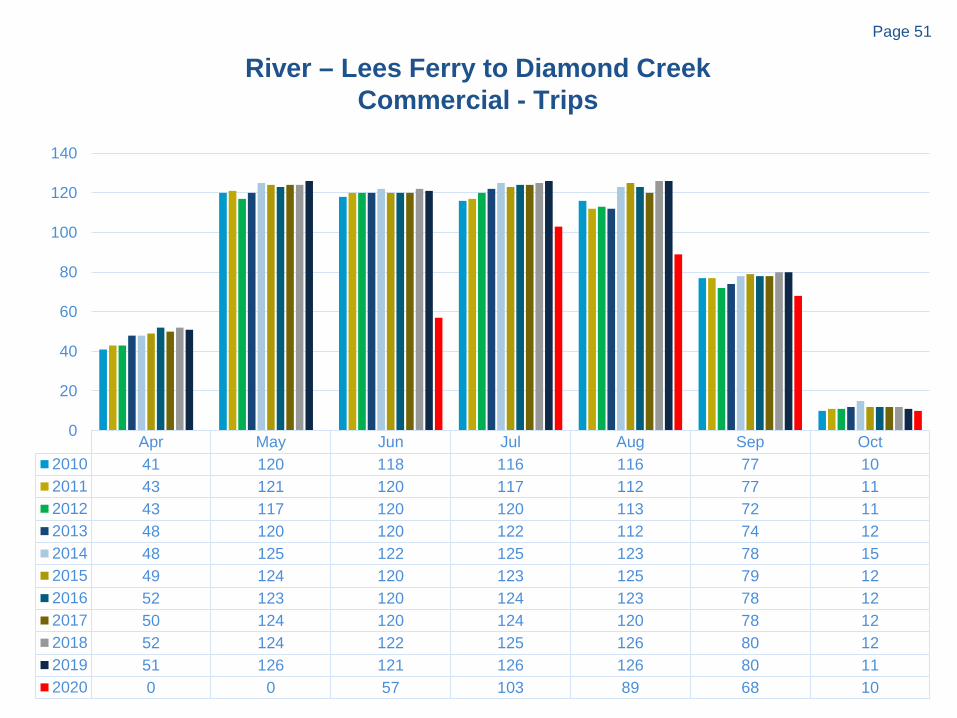
Page 51
River – Lees Ferry to Diamond CreekCommercial - Trips
Apr May Jun Jul Aug Sep Oct2010 41 120 118 116 116 77 102011 43 121 120 117 112 77 112012 43 117 120 120 113 72 112013 48 120 120 122 112 74 122014 48 125 122 125 123 78 152015 49 124 120 123 125 79 122016 52 123 120 124 123 78 122017 50 124 120 124 120 78 122018 52 124 122 125 126 80 122019 51 126 121 126 126 80 112020 0 0 57 103 89 68 10
0
20
40
60
80
100
120
140
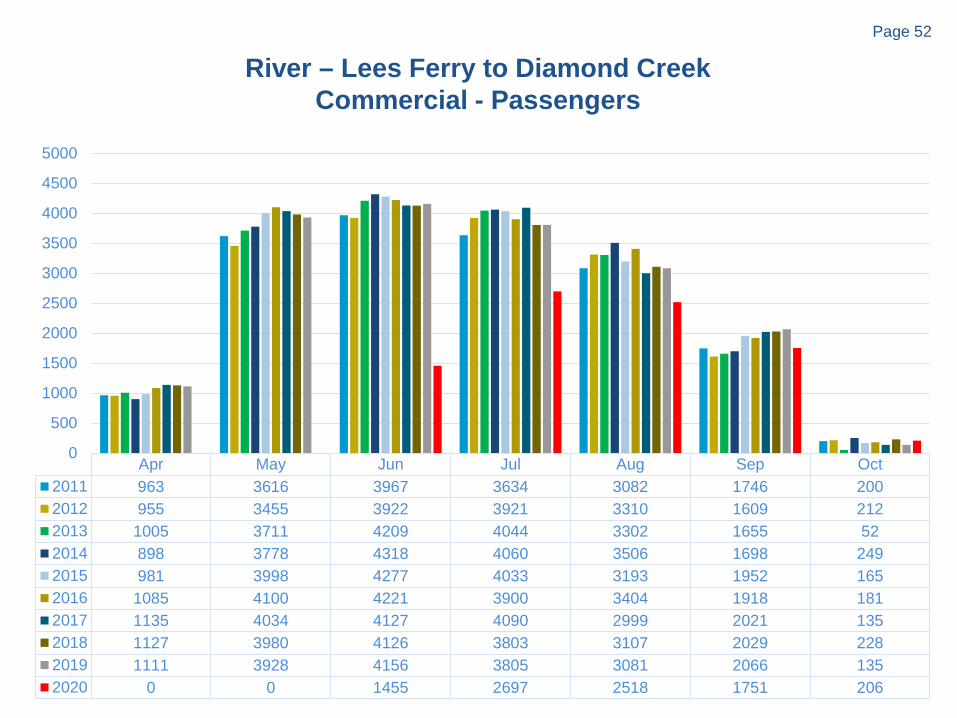
Page 52
River – Lees Ferry to Diamond CreekCommercial - Passengers
Apr May Jun Jul Aug Sep Oct2011 963 3616 3967 3634 3082 1746 2002012 955 3455 3922 3921 3310 1609 2122013 1005 3711 4209 4044 3302 1655 522014 898 3778 4318 4060 3506 1698 2492015 981 3998 4277 4033 3193 1952 1652016 1085 4100 4221 3900 3404 1918 1812017 1135 4034 4127 4090 2999 2021 1352018 1127 3980 4126 3803 3107 2029 2282019 1111 3928 4156 3805 3081 2066 1352020 0 0 1455 2697 2518 1751 206
0
500
1000
1500
2000
2500
3000
3500
4000
4500
5000
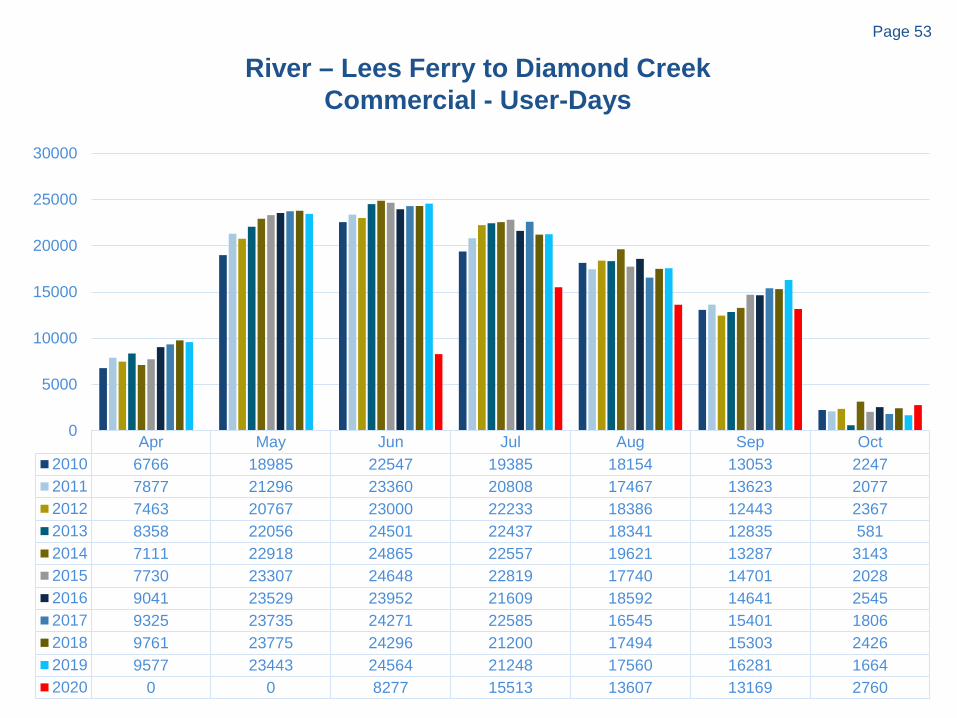
Page 53
River – Lees Ferry to Diamond CreekCommercial - User-Days
Apr May Jun Jul Aug Sep Oct2010 6766 18985 22547 19385 18154 13053 22472011 7877 21296 23360 20808 17467 13623 20772012 7463 20767 23000 22233 18386 12443 23672013 8358 22056 24501 22437 18341 12835 5812014 7111 22918 24865 22557 19621 13287 31432015 7730 23307 24648 22819 17740 14701 20282016 9041 23529 23952 21609 18592 14641 25452017 9325 23735 24271 22585 16545 15401 18062018 9761 23775 24296 21200 17494 15303 24262019 9577 23443 24564 21248 17560 16281 16642020 0 0 8277 15513 13607 13169 2760
0
5000
10000
15000
20000
25000
30000
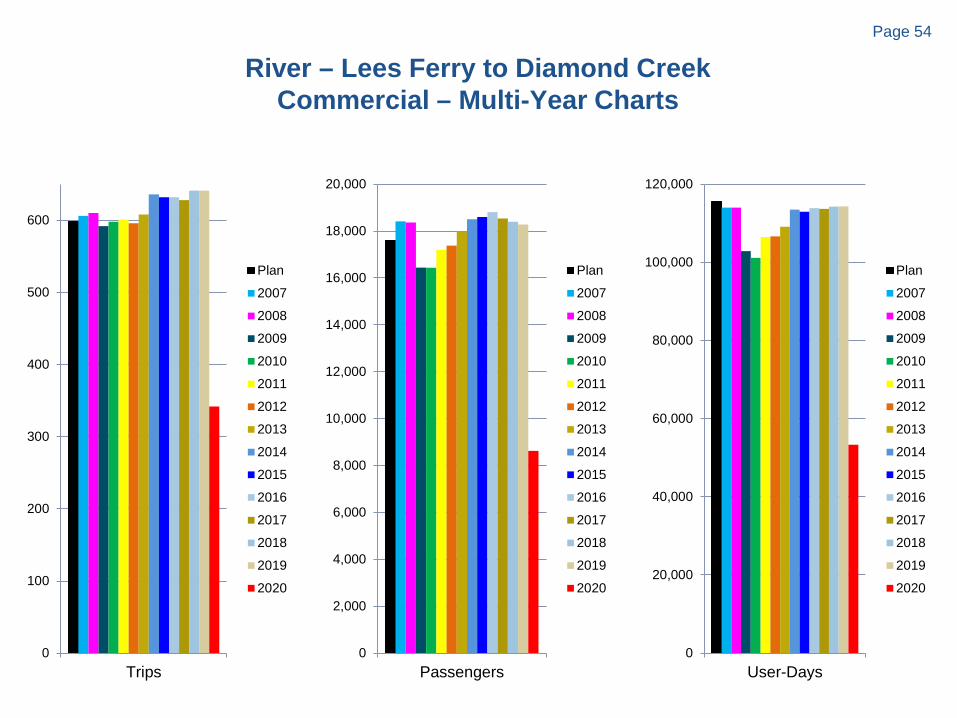
Page 54
River – Lees Ferry to Diamond CreekCommercial – Multi-Year Charts
0
100
200
300
400
500
600
Trips
Plan
2007
2008
2009
2010
2011
2012
2013
2014
2015
2016
2017
2018
2019
2020
0
2,000
4,000
6,000
8,000
10,000
12,000
14,000
16,000
18,000
20,000
Passengers
Plan
2007
2008
2009
2010
2011
2012
2013
2014
2015
2016
2017
2018
2019
2020
0
20,000
40,000
60,000
80,000
100,000
120,000
User-Days
Plan
2007
2008
2009
2010
2011
2012
2013
2014
2015
2016
2017
2018
2019
2020
Page 55
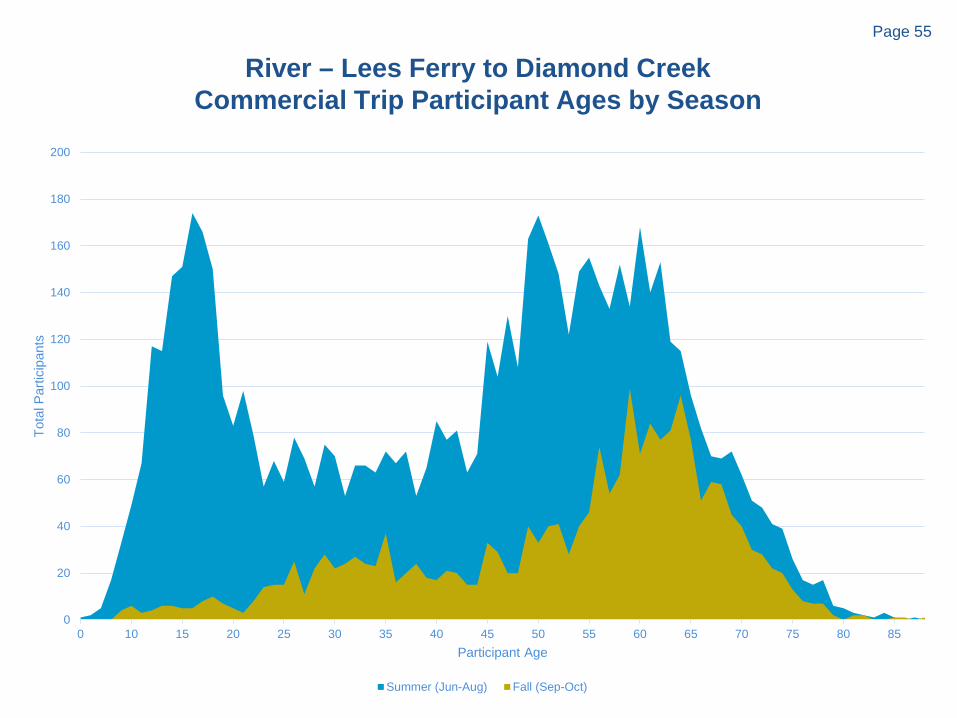
River – Lees Ferry to Diamond CreekCommercial Trip Participant Ages by Season
0
20
40
60
80
100
120
140
160
180
200
0 10 15 20 25 30 35 40 45 50 55 60 65 70 75 80 85
Tota
l Par
ticip
ants
Participant Age
Summer (Jun-Aug) Fall (Sep-Oct)
Page 56
River
Lees Ferry to Diamond Creek UseCommercial + Noncommercial
Trips
Page 57
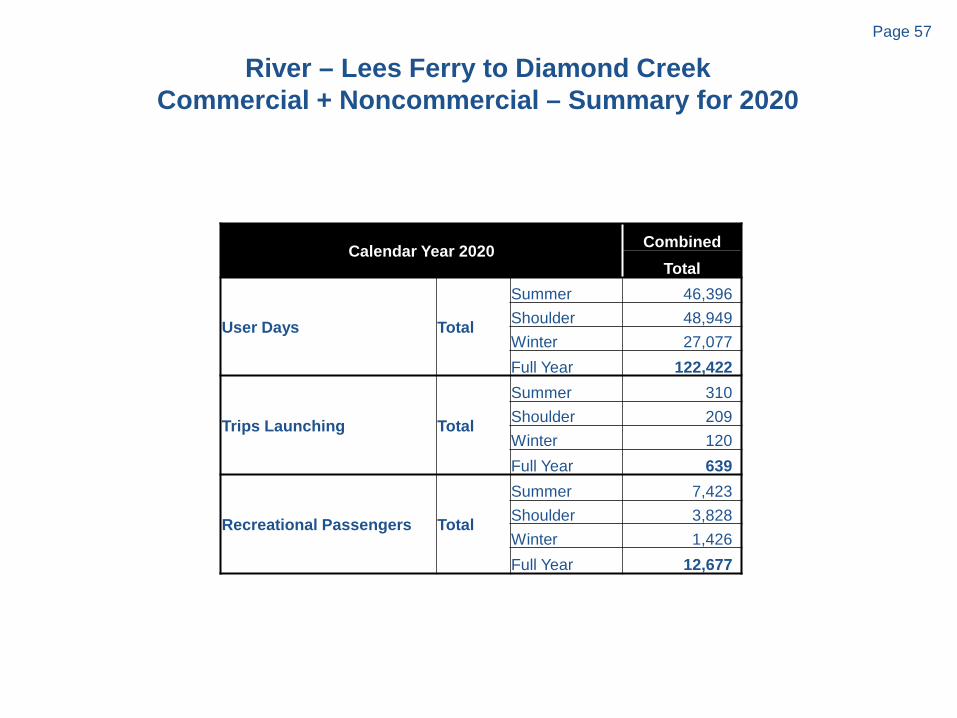
River – Lees Ferry to Diamond CreekCommercial + Noncommercial – Summary for 2020
Calendar Year 2020 CombinedTotal
User Days Total
Summer 46,396Shoulder 48,949Winter 27,077Full Year 122,422
Trips Launching Total
Summer 310Shoulder 209Winter 120Full Year 639
Recreational Passengers Total
Summer 7,423Shoulder 3,828Winter 1,426Full Year 12,677
Page 58
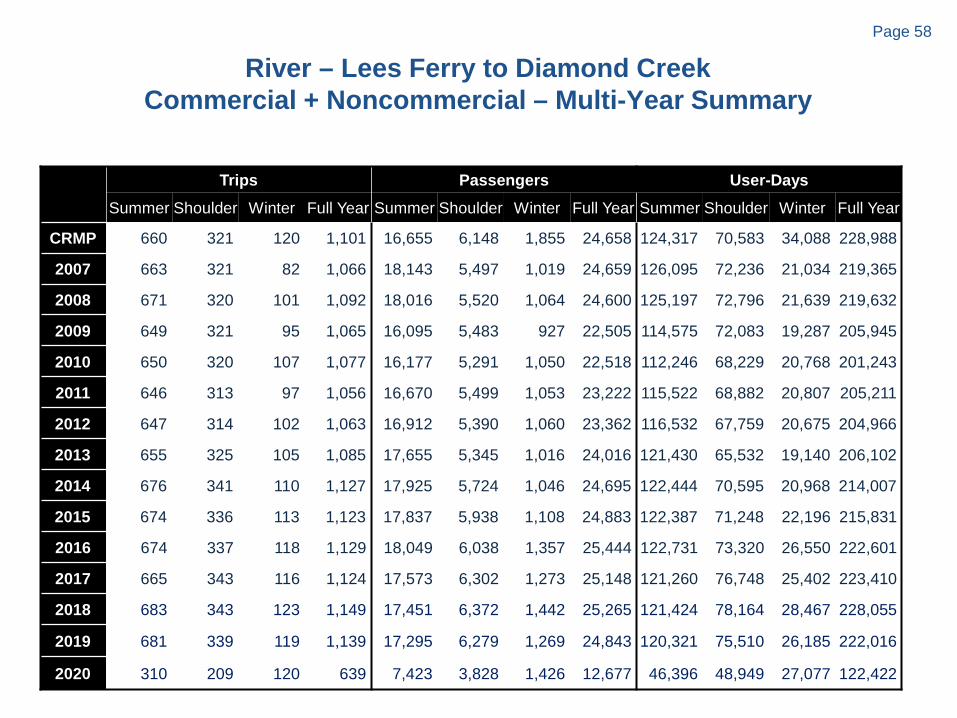
River – Lees Ferry to Diamond CreekCommercial + Noncommercial – Multi-Year Summary
Trips Passengers User-DaysSummer Shoulder Winter Full Year Summer Shoulder Winter Full Year Summer Shoulder Winter Full Year
CRMP 660 321 120 1,101 16,655 6,148 1,855 24,658 124,317 70,583 34,088 228,988
2007 663 321 82 1,066 18,143 5,497 1,019 24,659 126,095 72,236 21,034 219,365
2008 671 320 101 1,092 18,016 5,520 1,064 24,600 125,197 72,796 21,639 219,632
2009 649 321 95 1,065 16,095 5,483 927 22,505 114,575 72,083 19,287 205,945
2010 650 320 107 1,077 16,177 5,291 1,050 22,518 112,246 68,229 20,768 201,243
2011 646 313 97 1,056 16,670 5,499 1,053 23,222 115,522 68,882 20,807 205,211
2012 647 314 102 1,063 16,912 5,390 1,060 23,362 116,532 67,759 20,675 204,966
2013 655 325 105 1,085 17,655 5,345 1,016 24,016 121,430 65,532 19,140 206,102
2014 676 341 110 1,127 17,925 5,724 1,046 24,695 122,444 70,595 20,968 214,007
2015 674 336 113 1,123 17,837 5,938 1,108 24,883 122,387 71,248 22,196 215,831
2016 674 337 118 1,129 18,049 6,038 1,357 25,444 122,731 73,320 26,550 222,601
2017 665 343 116 1,124 17,573 6,302 1,273 25,148 121,260 76,748 25,402 223,410
2018 683 343 123 1,149 17,451 6,372 1,442 25,265 121,424 78,164 28,467 228,055
2019 681 339 119 1,139 17,295 6,279 1,269 24,843 120,321 75,510 26,185 222,016
2020 310 209 120 639 7,423 3,828 1,426 12,677 46,396 48,949 27,077 122,422
Page 59
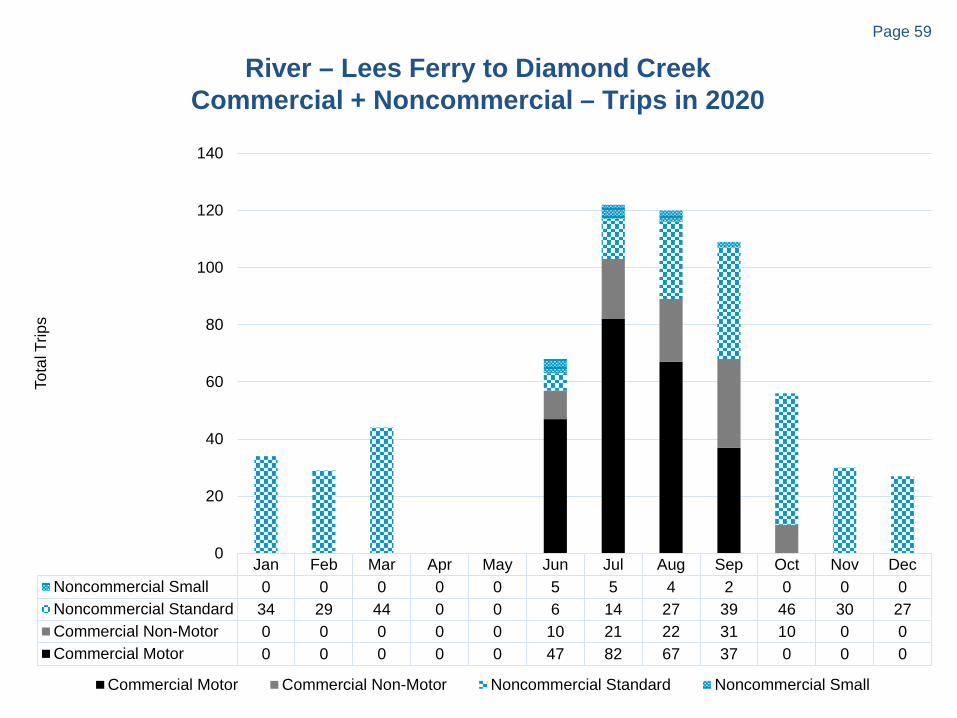
River – Lees Ferry to Diamond CreekCommercial + Noncommercial – Trips in 2020
Jan Feb Mar Apr May Jun Jul Aug Sep Oct Nov DecNoncommercial Small 0 0 0 0 0 5 5 4 2 0 0 0Noncommercial Standard 34 29 44 0 0 6 14 27 39 46 30 27Commercial Non-Motor 0 0 0 0 0 10 21 22 31 10 0 0Commercial Motor 0 0 0 0 0 47 82 67 37 0 0 0
0
20
40
60
80
100
120
140
Tota
l Trip
s
Commercial Motor Commercial Non-Motor Noncommercial Standard Noncommercial Small
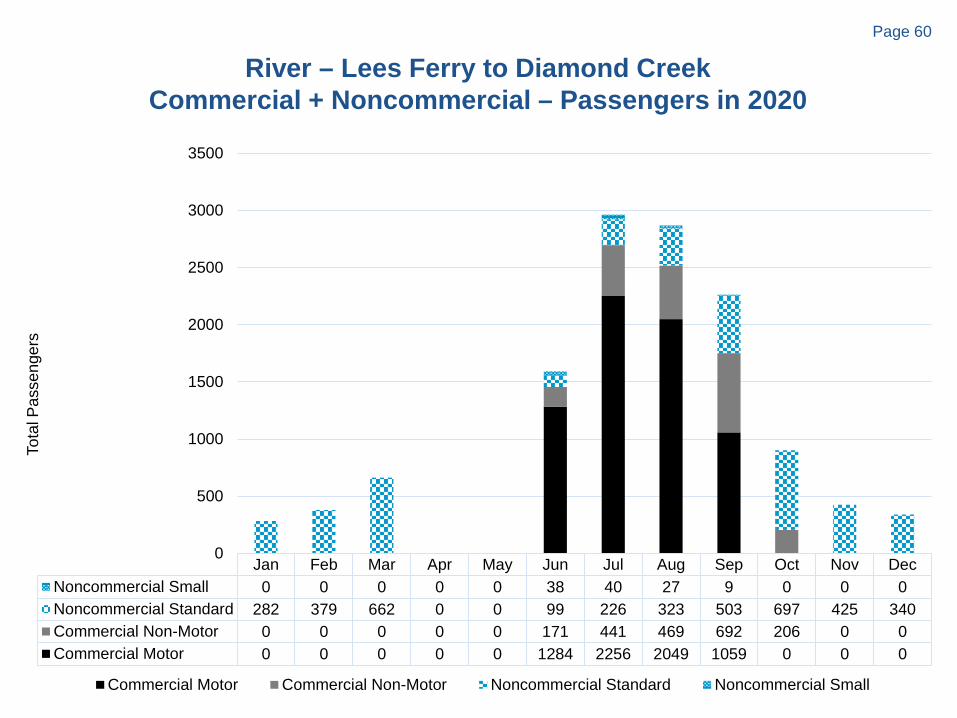
Page 60
River – Lees Ferry to Diamond CreekCommercial + Noncommercial – Passengers in 2020
Jan Feb Mar Apr May Jun Jul Aug Sep Oct Nov DecNoncommercial Small 0 0 0 0 0 38 40 27 9 0 0 0Noncommercial Standard 282 379 662 0 0 99 226 323 503 697 425 340Commercial Non-Motor 0 0 0 0 0 171 441 469 692 206 0 0Commercial Motor 0 0 0 0 0 1284 2256 2049 1059 0 0 0
0
500
1000
1500
2000
2500
3000
3500
Tota
l Pas
seng
ers
Commercial Motor Commercial Non-Motor Noncommercial Standard Noncommercial Small
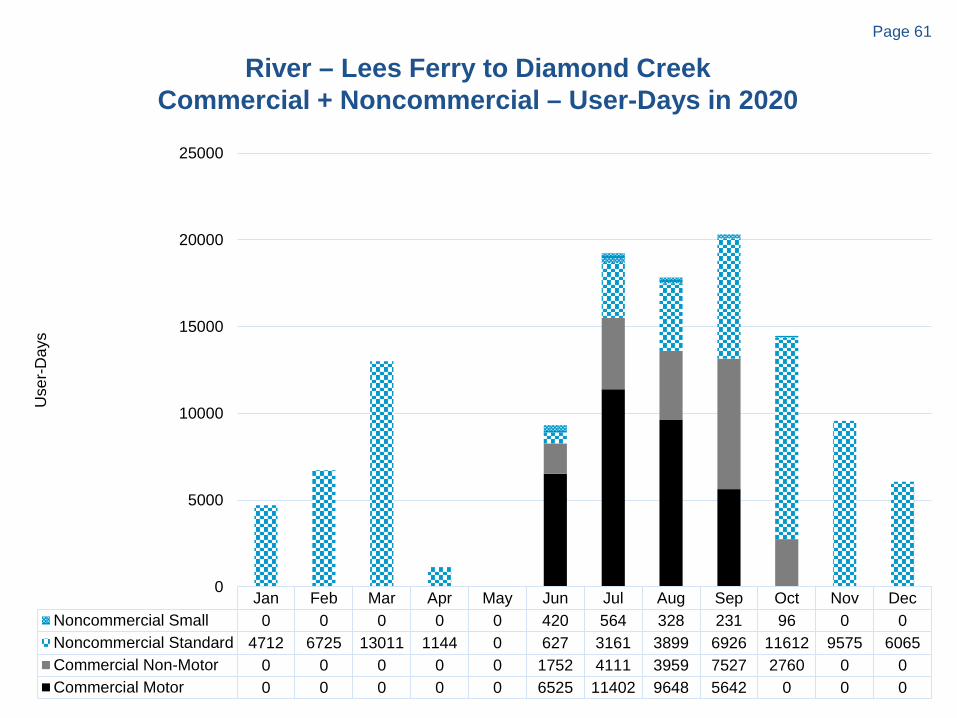
Page 61
River – Lees Ferry to Diamond CreekCommercial + Noncommercial – User-Days in 2020
Jan Feb Mar Apr May Jun Jul Aug Sep Oct Nov DecNoncommercial Small 0 0 0 0 0 420 564 328 231 96 0 0Noncommercial Standard 4712 6725 13011 1144 0 627 3161 3899 6926 11612 9575 6065Commercial Non-Motor 0 0 0 0 0 1752 4111 3959 7527 2760 0 0Commercial Motor 0 0 0 0 0 6525 11402 9648 5642 0 0 0
0
5000
10000
15000
20000
25000
Use
r-Day
s
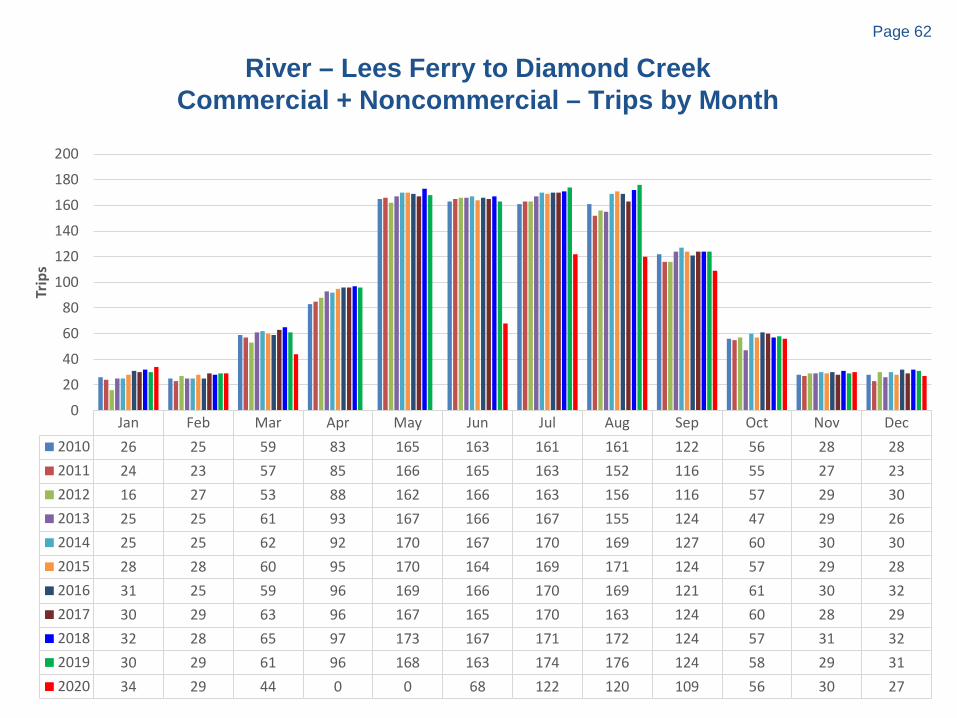
Page 62
River – Lees Ferry to Diamond CreekCommercial + Noncommercial – Trips by Month
Jan Feb Mar Apr May Jun Jul Aug Sep Oct Nov Dec2010 26 25 59 83 165 163 161 161 122 56 28 282011 24 23 57 85 166 165 163 152 116 55 27 232012 16 27 53 88 162 166 163 156 116 57 29 302013 25 25 61 93 167 166 167 155 124 47 29 262014 25 25 62 92 170 167 170 169 127 60 30 302015 28 28 60 95 170 164 169 171 124 57 29 282016 31 25 59 96 169 166 170 169 121 61 30 322017 30 29 63 96 167 165 170 163 124 60 28 292018 32 28 65 97 173 167 171 172 124 57 31 322019 30 29 61 96 168 163 174 176 124 58 29 312020 34 29 44 0 0 68 122 120 109 56 30 27
0
20
40
60
80
100
120
140
160
180
200
Trip
s
Page 63
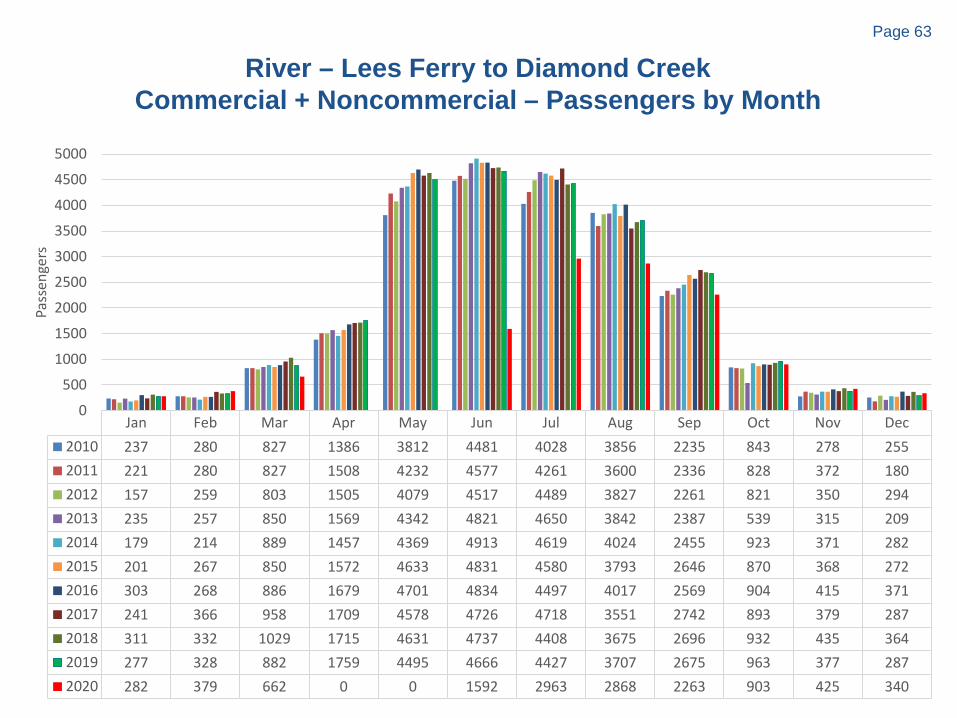
River – Lees Ferry to Diamond CreekCommercial + Noncommercial – Passengers by Month
Jan Feb Mar Apr May Jun Jul Aug Sep Oct Nov Dec2010 237 280 827 1386 3812 4481 4028 3856 2235 843 278 2552011 221 280 827 1508 4232 4577 4261 3600 2336 828 372 1802012 157 259 803 1505 4079 4517 4489 3827 2261 821 350 2942013 235 257 850 1569 4342 4821 4650 3842 2387 539 315 2092014 179 214 889 1457 4369 4913 4619 4024 2455 923 371 2822015 201 267 850 1572 4633 4831 4580 3793 2646 870 368 2722016 303 268 886 1679 4701 4834 4497 4017 2569 904 415 3712017 241 366 958 1709 4578 4726 4718 3551 2742 893 379 2872018 311 332 1029 1715 4631 4737 4408 3675 2696 932 435 3642019 277 328 882 1759 4495 4666 4427 3707 2675 963 377 2872020 282 379 662 0 0 1592 2963 2868 2263 903 425 340
0
500
1000
1500
2000
2500
3000
3500
4000
4500
5000
Pass
enge
rs
Page 64
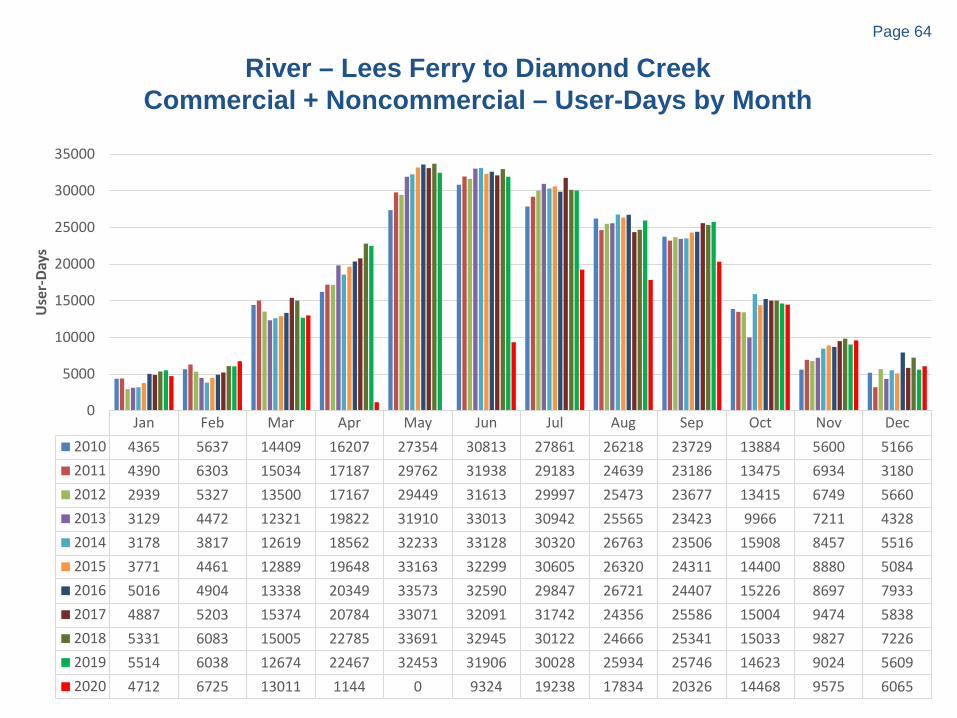
River – Lees Ferry to Diamond CreekCommercial + Noncommercial – User-Days by Month
Jan Feb Mar Apr May Jun Jul Aug Sep Oct Nov Dec2010 4365 5637 14409 16207 27354 30813 27861 26218 23729 13884 5600 51662011 4390 6303 15034 17187 29762 31938 29183 24639 23186 13475 6934 31802012 2939 5327 13500 17167 29449 31613 29997 25473 23677 13415 6749 56602013 3129 4472 12321 19822 31910 33013 30942 25565 23423 9966 7211 43282014 3178 3817 12619 18562 32233 33128 30320 26763 23506 15908 8457 55162015 3771 4461 12889 19648 33163 32299 30605 26320 24311 14400 8880 50842016 5016 4904 13338 20349 33573 32590 29847 26721 24407 15226 8697 79332017 4887 5203 15374 20784 33071 32091 31742 24356 25586 15004 9474 58382018 5331 6083 15005 22785 33691 32945 30122 24666 25341 15033 9827 72262019 5514 6038 12674 22467 32453 31906 30028 25934 25746 14623 9024 56092020 4712 6725 13011 1144 0 9324 19238 17834 20326 14468 9575 6065
0
5000
10000
15000
20000
25000
30000
35000
Use
r-Da
ys
Page 65
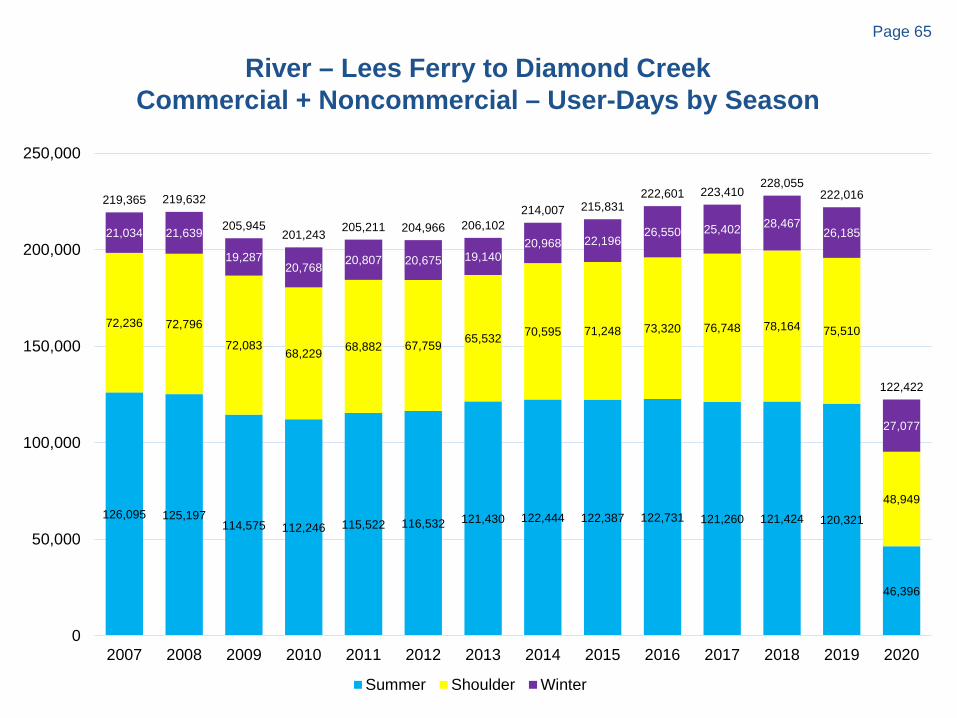
River – Lees Ferry to Diamond CreekCommercial + Noncommercial – User-Days by Season
126,095 125,197114,575 112,246 115,522 116,532 121,430 122,444 122,387 122,731 121,260 121,424 120,321
46,396
72,236 72,796
72,08368,229 68,882 67,759 65,532 70,595 71,248 73,320 76,748 78,164 75,510
48,949
21,034 21,639
19,28720,768 20,807 20,675 19,140
20,968 22,19626,550 25,402 28,467
26,185
27,077
219,365 219,632
205,945201,243 205,211 204,966 206,102
214,007 215,831222,601 223,410
228,055222,016
122,422
0
50,000
100,000
150,000
200,000
250,000
2007 2008 2009 2010 2011 2012 2013 2014 2015 2016 2017 2018 2019 2020
Summer Shoulder Winter
Page 66
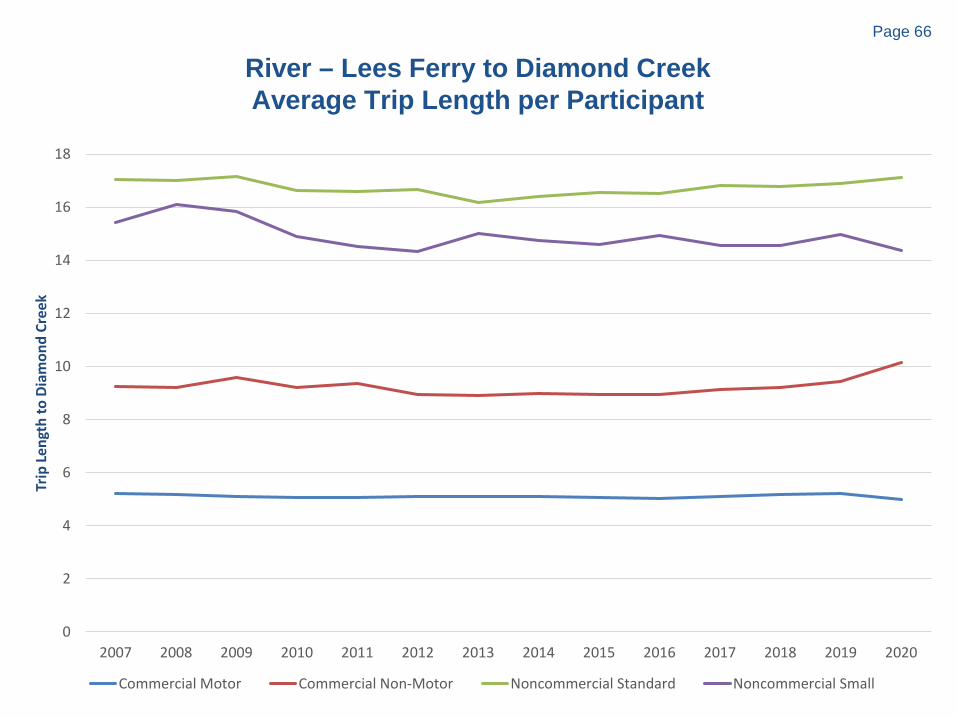
River – Lees Ferry to Diamond CreekAverage Trip Length per Participant
0
2
4
6
8
10
12
14
16
18
2007 2008 2009 2010 2011 2012 2013 2014 2015 2016 2017 2018 2019 2020
Trip
Leng
th to
Dia
mon
d Cr
eek
Commercial Motor Commercial Non-Motor Noncommercial Standard Noncommercial Small
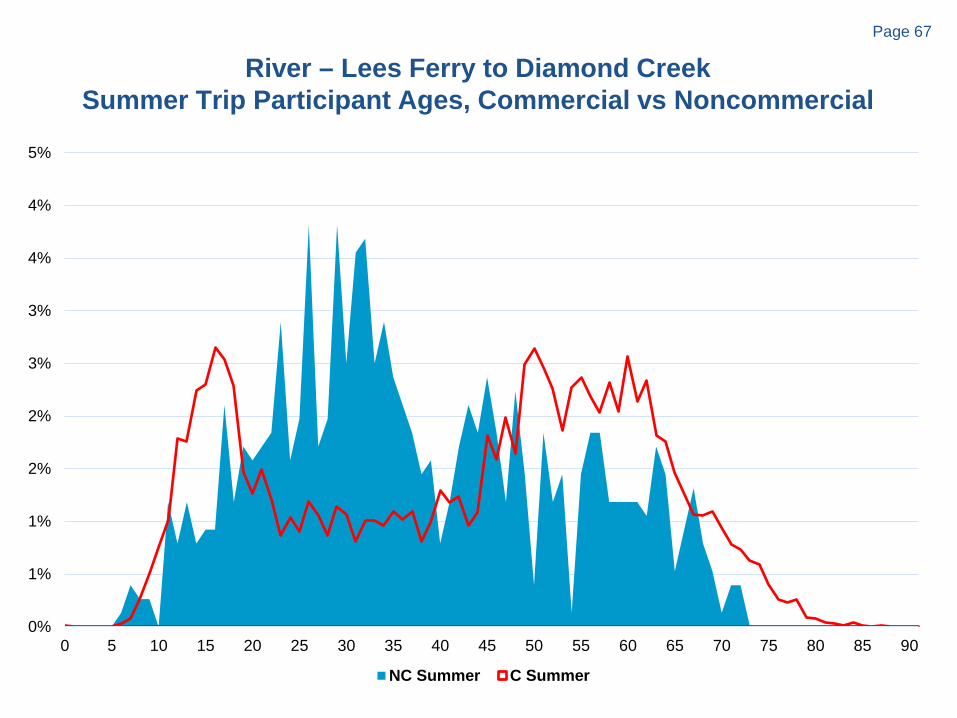
Page 67
River – Lees Ferry to Diamond CreekSummer Trip Participant Ages, Commercial vs Noncommercial
0%
1%
1%
2%
2%
3%
3%
4%
4%
5%
0 5 10 15 20 25 30 35 40 45 50 55 60 65 70 75 80 85 90
NC Summer C Summer
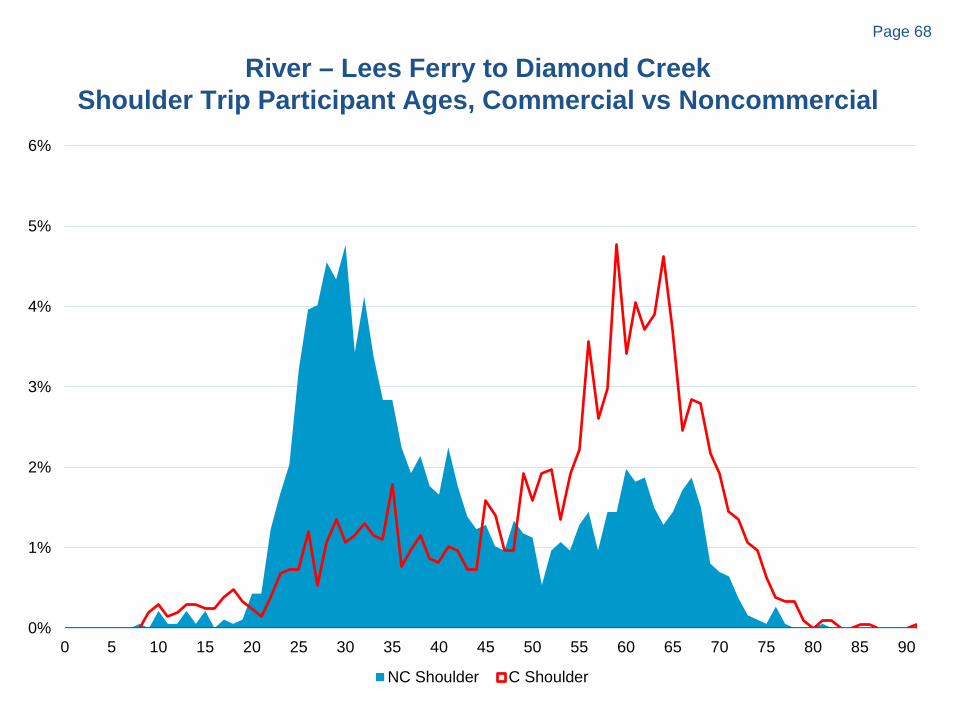
Page 68
River – Lees Ferry to Diamond CreekShoulder Trip Participant Ages, Commercial vs Noncommercial
0%
1%
2%
3%
4%
5%
6%
0 5 10 15 20 25 30 35 40 45 50 55 60 65 70 75 80 85 90
NC Shoulder C Shoulder
Page 69
River
Lees Ferry to Diamond Creek
Lotteries and Lottery Applicants for Noncommercial Trips
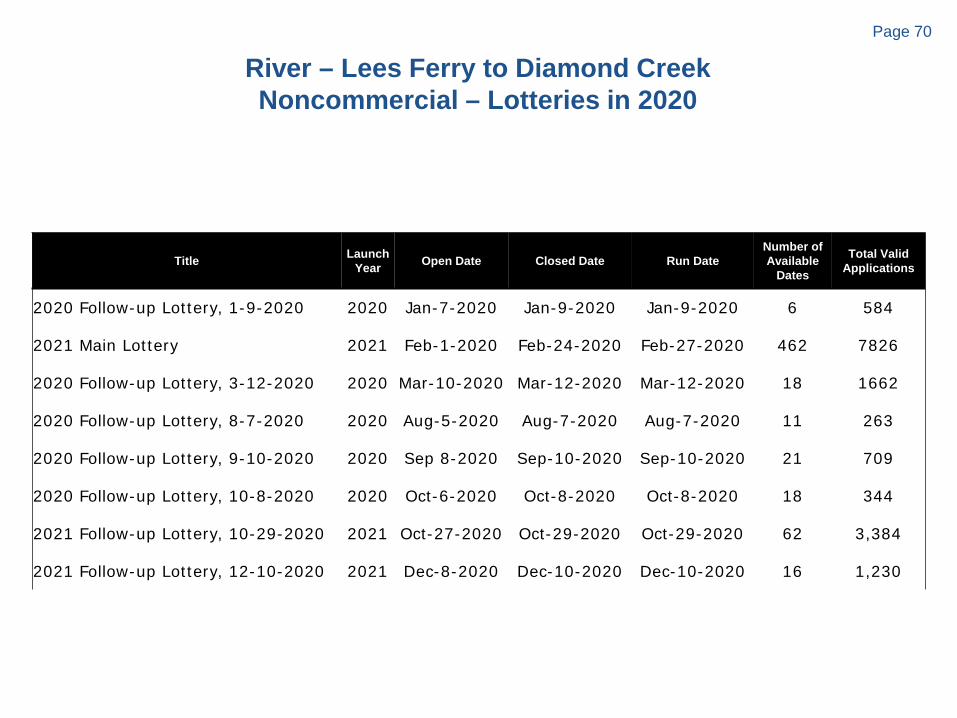
Page 70
River – Lees Ferry to Diamond CreekNoncommercial – Lotteries in 2020
Title Launch Year Open Date Closed Date Run Date
Number of Available
Dates
Total Valid Applications
2020 Follow-up Lottery, 1-9-2020 2020 Jan-7-2020 Jan-9-2020 Jan-9-2020 6 584
2021 Main Lottery 2021 Feb-1-2020 Feb-24-2020 Feb-27-2020 462 7826
2020 Follow-up Lottery, 3-12-2020 2020 Mar-10-2020 Mar-12-2020 Mar-12-2020 18 1662
2020 Follow-up Lottery, 8-7-2020 2020 Aug-5-2020 Aug-7-2020 Aug-7-2020 11 263
2020 Follow-up Lottery, 9-10-2020 2020 Sep 8-2020 Sep-10-2020 Sep-10-2020 21 709
2020 Follow-up Lottery, 10-8-2020 2020 Oct-6-2020 Oct-8-2020 Oct-8-2020 18 344
2021 Follow-up Lottery, 10-29-2020 2021 Oct-27-2020 Oct-29-2020 Oct-29-2020 62 3,384
2021 Follow-up Lottery, 12-10-2020 2021 Dec-8-2020 Dec-10-2020 Dec-10-2020 16 1,230
Page 71
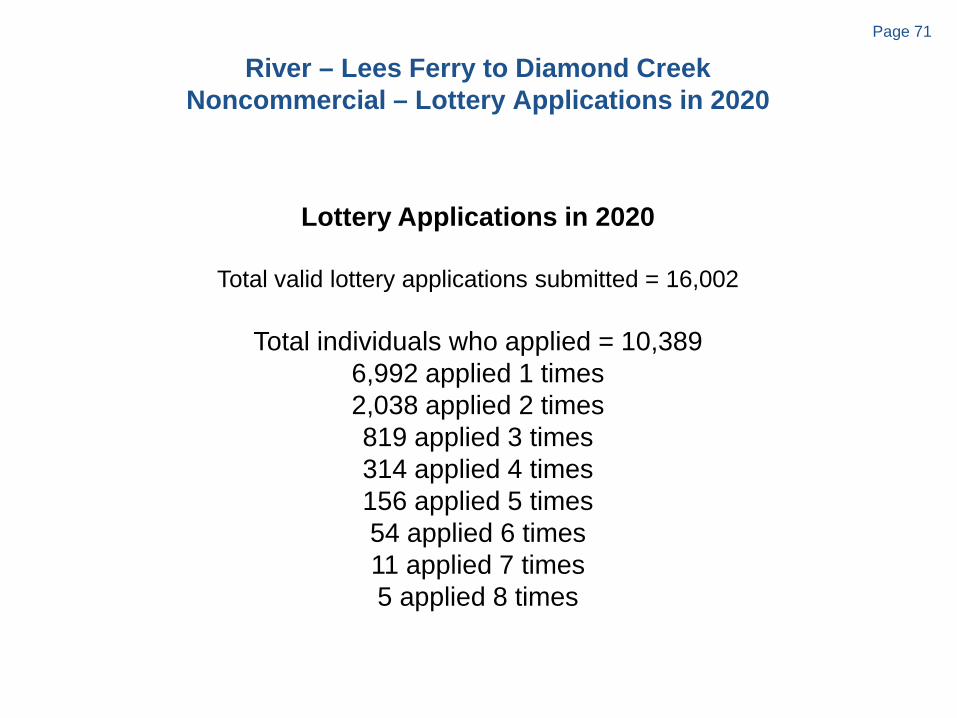
River – Lees Ferry to Diamond CreekNoncommercial – Lottery Applications in 2020
Lottery Applications in 2020
Total valid lottery applications submitted = 16,002
Total individuals who applied = 10,3896,992 applied 1 times2,038 applied 2 times819 applied 3 times314 applied 4 times156 applied 5 times54 applied 6 times11 applied 7 times5 applied 8 times
Page 72
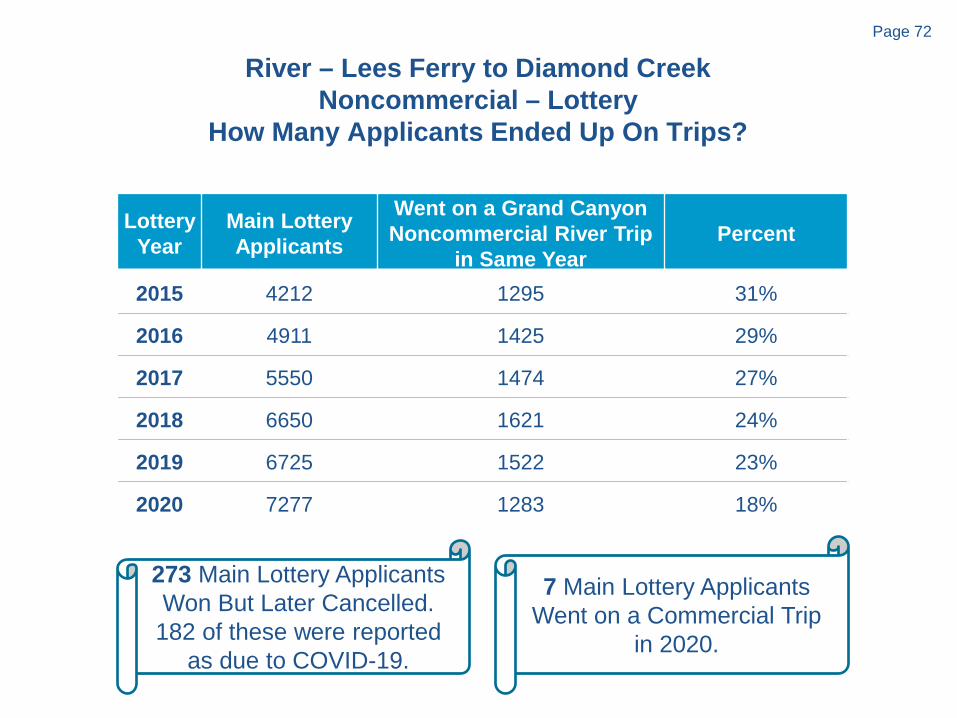
River – Lees Ferry to Diamond CreekNoncommercial – Lottery
How Many Applicants Ended Up On Trips?
Lottery Year
Main Lottery Applicants
Went on a Grand Canyon Noncommercial River Trip
in Same YearPercent
2015 4212 1295 31%
2016 4911 1425 29%
2017 5550 1474 27%
2018 6650 1621 24%
2019 6725 1522 23%
2020 7277 1283 18%
273 Main Lottery Applicants Won But Later Cancelled.
182 of these were reported as due to COVID-19.
7 Main Lottery Applicants Went on a Commercial Trip
in 2020.
Page 73
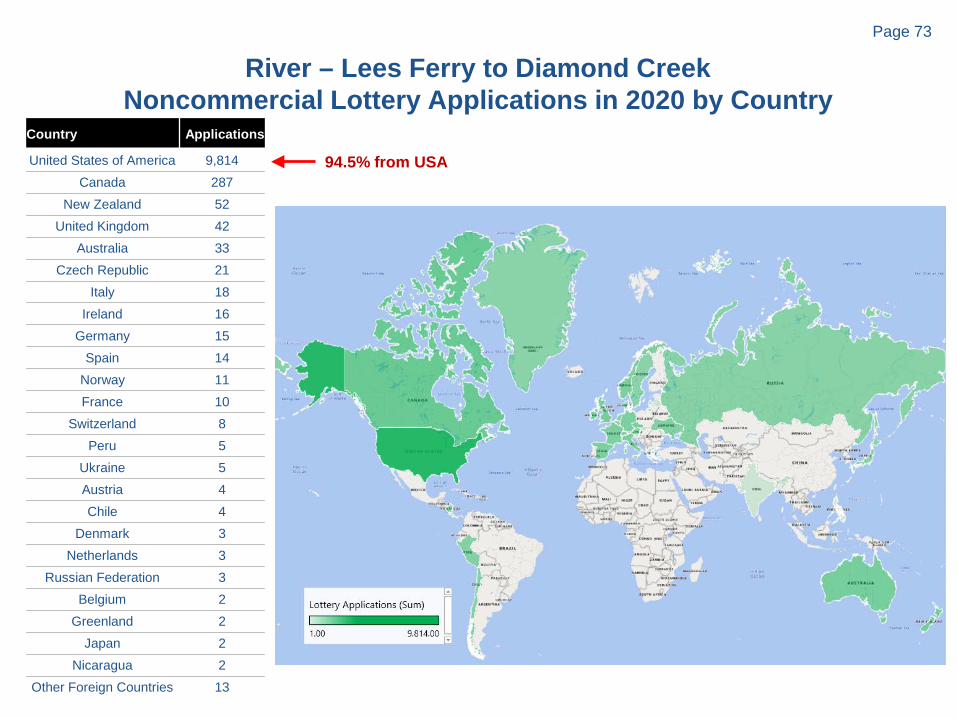
River – Lees Ferry to Diamond CreekNoncommercial Lottery Applications in 2020 by Country
Country Applications
United States of America 9,814Canada 287
New Zealand 52United Kingdom 42
Australia 33Czech Republic 21
Italy 18Ireland 16
Germany 15Spain 14
Norway 11France 10
Switzerland 8Peru 5
Ukraine 5Austria 4Chile 4
Denmark 3Netherlands 3
Russian Federation 3Belgium 2
Greenland 2Japan 2
Nicaragua 2Other Foreign Countries 13
94.5% from USA
Page 74
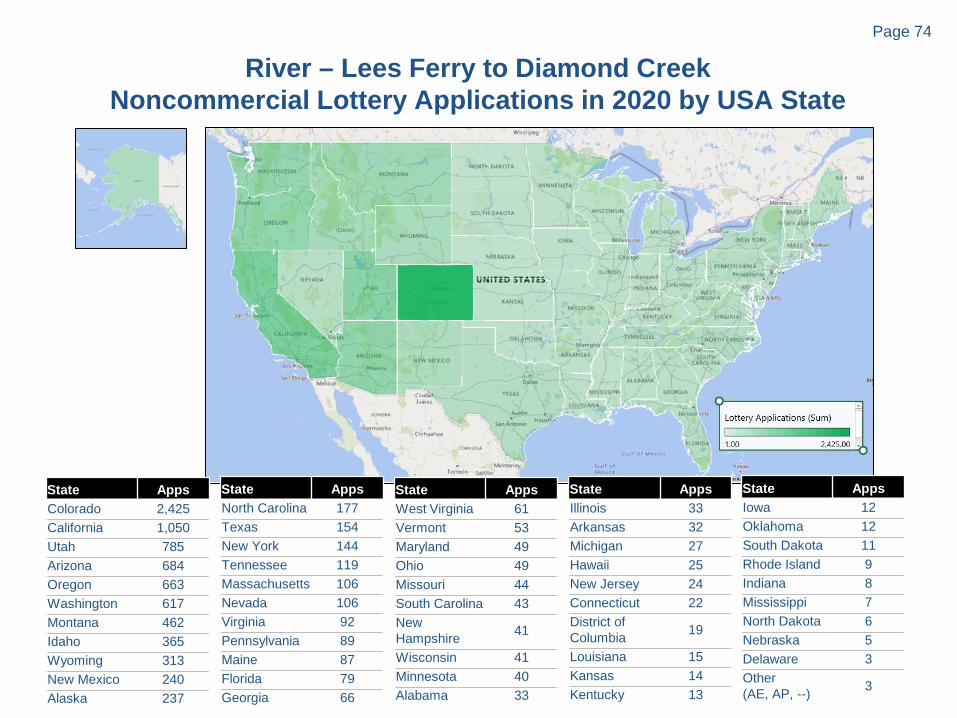
River – Lees Ferry to Diamond CreekNoncommercial Lottery Applications in 2020 by USA State
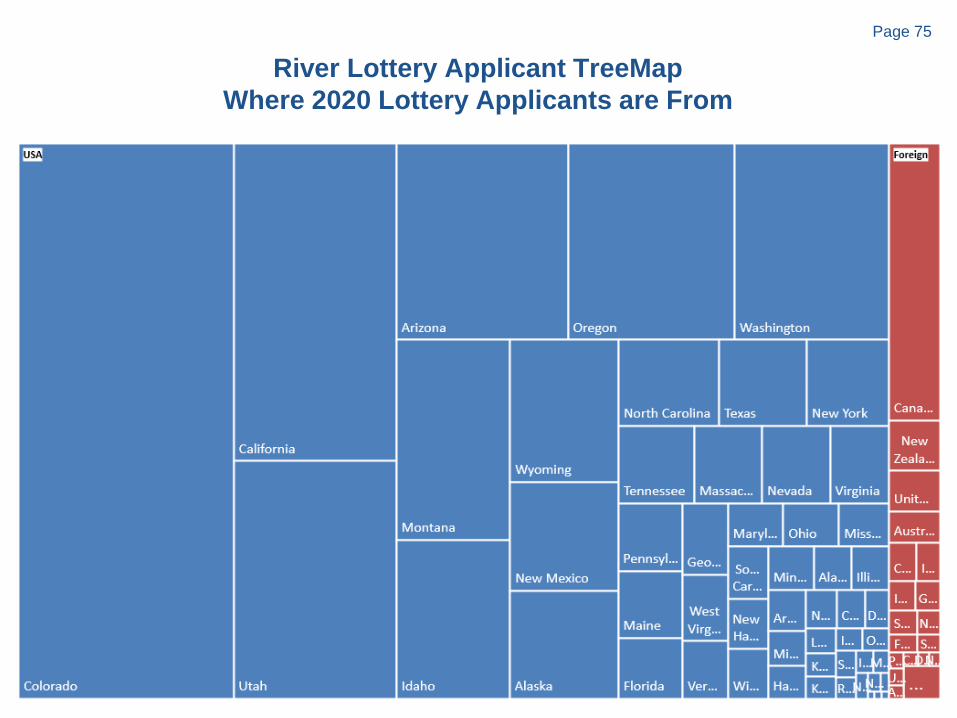
State AppsColorado 2,425California 1,050Utah 785Arizona 684Oregon 663Washington 617Montana 462Idaho 365Wyoming 313New Mexico 240Alaska 237
State AppsNorth Carolina 177Texas 154New York 144Tennessee 119Massachusetts 106Nevada 106Virginia 92Pennsylvania 89Maine 87Florida 79Georgia 66
State AppsWest Virginia 61Vermont 53Maryland 49Ohio 49Missouri 44South Carolina 43New Hampshire 41
Wisconsin 41Minnesota 40Alabama 33
State AppsIllinois 33Arkansas 32Michigan 27Hawaii 25New Jersey 24Connecticut 22District of Columbia 19
Louisiana 15Kansas 14Kentucky 13
State AppsIowa 12Oklahoma 12South Dakota 11Rhode Island 9Indiana 8Mississippi 7North Dakota 6Nebraska 5Delaware 3Other (AE, AP, --) 3
Page 75
River Lottery Applicant TreeMapWhere 2020 Lottery Applicants are From
Page 76
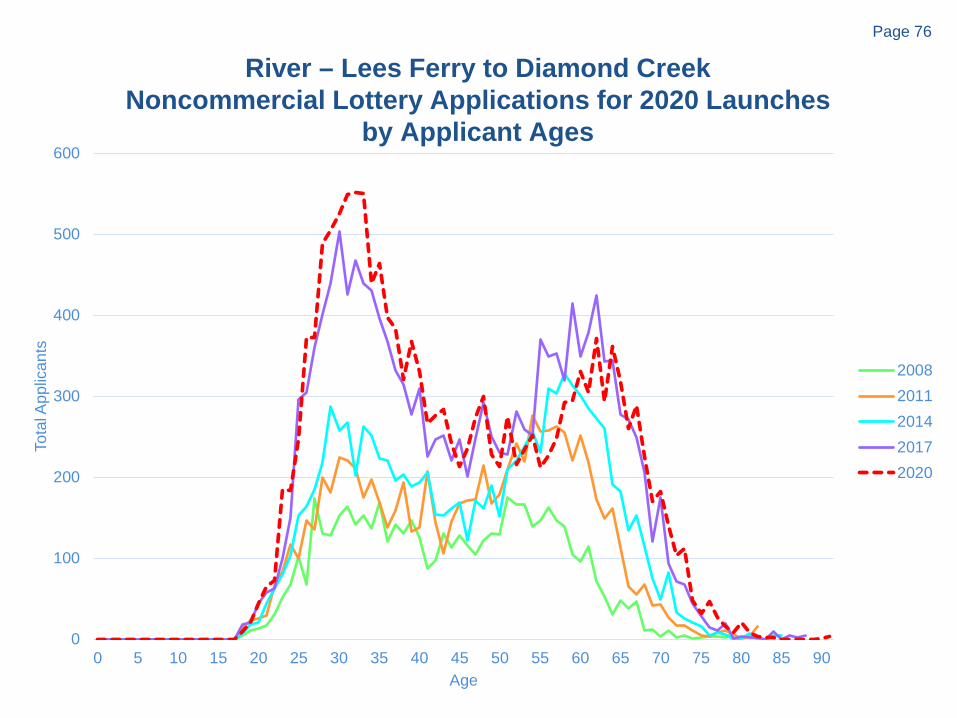
River – Lees Ferry to Diamond CreekNoncommercial Lottery Applications for 2020 Launches
by Applicant Ages
0
100
200
300
400
500
600
0 5 10 15 20 25 30 35 40 45 50 55 60 65 70 75 80 85 90
Tota
l App
lican
ts
Age
20082011201420172020
Page 77
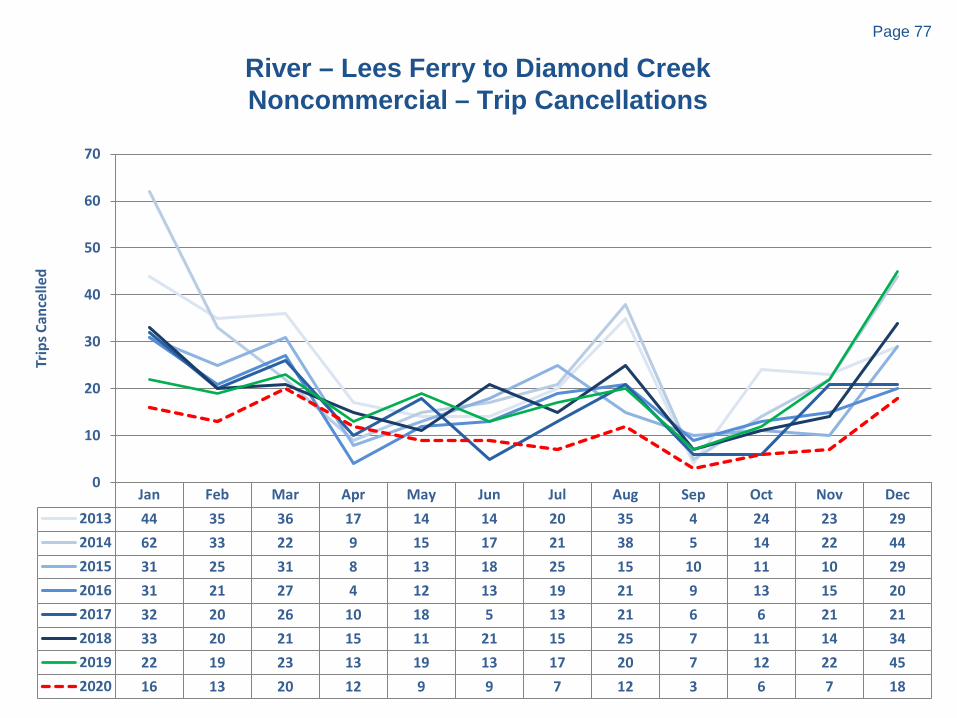
River – Lees Ferry to Diamond CreekNoncommercial – Trip Cancellations
Jan Feb Mar Apr May Jun Jul Aug Sep Oct Nov Dec2013 44 35 36 17 14 14 20 35 4 24 23 292014 62 33 22 9 15 17 21 38 5 14 22 442015 31 25 31 8 13 18 25 15 10 11 10 292016 31 21 27 4 12 13 19 21 9 13 15 202017 32 20 26 10 18 5 13 21 6 6 21 212018 33 20 21 15 11 21 15 25 7 11 14 342019 22 19 23 13 19 13 17 20 7 12 22 452020 16 13 20 12 9 9 7 12 3 6 7 18
0
10
20
30
40
50
60
70
Trip
s Can
celle
d
Page 78
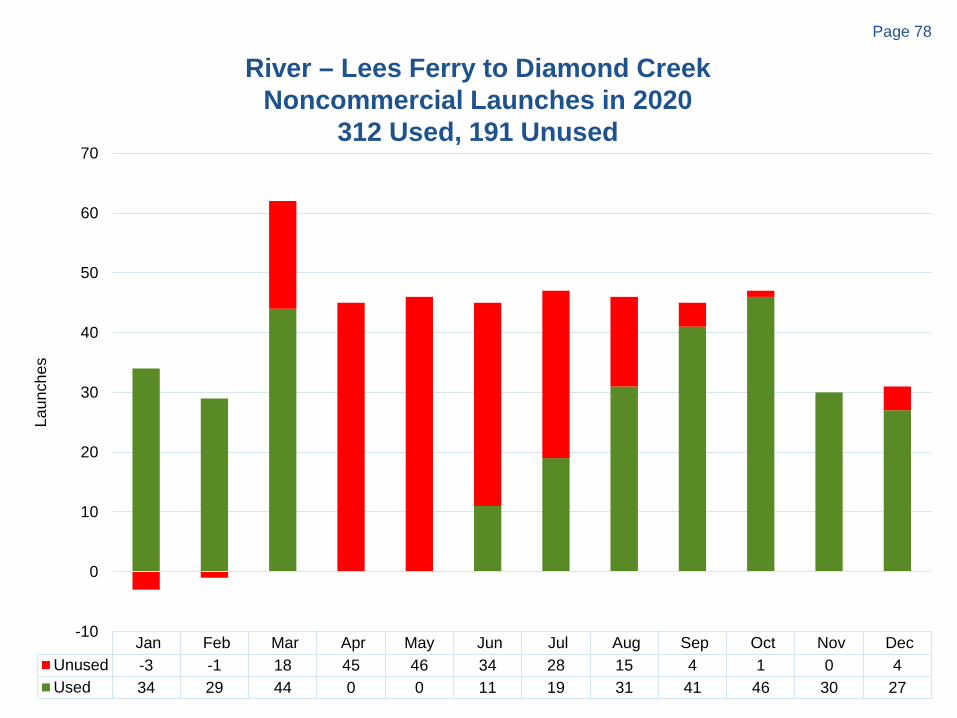
River – Lees Ferry to Diamond CreekNoncommercial Launches in 2020
312 Used, 191 Unused
Jan Feb Mar Apr May Jun Jul Aug Sep Oct Nov DecUnused -3 -1 18 45 46 34 28 15 4 1 0 4Used 34 29 44 0 0 11 19 31 41 46 30 27
-10
0
10
20
30
40
50
60
70
Laun
ches
Page 79
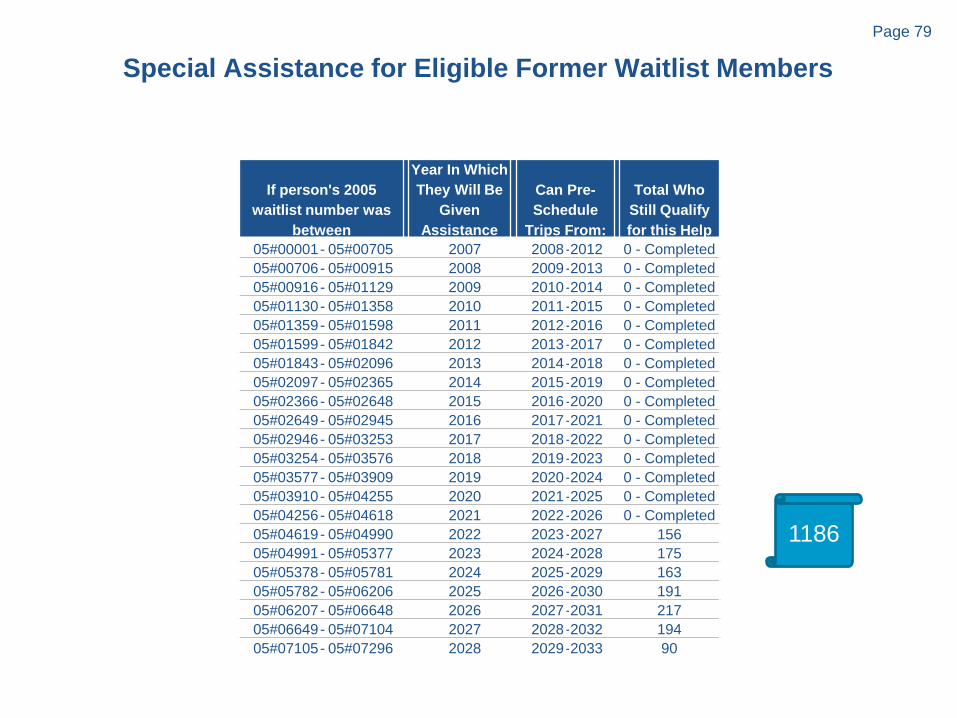
Special Assistance for Eligible Former Waitlist Members
If person's 2005 waitlist number was
between
Year In Which They Will Be
Given Assistance
Can Pre-Schedule
Trips From:
Total Who Still Qualify for this Help
05#00001- 05#00705 2007 2008-2012 0 - Completed05#00706- 05#00915 2008 2009-2013 0 - Completed05#00916- 05#01129 2009 2010-2014 0 - Completed05#01130- 05#01358 2010 2011-2015 0 - Completed05#01359- 05#01598 2011 2012-2016 0 - Completed05#01599- 05#01842 2012 2013-2017 0 - Completed05#01843- 05#02096 2013 2014-2018 0 - Completed05#02097- 05#02365 2014 2015-2019 0 - Completed05#02366- 05#02648 2015 2016-2020 0 - Completed05#02649- 05#02945 2016 2017-2021 0 - Completed05#02946- 05#03253 2017 2018-2022 0 - Completed05#03254- 05#03576 2018 2019-2023 0 - Completed05#03577- 05#03909 2019 2020-2024 0 - Completed05#03910- 05#04255 2020 2021-2025 0 - Completed05#04256- 05#04618 2021 2022-2026 0 - Completed05#04619- 05#04990 2022 2023-2027 15605#04991- 05#05377 2023 2024-2028 17505#05378- 05#05781 2024 2025-2029 16305#05782- 05#06206 2025 2026-2030 19105#06207- 05#06648 2026 2027-2031 21705#06649- 05#07104 2027 2028-2032 19405#07105- 05#07296 2028 2029-2033 90
1186
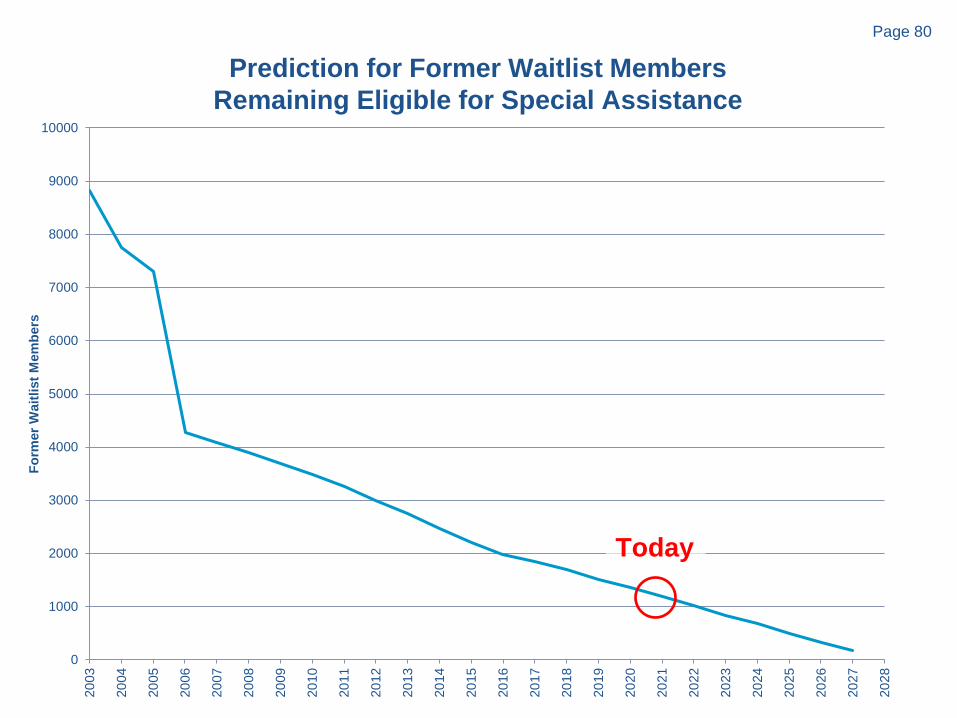
Page 80
Prediction for Former Waitlist MembersRemaining Eligible for Special Assistance
0
1000
2000
3000
4000
5000
6000
7000
8000
9000
10000
2003
2004
2005
2006
2007
2008
2009
2010
2011
2012
2013
2014
2015
2016
2017
2018
2019
2020
2021
2022
2023
2024
2025
2026
2027
2028
Form
er W
aitli
st M
embe
rs
Today
Page 81
River
Diamond Creek and Below
Page 82
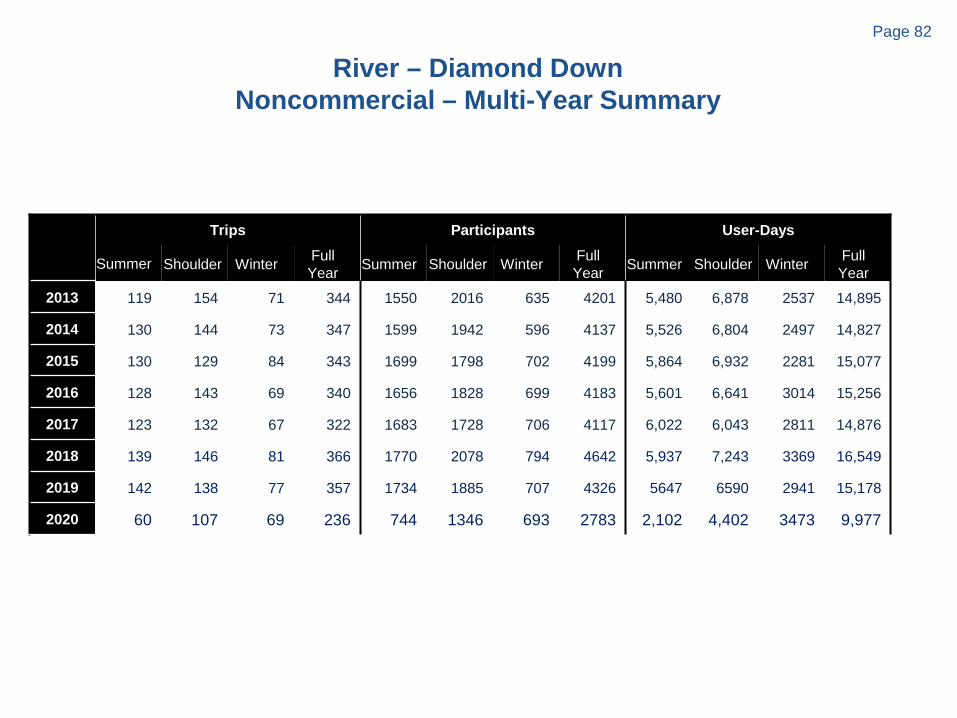
River – Diamond Down Noncommercial – Multi-Year Summary
Trips Participants User-Days
Summer Shoulder Winter Full Year Summer Shoulder Winter Full
Year Summer Shoulder Winter Full Year
2013 119 154 71 344 1550 2016 635 4201 5,480 6,878 2537 14,895
2014 130 144 73 347 1599 1942 596 4137 5,526 6,804 2497 14,827
2015 130 129 84 343 1699 1798 702 4199 5,864 6,932 2281 15,077
2016 128 143 69 340 1656 1828 699 4183 5,601 6,641 3014 15,256
2017 123 132 67 322 1683 1728 706 4117 6,022 6,043 2811 14,876
2018 139 146 81 366 1770 2078 794 4642 5,937 7,243 3369 16,549
2019 142 138 77 357 1734 1885 707 4326 5647 6590 2941 15,178
2020 60 107 69 236 744 1346 693 2783 2,102 4,402 3473 9,977
Page 83
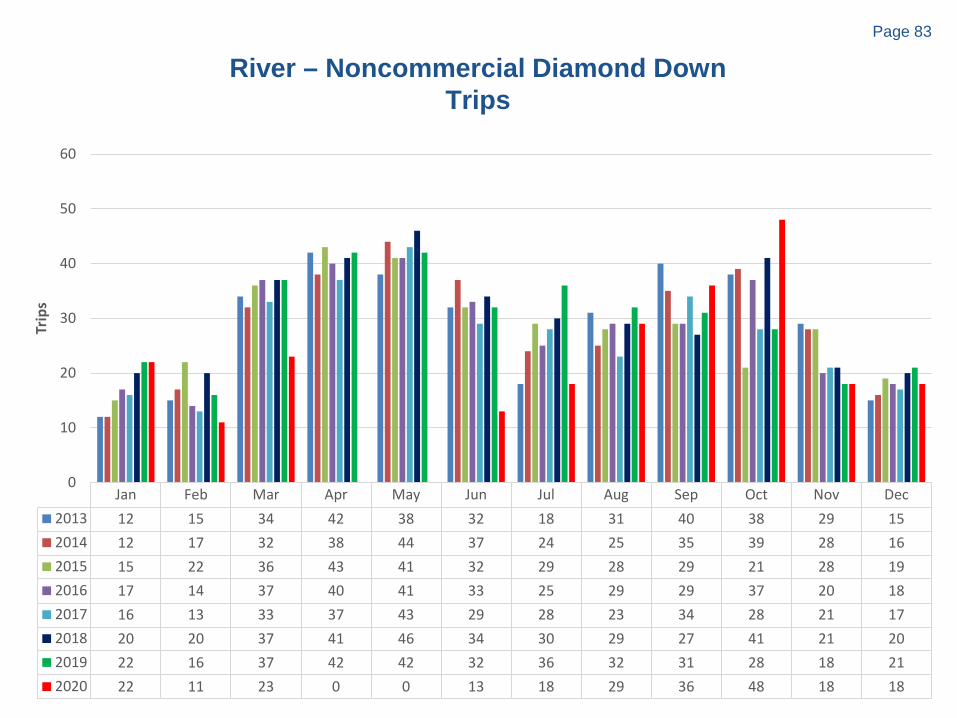
River – Noncommercial Diamond Down Trips
Jan Feb Mar Apr May Jun Jul Aug Sep Oct Nov Dec2013 12 15 34 42 38 32 18 31 40 38 29 152014 12 17 32 38 44 37 24 25 35 39 28 162015 15 22 36 43 41 32 29 28 29 21 28 192016 17 14 37 40 41 33 25 29 29 37 20 182017 16 13 33 37 43 29 28 23 34 28 21 172018 20 20 37 41 46 34 30 29 27 41 21 202019 22 16 37 42 42 32 36 32 31 28 18 212020 22 11 23 0 0 13 18 29 36 48 18 18
0
10
20
30
40
50
60
Trip
s
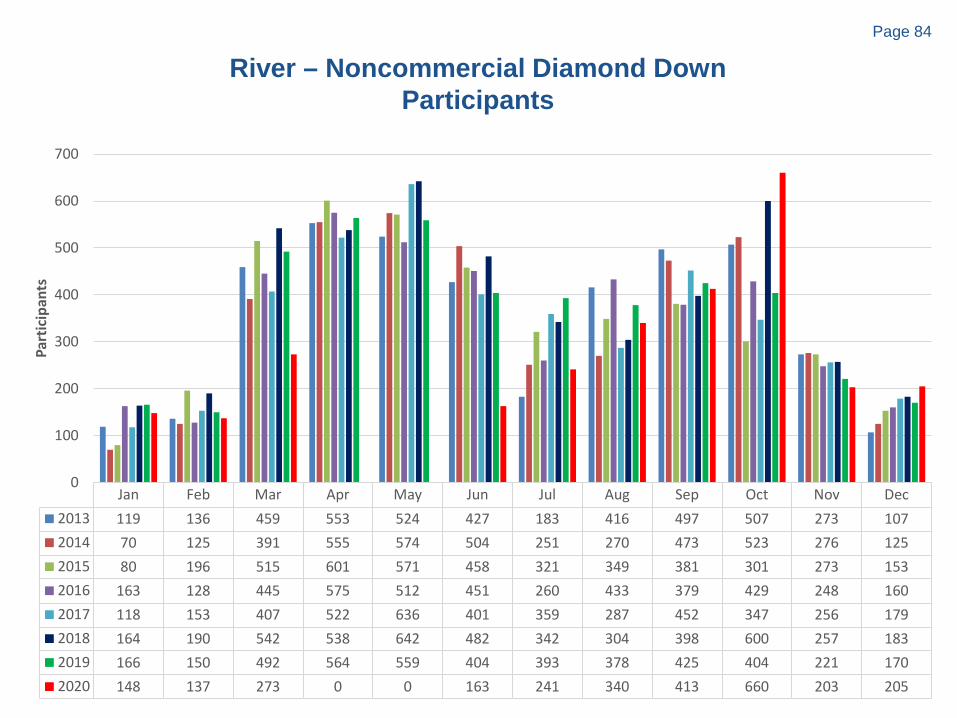
Page 84
River – Noncommercial Diamond Down Participants
Jan Feb Mar Apr May Jun Jul Aug Sep Oct Nov Dec2013 119 136 459 553 524 427 183 416 497 507 273 1072014 70 125 391 555 574 504 251 270 473 523 276 1252015 80 196 515 601 571 458 321 349 381 301 273 1532016 163 128 445 575 512 451 260 433 379 429 248 1602017 118 153 407 522 636 401 359 287 452 347 256 1792018 164 190 542 538 642 482 342 304 398 600 257 1832019 166 150 492 564 559 404 393 378 425 404 221 1702020 148 137 273 0 0 163 241 340 413 660 203 205
0
100
200
300
400
500
600
700
Part
icip
ants
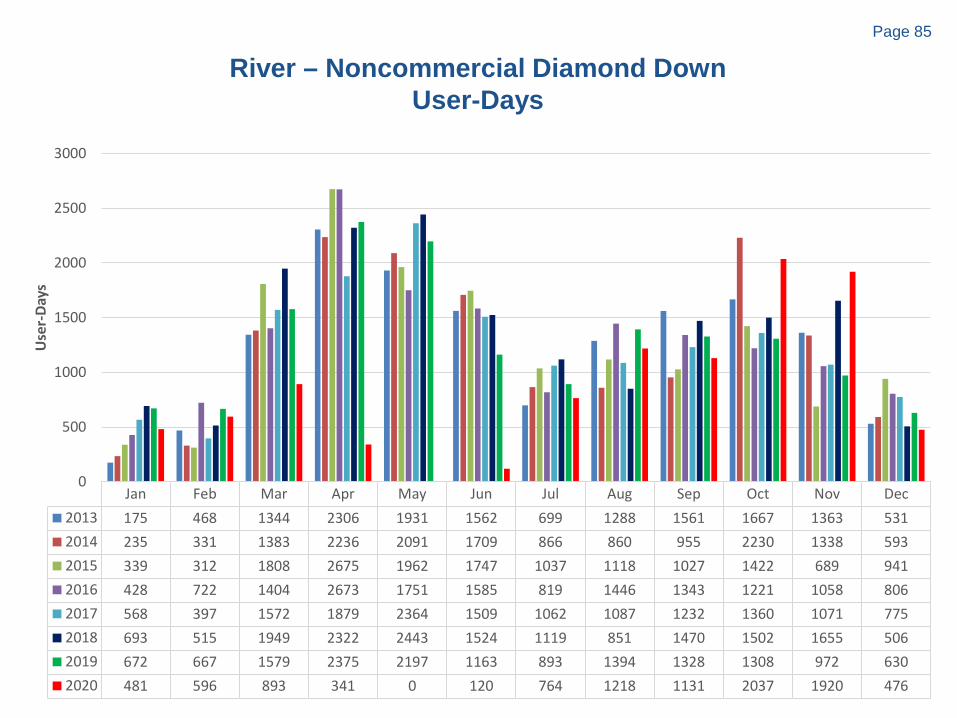
Page 85
River – Noncommercial Diamond Down User-Days
Jan Feb Mar Apr May Jun Jul Aug Sep Oct Nov Dec2013 175 468 1344 2306 1931 1562 699 1288 1561 1667 1363 5312014 235 331 1383 2236 2091 1709 866 860 955 2230 1338 5932015 339 312 1808 2675 1962 1747 1037 1118 1027 1422 689 9412016 428 722 1404 2673 1751 1585 819 1446 1343 1221 1058 8062017 568 397 1572 1879 2364 1509 1062 1087 1232 1360 1071 7752018 693 515 1949 2322 2443 1524 1119 851 1470 1502 1655 5062019 672 667 1579 2375 2197 1163 893 1394 1328 1308 972 6302020 481 596 893 341 0 120 764 1218 1131 2037 1920 476
0
500
1000
1500
2000
2500
3000
Use
r-Da
ys