Embed Size (px)
Citation preview
137
GRAINS RESEARCH AND DEVELOPMENT CORPORATION
Section 1: Entity overview and resources .............................................................. 139
1.1 Strategic direction statement ........................................................................ 139 1.2 Entity resource statement ............................................................................. 141 1.3 Budget measures .......................................................................................... 142
Section 2: Outcomes and planned performance ................................................... 142 2.1 Budgeted expenses and performance for Outcome 1 .................................. 142
Section 3: Budgeted financial statements .............................................................. 147
3.1 Budgeted financial statements...................................................................... 148


139
GRAINS RESEARCH AND DEVELOPMENT CORPORATION
Section 1: Entity overview and resources
1.1 STRATEGIC DIRECTION STATEMENT
The Grains Research and Development Corporation (GRDC) is a Commonwealth Corporate Entity established to invest in research and development (R&D) and related activities to benefit the Australian grains industry and the wider Australian community.
GRDC invests in research, development and extension (RD&E) activities across a portfolio spanning temperate and tropical cereals, coarse grains, pulses and oilseeds. This involves coordinating and funding the activities; monitoring, evaluating and reporting on their impact; and facilitating the dissemination, adoption and commercialisation of their results.
GRDC’s primary objective is to drive the discovery, development and delivery of world-class innovation to enhance the productivity, profitability and sustainability of Australian grain growers and benefit the industry and the wider community.
GRDC does not undertake R&D itself. Rather, it relies on other organisations that have the necessary capabilities to undertake the specialised work. As an investor in RD&E, GRDC often partners with co-funding organisations, many of which also provide RD&E services.
GRDC also contributes to the development of strategic national approaches to grains industry RD&E, to reduce fragmentation and duplication and to help address industry-wide issues such as biosecurity and climate variability.
While its focus is on delivering benefits to Australian grain growers, GRDC also generates outcomes from investing in RD&E that benefit other participants in the Australian grains industry value chain and the wider Australian community, as well as the research community in Australia and overseas.
Because effective delivery is critical to achieving benefits of R&D, GRDC undertakes activities to raise awareness of grains industry R&D and extend the results of GRDC-supported projects to grain growers and their advisers, other participants in rural industry and the wider community. Recognising different needs and preferences for receiving information, GRDC uses a range of products and channels, from phone apps to field days.

GRDC Budget Statements
140
GRDC works closely with Australian grain growers and the Australian Government to ensure that their RD&E priorities are effectively addressed through GRDC investments. GRDC also maintains strong connections with its other stakeholders, particularly in the R&D and agribusiness sectors.
Effective partnerships with other Australian organisations enable GRDC to leverage resources and research capability; share market knowledge, technologies and intellectual property; and reduce the risk associated with particular investments. GRDC also builds strong relationships with organisations overseas, both to broaden the resources available to the Australian grains industry and to access international RD&E efforts that offer potential benefits, such as food security, for Australia.
GRDC’s Strategic R&D Plan 2012–17 provides a template to ensure that GRDC will invest in RD&E in a sustainable manner, balancing long-term and short-term, high-risk and low-risk, and strategic and adaptive research needs, over the five years from July 2012 to June 2017.
The five-year strategy is informed by consultation with grain growers, representatives of government and research partners, and other relevant stakeholders. It embraces the principles, strategies and implementation plan set out in the Grains Industry National Research, Development and Extension Strategy and integrates them with the identified priorities of Australian grain growers and the Australian Government.
GRDC’s Strategic R&D Plan 2012–17 also takes into account the priorities of other cross-sectoral research strategies in areas with relevance to the grains industry – for example, climate change; water use in agriculture; and biofuels and bioenergy.
The outcomes of the Strategic R&D Plan 2012–17 are delivered through six investment themes – meeting market requirements, improving crop yield, protecting your crop, advancing profitable farming systems, improving your farm resource base and building skills and capacity – supported by five corporate strategies: Create value, Coordinate nationally, Deliver regionally, Connect globally and Engage with growers and industry. The Strategic R&D Plan sets out targets, intermediate outcomes and aspirational outcomes for each theme. These provide the framework for GRDC’s annual operational plans and the annual investment process through which GRDC refines its RD&E portfolio to respond to changes in the business environment and optimally address the priorities of its stakeholders.
GRDC Budget Statements
141
1.2 ENTITY RESOURCE STATEMENT
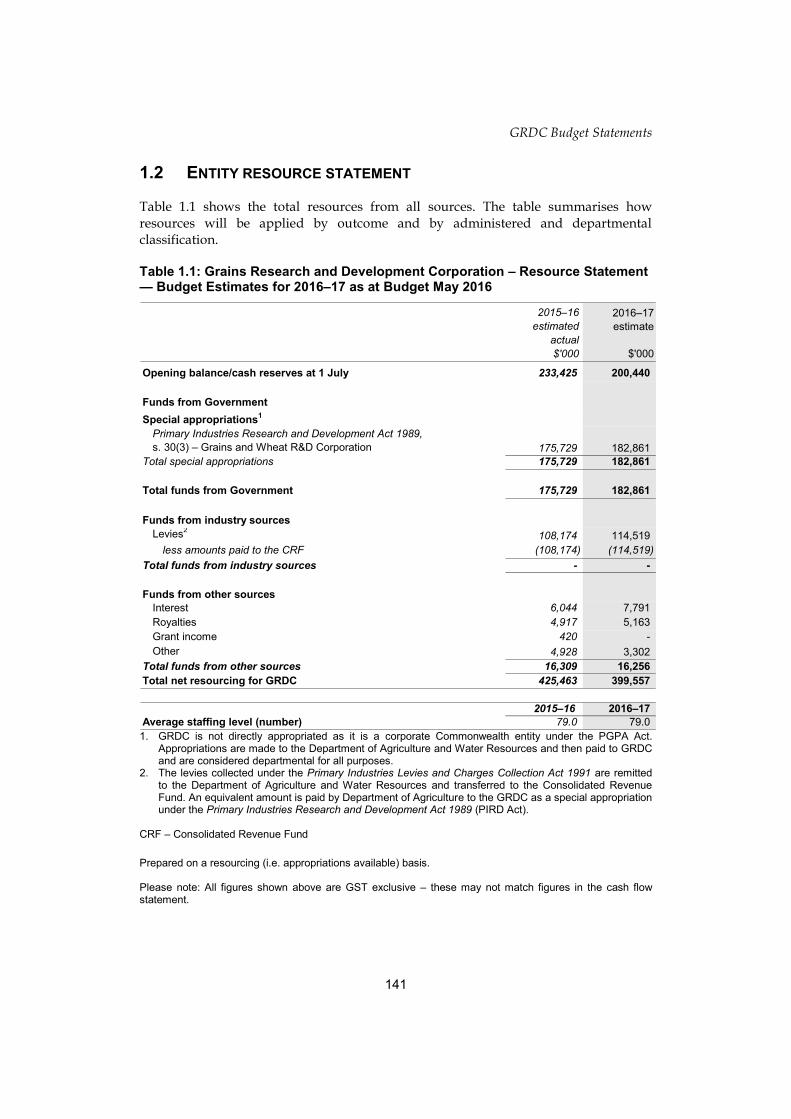
Table 1.1 shows the total resources from all sources. The table summarises how resources will be applied by outcome and by administered and departmental classification.
Table 1.1: Grains Research and Development Corporation – Resource Statement — Budget Estimates for 2016–17 as at Budget May 2016
2015–16
estimated
actual
$'000
2016–17
estimate
$'000
Opening balance/cash reserves at 1 July 233,425 200,440
Funds from Government
Special appropriations1
Primary Industries Research and Development Act 1989,
s. 30(3) – Grains and Wheat R&D Corporation 175,729 182,861
Total special appropriations 175,729 182,861
Total funds from Government 175,729 182,861
Funds from industry sources
Levies2
108,174 114,519
less amounts paid to the CRF (108,174) (114,519)
Total funds from industry sources - -
Funds from other sources
Interest 6,044 7,791
Royalties 4,917 5,163
Grant income 420 -
Other 4,928 3,302
Total funds from other sources 16,309 16,256
Total net resourcing for GRDC 425,463 399,557
2015–16 2016–17
Average staffing level (number) 79.0 79.0
1. GRDC is not directly appropriated as it is a corporate Commonwealth entity under the PGPA Act. Appropriations are made to the Department of Agriculture and Water Resources and then paid to GRDC and are considered departmental for all purposes. 2. The levies collected under the Primary Industries Levies and Charges Collection Act 1991 are remitted
to the Department of Agriculture and Water Resources and transferred to the Consolidated Revenue Fund. An equivalent amount is paid by Department of Agriculture to the GRDC as a special appropriation under the Primary Industries Research and Development Act 1989 (PIRD Act).
CRF – Consolidated Revenue Fund
Prepared on a resourcing (i.e. appropriations available) basis. Please note: All figures shown above are GST exclusive – these may not match figures in the cash flow statement.

GRDC Budget Statements
142
1.3 BUDGET MEASURES
GRDC does not have any 2016–17 Budget measures.
Section 2: Outcomes and planned performance
Government outcomes are the intended results, impacts or consequences of actions by the Government on the Australian community. Commonwealth programmes are the primary vehicle by which government entities achieve the intended results of their outcome statements. Entities are required to identify the programmes which contribute to government outcomes over the Budget and forward years.
Each outcome is described below together with its related programmes. The following provides detailed information on expenses for each outcome and programme, further broken down by funding source.
Note:
From 1 July 2015, performance reporting requirements in the Portfolio Budget
Statements sit alongside those required under the enhanced Commonwealth
performance framework. It is anticipated that the performance criteria described in
Portfolio Budget Statements will be read with broader information provided in an
entity’s corporate plans and annual performance statements – included in Annual
Reports from October 2016 – to provide an entity’s complete performance story.
2.1 BUDGETED EXPENSES AND PERFORMANCE FOR OUTCOME 1
Outcome 1: New information and products that enhance the productivity, competitiveness and environmental sustainability of Australian grain growers and benefit the industry and wider community, through planning, managing and implementing investments in grains research and development.

GRDC Budget Statements
143
Table 2.1.1: Budgeted expenses for Outcome 1
This table shows how much the entity intends to spend (on an accrual basis) on achieving the outcome, broken down by programme, as well as by Administered and Departmental funding sources.
2015–16
Estimated
actual
$'000
2016–17
Budget
$'000
2017–18
Forward
estimate
$'000
2018–19
Forward
estimate
$'000
2019–20
Forward
estimate
$'000
Revenue from Government
Special appropriations
Primary Industries Research and
Development Act 1989, s. 30(3) –
Grains and Wheat R&D Corporation 68,189 68,158 69,058 71,141 71,302
Revenues from industry sources 108,121 114,519 111,887 111,823 111,886
Revenues from other independent sources 23,088 17,411 19,107 18,167 17,940
Reserves 20,539 20,412 13,236 10,971 10,818
Total expenses for programme 1.1 219,937 220,500 213,288 212,102 211,946
Revenue from Government
Special appropriations 68,189 68,158 69,058 71,141 71,302
Revenues from industry sources 108,121 114,519 111,887 111,823 111,886
Revenues from other independent sources 23,088 17,411 19,107 18,167 17,940
Reserves 20,539 20,412 13,236 10,971 10,818
Total expenses for Outcome 1 219,937 220,500 213,288 212,102 211,946
2015–16 2016–17
Average staffing level (number) 79.0 79.0
Outcome 1 totals by resource type
Programme 1.1: Grains Research and Development Corporation
Outcome 1: New information and products that enhance the productivity, competitiveness and
environmental sustainability of Australian grain growers and benefit the industry and wider
community, through planning, managing and implementing investments in grains research and
development.

GRDC Budget Statements
144
Contributions to Outcome 1
2.1.2 Performance criteria for Outcome 1
Table 2.1.2 below details the performance criteria for each programme associated with Outcome 1. It also summarises how each programme is delivered and where 2016–17 Budget measures have created new programmes or materially changed existing programmes.
As an entity established under the PIRD Act, GRDC does not produce a Corporate Plan under the PGPA Act and is therefore exempt from the requirement to map purposes to outcomes.
Outcome 1: New information and products that enhance the productivity, competitiveness and environmental sustainability of Australian grain growers and benefit the industry and wider community, through planning, managing and implementing investments in grains research and development.
Programme 1.1: Grains Research and Development Corporation
Objective Drive the discovery, development and delivery of world-class innovation to enhance the productivity, profitability and sustainability of Australian grain growers and benefit the industry and the wider community.
Delivery Outcome 1 will be delivered through six RD&E investment themes set out in the GRDC Strategic R&D Plan 2012–17. The target group is primarily Australian grain growers but the grains industry value chain also includes Governments, industry groups, rural and regional communities, research organisations and the wider community.
Performance information
Year Performance criteria1 Targets
2015–16 Australian Export Grains Innovation Centre (AEGIC) joint venture is established and operating appropriately.
Required market information available.
Growers are interested in the benefits of measuring grain quality to meet customer requirements.
90 per cent of growers.
Growers storing grain on-farm use sealed silos to meet market requirements and provide for the continued effectiveness of pest control measures.
70 per cent

GRDC Budget Statements
145
Performance information (continued)
Year Performance criteria1 Targets
2015–16 New cereal, pulse and oilseed varieties have minimum increases in genetic yield potential per annum as measured in National Variety Trials (NVT).
Cereals 1 per cent
Pulses 2 per cent
Oilseeds 1.5 per cent.
New varieties currently available meet the expectations of growers.
60 per cent
Growers and advisers use NVT data in selection of varieties to plant.
35 per cent access data of which 90 per cent consider helpful.
Growers and advisers are aware of and use integrated weed, pest or disease management practices.
70 per cent aware, 50 per cent use.
Growers undertake on-farm practices to maintain or improve their biosecurity.
40 per cent
Growers place a high importance on the use of decision tools to assist them with strategic or tactical decision-making.
70 per cent
Growers have a whole-farm business plan which takes account of strategic opportunities, constraints and risks.
25 per cent
Growers consider the potential effects of climate change on their farm business when making long-term decisions.
55 per cent
Growers undertake activities to improve the condition and productive capacity of their soils.
70 per cent
Growers use nutrient budgeting to better match application with anticipated crop needs.
60 per cent
Each year Nuffield scholars include people from the grains industry.
At least three.
Growers and advisers undertake at least one activity each year to learn more about opportunities to improve farm profit or sustainability.
75 per cent

GRDC Budget Statements
146
Performance information (continued)
Year Performance criteria1 Targets
2016–17 As per 2015–16, except for minor changes to these four performance criteria’s in regards to their targets.
As per 2015–16, except for minor changes to these four performance criteria’s in regards to their targets.
Growers and advisers use NVT data in selection of varieties to plant.
40 per cent access data of which 90 per cent consider helpful
Growers undertake on-farm practices to maintain or improve their biosecurity.
50 per cent
Growers consider the potential effects of climate change on their farm business when making long-term decisions.
60 per cent
Growers use nutrient budgeting to better match application with anticipated crop needs.
65 per cent
2017–18 and beyond
See footnote2 See footnote
2
1. New or modified performance criteria that reflect new or materially changed programmes are shown in italics.
2. No performance measures have been developed for forward years 2017–18 and beyond. These will be the first years of a new five-year strategic plan for 2017–2022. All current performance measures that are extended to 2017–18 will maintain ongoing programme targets.

GRDC Budget Statements
147
Section 3: Budgeted financial statements
Section 3 presents budgeted financial statements that provide a comprehensive
snapshot of entity finances for the 2016–17 budget year, including the impact of budget
measures and resourcing on financial statements.
3.1 BUDGETED FINANCIAL STATEMENTS
3.1.1 Differences between entity resourcing and financial statements
The financial statements are prepared on an accrual basis where revenues and
expenses are recognised as and when the resources are received and used. The entities
resourcing table recognises cash resources available to be used during the period and
includes amounts recognised as revenue in previous periods.
3.1.2 Explanatory notes and analysis of budgeted financial statements
GRDC’s revenue is primarily from industry contributions in the form of levies paid on the farm gate value of grain sold and Australian Government contributions which are determined at 0.5 per cent of the three year rolling average of gross value of production (GVP). GRDC’s revenue streams are therefore subject to the volatility of local and international grain commodity markets, farm gate costs, and the marketing decisions of growers. This means the assumptions in developing financial forecasts have a high degree of uncertainty and change frequently.
In 2016–17, GRDC is budgeting for an operating deficit of $20.4 million which will be funded from its own accumulated reserves. Industry contributions are expected to increase by $6.4 million due to an increase in production and prices. Australian Government contributions are expected to remain in line with 2015–16 and own source income is expected to decrease by $5.7 million due to the recognition of a profit on sale of shares in 2015–16. Supplier expenses are expected to remain in line with 2015–16.
The budgeted net asset position for 2016–17 is $150.2 million which is $20.4 million less than the estimated actual for 2015–16. This decrease is due to the budgeted operating deficit for 2016–17.

GRDC Budget Statements
148
3.2.3 BUDGETED FINANCIAL STATEMENTS TABLES
Table 3.1 Comprehensive income statement (showing net cost of services) (for the period ended 30 June)
2015–16
Estimated
actual
$'000
2016–17
Budget
$'000
2017–18
Forward
estimate
$'000
2018–19
Forward
estimate
$'000
2019–20
Forward
estimate
$'000
EXPENSES
Employee benefits 11,199 11,500 11,903 12,319 12,750
Supplier expenses 207,768 207,595 199,999 198,415 197,847
Depreciation and amortisation 970 1,405 1,386 1,368 1,349
Total expenses 219,937 220,500 213,288 212,102 211,946
LESS:
OWN-SOURCE INCOME
Own-source revenue
Interest 6,044 7,791 9,085 9,011 8,368
Grant income 1,575 1,155 1,154 - -
Royalties 4,917 5,163 5,550 5,966 6,414
Other 10,552 3,302 3,318 3,190 3,158
Total own-source revenue 23,088 17,411 19,107 18,167 17,940
Total own-source income 23,088 17,411 19,107 18,167 17,940
Net cost of (contribution by) services 196,849 203,089 194,181 193,935 194,006
Revenue from Government1
Commonwealth contributions 68,189 68,158 69,058 71,141 71,302
Industry contributions 108,121 114,519 111,887 111,823 111,886
Total revenue from Government 176,310 182,677 180,945 182,964 183,188
Surplus/(deficit) attributable to the
Australian Government (20,539) (20,412) (13,236) (10,971) (10,818)
Total comprehensive income (loss) (20,539) (20,412) (13,236) (10,971) (10,818)
Total comprehensive income/(loss)
attributable to the Australian Government (20,539) (20,412) (13,236) (10,971) (10,818) 1. Revenue from Government includes a Commonwealth contribution under the PIRD Act and levies
collected from industry by the Department of Agriculture and Water Resources for R&D activities. Prepared on Australian Accounting Standards basis.

GRDC Budget Statements
149
Table 3.2: Budgeted departmental balance sheet (as at 30 June) 2015–16
Estimated
actual
$'000
2016–17
Budget
$'000
2017–18
Forward
estimate
$'000
2018–19
Forward
estimate
$'000
2019–20
Forward
estimate
$'000
ASSETS
Financial assets
Cash and cash equivalents 13,549 18,445 11,240 8,361 9,159
Trade and other receivables 26,374 26,190 27,114 28,521 27,121
Investments 189,891 162,891 152,891 142,891 132,891
Other investments 5,353 5,353 5,353 5,353 5,353
Total financial assets 235,167 212,879 196,598 185,126 174,524
Non-financial assets
Land and buildings 7,168 6,661 6,154 5,647 5,140
Property, plant and equipment 742 969 1,102 1,201 1,276
Intangibles 3,249 2,874 2,562 2,302 2,085
Other non-financial assets 2,200 2,200 2,200 2,200 2,200
Total non-financial assets 13,359 12,704 12,018 11,350 10,701
Total assets 248,526 225,583 208,616 196,476 185,225
LIABILITIES
Payables
Suppliers 71,670 70,423 67,974 66,934 66,451
Unearned income 2,309 1,154 - - -
Total payables 73,979 71,577 67,974 66,934 66,451
Provisions
Employee provisions 2,000 2,050 2,100 2,150 2,200
Other provisions 1,941 1,762 1,584 1,405 1,405
Total provisions 3,941 3,812 3,684 3,555 3,605
Total liabilities 77,920 75,389 71,658 70,489 70,056
Net assets 170,606 150,194 136,958 125,987 115,169
EQUITY*
Reserves 111,474 107,074 105,974 105,424 105,424
Retained earnings 59,132 43,120 30,984 20,563 9,745
Total Equity 170,606 150,194 136,958 125,987 115,169 * 'Equity' is the residual interest in assets after deduction of liabilities. Prepared on Australian Accounting Standards basis.

GRDC Budget Statements
150
Table 3.3: Departmental statement of changes in equity — summary of movement (budget year 2016–17)
Retained
earnings
$'000
Revaluation
Asset
Reserve
$'000
Other
reserves
$'000
Total
equity
$'000
Opening balance as at 1 July 2016
Balance carried forward from previous period 59,132 2,574 108,900 170,606
Adjusted opening balance 59,132 2,574 108,900 170,606
Comprehensive income
Surplus (deficit) for the period (20,412) - - (20,412)
Total comprehensive income (20,412) - - (20,412)
of which:
Attributable to the Australian Government (20,412) - - (20,412)
Transfers between equity components 4,400 - (4,400) -
Estimated closing balance as at 30 June 2017 43,120 2,574 104,500 150,194
Closing balance attributable to the Australian
Government 43,120 2,574 104,500 150,194 Prepared on Australian Accounting Standards basis.

GRDC Budget Statements
151
Table 3.4: Budgeted departmental statement of cash flows (for the period ended 30 June)
2015–16
Estimated
actual
$'000
2016–17
Budget
$'000
2017–18
Forward
estimate
$'000
2018–19
Forward
estimate
$'000
2019–20
Forward
estimate
$'000
OPERATING ACTIVITIES
Cash received
Industry contributions 108,174 114,519 111,887 111,823 111,886
Revenue from Government 67,555 68,342 68,135 69,734 72,702
Interest 6,044 7,791 9,085 9,011 8,368
Grant income 420 - - - -
Net GST received 20,777 20,760 20,000 19,842 19,785
Other 9,845 8,465 8,868 9,156 9,572
Total cash received 212,815 219,877 217,975 219,566 222,313
Cash used
Employees 11,361 11,450 11,853 12,269 12,700
Suppliers 236,333 229,781 222,627 219,476 218,115
Total cash used 247,694 241,231 234,480 231,745 230,815
Net cash from (used by)
operating activities (34,879) (21,354) (16,505) (12,179) (8,502)
INVESTING ACTIVITIES
Cash received
Investments 52,984 70,000 50,000 50,000 50,000
Total cash received 52,984 70,000 50,000 50,000 50,000
Cash used
Purchase of property, plant and
equipment 3,090 750 700 700 700
Investments 84,000 43,000 40,000 40,000 40,000
Total cash used 87,090 43,750 40,700 40,700 40,700
Net cash from (used by) investing
activities (34,106) 26,250 9,300 9,300 9,300
Net increase (decrease) in cash held (68,985) 4,896 (7,205) (2,879) 798
Cash and cash equivalents at the
beginning of the reporting period 82,534 13,549 18,445 11,240 8,361
Cash and cash equivalents at the end
of the reporting period 13,549 18,445 11,240 8,361 9,159 Prepared on Australian Accounting Standards basis.

GRDC Budget Statements
152
Table 3.5: Departmental capital budget statement 2015–16
Estimated
actual
$'000
2016–17
Budget
$'000
2017–18
Forward
estimate
$'000
2018–19
Forward
estimate
$'000
2019–20
Forward
estimate
$'000
PURCHASE OF NON-FINANCIAL
ASSETS
Funded internally from departmental
resources1
3,090 750 700 700 700
TOTAL 3,090 750 700 700 700
RECONCILIATION OF CASH USED TO
ACQUIRE ASSETS TO ASSET
MOVEMENT TABLE
Total purchases 3,090 750 700 700 700
Total cash used to acquire assets 3,090 750 700 700 700 1. Includes the following source of funding:
– internally developed assets. Consistent with information contained in the Statement of Asset Movements and the Budgeted Statement of Cash Flows.
Table 3.2.6: Statement of asset movements (Budget year 2016–17)
Land
$'000
Buildings
$'000
Other
property,
plant and
equipment
$'000
Intangibles
$'000
Total
$'000
As at 1 July 2016
Gross book value 742 7,131 1,103 5,157 14,133
Accumulated depreciation/amortisation
and impairment - (705) (361) (1,908) (2,974)
Opening net book balance 742 6,426 742 3,249 11,159
CAPITAL ASSET ADDITIONS
Estimated expenditure on new or
replacement assets
By purchase – other - - 550 200 750
Total additions - - 550 200 750
Other movements
Depreciation/amortisation expense - (507) (323) (575) (1,405)
Total other movements - (507) (323) (575) (1,405)
As at 30 June 2017
Gross book value 742 7,131 1,653 5,357 14,883
Accumulated depreciation/amortisation
Accumulated and impairment - (1,212) (684) (2,483) (4,379)
Closing net book balance 742 5,919 969 2,874 10,504
Prepared on Australian Accounting Standards basis.