Embed Size (px)
Citation preview
J O U R N A L OF M A T E R I A L S S C I E N C E 17 ( 1 9 8 2 ) 2 2 8 9 - 2 2 9 7
Grain-boundary segregation in aluminium-doped silicon carbide
Y O T A J I M A * , W . D. K I N G E R Y Ceramics Division, Department of Materials Science and Engineering, Massachusetts Institute of Technology, Cambridge, Massachusetts 02139, USA
Scanning transmission electron microscopy (STEM) was used to examine sintered and hot-pressed aluminium-doped silicon carbide. Grain-boundary segregation of AI was observed in both materials. Semi-quantitative analysis was carried out on the AI-saturated hot-pressed material. An estimated heat of segregation between 116 and 174 kJ mol -I was calculated from the STEM data and equilibrium segregation theory. Strain energy as a driving force was considered negligible. The data are consistent with a segregation model in which the driving force for segregation is the difference in the nature of bonding between the solute and solvent atoms. Fast grain-boundary diffusion of AI was suggested from a loss of AI during heat treatments.
1. Introduction Silicon carbide is a promising material for a variety of high-temperature structural applications. It has been shown that either/3- or s-SiC can be densified to near theoretical density with the addition of boron [1-3] or aluminium [4] together with excess carbon. Grain boundary and surface segre- gation phenomena may play important roles in determining effects of these dopants on densifi- cation and on high-temperature properties. Coblenz [5] has observed surface segregation of B in B-doped /3-SIC by Auger electron spectroscopy (AES) and supported an earlier postulate that the effect of B is to inhibit coarsening by surface diffusion [6, 7].
There have been few reports on segregation in covalent materials, in contrast with the number of reports in metal and ionic systems. It may be expected that, due to directional covalent bonding, the segregation mechanism is different in the SiC system from other systems. The present study reports examination of Al-doped SiC by scanning transmission electron microscopy (STEM).
2. Experimental procedure 2.1. Sample preparation Two kinds of materials were used in this study:
*Present address: NGK Spark Plug Co., Ltd, 2808 Iwasaki, Komaki, Aichi 485, Japan.
0022--2461/82/082289--091;03.58/0 �9 1982 Chapman and Hall Ltd.
sintered and hot-pressed s-SiC. The sintered sample was supplied by Dr H. Hausner, Technische Universit~it Berlin, West Germany, and details of the sintering procedures have been published [4]. The starting composition was 96.9 wt% SiC, 1.1 wt% At and 2 wt% C, and the starting materials were sintered at 2100~ for 20min under an Ar atmosphere. The hot-pressed a-SiC was manu- factured by Electroschmertzwerk Kempten, West Germany was made from fine s-SiC particles, hot- pressed at 2100~ in graphite under pressure of about 40 MPa with the addition of 1.5 wt% A1.
Samples were sliced-off the bulk to a thickness of about 1 mm (thinner in some cases) with a thin diamond cutting wheel. They were given various heat treatments in a carbon tube resistance furnace. At the end of each heat treatment the furnace power was turned off; the initial cooling rate was approximately 100 ~ C rain -1 .
Heat-treated and as-received samples were mechanically thinned by grinding with 6/1m diamond paste (sometimes they were sliced to a half thickness with a diamond wheel before grinding) to a thickness of 40 to 80/~m. Care was taken to ensure that the ground specimens rep- resented bulk regions; i.e., taken from regions away from the surfaces. They were then further
2289
thinned by an ion micromilling instrument* with argon ions accelerated through a potential of 6 to 10 kV until perforation was observed. A tilt angle of 20 to 30 ~ was used. The thinning rate depended on such factors as accelerating voltage, ion current and angle of incidence, and in most cases it was in the range 3 to 5/am h-1 gun-1.
2.2. STEM analysis The samples were observed and X-ray microanalysis was carried out in a scanning transmisson electron microscope t (STEM). This instrument, equipped with a detector; for energy dispersive X-ray analysis (EDAX), is sometimes referred to as a "dedicated" STEM or analytical electron microscope (AEM), and its design and modes of operation have been described in [8].
For analysis, the specimens were held in a graphite-nosed cartridge which allowed translation and tilting and which did not contribute spurious X-rays to the signal. The probe diameter and current were approximately 2.5 nm and approxi- mately 10 -8 A at an accelerating voltage of 100 kV. The analysis was performed by orienting the grain boundaries parallel to the electron beam and then manually stepping the probe along a line perpen- dicular to the boundary. A count time varied from spot to spot such that a sum of A1 and Si X-ray counts exceeds 10 000 counts. During the analysis, the boundary was examined to ensure that no specimen drift occurred; when such a drift occur- red it was kept to a minimum (less than 2.0 nm) by moving the boundary back to the original pos- ition.
For most of the analyses, a standard X-ray detector was used, which is limited to the detec- tion of elements of atomic number, Z ~> 9. An ultra-thin-window X-ray detector w , which is capable of detecting lighter elements down to carbon, has very recently become available, and it was used for a few analyses.
After collection, a computer-generated semi- empirical background was subtracted from the spectrum. A1 and Si peak intensities were then determined by fitting the energy locations and peak shapes of observed X-ray lines to Gaussian curves to minimize the error due to the overlap of two peaks.
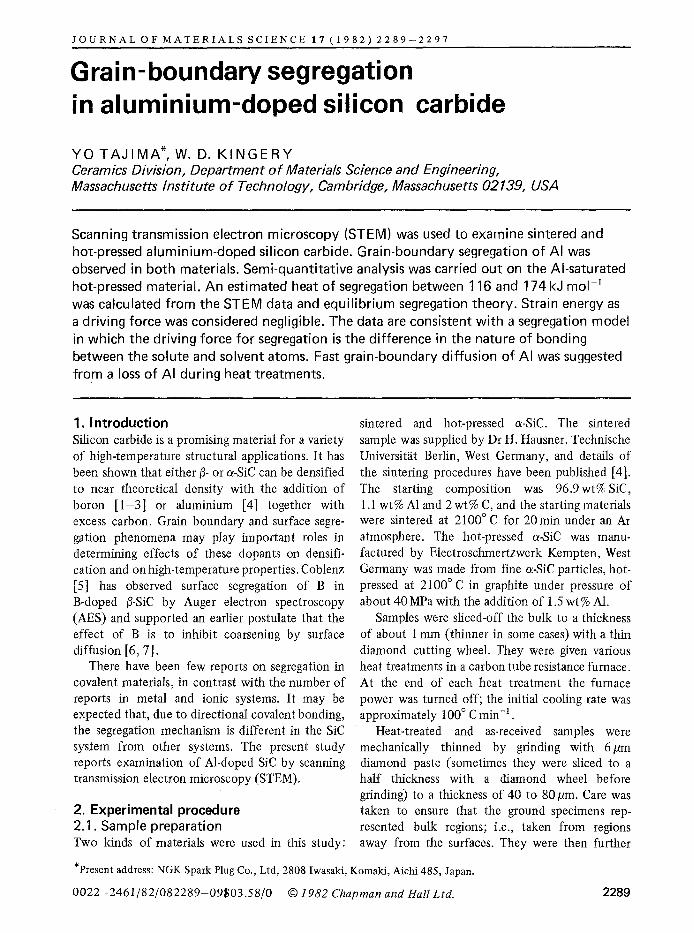
3. Results 3.1. Sintered SiC STEM observations on the sintered samples revealed ~everal features which are described below. In rare cases second phases were observed at three and four grain junctions. X-ray spectra taken at these second phases show that Fe is the major impurity present along with small amounts of other transition metals. These impurities were probably picked up during the milling process. Occasionally thin films were observed in porous regions. They were determined to be graphite from selected-area diffraction (SAD) patterns. An example of them, bright-field and annular dark- field images, is shown in Fig. 1. Since 2wt% of excess carbon was added prior to sintering, it is not surprising to find residual graphite. Major defects observed were stacking faults.
The only elements detected by EDAX in the bulk and at grain boundaries were Si and A1. X-ray intensities in bulk (and sometimes at grain bound- aries) were low, near or below the detection limit. X-ray microanalysis across a grain boundary of as-sintered samples showed an enhancement of A1 concentration at the grain boundary. Since there was no indication of grain-boundary phase when observed at a magnification of 500 000 times, this enhancement is believed to be a solute segregation at grain boundary. It was found, however, that after several as-sintered specimens were examined, some did not show any segregation of A1 at grain boundaries while others did. This was due to inhomogeneous distribution of AI in the sample: less A1 in the outer regions than in the central regions. It was indeed found that when the STEM specimen was prepared from the outer region of the disc, no A1 segregation was observed; i.e. A1 X-ray signals both at grain boundaries and in the bulk were below the detection limit. Due to these inhomogeneities, only qualitative analyses were carried out on this material.
Thin sliced specimens (of thickness about 150/am) were annealed at lower temperatures, 1350 ~ C and 1500 ~ C, for 1 to 10 h to examine the effect of temperature on the segregation. A1 segregation was observed in all samples although amounts of segregation varied from specimen to specimen, and no distinct correlation between the
*IMMI, Commonwealth Scientific Corp., Alexandria, Virginia, USA. tVG HB5, Vacuum Generators Microscopes Ltd, East Grinstead, UK. SKevex Corp., Foster City, California, USA. w UTW6, Kevex Corp., Foster City, California, USA.
2290
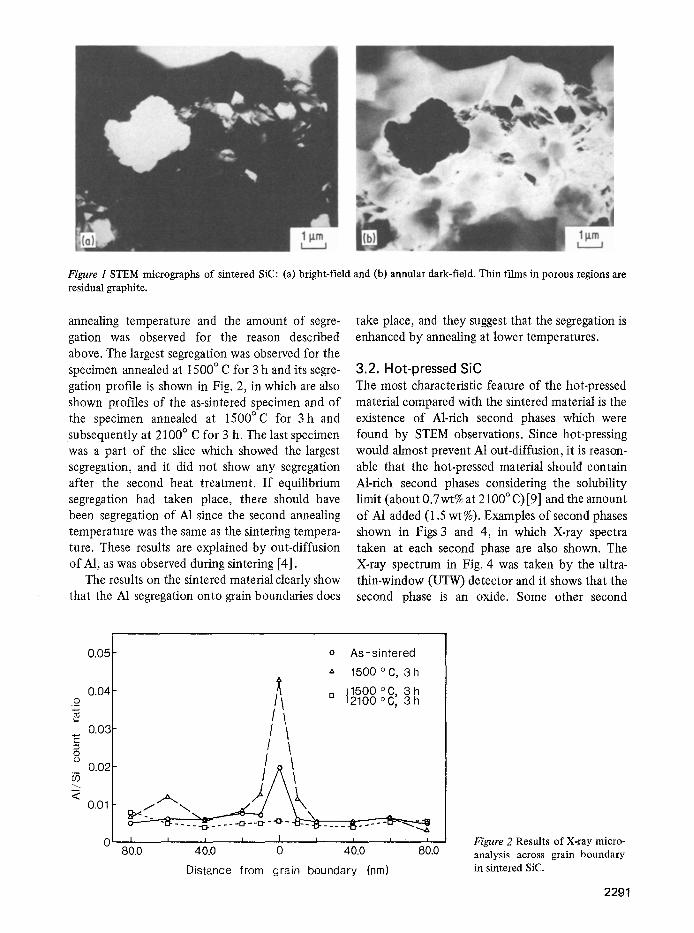
Figure 1 STEM micrographs of sintered SiC: (a) bright-field and (b) annular dark-field. Thin films in porous regions are residual graphite.
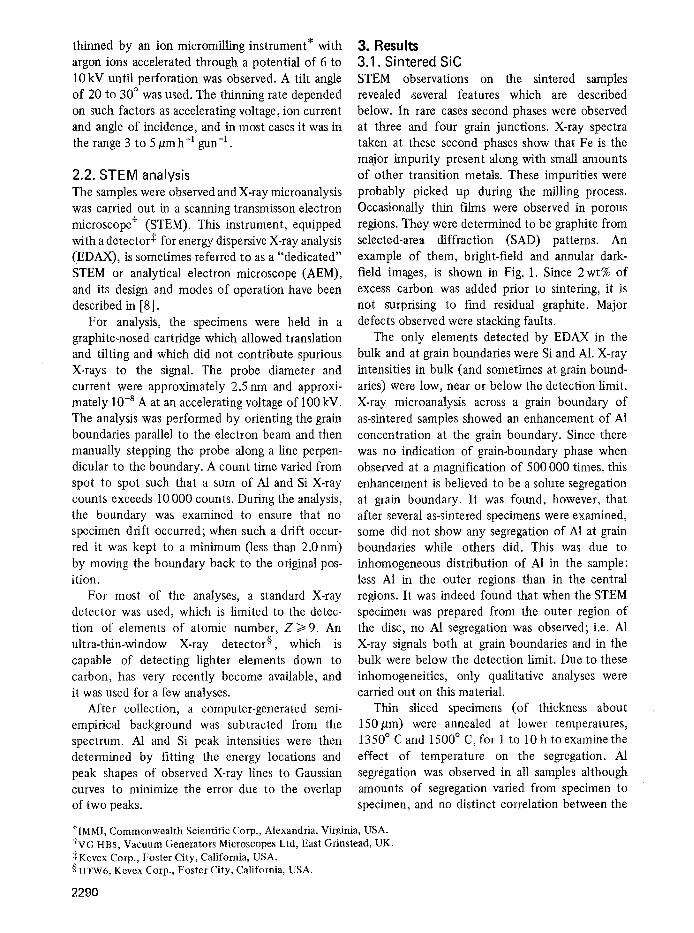
annealing temperature and the amount of segre- gation was observed for the reason described above. The largest segregation was observed for the specimen annealed at 1500 ~ C for 3 h and its segre- gation profile is shown in Fig. 2, in which are also shown profiles of the as-sintered specimen and of the specimen annealed at 1500~ for 3h and subsequently at 2100 ~ C for 3 h. The last specimen was a part of the slice which showed the largest segregation, and it did not show any segregation after the second heat treatment. If equilibrium segregation had taken place, there should have been segregation of AI since the second annealing temperature was the same as the sintering tempera- ture. These results are explained by out-diffusion of A1, as was observed during sintering [4].
The results on the sintered material clearly show that the A1 segregation onto grain boundaries does
take place, and they suggest that the segregation is enhanced by annealing at lower temperatures.
3.2. Hot-pressed SiC
The most characteristic feature of the hot-pressed material compared with the sintered material is the existence of Al-rich second phases which were found by STEM observations. Since hot-pressing would almost prevent A1 out-diffusion, it is reason- able that the hot-pressed material should contain Al-rich second phases considering the solubility limit (about 0.7 wt% at 2100 ~ C) [9] and the amount of A1 added (1.5 wt%). Examples of second phases shown in Figs 3 and 4, in which X-ray spectra taken at each second phase are also shown. The X-ray spectrum in Fig. 4 was taken by the ultra- thin-window (UTW) detector and it shows that the second phase is an oxide. Some other second
0
E 0 0
b5 m <
0.05
0.04
0.03
0.02
0.01
o As-sintered
a 1500~ 3h
j 1500 o C 0 '2100 ~ 3h
/ /
/
I I I I I I I I L
80.0 40.0 0 40.0 80.0
Distance from grain boundary (nm)
Figure 2 Results of X-ray micro- analysis across grain boundary in sintered SiC.
2291
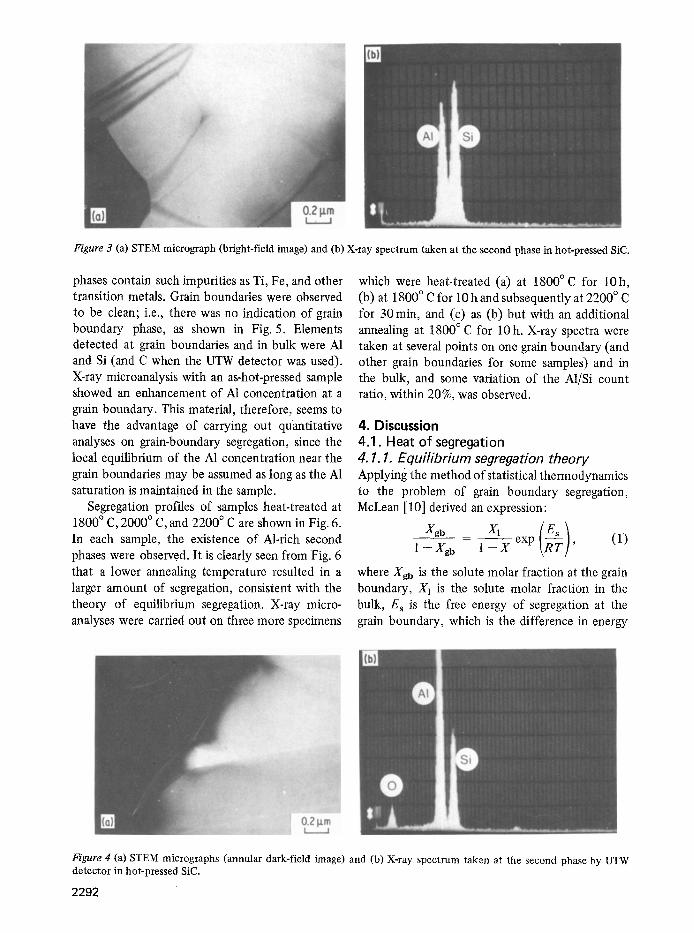
Figure 3 (a) STEM micrograph (bright-field image) and (b) X-ray spectrum taken at the second phase in hot-pressed SiC.
phases contain such impurities as Ti, Fe, and other transition metals. Grain boundaries were observed to be clean; i.e., there was no indication of grain boundary phase, as shown in Fig. 5. Elements detected at grain boundaries and in bulk were A1 and Si (and C when the UTW detector was used). X-ray microanalysis with an as-hot-pressed sample showed an enhancement of A1 concentration at a grain boundary. This material, therefore, seems to have the advantage of carrying out quantitative analyses on grain-boundary segregation, since the local equilibrium of the A1 concentration near the grain boundaries may be assumed as long as the A1 saturation is maintained in the sample.
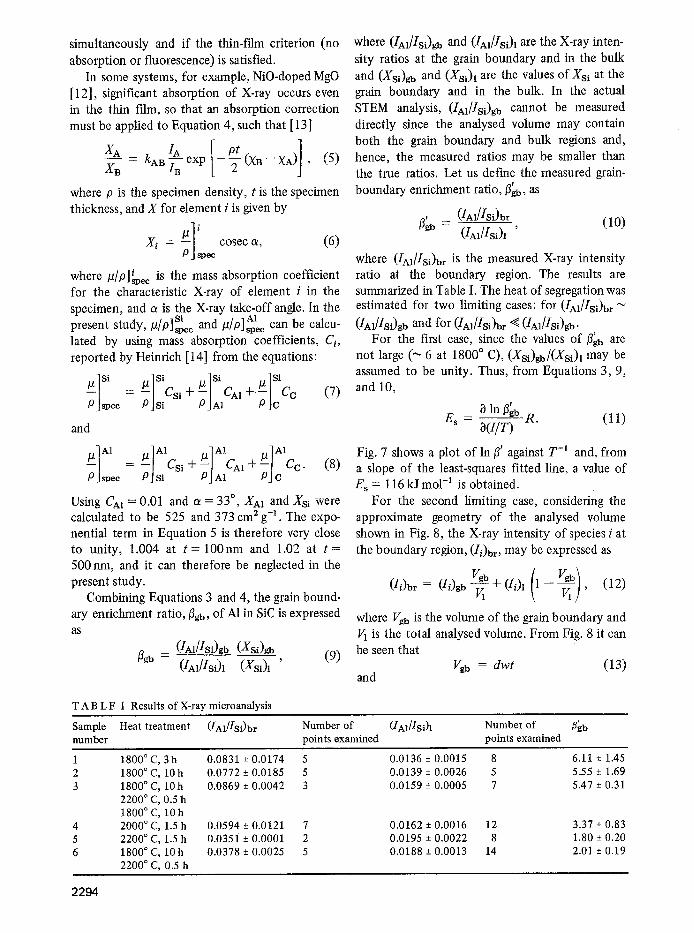
Segregation profiles of samples heat-treated at 1800 ~ C, 2000 ~ C, and 2200 ~ C are shown in Fig. 6. In each sample, the existence of Al-rich second phases were observed. It is clearly seen from Fig. 6 that a lower annealing temperature resulted in a larger amount of segregation, consistent with the theory of equilibrium segregation. X-ray micro- analyses were carried out on three more specimens
which were heat-treated (a) at 1800~ for 10h, (b) at 1800 ~ C for 10 h and subsequently at 2200 ~ C for 30 rain, and (c) as (b) but with an additional annealing at 1800 ~ C for 10 h. X-ray spectra were taken at several points on one grain boundary (and other grain boundaries for some samples) and in the bulk, and some variation of the A1/Si count ratio, within 20%, was observed.
4. Discussion 4.1. Heat of segregation 4. 1.1. Equilibrium segregation theory Applying the method of statistical thermodynamics to the problem of grain boundary segregation, McLean [10] derived an expression:
Xgb X1 exp ( E ~ ) 1--Xg--------b = l-----X- ~ , (1)
where Xg u is the solute molar fraction at the grain boundary, X 1 is the solute molar fraction in the bulk, E s is the free energy of segregation at the grain boundary, which is the difference in energy
Figure 4 (a) STEM micrographs (annular dark-field image) and (b) X-ray spectrum taken at the second phase by UTW detector in hot-pressed SiC.
2292
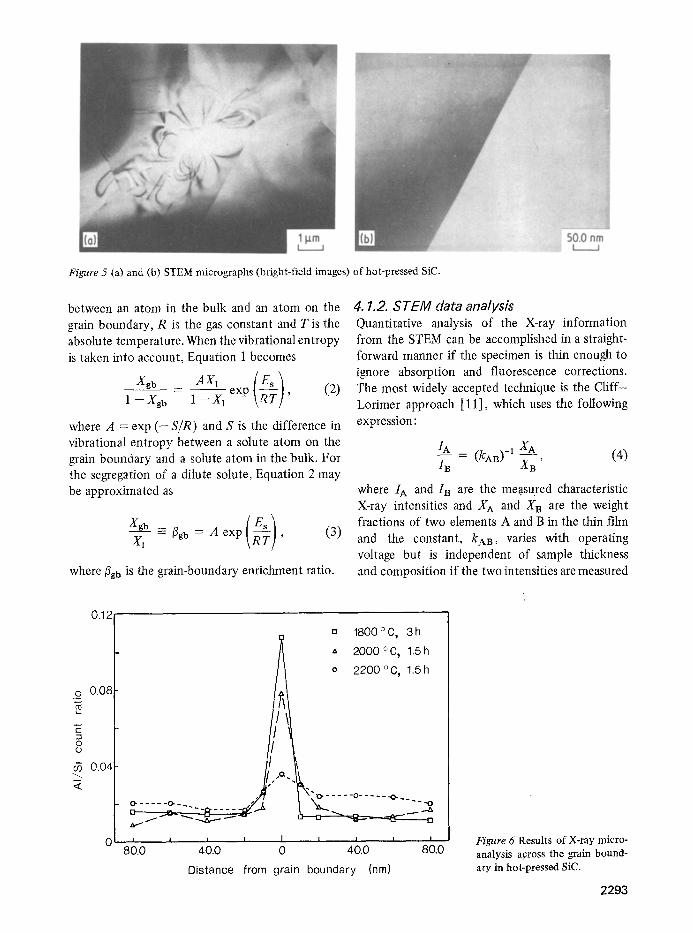
Figure 5 (a) and (b) STEM micrographs (bright-field images)
between an atom in the bulk and an atom on the grain boundary, R is the gas constant and T is the absolute temperature. When the vibrational entropy is taken into account, Equation 1 becomes
X g b - A X 1 ( Es ) 1 - -Xgb I~X;X1 exp ~ , (2)
where a = exp (--S/R) and S is the difference in vibrational entropy between a solute atom on the grain boundary and a solute atom in the bulk. For the segregation of a dilute solute, Equation 2 may be approximated as
Xgb ~ [3g b = Aexp R-~ , (3) x1
where/3g u is the grain-boundary enrichment ratio.
of hot-pressed SiC.
4. 1.2. STEM data analysis Quantitative analysis of the X-ray information from the STEM can be accomplished in a straight- forward manner if the specimen is thin enough to i~ore absorption and fluorescence corrections. The most widely accepted technique is the Cliff- Lorimer approach [11], which uses the following expression:
IA = (kAB) -1 XA (4) IB XB '
where I A and I13 are the measured characteristic X-ray intensities and XA and XB are the weight fractions of two elements A and B in the thin film and the constant, kAB, varies with operating voltage but is independent of sample thickness and composition if the two intensities are measured
0.12
.o_ 0.08
E O O
c~ 0.04
,F~ "Q
I I I I I
80.0 40.0 0
Distance
u 1800 o C, 3h
" 2000~ 1.5h
o 2200 o C, 1.5 h
I I I !
40.0 80.0
from grain boundary (nm)
Figure 6 Results of X-ray micro- analysis across the gxain bound- ary in hot-pressed SiC.
2293
simultaneously and if the thin-film criterion (no absorption or fluorescence) is satisfied.
In some systems, for example, NiO-doped MgO [12], significant absorption of X-ray occurs even in the thin film, so that an absorption correction must be applied to Equation 4, such that [13]
XA kABIA [ pt ] --XB = ]~-Bexp -~-(XB--XA) , (5)
where p is the specimen density, t is the specimen thickness, and X for element i is given by
Xi = cosec a, (6) s p e c
where/~/P]~ee is the mass absorption coefficient for the characteristic X-ray of element i in the specimen, and a is the X-ray take-off angle. In the Si A1 present study, P/P]spee and /d /p ] spe c can be calcu- lated by using mass absorption coefficients, C i, reported by Heinrich [14] from the equations:
/dlSi /2] si /2] Si _[_ ~__.1 Si
P ]spec : 7 ] S i CSi -{- 7JA1 CA] /9 }e CC (7)
and
___~]AI p]AI .]Al + /IIAI = --1 Csi + PJ'-JA1 CA1 7JC Cc" (8) PJspec PJsi
Using CAI = 0.01 and a = 33 ~ XA1 and Xsi were calculated to be 525 and 373 cm 2 g-1. The expo- nential term in Equation 5 is therefore very close to unity, 1.004 at t= 100nm and 1.02 at t= 500 nm, and it can therefore be neglected in the present study.
Combining Equations 3 and 4, the grain bound- ary enrichment ratio, {3zb, of A1 in SiC is expressed as
(IA1/ISi)gb (Xsi)gb (9)
& b - (IA,/Isi)l (Xsi)l '
where (IM/Isi)g b and (1A1/lsi)I are the X-ray inten- sity ratios at the grain boundary and in the bulk and (Xsi)g b and (Xsi)l are the values of Xsi at the grain boundary and in the bulk. In the actual STEM analysis, (IA1/Isi)g b cannot be measured directly since the analysed volume may contain both the grain boundary and bulk regions and, hence, the measured ratios may be smaller than the true ratios. Let us define the measured grain- boundary enrichment ratio, 3'gb, as
' ( /A1//Si)br (10) [3g b -- (iA1/iSi)l,
where (IA1/Isi)b r is the measured X-ray intensity ratio at the boundary region. The results are summarized in Table I. The heat of segregation was estimated for two limiting cases: for (IAJIsi)D r (IA1/Isi)g b and for (IAl/Isi)br ~ (IA1/Isi)gb.
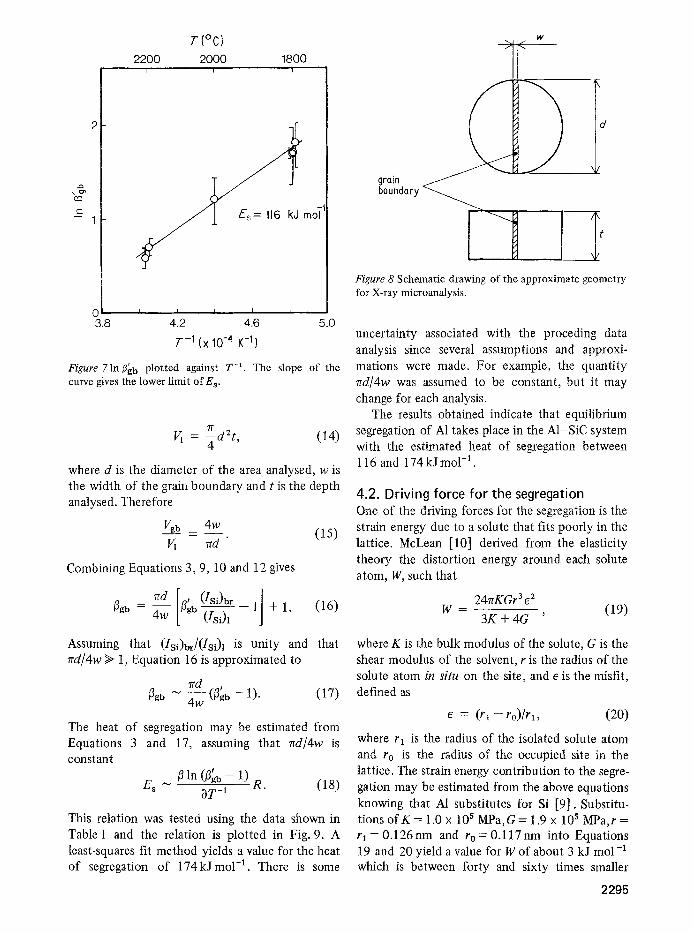
t For the first case, since the values of 3gb are not large (~ 6 at 1800 ~ C), (Xsi)gb/(Xsi)l m a y be assumed to be unity. Thus, from Equations 3, 9, and 10,
t ln3~b
E s = R. (11) O(I/r)
Fig. 7 shows a plot of In 3' against T- ' and, from a slope of the least-squares fitted line, a value of E s = 116 kJmo1-1 is obtained.
For the second limiting case, considering the approximate geometry of the analysed volume shown in Fig. 8, the X-ray intensity of species i at the boundary region, (Ii)br, may be expressed as
(Ii)br = (Ii)gb vgb + (/i)1 (l - - Vgb] (12) v, _ v,] '
where Vg b is the volume of the grain boundary and V1 is the total analysed volume. From Fig. 8 it can be seen that
Vg b = dwt (13) and
T A B L E I Results of X-ray microanalysis
Sample Heat treatment ([A1/iSi)br Number of (IA1/Isi) 1 Number of 3gb number points examined points examined
1 1800 ~ C, 3h 0.0831 +- 0.0174 5 0.0136 -+ 0.0015 8 2 1800 ~ C, 10 h 0.0772 -+ 0.0185 5 0.0139 -+ 0.0026 5 3 1800 ~ C, 10h 0.0869 +- 0.0042 3 0.0159 -+ 0.0005 7
2200 ~ C, 0.5 h 1800 ~ C, 10h
4 2000 ~ C, 1.5 h 0.0594 +- 0.0121 7 0.0162 -+ 0.0016 12 5 2200 ~ C, !.5 h 0.0351 -+ 0.0001 2 0.0195 -+ 0.0022 8 6 1800 ~ C, 10h 0.0378 +- 0.0025 5 0.0188 -+ 0.0013 14
2200 ~ C, 0.5 h
6.11 -+ 1.45 5.55 -+ 1.69 5.47 +- 0.31
3.37 -+ 0.83 1.80 -+ 0.20 2.01 -+ 0.19
2294
2
tool
T(~ 2200 2000 1800
c m
0 I I I I [
3.8 4.2 4.6 5.0
T-1 (x 10-4 K-l)
Figure 7ln~'g b plotted against T -1. The slope of the curve gives the lower limit o f E s.
7/" 2 V1 = ~-d t, (14)
where d is the diameter of the area analysed, w is the width of the grain boundary and t is the depth analysed. Therefore
Vgb _ 4w ( i s )
V1 rrd
Combining Equations 3, 9, 10 and 12 gives
rrd [a, (Isi)br 1 (16) /~gb = ~W-W [/~ ~ 1 + 1 . -
Assuming that (Isi)br/(Isi)l is unity and that rrd/4w >> 1, Equation 16 is approximated to
rrd , ~gb -- ~ (&b -- 1). (17)
The heat of segregation may be estimated from Equations 3 and 17, assuming that n d / 4 w is constant
fl in (fl~u -- 1) E s 0T_ 1 R . (18)
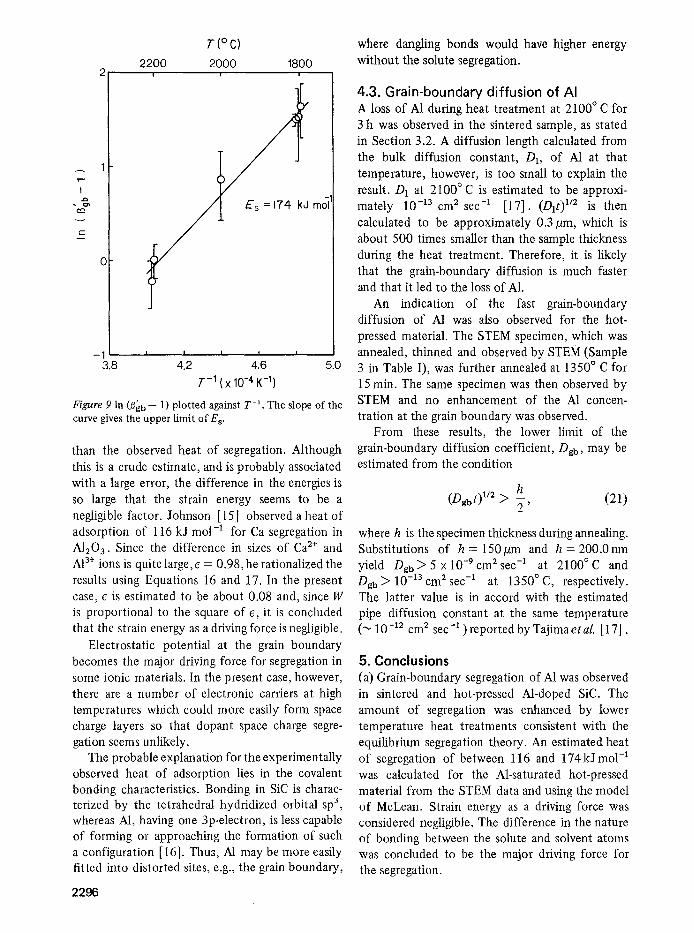
This relation was tested using the data shown in Table I and the relation is plotted in Fig. 9. A least-squares fit method yields a value for the heat of segregation of 174kJmo1-1. There is some
W > <
groin boundary
I d
I t Figure 8 Schematic drawing of the approximate geometry for X-ray microanalysis.
uncertainty associated, with the proceding data analysis since several assumptions and approxi- mations were made. For example, the quantity rrd/4w was assumed to be constant, but it may change for each analysis.
The results obtained indicate that equilibrium segregation of A1 takes place in the A1-SiC system with the estimated heat of segregation between 116 and 174kJmol -a.
4.2. Driving force for the segregation One of the driving forces for the segregation is the strain energy due to a solute that fits poorly in the lattice. McLean [10] derived from the elasticity theory the distortion energy around each solute atom, W, such that
247rKGr 3 e 2 W - , (19)
3K + 4G
where K is the bulk modulus of the solute, G is the shear modulus of the solvent, r is the radius of the solute atom in situ on the site, and e is the misfit, defined as
e = ( r l - - r o ) / r l , (20)
where rl is the radius of the isolated solute atom and ro is the radius of the occupied site in the lattice. The strain energy contribution to the segre- gation may be estimated from the above equations knowing that A1 substitutes for Si [9]. Substitu- tions of K = 1.0 • l0 s MPa,G= 1.9 • 10 s MPa,r = rl = 0.126nm and r0 = 0.117nm into Equations 19 and 20 yield a value for W of about 3 kJ mo1-1 which is between forty and sixty times smaller
2295
I
v
r
m
2 .....
r ( ~
2200 2000 1800 i i J
= mo] 1
-1 i I I I I
3.8 4.2 4.6 5.0
7 "- I (x 10 -4 K -I)
Figure 9 In (flgb- 1) plotted against T -1 . The slope of the curve gives the upper limit ofE s.
than the observed heat of segregation. Although this is a crude estimate, and is probably associated with a large error, the difference in the energies is so large that the strain energy seems to be a negligible factor. Johnson [15] observed a heat of adsorption of 116 kJ mo1-1 for Ca segregation in A1203. Since the difference in sizes of Ca 2§ and AI 3§ ions is quite large,e = 0.98, he rationalized the results using Equations 16 and 17. In the present case, e is estimated to be about 0.08 and, since W is proportional to the square of e, it is concluded that the strain energy as a driving force is negligible.
Electrostatic potential at the grain boundary becomes the major driving force for segregation in some ionic materials. In the present case, however, there are a number of electronic carriers at high temperatures which could more easily form space charge layers so that dopant space charge segre- gation seems unlikely.
The probable explanation for the experimentally observed heat of adsorption lies in the covalent bonding characteristics. Bonding in SiC is charac- terized by the tetrahedral hydridized orbital sp 3, whereas A1, having one 3p-electron, is less capable of forming or approaching the formation of such a configuration [16]. Thus, A1 may be more easily fitted into distorted sites, e.g., the grain boundary,
2296
where dangling bonds would have higher energy without the solute segregation.
4.3. Gra in-boundary dif fusion of AI A loss of A1 during heat treatment at 2100 ~ C for 3 h was observed in the sintered sample, as stated in Section 3.2. A diffusion length calculated from the bulk diffusion constant, Dt, of A1 at that temperature, however, is too small to explain the result. D1 at 2100~ C is estimated to be approxi- mately 10 -13 cm 2 sec -1 [17]. (D]t) u2 is then
calculated to be approximately 0.3/~m, which is about 500 times smaller than the sample thickness during the heat treatment. Therefore, it is likely that the grain-boundary diffusion is much faster and that it led to the loss of A1.
An indication of the fast grain-boundary diffusion of A1 was also observed for the hot- pressed material. The STEM specimen, which was annealed, thinned and observed by STEM (Sample 3 in Table I), was further annealed at 1350 ~ C for 15 rain. The same specimen was then observed by STEM and no enhancement of the A1 concen- tration at the grain boundary was observed.
From these results, the lower limit of the grain-boundary diffusion coefficient, Dgb, may be estimated from the condition
h (Dgbt) 1/2 > ~-, (21)
where h is the specimen thickness during annealing. Substitutions of h = 150/~m and h = 2 0 0 . 0 n m yield Dgb > 5 x 1 0 .9 c m 2 s e c -1 at 2100 ~ C and Dg b > 10 -13 cm 2 sec -1 at 1350 ~ C, respectively. The latter value is in accord with the estimated pipe diffusion constant at the same temperature ("~ 10 -12 cm 2 sec -1 ) reported by Tajimaetal. [17].
5. Conclusions (a) Grain-boundary segregation of A1 was observed in sintered and hot-pressed Al-doped SiC. The amount of segregation was enhanced by lower temperature heat treatments consistent with the equilibrium segregation theory. An estimated heat of segregation of between 116 and 174kJmo1-1 was calculated for the Al-saturated hot-pressed material from the STEM data and using the model of McLean. Strain energy as a driving force was considered negligible. The difference in the nature of bonding between the solute and solvent atoms was concluded to be the major driving force for the segregation.
(b) A loss o f A1 was observed when thin samples
were heat- t reated. Results are in terpre ted as indi-
cating that grain boundaries are high diffusivSty
paths for A1.
Acknowledgements This work was suppor ted by the US Depar tmen t
o f Energy under Cont rac t number DE-ACO2-
76ERO2390 . We thank Dr A. J. Garra t t -Reed for
his help in STEM operat ions, Dr K. Kij ima for
valuable discussions and Dr H. Hausner and
Dr A. Mocell in for supplying samples.
References 1. S. PROCHAZKA, in"Ceramics for High-Performance
Applications" edited by J. J. Burke, A. E. Gorum and R. N. Katz, (Brook Hill Publishing Co., Chest- nut Hill, MA, 1974) p. 239.
2. Y. MURATA and R. H. SMOAK, in Proceedings of the International Symposium of Factors in Densifi- cation and Sintering of Oxide and Non-oxide Ceramics, Hakone, Japan, 3-5 October 1978, edited by S. Somiya and S. Saito (Gakujutsu Bunken Fukyu-kai, Ookayama, Japan, 1978) p. 382.
3. w. BOCKER and H. HAUSNER, Powder Met. Int. 10 (1978) 87.
4. W. BOCKER, H. LANDFERMANN and H. HAUS- NER,ibid. 11 (1979) 83.
5. W.S. COBLENZ, PhD thesis, Massachusetts Institute of Technology, Cambridge, MA (1981).
6. G. GRESKOVICH and J.H. ROSOLOWSKI, J. Amer. Ceram. Soc. 59 (1976) 336.
7. S. PROCHAZKA, C.A. JOHNSON and R.A. GIDDINGS, G.E. Technical Information Series, Publication number 78CRD192 (1978).
8. J.B. VANDER SANDE and E. I. HALL, 2". Amer. Ceram. Soc. 63 (1979) 246.
9. YO TAJIMA and W. D. KINGERY, Commun, Amer. Ceram. Soc. 65 (2) (1982) C-27.
10. D. McLEAN, "Grain Boundary in Metals" (Clarendon Press, Oxford, 1957) p. 118.
11. G. CLIFF and G. W. LORIMER, J. Microscopy 103 (1975) 203.
12. B.A. BENDER, D. B. WILLIAMS and M. B. NOTIS, J. Amer. Ceram. Soc. 63 (1980) 149.
13. J.I . GOLDSTEIN, J. L. COSTLEY, G. W. LORIMER and S. J. B. REED, in "Scanning Electron Micro- scopy/1977" Vol. 1 (liT Research Institute, Chicago, IL, 1977) p. 315.
14. K.F .J . HEINRICH, in "The Electron Microprobe" edited by T.D. McKinley, K .F . J . Heinrich and D. B. Wittry (John Wiley and Sons, New York, 1966) p. 296.
15. W.C. JOHNSON, Met. Trans. A 8A (1977) 1413. 16. G.V. SAMSONOV, Soviet Powder Metal. Ceram.
(1) (1965) 75. 17. YO. TAJIMA, K. KIJIMA and W. D. KINGERY, J.
Chem. Phys. (1982) in press.
Received 20 November
and accep ted 15 December 1981
2297


![Subcycle Nonlinear Response of Doped 4H Silicon Carbide ......instance GaAs, Si, Ge, and InGaAs [18-23]. In line with its potential for high-power THz applications, the possibility](https://img.pdfslide.us/doc/110x75/60df2e31b666e81ebd71dfd6/subcycle-nonlinear-response-of-doped-4h-silicon-carbide-instance-gaas-si.jpg)