Embed Size (px)
Citation preview

S1
Supporting Information (SI)
Grain Boundaries Modified Uniformly-Conjoint
Metal/Oxides via Binder Strategy as Efficient
Bifunctional Electrocatalysts
Rongrong Zhang, Li Wang, Yu-Hang Ma, Lun Pan,* Ruijie Gao, Ke Li, Xiangwen Zhang, Ji-Jun Zou
Key Laboratory for Green Chemical Technology of the Ministry of Education, School of Chemical
Engineering and Technology, Tianjin University, Tianjin 300072, China.
Collaborative Innovative Center of Chemical Science and Engineering (Tianjin), Tianjin 300072,
China.
Corresponding author email address:
E-mail: [email protected] (L. Pan)
Electronic Supplementary Material (ESI) for Journal of Materials Chemistry A.This journal is © The Royal Society of Chemistry 2019

S2
Table of contents
Captions Page
Figure S1 XRD of CoNim-Gly and CoNi-Gly. S3
Figure S2 Schematic of melamine lie in interlamination of glyceric metal precursor (CoNim-Gly). S3
Figure S3 IR of CoNim-Gly and CoNi-Gly. S4
Figure S4 TG and DTG in argon flow of CoNim-Gly and CoNi-Gly. S4
Figure S5 TEM of CoNi. S5
Figure S6 HRTEM of CoNi. S5
Figure S7 TEM of CoNi-melamine with different Co/Ni ratio. Com and Nim are synthesized with
only one metal source of cobalt and nickel respectively. S5
Figure S8 XRD of CoNim and CoNi. S6
Figure S9 The linear combination fitting (LCF) of XANES for CoNi which main component is
metal. S6
Figure S10 The fine X-ray photoelectron spectroscopy (XPS) of CoNi and CoNim, fitting of O 1s. S7
Table S1 Elements concentration of CoNim and CoNi by XPS. S8
Figure S11 The XANES of Co K-edge for CoNim. S9
Figure S12 The XANES of Ni K-edge for CoNim. S9
Figure S13 XRD of Com and Nim. S10
Figure S14 RRDE tests for electron transfer number of Pt/C (a), IrO2 (b), and RuO2 (c). S11
Figure S15 LSV of IrO2 (a) and RuO2 (b) before and after 2000 cycle tests. S12
Figure S16 HRTEM of CoNim after OER stability test (washed from electrode). S13
Figure S17 HRTEM of CoNim after ORR stability test (washed from electrode) S13
Figure S18 Optimized adsorption structures of metal and metal oxides with (100) crystal faces. S14
Figure S19 Optimized OH adsorption structures of (100) crystal faces with composite clusters. S15
Figure S20 Optimized O2 adsorption structures of (100) crystal faces with composite clusters. S16
Figure S21 Galvanostatic (10 mA/cm2) charge-discharge cycling curves for Pt/C-IrO2 (a) and
CoNim (b). S17
Figure S22 (a,b) Co 2p and Ni 2p XPS spectra of CoNim surface after OER stability test. In Co 2p
and Ni 2p XPS, the surface Co, Co2+ and Ni, Ni2+ were oxidized to Co3+ and Ni3+. S18
// XAFS fit specific information. S19
// References S20

S3
Figure S1. XRD of CoNim-Gly and CoNi-Gly.
Figure S2. Schematic of melamine lie in interlamination of glyceric metal precursor (CoNim-Gly).
10 20 30 40 50 60 70 80
Inte
nsi
ty
2/degree
CoNim-Gly
CoNi-Gly
S4
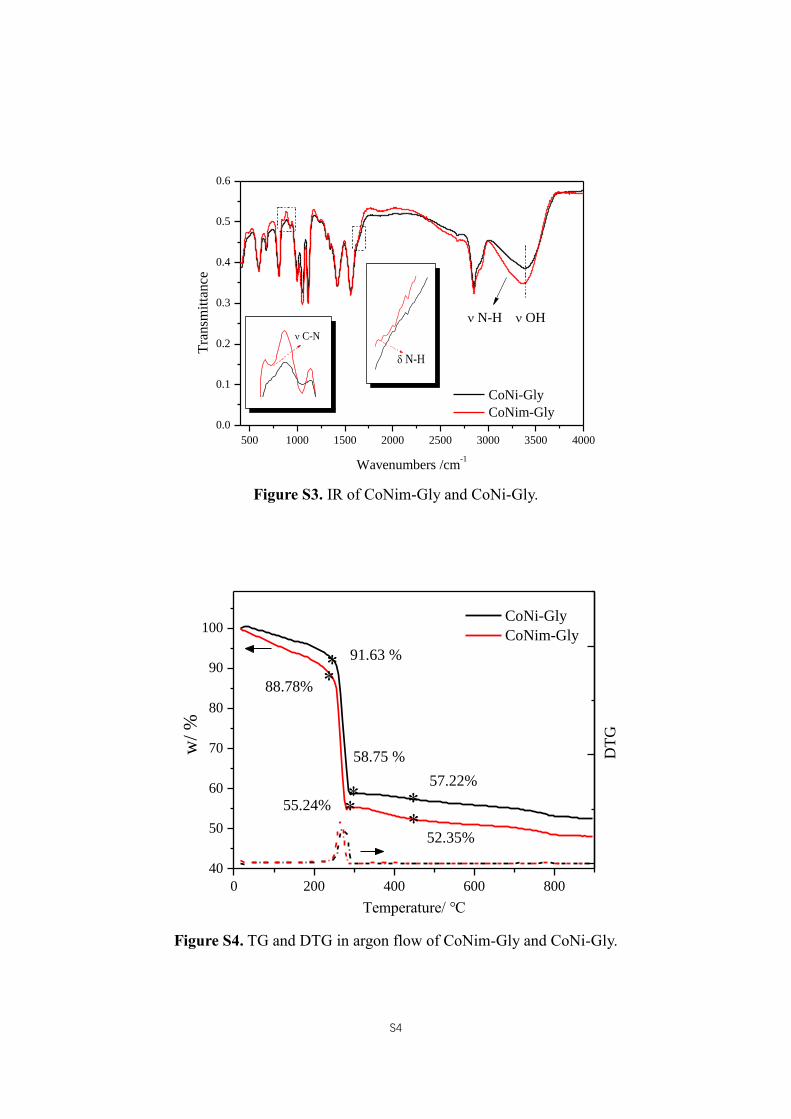
Figure S3. IR of CoNim-Gly and CoNi-Gly.
0 200 400 600 800
40
50
60
70
80
90
100
w/
%
Temperature/ ℃
CoNi-Gly
CoNim-Gly
88.78%
55.24%
91.63 %
58.75 %
52.35%
57.22%
DT
G
Figure S4. TG and DTG in argon flow of CoNim-Gly and CoNi-Gly.
500 1000 1500 2000 2500 3000 3500 4000
0.0
0.1
0.2
0.3
0.4
0.5
0.6
OH
C-N
N-H
Tra
nsm
itta
nce
Wavenumbers /cm-1
CoNi-Gly
CoNim-Gly
N-H

S5
Figure S5. TEM of CoNi.
Figure S6. HRTEM of CoNi.
Figure S7. TEM of CoNi-melamine with different Co/Ni ratio. Com and Nim are synthesized with
only one metal source of cobalt and nickel respectively.

S6
Figure S8. XRD of CoNim and CoNi.
7700 7720 7740 7760
0.0
0.4
0.8
1.2
Co K-edge
no
rmal
ized
x
(E)
energy/eV
CoNi
LCF fitting
8% CoO
91% Co-foil
1% Co3O4
8300 8320 8340 8360 8380 8400 8420
0.0
0.4
0.8
1.2 Ni K-edge
photon enenrgy (eV)
A
bso
rpti
on (
a.u.)
CoNi
LCF fitting
6% NiO
94% Ni
residual
Figure S9. The linear combination fitting (LCF) of XANES for CoNi which main component is metal.
30 40 50 60 70 80 90
•
Ni 04-0850
Co 15-0806•
••
Inte
nsi
ty
2/degree
CoNi
CoNim
NiO 47-1049
Co3O
4 42-1467
CoO 48-1719
S7
540 538 536 534 532 530 528 526
CoNim
Inte
nsi
ty
Binding Energy/eV
O 1s
OV
OH2O
OOH-
OL
540 538 536 534 532 530 528 526
OV
OH2O
OOH-
O 1s
Inte
nsi
tyBinding Energy/eV
CoNi
OL
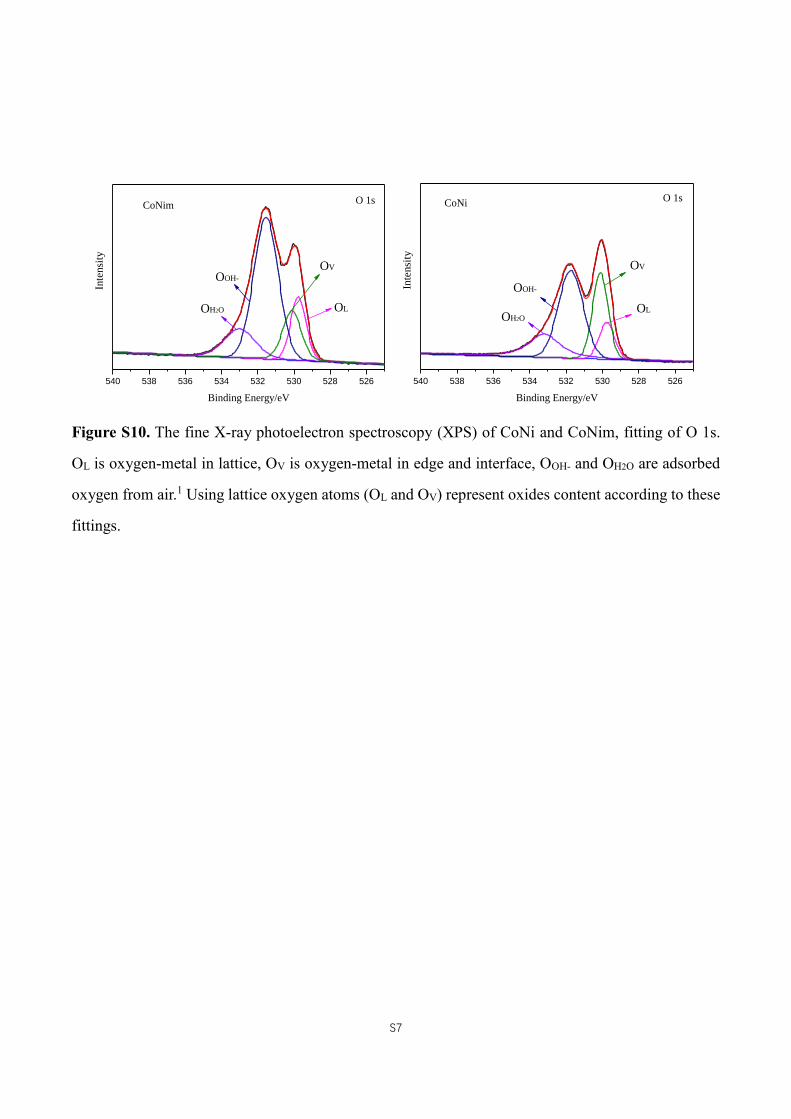
Figure S10. The fine X-ray photoelectron spectroscopy (XPS) of CoNi and CoNim, fitting of O 1s.
OL is oxygen-metal in lattice, OV is oxygen-metal in edge and interface, OOH- and OH2O are adsorbed
oxygen from air.1 Using lattice oxygen atoms (OL and OV) represent oxides content according to these
fittings.
S8
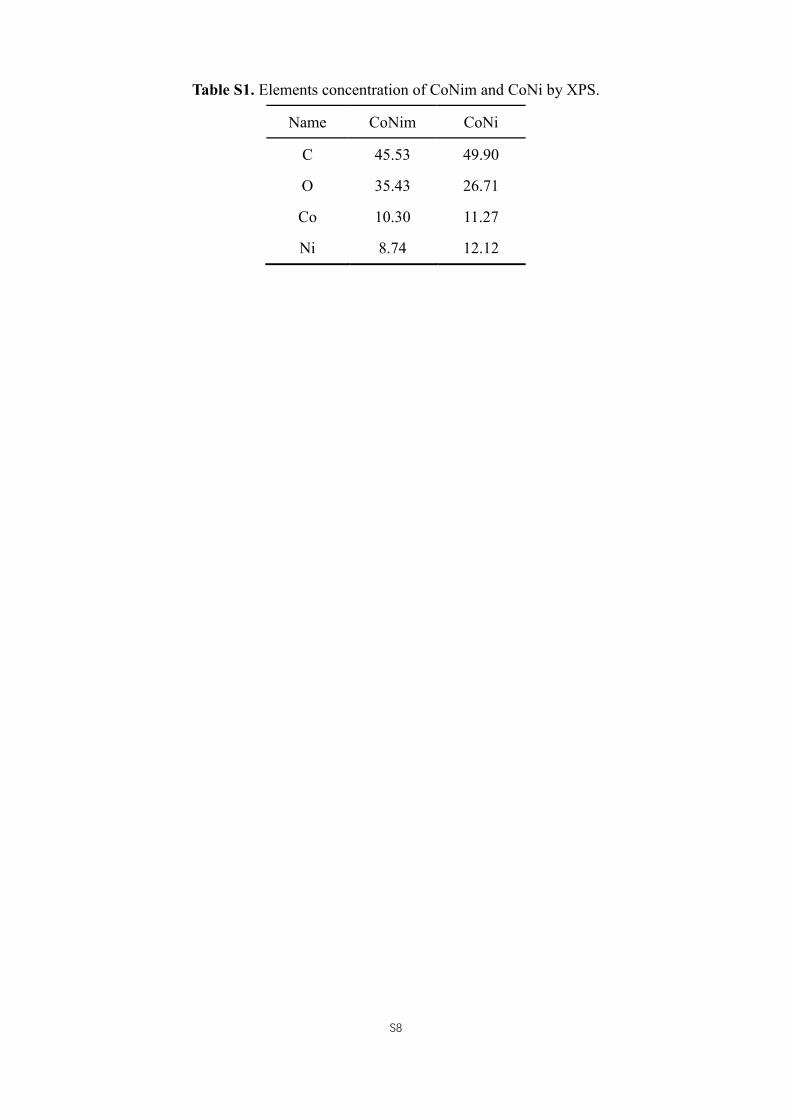
Table S1. Elements concentration of CoNim and CoNi by XPS.
Name CoNim CoNi
C 45.53 49.90
O 35.43 26.71
Co 10.30 11.27
Ni 8.74 12.12

S9
7700 7710 7720 7730 7740 7750 7760
0.0
0.5
1.0
1.5
norm
aliz
ed x
(E
)
energy/eV
CoNim
CoNi
Co
Co3O4
CoO
Co K-edge
Figure S11. The XANES of Co K-edge for CoNim.
8320 8330 8340 8350 8360 8370 8380 8390
0.0
0.4
0.8
1.2
1.6 Ni K-edge
no
rmal
ized
x
(E)
energy/eV
CoNim
CoNi
Ni
NiO
Figure S12. The XANES of Ni K-edge for CoNim.

S10
Information of different Co/Ni ratio samples
20 30 40 50 60 70 80 90
Inte
nsi
ty
/degree
Com
20 30 40 50 60 70 80 90
Inte
nsi
ty
/degree
Nim
Figure S13. XRD of Com and Nim.

S11
Figure S14. RRDE tests for electron transfer number of Pt/C (a), IrO2 (b), and RuO2 (c).
0.4 0.5 0.6 0.7 0.8 0.9 1.0
10 uA/cm2
Cu
rren
t
E/V (RHE)
1 mA/cm2
0
1
2
3
4
N
Pt(a)
1.3 1.4 1.5 1.6 1.7 1.8
Iring
Cu
rren
t
E/V (RHE)
20 mA/cm2
Idisk
0
1
2
3
4N
IrO2(b)
1.3 1.4 1.5 1.6 1.7 1.8
Iring
Curr
ent
E/V (RHE)
20 mA/cm2
Idisk
0
1
2
3
4
N
RuO2(c)

S12
Figure S15. LSV of IrO2 (a) and RuO2 (b) before and after 2000 cycle tests.
1.3 1.4 1.5 1.6 1.7 1.8
0
20
40
60
80
100
I/m
Acm
-2
E/V (RHE)
fresh
post 2000-cyclesIrO2(a)
1.3 1.4 1.5 1.6 1.7 1.8
0
20
40
60
80
100
I/m
Acm
-2
E/V (RHE)
fresh
post 2000-cyclesRuO2(b)

S13
Figure S16. HRTEM of CoNim after OER stability test (washed from electrode).
Figure S17. HRTEM of CoNim after ORR stability test (washed from electrode).
S14
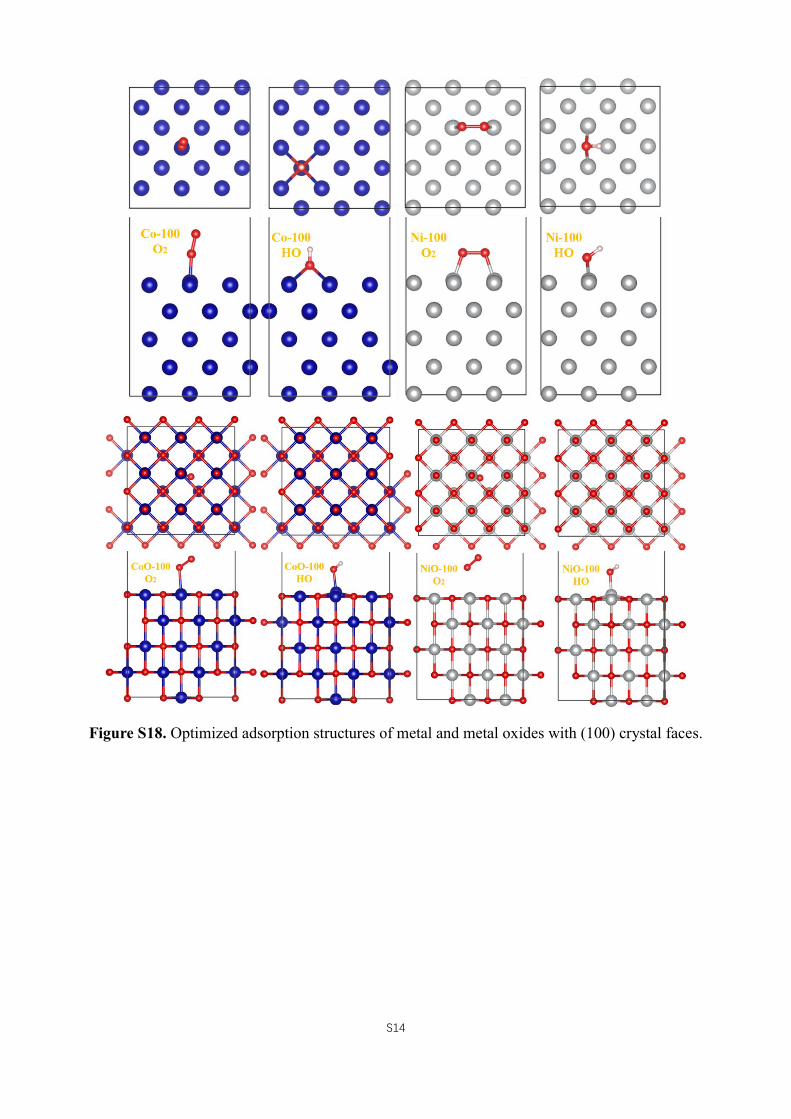
Figure S18. Optimized adsorption structures of metal and metal oxides with (100) crystal faces.

S15
Figure S19. Optimized OH adsorption structures of (100) crystal faces with composite clusters.

S16
Figure S20. Optimized O2 adsorption structures of (100) crystal faces with composite clusters.

S17
Figure S21. Galvanostatic (at 10 mA/cm2) charge-discharge cycling curves for Pt/C-IrO2 (a) and
CoNim (b).
0.0 0.5 1.0 1.5 2.0 2.5 3.0
1.2
1.4
1.6
1.8
2.0
Pote
nti
al/V
Time/h
Pt/C-IrO2 @10 mA/cm2(a)
0.0 0.5 1.0 1.5 2.0 2.5 3.0
0.6
0.9
1.2
1.5
1.8
2.1
Pote
nti
al/V
Time/h
CoNim @10 mA/cm2(b)

S18
Figure S22. (a,b) Co 2p and Ni 2p XPS spectra of CoNim surface after OER stability test. In Co 2p
and Ni 2p XPS, the surface Co, Co2+ and Ni, Ni2+ were oxidized to Co3+ and Ni3+.
810 805 800 795 790 785 780 775
Co
Co2+
Co 2p1/2
sat.
sat. Co
3+
Inte
nsi
ty
Binding Energy/eV
Co 2p3/2
CoNim-fresh
CoNim-after OER stability test (a)
890 885 880 875 870 865 860 855 850
Ni3+
Ni2+
CoNim-fresh
CoNim-after OER stability test (b)
sat. sat.
Ni 2p1/2
Ni 2p3/2
Inte
nsi
ty
Binding Energy/eV
Ni

S19
XAFS fit specific information.
Three paths from 1.10 Å to 2.85 Å (Co-O of Co3O4, Co-O of CoO, and Co-Co of Co metal) were
used in Co k-edge adsorption spectrum fit, and three paths from 1.25 Å to 3.00 Å (Ni-O of NiO, Ni-
Ni of Ni metal, Ni-Ni of NiO) were used in Ni k-edge adsorption spectrum fit. According to the
principle and results of LCF, the following standard EXAFS formula can be used in absorption
spectrum of mixed substances:
(k) =∑𝑁𝑗𝑆0
2𝑓𝑗(𝑘)
𝑘𝑅𝑗2
𝑗
𝑒−2𝑘2𝑗
2𝑒−2𝑅𝑗 𝑗(𝑘)⁄ sin[2𝑘𝑅𝑗 + 𝑗(𝑘) + 2
𝐶(𝑘)]
j=1, 2, 3 represent three paths mentioned above. Nj denotes the total number of atoms in the j-th
shell. S02 is the amplitude reduction factor. R is the distance between the absorbing and scattering
atoms. (k) is the mean free path of the excited photoelectron. f(k) and δ(k) are the backscattering
amplitude and scattering phase shift of the scattering atom, respectively. φC(k) is phase-shift of the
absorbing atom. 2 known as the Debye-Waller factor, is the mean square variation in the interatomic
distance R and 𝑒−2𝑘2𝑗
2 term accounts for the effects of dynamic (thermal) vibration and
configuration (structural) disorder which smear out the EXAFS oscillations at high k region. The N
values obtained by fitting are multiplied by the ratio of the substance from LCF to obtain the atomic
coordination number of each substance in the mixture.2

S20
Reference
1. Xu, L.; Jiang, Q.; Xiao, Z.; Li, X.; Huo, J.; Wang, S.; Dai, L., Plasma-Engraved Co3O4 Nanosheets
with Oxygen Vacancies and High Surface Area for the Oxygen Evolution Reaction. Angew. Chem. Int.
Ed. 2016, 55 (17), 5277-81.
2. Sun, Z.; Yan, W.; Yao, T.; Liu, Q.; Xie, Y.; Wei, S. XAFS in Dilute Magnetic Semiconductors. Dalton
T. 2013, 42, 13779-13801.