Embed Size (px)
Citation preview
THIS REPORT CONTAINS ASSESSMENTS OF COMMODITY AND TRADE ISSUES MADE BY
USDA STAFF AND NOT NECESSARILY STATEMENTS OF OFFICIAL U.S. GOVERNMENT
POLICY
Date:
GAIN Report Number:
Approved By:
Prepared By:
Report Highlights:
The United States is the main sourcing option for Colombian importers of corn and rice. In 2017, U.S.
corn dominated the Colombian market supplying 99.7 percent of imports triggered by trade preferences
in the U.S.-Colombia Trade Promotion Agreement (CTPA). Corn production will decrease to 1.6
million metric tons (MT) in marketing year (MY) 2018/19, while imports surge to 5.15 million MT. In
MY 2018/19, rice imports will increase to 150,000 MT and rough rice production is expected to
decrease to 2.4 million MT given low grower prices. In MY 2018/19, wheat production is forecast to
10,000 MT with imports reaching 1.95 million MT.
Benjamin Rau, Agricultural Attaché
Lady A. Gomez, Agricultural Specialist
Michael Conlon, Agricultural Counselor
Colombia Remains the Largest South American Market for U.S.
Grains
Grain and Feed Annual 2018
Colombia
CO1804
3/15/2018
Required Report - public distribution
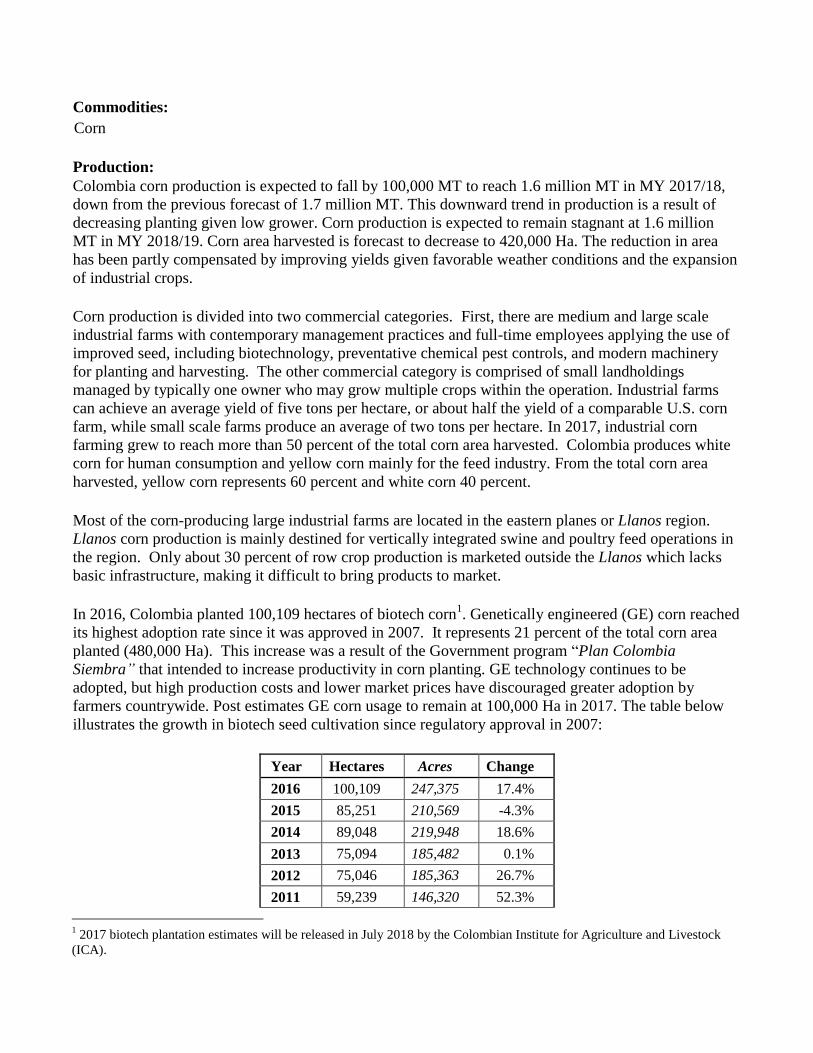
Commodities:
Production:
Colombia corn production is expected to fall by 100,000 MT to reach 1.6 million MT in MY 2017/18,
down from the previous forecast of 1.7 million MT. This downward trend in production is a result of
decreasing planting given low grower. Corn production is expected to remain stagnant at 1.6 million
MT in MY 2018/19. Corn area harvested is forecast to decrease to 420,000 Ha. The reduction in area
has been partly compensated by improving yields given favorable weather conditions and the expansion
of industrial crops.
Corn production is divided into two commercial categories. First, there are medium and large scale
industrial farms with contemporary management practices and full-time employees applying the use of
improved seed, including biotechnology, preventative chemical pest controls, and modern machinery
for planting and harvesting. The other commercial category is comprised of small landholdings
managed by typically one owner who may grow multiple crops within the operation. Industrial farms
can achieve an average yield of five tons per hectare, or about half the yield of a comparable U.S. corn
farm, while small scale farms produce an average of two tons per hectare. In 2017, industrial corn
farming grew to reach more than 50 percent of the total corn area harvested. Colombia produces white
corn for human consumption and yellow corn mainly for the feed industry. From the total corn area
harvested, yellow corn represents 60 percent and white corn 40 percent.
Most of the corn-producing large industrial farms are located in the eastern planes or Llanos region.
Llanos corn production is mainly destined for vertically integrated swine and poultry feed operations in
the region. Only about 30 percent of row crop production is marketed outside the Llanos which lacks
basic infrastructure, making it difficult to bring products to market.
In 2016, Colombia planted 100,109 hectares of biotech corn1. Genetically engineered (GE) corn reached
its highest adoption rate since it was approved in 2007. It represents 21 percent of the total corn area
planted (480,000 Ha). This increase was a result of the Government program “Plan Colombia
Siembra” that intended to increase productivity in corn planting. GE technology continues to be
adopted, but high production costs and lower market prices have discouraged greater adoption by
farmers countrywide. Post estimates GE corn usage to remain at 100,000 Ha in 2017. The table below
illustrates the growth in biotech seed cultivation since regulatory approval in 2007:
Year Hectares Acres Change
2016 100,109 247,375 17.4%
2015 85,251 210,569 -4.3%
2014 89,048 219,948 18.6%
2013 75,094 185,482 0.1%
2012 75,046 185,363 26.7%
2011 59,239 146,320 52.3%
1 2017 biotech plantation estimates will be released in July 2018 by the Colombian Institute for Agriculture and Livestock
(ICA).
Corn
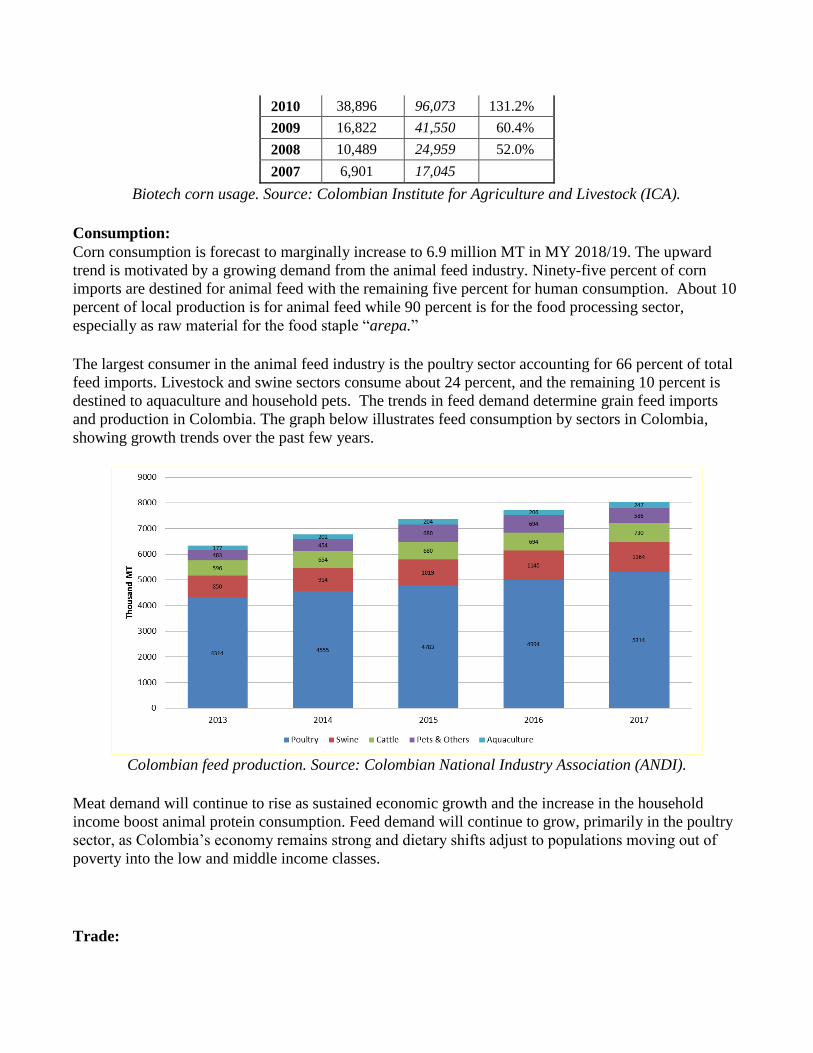
2010 38,896 96,073 131.2%
2009 16,822 41,550 60.4%
2008 10,489 24,959 52.0%
2007 6,901 17,045
Biotech corn usage. Source: Colombian Institute for Agriculture and Livestock (ICA).
Consumption:
Corn consumption is forecast to marginally increase to 6.9 million MT in MY 2018/19. The upward
trend is motivated by a growing demand from the animal feed industry. Ninety-five percent of corn
imports are destined for animal feed with the remaining five percent for human consumption. About 10
percent of local production is for animal feed while 90 percent is for the food processing sector,
especially as raw material for the food staple “arepa.”
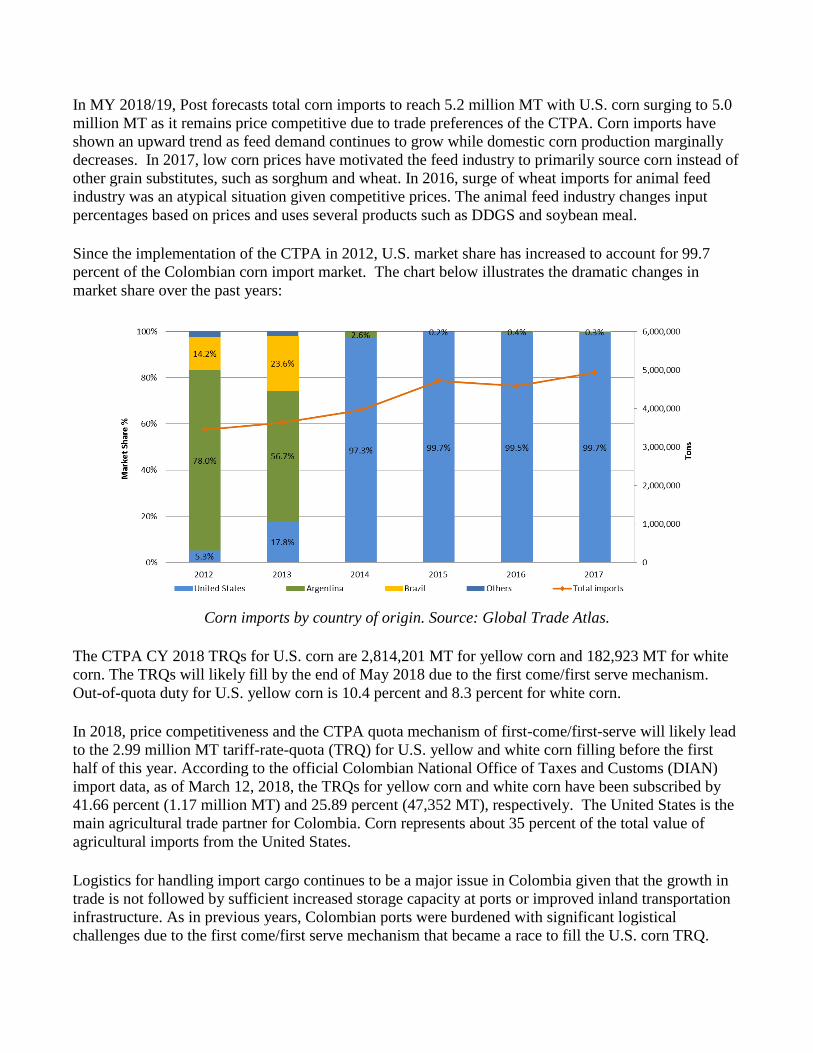
The largest consumer in the animal feed industry is the poultry sector accounting for 66 percent of total
feed imports. Livestock and swine sectors consume about 24 percent, and the remaining 10 percent is
destined to aquaculture and household pets. The trends in feed demand determine grain feed imports
and production in Colombia. The graph below illustrates feed consumption by sectors in Colombia,
showing growth trends over the past few years.
Colombian feed production. Source: Colombian National Industry Association (ANDI).
Meat demand will continue to rise as sustained economic growth and the increase in the household
income boost animal protein consumption. Feed demand will continue to grow, primarily in the poultry
sector, as Colombia’s economy remains strong and dietary shifts adjust to populations moving out of
poverty into the low and middle income classes.
Trade:
In MY 2018/19, Post forecasts total corn imports to reach 5.2 million MT with U.S. corn surging to 5.0
million MT as it remains price competitive due to trade preferences of the CTPA. Corn imports have
shown an upward trend as feed demand continues to grow while domestic corn production marginally
decreases. In 2017, low corn prices have motivated the feed industry to primarily source corn instead of
other grain substitutes, such as sorghum and wheat. In 2016, surge of wheat imports for animal feed
industry was an atypical situation given competitive prices. The animal feed industry changes input
percentages based on prices and uses several products such as DDGS and soybean meal.
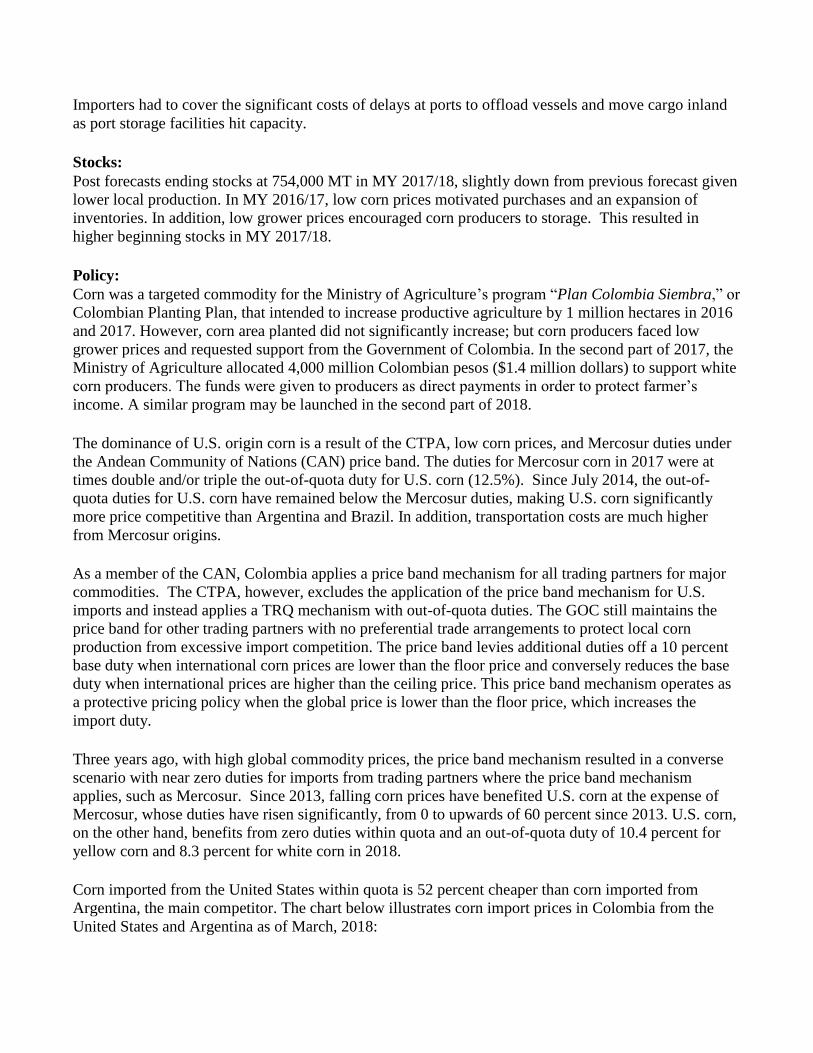
Since the implementation of the CTPA in 2012, U.S. market share has increased to account for 99.7
percent of the Colombian corn import market. The chart below illustrates the dramatic changes in
market share over the past years:
Corn imports by country of origin. Source: Global Trade Atlas.
The CTPA CY 2018 TRQs for U.S. corn are 2,814,201 MT for yellow corn and 182,923 MT for white
corn. The TRQs will likely fill by the end of May 2018 due to the first come/first serve mechanism.
Out-of-quota duty for U.S. yellow corn is 10.4 percent and 8.3 percent for white corn.
In 2018, price competitiveness and the CTPA quota mechanism of first-come/first-serve will likely lead
to the 2.99 million MT tariff-rate-quota (TRQ) for U.S. yellow and white corn filling before the first
half of this year. According to the official Colombian National Office of Taxes and Customs (DIAN)
import data, as of March 12, 2018, the TRQs for yellow corn and white corn have been subscribed by
41.66 percent (1.17 million MT) and 25.89 percent (47,352 MT), respectively. The United States is the
main agricultural trade partner for Colombia. Corn represents about 35 percent of the total value of
agricultural imports from the United States.
Logistics for handling import cargo continues to be a major issue in Colombia given that the growth in
trade is not followed by sufficient increased storage capacity at ports or improved inland transportation
infrastructure. As in previous years, Colombian ports were burdened with significant logistical
challenges due to the first come/first serve mechanism that became a race to fill the U.S. corn TRQ.
Importers had to cover the significant costs of delays at ports to offload vessels and move cargo inland
as port storage facilities hit capacity.
Stocks:
Post forecasts ending stocks at 754,000 MT in MY 2017/18, slightly down from previous forecast given
lower local production. In MY 2016/17, low corn prices motivated purchases and an expansion of
inventories. In addition, low grower prices encouraged corn producers to storage. This resulted in
higher beginning stocks in MY 2017/18.
Policy:
Corn was a targeted commodity for the Ministry of Agriculture’s program “Plan Colombia Siembra,” or
Colombian Planting Plan, that intended to increase productive agriculture by 1 million hectares in 2016
and 2017. However, corn area planted did not significantly increase; but corn producers faced low
grower prices and requested support from the Government of Colombia. In the second part of 2017, the
Ministry of Agriculture allocated 4,000 million Colombian pesos ($1.4 million dollars) to support white
corn producers. The funds were given to producers as direct payments in order to protect farmer’s
income. A similar program may be launched in the second part of 2018.
The dominance of U.S. origin corn is a result of the CTPA, low corn prices, and Mercosur duties under
the Andean Community of Nations (CAN) price band. The duties for Mercosur corn in 2017 were at
times double and/or triple the out-of-quota duty for U.S. corn (12.5%). Since July 2014, the out-of-
quota duties for U.S. corn have remained below the Mercosur duties, making U.S. corn significantly
more price competitive than Argentina and Brazil. In addition, transportation costs are much higher
from Mercosur origins.
As a member of the CAN, Colombia applies a price band mechanism for all trading partners for major
commodities. The CTPA, however, excludes the application of the price band mechanism for U.S.
imports and instead applies a TRQ mechanism with out-of-quota duties. The GOC still maintains the
price band for other trading partners with no preferential trade arrangements to protect local corn
production from excessive import competition. The price band levies additional duties off a 10 percent
base duty when international corn prices are lower than the floor price and conversely reduces the base
duty when international prices are higher than the ceiling price. This price band mechanism operates as
a protective pricing policy when the global price is lower than the floor price, which increases the
import duty.
Three years ago, with high global commodity prices, the price band mechanism resulted in a converse
scenario with near zero duties for imports from trading partners where the price band mechanism
applies, such as Mercosur. Since 2013, falling corn prices have benefited U.S. corn at the expense of
Mercosur, whose duties have risen significantly, from 0 to upwards of 60 percent since 2013. U.S. corn,
on the other hand, benefits from zero duties within quota and an out-of-quota duty of 10.4 percent for
yellow corn and 8.3 percent for white corn in 2018.
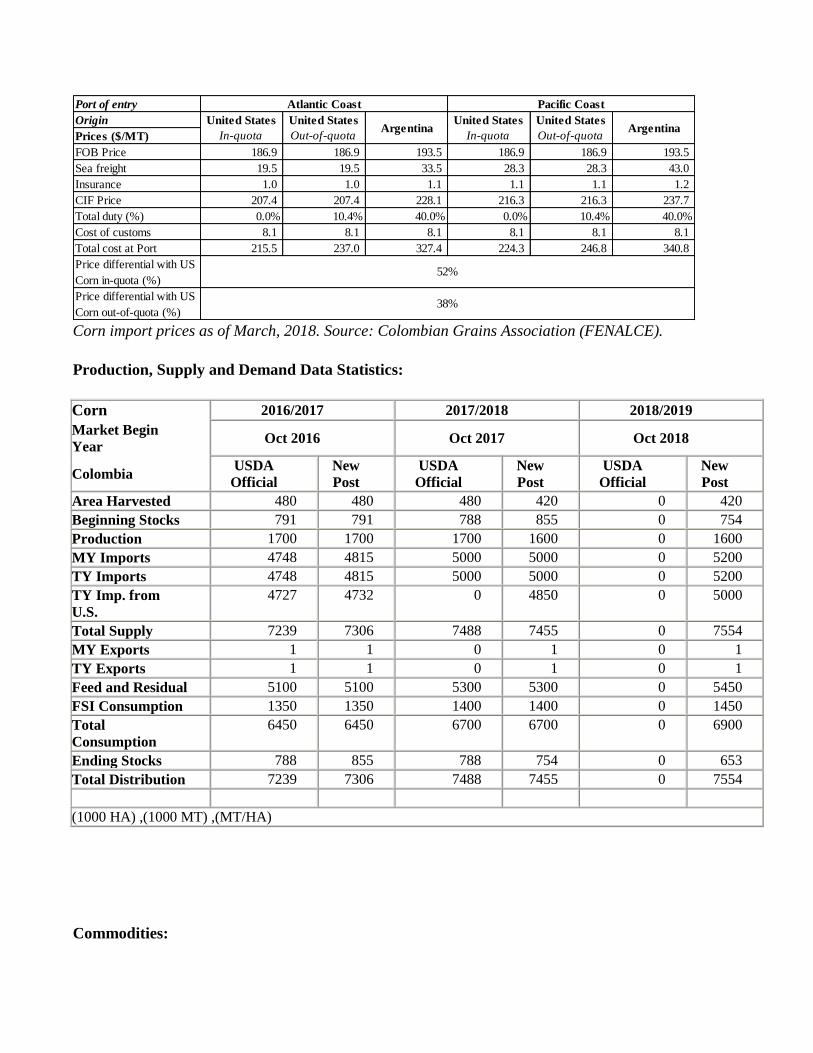
Corn imported from the United States within quota is 52 percent cheaper than corn imported from
Argentina, the main competitor. The chart below illustrates corn import prices in Colombia from the
United States and Argentina as of March, 2018:
Port of entry
Origin
Prices ($/MT)
FOB Price 186.9 186.9 193.5 186.9 186.9 193.5
Sea freight 19.5 19.5 33.5 28.3 28.3 43.0
Insurance 1.0 1.0 1.1 1.1 1.1 1.2
CIF Price 207.4 207.4 228.1 216.3 216.3 237.7
Total duty (%) 0.0% 10.4% 40.0% 0.0% 10.4% 40.0%
Cost of customs 8.1 8.1 8.1 8.1 8.1 8.1
Total cost at Port 215.5 237.0 327.4 224.3 246.8 340.8
Price differential with US
Corn in-quota (%)
Price differential with US
Corn out-of-quota (%)
52%
38%
Atlantic Coast Pacific Coast
United States
In-quotaArgentina
United States
In-quotaArgentina
United States
Out-of-quota
United States
Out-of-quota
Corn import prices as of March, 2018. Source: Colombian Grains Association (FENALCE).
Production, Supply and Demand Data Statistics:
Corn 2016/2017 2017/2018 2018/2019
Market Begin
Year Oct 2016 Oct 2017 Oct 2018
Colombia USDA
Official
New
Post
USDA
Official
New
Post
USDA
Official
New
Post
Area Harvested 480 480 480 420 0 420
Beginning Stocks 791 791 788 855 0 754
Production 1700 1700 1700 1600 0 1600
MY Imports 4748 4815 5000 5000 0 5200
TY Imports 4748 4815 5000 5000 0 5200
TY Imp. from
U.S.
4727 4732 0 4850 0 5000
Total Supply 7239 7306 7488 7455 0 7554
MY Exports 1 1 0 1 0 1
TY Exports 1 1 0 1 0 1
Feed and Residual 5100 5100 5300 5300 0 5450
FSI Consumption 1350 1350 1400 1400 0 1450
Total
Consumption
6450 6450 6700 6700 0 6900
Ending Stocks 788 855 788 754 0 653
Total Distribution 7239 7306 7488 7455 0 7554
(1000 HA) ,(1000 MT) ,(MT/HA)
Commodities:
Production:
After two years of growth, Post forecasts Colombia paddy rice production will decrease to 2.4 million
MT in MY 2018/19. This is a result of low grower prices that will discourage rice producers to plant.
The paddy rice price has decreased to reach levels not seen since 2013, when rice growers reduced area
planted resulting in a fall of paddy rice production of approximately 170,000 MT. In addition, the
National Federation of Colombian Rice Producers (Fedearroz) has been actively conducting campaigns
among producers to decrease area planted to recover price and reduce large stocks. Rice area harvested
is estimated to decrease to 510 Ha in MY 2018/19. Climate conditions are expected to be favorable as
above average rains from the low intensity La Niña weather phenomena will benefit the crop, especially
in rain-fed areas.
In MY 2017/18, Colombian paddy rice production increased to 2.6 million MT, up from the previous
forecast of 2.3 million MT. The larger production is a direct result of more area harvested in the eastern
plains and other rain-fed regions where yields are lower compared to other producing regions. Rice
producers did not follow Fedearroz advice on decreasing area as grower prices were still competitive
during the planting season.
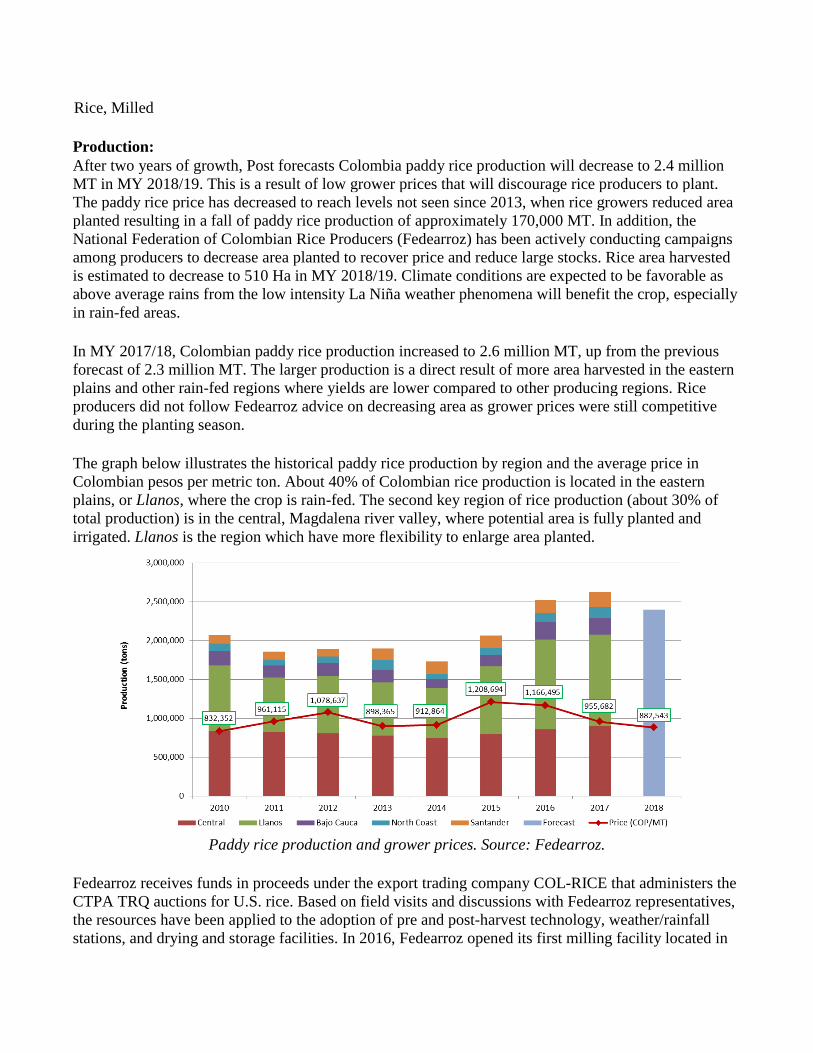
The graph below illustrates the historical paddy rice production by region and the average price in
Colombian pesos per metric ton. About 40% of Colombian rice production is located in the eastern
plains, or Llanos, where the crop is rain-fed. The second key region of rice production (about 30% of
total production) is in the central, Magdalena river valley, where potential area is fully planted and
irrigated. Llanos is the region which have more flexibility to enlarge area planted.
Paddy rice production and grower prices. Source: Fedearroz.
Fedearroz receives funds in proceeds under the export trading company COL-RICE that administers the
CTPA TRQ auctions for U.S. rice. Based on field visits and discussions with Fedearroz representatives,
the resources have been applied to the adoption of pre and post-harvest technology, weather/rainfall
stations, and drying and storage facilities. In 2016, Fedearroz opened its first milling facility located in
Rice, Milled
Pore, Casanare. It has a storage capacity of 32,000 tons and a milling rate of 11 MT of rough paddy per
hour. A new Fedearroz facility located in Meta is scheduled to begin operations in March 2018 with a
storage capacity of 25,000 tons and a milling rate of 10MT of rough rice per hour.
Consumption:
In MY 2018/19, milled rice consumption is projected to reach 1.86 million MT. Rice is one of the key
basic staple foods in Colombia with a high per capita consumption compared to neighboring countries at
about 40 kilograms (90 pounds). Colombian rice consumption is price inelastic; therefore consumption
trends will likely parallel population growth with demand gradually increasing each year.
In an effort to promote rice consumption, Fedearroz launched its first rice store called “Mi Tienda del
Arroz.” The goal of this initiative is to eliminate intermediaries between rice producers and end
customers to maximize their economic benefits. Fedearroz plans to open 20 new stores in 2018 in
Colombia. However, the market is dominated by the two industry-leading millers: Diana Corp and Roa,
which have more than 60 percent market share.
Trade:
In MY 2018/19, Post forecasts Colombian rice imports at 150,000 MT, 34 percent higher than previous
year. The increased CTPA TRQ coupled with decreasing local production will encourage imports.
The CTPA CY 2018 TRQ for U.S. rice is 102,879 MT. The first 2018 TRQ auction was held on
January 29, 2018, resulting in awards for deliveries of 72,043 MT, or about 70 percent of the total 2018
quota. There will be two more auctions to allocate the remaining quota volume: June 7, 2018, for 14,955
MT; and, October 11, 2018, for 15,881 MT. See the COL-RICE website for more details. In 2018, the
TRQ phase-out period for U.S. rice under the CTPA started. The duty on U.S. rice out of quota is 73.8
percent for 2018 and 67.7 percent for 2019.
Despite the fact that in trade year (TY) 2015/16 (calendar year 2016) and TY 2016/17 (calendar year
2017), the imports of rice from the United States were approximately the same, the market share
significantly increased in TY 2016/17. During TY 2015/16, imports were around 300,000 MT, but the
strong dollar and competitive prices in South America opened the opportunity for Mercosur origins to
export to Colombia. During TY 2016/17, domestic supplies were more available so imports dropped to
just over 100,000 tons. U.S. rice benefited from the TRQ access, while Mercosur origins did not have
the same advantage. For TY 2017/18 and TY 2018/19, the United States is expected to remain the
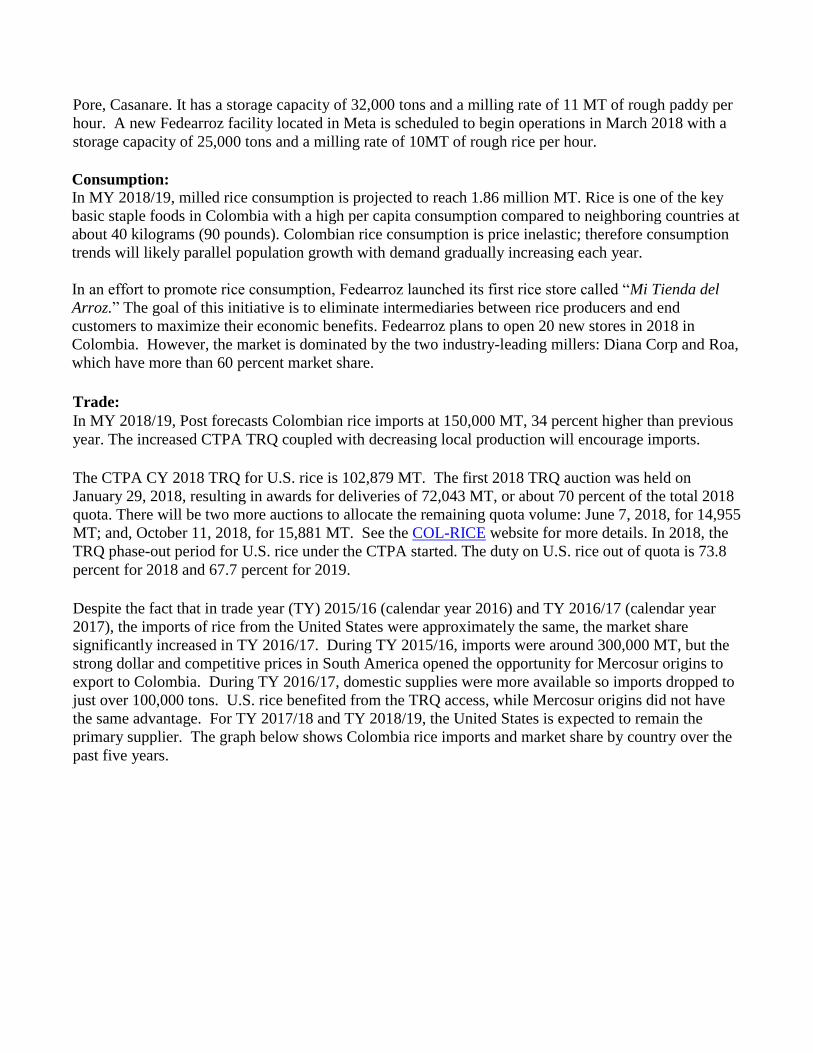
primary supplier. The graph below shows Colombia rice imports and market share by country over the
past five years.
Rice imports by country of origin. Source: DIAN-Global Trade Atlas.
In past years, Colombia historically imported rice, licit and illicit, from neighboring countries; however,
these intra-region trade flows have changed direction over the last two years given several conditions
such as large Colombian domestic production, strong dollar, and Venezuela’s food shortage. In addition,
the re-opening of the common border Colombia-Venezuela have resulted in milled rice trade flows into
Venezuela. The local border state governments and private individuals have been importing scarce
commodities from Colombia, including rice.
Colombia is trying to open new markets overseas for milled rice. Phytosanitary protocols have been
established with the European Union, Canada, Chile and Ecuador. If the initiative of the Government
and Fedearroz to open new markets is successful, and domestic paddy rice production keeps above 2
million MT, Post estimates Colombia will export 15,000 MT of milled rice in MY2018/19.
Stocks:
The Colombian government does not maintain a policy for holding grain stocks; however, on an ad hoc
basis and mostly for rice, the Ministry of Agriculture offers financial storage incentives for producers
and millers to hold inventories in order to regulate market prices. It is estimated that ending stocks for
MY 2018/19 will be down from the year before to 315,000 MT of milled rice, which would satisfy two
months of domestic consumption.
Policy:
Under the Colombian Ministry of Agriculture program “Plan Colombia Siembra,” rice area planted
increased by more than 100,000 hectares in 2016, nevertheless, this significant level of scaling up was
challenged by poor infrastructure with transportation, storage and milling capacity. The overproduction
also led to decreasing grower prices. As a result of this situation, rice growers have protested several
times to the Government of Colombia and requested its support to face the price crisis.
For the calendar year 2018, the Government of Colombia allocated 60,000 million Colombian pesos
($21 million dollars) to support rice growers. The funds will be divided in two programs: $17.5 million
will be given to producers as direct payments to protect farmer’s income and $3.5 million will be
offered through financial storage incentives to regulate market prices. The Ministry of Agriculture also
requested to producers to be cautious regarding the expansion of area planted in 2018, which is
contradictory to its “Plan Colombia Siembra.”
The United States is the only country allowed to export rough/paddy rice to Colombia for human
consumption; however national regulations had restricted U.S. paddy rice access to only the port of
Barranquilla. This restriction was due to concerns over the presence in U.S. paddy rice of Tilletia
horrida, a plant pathogen. Colombian phytosanitary authority (ICA) conducted an epidemiologic study
that determined the presence of Tilletia horrida in Colombian rice producing regions. Given the study
results, in June 2017, ICA annulled the resolution that limited U.S. paddy rice exports to only one port
and removed the phytosanitary pest Tilletia horrida from Colombia’s official pest list. On August 9,
2017 ICA released the phytosanitary requirements to import U.S. rough rice into Colombia. This is the
final step for removing restrictions on U.S. paddy rice that limited exports to the port of Barranquilla,
and means that U.S. paddy rice exporters will have greater flexibility when choosing a Colombian port
of destination.
Under the Andean Community (CAN) Agreement, Colombia and Ecuador have been disputing access of
Ecuadorian rice to Colombia. CAN members (Colombia, Ecuador, Peru and Bolivia) are assessed a
zero-tariff and are not subject to the Andean Price Band System, but a ministerial decree is necessary
before an import permit is issued. In recent years, Colombia did not allowed rice imports from Ecuador
given high prices and poor quality of Ecuadorian rice and large Colombian production. In August 2017,
Ecuador filed a lawsuit against Colombia under the CAN. Ecuador won the case and Colombia will
have to grant access for Ecuadorian rice starting in 2018, following an agreement between the Ministries
of Commerce of both countries.
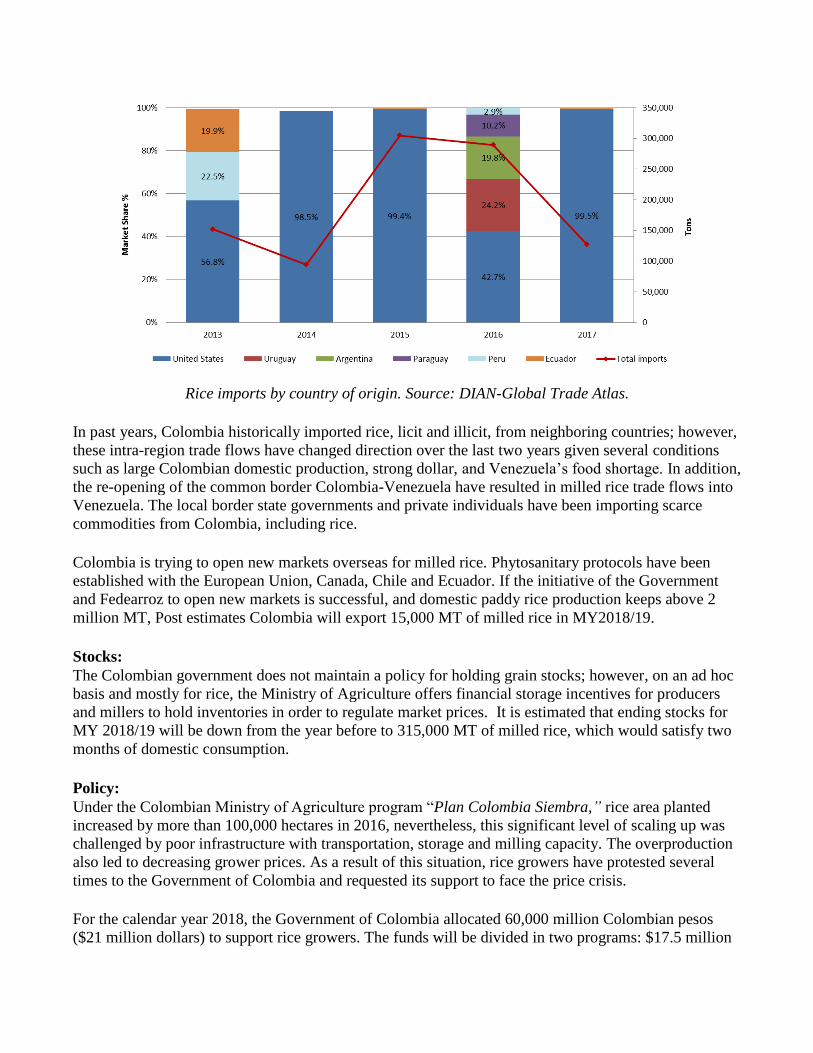
Production, Supply and Demand Data Statistics:
Rice, Milled 2016/2017 2017/2018 2018/2019
Market Begin Year Apr 2016 Apr 2017 Apr 2018
Colombia USDA
Official
New
Post
USDA
Official
New
Post
USDA
Official
New
Post
Area Harvested 520 525 495 570 0 510
Beginning Stocks 142 142 254 318 0 400
Milled Production 1718 1718 1580 1780 0 1640
Rough Production 2526 2526 2324 2618 0 2412
Milling Rate (.9999) 6800 6800 6800 6800 0 6800
MY Imports 149 210 110 112 0 150
TY Imports 110 110 110 110 0 150
TY Imp. from U.S. 0 109 0 110 0 130
Total Supply 2009 2070 1944 2210 0 2190
MY Exports 5 2 10 10 0 15
TY Exports 5 2 10 10 0 15
Consumption and
Residual
1750 1750 1800 1800 0 1860
Ending Stocks 254 318 134 400 0 315
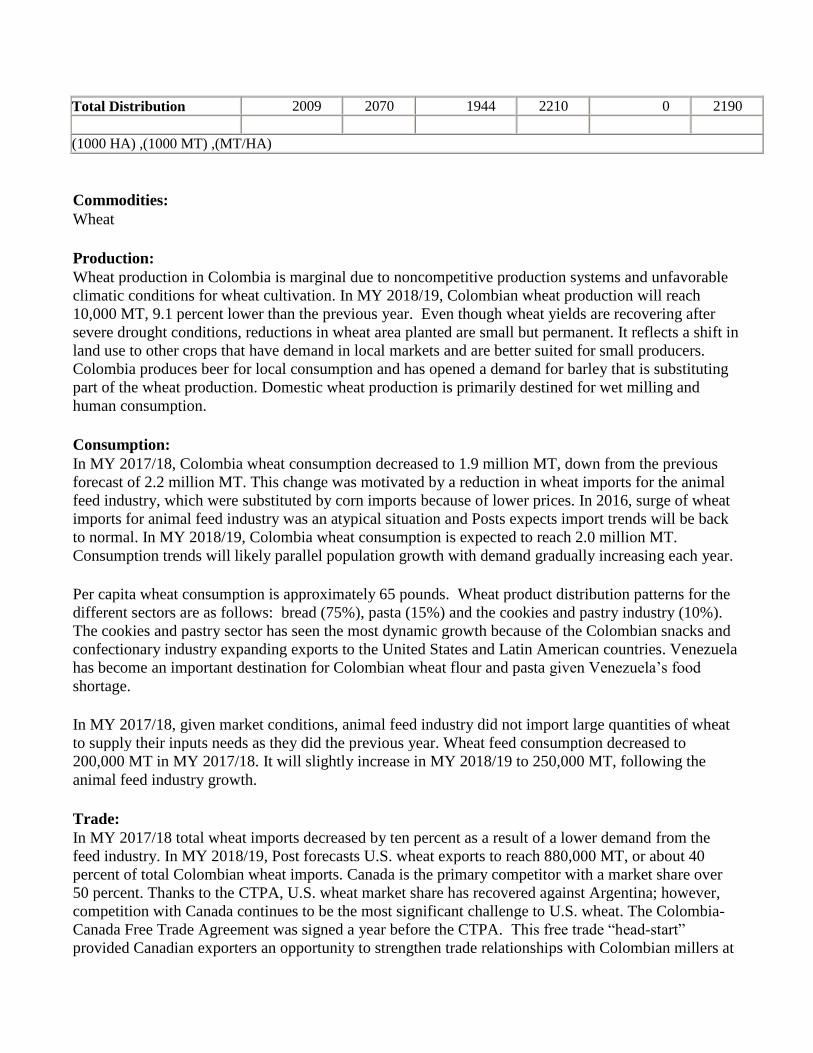
Total Distribution 2009 2070 1944 2210 0 2190
(1000 HA) ,(1000 MT) ,(MT/HA)
Commodities:
Wheat
Production:
Wheat production in Colombia is marginal due to noncompetitive production systems and unfavorable
climatic conditions for wheat cultivation. In MY 2018/19, Colombian wheat production will reach
10,000 MT, 9.1 percent lower than the previous year. Even though wheat yields are recovering after
severe drought conditions, reductions in wheat area planted are small but permanent. It reflects a shift in
land use to other crops that have demand in local markets and are better suited for small producers.
Colombia produces beer for local consumption and has opened a demand for barley that is substituting
part of the wheat production. Domestic wheat production is primarily destined for wet milling and
human consumption.
Consumption:
In MY 2017/18, Colombia wheat consumption decreased to 1.9 million MT, down from the previous
forecast of 2.2 million MT. This change was motivated by a reduction in wheat imports for the animal
feed industry, which were substituted by corn imports because of lower prices. In 2016, surge of wheat
imports for animal feed industry was an atypical situation and Posts expects import trends will be back
to normal. In MY 2018/19, Colombia wheat consumption is expected to reach 2.0 million MT.
Consumption trends will likely parallel population growth with demand gradually increasing each year.
Per capita wheat consumption is approximately 65 pounds. Wheat product distribution patterns for the
different sectors are as follows: bread (75%), pasta (15%) and the cookies and pastry industry (10%).
The cookies and pastry sector has seen the most dynamic growth because of the Colombian snacks and
confectionary industry expanding exports to the United States and Latin American countries. Venezuela
has become an important destination for Colombian wheat flour and pasta given Venezuela’s food
shortage.
In MY 2017/18, given market conditions, animal feed industry did not import large quantities of wheat
to supply their inputs needs as they did the previous year. Wheat feed consumption decreased to
200,000 MT in MY 2017/18. It will slightly increase in MY 2018/19 to 250,000 MT, following the
animal feed industry growth.
Trade:
In MY 2017/18 total wheat imports decreased by ten percent as a result of a lower demand from the
feed industry. In MY 2018/19, Post forecasts U.S. wheat exports to reach 880,000 MT, or about 40
percent of total Colombian wheat imports. Canada is the primary competitor with a market share over
50 percent. Thanks to the CTPA, U.S. wheat market share has recovered against Argentina; however,
competition with Canada continues to be the most significant challenge to U.S. wheat. The Colombia-
Canada Free Trade Agreement was signed a year before the CTPA. This free trade “head-start”
provided Canadian exporters an opportunity to strengthen trade relationships with Colombian millers at
the expense of U.S. wheat. As well, industry sources indicate that the homogeneous quality of
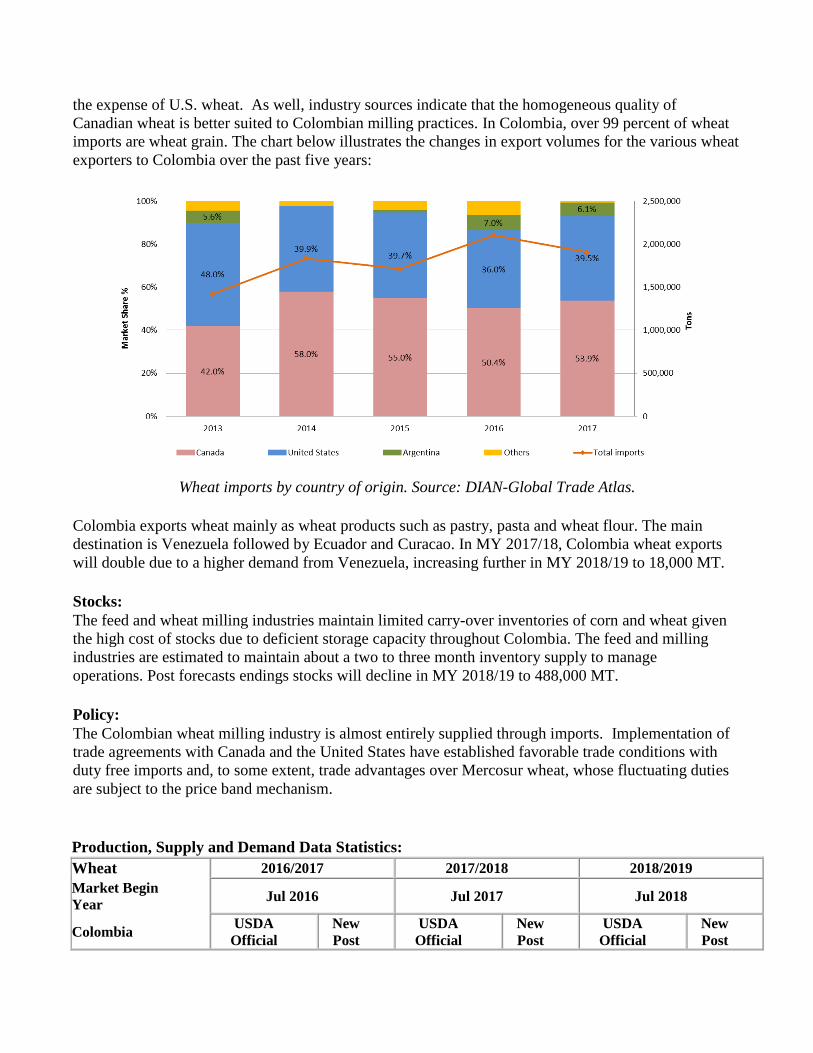
Canadian wheat is better suited to Colombian milling practices. In Colombia, over 99 percent of wheat
imports are wheat grain. The chart below illustrates the changes in export volumes for the various wheat
exporters to Colombia over the past five years:
Wheat imports by country of origin. Source: DIAN-Global Trade Atlas.
Colombia exports wheat mainly as wheat products such as pastry, pasta and wheat flour. The main
destination is Venezuela followed by Ecuador and Curacao. In MY 2017/18, Colombia wheat exports
will double due to a higher demand from Venezuela, increasing further in MY 2018/19 to 18,000 MT.
Stocks:
The feed and wheat milling industries maintain limited carry-over inventories of corn and wheat given
the high cost of stocks due to deficient storage capacity throughout Colombia. The feed and milling
industries are estimated to maintain about a two to three month inventory supply to manage
operations. Post forecasts endings stocks will decline in MY 2018/19 to 488,000 MT.
Policy:
The Colombian wheat milling industry is almost entirely supplied through imports. Implementation of
trade agreements with Canada and the United States have established favorable trade conditions with
duty free imports and, to some extent, trade advantages over Mercosur wheat, whose fluctuating duties
are subject to the price band mechanism.
Production, Supply and Demand Data Statistics:
Wheat 2016/2017 2017/2018 2018/2019
Market Begin
Year Jul 2016 Jul 2017 Jul 2018
Colombia USDA
Official
New
Post
USDA
Official
New
Post
USDA
Official
New
Post
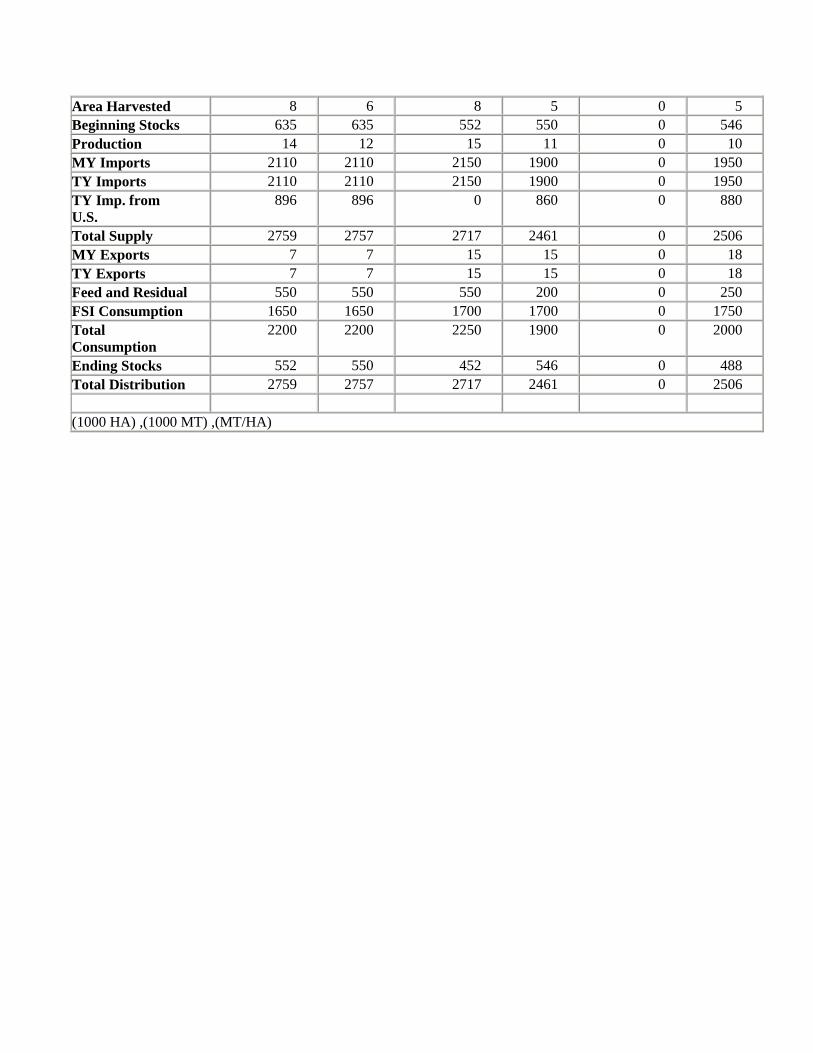
Area Harvested 8 6 8 5 0 5
Beginning Stocks 635 635 552 550 0 546
Production 14 12 15 11 0 10
MY Imports 2110 2110 2150 1900 0 1950
TY Imports 2110 2110 2150 1900 0 1950
TY Imp. from
U.S.
896 896 0 860 0 880
Total Supply 2759 2757 2717 2461 0 2506
MY Exports 7 7 15 15 0 18
TY Exports 7 7 15 15 0 18
Feed and Residual 550 550 550 200 0 250
FSI Consumption 1650 1650 1700 1700 0 1750
Total
Consumption
2200 2200 2250 1900 0 2000
Ending Stocks 552 550 452 546 0 488
Total Distribution 2759 2757 2717 2461 0 2506
(1000 HA) ,(1000 MT) ,(MT/HA)