Embed Size (px)
DESCRIPTION
Graduation Rates: Students Who Started 9 th Grade in 2000, 2001, and 2002. The Bottom Line. Latest 4-year statewide graduation rate is 67%, much too low. Ranges from 45% in Big 4 Cities to 91% in wealthiest districts. - PowerPoint PPT Presentation
Citation preview

1
Graduation Rates:Students Who Started 9th Grade in 2000, 2001,
and 2002

2
The Bottom Line• Latest 4-year statewide graduation rate is 67%, much
too low. Ranges from 45% in Big 4 Cities to 91% in wealthiest districts.
• This disparity declines in the 5th and 6th year of high school. After 6 years, 57% of New York City students had graduated; 94% for Low Need.
• Shows the urgent need for additional funding and accountability, as Regents have advocated.
• Some improvements:• Graduation rates increased for Black and Hispanic
students.• Graduation rate increased for New York City.
3
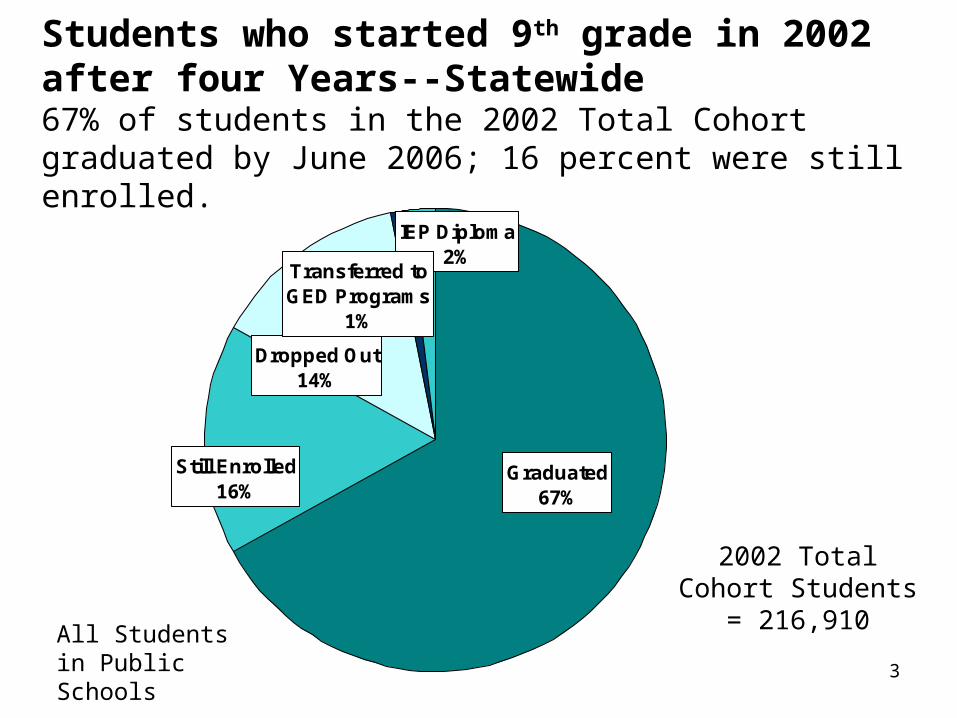
IEP Diploma2%
Still Enrolled16%
Dropped Out14%
Graduated67%
Transferred to GED Programs
1%
Students who started 9th grade in 2002 after four Years--Statewide 67% of students in the 2002 Total Cohort graduated by June 2006; 16 percent were still enrolled.
2002 Total Cohort Students = 216,910
All Students in Public Schools
4
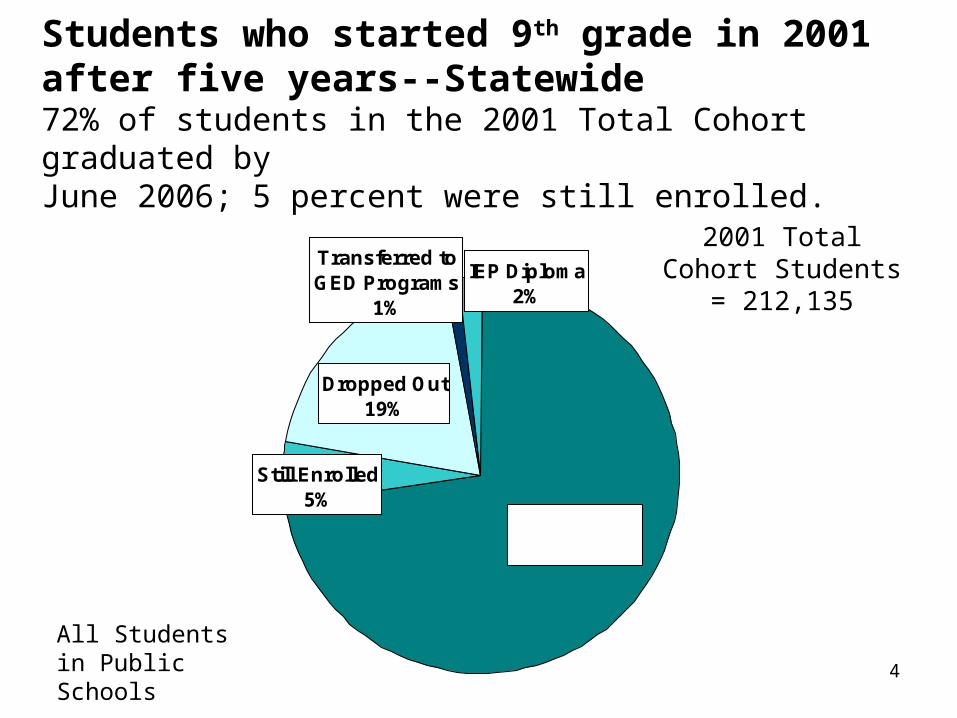
Transferred to GED Programs
1%
IEP Diploma2%
Still Enrolled5%
Dropped Out19%
Graduated 72%
Students who started 9th grade in 2001 after five years--Statewide 72% of students in the 2001 Total Cohort graduated byJune 2006; 5 percent were still enrolled.
2001 Total Cohort Students = 212,135
All Students in Public Schools
5
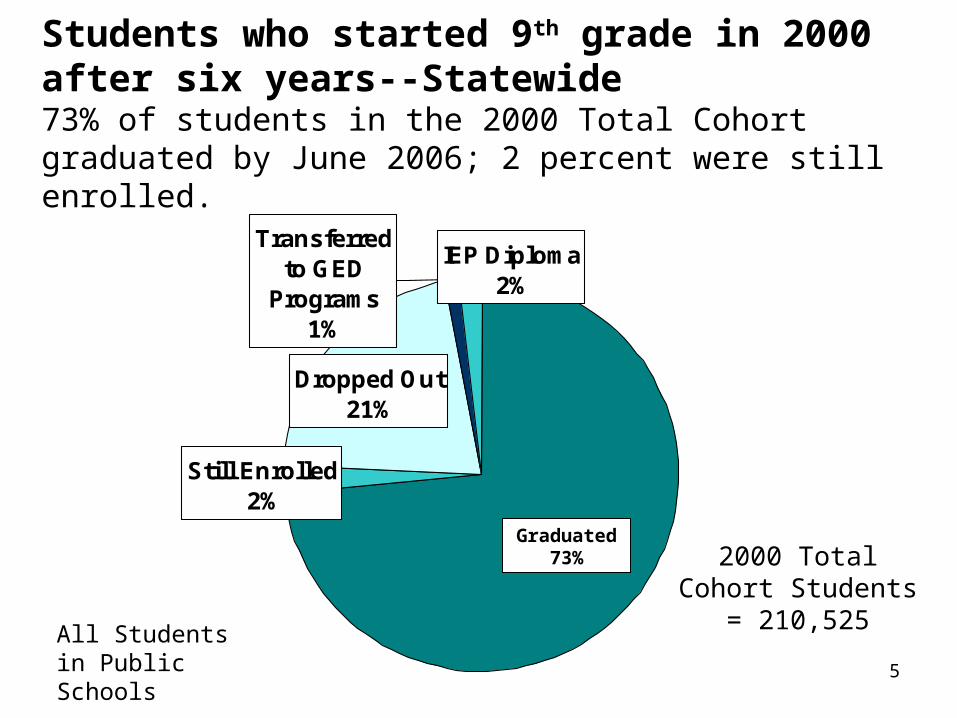
Students who started 9th grade in 2000 after six years--Statewide 73% of students in the 2000 Total Cohort graduated by June 2006; 2 percent were still enrolled.
2000 Total Cohort Students = 210,525
All Students in Public Schools
Dropped Out21%
Still Enrolled2%
IEP Diploma2%
Transferred to GED
Programs1%
Graduated 73%
6
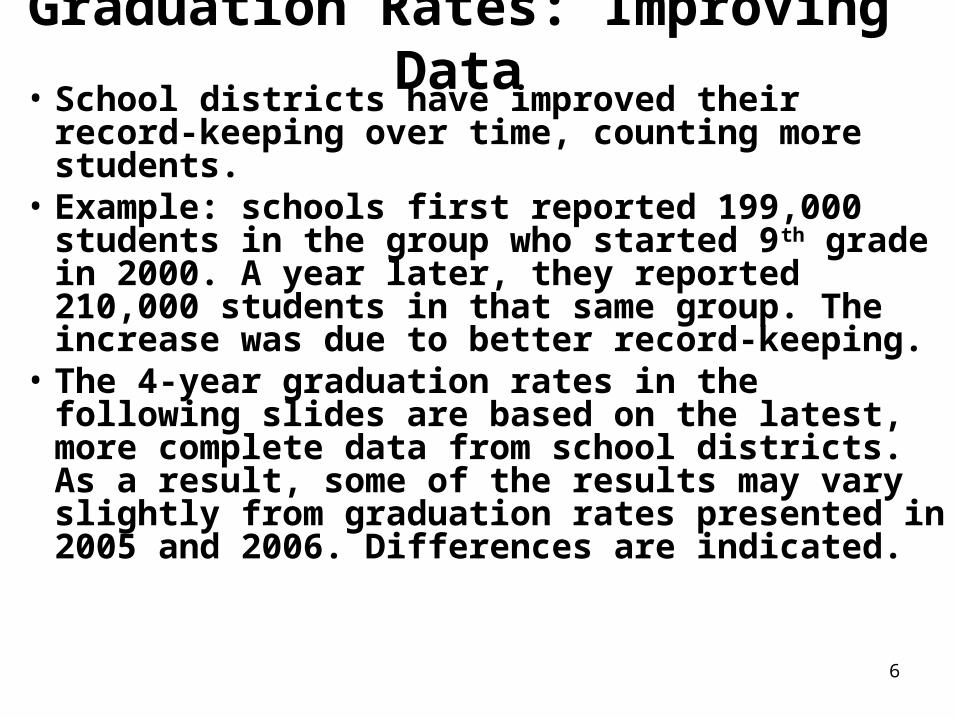
Graduation Rates: Improving Data• School districts have improved their record-
keeping over time, counting more students. • Example: schools first reported 199,000
students in the group who started 9th grade in 2000. A year later, they reported 210,000 students in that same group. The increase was due to better record-keeping.
• The 4-year graduation rates in the following slides are based on the latest, more complete data from school districts. As a result, some of the results may vary slightly from graduation rates presented in 2005 and 2006. Differences are indicated.
7
Graduation Rates: The Total Cohort
• Graduation rates shown in the following slides for the state as a whole and for all need/resource categories (for example, the Big 4 Cities, New York City, High Need Urban/Suburban districts, and so forth) include all students who began 9th grade in a particular year (for example, 2002), no matter how long they remained in school.
8
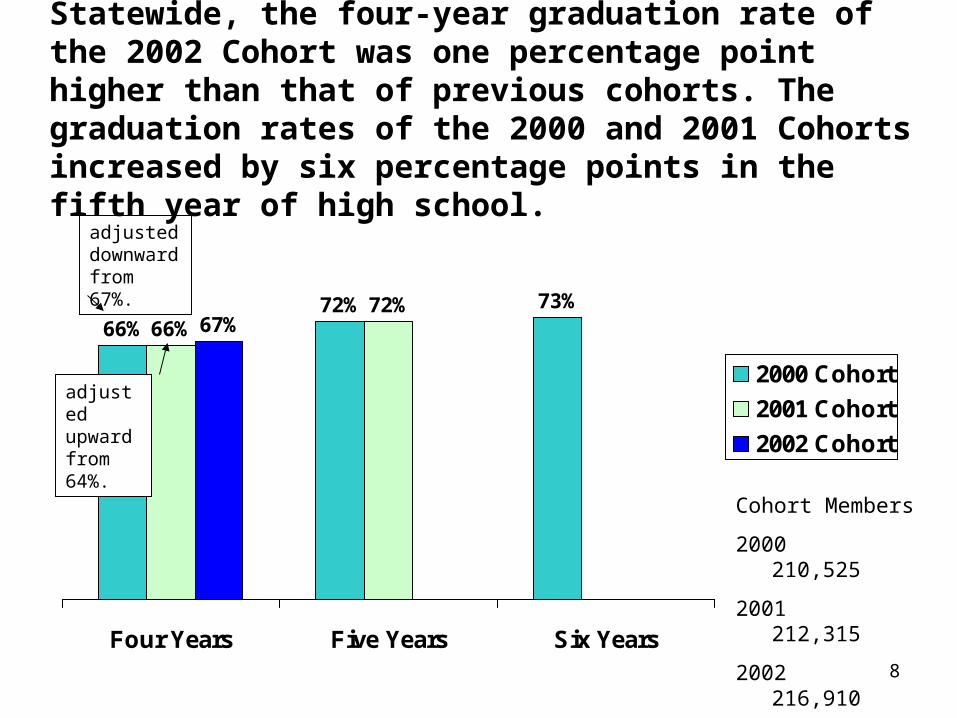
Statewide, the four-year graduation rate of the 2002 Cohort was one percentage point higher than that of previous cohorts. The graduation rates of the 2000 and 2001 Cohorts increased by six percentage points in the fifth year of high school.
66%72% 73%
66%72%
67%
Four Years Five Years Six Years
2000 Cohort
2001 Cohort
2002 Cohort
Cohort Members
2000 210,525
2001 212,315
2002 216,910
adjusted downward from 67%.
adjusted upward from 64%.
9
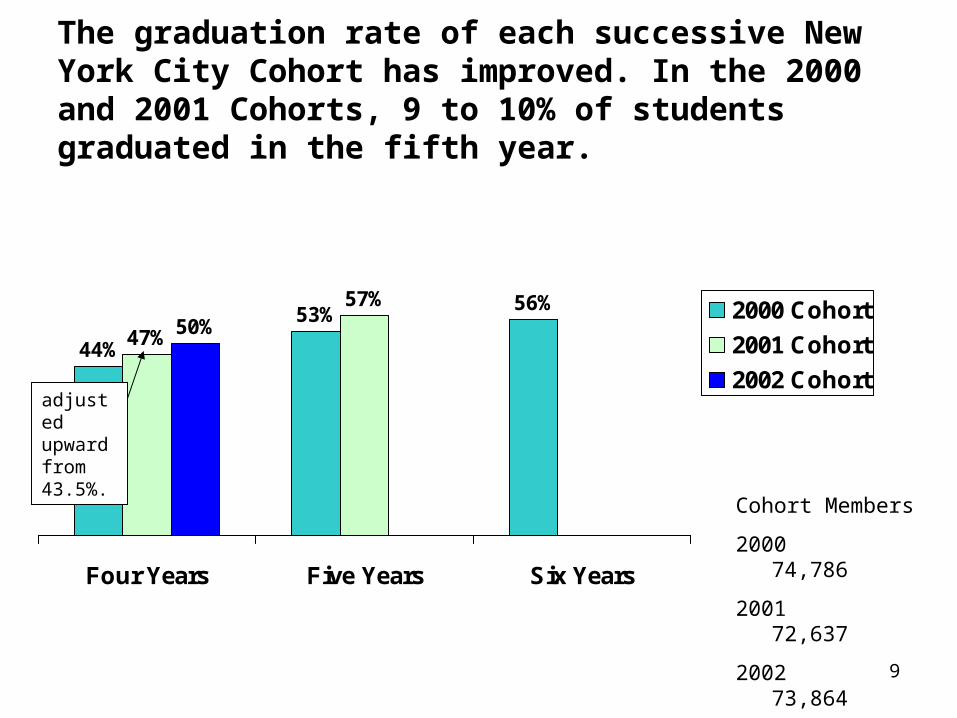
The graduation rate of each successive New York City Cohort has improved. In the 2000 and 2001 Cohorts, 9 to 10% of students graduated in the fifth year.
44%
53%56%
47%
57%50%
Four Years Five Years Six Years
2000 Cohort
2001 Cohort
2002 Cohort
Cohort Members
2000 74,786
2001 72,637
2002 73,864
adjusted upward from 43.5%.
10
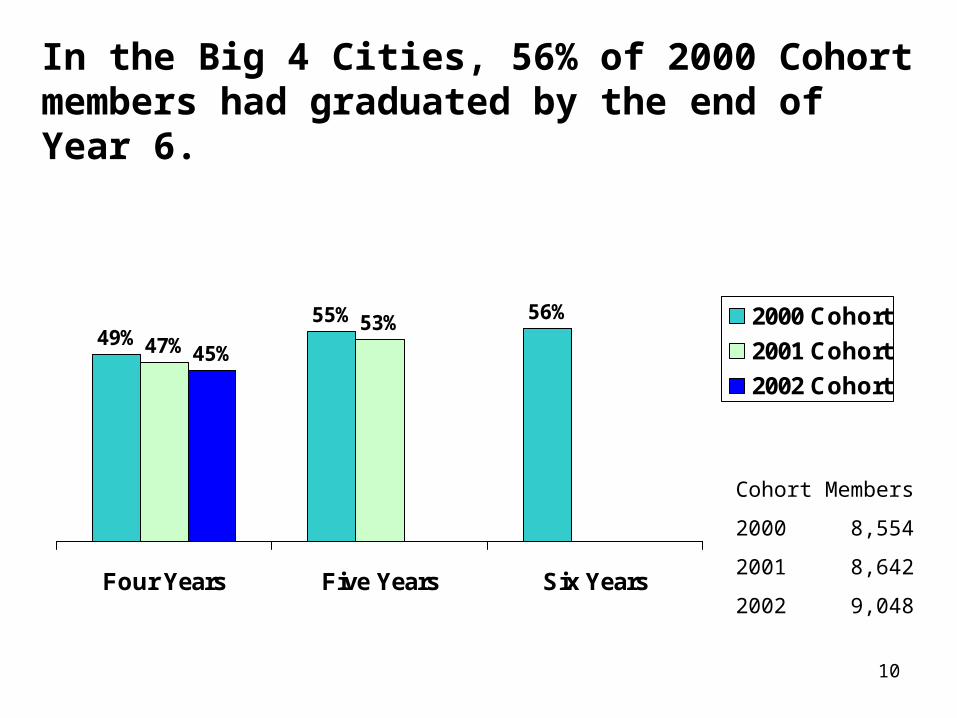
In the Big 4 Cities, 56% of 2000 Cohort members had graduated by the end of Year 6.
49%55% 56%
47%53%
45%
Four Years Five Years Six Years
2000 Cohort
2001 Cohort
2002 Cohort
Cohort Members
2000 8,554
2001 8,642
2002 9,048
11
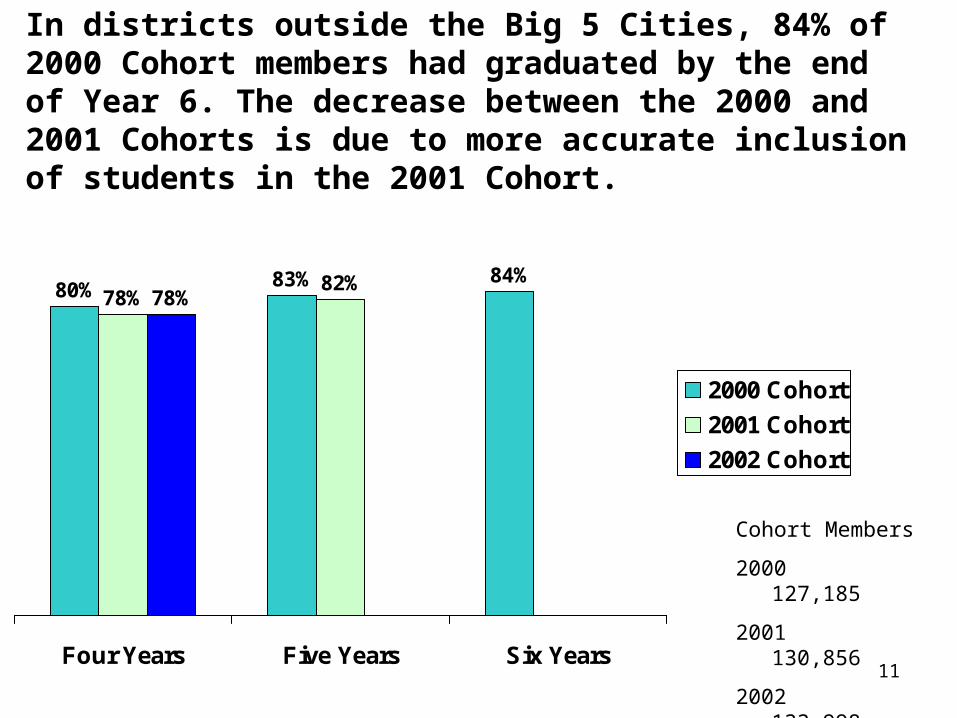
In districts outside the Big 5 Cities, 84% of 2000 Cohort members had graduated by the end of Year 6. The decrease between the 2000 and 2001 Cohorts is due to more accurate inclusion of students in the 2001 Cohort.
80% 83% 84%78%
82%78%
Four Years Five Years Six Years
2000 Cohort
2001 Cohort
2002 Cohort
Cohort Members
2000 127,185
2001 130,856
2002 133,998
12
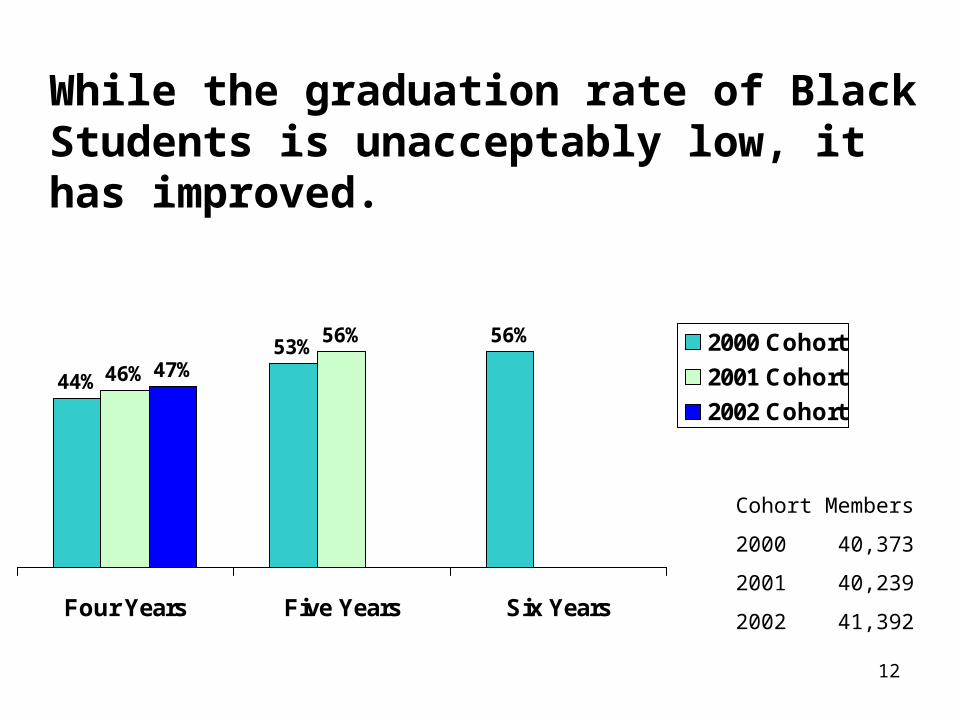
While the graduation rate of Black Students is unacceptably low, it has improved.
44%
53%56%
46%
56%
47%
Four Years Five Years Six Years
2000 Cohort
2001 Cohort
2002 Cohort
Cohort Members
2000 40,373
2001 40,239
2002 41,392
13
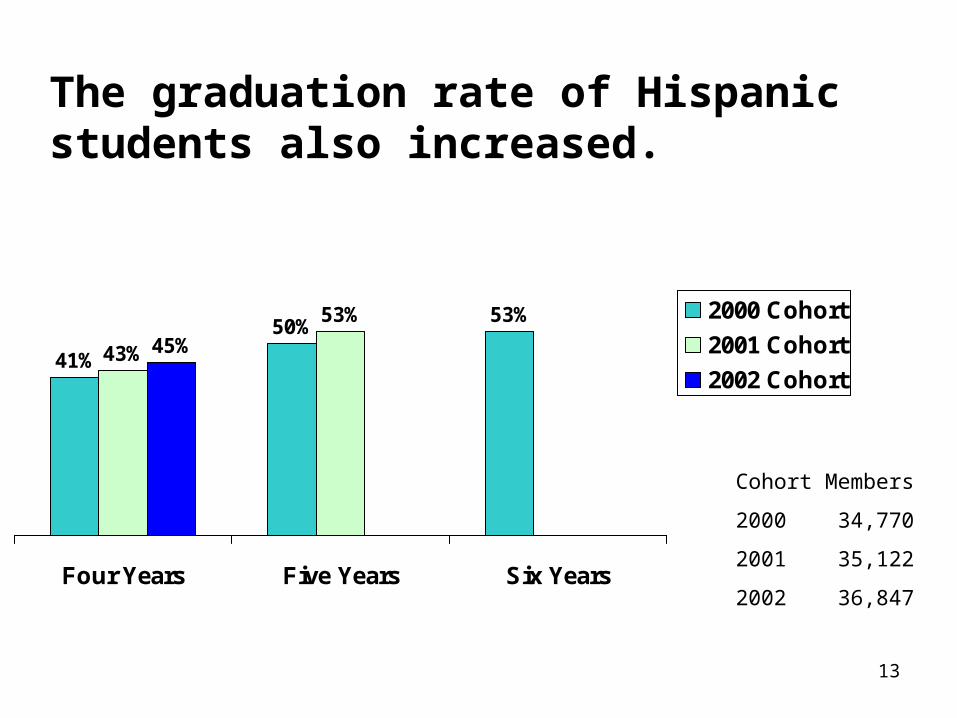
The graduation rate of Hispanic students also increased.
41%
50%53%
43%
53%
45%
Four Years Five Years Six Years
2000 Cohort
2001 Cohort
2002 Cohort
Cohort Members
2000 34,770
2001 35,122
2002 36,847
14
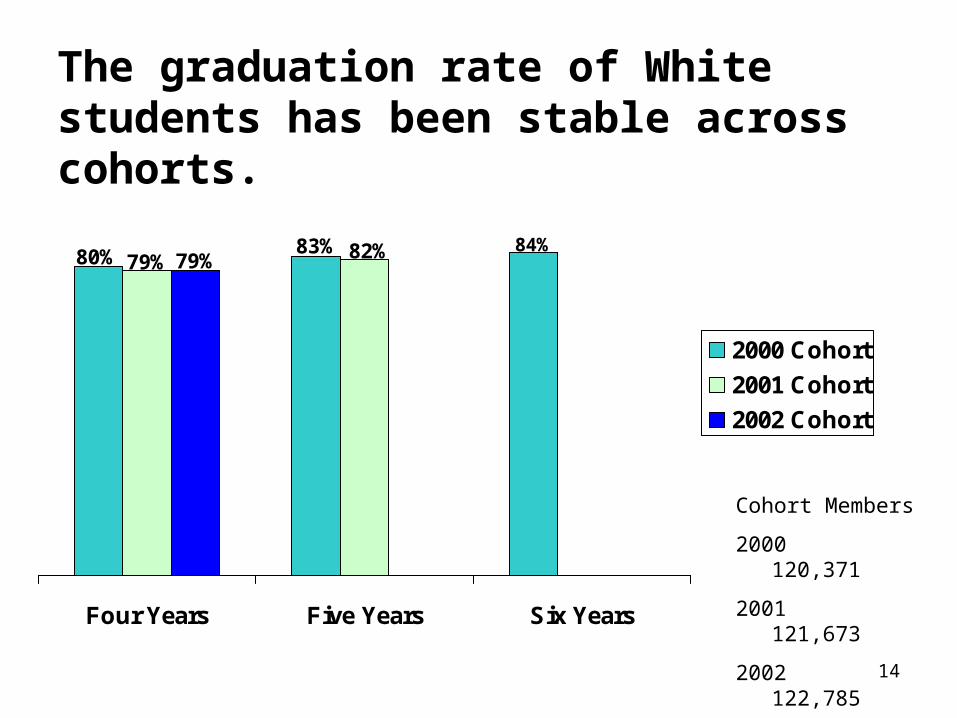
The graduation rate of White students has been stable across cohorts.
80% 83% 84%79% 82%79%
Four Years Five Years Six Years
2000 Cohort
2001 Cohort
2002 Cohort
Cohort Members
2000 120,371
2001 121,673
2002 122,785
15
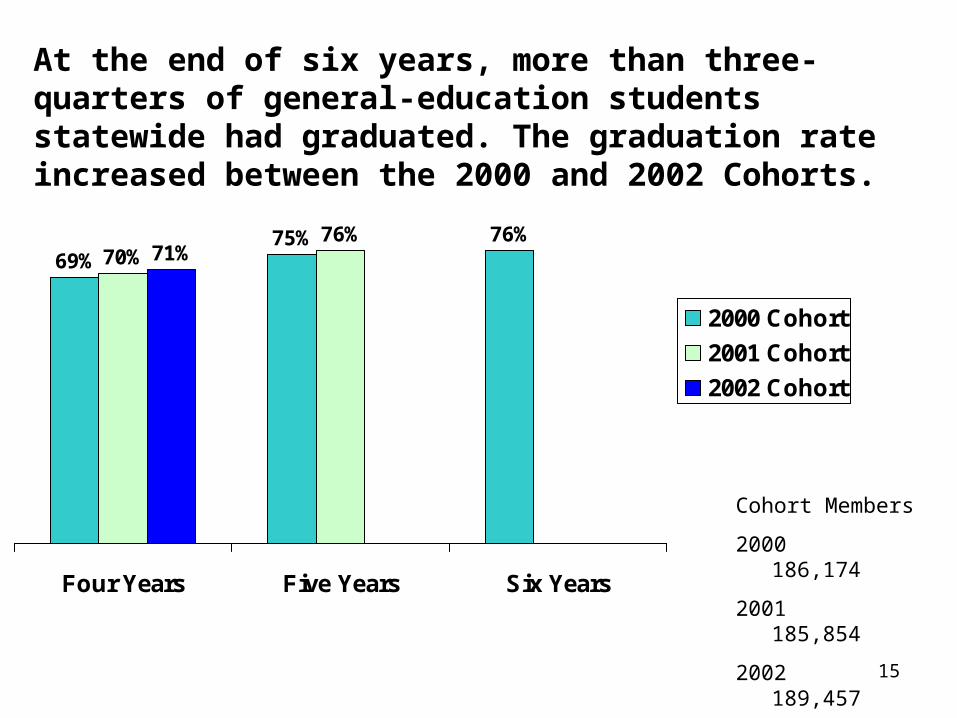
At the end of six years, more than three-quarters of general-education students statewide had graduated. The graduation rate increased between the 2000 and 2002 Cohorts.
69%75% 76%
70%76%
71%
Four Years Five Years Six Years
2000 Cohort
2001 Cohort
2002 Cohort
Cohort Members
2000 186,174
2001 185,854
2002 189,457
16
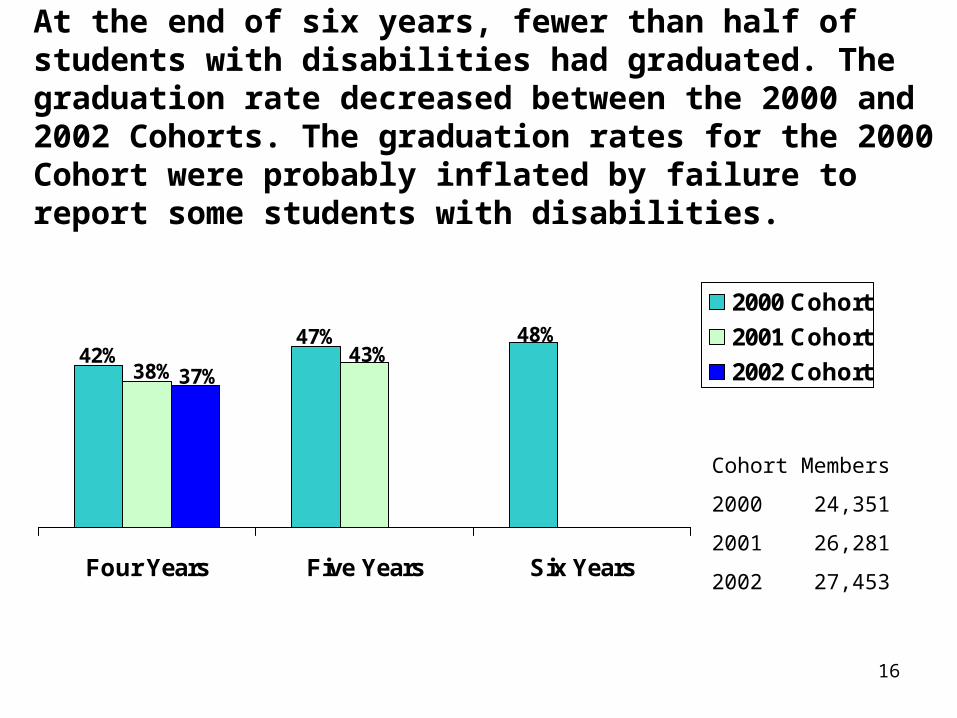
At the end of six years, fewer than half of students with disabilities had graduated. The graduation rate decreased between the 2000 and 2002 Cohorts. The graduation rates for the 2000 Cohort were probably inflated by failure to report some students with disabilities.
48%47%42% 43%
38% 37%
Four Years Five Years Six Years
2000 Cohort
2001 Cohort
2002 Cohort
Cohort Members
2000 24,351
2001 26,281
2002 27,453
17
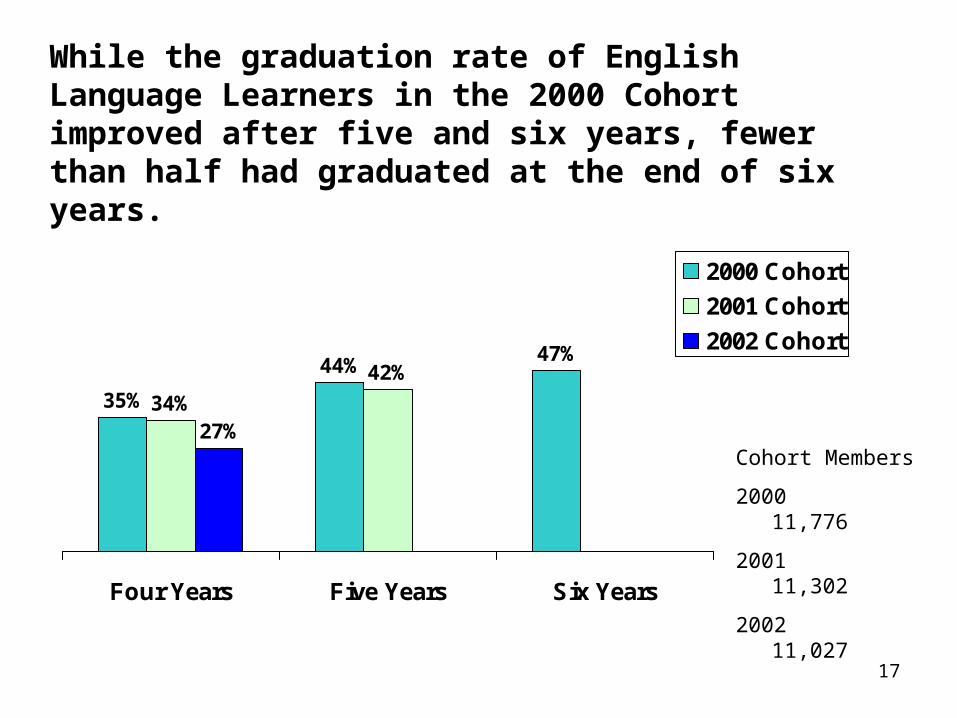
While the graduation rate of English Language Learners in the 2000 Cohort improved after five and six years, fewer than half had graduated at the end of six years.
35%
44%47%
34%
42%
27%
Four Years Five Years Six Years
2000 Cohort
2001 Cohort
2002 Cohort
Cohort Members
2000 11,776
2001 11,302
2002 11,027
18
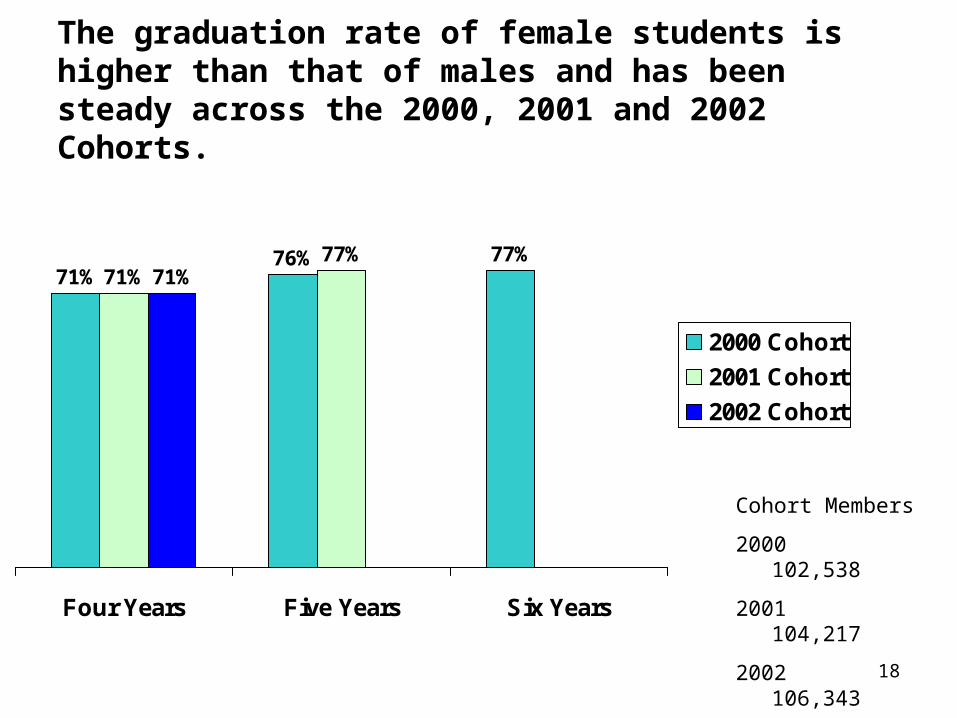
The graduation rate of female students is higher than that of males and has been steady across the 2000, 2001 and 2002 Cohorts.
71%76% 77%
71%77%
71%
Four Years Five Years Six Years
2000 Cohort
2001 Cohort
2002 Cohort
Cohort Members
2000 102,538
2001 104,217
2002 106,343
19
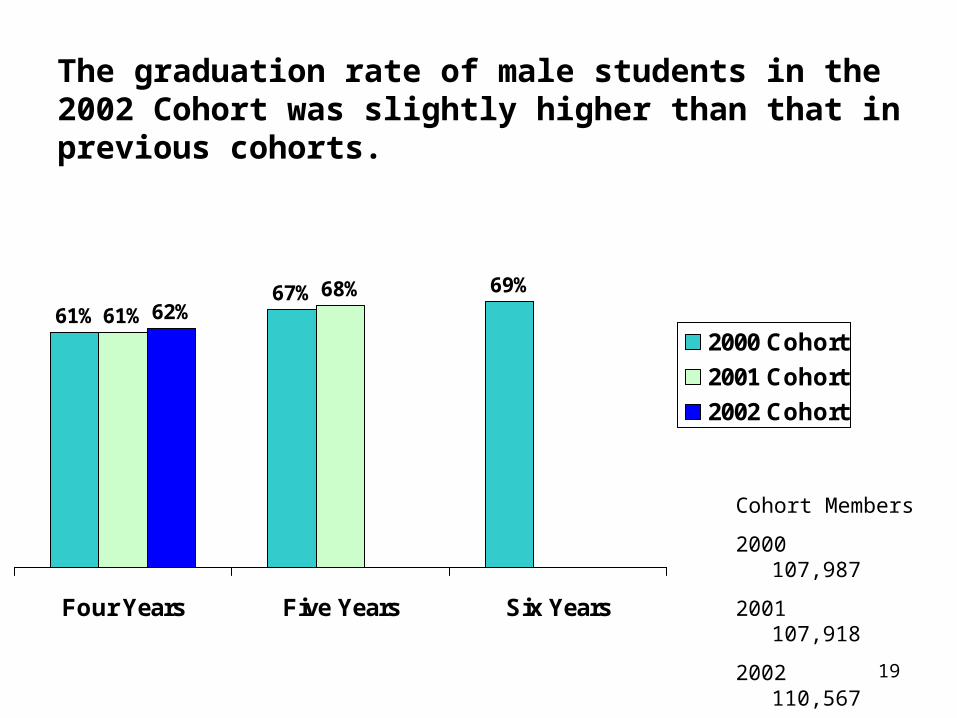
The graduation rate of male students in the 2002 Cohort was slightly higher than that in previous cohorts.
61%67% 69%
61%68%
62%
Four Years Five Years Six Years
2000 Cohort
2001 Cohort
2002 Cohort
Cohort Members
2000 107,987
2001 107,918
2002 110,567
20
Graduation rates vary widely based on student need and district wealth.
21
Needs/Resource Category
Cohort Enroll-ment
Regents/Local
Diploma
IEP diploma
Still enrolled
Trans-ferred to
GED
Dropped Out
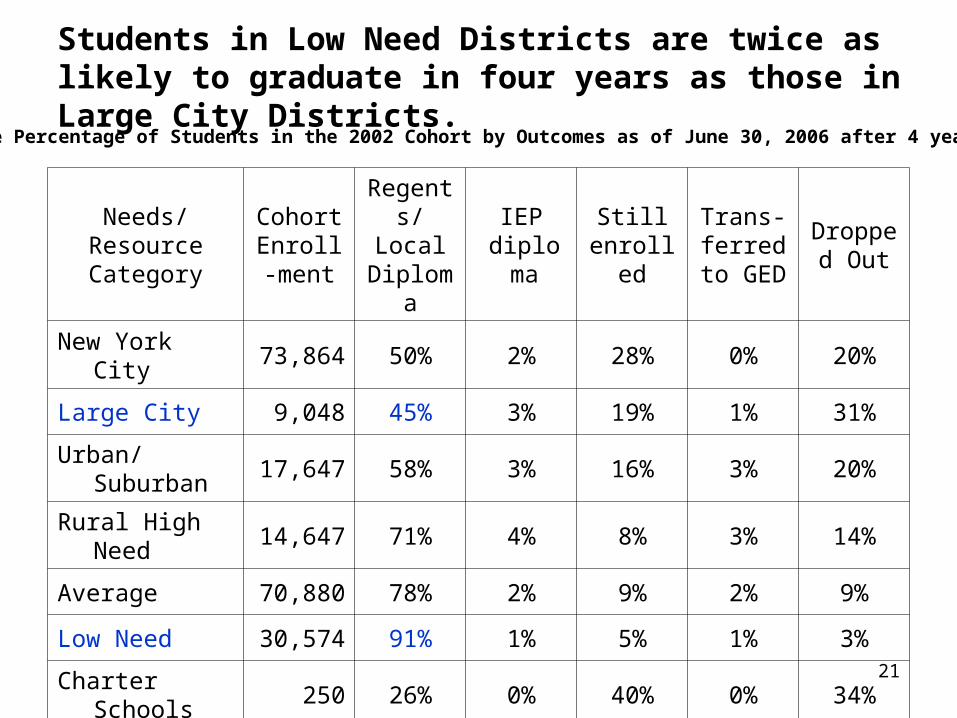
New York City 73,864 50% 2% 28% 0% 20%
Large City 9,048 45% 3% 19% 1% 31%
Urban/Suburban 17,647 58% 3% 16% 3% 20%
Rural High Need 14,647 71% 4% 8% 3% 14%
Average 70,880 78% 2% 9% 2% 9%
Low Need 30,574 91% 1% 5% 1% 3%
Charter Schools 250 26% 0% 40% 0% 34%
Total Public 216,910 67% 2% 16% 1% 14%
The Percentage of Students in the 2002 Cohort by Outcomes as of June 30, 2006 after 4 years
Students in Low Need Districts are twice as likely to graduate in four years as those in Large City Districts.
22
Need/Resource Category
Cohort Enroll-ment
Regents/Local
Diploma
IEP diploma
Still enrolled
Trans-ferred to
GED
Dropped Out
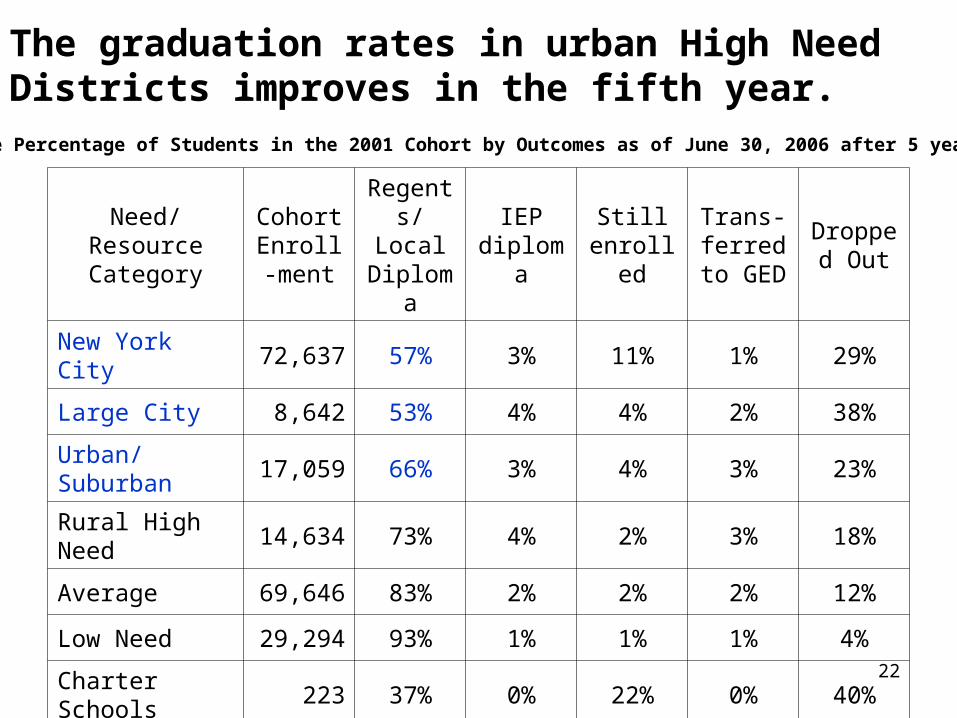
New York City 72,637 57% 3% 11% 1% 29%
Large City 8,642 53% 4% 4% 2% 38%
Urban/Suburban 17,059 66% 3% 4% 3% 23%
Rural High Need 14,634 73% 4% 2% 3% 18%
Average 69,646 83% 2% 2% 2% 12%
Low Need 29,294 93% 1% 1% 1% 4%
Charter Schools 223 37% 0% 22% 0% 40%
Total Public 212,135 72% 2% 5% 1% 19%
The graduation rates in urban High Need Districts improves in the fifth year.
The Percentage of Students in the 2001 Cohort by Outcomes as of June 30, 2006 after 5 years
23
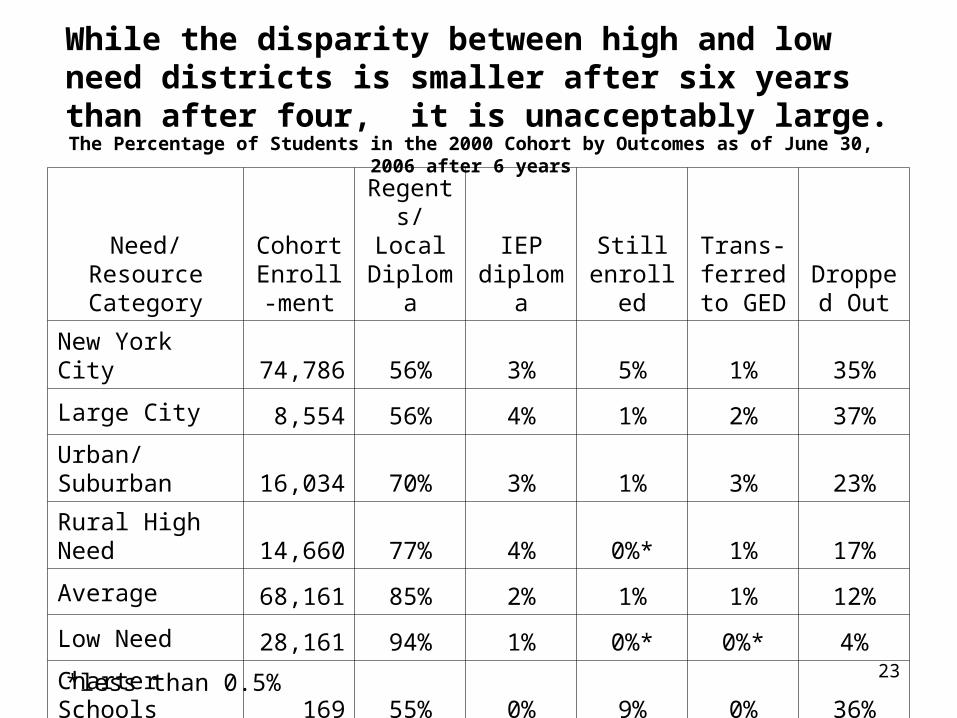
The Percentage of Students in the 2000 Cohort by Outcomes as of June 30, 2006 after 6 years
Need/Resource Category
Cohort Enroll-ment
Regents/Local
DiplomaIEP
diplomaStill
enrolled
Trans-ferred to
GEDDropped
Out
New York City 74,786 56% 3% 5% 1% 35%
Large City 8,554 56% 4% 1% 2% 37%
Urban/Suburban 16,034 70% 3% 1% 3% 23%
Rural High Need14,660 77% 4% 0%* 1% 17%
Average 68,161 85% 2% 1% 1% 12%
Low Need 28,161 94% 1% 0%* 0%* 4%
Charter Schools 169 55% 0% 9% 0% 36%
Total Public 210,525 73% 2% 2% 1% 21%
While the disparity between high and low need districts is smaller after six years than after four, it is unacceptably large.
*less than 0.5%
24
Graduation rates vary according to disability status, ELL status, race/ethnicity, and gender.
25
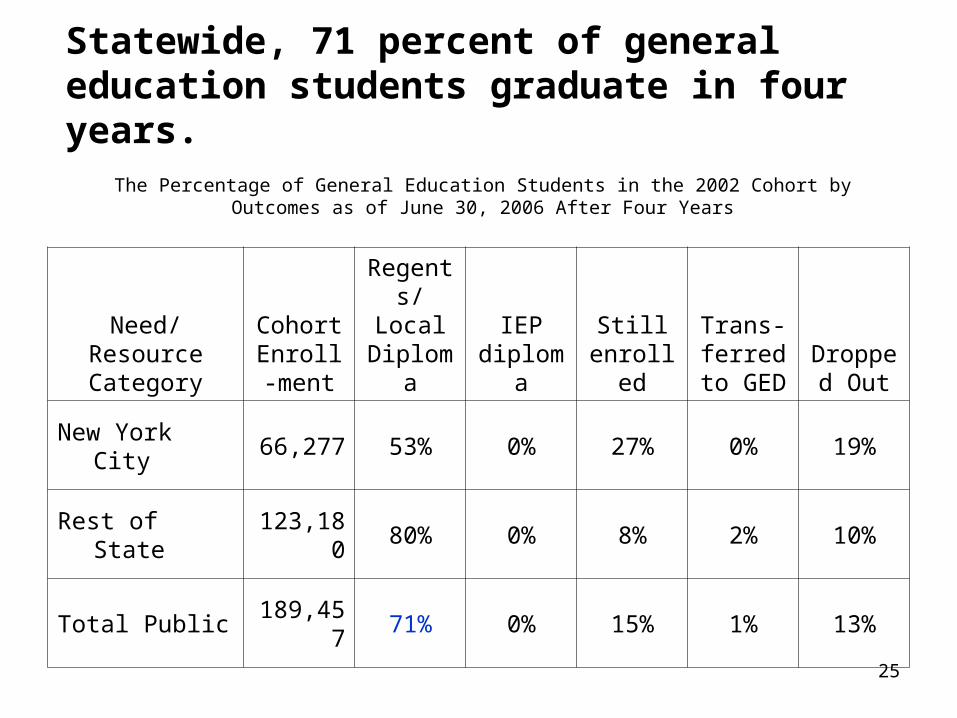
The Percentage of General Education Students in the 2002 Cohort by Outcomes as of June 30, 2006 After Four Years
Need/Resource Category
Cohort Enroll-ment
Regents/Local
DiplomaIEP
diplomaStill
enrolled
Trans-ferred to
GEDDropped
Out
New York City 66,277 53% 0% 27% 0% 19%
Rest of State 123,180 80% 0% 8% 2% 10%
Total Public 189,457 71% 0% 15% 1% 13%
Statewide, 71 percent of general education students graduate in four years.
26
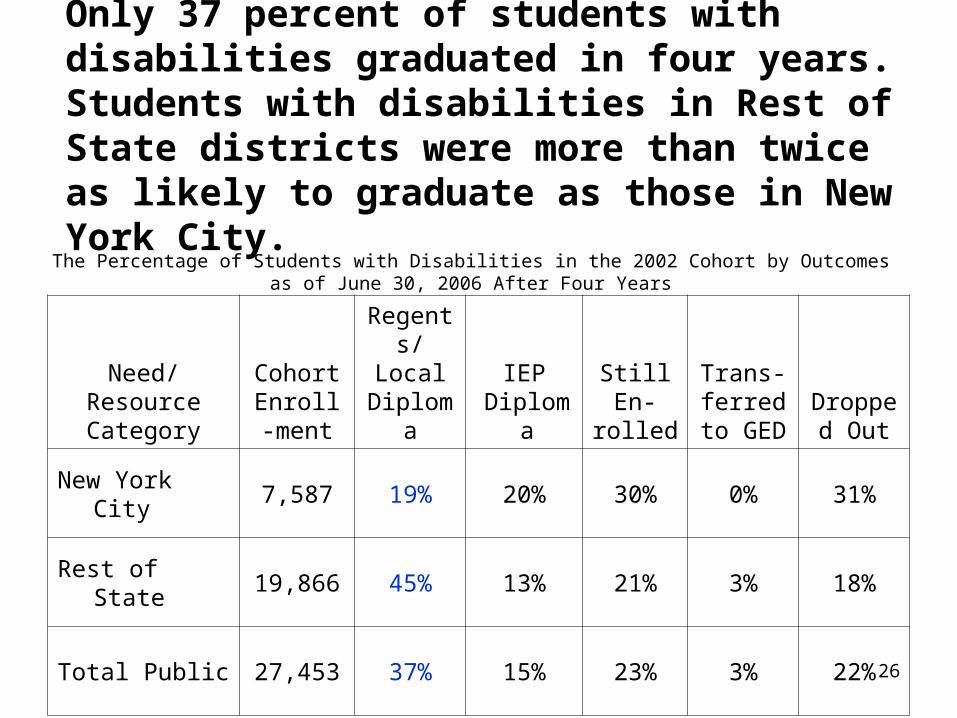
The Percentage of Students with Disabilities in the 2002 Cohort by Outcomes as of June 30, 2006 After Four Years
Need/Resource Category
Cohort Enroll-ment
Regents/Local
DiplomaIEP
DiplomaStill En-rolled
Trans-ferred to
GEDDropped
Out
New York City 7,587 19% 20% 30% 0% 31%
Rest of State 19,866 45% 13% 21% 3% 18%
Total Public 27,453 37% 15% 23% 3% 22%
Only 37 percent of students with disabilities graduated in four years. Students with disabilities in Rest of State districts were more than twice as likely to graduate as those in New York City.
27
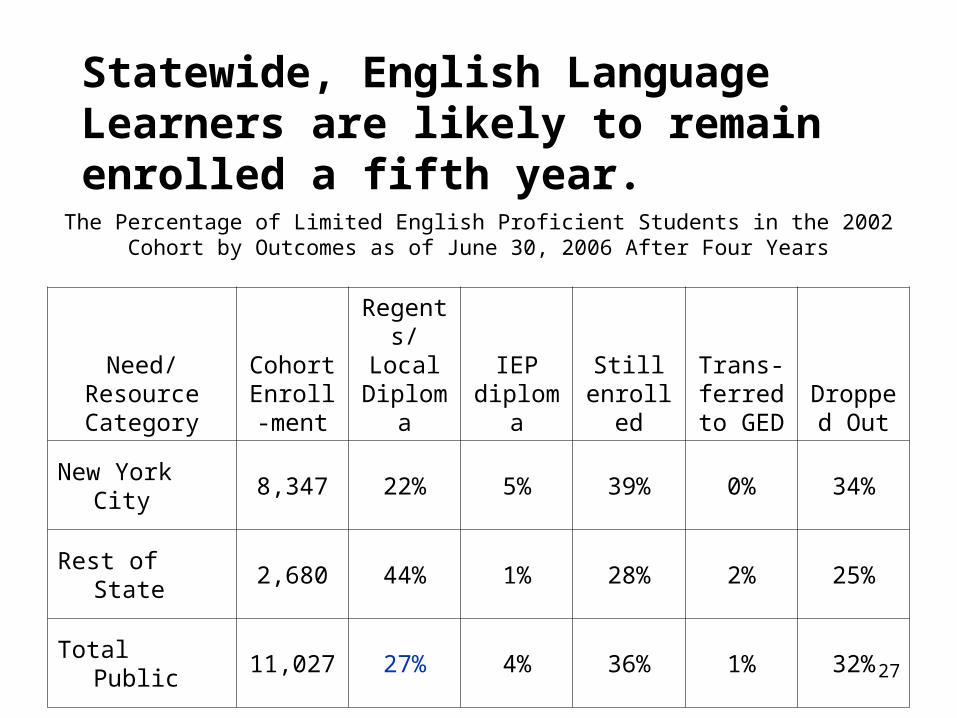
The Percentage of Limited English Proficient Students in the 2002 Cohort by Outcomes as of June 30, 2006 After Four Years
Need/Resource Category
Cohort Enroll-ment
Regents/Local
DiplomaIEP
diplomaStill
enrolled
Trans-ferred to
GEDDropped
Out
New York City 8,347 22% 5% 39% 0% 34%
Rest of State 2,680 44% 1% 28% 2% 25%
Total Public 11,027 27% 4% 36% 1% 32%
Statewide, English Language Learners are likely to remain enrolled a fifth year.
28
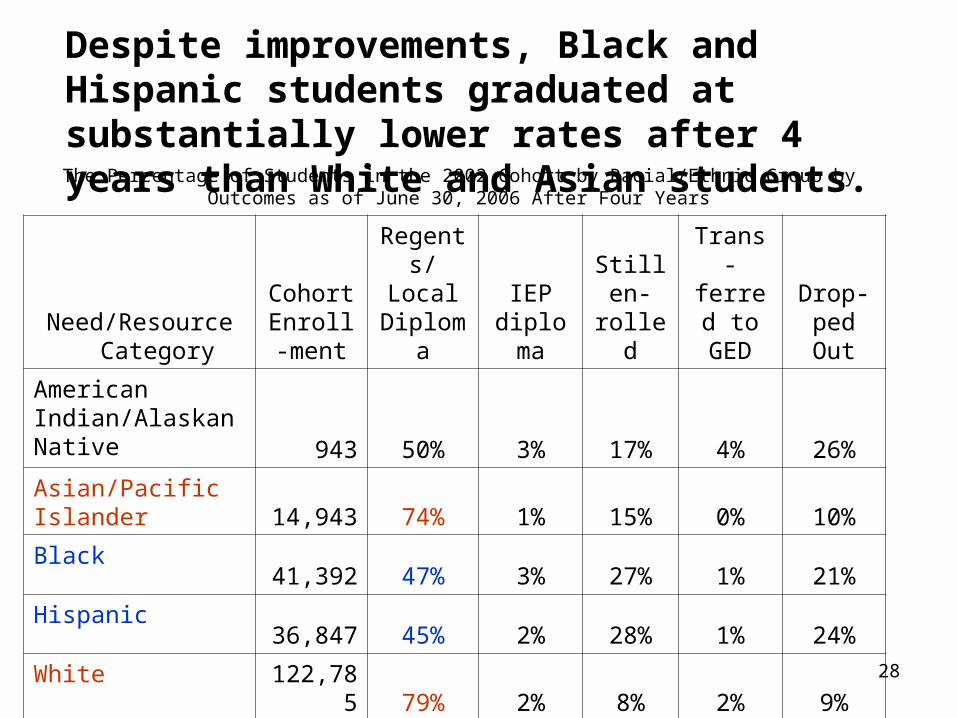
The Percentage of Students in the 2002 Cohort by Racial/Ethnic Group by Outcomes as of June 30, 2006 After Four Years
Need/Resource Category
Cohort Enroll-ment
Regents/Local
DiplomaIEP
diploma
Still en-
rolled
Trans-ferred
to GED
Drop-ped Out
American Indian/Alaskan Native 943 50% 3% 17% 4% 26%
Asian/Pacific Islander 14,943 74% 1% 15% 0% 10%
Black41,392 47% 3% 27% 1% 21%
Hispanic36,847 45% 2% 28% 1% 24%
White122,785 79% 2% 8% 2% 9%
Despite improvements, Black and Hispanic students graduated at substantially lower rates after 4 years than White and Asian students.
29
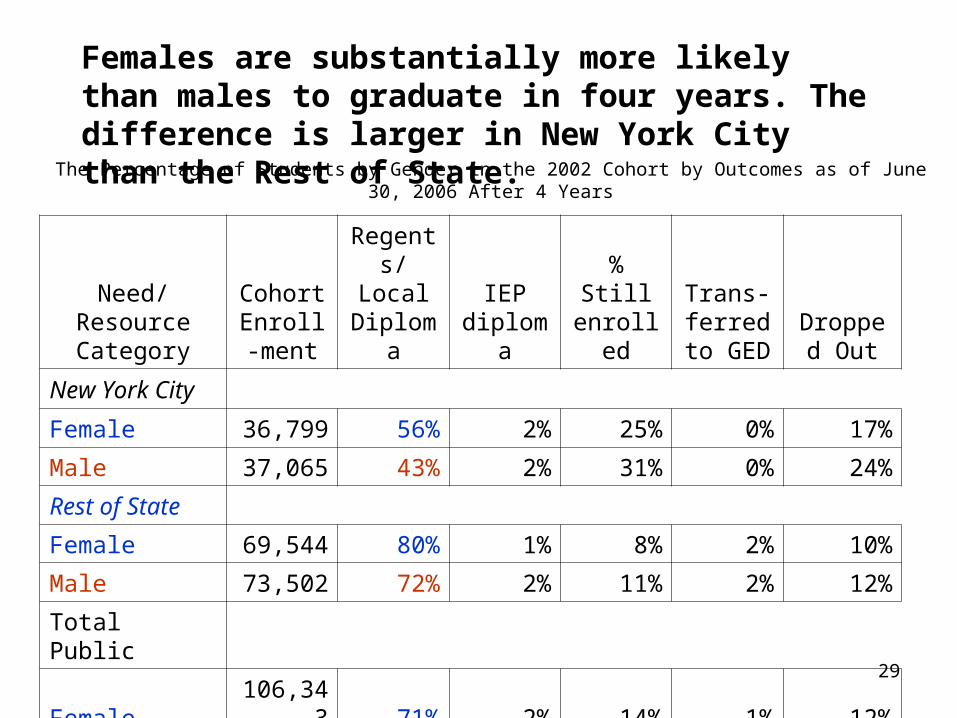
The Percentage of Students by Gender in the 2002 Cohort by Outcomes as of June 30, 2006 After 4 Years
Need/Resource Category
Cohort Enroll-ment
Regents/Local
DiplomaIEP
diploma% Still
enrolled
Trans-ferred to
GEDDropped
Out
New York City
Female 36,799 56% 2% 25% 0% 17%
Male 37,065 43% 2% 31% 0% 24%
Rest of State
Female 69,544 80% 1% 8% 2% 10%
Male 73,502 72% 2% 11% 2% 12%
Total Public
Female 106,343 71% 2% 14% 1% 12%
Male 110,567 62% 2% 18% 2% 16%
Females are substantially more likely than males to graduate in four years. The difference is larger in New York City than the Rest of State.
30
Graduation Rates: Accountability for School Districts
• Under the NCLB accountability system in New York State, individual school districts and schools are held accountable for all students who start 9th grade in a particular year (for example, 2002) and stay in school for at least 5 months during high school and do not transfer to another district or school. Therefore, the graduation rates for New York City’s community school districts and for all other school districts are computed in this way.
• Those are the rates you see in the following slides.
31
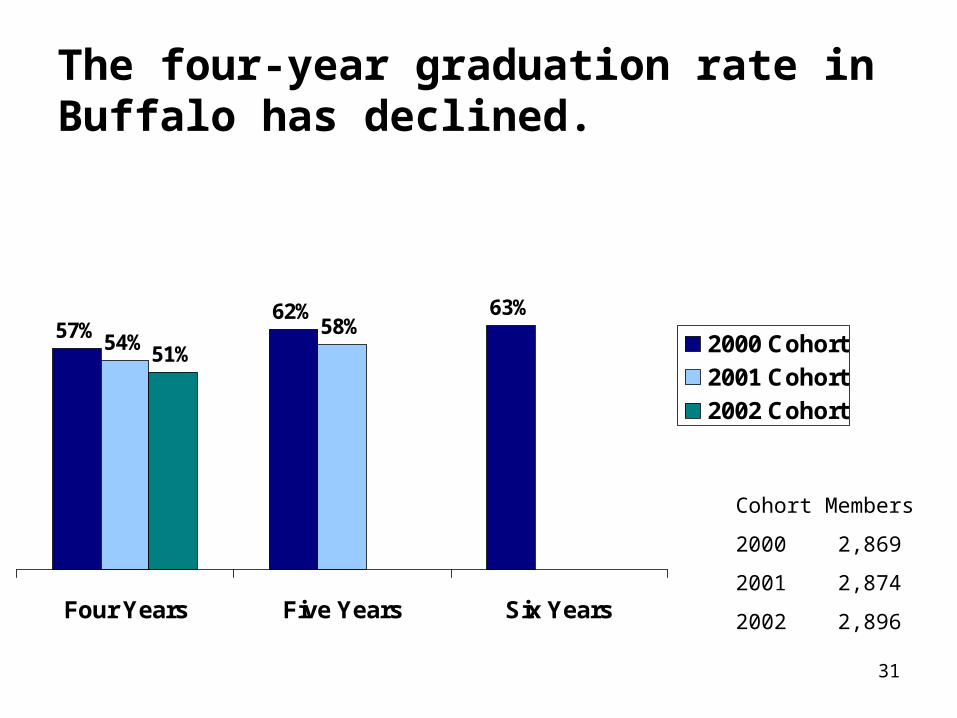
The four-year graduation rate in Buffalo has declined.
57%62% 63%
54%58%
51%
Four Years Five Years Six Years
2000 Cohort
2001 Cohort
2002 Cohort
Cohort Members
2000 2,869
2001 2,874
2002 2,896
32
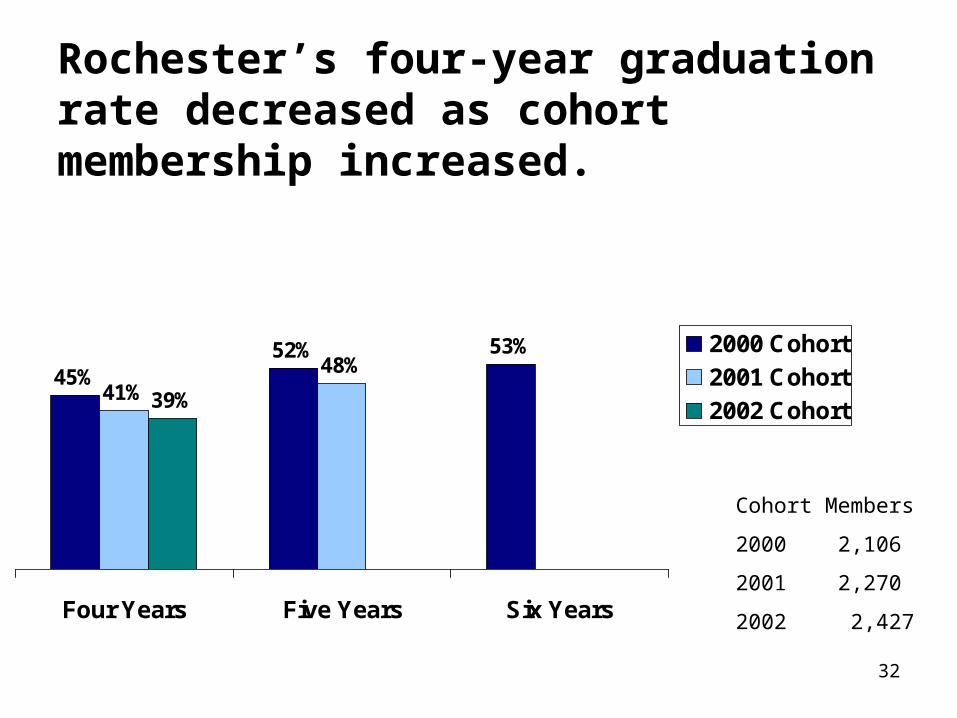
Rochester’s four-year graduation rate decreased as cohort membership increased.
45%52% 53%
41%48%
39%
Four Years Five Years Six Years
2000 Cohort
2001 Cohort
2002 Cohort
Cohort Members
2000 2,106
2001 2,270
2002 2,427
33
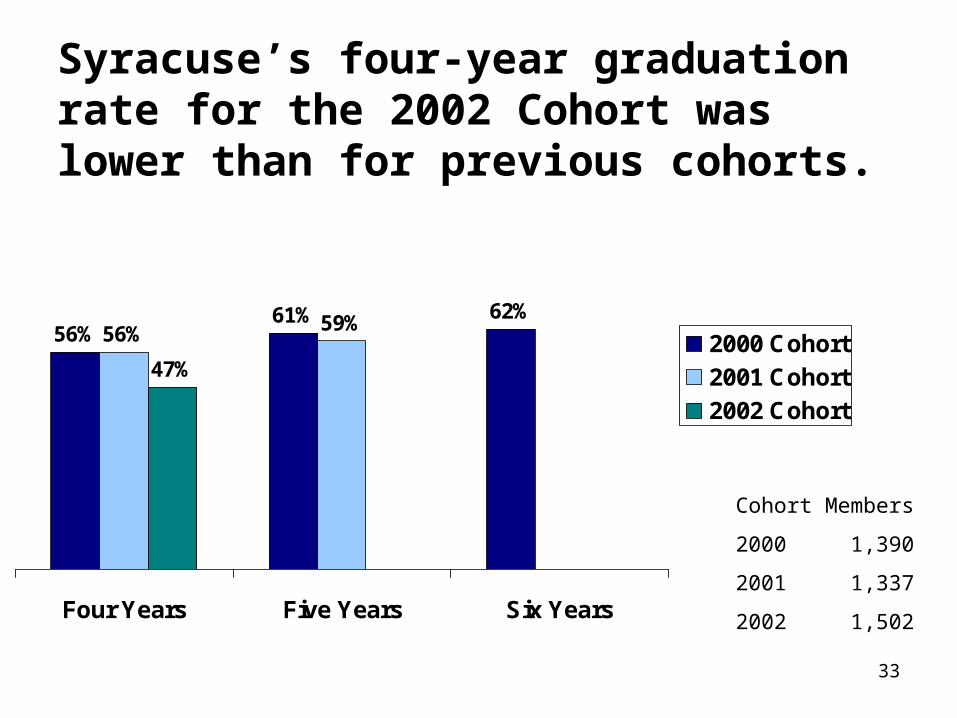
Syracuse’s four-year graduation rate for the 2002 Cohort was lower than for previous cohorts.
56%61% 62%
56% 59%
47%
Four Years Five Years Six Years
2000 Cohort
2001 Cohort
2002 Cohort
Cohort Members
2000 1,390
2001 1,337
2002 1,502
34
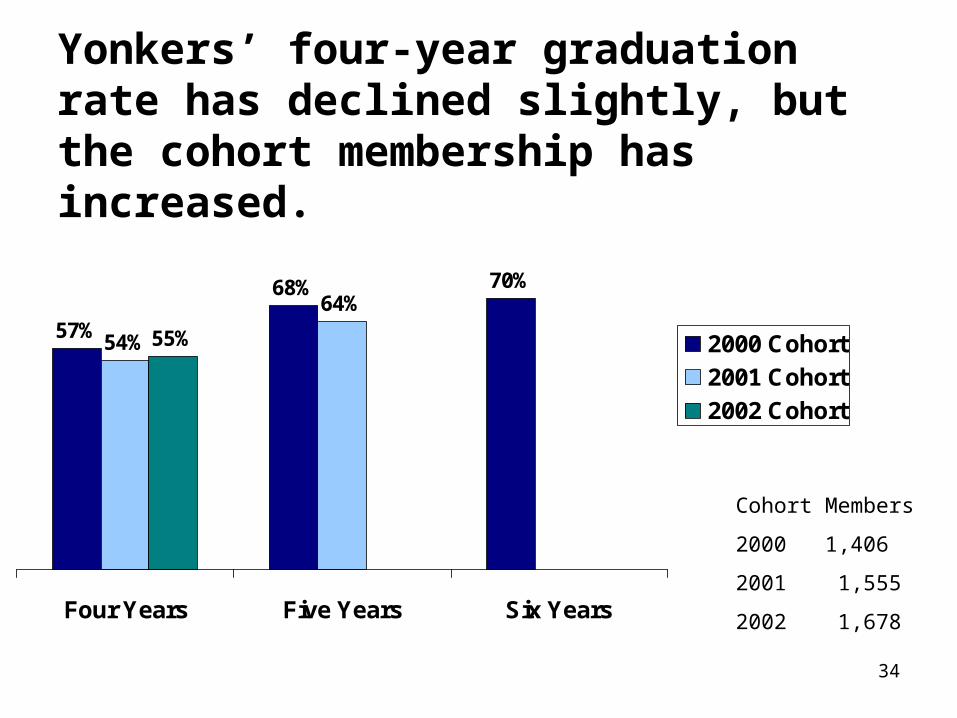
Yonkers’ four-year graduation rate has declined slightly, but the cohort membership has increased.
57%
68% 70%
54%
64%
55%
Four Years Five Years Six Years
2000 Cohort
2001 Cohort
2002 Cohort
Cohort Members
2000 1,406
2001 1,555
2002 1,678
35
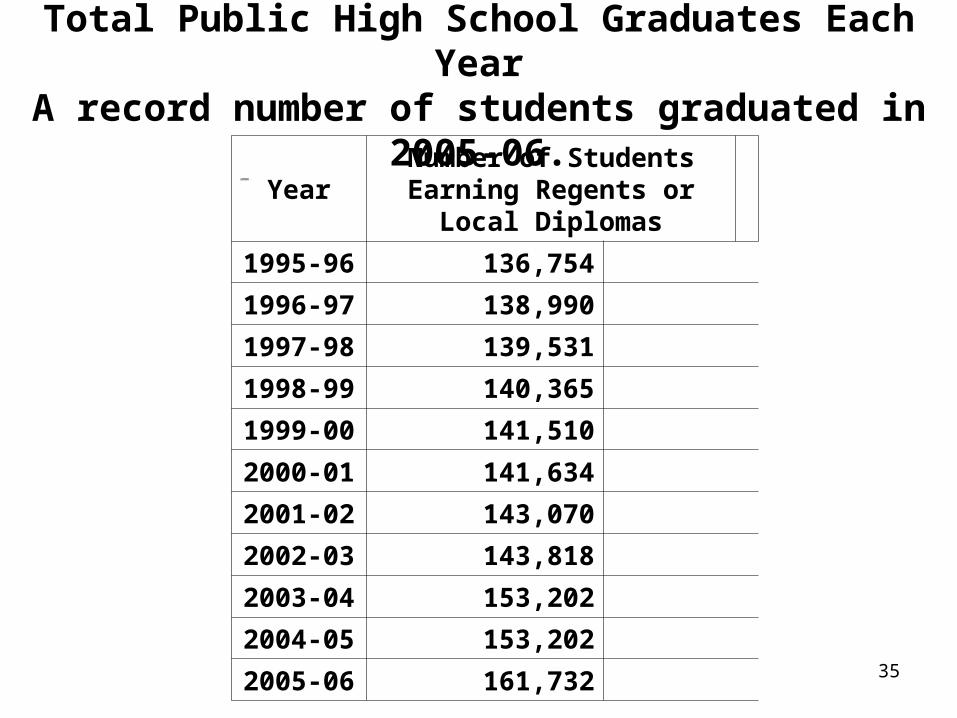
Total Public High School Graduates Each YearA record number of students graduated in 2005-06.
13
1,2
13
1,2
13
1,7
13
3,1
13
2,8
13
1,1
13
3,2
14
1,5
57
,4
7
59
,8
4
62
,5
5
67
,6
6
70
,1
2
76
,0
5
78
,6
6
84
,1
91
02
,4
14
1,4
1 2 2
HS Graduates Regents Diplomas
YearNumber of Students Earning Regents or
Local Diplomas
1995-96
136,754
1996-97
138,990
1997-98
139,531
1998-99
140,365
1999-00
141,510
2000-01
141,634
2001-02
143,070
2002-03
143,818
2003-04
153,202
2004-05
153,202
2005-06
161,732
36
The Bottom Line• Latest 4-year statewide graduation rate is 67%, much
too low. Ranges from 45% in Big 4 Cities to 91% in wealthiest districts.
• This disparity declines in the 5th and 6th year of high school. After 6 years, 57% of New York City students had graduated; 94% for Low Need.
• Shows the urgent need for additional funding and accountability, as Regents have advocated.
• Some improvements:• Graduation rates increased for Black and Hispanic
students.• Graduation rate increased for New York City.
37
What Successful Schools Do to Raise Graduation Rates
• Focus on improving the 9th grade promotion rate. This starts with “bridge” programs in the summer for students with low 8th grade scores. New York City has been able to estimate the probability of graduation based on a threshold number of credits upon entering 9th grade. That knowledge makes the summer bridge program an urgent matter.
• Figure out which children are in which cohort at the start of school. This makes the challenge more focused.
• Know the data, know the children personally, and make sure all the other adults do, too.

38
What Successful Schools Do to Raise Graduation Rates
• Tell entering 9th graders that some will graduate in four years, and others “have skills that we will work on,” and they too will graduate in years five or six. Let no one feel excluded or like a failure.
• Work on those skills through morning, afternoon and evening sessions in flexible groups so students can easily move to a new group to learn the next skill set as they progress.
39
What Successful Schools Do to Raise Graduation Rates
• Use short diagnostic tests often during the year to check gains in the skills measured by the standards and the Regents exams. Keep reassessing to ensure that students really grasp the content.
• By the middle of 9th grade, the students needing intensive help get an “Advocate,” who is a teacher committed to talking with each of the 15 students in that teacher’s care every single day.
40
What Successful Schools Do to Raise Graduation Rates
• In June of senior year, identify students who are a credit or two away from graduation. Assign someone to stay in daily contact with each of them and their families. Support the students through summer school and the August Regents and graduation.
• Schedule twice weekly meetings of teachers to examine student work, teacher practice, and the interim assessments that gauge student progress. Share the notes from these professional conversations.
• Make sure the support systems are in place: attendance taking and analysis, social services, guidance.
41
Graduation Rates:Students Who Started 9th Grade in 2000, 2001,
and 2002