Embed Size (px)
Citation preview

ELLs with Disabilities Report 3
Graduation Exam Participation and Performance (2000-2001) of English Language Learners with Disabilities
In collaboration with:
Council of Chief State School Offi cers (CCSSO)
National Association of State Directors of Special Education (NASDSE)
N A T I O N A L
C E N T E R O N
EDUCATIONAL
O U T C O M E S
ELLs with Disabilities Report 3
Graduation Exam Participation and Performance (2000-2001) of English Language Learners with Disabilities
Kristi Liu • Martha Thurlow • Manuel Barrera • Kamil Guven • Vitaliy Shyyan
June 2005
All rights reserved. Any or all portions of this document may be reproduced and distributed without prior permission, provided the source is cited as:
Liu, K., Thurlow, M., Barrera, M., Guven, K., & Shyyan, V. (2005). Graduation exam participation and performance (2000-2001) of English language learners with disabilities (ELLs with Disabilities Report 3). Min ne ap o lis, MN: Uni ver si ty of Min ne so ta, Na tion al Center on Ed u ca tion al Out comes.
National Center on Educational OutcomesUniversity of Minnesota • 350 Elliott Hall75 East River Road • Minneapolis, MN 55455Phone 612/624-8561 • Fax 612/624-0879http://education.umn.edu/NCEO
The University of Minnesota is committed to the policy that all persons shall have equal access to its pro grams, facilities, and employment without regard to race, color, creed, religion, national origin, sex, age, marital status, disability, public assistance status, veteran status, or sexual orientation.
This document is available in alternative formats upon request.
N A T I O N A L
C E N T E R O N
EDUCATIONAL
O U T C O M E S
Ross E. MoenMichael L. MooreRachel F. QuenemoenDorene L. ScottSandra J. ThompsonMartha L. Thurlow, Director
Deb A. AlbusAnn T. Clapper Christopher J. JohnstoneJane L. Krentz Sheryl S. LazarusKristi K. LiuJane E. Minnema
NCEO Core Staff
This project is supported by a grant from the U.S. Department of Education, Offi ce of Special Education Programs (Grant #H324D010023). Opinions expressed herein do not necessarily refl ect those of the U.S. Department of Education or Offi ces within it.
1NCEO
Overview
The main tenet of the standards movement, according to the National Association of State Boards of Education, is that “Schools, districts and state departments of education, along with students and families, are responsible for developing high levels of knowledge and skills in all students” (NASBE, 2002, p. 7). In the past, some groups of students have been left out of educational reform movements because of barriers to high achievement. These might include a perception that English language learners (ELLs)1 and students with disabilities were not ca-pable of challenging academic content, for example, and inequitable funding in urban schools with high concentrations of minority and low-income students (NASBE, 2002). The No Child Left Behind Act of 2001 (NCLB) made it clear that states, districts, and schools are to hold high expectations for all students and work to improve outcomes for low performing groups. A central part of these mandated improvement efforts is using data to identify groups of students who are achieving poorly on statewide tests and fi nd ways to improve instruction for the students so that they might achieve at higher rates in the future.
NCLB requires that accountability data be disaggregated and reported for some specifi c sub-groups of students. According to Thurlow and Liu (2001), one group for which NCLB does not clearly mandate the public reporting of assessment data is students who are limited English profi cient and also have disabilities. Students who are not tested, and students who are tested but whose data are not publicly reported, tend to remain invisible inside our educational system (Thurlow & Liu, 2001). Therefore, it is important for students with limited English profi ciency and disabilities, a rapidly growing group2, to be represented in discussions of standards-based assessment results.
At the present time, fewer than 10 states report large-scale assessment participation or per-formance data on students with limited English profi ciency and disabilities (Albus, Thurlow, Minnema & Anderson, 2004). This report is part of a series aimed at providing an in depth look at one state’s data on the participation and performance of students with limited English profi ciency and disabilities in assessments mandated by NCLB. A previous report (Liu, Bar-rera, Thurlow & Shyyan, 2005) examined data from the 1999–2000 administration of a state graduation test. This report adds to those data with results from the 2000–2001 administration of the graduation test.
1 Students with limited English profi ciency are increasingly referred to as English language learners or ELLs. We recognize that a number of terms are used in the fi eld related to learners of English as a new or second language. We have adopted some of those terms for reference, but have chosen to use language and acronyms compliant with “person fi rst” protocol and to minimize lengthy terms where possible. In this document we use the term “students with limited English profi ciency.”2 Zehler, Fleischman, Hopstock, Pendzick and Stephenson (2003) have documented that English language learners with dis-abilities represent approximately 9% of all ELLs in public schools. Because the total number of ELLs is growing rapidly, it is logical to assume that the number of ELLs with disabilities is also growing.
2 NCEO
Background
In Minnesota, Basic Standards Tests (BSTs) are assessments that students must pass to receive a high school diploma. Assessments for the diploma are administered in reading and mathemat-ics for the fi rst time in 8th grade and in writing for the fi rst time in grade 10. In each content area, students must achieve a scale score of 600 or higher by the 12th grade in order to receive a diploma. Tests may be re-taken several times if the students do not meet the passing scale score.
In addition to their use as graduation requirement assessments, BSTs are also used as school accountability measures. Thus, the grade 8 reading and mathematics scores and the grade 10 writing scores were school accountability measures. During the 2000–2001 school year, ad-ditional components of the Basic Standards Tests at other grades were in the process of being implemented. This report examines only the participation and performance of students with limited English profi ciency and disabilities (SLEPD) on the reading and mathematics compo-nents of the BST during their fi rst attempt on the grade 8 administration.
The 2000–2001 technical manual for the Basic Standards Tests (Minnesota Department of Education [MDE], 2001) states that in that year exemptions from testing were allowed for some students with limited English profi ciency (SLEP). “Students with limited English profi ciency must participate in the accountability testing unless they have been in the United States fewer than 12 months. Only these very few LEP students may be exempted from testing” (Appendix C, p. 3). Also, during the time period represented in this report, students with disabilities could be exempted from the tests if the goals and objectives of their Individualized Education Programs (IEPs) did not match the content of the state tests.
The data in this report come from the year in which NCLB legislation was passed, but had not yet taken effect. Requirements for alternate assessments for students with severe disabilities and for at least 95% participation of students in a subgroup to be tested for accountability purposes had not yet been implemented.
Accommodations and Modifi cations
Students who participated in the BSTs in 2000–2001 were allowed some accommodations and modifi cations. The Minnesota Department of Education defi nes accommodations as minor changes that do not change the validity, reliability, or security of the test (MDE 2001, p. 5). Modifi cations are changes in the standard, the test, or the testing circumstances that alter the level of diffi culty of what is being assessed (MDE, 2001, p. 6). Accommodations are permitted on the reading and mathematics portions of the test in 8th grade, when the test is used for ac-countability purposes, and on the writing portion in 10th grade. Modifi cations are only allowed
3NCEO
for students with disabilities in later retests. When they are used, they result in a student receiv-ing a “pass individual” notation. The data fi les used for this report did not contain information about whether students received an accommodation or a modifi cation. Therefore, the report does not address this topic. Data in the report represent numbers of students passing the reading or mathematics tests at the “state level,” meaning the state test is taken without modifi cations.
Method
The Minnesota Department of Education collected the data compiled for this report. After preparing the data fi les and discarding unusable data, the researchers ran descriptive statisti-cal analyses using the SPSS Information Analysis System. Numbers showing total student enrollment were based on fall counts and may differ from counts of students enrolled on the day of testing several months later. Following the presentation of the results of our analyses of participation and performance data for 2000–2001, we compare the 2000–2001 results to the data from 1999–2000.
Data
Participation in 2000–2001
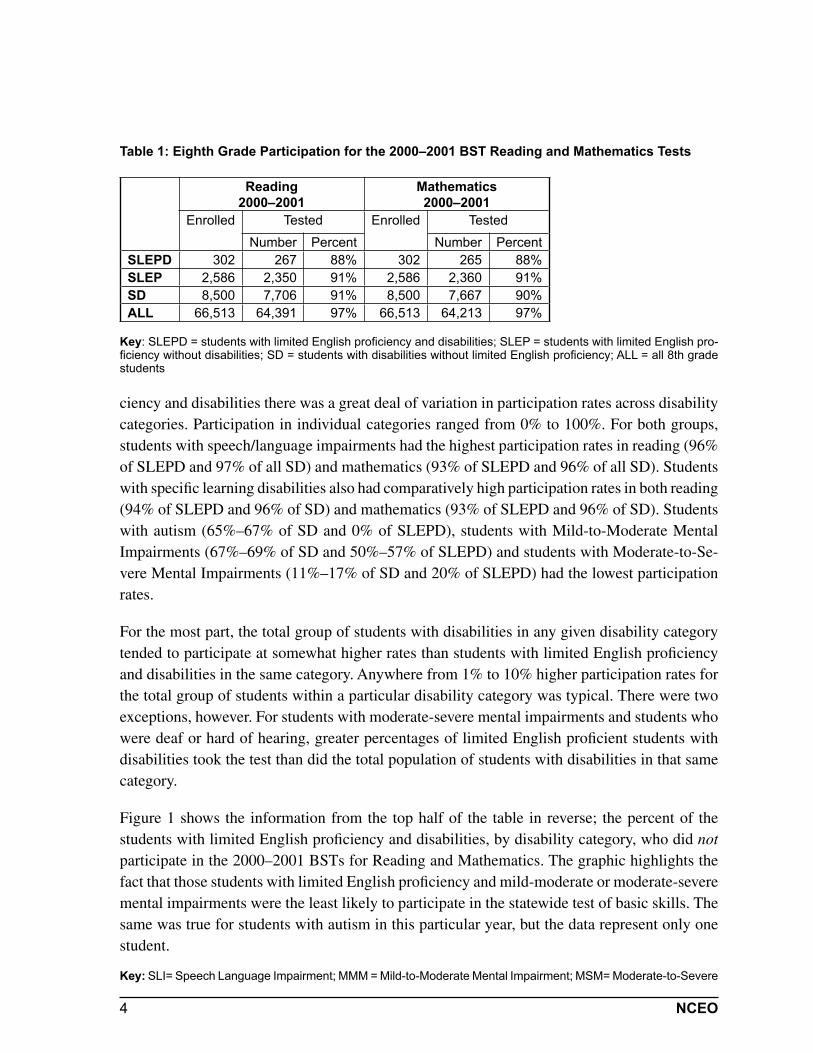
As indicated in Table 1, in 2000–2001 eighth grade participation of subgroups taking the reading and mathematics BSTs ranged from 88% to 97%. At the time, these rates were considered to be relatively high. The 95% participation requirement for accountability for all subgroups that was implemented under NCLB in 2001 had not yet taken effect. Students with limited English profi ciency and disabilities (SLEPD) had the lowest participation rates with 88% in both reading and mathematics. Students with limited English profi ciency (SLEP) and students with disabilities (SD) had slightly higher percentages of participation (90%–91%). The total group of 8th grade students had the highest percent participating with 97%. This was nearly 10% higher than that of students with limited English profi ciency and disabilities. For each group, the percentage of students participating in reading versus mathematics was similar.
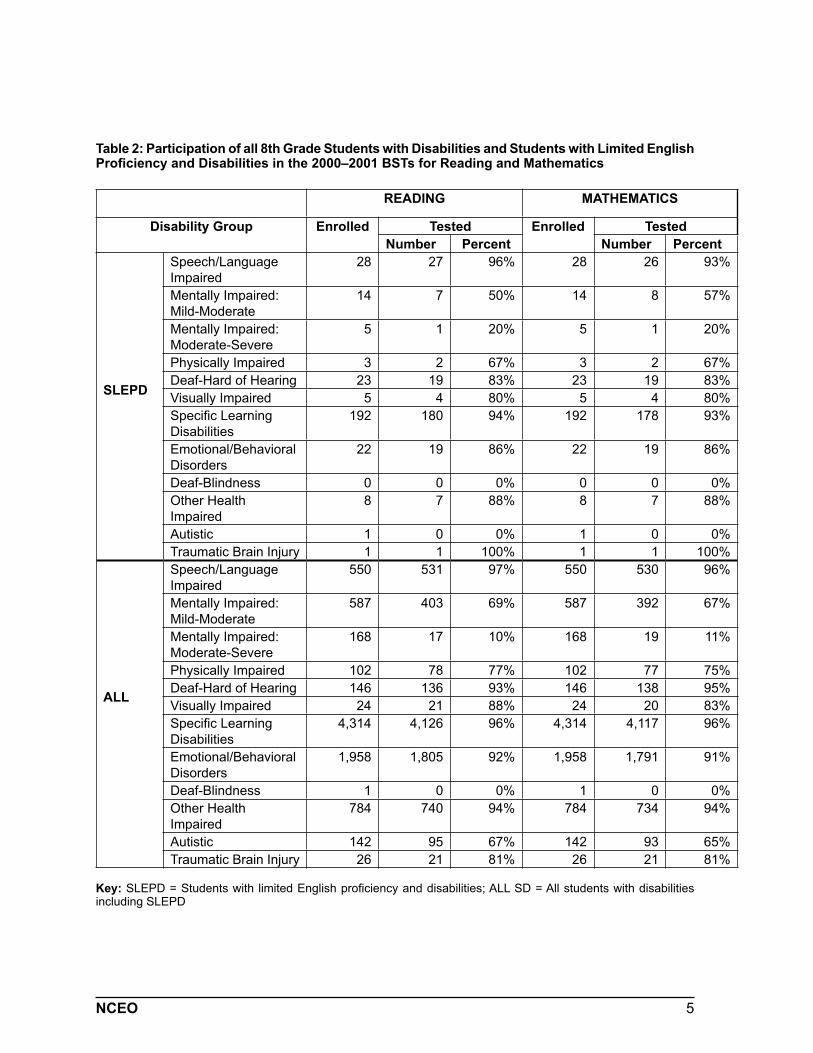
Participation of Students by Disability CategoryTable 2 shows the participation of students with limited English profi ciency and disabilities (SLEPD) and all students with disabilities (SD) according to the students’ primary disability category. When looking at these data, readers are cautioned to keep in mind that some disability categories were quite small in size. Also, there were no students with limited English profi ciency and deaf-blindness in this particular year.
In both the total group of students with disabilities and the students with limited English profi -
4 NCEO
ciency and disabilities there was a great deal of variation in participation rates across disability categories. Participation in individual categories ranged from 0% to 100%. For both groups, students with speech/language impairments had the highest participation rates in reading (96% of SLEPD and 97% of all SD) and mathematics (93% of SLEPD and 96% of all SD). Students with specifi c learning disabilities also had comparatively high participation rates in both reading (94% of SLEPD and 96% of SD) and mathematics (93% of SLEPD and 96% of SD). Students with autism (65%–67% of SD and 0% of SLEPD), students with Mild-to-Moderate Mental Impairments (67%–69% of SD and 50%–57% of SLEPD) and students with Moderate-to-Se-vere Mental Impairments (11%–17% of SD and 20% of SLEPD) had the lowest participation rates.
For the most part, the total group of students with disabilities in any given disability category tended to participate at somewhat higher rates than students with limited English profi ciency and disabilities in the same category. Anywhere from 1% to 10% higher participation rates for the total group of students within a particular disability category was typical. There were two exceptions, however. For students with moderate-severe mental impairments and students who were deaf or hard of hearing, greater percentages of limited English profi cient students with disabilities took the test than did the total population of students with disabilities in that same category.
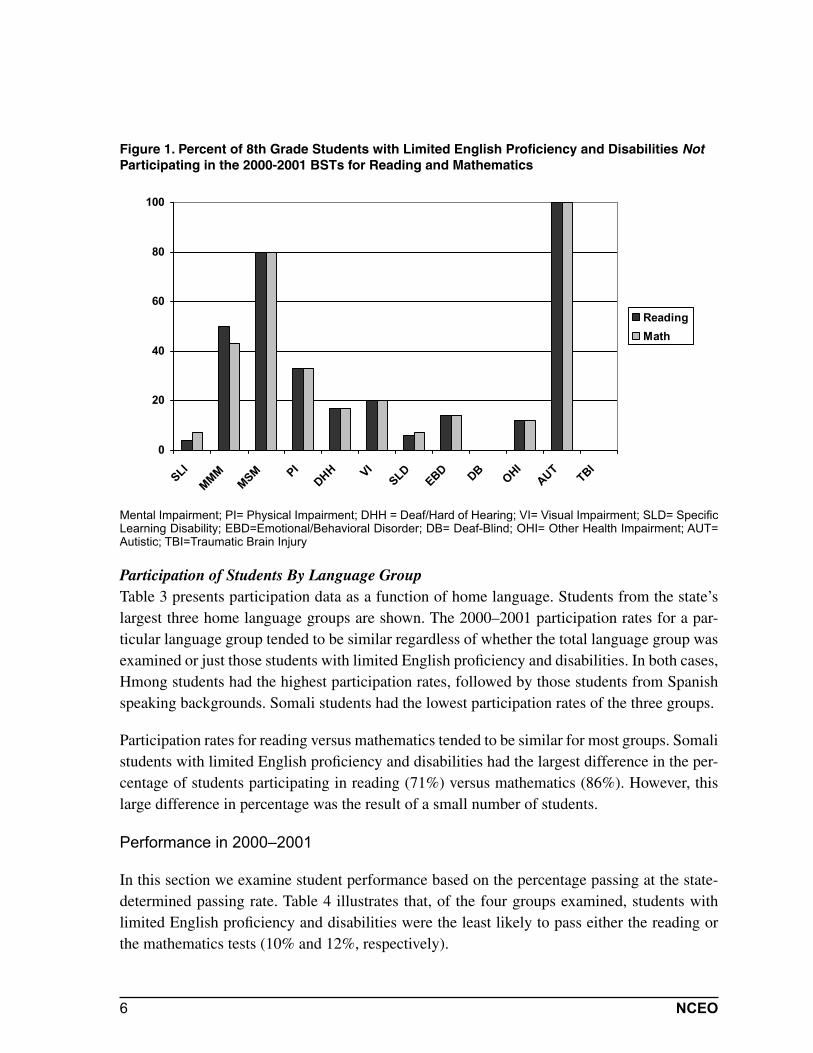
Figure 1 shows the information from the top half of the table in reverse; the percent of the students with limited English profi ciency and disabilities, by disability category, who did not participate in the 2000–2001 BSTs for Reading and Mathematics. The graphic highlights the fact that those students with limited English profi ciency and mild-moderate or moderate-severe mental impairments were the least likely to participate in the statewide test of basic skills. The same was true for students with autism in this particular year, but the data represent only one student.
Key: SLI= Speech Language Impairment; MMM = Mild-to-Moderate Mental Impairment; MSM= Moderate-to-Severe
Table 1: Eighth Grade Participation for the 2000–2001 BST Reading and Mathematics Tests
Reading
2000–2001
Mathematics
2000–2001
Enrolled Tested Enrolled Tested
Number Percent Number Percent
SLEPD 302 267 88% 302 265 88%
SLEP 2,586 2,350 91% 2,586 2,360 91%
SD 8,500 7,706 91% 8,500 7,667 90%
ALL 66,513 64,391 97% 66,513 64,213 97%
Key: SLEPD = students with limited English profi ciency and disabilities; SLEP = students with limited English pro-fi ciency without disabilities; SD = students with disabilities without limited English profi ciency; ALL = all 8th grade students
5NCEO
Table 2: Participation of all 8th Grade Students with Disabilities and Students with Limited English Profi ciency and Disabilities in the 2000–2001 BSTs for Reading and Mathematics
READING MATHEMATICS
Disability Group Enrolled Tested Enrolled Tested
Number Percent Number Percent
SLEPD
Speech/Language
Impaired
28 27 96% 28 26 93%
Mentally Impaired:
Mild-Moderate
14 7 50% 14 8 57%
Mentally Impaired:
Moderate-Severe
5 1 20% 5 1 20%
Physically Impaired 3 2 67% 3 2 67%
Deaf-Hard of Hearing 23 19 83% 23 19 83%
Visually Impaired 5 4 80% 5 4 80%
Specifi c Learning
Disabilities
192 180 94% 192 178 93%
Emotional/Behavioral
Disorders
22 19 86% 22 19 86%
Deaf-Blindness 0 0 0% 0 0 0%
Other Health
Impaired
8 7 88% 8 7 88%
Autistic 1 0 0% 1 0 0%
Traumatic Brain Injury 1 1 100% 1 1 100%
ALL
Speech/Language
Impaired
550 531 97% 550 530 96%
Mentally Impaired:
Mild-Moderate
587 403 69% 587 392 67%
Mentally Impaired:
Moderate-Severe
168 17 10% 168 19 11%
Physically Impaired 102 78 77% 102 77 75%
Deaf-Hard of Hearing 146 136 93% 146 138 95%
Visually Impaired 24 21 88% 24 20 83%
Specifi c Learning
Disabilities
4,314 4,126 96% 4,314 4,117 96%
Emotional/Behavioral
Disorders
1,958 1,805 92% 1,958 1,791 91%
Deaf-Blindness 1 0 0% 1 0 0%
Other Health
Impaired
784 740 94% 784 734 94%
Autistic 142 95 67% 142 93 65%
Traumatic Brain Injury 26 21 81% 26 21 81%
Key: SLEPD = Students with limited English profi ciency and disabilities; ALL SD = All students with disabilities including SLEPD
6 NCEO
Mental Impairment; PI= Physical Impairment; DHH = Deaf/Hard of Hearing; VI= Visual Impairment; SLD= Specifi c Learning Disability; EBD=Emotional/Behavioral Disorder; DB= Deaf-Blind; OHI= Other Health Impairment; AUT= Autistic; TBI=Traumatic Brain Injury
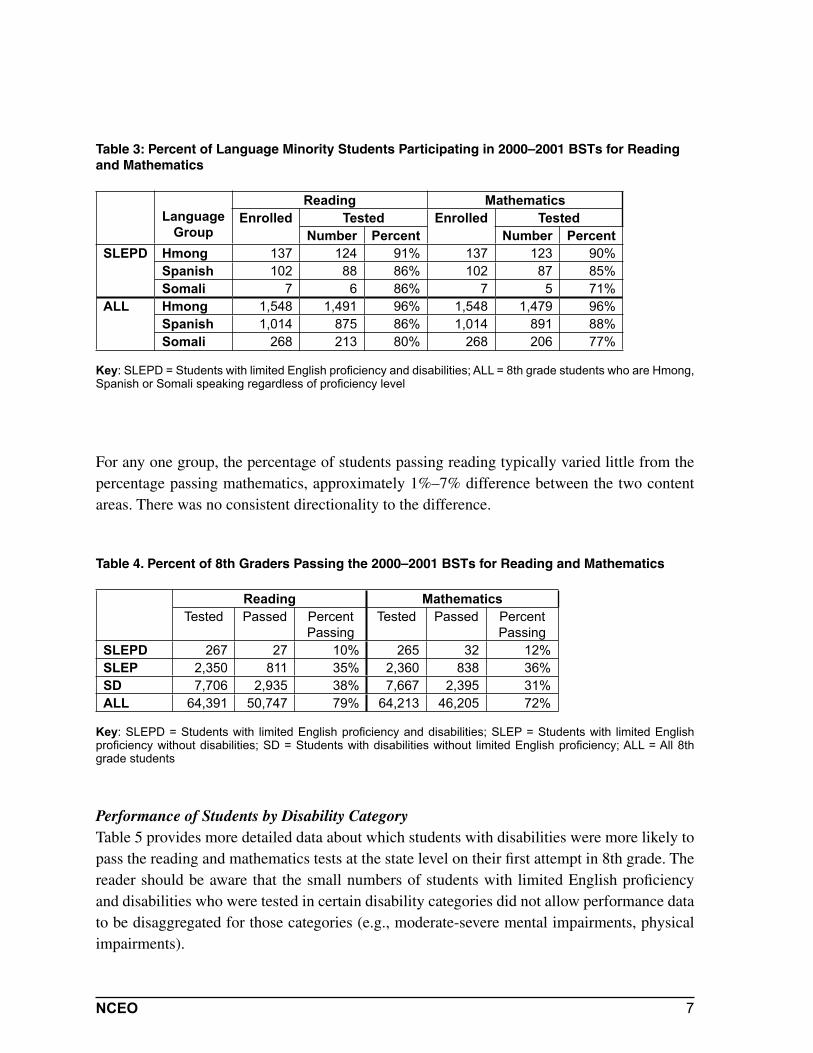
Participation of Students By Language GroupTable 3 presents participation data as a function of home language. Students from the state’s largest three home language groups are shown. The 2000–2001 participation rates for a par-ticular language group tended to be similar regardless of whether the total language group was examined or just those students with limited English profi ciency and disabilities. In both cases, Hmong students had the highest participation rates, followed by those students from Spanish speaking backgrounds. Somali students had the lowest participation rates of the three groups.
Participation rates for reading versus mathematics tended to be similar for most groups. Somali students with limited English profi ciency and disabilities had the largest difference in the per-centage of students participating in reading (71%) versus mathematics (86%). However, this large difference in percentage was the result of a small number of students.
Performance in 2000–2001
In this section we examine student performance based on the percentage passing at the state-determined passing rate. Table 4 illustrates that, of the four groups examined, students with limited English profi ciency and disabilities were the least likely to pass either the reading or the mathematics tests (10% and 12%, respectively).
0
20
40
60
80
100
SLI
MM
MM
SM P
I
DHH V
I
SLD
EBD
DB
OHI
AUT
TBI
Reading
Math
Figure 1. Percent of 8th Grade Students with Limited English Profi ciency and Disabilities Not Participating in the 2000-2001 BSTs for Reading and Mathematics
7NCEO
For any one group, the percentage of students passing reading typically varied little from the percentage passing mathematics, approximately 1%–7% difference between the two content areas. There was no consistent directionality to the difference.
Table 4. Percent of 8th Graders Passing the 2000–2001 BSTs for Reading and Mathematics
Reading Mathematics
Tested Passed Percent
Passing
Tested Passed Percent
Passing
SLEPD 267 27 10% 265 32 12%
SLEP 2,350 811 35% 2,360 838 36%
SD 7,706 2,935 38% 7,667 2,395 31%
ALL 64,391 50,747 79% 64,213 46,205 72%
Key: SLEPD = Students with limited English profi ciency and disabilities; SLEP = Students with limited English profi ciency without disabilities; SD = Students with disabilities without limited English profi ciency; ALL = All 8th grade students
Performance of Students by Disability CategoryTable 5 provides more detailed data about which students with disabilities were more likely to pass the reading and mathematics tests at the state level on their fi rst attempt in 8th grade. The reader should be aware that the small numbers of students with limited English profi ciency and disabilities who were tested in certain disability categories did not allow performance data to be disaggregated for those categories (e.g., moderate-severe mental impairments, physical impairments).
Table 3: Percent of Language Minority Students Participating in 2000–2001 BSTs for Reading and Mathematics
Language
Group
Reading Mathematics
Enrolled Tested Enrolled Tested
Number Percent Number Percent
SLEPD Hmong 137 124 91% 137 123 90%
Spanish 102 88 86% 102 87 85%
Somali 7 6 86% 7 5 71%
ALL Hmong 1,548 1,491 96% 1,548 1,479 96%
Spanish 1,014 875 86% 1,014 891 88%
Somali 268 213 80% 268 206 77%
Key: SLEPD = Students with limited English profi ciency and disabilities; ALL = 8th grade students who are Hmong, Spanish or Somali speaking regardless of profi ciency level
8 NCEO
One characteristic that stands out from the performance data is the amount of variation in the percentage of students from particular disability groups who passed either the reading or math-ematics tests. For students with limited English profi ciency and disabilities, 0%–19% passed reading and 0%–35% passed mathematics. For the total population of students with disabilities,
Table 5. Percent of All Students with Disabilities and Students Who Are Limited English Profi cient with Disabilities Passing the 2000–2001 BSTs for Reading and Mathematics
Disability Group Reading Mathematics
Tested Number
Passed
Percent
Passed
Tested Number
Passed
Percent
Passed
SLEPD
Speech/Language
Impaired
27 5 19% 26 9 35%
Mentally Impaired: Mild-
Moderate
7 * * 8 * *
Mentally Impaired:
Moderate-Severe
1 * * 1 * *
Physically Impaired 2 * * 2 * *
Deaf-Hard of Hearing 19 3 16% 19 1 5%
Visually Impaired 4 * * 4 * *
Specifi c Learning
Disabilities
180 15 8% 178 14 8%
Emotional/Behavioral
Disorders
19 2 11% 19 2 11%
Deaf-Blindness 0 0 0 0 0 0
Other Health Impaired 7 * * 7 * *
Autistic 0 0 0 0 0 0
Traumatic Brain Injury 1 * * 1 * *
All
SD
Speech/Language
Impaired
531 276 52% 531 267 50%
Mentally Impaired: Mild-
Moderate
403 10 2% 403 2 <1%
Mentally Impaired:
Moderate-Severe
17 0 0% 17 1 6%
Physically Impaired 78 41 53% 78 32 41%
Deaf-Hard of Hearing 136 54 40% 136 48 35%
Visually Impaired 21 11 52% 21 15 71%
Specifi c Learning
Disabilities
4,126 1,347 33% 4,126 1,155 28%
Emotional/Behavioral
Disorders
1,805 799 44% 1,805 582 32%
Deaf-Blindness 0 0 0% 0 0 0%
Other Health Impaired 740 339 46% 740 239 32%
Autistic 95 51 54% 95 48 51%
Traumatic Brain Injury 21 7 33% 21 6 29%
Key: SLEPD = Students with limited English profi ciency and disabilities; ALL SD = Students with disabilities includ-ing SLEPD; * = Data not disaggregated because fewer than 10 students tested in this category
9NCEO
the variation is even greater. The percentage of these students passing ranged from 0%–54% in reading and 0%–71% in mathematics.
The percentages of students with limited English profi ciency and disabilities who passed either the reading or mathematics test was often quite a bit smaller than the percentage passing from the total group of students with disabilities. The data were suffi cient to document the gap in four disability categories. Students with limited English profi ciency and speech language im-pairments, specifi c learning disabilities, emotional-behavioral disabilities, and those who were deaf and hard of hearing all had a 15%–33% lower percentage passing reading or mathematics than their non-limited English profi cient peers in the same disability category.
There were some consistent patterns of performance that were evident across the general popu-lation of students with disabilities and those with limited English profi ciency and disabilities. Students with speech-language impairments were among the highest achievers in both the total population of students with disabilities (52% passed reading and 50% passed mathematics) and for students with limited English profi ciency and disabilities (19% passed reading and 35% passed mathematics). Of the few groups that had disaggregated data, students with limited English profi ciency and learning disabilities had the smallest percentage of students passing the test (8% for both reading and mathematics). Of particular note is that students with specifi c learning disabilities had relatively low percentages of students passing in both the total popula-tion of students with disabilities (33% passed reading and 28% passed mathematics) and those with limited English profi ciency and disabilities (8% passed reading and mathematics).
There were differences between the percentage of students passing reading and mathematics, but the direction of the difference was not always the same. For students with limited English profi ciency and disabilities, most of the groups with disaggregated data had the same or slightly smaller percentage of students passing reading than mathematics. This pattern was similar to what was observed in the data for the total population of students with disabilities as well. The only exception was students with limited English profi ciency and speech language impairments. Sixteen percent more of these students passed the mathematics test than the reading test. In the total population of students with disabilities, those with moderate-severe mental impairments and those with visual impairments were more likely to pass mathematics than reading.
Performance of Students by Language GroupNext we examined the performance of students with limited English profi ciency and disabili-ties by language group. The data in Table 6 show that all Hmong students (ALL) and Hmong students with limited English profi ciency and disabilities (SLEPD) were the most likely of the three language groups to pass the test (43% for reading and 46% for mathematics for All Hmong and 9% for reading and 16% for mathematics of Hmong students with limited English profi ciency and disabilities). The number of Somali students with limited English profi ciency
10 NCEO
and disabilities was too small to make any inferences about performance.
For the Hmong-, Spanish-, and Somali-speaking students with limited English profi ciency and disabilities there was not a consistent directionality of better performance on reading versus mathematics. Hmong students were more likely to pass the mathematics than the reading test. In contrast, Spanish- and Somali-speaking students were more likely to pass reading than math-ematics. This pattern was also evident in the total population of Hmong- and Spanish-speak-ing students. The number of Somali students with limited English profi ciency and disabilities (SLEPD) was fewer than 10 so their performance data are not provided here.
Table 6: 2000–2001 8th Grade BST Reading and Mathematics Performance of Students who are Language Minority and Students with Limited English Profi ciency and Disabilities
Language
Group
Reading Mathematics
Tested Passed Percent
Passed
Tested Passed Percent
Passed
SLEPD Hmong 124 11 9% 123 20 16%
Spanish 88 7 8% 87 5 6%
Somali 6 * * 5 * *
All Hmong 1,491 637 43% 1,479 674 46%
Spanish 875 324 37% 891 251 28%
Somali 213 41 19% 206 29 14%
Key: SLEPD = Students with limited English profi ciency and disabilities; ALL = 8th grade students who are Hmong-, Spanish-, or Somali-speaking regardless of profi ciency level; * = Data not disaggregated because fewer than 10 students tested
Comparison across Years 2000–2001 and 1999–2000
The fi gures that follow place the 1999–2000 data next to the 2000–2001 data for the purposes of descriptive comparison. Two years of data are not enough to establish any trends in perfor-mance. Still, this preliminary look at how students did over a two-year period can form the basis for further work on trends when suffi cient data are available. Tables with more detailed data are presented in Appendix A.
Participation
Participation in the 1999–2000 and 2000–2001 Basic Standards Tests for students with limited English profi ciency and disabilities (SLEPD) compared to the other three groups that we discuss here (SLEP, SD, and ALL) is shown in Figure 2. In both reading and mathematics, there was a noticeable decline in the percentage of students with limited English profi ciency and disabilities who participated in a content test from one year to the next. In contrast, for the other groups shown in the fi gure (SLEP, SD, and ALL) there were relatively small changes in the percent of
11NCEO
students participating in a content test from one year to the next. Overall participation rates for reading versus mathematics were similar across years.
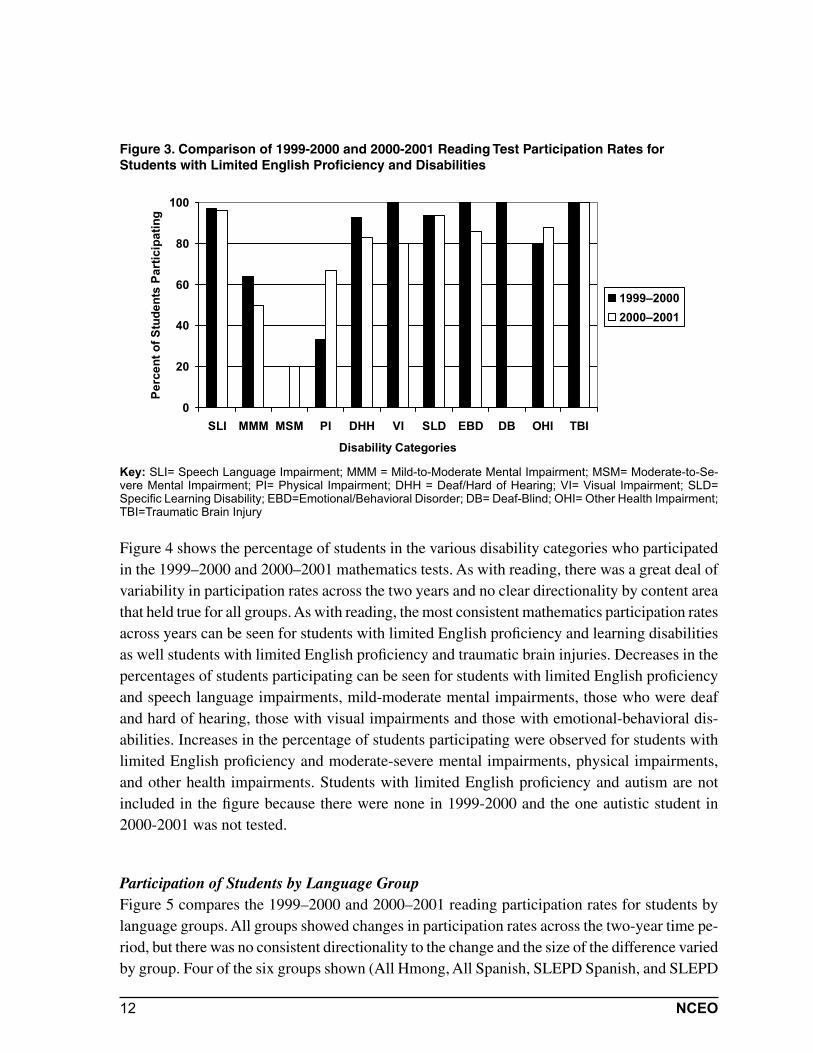
Participation of Students by Disability CategoryThe 1999–2000 and 2000–2001 reading test participation rates by disability category are shown in Figure 3. Participation varied across groups and years. Students with limited English pro-fi ciency and speech language impairments, specifi c learning disabilities, and traumatic brain injuries had consistent reading test participation rates across the two years. Students with limited English profi ciency who had mild-moderate mental impairments, those who were deaf and hard of hearing, and those who were visually impaired had lower participation rates in 2000–2001 than in 1999–2000. Students with limited English profi ciency and moderate to severe mental impairments, physical impairments, and other health impairments had higher participation rates in 2000–2001 than in 1999–2000. Some of this variability, particularly for the categories of moderate-severe mentally impaired, physically impaired, visually impaired, other health im-paired, and traumatic brain injury, is due to small numbers of students in the groups. Students with limited English profi ciency and autism are not included in the fi gure because there were none tested in either year.
Figure 2. Comparison of Percentage Tested Across Groups for 1999-2000 and 2000-2001
0
20
40
60
80
100
SLEPD SLEP SD ALL SLEPD SLEP SD ALL
Reading Math
Pe
rce
nt
of
Stu
de
nts
Pa
ss
ing
1999-2000
2000-2001
Key: SLEPD = Students with limited English profi ciency and disabilities; SLEP = Students with limited English profi ciency without disabilities; SD = Students with disabilities without limited English profi ciency; ALL = All 8th grade students
12 NCEO
Key: SLI= Speech Language Impairment; MMM = Mild-to-Moderate Mental Impairment; MSM= Moderate-to-Se-vere Mental Impairment; PI= Physical Impairment; DHH = Deaf/Hard of Hearing; VI= Visual Impairment; SLD= Specifi c Learning Disability; EBD=Emotional/Behavioral Disorder; DB= Deaf-Blind; OHI= Other Health Impairment; TBI=Traumatic Brain Injury
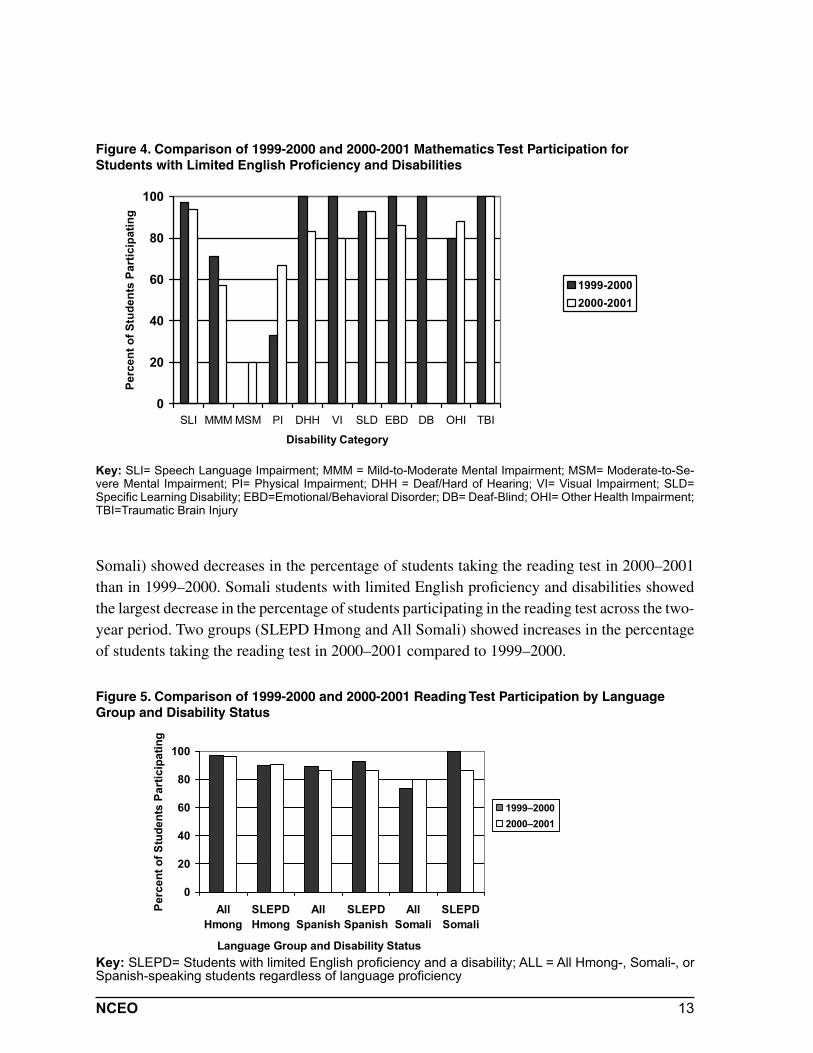
Figure 4 shows the percentage of students in the various disability categories who participated in the 1999–2000 and 2000–2001 mathematics tests. As with reading, there was a great deal of variability in participation rates across the two years and no clear directionality by content area that held true for all groups. As with reading, the most consistent mathematics participation rates across years can be seen for students with limited English profi ciency and learning disabilities as well students with limited English profi ciency and traumatic brain injuries. Decreases in the percentages of students participating can be seen for students with limited English profi ciency and speech language impairments, mild-moderate mental impairments, those who were deaf and hard of hearing, those with visual impairments and those with emotional-behavioral dis-abilities. Increases in the percentage of students participating were observed for students with limited English profi ciency and moderate-severe mental impairments, physical impairments, and other health impairments. Students with limited English profi ciency and autism are not included in the fi gure because there were none in 1999-2000 and the one autistic student in 2000-2001 was not tested.
Participation of Students by Language GroupFigure 5 compares the 1999–2000 and 2000–2001 reading participation rates for students by language groups. All groups showed changes in participation rates across the two-year time pe-riod, but there was no consistent directionality to the change and the size of the difference varied by group. Four of the six groups shown (All Hmong, All Spanish, SLEPD Spanish, and SLEPD
Figure 3. Comparison of 1999-2000 and 2000-2001 Reading Test Participation Rates for Students with Limited English Profi ciency and Disabilities
0
20
40
60
80
100
SLI MMM MSM PI DHH VI SLD EBD DB OHI TBI
Disability Categories
Pe
rce
nt
of
Stu
de
nts
Pa
rtic
ipa
tin
g
1999–2000
2000–2001
13NCEO
Somali) showed decreases in the percentage of students taking the reading test in 2000–2001 than in 1999–2000. Somali students with limited English profi ciency and disabilities showed the largest decrease in the percentage of students participating in the reading test across the two-year period. Two groups (SLEPD Hmong and All Somali) showed increases in the percentage of students taking the reading test in 2000–2001 compared to 1999–2000.
Figure 4. Comparison of 1999-2000 and 2000-2001 Mathematics Test Participation for Students with Limited English Profi ciency and Disabilities
0
20
40
60
80
100
SLI MMMMSM PI DHH VI SLD EBD DB OHI TBI
Disability Category
Pe
rce
nt
of
Stu
de
nts
Pa
rtic
ipa
tin
g
1999-2000
2000-2001
Key: SLI= Speech Language Impairment; MMM = Mild-to-Moderate Mental Impairment; MSM= Moderate-to-Se-vere Mental Impairment; PI= Physical Impairment; DHH = Deaf/Hard of Hearing; VI= Visual Impairment; SLD= Specifi c Learning Disability; EBD=Emotional/Behavioral Disorder; DB= Deaf-Blind; OHI= Other Health Impairment; TBI=Traumatic Brain Injury
Figure 5. Comparison of 1999-2000 and 2000-2001 Reading Test Participation by Language Group and Disability Status
0
20
40
60
80
100
All
Hmong
SLEPD
Hmong
All
Spanish
SLEPD
Spanish
All
Somali
SLEPD
Somali
Language Group and Disability Status
Pe
rce
nt
of
Stu
de
nts
Pa
rtic
ipa
tin
g
1999–2000
2000–2001
Key: SLEPD= Students with limited English profi ciency and a disability; ALL = All Hmong-, Somali-, or Spanish-speaking students regardless of language profi ciency
14 NCEO
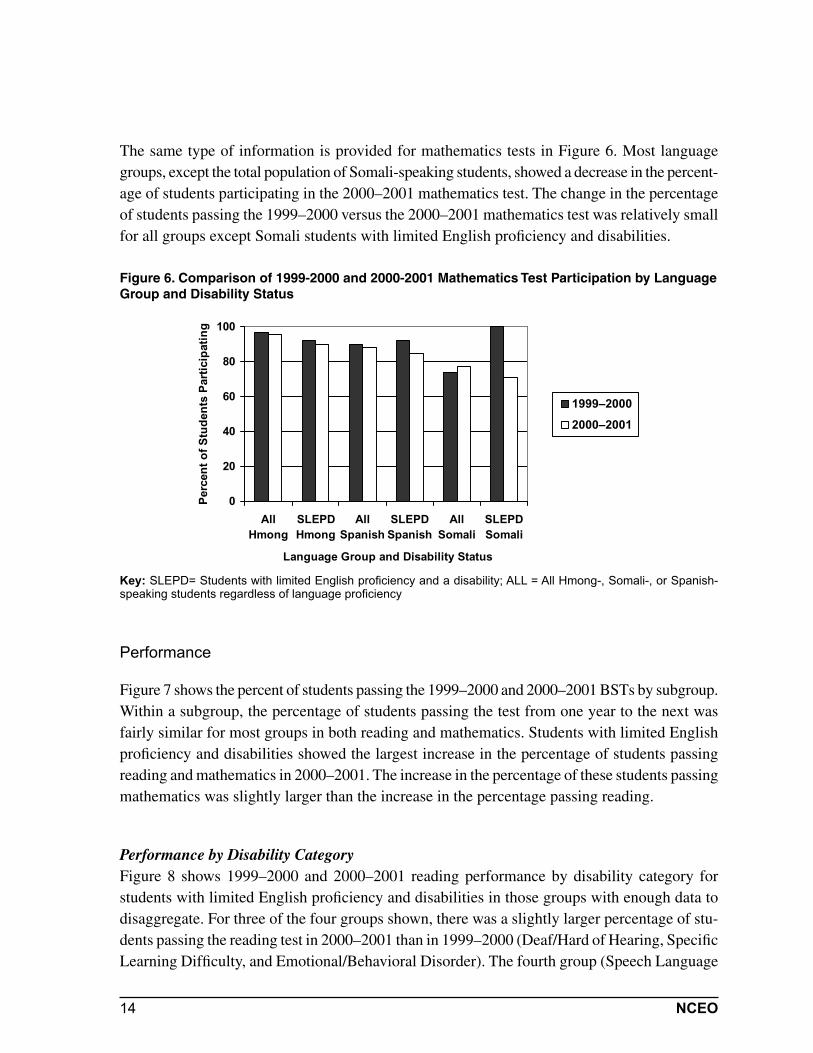
The same type of information is provided for mathematics tests in Figure 6. Most language groups, except the total population of Somali-speaking students, showed a decrease in the percent-age of students participating in the 2000–2001 mathematics test. The change in the percentage of students passing the 1999–2000 versus the 2000–2001 mathematics test was relatively small for all groups except Somali students with limited English profi ciency and disabilities.
Key: SLEPD= Students with limited English profi ciency and a disability; ALL = All Hmong-, Somali-, or Spanish-speaking students regardless of language profi ciency
Performance
Figure 7 shows the percent of students passing the 1999–2000 and 2000–2001 BSTs by subgroup. Within a subgroup, the percentage of students passing the test from one year to the next was fairly similar for most groups in both reading and mathematics. Students with limited English profi ciency and disabilities showed the largest increase in the percentage of students passing reading and mathematics in 2000–2001. The increase in the percentage of these students passing mathematics was slightly larger than the increase in the percentage passing reading.
Performance by Disability CategoryFigure 8 shows 1999–2000 and 2000–2001 reading performance by disability category for students with limited English profi ciency and disabilities in those groups with enough data to disaggregate. For three of the four groups shown, there was a slightly larger percentage of stu-dents passing the reading test in 2000–2001 than in 1999–2000 (Deaf/Hard of Hearing, Specifi c Learning Diffi culty, and Emotional/Behavioral Disorder). The fourth group (Speech Language
Figure 6. Comparison of 1999-2000 and 2000-2001 Mathematics Test Participation by Language Group and Disability Status
0
20
40
60
80
100
All
Hmong
SLEPD
Hmong
All
Spanish
SLEPD
Spanish
All
Somali
SLEPD
Somali
Language Group and Disability Status
Perc
en
t o
f S
tud
en
ts P
art
icip
ati
ng
1999–2000
2000–2001
15NCEO
Impairment) showed similar percentages of students passing the reading test in both years.
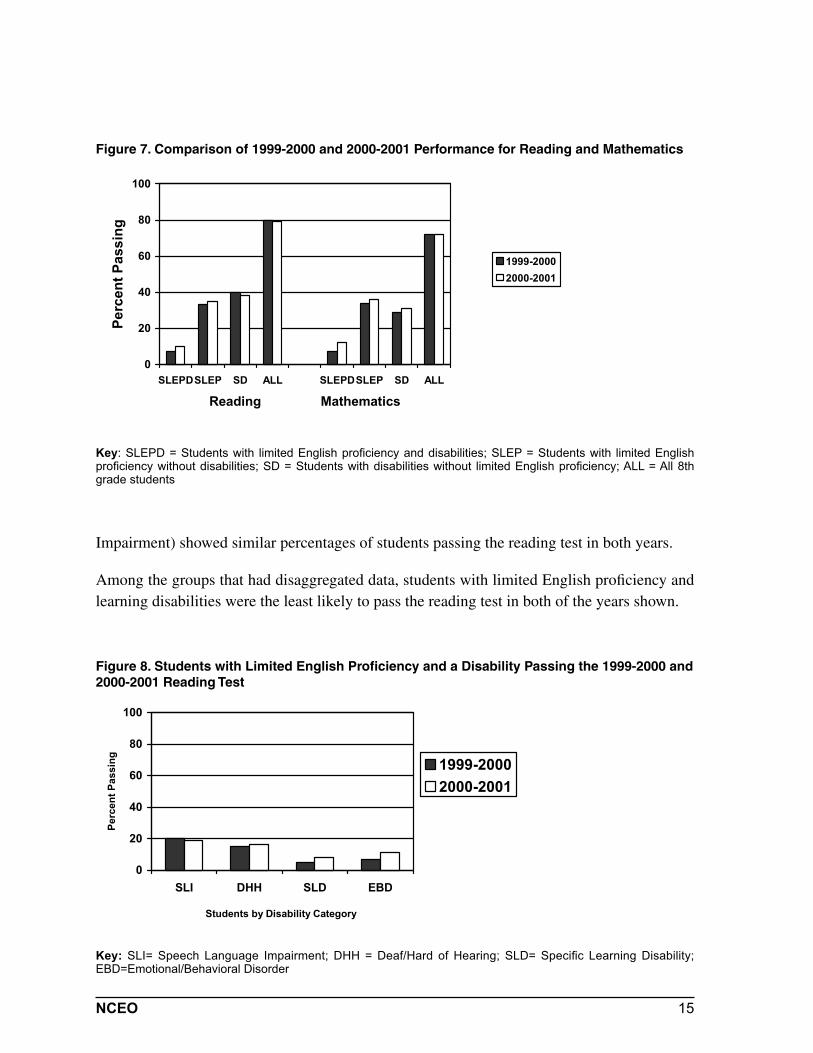
Among the groups that had disaggregated data, students with limited English profi ciency and learning disabilities were the least likely to pass the reading test in both of the years shown.
Key: SLEPD = Students with limited English profi ciency and disabilities; SLEP = Students with limited English profi ciency without disabilities; SD = Students with disabilities without limited English profi ciency; ALL = All 8th grade students
Figure 7. Comparison of 1999-2000 and 2000-2001 Performance for Reading and Mathematics
0
20
40
60
80
100
SLEPDSLEP SD ALL SLEPDSLEP SD ALL
Reading Mathematics
Pe
rcen
t P
ass
ing
1999-2000
2000-2001
Figure 8. Students with Limited English Profi ciency and a Disability Passing the 1999-2000 and 2000-2001 Reading Test
0
20
40
60
80
100
SLI DHH SLD EBD
Students by Disability Category
Perc
en
t P
assin
g
1999-2000
2000-2001
Key: SLI= Speech Language Impairment; DHH = Deaf/Hard of Hearing; SLD= Specifi c Learning Disability; EBD=Emotional/Behavioral Disorder
16 NCEO
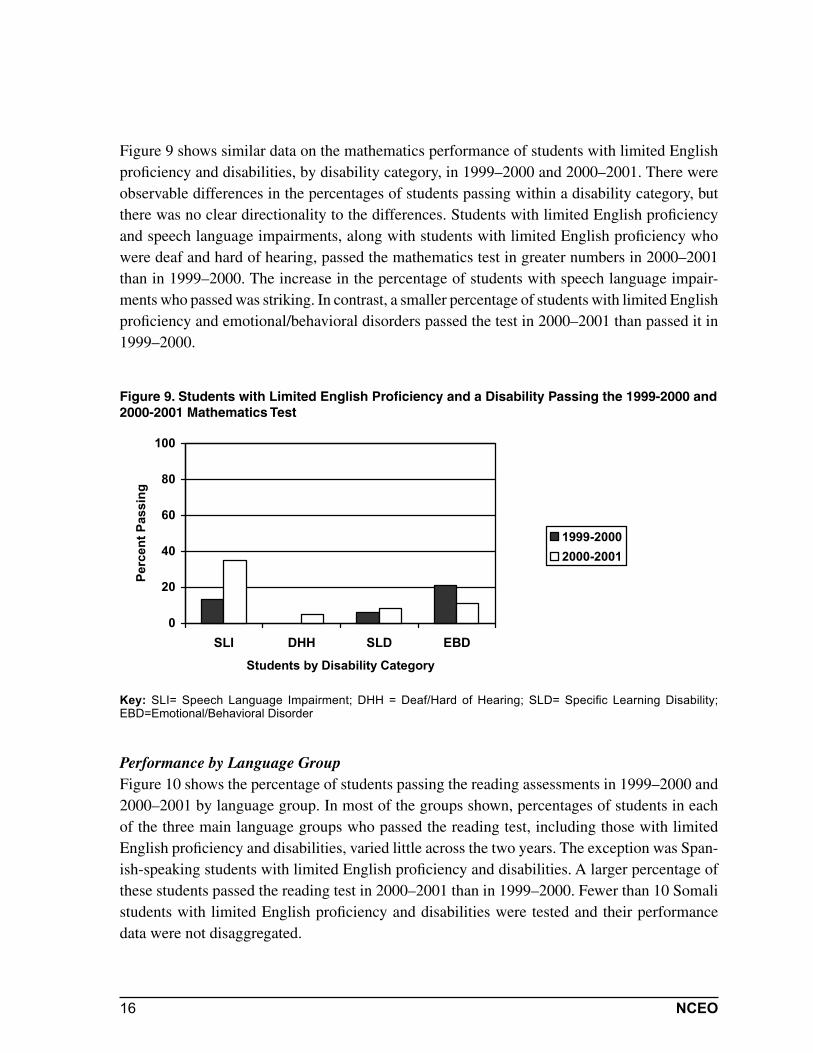
Figure 9 shows similar data on the mathematics performance of students with limited English profi ciency and disabilities, by disability category, in 1999–2000 and 2000–2001. There were observable differences in the percentages of students passing within a disability category, but there was no clear directionality to the differences. Students with limited English profi ciency and speech language impairments, along with students with limited English profi ciency who were deaf and hard of hearing, passed the mathematics test in greater numbers in 2000–2001 than in 1999–2000. The increase in the percentage of students with speech language impair-ments who passed was striking. In contrast, a smaller percentage of students with limited English profi ciency and emotional/behavioral disorders passed the test in 2000–2001 than passed it in 1999–2000.
Figure 9. Students with Limited English Profi ciency and a Disability Passing the 1999-2000 and 2000-2001 Mathematics Test
0
20
40
60
80
100
SLI DHH SLD EBD
Students by Disability Category
Perc
en
t P
as
sin
g
1999-2000
2000-2001
Key: SLI= Speech Language Impairment; DHH = Deaf/Hard of Hearing; SLD= Specifi c Learning Disability; EBD=Emotional/Behavioral Disorder
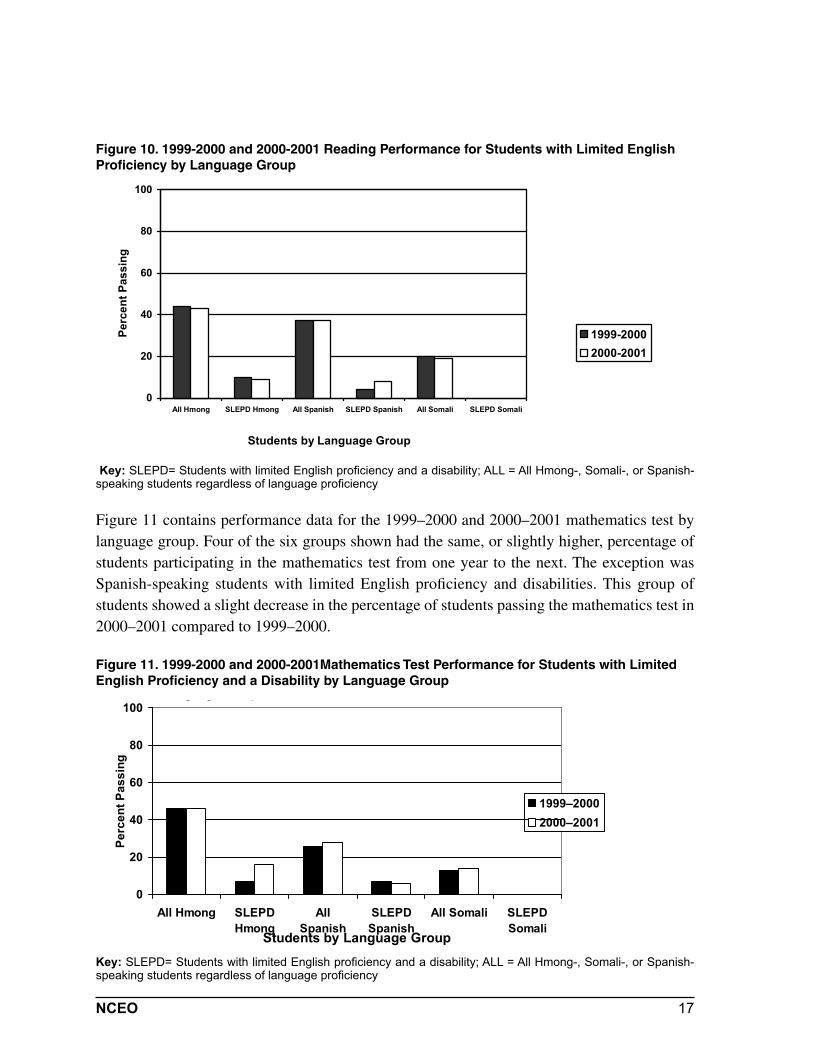
Performance by Language GroupFigure 10 shows the percentage of students passing the reading assessments in 1999–2000 and 2000–2001 by language group. In most of the groups shown, percentages of students in each of the three main language groups who passed the reading test, including those with limited English profi ciency and disabilities, varied little across the two years. The exception was Span-ish-speaking students with limited English profi ciency and disabilities. A larger percentage of these students passed the reading test in 2000–2001 than in 1999–2000. Fewer than 10 Somali students with limited English profi ciency and disabilities were tested and their performance data were not disaggregated.
17NCEO
Key: SLEPD= Students with limited English profi ciency and a disability; ALL = All Hmong-, Somali-, or Spanish-speaking students regardless of language profi ciency
Figure 11 contains performance data for the 1999–2000 and 2000–2001 mathematics test by language group. Four of the six groups shown had the same, or slightly higher, percentage of students participating in the mathematics test from one year to the next. The exception was Spanish-speaking students with limited English profi ciency and disabilities. This group of students showed a slight decrease in the percentage of students passing the mathematics test in 2000–2001 compared to 1999–2000.
Figure 10. 1999-2000 and 2000-2001 Reading Performance for Students with Limited English Profi ciency by Language Group
0
20
40
60
80
100
All Hmong SLEPD Hmong All Spanish SLEPD Spanish All Somali SLEPD Somali
Students by Language Group
Pe
rce
nt
Pa
ss
ing
1999-2000
2000-2001
g g p
0
20
40
60
80
100
All Hmong SLEPD
Hmong
All
Spanish
SLEPD
Spanish
All Somali SLEPD
SomaliStudents by Language Group
Pe
rce
nt
Pa
ss
ing
1999–2000
2000–2001
Figure 11. 1999-2000 and 2000-2001Mathematics Test Performance for Students with Limited English Profi ciency and a Disability by Language Group
Key: SLEPD= Students with limited English profi ciency and a disability; ALL = All Hmong-, Somali-, or Spanish-speaking students regardless of language profi ciency
18 NCEO
For most groups, the difference in the percent of students passing in 1999–2000 versus 2000–2001 was small. The one exception was Hmong students with limited English profi ciency and disabilities. Roughly 10% more of these students passed the mathematics test in 2000–2001 than in 1999–2000.
Summary of Findings
The data on the participation and performance of students with limited English profi ciency and disabilities that are presented in this report are important because they are among some of the fi rst that have been publicly reported and analyzed. Despite their importance, they still must be viewed with some caution, particularly when considering data by disability category, because of the limited number of students.
Participation in 2000–2001In 2000–2001, students with limited English profi ciency and disabilities (SLEPD) had the lowest participation rates of all the groups discussed (SLEP, SD, and All 8th graders) in this report for both reading and mathematics. Participation rates for this group were slightly under 90%, but the rates were 9% lower than the participation rates for the total group of 8th grade students.
Within disability categories, students with limited English profi ciency and disabilities tended to participate at lower rates than their peers in the total group of students with disabilities in that same disability category. Participation rates by disability category varied and were impacted by small numbers of students with limited English profi ciency and disabilities. Typically, students with speech/language disabilities and learning disabilities had the highest participation rates for students with limited English profi ciency and disabilities. Students with autism, mild-moderate mental impairments, and moderate-severe mental impairments had the lowest participation rates. In a few categories, participation rates were different in reading versus mathematics. However, in most cases the participation rates for students in a particular disability category were the same for both subjects.
There was no consistent pattern of participation across all language groups and content tests. Hmong students with limited English profi ciency and disabilities tended to have the highest participation rates of the three language groups examined. They were followed by Spanish-speaking students and, fi nally, by Somali students.
Performance in 2000–2001Of the four groups examined, students with limited English profi ciency and disabilities were the least likely to pass either the reading or the mathematics tests. The passing rate was ap-proximately 10%–12% for students with limited English profi ciency and disabilities, which was
19NCEO
at least 20% lower than the passing rate for either students with disabilities or students with limited English profi ciency. This disparity grew even larger when students with limited English profi ciency and disabilities were compared to the total student population.
Small numbers of students with limited English profi ciency and disabilities in some disability categories limited the observations that could be made about performance. There were enough students to provide data showing that students with limited English profi ciency and speech/lan-guage impairments had the highest percentage passing of all the disability categories. Students with mild-moderate mental impairments along with students with learning disabilities had the lowest percentage passing.
In general, the percentage of the Hmong-, Spanish-, and Somali-speaking students with limited English profi ciency and disabilities who passed the BSTs was typically 20% to approximately 35% lower than the percentage of all students from the same language group who passed the tests. In general, the percentage of Hmong students with limited English profi ciency and dis-abilities passing either the reading or mathematics test was the highest of all three groups of students with limited English profi ciency and disabilities. There was no consistent pattern of better performance in one of the two years that held true across each of the three language groups and for both content tests. The number of Somali students with disabilities was too small to disaggregate performance data.
Participation Compared Across Two YearsParticipation rates for students with disabilities, students with limited English profi ciency, and the total student population tended to be similar in 1999–2000 and 2000–2001 for both reading and mathematics. Even so, students with limited English profi ciency and disabilities had the most noticeable decrease in the percentage of students participating.
When data were examined by disability category, there was a great deal of variation in par-ticipation rates for students with limited English profi ciency and disabilities in both years. In reading, students with limited English profi ciency and speech-language impairments, learning disabilities, and traumatic brain injuries had consistent participation rates across the two years. In contrast, students with limited English profi ciency and mild-moderate mental impairments, visual impairments, and those who were deaf and hard of hearing had lower participation rates in 2000–2001 than in 1999–2000. Students with moderate-severe mental impairments, physical impairments, and other health impairments had higher reading participation in 2000–2001 than in 1999–2000. In mathematics, those with limited English profi ciency and learning disabilities or traumatic brain injury had the most consistent participation rates across years. Students with limited English profi ciency and speech language impairments, mild-moderate mental impair-ments, visual impairments, emotional-behavioral disabilities, and those who were deaf and
20 NCEO
hard of hearing had lower mathematics participation rates in 2000–2001. Students with limited English profi ciency and moderate-severe mental impairments, physical impairments, and other health impairments showed an increase participation rates in mathematics for 2000–2001.
When we examined data by language group and disability status there was no common pattern of increased performance on the reading test in one year compared to the other. Hmong students with limited English profi ciency and disabilities had slightly increased participation rates in reading for 2000–2001 while Spanish-speaking and Somali students with limited English pro-fi ciency and disabilities had decreases in the percent of students participating. In mathematics Hmong-, Spanish-, and Somali-speaking speaking students with limited English profi ciency and disabilities all had lower participation rates in 2000–2001 than in 1999–2000. The decrease was most noticeable for Somali students with limited English profi ciency and disabilities.
Performance Compared Across Two YearsCompared to students with disabilities, students with limited English profi ciency, and the total 8th grade population, students with limited English profi ciency and disabilities were the least likely to pass either the reading or the mathematics test in either year.
When data were examined by disability category, certain patterns could be seen in those disability categories with large enough numbers of students. Students with limited English profi ciency and speech-language impairments had the highest percentage of students passing either reading or mathematics. Typically, the percentage of students in a disability category who passed math-ematics versus reading was the same or slightly different. Exceptions to this pattern were noted for students with speech-language impairments who had a noticeable increase in the percentage of students passing mathematics in 2000–2001 compared to 1999–2000.
Typically, there were small changes in the percentages of Hmong-, Spanish-, and Somali-speaking students with limited English profi ciency and disabilities who passed the reading and mathematics test in either year examined. However, there was no consistent directionality to the changes. A slightly lower percentage of Hmong students passed the reading test in 2000–2001 while a slightly higher percentage of Spanish-speaking students passed the reading test that same year as compared to the previous year. A slightly higher percentage of Hmong- and Spanish-speaking students passed the mathematics test in 2000–2001 compared to the previous year. In both years, the numbers of Somali students with limited English profi ciency were too small to disaggregate data.
Discussion and Conclusion
There were very small numbers of Somali students with limited English profi ciency and dis-abilities that were enrolled in the years covered by this report. One important contextual factor
21NCEO
to understand in interpreting these results is that Somali students are among the most recent immigrants to Minnesota. At the time these data were collected, many Somali students may have been so new to the United States that teachers were not yet referring them for special education assessment in the belief that they needed time to learn English fi rst. Somali students might also have qualifi ed for the short-term exemption from testing due to their recent arrival in the United States.
Although disaggregating statewide assessment data for students who have both limited English profi ciency and disabilities is not currently mandated by NCLB, there are advantages for educa-tors in having these data available to them. This report has shown that while students with limited English profi ciency and disabilities tended to pass the statewide tests at lower percentages than their peers who were in the larger groups of all students with disabilities or all students with limited English profi ciency, it was not true that all students with limited English profi ciency and disabilities were performing poorly. Some of these students passed this state’s 8th grade tests of basic skills in reading and mathematics at the state-determined level on their fi rst at-tempt. Clearly, these are success stories that should be celebrated. However, this examination of the data shows that as recently as 2000–2001 there was a much larger group of students with limited English profi ciency and disabilities who required increased support in order to achieve profi ciency on basic skills. A closer examination of the standards-based instruction that these students receive in the classroom and how it aligns with the state content standards assessed by the test may be in order.
One such group that warrants close attention is students with limited English profi ciency and learning disabilities. These students had relatively high percentages participating in the BST content tests, but relatively low percentages passing either reading or mathematics. Students with limited English profi ciency and learning disabilities are one of the larger groups of students with limited English profi ciency and disabilities. Therefore, changes in instruction and assess-ment policies and practices to support increased academic achievement could have a relatively large impact on the performance of the total group of students. Based on the data, immigrant and refugee students who are the more recent arrivals to the state, such as Somali students with learning disabilities, may be among those most likely to benefi t from this additional support.
Armed with data like these, educators can begin to take a closer look at policies and practices affecting the grade-level, standards-based achievement of students with limited English profi -ciency and disabilities.
22 NCEO
References
Albus, D., Thurlow, M., Minnema, J. & Anderson, M. (2004). Beyond subgroup reporting: English language learners with disabilities in 2002–2003 online state assessment reports (ELLs with Disabilities Report 10). Minneapolis, MN: University of Minnesota, National Center on Educational Outcomes.
Liu, K., Barrera, M., Thurlow, M. & Shyyan, V. (2005). Graduation exam participation and performance (1999–2000) of English language learners with disabilities (ELLS with Disabilities Report 2). Minneapolis, MN: University of Minnesota, National Center on Educational Outcomes.
National Association of State Boards of Education. (2002). From sanctions to solutions: Meeting the needs of low performing schools. Retrieved 12/31/03 from the World Wide Web: http://www.nasbe.org/Educational_Issues/Reports/Sanctions.pdf
Minnesota Department of Education (MDE). (2001). Minnesota Basic Standards Test (BST) technical manual for the academic year 2000–2001. Retrieved 1/26/04 from the World Wide Web: http://education.state.mn.us/content/004211.pdf
Thurlow, M., & Liu, K. (2001). State and district assessments as an avenue to equity and excellence for English language learners with disabilities (LEP Projects Report 2). Minneapolis, MN: University of Minnesota, National Center on Educational Outcomes. Retrieved 1/26/04, from the World Wide Web: http://education.umn.edu/NCEO/OnlinePubs/LEP2.html
Zehler, A., Fleischman, H., Hopstock, P., Pendzick, M. & Stephenson, T. (2003). Descriptive study of services to LEP students and LEP students with disabilities. Special topic report #4: Findings on special education LEP students. Arlington, VA: Development Associates, Inc.
23NCEO
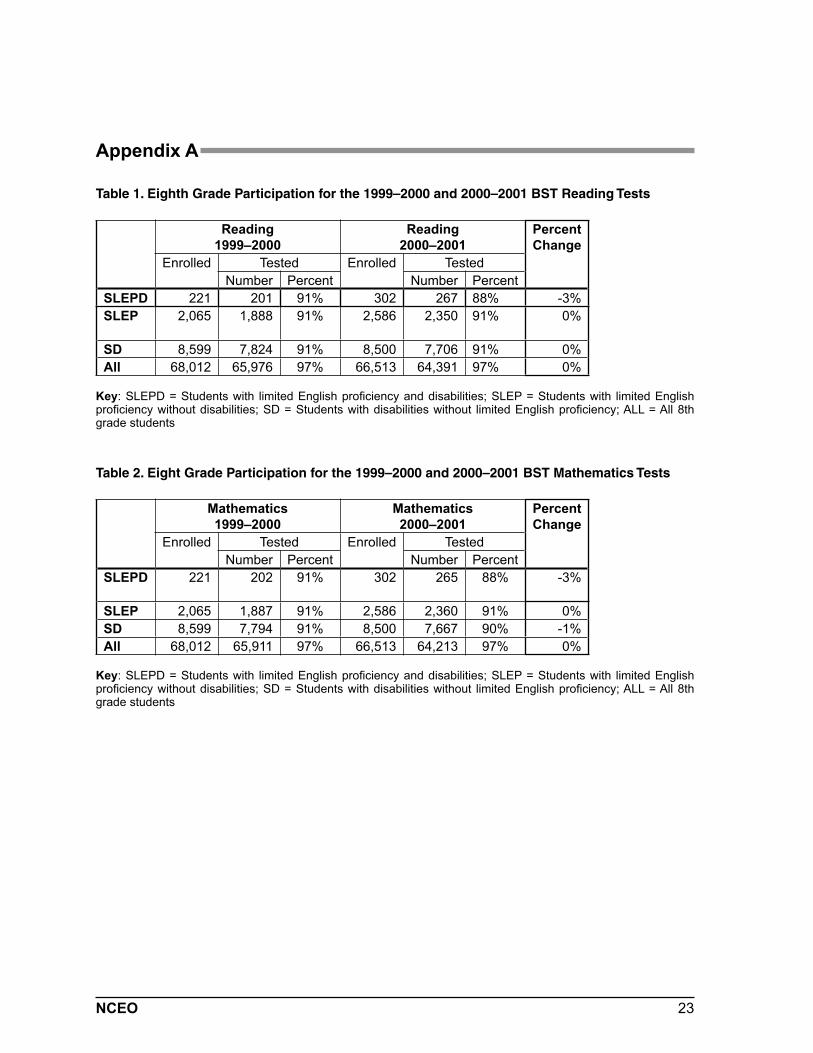
Appendix A
Table 1. Eighth Grade Participation for the 1999–2000 and 2000–2001 BST Reading Tests
Reading
1999–2000
Reading
2000–2001
Percent
Change
Enrolled Tested Enrolled Tested
Number Percent Number Percent
SLEPD 221 201 91% 302 267 88% -3%
SLEP 2,065 1,888 91% 2,586 2,350 91% 0%
SD 8,599 7,824 91% 8,500 7,706 91% 0%
All 68,012 65,976 97% 66,513 64,391 97% 0%
Key: SLEPD = Students with limited English profi ciency and disabilities; SLEP = Students with limited English profi ciency without disabilities; SD = Students with disabilities without limited English profi ciency; ALL = All 8th grade students
Table 2. Eight Grade Participation for the 1999–2000 and 2000–2001 BST Mathematics Tests
Mathematics
1999–2000
Mathematics
2000–2001
Percent
Change
Enrolled Tested Enrolled Tested
Number Percent Number Percent
SLEPD 221 202 91% 302 265 88% -3%
SLEP 2,065 1,887 91% 2,586 2,360 91% 0%
SD 8,599 7,794 91% 8,500 7,667 90% -1%
All 68,012 65,911 97% 66,513 64,213 97% 0%
Key: SLEPD = Students with limited English profi ciency and disabilities; SLEP = Students with limited English profi ciency without disabilities; SD = Students with disabilities without limited English profi ciency; ALL = All 8th grade students
24 NCEO
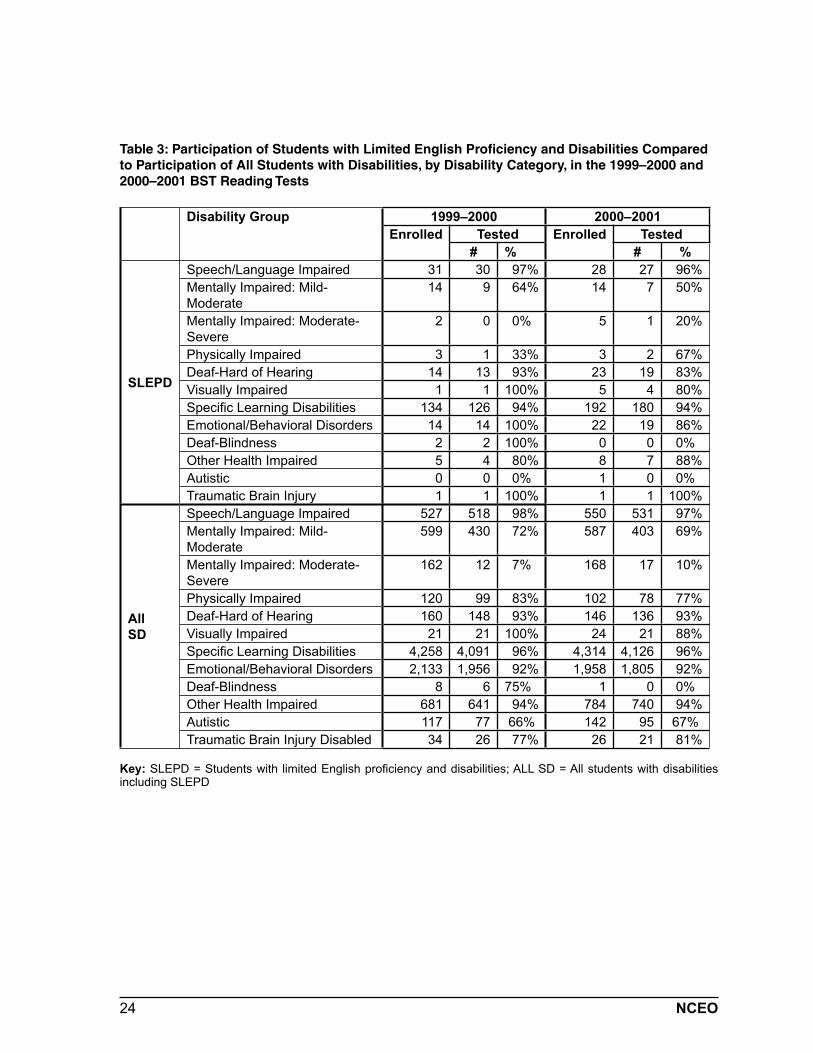
Table 3: Participation of Students with Limited English Profi ciency and Disabilities Compared to Participation of All Students with Disabilities, by Disability Category, in the 1999–2000 and 2000–2001 BST Reading Tests
Disability Group 1999–2000 2000–2001
Enrolled Tested Enrolled Tested
# % # %
SLEPD
Speech/Language Impaired 31 30 97% 28 27 96%
Mentally Impaired: Mild-
Moderate
14 9 64% 14 7 50%
Mentally Impaired: Moderate-
Severe
2 0 0% 5 1 20%
Physically Impaired 3 1 33% 3 2 67%
Deaf-Hard of Hearing 14 13 93% 23 19 83%
Visually Impaired 1 1 100% 5 4 80%
Specifi c Learning Disabilities 134 126 94% 192 180 94%
Emotional/Behavioral Disorders 14 14 100% 22 19 86%
Deaf-Blindness 2 2 100% 0 0 0%
Other Health Impaired 5 4 80% 8 7 88%
Autistic 0 0 0% 1 0 0%
Traumatic Brain Injury 1 1 100% 1 1 100%
All
SD
Speech/Language Impaired 527 518 98% 550 531 97%
Mentally Impaired: Mild-
Moderate
599 430 72% 587 403 69%
Mentally Impaired: Moderate-
Severe
162 12 7% 168 17 10%
Physically Impaired 120 99 83% 102 78 77%
Deaf-Hard of Hearing 160 148 93% 146 136 93%
Visually Impaired 21 21 100% 24 21 88%
Specifi c Learning Disabilities 4,258 4,091 96% 4,314 4,126 96%
Emotional/Behavioral Disorders 2,133 1,956 92% 1,958 1,805 92%
Deaf-Blindness 8 6 75% 1 0 0%
Other Health Impaired 681 641 94% 784 740 94%
Autistic 117 77 66% 142 95 67%
Traumatic Brain Injury Disabled 34 26 77% 26 21 81%
Key: SLEPD = Students with limited English profi ciency and disabilities; ALL SD = All students with disabilities including SLEPD
25NCEO
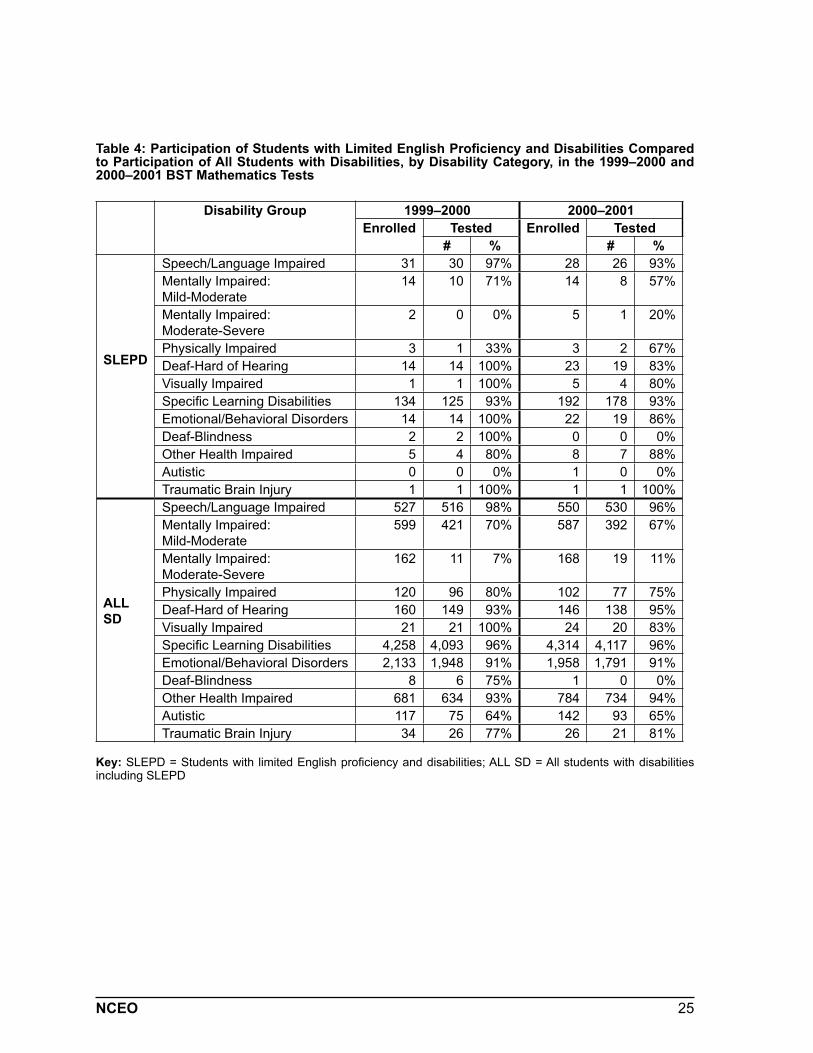
Table 4: Participation of Students with Limited English Profi ciency and Disabilities Compared to Participation of All Students with Disabilities, by Disability Category, in the 1999–2000 and 2000–2001 BST Mathematics Tests
Disability Group 1999–2000 2000–2001
Enrolled Tested Enrolled Tested
# % # %
SLEPD
Speech/Language Impaired 31 30 97% 28 26 93%
Mentally Impaired:
Mild-Moderate
14 10 71% 14 8 57%
Mentally Impaired:
Moderate-Severe
2 0 0% 5 1 20%
Physically Impaired 3 1 33% 3 2 67%
Deaf-Hard of Hearing 14 14 100% 23 19 83%
Visually Impaired 1 1 100% 5 4 80%
Specifi c Learning Disabilities 134 125 93% 192 178 93%
Emotional/Behavioral Disorders 14 14 100% 22 19 86%
Deaf-Blindness 2 2 100% 0 0 0%
Other Health Impaired 5 4 80% 8 7 88%
Autistic 0 0 0% 1 0 0%
Traumatic Brain Injury 1 1 100% 1 1 100%
ALL
SD
Speech/Language Impaired 527 516 98% 550 530 96%
Mentally Impaired:
Mild-Moderate
599 421 70% 587 392 67%
Mentally Impaired:
Moderate-Severe
162 11 7% 168 19 11%
Physically Impaired 120 96 80% 102 77 75%
Deaf-Hard of Hearing 160 149 93% 146 138 95%
Visually Impaired 21 21 100% 24 20 83%
Specifi c Learning Disabilities 4,258 4,093 96% 4,314 4,117 96%
Emotional/Behavioral Disorders 2,133 1,948 91% 1,958 1,791 91%
Deaf-Blindness 8 6 75% 1 0 0%
Other Health Impaired 681 634 93% 784 734 94%
Autistic 117 75 64% 142 93 65%
Traumatic Brain Injury 34 26 77% 26 21 81%
Key: SLEPD = Students with limited English profi ciency and disabilities; ALL SD = All students with disabilities including SLEPD
26 NCEO
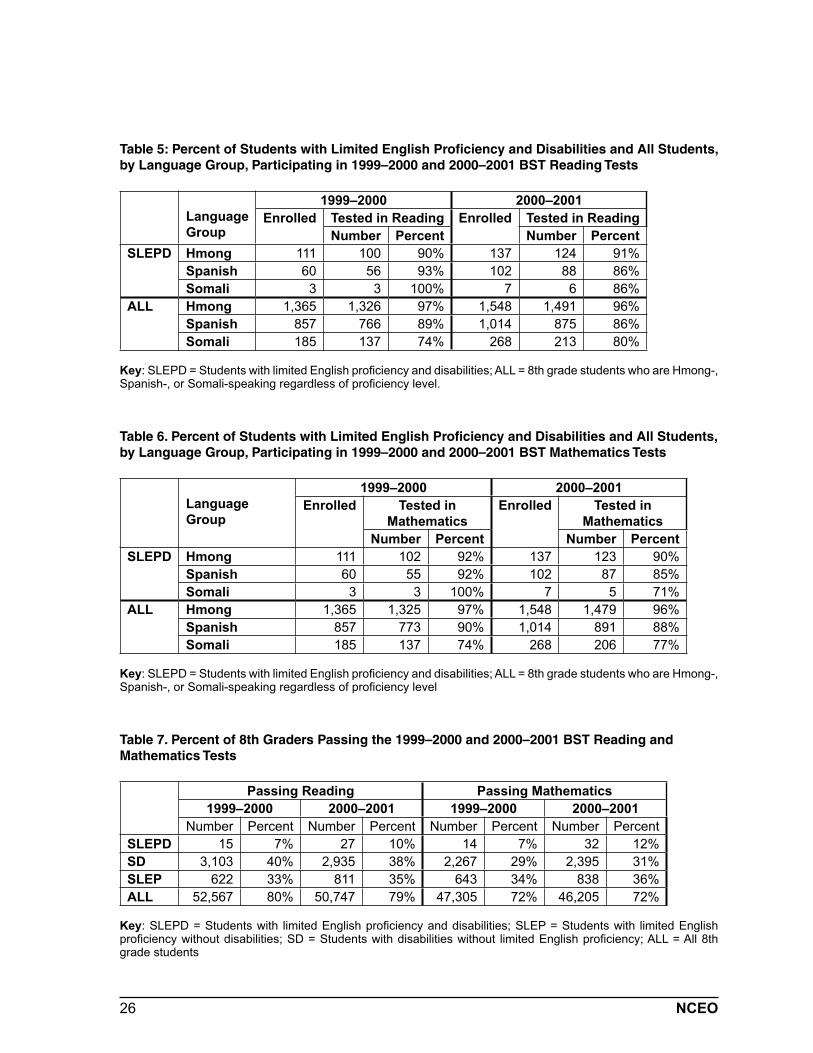
Table 5: Percent of Students with Limited English Profi ciency and Disabilities and All Students, by Language Group, Participating in 1999–2000 and 2000–2001 BST Reading Tests
Language
Group
1999–2000 2000–2001
Enrolled Tested in Reading Enrolled Tested in Reading
Number Percent Number Percent
SLEPD Hmong 111 100 90% 137 124 91%
Spanish 60 56 93% 102 88 86%
Somali 3 3 100% 7 6 86%
ALL Hmong 1,365 1,326 97% 1,548 1,491 96%
Spanish 857 766 89% 1,014 875 86%
Somali 185 137 74% 268 213 80%
Key: SLEPD = Students with limited English profi ciency and disabilities; ALL = 8th grade students who are Hmong-, Spanish-, or Somali-speaking regardless of profi ciency level.
Table 6. Percent of Students with Limited English Profi ciency and Disabilities and All Students, by Language Group, Participating in 1999–2000 and 2000–2001 BST Mathematics Tests
Language
Group
1999–2000 2000–2001
Enrolled Tested in
Mathematics
Enrolled Tested in
Mathematics
Number Percent Number Percent
SLEPD Hmong 111 102 92% 137 123 90%
Spanish 60 55 92% 102 87 85%
Somali 3 3 100% 7 5 71%
ALL Hmong 1,365 1,325 97% 1,548 1,479 96%
Spanish 857 773 90% 1,014 891 88%
Somali 185 137 74% 268 206 77%
Key: SLEPD = Students with limited English profi ciency and disabilities; ALL = 8th grade students who are Hmong-, Spanish-, or Somali-speaking regardless of profi ciency level
Table 7. Percent of 8th Graders Passing the 1999–2000 and 2000–2001 BST Reading and Mathematics Tests
Passing Reading Passing Mathematics
1999–2000 2000–2001 1999–2000 2000–2001
Number Percent Number Percent Number Percent Number Percent
SLEPD 15 7% 27 10% 14 7% 32 12%
SD 3,103 40% 2,935 38% 2,267 29% 2,395 31%
SLEP 622 33% 811 35% 643 34% 838 36%
ALL 52,567 80% 50,747 79% 47,305 72% 46,205 72%
Key: SLEPD = Students with limited English profi ciency and disabilities; SLEP = Students with limited English profi ciency without disabilities; SD = Students with disabilities without limited English profi ciency; ALL = All 8th grade students
27NCEO
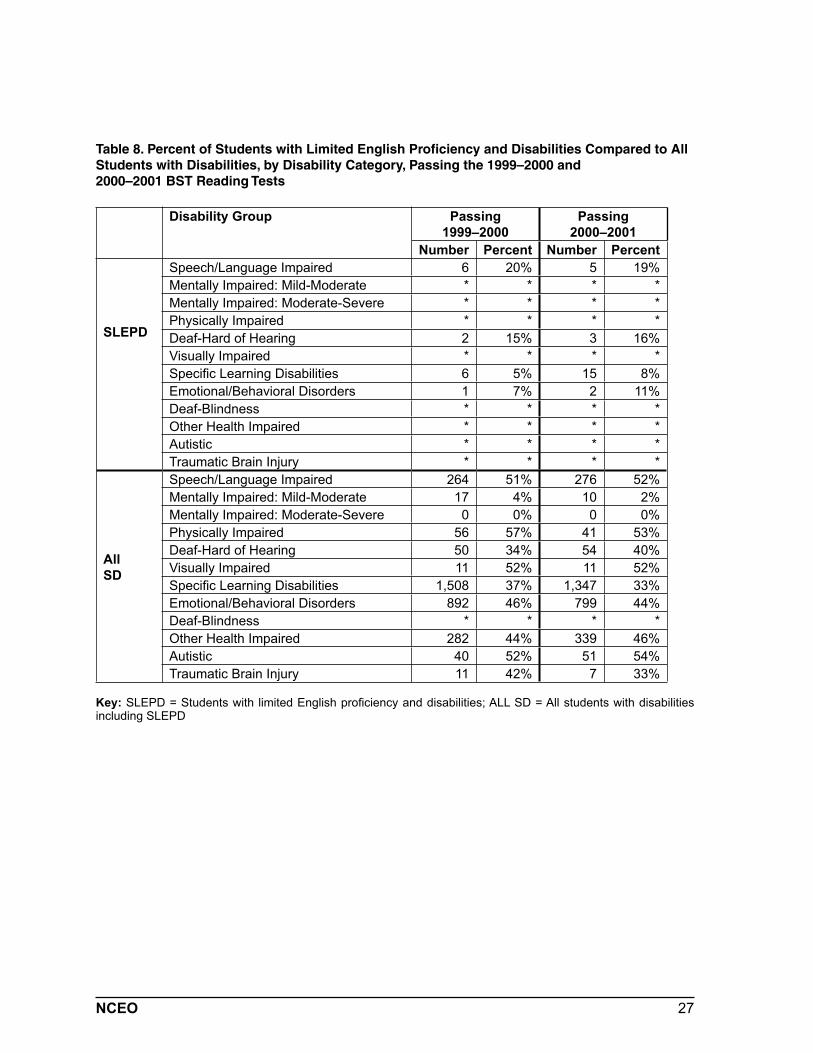
Table 8. Percent of Students with Limited English Profi ciency and Disabilities Compared to All Students with Disabilities, by Disability Category, Passing the 1999–2000 and 2000–2001 BST Reading Tests
Disability Group Passing
1999–2000
Passing
2000–2001
Number Percent Number Percent
SLEPD
Speech/Language Impaired 6 20% 5 19%
Mentally Impaired: Mild-Moderate * * * *
Mentally Impaired: Moderate-Severe * * * *
Physically Impaired * * * *
Deaf-Hard of Hearing 2 15% 3 16%
Visually Impaired * * * *
Specifi c Learning Disabilities 6 5% 15 8%
Emotional/Behavioral Disorders 1 7% 2 11%
Deaf-Blindness * * * *
Other Health Impaired * * * *
Autistic * * * *
Traumatic Brain Injury * * * *
All
SD
Speech/Language Impaired 264 51% 276 52%
Mentally Impaired: Mild-Moderate 17 4% 10 2%
Mentally Impaired: Moderate-Severe 0 0% 0 0%
Physically Impaired 56 57% 41 53%
Deaf-Hard of Hearing 50 34% 54 40%
Visually Impaired 11 52% 11 52%
Specifi c Learning Disabilities 1,508 37% 1,347 33%
Emotional/Behavioral Disorders 892 46% 799 44%
Deaf-Blindness * * * *
Other Health Impaired 282 44% 339 46%
Autistic 40 52% 51 54%
Traumatic Brain Injury 11 42% 7 33%
Key: SLEPD = Students with limited English profi ciency and disabilities; ALL SD = All students with disabilities including SLEPD
28 NCEO
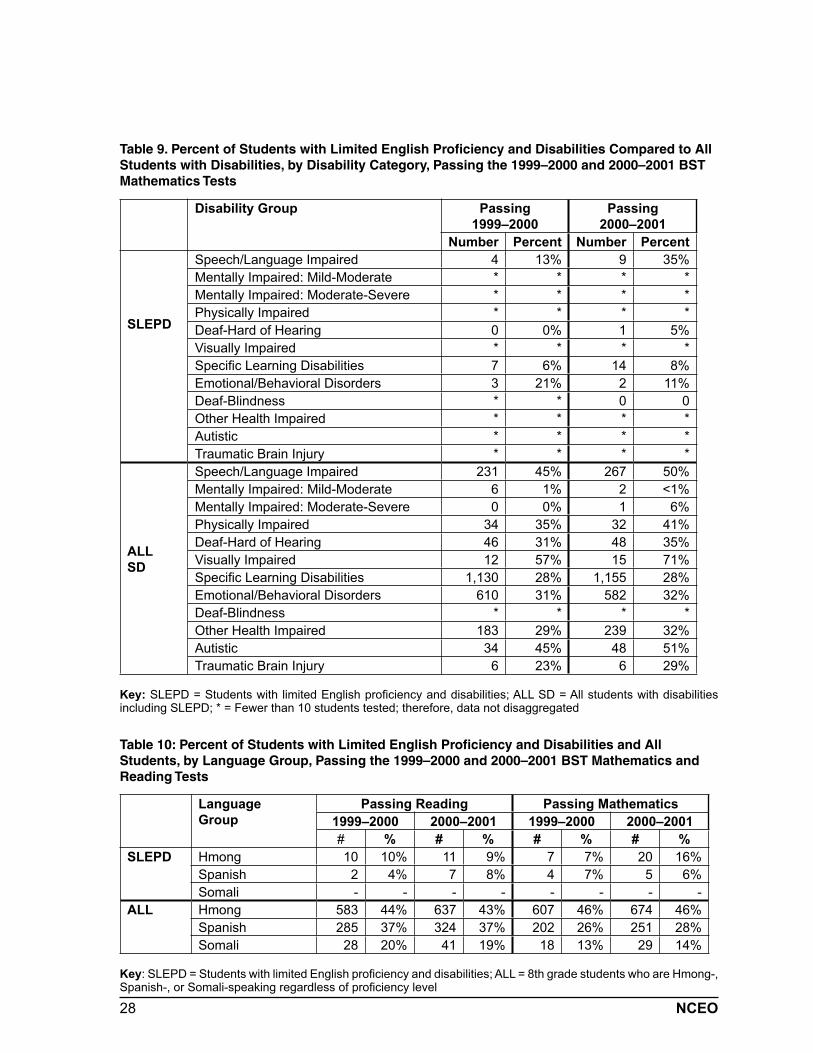
Table 9. Percent of Students with Limited English Profi ciency and Disabilities Compared to All Students with Disabilities, by Disability Category, Passing the 1999–2000 and 2000–2001 BST Mathematics Tests
Disability Group Passing
1999–2000
Passing
2000–2001
Number Percent Number Percent
SLEPD
Speech/Language Impaired 4 13% 9 35%
Mentally Impaired: Mild-Moderate * * * *
Mentally Impaired: Moderate-Severe * * * *
Physically Impaired * * * *
Deaf-Hard of Hearing 0 0% 1 5%
Visually Impaired * * * *
Specifi c Learning Disabilities 7 6% 14 8%
Emotional/Behavioral Disorders 3 21% 2 11%
Deaf-Blindness * * 0 0
Other Health Impaired * * * *
Autistic * * * *
Traumatic Brain Injury * * * *
ALL
SD
Speech/Language Impaired 231 45% 267 50%
Mentally Impaired: Mild-Moderate 6 1% 2 <1%
Mentally Impaired: Moderate-Severe 0 0% 1 6%
Physically Impaired 34 35% 32 41%
Deaf-Hard of Hearing 46 31% 48 35%
Visually Impaired 12 57% 15 71%
Specifi c Learning Disabilities 1,130 28% 1,155 28%
Emotional/Behavioral Disorders 610 31% 582 32%
Deaf-Blindness * * * *
Other Health Impaired 183 29% 239 32%
Autistic 34 45% 48 51%
Traumatic Brain Injury 6 23% 6 29%
Key: SLEPD = Students with limited English profi ciency and disabilities; ALL SD = All students with disabilities including SLEPD; * = Fewer than 10 students tested; therefore, data not disaggregated
Table 10: Percent of Students with Limited English Profi ciency and Disabilities and All Students, by Language Group, Passing the 1999–2000 and 2000–2001 BST Mathematics and Reading Tests
Language
Group
Passing Reading Passing Mathematics
1999–2000 2000–2001 1999–2000 2000–2001
# % # % # % # %
SLEPD Hmong 10 10% 11 9% 7 7% 20 16%
Spanish 2 4% 7 8% 4 7% 5 6%
Somali - - - - - - - -
ALL Hmong 583 44% 637 43% 607 46% 674 46%
Spanish 285 37% 324 37% 202 26% 251 28%
Somali 28 20% 41 19% 18 13% 29 14%
Key: SLEPD = Students with limited English profi ciency and disabilities; ALL = 8th grade students who are Hmong-, Spanish-, or Somali-speaking regardless of profi ciency level