Embed Size (px)
Citation preview

Graduating Senior Survey Report
2005-2006 Graduates from Summer 2005,
Fall 2005, and Spring 2006
Office of Institutional Assessment
June 2007

Graduating Senior Survey Report, 2005-2006 Office of Institutional Assessment, June 2007
i
Table of Contents Table of Contents -------------------------------------------------------------------------------------------------------- i List of Tables ------------------------------------------------------------------------------------------------------------ ii List of Figures ----------------------------------------------------------------------------------------------------------- ii
Part One: University Report
I. Highlights and Introduction ------------------------------------------------------------------------------------------1 Survey Highlights -----------------------------------------------------------------------------------------------------1 Implications and Recommendations --------------------------------------------------------------------------------3 Data Summary Table--------------------------------------------------------------------------------------------------5 Demographics for All Respondents ---------------------------------------------------------------------------------7 Survey Process and Response Rates --------------------------------------------------------------------------------7
II. Student Satisfaction ---------------------------------------------------------------------------------------------------8 Overall Satisfaction and Sense of Belonging ----------------------------------------------------------------------8 Satisfaction with Educational Experiences at Mason-------------------------------------------------------------9 Opportunities to Interact with Students and Faculty--------------------------------------------------------------9 Satisfaction with Campus Life and Services--------------------------------------------------------------------- 10 Would You Attend Mason Again? -------------------------------------------------------------------------------- 10
III. Civic Engagement---------------------------------------------------------------------------------------------------- 12 Interest in News------------------------------------------------------------------------------------------------------ 12 Participation in Civic Activities ----------------------------------------------------------------------------------- 13 Vote in a Presidential Election------------------------------------------------------------------------------------- 13
IV. Mid-term Grades, Educational Debt and Future Plans---------------------------------------------------------- 15 Mid-term Evaluations ----------------------------------------------------------------------------------------------- 15 Educational Debt ---------------------------------------------------------------------------------------------------- 15 Future Educational Plans ------------------------------------------------------------------------------------------- 16 Participation in Alumni Events ------------------------------------------------------------------------------------ 18
V. In-Focus: A Comparison of Transfer and Native Students on Educational Experiences------------------- 19 Introduction----------------------------------------------------------------------------------------------------------- 19 Highlights------------------------------------------------------------------------------------------------------------- 20 Time to Bachelor’s Degree Completion-------------------------------------------------------------------------- 20 Change of Major ----------------------------------------------------------------------------------------------------- 22 Educational Outcomes ---------------------------------------------------------------------------------------------- 22 Synthesis Courses --------------------------------------------------------------------------------------------------- 24 Writing Experiences in Upper-Level Courses ------------------------------------------------------------------- 24 Satisfaction with Educational Experiences at Mason----------------------------------------------------------- 25
Part Two: Appendixes Frequency Reports ----------------------------------------------------------------------------------------------------- 27 Demographics of ALL Graduates and Respondents -------------------------------------------------------------- 34 Graduating Senior Survey, 2005-2006 ------------------------------------------------------------------------------ 37

Graduating Senior Survey Report, 2005-2006 Office of Institutional Assessment, June 2007
ii
List of Tables Table 1. Satisfaction with Overall Mason Experience and Sense of Belonging, by Ethnicity ---------------------8 Table 2. Satisfaction with Educational Experiences, 2003-2006-------------------------------------------------------9 Table 3. Opportunities to Interact with Faculty and Other Students, 2003-2006 ------------------------------------9 Table 4. Satisfaction with Campus Life and Services ----------------------------------------------------------------- 10 Table 5. Interest in News, 2006 vs. 2004 -------------------------------------------------------------------------------- 12 Table 6. Interest in News by Sex, Ethnicity and Age ------------------------------------------------------------------ 12 Table 7. Participation in Civic Activities -------------------------------------------------------------------------------- 13 Table 8. Turnout Rate for the 2004 Presidential Election by Demographic Characteristics---------------------- 14 Table 9. Impact of Midterm Grades -------------------------------------------------------------------------------------- 12 Table 10. Trend of Future Educational Plans, 2003-2006------------------------------------------------------------- 17 Table 11. Percentage of Students who Plan to Enroll in Graduate/Professional Schools: College
Comparison------------------------------------------------------------------------------------------------------ 17 Table 12. Percentage of Students who Plan to Enroll in Graduate/Professional Schools by Background
Characteristics -------------------------------------------------------------------------------------------------- 17 Table 13. Participation in Alumni Events ------------------------------------------------------------------------------- 18 List of Figures Figure 1. Trend of Student Sense of Belonging and Overall Experience at Mason, 1996-2006 ------------------8 Figure 2. If you were to do it all over again, would you attend Mason? 2003-2006------------------------------- 11 Figure 3. If you were to do it all over again, would you attend Mason? Comparison by Ethnicity ------------- 11 Figure 4. How important is it for college-age students to vote in a presidential election?------------------------ 13 Figure 5. Have you ever checked your midterm grades online for any 100- or 200-level courses you took?-- 15 Figure 6. Level of Educational Debt at Graduation, 1998-2006------------------------------------------------------ 16 Figure 7. Level of Educational Debt by Ethnicity---------------------------------------------------------------------- 16

Graduating Senior Survey Report, 2005-2006 Office of Institutional Assessment, June 2007
1
I. Highlights and Introduction
1. Survey Highlights Time to Bachelor’s Degree Completion
• 53% of native students and 74% of transfer students said it took them more than four years to complete their baccalaureate degree.
• Change of major/selecting a second major and working full-time/part-time are the most frequently cited reasons for extended Time-to-Degree completion by native students. For transfer students, working and transferring from another institution are the most frequently cited reasons.
Change of Major
• 43% of native students and 24% of transfer students changed majors while they were Mason students. • Personal interest in the subject matter and a better fit for career goals are the primary reasons for change.
Educational Outcomes
• Over 50% of students think Mason has contributed “very much” to their growth in critical thinking and analysis (56%) and written communication (55%). On several general education learning goals, native students are more likely than transfer students to say Mason contributed “very much” to their growth.
Experiences in Synthesis Courses
• Students had very positive experiences in synthesis courses. A majority thought these courses required them to think critically and to organize ideas, information, or experiences into new, more complex interpretations and relationships.
• Compared to the other items about synthesis courses, students’ level of agreement is relatively lower on the following two statements: “the course improved my writing skills” and “the course improved my oral presentation skills.”
Writing Experiences in Upper-Level Courses
• 89% of students have taken at least one upper-level course in which they had the opportunity to revise their writing after receiving feedback from their instructor on an earlier draft.
• 30% said they “always” have sufficient opportunities in upper-level courses to revise their writings after receiving feedback from an instructor.
• 85% “strongly agree” that the writing assignments from these courses have increased their understanding of their field.
Midterm Grades Among the students who took 100- or 200-level courses at Mason:
• 92% of native students and 78% of transfer students said they had checked their midterm grades. • Among the respondents who HAD checked their midterm grades, 86% said the midterm grades had an
impact on their academic performance and 79% found the grades helpful to assess their academic performance.
Civic Engagement
• Over 70% of students said they followed news “very closely” or “somewhat closely.” Student interest in news differs significantly by demographic characteristics such as sex, ethnicity, and age.
• 39% of students discussed politics frequently and 48% did it occasionally in the past year. About 60% performed volunteer work and 30% performed community service as part of a class.
• Two out of three seniors think it is “very important” for college-age students to vote in a presidential election and 26% think it is “important.”
• Among those who were eligible, 79% voted in the 2004 Presidential Election – a figure equivalent to the national average for the population with a bachelor’s degree.

Graduating Senior Survey Report, 2005-2006 Office of Institutional Assessment, June 2007
2
At the end of the survey, students were given an opportunity to comment on their Mason experiences. All student comments can be accessed at:
http://assessment.gmu.edu/Results/GraduatingSenior/2006/index.cfm
Satisfaction with Educational Experiences • 89% of students are “satisfied” or “very satisfied” with their overall Mason experience; 74% are satisfied
or very satisfied with their sense of belonging at Mason. • Hispanic American students are the most satisfied and Asian American students are the least satisfied
with their overall Mason experience. • Transfer students are more likely than native students to say if they were to do it all over, they would
attend Mason again. Hispanic American students are more likely to say they would attend Mason again than students from other ethnic groups.
• Over 90% of students are either “satisfied” or “very satisfied” with the following: education in the major, academic courses, and education in general.
• Advising in the major has been rated the lowest among educational experiences (listed in the survey) by four cohorts of graduating seniors since 2003, with less than 30% of students being “very satisfied.”
• On out of class access to faculty, 24% of the 2006 seniors were “very satisfied,” down by eight percentage points since 2003.
Satisfaction with Campus Life and Services
• Opportunities to interact with students from diverse backgrounds received the highest rating among the items in this section, but the proportion of students who are satisfied with these opportunities has been decreasing since 2003.
• Food services and parking are major sources of student dissatisfaction. It is particularly true with parking, with only 25% of students being “satisfied” or “very satisfied.”
Would Attend Mason Again?
• Over the past four years, more graduating students said “definitely yes” when asked “If you were to do it all over again, would you attend Mason?” Transfer students are more likely to say definitely yes than native students; Hispanic American students are more likely to say so than students from other ethnic groups.
Educational Debt
• 45% of students graduated with no educational debt. • One out of five students had an educational debt below $10,000 and one out of three had a debt above
$10,000. • Among American students, White Americans have the lowest levels of educational debt and African
American students have the highest levels of educational debt. Future Educational Plan
• 43% of students plan to enroll either full-time or part-time in a graduate/professional school within one year.
• Students who graduated from the former CAS and IT&E are most likely to say they plan to enroll in graduate/professional schools within one year.
• Among American students, Hispanic and African American students are most likely and White American students are least likely to say they will enroll in a graduate/professional school within a year.
Participation in Alumni Activities
• When asked which alumni events would bring them back to campus, students are most likely to participate in an event related to professional development, such as career networking (51%), professional development seminars (33%) and short courses (29%).

Graduating Senior Survey Report, 2005-2006 Office of Institutional Assessment, June 2007
3
2. Implications and Recommendations Opportunities for Interaction Continuing a trend, graduating seniors are reporting less satisfaction with their opportunities to interact with students from diverse backgrounds and out of class access to faculty. On a four-point scale, the average rating for each question remains above 3.0, but it is dropping because fewer students are reporting that they are “very satisfied.” Further, Mason seniors who responded to the National Survey of Student Engagement (NSSE) 2006 also reported a considerably lower level of interaction with faculty than national peers. Despite the fact that the level of student-faculty interaction as measured by the NSSE 2006 survey was higher than it was a few years ago, the results from the NSSE and from this survey are noteworthy. The decreasing satisfaction with “interaction with students from diverse backgrounds” is particularly troubling. In 2003, almost half (49%) of seniors said they were “very satisfied” with these opportunities. That percent is now at 38. We are not certain of the reasons behind this drop and it should be noted that the mean response to this item is still reasonably high at 3.3. Nonetheless, we plan to focus the next iteration of the Graduating Senior Survey on this topic. Synthesis Courses Student responses to questions about their experiences with synthesis courses provide good information to begin evaluating the success of this general education requirement. In general, there are high levels of student agreement with various learning outcomes associated with the synthesis courses. For example, thinking critically is rated very high as an outcome of taking synthesis courses. Further, students also report that these courses required them to organize ideas into more complex interpretations and relationships. More direct measures of student learning outcomes are desirable and currently there are faculty participating in an assessment of critical thinking, particularly as it is manifested in the synthesis courses. More information on this project will be available in the future. Writing Experiences in Upper-Level Courses At least one course in each major at Mason is designated as “writing intensive (WI),” i.e. at least one course must emphasize the process of drafting and revision. Despite a university policy requiring all students to take a WI course, one out of ten graduating seniors reports not having taken such a course. Students may well have forgotten that they took a WI course or may not have realized they were in a WI course, or worse, a course designated as WI might not actually be taught as a WI course. In any case, we urge academic units to verify that there is a least one WI course offered in each major and that it is indeed being taught as a WI course, i.e. one in which students have the opportunity to revise their writing after receiving feedback from their instructor on an earlier draft. Those students who have taken such courses report improvement in their writing, better understanding of their field and more confidence as writers. This is a policy that may need to be monitored to ensure that all graduates have had a minimum of one intensive writing experience. Midterm Grades When midterm grade reports became a requirement at Mason, the thinking was that this feedback would give low-performing students an early warning about their performance in the course and encourage them to contact their professors in order to increase their chances of success. Nearly all native students reported checking their midterm grades and over three-fourths of transfer students did so. Of these students, a very high proportion said midterm grades helped them to assess their performance and over half said midterm grades motivated them to work harder or at least continue with their efforts. Getting midterm grades prompted two out of ten students to talk to their instructors. While we have no direct evidence that midterm grades actually improve student performance, the responses to these questions suggest that this policy may be effective in motivating students to do well in their courses.
Graduating Senior Survey Report, 2005-2006 Office of Institutional Assessment, June 2007
4
Ethnicity and Satisfaction with Mason Experiences Hispanic Americans report greater levels of satisfaction with their overall Mason experience and their sense of belonging to Mason than other ethnic groups. They are more likely to indicate that they would attend Mason again if they were to do it all over again. They are also more satisfied with opportunities to interact with students from diverse backgrounds. Our limited analyses so far do not tell us why this group, which is not the largest of the minority groups on campus, is more positive about their experiences at Mason. Are Hispanic Americans more involved in student organizations? Do they have a strong social support system? These kinds of questions will be raised in the next senior survey. Advising in the Major Satisfaction with advising in the major remains low. One year ago, the Ad Hoc Committee on Advising reported to the Provost on a variety of ways to improve advising at Mason. Promised funding in fiscal year ’08 will allow the implementation of many of the recommendations made by this committee. Reported levels of satisfaction are unlikely to rise in next year or two, but we should see some improvement in satisfaction with advising in the major by the end of the decade if the Committee’s plan is fully implemented. Educational Debt On average, 45% of Mason baccalaureate recipients graduate with no educational debt. The same is true for just 24% of African American students. This is also the group with the highest proportion of debt over $20,000—19%. This disparity is particularly striking when compared with the percentage of white American students who graduate with no debt—49%. These figures highlight the continuing need for increased financial aid resources for our students.

Graduating Senior Survey Report, 2005-2006 Office of Institutional Assessment, June 2007
5
3. Data Summary Table
Total Respondents = 3,123 Response Rate = 86%
Overall Satisfaction and Sense of Belonging
Very satisfied Satisfied Mean a 31% 58% 3.19 Overall Mason experience 23% 51% 2.89 Sense of belonging
Satisfaction with Academic Experiences
Very satisfied Satisfied Mean a 50% 43% 3.41 Education in the major 34% 62% 3.28 Academic courses 34% 60% 3.27 Education in general 28% 60% 3.14 Opportunities to improve writing 23% 62% 3.05 Preparation for work 22% 57% 2.98 Preparation for post-baccalaureate study 26% 44% 2.86 Advising in the major
Satisfaction with Campus Climate and Interactions with Faculty/Students
Very satisfied Satisfied Mean a
38% 56% 3.31 Opportunities to interact with students from diverse background
32% 59% 3.22 Campus climate for the broad diversity of students at Mason
24% 63% 3.08 Out-of-class access to faculty 13% 58% 2.78 Campus life
a Rated on a 1-4 scale: 1=very dissatisfied; and 4=very satisfied Educational Outcomes – The extent to which Mason contributed to your growth in:
Very satisfied Satisfied Mean b 56% 34% 3.45 Critical thinking 55% 34% 3.41 Written communication 27% 56% 3.06 Oral communication 31% 41% 2.96 Quantitative reasoning 32% 39% 2.95 Information technology 28% 39% 2.87 Scientific reasoning
b Rated on a 1-4 scale: 1=not at all; and 4=very much Midterm Grades - % of students who agreed with the following statements about midterm grades
86% The mid-term grade(s) had an impact on my academic performance. 79% The mid-term grades helped me to assess my academic performance. 55% The mid-term grade(s) motivated me to work harder or continue my efforts.
38% The mid-term grade(s) was/were available to me early enough to improve my academic performance.
18% I have discussed my mid-term grade(s) with my instructor(s). 1% I withdrew from a course because of the mid-term grade I received.

Graduating Senior Survey Report, 2005-2006 Office of Institutional Assessment, June 2007
6
Writing Experience in Courses of 300-Level or above (excluding English 302) A great deal Somewhat Mean c
43% 42% 3.22 The writing assignments from these courses have increased my understanding of my field.
37% 46% 3.15 These courses have improved my confidence as a writer.
38% 45% 3.14 The feedback and revision process in these courses has helped me to improve my writing.
c Rated on 1-4 scale: 1=not at all; 4=a great deal Time to Bachelor’s Degree Completion
% Native Students % Transfer Students 47% 26% Four years or less 53% 74% More than four years
Time to Bachelor’s Degree Completion – Why did it take you more than four years to complete your baccalaureate degree? d
% Native Students % Transfer Students 52% 59% I have to work full-time/part-time.
-- 61% I transferred from another institution.
43% 31% I have changed my major or I have selected a second major.
35% 25% Some courses were not offered at convenient times for me.
34% 33% My job(s) was/were off-campus. 31% 16% I had some academic difficulty.
d The survey provided 14 possible reasons for extending baccalaureate degree study to more than four years and students were able to select more than one reason. This table only includes the most frequently cited reasons. The figures presented here are the percentages of native/transfer students who selected each reason. How Closely Students Follow News
Very closely Somewhat closely Mean e 26% 51% 2.99 Local and state news 35% 50% 3.18 National news 27% 46% 2.97 International news
e Rated on a 1-4 scale: 1=not at all; and 4=very closely Did you personally vote in the 2004 presidential election? f
79% Yes, I did vote. 21% No, I did not vote.
f Only includes the U.S. citizens who were eligible to vote.
A complete frequency table can be found at the end of this report in the appendix. Department/major level frequency tables are available online at:
http://assessment.gmu.edu/Results/GraduatingSenior/2006/index.cfm

Graduating Senior Survey Report, 2005-2006 Office of Institutional Assessment, June 2007
7
4. Demographics for All Respondents
• The total number of respondents is 3,123. • The overall response rate is 86%. • 59% of the respondents are women.* • 54% are white Americans, 41% are minority Americans and 5% are international students.* • 91% are VA residents.* • 52% of the respondents are from the former College of Arts and Sciences and 20% are from the School of
Management.* *These figures are very similar to the overall demographic characteristics of the 2006 graduating class. For more detailed statistics, go to: http://assessment.gmu.edu/Results/GraduatingSenior/2006/index.cfm 5. Survey Process and Response Rates The Office of Institutional Assessment has been conducting Graduating Senior Surveys since 1989. Senior students who graduated in summer 2005, fall 2005 and spring 2006 were directed to complete the Graduating Senior Survey online as they completed their online graduation application. In this academic year, 3,639 graduates earned a total number of 3,655 undergraduate degrees from Mason. Among them, 3,123 completed the survey for a response rate of 86%.
Each year, transfer students account for about 60% of the graduating class. Among the survey respondents, 57% started college at another institution and transferred to Mason later. The 2006 Graduating Senior Survey included a variety of topics: learning outcomes, writing experience in upper-level courses, synthesis courses, midterm grades, civic engagement, satisfaction with Mason experiences, educational debt and future plans. In addition, it asked in-depth questions about time-to-baccalaureate degree completion and change of major. All survey respondents were categorized into two groups using the following definitions:
• Transfer students are those who started college at another post-secondary institution as first-time freshmen and, later, transferred into Mason
• Native students are those who started college at Mason as first-time freshmen and have not attended any other post-secondary institution
The first four sections of this report present results from all respondents. Some of the survey questions have been asked previously and are reported as trends. Comparisons of student responses by demographic characteristics were made when appropriate. A comparison of transfer and native students on educational experiences was reported in an In Focus publication, which is included in Section V of this report. Detailed information on college and program level results of the Graduating Senior Survey is available online at http://assessment.gmu.edu/Results/GraduatingSenior/2006/index.cfm. Feedback from readers is appreciated. We can be contacted at [email protected].
Throughout this report, percentages may not add up to 100 due to rounding.
The following college codes are used in this report:
• CAS* = College of Arts and Sciences • CEHD = College of Education and Human Development • CNHS = College of Nursing and Health Sciences • CVPA = College of Visual and Performing Arts • IT&E = The Volgenau School of Information Technology and Engineering • SOM = School of Management
* The survey was administered before CAS was formally re-organized into two separate colleges.

Graduating Senior Survey Report, 2005-2006 Office of Institutional Assessment, June 2007
8
II. Student Satisfaction
1. Overall Satisfaction and Sense of Belonging Overall levels of satisfaction. The percentage of students who are “very satisfied” or “satisfied” with their overall Mason experience has hovered around 90% since 1998 (see Figure 1). Thirty-one percent of the 2006 graduating seniors were “very satisfied” with their overall Mason experience and 58% were “satisfied.” The past three years have seen a slight decrease in student sense of belonging to Mason. In 2006, 23% of the seniors were “very satisfied” and 51% were “satisfied” with their sense of belonging to Mason, the lowest level since 2003. Figure 1. Trend of Student Sense of Belonging and Overall Experience at Mason, 1996-2006
Percentage of Students "Very Satisfied/Satisfied" with Overall Mason Experience and Sense of Belonging at Mason
44% 39%51%
60% 63% 63%73% 76% 79% 77% 74%
81% 78%91% 90% 90% 91% 89% 94% 90% 90% 89%
0%
20%
40%
60%
80%
100%
1996 1997 1998 1999 2000 2001 2002 2003 2004 2005 2006
Sense of belonging to Mason Overall Mason experience
Analysis by transfer status. Levels of satisfaction with the overall Mason experience and sense of belonging at Mason do not vary by transfer status. The same results were found from the 2005 Graduating Senior Survey as well. Analyses by sex and ethnicity. Levels of satisfaction with the overall Mason experience and sense of belonging do NOT vary by sex but statistically significant differences are found across ethnic groups. As Table 1 shows, Hispanic American students are the most satisfied and Asian American students are the least satisfied with their overall Mason experience. Hispanic American students and International students are the most satisfied and White American students are the least satisfied with sense of belonging at Mason. Table 1. Satisfaction with Overall Mason Experience and Sense of Belonging, by Ethnicity*
How satisfied are you with the following? (Rated on 1-4 scales: 1=very dissatisfied; 4=very satisfied)
African American
Asian American
Hispanic American
White American
International Students Sig. †
Overall Mason experience 3.22 3.10 3.31 3.19 3.26 0.001 Sense of belonging at Mason 2.99 2.94 3.09 2.81 3.07 0.000
* Native American students were excluded from the analysis due to too few cases. Students whose ethnicity was unknown or unreported were also excluded.
† Analysis of Variance (ANOVA) shows the differences in mean values across ethnic groups are statistically significant. Bold type was used to indicate the highest mean value.

Graduating Senior Survey Report, 2005-2006 Office of Institutional Assessment, June 2007
9
2. Satisfaction with Educational Experiences at Mason Trend analyses. A comparison of levels of satisfaction with eight major areas of educational experiences since 2003 shows mixed results. As shown in Table 2, although levels of satisfaction differ significantly across the four-year period, graduating seniors since 2003 are most satisfied with the following three areas:
• Education in the major (47-53% were “very satisfied”) • Academic courses (29-35% were “very satisfied”), and • Education in general (about one third were “very satisfied”)
The 2006 seniors rated opportunities to improve writing significantly lower than the previous three cohorts: the percentage of 2006 students who were “very satisfied” decreased by seven percentage points from previous years. The 2006 seniors were more satisfied with preparation for work than their 2003 counterparts; and the two cohorts gave comparable ratings to preparation for post-baccalaureate study. Advising in the major has been rated the lowest among all the academic areas for four years, with less than 30% of students being “very satisfied.” Between 2004 and 2006, levels of satisfaction with advising have been consistent, which is lower than that of 2003. Table 2. Satisfaction with Educational Experiences, 2003-2006
% of Students who were “Very Satisfied” Mean Comparison How satisfied are you with the following?
(Rated on 1-4 scales: 1=very dissatisfied; 4=very satisfied) 2003 2004 2005 2006 2003 2004 2005 2006 Sig. * Education in the major 53% 51% 47% 50% 3.48 3.43 3.38 3.41 .000 Academic courses 30% 29% 35% 34% 3.24 3.21 3.29 3.28 .000 Education in general 37% 38% 33% 34% 3.33 3.32 3.26 3.27 .000 Opportunities to improve writing 35% 35% 35% 28% 3.28 3.26 3.26 3.14 .000 Preparation for work 18% -- -- 23% 2.98 -- -- 3.05 .000 Preparation for post-baccalaureate study 20% -- -- 22% 3.00 -- -- 2.98 Advising in major 28% 25% 26% 27% 2.98 2.89 2.86 2.89 .000 * Analysis of Variance (ANOVA) or t-test was used to test to whether the differences in mean values are statistically
significant. A result <.05 indicates that the mean values are significantly different across four years or between two years. Analyses by transfer status. A comparison of satisfaction with educational experiences by transfer status is presented in the In Focus report included in Section V of this report. 3. Opportunities to Interact with Students and Faculty Trend analyses. Three graduating classes between 2003 and 2005 were asked to rate how important it was and how satisfied they were with out of class access to faculty and opportunities to interact with students from diverse backgrounds. Compared to the earlier cohorts, the 2005 graduating seniors gave significantly lower importance and satisfaction ratings to both items. The decline in levels of satisfaction continued in 2006. As Table 3 shows, 38% of the 2006 respondents were “very satisfied” with opportunities to interact with students from diverse backgrounds, a drop of eleven percentage points since 2003. On out of class access to faculty, 24% of the 2006 seniors were “very satisfied,” down by eight percentage points since 2003. Table 3. Opportunities to Interact with Faculty and Other Students, 2003-2006
% of Students who were “Very Satisfied” Mean Comparison How satisfied are you with the
following? (Rated on 1-4 scales: 1=very dissatisfied; 4=very satisfied) 2003 2004 2005 2006 2003 2004 2005 2006 Sig.* Opportunities to interact with students from diverse backgrounds 49% 46% 40% 38% 3.44 3.41 3.33 3.31 .000
Out of class access to faculty 32% 32% 25% 24% 3.19 3.18 3.10 3.08 .000 * Analysis of Variance (ANOVA) shows that the differences in mean values across four years are statistically significant.

Graduating Senior Survey Report, 2005-2006 Office of Institutional Assessment, June 2007
10
Analyses by sex and ethnicity. Female students are more satisfied with out of class access to faculty than their male counterparts; and students from different ethnic groups reported comparable levels of satisfaction. Satisfaction with opportunities to interact with students from diverse backgrounds does not vary significantly by sex, but significant differences are found across ethnic groups: Hispanic American students, followed by African American students, are more satisfied than students from other ethnic groups. 4. Satisfaction with Campus Life and Services The survey items on campus life and services have higher non-response rates than those about academic experiences because many students did not live on campus or did not use certain kinds of services, such as personal counseling and financial aid. The results shown in Table 4 excluded the students who selected “not applicable” for these items. Over 90% of the 2006 students who responded to this question were “satisfied” or “very satisfied” with campus climate for the broad diversity of students at Mason, which is the most highly rated item in Table 4. Career counseling, personal counseling, and financial aid services received fairly high ratings, with 77%-79% of the students being either “satisfied” or “very satisfied.” Satisfaction with campus life has slightly improved since 2003, with more 2006 students selecting “very satisfied.” Levels of satisfaction with life in residence halls remain unchanged, although the population of residential students in 2006 was much larger than that of 2003. Parking remains a major source of student dissatisfaction with only 25% of the 2006 students being “satisfied” or “very satisfied.” Table 4. Satisfaction with Campus Life and Services
% “Very Satisfied” OR “Satisfied” Mean Comparison How satisfied are you with the following?
(Rated on 1-4 scales: 1=very dissatisfied; 4=very satisfied) 2003 2006 2003 2006 Sig.* Campus climate for the broad diversity of students at Mason -- 91% -- 3.22 --
Career counseling† 79% 79% 2.92 2.94 Counseling for personal concerns† 82% 79% 2.99 2.94 Financial aid services† -- 77% -- 2.91 -- Campus life† 72% 72% 2.73 2.78 .041 Life in residence halls† 69% 69% 2.75 2.76 Food services -- 66% -- 2.64 -- Parking -- 25% -- 1.82 --
* T-test was used when appropriate to test whether the difference in mean values between 2003 and 2006 is statistically significant. A result <.05 indicates a statistically significant difference.
† On these items, a large number of respondents selected “not applicable” and were excluded from the calculation of frequencies and means.
5. Would You Attend Mason Again? Trend analyses. Over the past four years, more graduating students said “definitely yes” when asked “If you were to do it all over again, would you attend Mason?” In 2006, 40% of the respondents said “definitely yes,” an increase of six percentage points over 2003 (see Figure 2). Transfer students are more likely to say definitely yes than native students: 43% of the 2006 transfer students said so, compared to 36% of native students. The same finding was reported in the 2005 Graduating Senior Survey.

Graduating Senior Survey Report, 2005-2006 Office of Institutional Assessment, June 2007
11
At the end of the survey, students were given an opportunity to comment on their experiences at Mason. Those verbatim comments contain more in-depth information about why students were satisfied or dissatisfied with certain experiences. They are available on line at: http://www.assessment.gmu.edu/Results/GraduatingSenior/2006/index.cfm.
Figure 2. If you were to do it all over again, would you attend Mason? 2003-2006
34%
35%
36%
40%
49%
47%
47%
46%
14%
14%
13%
11%
4%
4%
4%
3%
0% 25% 50% 75% 100%
2003
2004
2005
2006
definitely yes probably yes probably no definitely no
Analyses by Ethnicity. Statistically significant differences are also found across ethnic groups. Again, Hispanic American students are more likely to say they would attend Mason again than students from other ethnic groups. As Figure 3 shows, over 51% of Hispanic American students said “definitely yes,” compared to 40% of African American and White American students, 38% of International students, and 35% of Asian American students. Figure 3. If you were to do it all over again, would you attend Mason? Comparison by Ethnicity*
38%
40%
51%
35%
40%
48%
45%
41%
50%
49%
10%
11%
7%
12%
9%
3%
4%
3%
2%
0% 25% 50% 75% 100%
International Students
White American
Hispanic American
Asian American
African American
definitely yes probably yes probably no definitely no
* Native American students were excluded from the analysis due to too few cases. Students whose ethnicity was unknown or unreported were excluded, too.

Graduating Senior Survey Report, 2005-2006 Office of Institutional Assessment, June 2007
12
III. Civic Engagement 1. Interest in News Trend analysis. The 2006 graduating seniors do not follow news as closely as their counterparts in 2004. As Table 5 shows, the percentage of 2006 students who follow news “very closely” dropped for all three types of news – local and state news, national news and international news. The reason for the drop may be because 2004 was a presidential election year. Table 5. Interest in News, 2006 vs. 2004
2006 2004 How closely do you follow various types of news?
very closely
somewhat closely
not very closely /not at all
very closely
somewhat closely
not very closely /not at all
Local and state news 26% 51% 23% 32% 53% 15% National news 35% 50% 15% 39% 50% 11% International news 27% 46% 27% 31% 46% 23%
Analyses by demographic characteristics. Student interest in news differs significantly by demographic characteristics such as sex, ethnicity, and age. The following findings are based on the information presented in Table 6:
• Sex: Although women and men show the same level of interest in local and state news, male students report following national and international news more closely than female students.
• Ethnicity: Hispanic and African American students follow local and state news more closely than students from other ethnic groups. Hispanic and White American students follow national news more closely than other students. International students have more interest in international news than their American counterparts.
• Age: Interest in news appears to grow with age. Older students (35 or older) follow news more closely than younger students, particularly those 22 or younger.
• Regardless of sex, ethnicity or age, all American students reported a greater interest in national news than local/state or international news.
Table 6. Interest in News by Sex, Ethnicity and Age
Mean Comparison* Local and state news National news International news SEX Female 3.00 3.11 2.87 Male 2.98 3.29 3.11 RACIAL ETHNICITY† African American 3.08 3.15 2.88 Asian American 2.99 3.11 2.97 Hispanic American 3.11 3.23 3.06 White American 2.98 3.21 2.92 International Students 2.79 3.09 3.21 AGE 22 or younger 2.85 3.09 2.86 23-24 2.94 3.13 2.90 25-27 3.02 3.19 3.00 28-30 3.11 3.29 3.07 31-34 3.12 3.32 3.22 35 or older 3.33 3.44 3.24
* Mean values are calculated on a 1-4 scale: 4=very closely, 3=somewhat closely, 2=not very closely, and 1=not at all. † Native American students were excluded due to too few cases. Students whose ethnicity was unknown or unreported were
also excluded.

Graduating Senior Survey Report, 2005-2006 Office of Institutional Assessment, June 2007
13
Figure 4. How important is it for college-age students to vote in a presidential election?
very important,
67%
important, 26%
unimportant, 4%
very unimportant,
3%
2. Participation in Civic Activities Levels of participation, 2006. During their senior year, 39% of students discussed politics frequently and 48% did it occasionally (see Table 7). Nearly 60% performed volunteer work and just over 30% performed community service as part of a class. Less than 30% of students voted in a student election, and one out of four participated in organized demonstrations. Fifteen percent worked on a local, state, or national political campaign. Table 7. Participation in Civic Activities
How frequently did you do the following activities during the past year? Frequently Occasionally Not at all Discussed politics 39% 48% 13% Performed volunteer work 18% 40% 42% Performed community service as part of a class 8% 23% 69% Voted in a student election 8% 21% 71% Participated in organized demonstrations 5% 19% 76% Worked on a local, state, or national political campaign 4% 11% 85%
Analyses by demographic characteristics. Depending on the type of civic activities, levels of participation differ by demographic characteristics. The following are a few highlights:
• Sex: Male students are more likely to say that they discussed politics or voted in a student election, more frequently than female students. Female students are significantly more likely to have performed volunteer work or community service as part of a class than their male counterparts.
• Ethnicity: Students from different ethnic groups (excluding Native American and ethnicity unknown/unreported American students) show significantly different levels of participation in the following activities: discussing politics, voting in a student election, and participating in organized demonstrations. White American students discussed politics more often than students from other ethnic groups, particularly international students and Asian American students; but they are the least likely to say they participated in organized demonstrations in the past year. African American students are more likely to vote in a student election than their counterparts from other ethnic groups.
• Age: Depending on the type of civic activities, students of different age groups show different levels of participation. Younger students (24 or younger) are significantly more likely than their older counterparts to say that they participated in organized demonstrations and voted in a student election in the past year. Students who are between 23-27 are less likely to discuss polities than other students. Students who are younger than 24 or older than 35 are significantly more likely to have performed volunteer work or performed community service as part of a class during the past year than their counterparts.
3. Vote in a Presidential Election Importance of Voting. Two out of three seniors think it is “very important” for college-age students to vote in a presidential election, and 26% think it is “important.” Only 7% selected “unimportant” or “very unimportant.” Female students are significantly more likely to say it is “very important” than their male counterparts. African American students are most likely to say it is “very important,” and Asian American and international students are the least likely to say so. Comparing students from different age groups, older students (above 35) are more likely to think so than younger students.

Graduating Senior Survey Report, 2005-2006 Office of Institutional Assessment, June 2007
14
Turnout Rate for the 2004 Presidential Election. According to the U.S. Census Bureau, 64% of U.S. citizens age 18 and over voted in the 2004 presidential election and the turnout rate for people with a bachelor’s degree was 77.5%. Among the 2006 graduating seniors who were eligible to vote1, 79% voted – a figure equivalent to the national average for the population with a bachelor’s degree. Table 8 compares the turnout rates of Mason students by selected demographic characteristics. The following are some highlights:
• Sex: The voting turnout rate for female students at Mason is significantly higher than that of male students.
• Ethnicity: Native American students and White American students are more likely to have voted in the 2004 presidential election. The turnout rate for Asian American students at Mason is the lowest among all ethnic groups, which is 62%; but this figure is significantly higher than the national average for Asian Americans, which is 44%.
• Age: Mason students who are over 30 years of age are more likely to have voted than their younger counterparts.
Table 8. Turnout Rate for the 2004 Presidential Election by Demographic Characteristics
Turnout Rate Demographic Characteristics
Eligible Graduating Seniors at Mason*
Citizen Population in the U.S. †
Overall Turnout Rate 79% 64% SEX Female 82% 65% Male 75% 62% RACIAL ETHNICITY African American 80% 60% Native American 91% Data not available Asian American 62% 44% Hispanic American 77% 47% White American 84% 67% Other/Unknown American 76% -- AGE 22 or lower 79% 23-24 79%
47% (18-24 years old)
25-27 75% 28-30 77% 31-34 89%
56% (25-34 years old)
35+ 85% 69% (35 years and over) EDUCATIONAL ATTAINMENT High School or less -- 51.5% Some college or Associate degree 79% 69% Bachelor's degree -- 77.5% Advanced degree -- 84%
* See Reference One at the bottom of the page for the criteria used to judge the eligibility of Mason students. † Source: U.S. Census Bureau, Current Population Survey, November 2004. These figures are for reference only because: 1)
the U.S. Census Bureau uses slightly different ethnicity, age, and educational attainment categories than those used in the graduating senior survey; thus, some percentages shown in the table were re-calculated based on the original report; 2) in terms of demographic characteristics, the 2006 graduating seniors at Mason are not representative of the citizen population in the U.S
1 Eligibility is defined by two criteria: 1) a respondent’s official status (reported by the Office of Institutional Research and Reporting) is NOT non-resident alien; 2) on the survey, the respondent did not select the option “I was not eligible to vote because I was not a U.S. citizen.”
Graduating Senior Survey Report, 2005-2006 Office of Institutional Assessment, June 2007
15
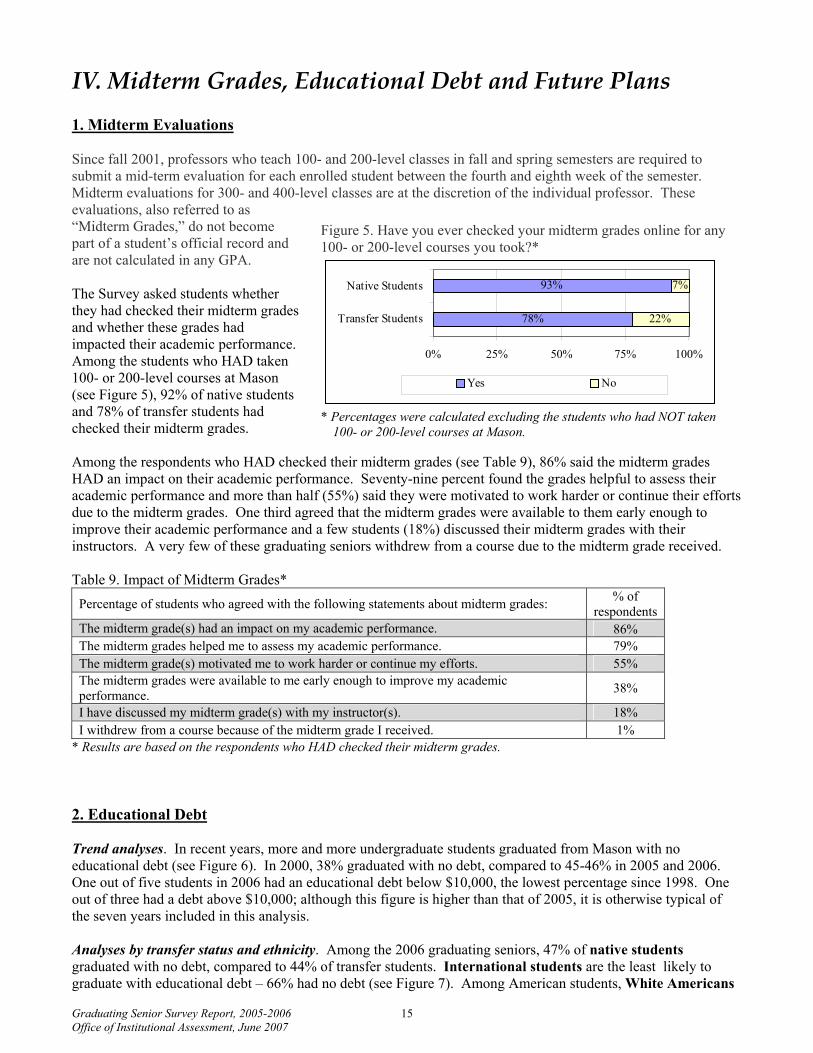
Figure 5. Have you ever checked your midterm grades online for any 100- or 200-level courses you took?*
78%
93%
22%
7%
0% 25% 50% 75% 100%
Transfer Students
Native Students
Yes No
* Percentages were calculated excluding the students who had NOT taken
100- or 200-level courses at Mason.
IV. Midterm Grades, Educational Debt and Future Plans 1. Midterm Evaluations Since fall 2001, professors who teach 100- and 200-level classes in fall and spring semesters are required to submit a mid-term evaluation for each enrolled student between the fourth and eighth week of the semester. Midterm evaluations for 300- and 400-level classes are at the discretion of the individual professor. These evaluations, also referred to as “Midterm Grades,” do not become part of a student’s official record and are not calculated in any GPA. The Survey asked students whether they had checked their midterm grades and whether these grades had impacted their academic performance. Among the students who HAD taken 100- or 200-level courses at Mason (see Figure 5), 92% of native students and 78% of transfer students had checked their midterm grades. Among the respondents who HAD checked their midterm grades (see Table 9), 86% said the midterm grades HAD an impact on their academic performance. Seventy-nine percent found the grades helpful to assess their academic performance and more than half (55%) said they were motivated to work harder or continue their efforts due to the midterm grades. One third agreed that the midterm grades were available to them early enough to improve their academic performance and a few students (18%) discussed their midterm grades with their instructors. A very few of these graduating seniors withdrew from a course due to the midterm grade received. Table 9. Impact of Midterm Grades*
Percentage of students who agreed with the following statements about midterm grades: % of respondents
The midterm grade(s) had an impact on my academic performance. 86% The midterm grades helped me to assess my academic performance. 79% The midterm grade(s) motivated me to work harder or continue my efforts. 55% The midterm grades were available to me early enough to improve my academic performance. 38%
I have discussed my midterm grade(s) with my instructor(s). 18% I withdrew from a course because of the midterm grade I received. 1%
* Results are based on the respondents who HAD checked their midterm grades. 2. Educational Debt Trend analyses. In recent years, more and more undergraduate students graduated from Mason with no educational debt (see Figure 6). In 2000, 38% graduated with no debt, compared to 45-46% in 2005 and 2006. One out of five students in 2006 had an educational debt below $10,000, the lowest percentage since 1998. One out of three had a debt above $10,000; although this figure is higher than that of 2005, it is otherwise typical of the seven years included in this analysis. Analyses by transfer status and ethnicity. Among the 2006 graduating seniors, 47% of native students graduated with no debt, compared to 44% of transfer students. International students are the least likely to graduate with educational debt – 66% had no debt (see Figure 7). Among American students, White Americans

Graduating Senior Survey Report, 2005-2006 Office of Institutional Assessment, June 2007
16
had the lowest level of educational debt—almost 50% graduated without debt. African American students had the highest level of educational debt: one in five had a debt over $20,000, one third had a debt between $10,001 and $20,000, and one out of four had a debt of $10,000 or less. Figure 6. Level of Educational Debt at Graduation, 1998-2006
36%
45%46%
41%39%38%
42%41%
21%24%23%26%27%26%26%
35%34%34%
30%32%33%
20%
30%
40%
50%
1998 1999 2000 2001 2003 2005 2006
none $1-10,000 More than $10,000
Figure 7. Level of Educational Debt by Ethnicity
66%
49%
31%
40%
24%
14%
19%
31%
23%
25%
7%
19%
25%
27%
32%
14%
12%
13%
10%
19%
0% 25% 50% 75% 100%
International Students
White American
Hispanic American
Asian American
African American
none $1-10,000 $10,001-20,000 more than $20,000
3. Future Educational Plans Trend analyses. Table 10 shows a four-year trend of students’ post-graduate educational plans. The percentage of graduating seniors who plan to enroll full-time in graduate/professional schools within a year has been consistent since 2003, between 22-24%. The percentage of 2006 students who plan to enroll part-time (20%) dropped by 5-6 percentage points from previous years. Thus, there is an overall decrease in the percentage of 2006 students who plan to be enrolled in course work. In addition, 7% of the 2006 seniors plan to enroll in courses leading to a certificate/professional license and the remaining 6% plan to take courses only, but not as part of a degree/certificate program. These figures have been consistent since 2003. Analyses by college. As reported in the 2004 and 2005 Senior Surveys, students’ future educational plans differ significantly by college. And within each college, future educational plans vary from year to year, as shown in Table 11. For former CAS, the percentage of students who plan to enroll full-time in graduate/professional school remains the highest among all the colleges, which is between 30-31% in the most recent three years. Within CAS, students graduating from five programs are most likely to enroll fulltime: Biology, Chemistry, Earth Science, Government and Politics, and Philosophy.

Graduating Senior Survey Report, 2005-2006 Office of Institutional Assessment, June 2007
17
At CEHD, CNHS and IT&E, the percentages of students who plan to enroll full-time have increased and the percentages of students who plan to enroll part-time have decreased since 2004. CVPA students are the least likely to plan to enroll part-time. The proportion of SOM students planning to enroll in graduate/professional school, either full-time or part-time, has dropped since 2004. Table 10. Trend of Future Educational Plans, 2003-2006 Do you plan to pursue additional education within the next year? 2003 2004 2005 2006 Yes, I will enroll full-time in graduate/ professional school. 22% 23% 24% 23% Yes, I will enroll part-time in graduate/ professional school. 25% 26% 26% 20% Yes, I will enroll in courses leading to a certificate/professional license. 9% 8% 8% 7% Yes, I plan to take courses, but not as part of a degree/certificate program. 6% 6% 6% No, I do not plan to be enrolled in course work. 38% 36%
42%* 44%
*The last two response choices were combined in 2005 Table 11. Percentage of Students who Plan to Enroll in Graduate/Professional Schools: College Comparison
Will Enroll Full-time Will Enroll Part-time 2004 2005 2006 2004 2005 2006 All Graduating Seniors 23% 24% 23% 26% 26% 20% CAS 30% 31% 30% 22% 24% 19% CEHD 12% 14% 19% 28% 24% 23% CNHS 14% 12% 15% 30% 29% 17% CVPA 16% 27% 22% 17% 13% 7% IT&E 16% 18% 20% 48% 39% 28% SOM 15% 13% 11% 28% 31% 24%
Analyses by background characteristics. Female students are more likely to enroll full-time in graduate/professional school than their male counterparts. Over 50% of international students plan to enroll within one year of graduation, with a majority planning to enroll full-time. Among American students, Hispanic and African American students are most likely and White students are least likely to expect to enroll within a year. Native students are more likely to say they plan to enroll full-time while transfer students are more likely to plan to enroll part-time in graduate/professional school. Table 12. Percentage of Students who Plan to Enroll in Graduate/Professional Schools by Background Characteristics
2006 Graduating Seniors Demographic Characteristics Will Enroll Full-time Will Enroll Part-time
All Graduating Seniors 23% 20% SEX Female 25% 20% Male 21% 21% RACIAL ETHNICITY African American 22% 27% Asian American 22% 23% Hispanic American 26% 24% White American 22% 18% International Students 33% 19% TRANSFER STATUS Native Students 27% 15% Transfer Students 21% 24%

Graduating Senior Survey Report, 2005-2006 Office of Institutional Assessment, June 2007
18
4. Participation in Alumni Events When asked which alumni events would bring them back to campus (see Table 13), students are most likely to say they would like to participate in an event related to professional development, such as career networking (51%), professional development seminars (33%) and short courses (29%). One out four would come back for alumni homecoming, faculty presentations, and for interactions with current students and faculty. Sports and recreational events may bring 21-23% back to campus. About 7% say that activities other than the ones listed in Table 13 would bring them back. The most popular of these include the following: enrolling in courses or graduate degree programs, events at the Center for Performing Arts, and football. Table 13. Participation in Alumni Events*
As a Mason alumnus, which of the following would bring you back to campus?
% of Total Respondents
Career networking 51% Professional development seminar 33% Short courses 29% Alumni homecoming 26% Faculty presentation 26% Interaction with current students 26% Interaction with faculty 24% Sports events 23% Recreational events 21% Interaction with classmates 14% Other activities 7%
* Students were able to select multiple options.

Graduating Senior Survey Report, 2005-2006 Office of Institutional Assessment, June 2007
19
A Comparison of Transfer and Native Students on Educational Experiences: Results from the 2005-2006
Graduating Senior Survey I. Introduction The Office of Institutional Assessment has been conducting Graduating Senior Surveys since 1989. Senior students who graduated in summer 2005, fall 2005 and spring 2006 were directed to complete the Graduating Senior Survey online as they completed their online graduation application. In this academic year, 3,639 graduates earned a total number of 3,655 undergraduate degrees from Mason. Among them, 3,123 completed the survey for a response rate of 86%. The 2005-2006 Graduating Senior Survey included a variety of topics: learning outcomes, writing experiences, synthesis courses, change of major, mid-term grades, civic engagement, satisfaction, etc. This In Focus report compares the educational experiences of transfer and native students. It examines the following questions: Why did it take some Mason students more than FOUR years to complete a baccalaureate degree? How many times did they change majors and why? Are there any differences between transfer and native students in terms of educational growth at Mason? Are transfer students as satisfied as native students with their educational experiences at Mason? For this In Focus, all survey respondents were categorized into two groups using the following definitions: • Transfer students: those who started college at another post-secondary institution as
first-time freshmen and, later, transferred into Mason. They accounted for 57% of the survey respondents.
• Native students: those who started college at Mason as first-time freshmen. They accounted for 43% of the survey respondents.
The results of additional survey questions are included in the full report of the 2005-06 Graduating Senior Survey. For detailed information on college and program level results, and for characteristics of survey respondents, please visit our website at http://assessment.gmu.edu/Results/GraduatingSenior/2006/index.cfm.
In Focus A Publication of the Office of Institutional Assessment
George Mason University March 2007 Volume 12, Number 2
ALL results are based on the responses from 3,075 distinct graduating seniors who self-identified as having one of the following statuses: “started college at Mason” or “started college at another institution and transferred to
Mason.” Because of rounding, not all percentages equal to 100% in this report.
Office of
Institutional Assessment D111 Mason Hall
MS 3D2 703-993-8834
[email protected] http://assessment.gmu.edu
Associate Provost for
Institutional Effectiveness Karen M. Gentemann, Ph.D.
Associate Director Ying Zhou, Ph.D. [email protected]
Assistant Director
Mary Zamon, M.A.T. [email protected]
Applications Analyst Rawa Abdalla, M.S. [email protected]
Program Support
Erin McSherry, B.A. [email protected]

Graduating Senior Survey Report, 2005-2006 Office of Institutional Assessment, June 2007
20
Table 1: What year did you first enroll at George Mason University?
1999 or earlier 2000 2001 2002 2003 2004
Native students 10% 12% 34% 42% 2% 0%
Transfers 7% 3% 9% 22% 33% 25%
II. Highlights
• Among the students who graduated in the 2005-2006 academic year, 53% of native students and 74% of transfer students said it took them more than four years to complete their baccalaureate degree.
• Change of major/selecting a second major and working full-time/part-time are the most frequently cited reasons for extended Time-to-Degree completion by native students. For transfer students, working and transferring from another institution are the most frequently cited reasons.
• 43% of native students and 24% of transfer students changed majors while they were a Mason student. Personal interest in the subject matter and a better fit for career goals are the primary reasons for changing majors.
• Over 40% of native and transfer students think Mason has contributed “very much” to their growth in critical thinking and analysis, written communication, global understanding, social and behavioral sciences and synthesis. On several general education learning goals, native students are more likely than transfer students to say Mason contributed “very much” to their growth.
• Both native and transfer students had very positive experiences in synthesis courses. A majority thought these courses required them to think critically and to organize ideas, information, or experiences into new, more complex interpretations and relationships.
• One third of transfer students and one fourth of native students said they “always” had sufficient opportunities in their upper-level courses to revise their writing after receiving feedback from an instructor. They felt the writing assignments in these courses and the feedback-and-revision process contributed to their learning.
• Both native and transfer students are most satisfied with education in the major, academic courses, and the education they received in general at Mason. Transfer students are more likely than native students to say if they were to do it all over, they would attend Mason again.
III. Time to Bachelor’s Degree Completion “Time-to-Degree” refers to the time taken to complete all degree requirements, from the point of admission to graduation. Obviously, Time-to-Degree will be shorter for full-time students vs. part-time students, for students enrolling only in courses which are required for their degree program, and for those who maintain continuous enrollment through completion. 1. Starting Year The starting year (i.e., the first year a student was enrolled at Mason) provides a good estimate of how long it takes a student to earn a bachelor’s degree. A more accurate analysis should take into account a students’ starting semester and graduation term, which we were not able to do through this survey. Native Students. As Table 1 shows, among the native students, 34% first enrolled in 2001 and 44% were first enrolled in 2002 or later. These students earned their baccalaureate degrees in four to five years. It takes the remaining 12% six years and 10% at least seven years to complete a degree. These figures provide a complimentary but different picture than we usually see when we look at Mason’s graduation rates. For instance, the Office of Institutional Research and Reporting (IRR) reports that, for the 1999 first-time full-time degree-seeking freshman cohort, the four-year graduation rate is 33%, five-year rate is 48% and six-year rate is 52%. IRR obtains their figures by tracking entering freshman cohorts, while the survey results are based on the responses from the 2005-2006 graduating class. Transfers. Most transfer students matriculated into Mason as sophomores or juniors. As Table 1 shows, 22% started in 2002, 33% started in 2003, and another 25% first entered Mason in 2004. Nineteen percent entered Mason in 2001 or earlier. These Time-to-Degree figures are very close to what we found from the transfer students who graduated during the 2004-2005 academic year.

Graduating Senior Survey Report, 2005-2006 Office of Institutional Assessment, June 2007
21
The data presented in Table 1 are not exhaustive. For example, it is very likely that some native students who entered Mason in 2001 will graduate in 2007. What we can say about the graduating class of 2005-06 is that a majority of native students took about 4-5 years to graduate from Mason and most transfers took 2-4 years. 2. Reasons for Extended Time to Complete a Bachelor’s Degree More than half of the native students (53%) and three out of four transfer students (74%) said it took them more than four years to complete their baccalaureate degree. The following responses were from these students only! Note: For transfer students, this Time-to-Degree includes the time they were enrolled at other institutions. Possible Reasons for Extended Time-to-Degree. Native students are most likely to cite the following reasons when asked why it took them more than four years:
• I have to work full-time/part-time (selected by 52% of the native students who spent more than four years completing a baccalaureate degree)
• I changed my major or I selected a second major (43%) • Some courses were not offered at convenient times for me (35%) • My job(s) was/were off campus (34%) • I had some academic difficulty (31%)
Transfer students who spent more than four years to earn a college degree are most likely to cite the following reasons:
• I transferred from another institution (61%) • I have to work full-time/part-time (59%) • My job(s) was/were off campus (33%) • I changed my major or I selected a second major (31%)
The Most Important Reason. Native students and transfers responded differently when selecting the most important reason from a list of 14 possible reasons. As Figure 1 shows, a change of major/enrolled in a second major was rated as the most important reason by 19% of native students, followed closely by working full-time/part-time (selected by 16% of native students). A lot of native students (42%) selected “other reasons,” which ranged from courses not being offered at convenient times (5%), a lack of motivation to complete in four years (5%), being enrolled in a certificate program or a minor (4%), to other reasons not included in the list (15%). For 20% of transfer students (see Figure 2), transferring from another institution was the most important factor that caused a delay in completing a bachelor’s degree. However, even more transfers (29%) thought working full-time/part-time was the reason that they could not finish in four years. Another one third selected “other reasons,” such as insufficient financial resources (4%), lack of motivation (3%), courses not being offered at convenient times (3%), taking a long time to choose a major (3%), to other reasons not included in the list (10%). Figures 1 and 2: The Most Important Reason for Extending the Time to Complete a Baccalaureate Degree*
* The figures only include the respondents who said it took them more than four years to complete a bachelor’s degree.
Native Students (n=698)Academic advising,
7%
Working, 16%
Change of major/a
2nd major, 19%
Other reasons,
42%
Taking a long time
to choose a major, 7%
Academic difficulty,
9%
Transfer Students (n=1,306)
Working, 29%
Other reasons,
33%
Change of major/a
2nd major, 9%
Taking care of
family, 9%Transferred
from another
institution, 20%

Graduating Senior Survey Report, 2005-2006 Office of Institutional Assessment, June 2007
22
Figure 3: Have you ever officially changed your major while you were a Mason student?
57%
36%
7%
76%
22%
2%0%
20%40%
60%
80%
No Once Twice or more
Native Students Transfers
IV. Change of Major Change of Major – Frequency. Native students are more likely than transfers to say they officially changed their major while they were a Mason student: 43% of native students and 24% of transfers have done so (see Figure 3). A majority of these students changed major only once. A previous survey also found that among transfer students who graduated during 2004-2005, 23% changed major one or two times, and 1% changed major more than three times. Reasons for Changing Major. There is little difference between native and transfer students regarding the reasons for changing major. The reasons most frequently cited by the students who changed their major at Mason include personal interest in the subject matter and a better fit for career goals (see Table 2). Lack of interest and academic difficulties in the previous major were cited by more native students than transfers. Table 2: Reasons for Changing Major (ONLY for those who Changed Major at Mason)
Reasons for changing major (select all that apply): Native Students (n=560)
Transfers (n=427)
More interest in the subject matter of the new major 68% 59% The new major better fits my career goals 42% 40% Lack of interest in the previous major 39% 26% Academic difficulties in the previous major 25% 15% Dissatisfaction with the previous program 18% 14% The new major was easier for me 16% 14%
V. Educational Outcomes This section summarizes Mason’s contribution to students’ educational growth. The survey lists all the 15 general educational learning goals of the University and asks students to rate the extent to which Mason contributed to their growth in these areas. These 15 learning goals (as listed in Tables 3 and 4) cover a wide range of competencies (e.g., critical thinking, written communication, oral communication, etc.) and subject matter (e.g., arts, social and behavioral sciences, western civilization, etc.). Over the years, we have found that students answer these questions based on their entire educational experiences at Mason, not just their general education experiences. In addition, students tend to rate their growth in competencies (such as critical thinking and analysis) much higher than their growth in a specific subject matter, particularly if the subject is not related or reinforced in their major. As Table 3 shows, over 40% of native and transfer students thought Mason had contributed “very much” to their growth in the following areas: critical thinking and analysis (56-57%), written communication (54-56%), global understanding (44-47%), social and behavioral sciences (40-45%), and synthesis (39-40%). Most of the above learning goals are emphasized throughout the entire undergraduate curricula. The high rating on “social and behavioral sciences” is likely related to the fact that a majority of these graduates majored in these disciplines. Approximately half of transfer students and 40% of native students thought Mason contributed “a little” or “not at all” to their growth in understanding the arts, western civilization and U.S. history (U.S. history no longer exists as a core requirement). There are likely many reasons why students rate their growth in “subject matter” courses lower than they do their growth in overarching university-level competencies. One is that, unlike competencies, some subjects required by the general education curriculum are not addressed throughout the curriculum. Indeed, “subject matter” courses contribute to student growth in competencies such as critical thinking, and oral and written communication. Another reason may be linked to the fact that the approved courses to satisfy U.S. history

Graduating Senior Survey Report, 2005-2006 Office of Institutional Assessment, June 2007
23
and western civilization requirements are all 100-level courses, which students may have taken early in their college career. Table 3: Mason’s Contribution to Student Growth – Frequency Comparison
Native Students Transfers Indicate the extent to which Mason contributed to your growth in each of the following:
Very much Somewhat A
little Not at all
Very much Somewhat A
little Not at all
Critical Thinking and Analysis 56% 36% 7% 1% 57% 33% 9% 2% Written Communication 56% 36% 8% 1% 54% 33% 10% 3% Global Understanding 47% 39% 13% 2% 44% 37% 14% 6% Social and Behavioral Sciences 45% 35% 16% 3% 40% 34% 17% 9% Synthesis 40% 40% 15% 5% 39% 37% 17% 7% Oral Communication 32% 54% 12% 3% 23% 58% 13% 6% Information Technology 32% 40% 24% 5% 32% 38% 21% 9% Literature 31% 45% 20% 4% 28% 40% 21% 11% Quantitative Reasoning 30% 42% 23% 5% 32% 40% 18% 9% Scientific Reasoning 29% 41% 26% 4% 28% 38% 23% 12% Natural Sciences 27% 40% 27% 6% 25% 34% 21% 20% Understand and Apply Ethics in IT 27% 34% 27% 13% 28% 35% 22% 14% Arts 25% 38% 26% 12% 21% 32% 23% 24% U.S. History 20% 39% 31% 10% 20% 30% 26% 25% Western Civilization 19% 39% 33% 9% 19% 32% 26% 24%
It is not surprising that native students are more likely to say Mason has contributed “very much” to these general education goals than transfers (see Table 4). Some transfer students may only need to take two general education courses at Mason (i.e., English 302 and a synthesis course) if they have completed equivalent courses at another institution. In the following areas, native students rated significantly higher than transfers: written communication, global understanding, social and behavioral sciences, oral communication, literature, scientific reasoning, natural sciences, arts, U.S. history and Western civilization. In two areas, transfer students rated as high as native students: critical thinking and analysis and synthesis. Presumably this is due to an emphasis on these areas in synthesis courses and courses in the major. In the remaining three areas, quantitative reasoning, information technology and understanding and applying ethics in information technology, there is no significant difference between native and transfer students either. Table 4: Mason’s Contribution to Student Growth – Mean Comparison* Indicate the extent to which Mason contributed to your growth in each of the following:
Native Students Transfers Sig.
Critical Thinking and Analysis 3.46 3.44 Written Communication 3.46 3.38 0.023 Global Understanding 3.31 3.18 0.000 Social and Behavioral Sciences 3.22 3.05 0.000 Oral Communication 3.15 2.99 0.000 Synthesis 3.14 3.08 Literature 3.04 2.87 0.000 Quantitative Reasoning 2.98 2.95 Information Technology 2.98 2.93 Scientific Reasoning 2.94 2.81 0.000 Natural Sciences 2.88 2.63 0.000 Arts 2.76 2.50 0.000 Understand and Apply Ethics in IT 2.75 2.78 U.S. History 2.69 2.45 0.000 Western Civilization 2.67 2.46 0.000
* Mean values are calculated on a 1-4 scale: 1=not at all, 2=a little, 3=somewhat, and 4=very much. Only statistically significant results p<.05 are reported in the “Sig.” column.

Graduating Senior Survey Report, 2005-2006 Office of Institutional Assessment, June 2007
24
Figure 4. In how many courses at Mason, 300-level or above, did you have the opportunity to revise your writing after receiving feedback from your instructor on an earlier draft?
None, 11%
one course, 23%
three courses,
16%
four courses,
8%
five or more, 16%
two courses,
26%
VI. Synthesis Courses Every undergraduate at Mason is required to take a synthesis course, which is the culminating course in the general education sequence. Synthesis courses are designed to engage students in the connection of meaning and the synthesis of knowledge and require students to demonstrate advanced skills in oral and written presentation. The 2005-06 survey results indicate that synthesis courses seem to be achieving important learning outcomes, particularly in critical thinking. On a list of eight statements about synthesis courses (see Table 5), the ratings from native students are comparable to those from transfer students. Graduating seniors (88%) are most likely to “agree” or “strongly agree” that the synthesis courses they took required them to think critically. Other highly rated items include:
• The course required me to organize ideas, information or experiences into new, more complex interpretations and relationships.
• The course was intellectually challenging. • The course was well organized. • The course linked issues in my major to wider intellectual and community concerns. • The course held my interest.
Students’ level of agreement is relatively lower on two statements: “the course improved my writing skills” and “the course improved my oral presentation skills.” One out of four students disagreed with these two statements. Although unknown, there may not have been sufficient oral presentation or writing assignments included in the synthesis courses these students took. Table 5: Student Experiences in Synthesis Courses
Please indicate your level of agreement with the following statements about the synthesis course you have taken.
Strongly agree Agree Mean*
The course required me to think critically. 38% 50% 3.22 The course required me to organize ideas, information, or experiences into new, more complex interpretations and relationships. 36% 49% 3.18
The course was intellectually challenging. 35% 49% 3.14 The course was well organized. 33% 51% 3.13 The course linked issues in my major to wider intellectual & community concerns. 34% 49% 3.12 The course held my interest. 33% 50% 3.11 The course improved my writing skills. 24% 50% 2.93 The course improved my oral presentation skills. 23% 50% 2.89
* Mean values are calculated on a 1-4 scale: 1=strongly disagree, 2=disagree, 3=agree, and 4=strongly agree. VII. Writing Experiences in Upper‐Level
Courses The 2005-06 survey included a revised set of questions about student writing experiences in 300-level or above courses (excluding English 302), as suggested by the Writing Across the Curriculum Committee. These questions intended to examine whether students receive any feedback about their writing from instructors in upper level courses other than English 302 and whether they have opportunities to revise their writing after receiving the feedback. Number of Upper-Level Courses. Students were asked to report in how many upper-level courses they had the opportunities to revise their writing after receiving feedback from their instructor on an earlier draft. The

Graduating Senior Survey Report, 2005-2006 Office of Institutional Assessment, June 2007
25
responses from native and transfer students are almost the same. Overall, 23% said they had one course, 26% reported two courses, and 16% had three courses (see Figure 4). Eleven percent of students did not have such a course. A detailed analysis found that students’ responses to this question vary greatly by academic program. Generally, students graduating from what-was-then the College of Arts and Sciences (CAS) and the College of Education and Human Development (CEHD) tend to report more courses than their counterparts at other colleges. For all college and program level data, please visit our website at: http://assessment.gmu.edu/Results/GraduatingSenior/2006/index.cfm. Perceived Opportunities for Revision. When asked whether they have sufficient opportunities in upper-level courses to revise their writing after receiving feedback from an instructor, students’ responses differ significantly by transfer status. One third of transfer students said they “always” have sufficient opportunities, compared to one fourth of native students. Contribution to Student Learning. A large percentage of students agreed that the writing assignments in upper-level courses contributed to their learning (see Table 6). Students are most likely to agree that the writing assignments from upper-level courses have increased their understanding of their field either “a great deal” or “somewhat.” A majority of students also feel these courses, particularly the feedback-and-revision process in these courses, have helped to improve their confidence as writers and improve their writing skills. Table 6. Contribution to Student Learning
Native Students Transfers To what extent did the 300-level or above courses help you in the following areas? A great
deal Somewhat Very little/ Not at all
A great deal Somewhat Very little/
Not at all The writing assignments from these courses have increased my understanding of my field. 40% 45% 15% 45% 39% 16%
These courses have improved my confidence as a writer. 35% 48% 17% 39% 44% 17%
The feedback and revision process in these courses has helped me to improve my writing. 33% 50% 17% 42% 41% 18%
VIII. Satisfaction with Educational Experiences at Mason Satisfaction with Educational Experiences. Over 90% of students are either “satisfied” or “very satisfied” with the following (see Table 7): education in the major, academic courses, and education in general. There is no statistically significant difference between native and transfer students. Table 7. Satisfaction with Educational Experiences
% “Satisfied” or “Very Satisfied” Mean Comparison* How satisfied are you with the following aspects of your education at Mason? Native Students Transfers Native
Students Transfers Sig.
Education you received in your major 93% 93% 3.43 3.40 Academic courses 95% 95% 3.26 3.30 Education you received in general 95% 93% 3.25 3.28 Opportunities to improve your writing 87% 89% 3.09 3.17 0.002 Preparation for work 84% 86% 3.01 3.08 0.012 Preparation for post-baccalaureate study 79% 80% 2.96 2.99 Advising you received in your major 68% 75% 2.81 2.95 0.000
* Mean values are calculated on a 1-4 scale: 1=very dissatisfied, 2=dissatisfied, 3=satisfied, and 4=very satisfied. Only statistically significant difference (p<.05) is shown in the “Sig.” column. On opportunities to improve writing, preparation for work, and preparation for post-baccalaureate study, over 80% of students are either “satisfied” or “very satisfied.” Transfer students are slightly more satisfied with the first two items than native students. The item receiving the lowest rating is advising in the major, with which

Graduating Senior Survey Report, 2005-2006 Office of Institutional Assessment, June 2007
26
transfer students are also more satisfied than native students. Earlier studies at Mason suggest that transfer students come to Mason with clearer educational goals than native students. They may feel less of a need for advising and/or may be more receptive to the advice they receive. Also, as noted earlier, transfers are far less likely to change majors than native students, which might result in a better connection to their major advisors as well as a greater familiarity with degree requirements for the major. Overall Satisfaction with Mason Experiences. Student satisfaction with overall Mason experiences and sense of belonging at Mason do not vary by transfer status. Eighty-nine percent of students are either “satisfied” or “very satisfied” with overall Mason experiences and 74% are “satisfied” or “very satisfied” with sense of belonging at Mason. However, transfer students are significantly more likely than native students to say if they were to do it all over, they would “definitely” attend Mason again. As Figure 5 shows, 43% of transfer students would “definitely” make the same decision, compared to 36% of native students; 44% of transfer students would “probably” make the same decision, compared to 49% of native students. Figure 5. If you were to do it all over, would you attend Mason again?
3%
12%
49%
36%
3%
10%
44%
43%
0% 10% 20% 30% 40% 50%
definitely no
probably no
probably yes
definitely yes
native students transfers

Graduating Senior Survey Report, 2005-2006 Office of Institutional Assessment, June 2007
27
2005-2006 Graduating Senior Survey - University Results
I. Educational Experiences1. Which of the following statements best described your enrollment status at Mason?
Count %I started college at Mason as a freshman. 1,320 43%I started at another institution and transferred to Mason. 1,755 57%
Total 3,075 100%
2. What year did you first enroll in George Mason University?Count %
2004 448 14%2003 603 19%2002 958 31%2001 606 20%2000 217 7%1999 117 4%1998 44 1%1997 or earlier 109 4%Total 3,102 100%
3. If it took you more than FOUR years to complete your degree, please indicate why by selecting ALL of the applicable reasons listed below. Count %334 16%722 35%248 12%282 14%441 22%153 8%
1,158 57%683 34%313 15%437 21%225 11%309 15%576 28%820 40%306 15%
It took me a long time to choose a major.I have changed my major or I have selected a second major.Besides my major, I also enrolled in a certificate program or a minor.I wanted to enroll in additional courses in which I have some interest.I had some academic difficulty.I was on academic suspension.I have to work full-time/part-time.My job(s) was/were off-campus.I didn't have enough financial resources.I have to take care of my family.I lacked the motivation to complete the degree in four years.My academic advisor didn't give me good information.Some courses were not offered at convenient times for me.I transferred from another institution.Other

Graduating Senior Survey Report, 2005-2006 Office of Institutional Assessment, June 2007
28
4. Among all the factors above, what was the MOST important one?Count %
93 5%253 13%50 2%34 2%101 5%33 2%482 24%15 1%70 3%137 7%79 4%87 4%78 4%270 13%234 12%
5. Have you ever officially changed your major while you were a Mason student?Count %
No 2,099 68%Yes, once 869 28%Yes, twice 105 3%Yes, three times 24 1%Yes, 4 times or more 5 0%Total 3,102 100%
6. If you answered YES, please indicate why you changed your major. (Select ALL that apply.)Count %206 21%333 33%162 16%640 64%148 15%410 41%110 11%76 8%93 9%
Other
My job(s) was/were off-campus.I didn't have enough financial resources.I have to take care of my family.I lacked the motivation to complete the degree in four years.My academic advisor didn't give me good information.Some courses were not offered at convenient times for me.I transferred from another institution.
It took me a long time to choose a major.I have changed my major or I have selected a second major.Besides my major, I also enrolled in a certificate program or a minor.I wanted to enroll in additional courses in which I have some interest.I had some academic difficulty.I was on academic suspension.I have to work full-time/part-time.
OtherReputation of the new program or the faculty in the new program.
More interest in the subject matter of the new major.
Academic difficulties in the previous major.Lack of interest in the previous major.Dissatisfaction with the previous program.
The new major was easier for me.The new major better fits my career goals.I could earn more money with the new major.

Graduating Senior Survey Report, 2005-2006 Office of Institutional Assessment, June 2007
29
7. How much money will you owe for tuition, books, and other educational expenses?Count %
None 1,382 45%$5,000 or less 289 9%$5,001-10,000 350 11%$10,001-15,000 365 12%$15,001-20,000 311 10%$20,001 or more 379 12%
8. Indicate the extent to which George Mason University contributed to your growth in each of the following:
Count % Count % Count % Count %Arts 695 23% 1,052 34% 748 24% 578 19% 2.61 1.03Critical thinking and analysis 1,741 56% 1,055 34% 247 8% 50 2% 3.45 0.71Global understanding 1,393 45% 1,158 37% 413 13% 127 4% 3.23 0.83Information technology 976 32% 1,182 39% 681 22% 231 8% 2.95 0.92Literature 907 29% 1,306 42% 631 21% 232 8% 2.94 0.89Natural sciences 797 26% 1,125 37% 722 23% 438 14% 2.74 1.00Oral communication 826 27% 1,728 56% 392 13% 132 4% 3.06 0.75Quantitative reasoning 961 31% 1,254 41% 626 20% 224 7% 2.96 0.90Scientific reasoning 866 28% 1,196 39% 745 24% 262 9% 2.87 0.92Social and behavioral sciences 1,297 42% 1,070 35% 512 17% 200 6% 3.13 0.91Synthesis 1,207 39% 1,176 38% 495 16% 199 6% 3.10 0.90Understand and apply ethics in IT 841 28% 1,056 35% 739 24% 414 14% 2.76 1.00US history 608 20% 1,038 34% 860 28% 560 18% 2.55 1.00Western civilization 578 19% 1,066 35% 883 29% 538 18% 2.55 0.99Written communication 957 55% 595 34% 154 9% 40 2% 3.41 0.75
9-1. Have you ever checked your MID-TERM grades on-line for any 100 or 200 level courses you took?Count %
Yes 2,371 77%No 428 14%Did not take any courses 294 10%Total 3,093 100%
Very much Somewhat A little Not at all
Std DeviationMean

Graduating Senior Survey Report, 2005-2006 Office of Institutional Assessment, June 2007
30
9-2. If YES, please read the following statements and check ALL that apply. Count %1,862 79%
893 38%
431 18%33 1%
1,307 55%338 14%49 2%
II. Synthesis Courses10. How often did the following statements apply to your synthesis course?
Count % Count % Count % Count %The course held my interest. 960 33% 1,456 50% 336 12% 154 5% 3.11 0.80The course improved my oral presentation skills. 655 23% 1,451 50% 627 22% 167 6% 2.89 0.81
The course improved my writing skills. 705 24% 1,435 50% 607 21% 146 5% 2.93 0.81The course linked issues in my major to wider intellectual and community concerns. 975 34% 1,399 49% 373 13% 134 5% 3.12 0.80
The course required me to organize ideas, information, or experiences into new, more complex interpretations and relationships.
1,049 36% 1,433 49% 303 10% 113 4% 3.18 0.77
The course required me to think critically. 1,093 38% 1,433 50% 272 9% 96 3% 3.22 0.75The course was intellectually challenging. 1,008 35% 1,413 49% 351 12% 121 4% 3.14 0.79The course was well organized. 967 33% 1,472 51% 313 11% 140 5% 3.13 0.79
III. Writing Experience in Courses of 300-level or above (Excluding English 302)11. In how many courses of 300-level or above did you have the opportunity to revise your writing after receiving feedback from your instructor on an earlier draft?
Count %None 331 11%One 701 23%Two 805 26%Three 508 16%Four 259 8%Five or more 492 16%Total 3,096 100%
MeanStd
DeviationStrongly disagree
Strongly agree Agree Disagree
The mid-term grades helped me to assess my academic performance.The mid-term grades were available to me early enough to improve my academic performance.I have discussed my mid-term grade(s) with my instructor(s).I withdrew from a course because of the mid-term grade I received.The mid-term grade(s) motivated me to work harder or continue my efforts.The mid-term grade(s) had no impact on my academic performance.Other
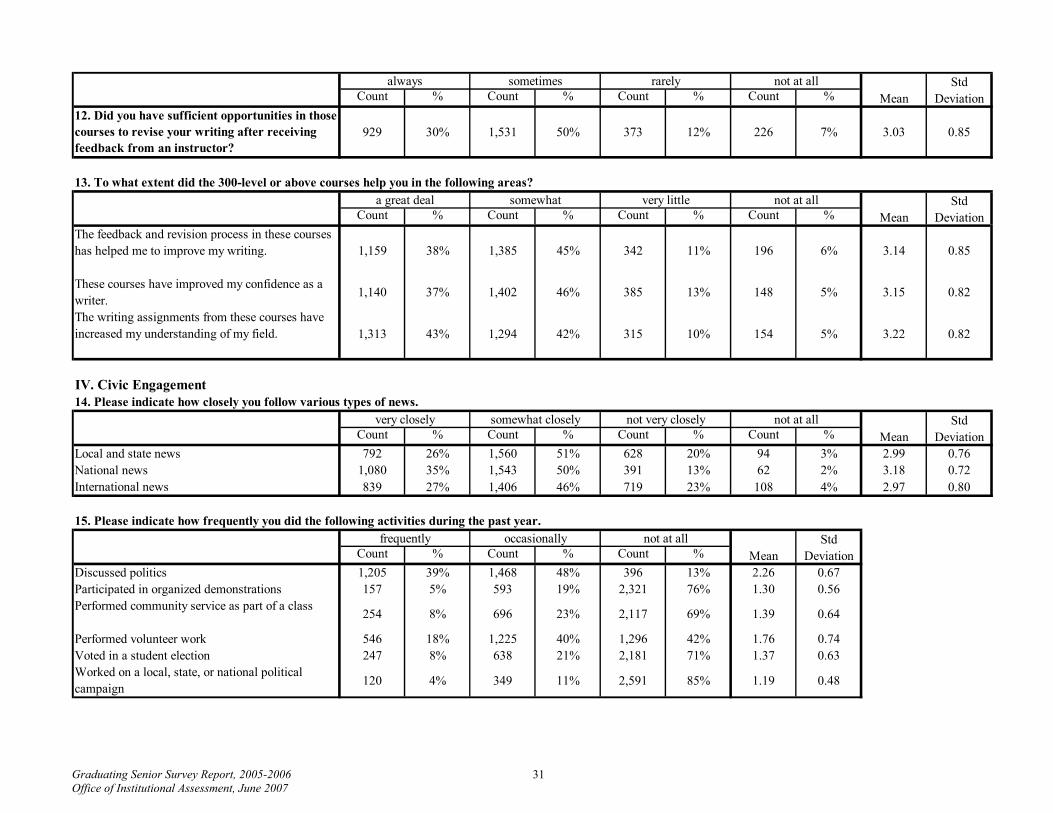
Graduating Senior Survey Report, 2005-2006 Office of Institutional Assessment, June 2007
31
Count % Count % Count % Count %12. Did you have sufficient opportunities in those courses to revise your writing after receiving feedback from an instructor?
929 30% 1,531 50% 373 12% 226 7% 3.03 0.85
13. To what extent did the 300-level or above courses help you in the following areas?
Count % Count % Count % Count %The feedback and revision process in these courses has helped me to improve my writing. 1,159 38% 1,385 45% 342 11% 196 6% 3.14 0.85
These courses have improved my confidence as a writer. 1,140 37% 1,402 46% 385 13% 148 5% 3.15 0.82
The writing assignments from these courses have increased my understanding of my field. 1,313 43% 1,294 42% 315 10% 154 5% 3.22 0.82
IV. Civic Engagement14. Please indicate how closely you follow various types of news.
Count % Count % Count % Count %Local and state news 792 26% 1,560 51% 628 20% 94 3% 2.99 0.76National news 1,080 35% 1,543 50% 391 13% 62 2% 3.18 0.72International news 839 27% 1,406 46% 719 23% 108 4% 2.97 0.80
15. Please indicate how frequently you did the following activities during the past year.
Count % Count % Count %Discussed politics 1,205 39% 1,468 48% 396 13% 2.26 0.67Participated in organized demonstrations 157 5% 593 19% 2,321 76% 1.30 0.56Performed community service as part of a class 254 8% 696 23% 2,117 69% 1.39 0.64
Performed volunteer work 546 18% 1,225 40% 1,296 42% 1.76 0.74Voted in a student election 247 8% 638 21% 2,181 71% 1.37 0.63Worked on a local, state, or national political campaign 120 4% 349 11% 2,591 85% 1.19 0.48
Mean
Mean
MeanStd
Deviation
MeanStd
Deviation
Std Deviation
Std Deviation
not at all
not at all
very closely somewhat closely not very closely not at all
a great deal somewhat very little
always sometimes rarely not at all
frequently occasionally
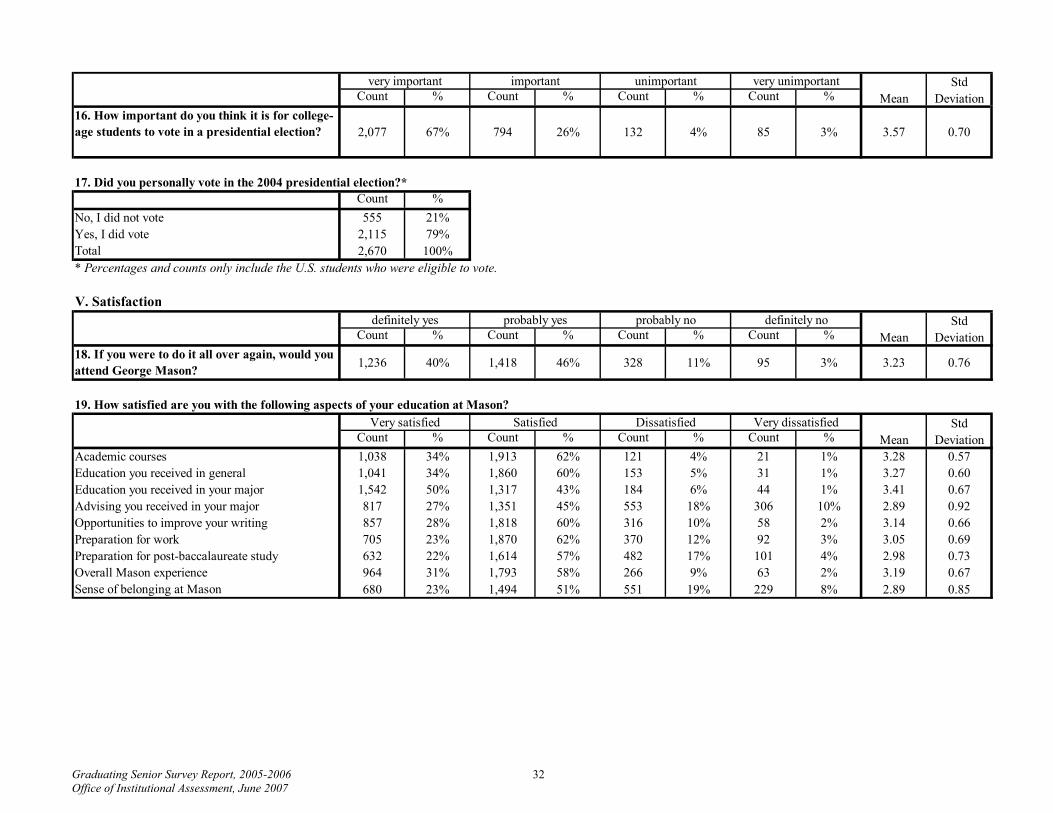
Graduating Senior Survey Report, 2005-2006 Office of Institutional Assessment, June 2007
32
Count % Count % Count % Count %16. How important do you think it is for college-age students to vote in a presidential election? 2,077 67% 794 26% 132 4% 85 3% 3.57 0.70
17. Did you personally vote in the 2004 presidential election?*Count %
No, I did not vote 555 21%Yes, I did vote 2,115 79%Total 2,670 100%* Percentages and counts only include the U.S. students who were eligible to vote.
V. Satisfaction
Count % Count % Count % Count %18. If you were to do it all over again, would you attend George Mason? 1,236 40% 1,418 46% 328 11% 95 3% 3.23 0.76
19. How satisfied are you with the following aspects of your education at Mason?
Count % Count % Count % Count %Academic courses 1,038 34% 1,913 62% 121 4% 21 1% 3.28 0.57Education you received in general 1,041 34% 1,860 60% 153 5% 31 1% 3.27 0.60Education you received in your major 1,542 50% 1,317 43% 184 6% 44 1% 3.41 0.67Advising you received in your major 817 27% 1,351 45% 553 18% 306 10% 2.89 0.92Opportunities to improve your writing 857 28% 1,818 60% 316 10% 58 2% 3.14 0.66Preparation for work 705 23% 1,870 62% 370 12% 92 3% 3.05 0.69Preparation for post-baccalaureate study 632 22% 1,614 57% 482 17% 101 4% 2.98 0.73Overall Mason experience 964 31% 1,793 58% 266 9% 63 2% 3.19 0.67Sense of belonging at Mason 680 23% 1,494 51% 551 19% 229 8% 2.89 0.85
MeanStd
Deviation
MeanStd
Deviation
MeanStd
Deviation
definitely no
Very dissatisfied
very unimportant
Very satisfied Satisfied Dissatisfied
definitely yes probably yes probably no
very important important unimportant

Graduating Senior Survey Report, 2005-2006 Office of Institutional Assessment, June 2007
33
20. How satisfied are you with the following aspects of campus life and services?
Count % Count % Count % Count %Campus life 301 13% 1,309 58% 478 21% 157 7% 2.78 0.76Campus climate for the broad diversity of students at Mason 882 32% 1,620 59% 176 6% 58 2% 3.22 0.65
Life in residence halls 186 16% 641 54% 263 22% 103 9% 2.76 0.82Opportunities to interact with students from diverse backgrounds 1,110 38% 1,641 56% 128 4% 38 1% 3.31 0.62
Out-of-class access to Mason faculty 676 24% 1,795 63% 312 11% 67 2% 3.08 0.66Career counseling 468 20% 1,400 60% 361 15% 121 5% 2.94 0.75Counseling for personal concerns 295 21% 807 58% 196 14% 93 7% 2.94 0.79Financial aid services 414 21% 1,111 56% 308 16% 144 7% 2.91 0.81Food services 257 10% 1,512 56% 619 23% 298 11% 2.64 0.80Parking 106 4% 647 22% 836 28% 1,380 46% 1.82 0.89
VI. Future Plans21. Do you plan to pursue additional education within the next year?
Count %724 23%631 20%204 7%181 6%
1,364 44%3,104 100%
22. As a Mason alumni, which of following would bring you back to campus? (Select ALL that apply.)Count %
Career networking 1,605 51%Professional development seminar 1,031 33%Interaction with classmates 433 14%Faculty presentation 806 26%Interaction with current students 800 26%Alumni homecoming 823 26%Sports events 714 23%Recreational events 661 21%Short courses 903 29%Interaction with faculty 747 24%Other 231 7%
Yes, I plan to take courses, but not as part of a degree or certificate program.No, I don't plan to be enrolled in course work.Total
very dissatisfiedsatisfied dissatisfiedMean
Std Deviation
Yes, I will enroll in courses leading to a certificate/professional license.
Yes, I will enroll full-time in graduate/professional school.Yes, I will enroll part-time in graduate/professional school.
very satisfied

Graduating Senior Survey Report, 2005-2006 Office of Institutional Assessment, June 2007
34
Demographics of All Graduates and Respondents
In the 2005-2006 academic year (Summer and Fall 2005, and Spring 2006), 3639 students graduated with 3639 degrees. Out Of these 3639 individuals, 3123 responded to the survey. This resulted in a 85.8% overall response rate.
Sex
Survey Respondents All Graduates Category Count Percent Count Percent
Response Rate
Female 1852 59.3% 2108 57.9% 88.0% Male 1246 39.9% 1503 41.3% 83.0% Unknown 25 0.8% 28 0.8% 89.0%
Age at Graduation
Survey Respondents All Graduates Category Count Percent Count Percent
Response Rate
22 or younger 794 25.4% 910 25.0% 87.3% 23-24 1076 34.5% 1253 34.4% 85.9% 25-37 542 17.4% 662 18.2% 81.9% 28-30 217 6.9% 248 6.8% 87.5% 31-34 155 5.0% 179 4.9% 86.6% 35 or older 334 10.7% 382 10.5% 87.4% Unknown 5 0.2% 5 0.1% 100.0%
Ethnicity
Survey Respondents All Graduates Category Count Percent Count Percent
Response Rate
African American 239 7.7% 287 7.9% 83.0% Asian American 501 16.0% 600 16.5% 84.0% Hispanic American 235 7.5% 275 7.6% 85.0% Native American 11 0.4% 12 0.3% 92.0% Non-resident Alien 150 4.8% 172 4.7% 87.0% Other/Unknown American 296 9.5% 365 10.0% 81.0% White American 1691 54.1% 1928 53.0% 88.0%
Final Grade Point Average
Survey Respondents All Graduates Category Count Percent Count Percent
Response Rate
3.501-4.000 764 24.5% 846 23.2% 90.3% 3.001-3.500 1144 36.6% 1311 36.0% 87.3% 2.501-3.000 988 31.6% 1186 32.6% 83.3% 2.000-2.500 223 7.1% 289 7.9% 77.2% 2.000 and below 4 0.1% 6 0.2% 66.7% Unknown 0 0.0% 1 0.0% 0.0%
Domicile (Virginia Residency)
Survey Respondents All Graduates Category Count Percent Count Percent
Response Rate
In-State 2844 91.1% 3305 90.8% 86.1% Out-of-State 279 8.9% 334 9.2% 83.5%

Graduating Senior Survey Report, 2005-2006 Office of Institutional Assessment, June 2007
35
Academic Unit/College* Survey Respondents All Graduates Category Count Percent Count Percent
Response Rate
College of Visual and Performing Arts 164 5.2% 197 5.4% 83.2% College of Arts and Sciences 1625 51.8% 1893 51.8% 85.8% School of Management 626 20.0% 749 20.5% 83.6% College of Education and Human Development 75 2.4% 86 2.4% 87.2% School of Information Technology and Engineering 392 12.5% 438 12.0% 89.5% College of Nursing and Health Science 231 7.4% 269 7.4% 85.9% Provost Office (Global Affairs) 23 0.7% 23 0.6% 100.0%
*Students/Respondents graduated with double degrees from different academic programs were counted twice in this table.
Major* Survey Respondents All Graduates Category Count Percent Count Percent
Response Rate
Accounting (ACCT) (BS) 177 5.6% 208 5.7% 85.1% Administration of Justice (ADJ) (BS) 116 3.7% 133 3.6% 87.2% Anthropology (ANTH) (BA) 20 0.6% 24 0.7% 83.3% Art (History) (ARTH) (BA) 10 0.3% 11 0.3% 90.9% Art (Studio) (ARTS) (BA) 5 0.2% 7 0.2% 71.4% Art (Studio) (ARTS) (BFA) 2 0.1% 3 0.1% 66.7% Athletic Training (ATT) (BS) 5 0.2% 7 0.2% 71.4% Art & Visual Technology (AVT) (BA) 76 2.4% 92 2.5% 82.6% Art & Visual Technology (AVT) (BFA) 23 0.7% 30 0.8% 76.7% Biology (BIOL) (BA) 28 0.9% 31 0.8% 90.3% Biology (BIOL) (BS) 109 3.5% 120 3.3% 90.8% Civil & Infrastructure Engineering (CEIE) (BS) 23 0.7% 27 0.7% 85.2% Chemistry (CHEM) (BA) 1 0.0% 1 0.0% 100.0% Chemistry (CHEM) (BS) 16 0.5% 18 0.5% 88.9% Communication (COM) (BA) 233 7.4% 269 7.4% 86.6% Speech Communication (COMM) (BA) 0 0.0% 1 0.0% 0.0% Computer Engineering (CPE) (BS) 28 0.9% 28 0.8% 100.0% Computer Science (CS) (BS) 87 2.8% 102 2.8% 85.3% Dance (DANC) (BA) 3 0.1% 3 0.1% 100.0% Dance (DANC) (BFA) 5 0.2% 6 0.2% 83.3% Decision Sci & Mgmt Info System (DMIS) (BS) 98 3.1% 115 3.1% 85.2% Economics (ECON) (BA) 42 1.3% 51 1.4% 82.4% Economics (ECON) (BS) 50 1.6% 61 1.7% 82.0% Electrical Engineering (ELEN) (BS) 56 1.8% 57 1.6% 98.2% English (ENGL) (BA) 129 4.1% 146 4.0% 88.4% Earth Science (ESCI) (BS) 3 0.1% 4 0.1% 75.0% Finance (FNAN) (BS) 114 3.6% 148 4.0% 77.0% Foreign Languages (FRLN) (BA) 16 0.5% 25 0.7% 64.0% Geography (GEOG) (BA) 8 0.3% 8 0.2% 100.0% Geography (GEOG) (BS) 3 0.1% 3 0.1% 100.0% Geology (GEOL) (BA) 2 0.1% 2 0.1% 100.0% Geology (GEOL) (BS) 2 0.1% 2 0.1% 100.0% Global Affairs (GLOA) (BA) 23 0.7% 23 0.6% 100.0% Government & Politics (GOVT) (BA) 1 0.0% 1 0.0% 100.0%

Graduating Senior Survey Report, 2005-2006 Office of Institutional Assessment, June 2007
36
Survey Respondents All Graduates Category Count Percent Count Percent
Response Rate
Government & International Politics (GVIP) (BA) 201 6.4% 246 6.7% 81.7%
Health, Fitness & Recreation (HFRR) (BS) 50 1.6% 58 1.6% 86.2% History (HIST) (BA) 71 2.3% 84 2.3% 84.5% Health Science (HSCI) (BS) 32 1.0% 37 1.0% 86.5% Interdisciplinary Studies (INDS) (BA) 1 0.0% 1 0.0% 100.0% Individualized Studies (INDV) (BIS) 94 3.0% 106 2.9% 88.7% Information Technology (INFT) (BS) 171 5.5% 194 5.3% 88.1% Integrative Studies (INTS) (BA) 97 3.1% 119 3.3% 81.5% Integrative Studies (INTS) (BS) 6 0.2% 6 0.2% 100.0% Mathematics (MATH) (BA) 5 0.2% 7 0.2% 71.4% Mathematics (MATH) (BS) 19 0.6% 20 0.5% 95.0% Management (MGMT) (BS) 153 4.9% 175 4.8% 87.4% Marketing (MKTG) (BS) 84 2.7% 103 2.8% 81.6% Medical Technology (MTCH) (BS) 1 0.0% 2 0.1% 50.0% Music (MUSI) (BA) 9 0.3% 10 0.3% 90.0% Music (MUSI) (BM) 23 0.7% 26 0.7% 88.5% Nursing (NURS) (BSN) 199 6.3% 232 6.3% 85.8% Physical Education (PHED) (BSED) 20 0.6% 21 0.6% 95.2% Philosophy (PHIL) (BA) 5 0.2% 6 0.2% 83.3% Physics (PHYS) (BS) 4 0.1% 5 0.1% 80.0% Psychology (PSYC) (BA) 141 4.5% 160 4.4% 88.1% Psychology (PSYC) (BS) 97 3.1% 112 3.1% 86.6% Public Administration (PUAD) (BS) 17 0.5% 23 0.6% 73.9% Religious Studies (RELI) (BA) 6 0.2% 8 0.2% 75.0% Russian Studies (RUST) (BA) 3 0.1% 5 0.1% 60.0% Sociology (SOCI) (BA) 44 1.4% 47 1.3% 93.6% Social Work (SOCW) (BS) 24 0.8% 25 0.7% 96.0% Systems Engineering. (SYST) (BS) 27 0.9% 30 0.8% 90.0% Theatre (THR) (BA) 18 0.6% 20 0.5% 90.0%
* Students/Respondents graduated with double degrees from different academic programs were counted twice in this table.
Semester of Graduation* Survey Respondents All Graduates Category Count Percent Count Percent
Response Rate
SUMMER 2005 535 17.1% 808 22.1% 66.2% FALL 2005 850 27.1% 929 25.4% 91.5% SPRING 2006 1751 55.8% 1918 52.5% 91.3%
* Students/Respondents graduated with double degrees from different academic programs were counted twice in this table.

Graduating Senior Survey Report, 2005-2006 Office of Institutional Assessment, June 2007
37
Congratulations on your impending graduation from George Mason University. Your satisfaction and evaluation of your educational and student life experiences at Mason are important to us and will be used in educational planning. To contact the Office of Institutional Assessment: Mason Hall, D111, Phone: 703-993-8834 or E-mail: [email protected]. We can be reached by mail at the address below. Directions: Circle, mark, or write in the most appropriate response and return the completed survey to the Office of Institutional Assessment, George Mason University - MS 3D2, 4400 University Drive, Fairfax, VA 22030. If you prefer to complete this survey on line go directly to the survey at: http://assessment.gmu.edu/surveys/2005-2006/letter-senior.cfm.
I. Educational Experience
1. Which of the following statements best described your enrollment status at Mason? a. ___ I started college at Mason as a freshman. b. ___ I started college at another institution and transferred to Mason.
2. What year did you first enroll in George Mason University?___ 2004 ___ 2000
___ 2003 ___ 1999
___ 2002 ___ 1998
___ 2001 ___ 1997 or earlier
3. If it took you more than FOUR years to complete your baccalaureate degree, please indicate why by selecting ALL of the applicable reasons listed below.
a. ___ It took me a long time to choose a major. b. ___ I have changed my major or I have selected a second major. c. ___ Besides my major, I also enrolled in a certificate program or a minor. d. ___ I wanted to enroll in additional courses in which I have some interest. e. ___ I had some academic difficulty.
Academic Reasons
f. ___ I was on academic suspension. g. ___ I have to work full-time/part-time. h. ___ My job(s) was/were off-campus. Financial Reasons i. ___ I didn’t have enough financial resources. j. ___ I have to take care of my family.
Personal Reasons k. ___ I lacked the motivation to complete the degree in four years. l. ___ My academic advisor didn’t give me good information. m. ___ Some courses were not offered at convenient times for me. n. ___ I transferred from another institution. Other Reasons
o. ___ Other, please specify __________________________________________ _________________________________________________________________
4. Among ALL of the factors above, what was the MOST important one in extending your time to complete a baccalaureate degree? Please
write down the letter (A to O) from the above list. ________________
5. Have you ever officially changed your major while you were a Mason student? a. ___ No
b. ___ Yes, once c. ___ Yes, twice
d. ___ Yes, 3 times e. ___ Yes, 4 times or more
6. If you answered YES, please indicate why you changed your major. (Select ALL that apply.) a. ___ Academic difficulties in the previous major. b. ___ Lack of interest in the previous major. c. ___ Dissatisfaction with the previous program. d. ___ More interest in the subject matter of the new major. e. ___ The new major was easier for me.
f. ___ The new major better fits my career goals. g. ___ I could earn more money with the new major. h. ___ Reputation of the new program or the faculty in the new
program. i. ___ Other, please specify ____________________________
Graduating Senior Survey Summer and Fall 2005, Spring 2006
George Mason University

Graduating Senior Survey Report, 2005-2006 Office of Institutional Assessment, June 2007
38
7. At graduation, how much money will you owe for tuition, books, and other educational expenses? ___ None ___ $5,000 or less
___ $5,001-10,000 ___ $10,001-15,000
___ $15,001-20,000 ___ $20,001 or more
8. Indicate the extent to which George Mason University contributed to your
growth in each of the following: Very much Somewhat A little Not at
all Arts (understand the aesthetic and intellectual components of the arts or creative works through critical analysis) 4 3 2 1
Critical Thinking and Analysis (judge the consistency, adequacy, and relevance of ideas, data, and arguments) 4 3 2 1
Global Understanding (understand global society and compare cultural traditions) 4 3 2 1 Information Technology (IT) (use IT to communicate and to conduct research) 4 3 2 1 Literature (use critical analysis to understand the aesthetic and intellectual components of major works) 4 3 2 1
Natural Sciences (understand and apply natural science knowledge and methods; e.g., Biology, Chemistry, Physics) 4 3 2 1
Oral Communication (use speaking to think, learn, and share ideas) 4 3 2 1 Quantitative Reasoning (use and evaluate numerical information and evaluate logical arguments) 4 3 2 1
Scientific Reasoning (use and understand the scientific process and evaluate scientific information) 4 3 2 1
Social and Behavioral Sciences (understand and apply social science knowledge & methods to the study of human behavior; e.g., Psychology, Government, Sociology) 4 3 2 1
Synthesis (understand the connections among different disciplines) 4 3 2 1 Understand and Apply Ethics in Information Technology 4 3 2 1 US History (understand US institutions, traditions, values, and history) 4 3 2 1 Western Civilization (understand western civilization and its global impact) 4 3 2 1 Written Communication (use writing to discover and express ideas) 4 3 2 1
9-1. Have you ever checked your MID-TERM grades on-line for any 100 or 200 level courses you took? ___ Yes ___ No ___ I did not take any 100-200 level courses at Mason.
9-2. If YES, please read the following statements and check ALL that apply. a. ___ The mid-term grades helped me to assess my academic performance. b. ___ The mid-term grades were available to me early enough to improve my academic performance. c. ___ I have discussed my mid-term grade(s) with my instructor(s). d. ___ I withdrew from a course because of the mid-term grade I received. e. ___ The mid-term grade(s) motivated me to work harder or continue my efforts. f. ___ The mid-term grade(s) had no impact on my academic performance. g. ___ Other, please specify ____________________________________________
II. Synthesis Courses
10. How often did the following statements apply to your SYNTHESIS COURSE? (Synthesis courses include: ADJ 303, ANTH 400, ARTH 394, AVT 497, AVT 498, BINF 354, BIOL 301, CEIE 490, COMM 326, COMM 362, COMM 454, CS 306, CS 491, DANC 490, ECE 447, ECE 492, ECE 493, ECON 309, ENGL 325, EOS 304, GEOG 304, GOVT 490, GOVT 491, HIST 300, HIST 499, IT 492, MUSI 490, NURS/HSCI 465, PHIL 309, PHIL 377, PHIL 378, RELI 490, RUSS 353, SOCI 377, SOCW 323, SOM 498, SYST 495, THR 440, THR 496, UNIV 342, UNIV 442, etc.)
Please indicate your level of agreement with the following statements about the synthesis course you have taken.
Strongly agree Agree Disagree Strongly
disagree
The course held my interest. 4 3 2 1 The course improved my oral presentation skills. 4 3 2 1 The course improved my writing skills. 4 3 2 1 The course linked issues in my major to wider intellectual and community concerns. 4 3 2 1 The course required me to organize ideas, information, or experiences into new, more complex interpretations and relationships. 4 3 2 1
The course required me to think critically. 4 3 2 1 The course was intellectually challenging. 4 3 2 1 The course was well organized. 4 3 2 1

Graduating Senior Survey Report, 2005-2006 Office of Institutional Assessment, June 2007
39
III. Writing Experience in Courses of 300-level or above (excluding English 302) (For Questions 11-13, please think of your experiences in courses of 300-level or above, excluding English 302.)
11. In how many courses at Mason, 300-level or above, did you have the opportunity to revise your writing after receiving feedback from your instructor on an earlier draft? (This might include essays, projects, lab reports, case studies, reviews, and reports, for example.) a. ___ none b. ___ one c. ___ two d. ___ three e. ___ four f. ___ five or more
12. Did you have sufficient opportunities in those courses to revise your writing after receiving feedback from an instructor? a. ___ always b. ___ sometimes c. ___ rarely d. ___ not at all
13. To what extent did the 300-level or above courses help you in the following areas? A great deal Somewhat Very
little Not at
all The feedback and revision process in these courses has helped me to improve my writing. 4 3 2 1 These courses have improved my confidence as a writer. 4 3 2 1 The writing assignments from these courses have increased my understanding of my field. 4 3 2 1
IV. Civic Engagement
14. Please indicate how closely you follow various types of news. Very closely
Somewhat closely
Not very closely Not at all
Local and state news 4 3 2 1
National news 4 3 2 1
International news 4 3 2 1
15. Please indicate how frequently you did the following activities during the past year. Frequently Occasionally Not at all
Discussed politics 3 2 1 Participated in organized demonstrations 3 2 1 Performed community service as part of a class 3 2 1 Performed volunteer work 3 2 1 Voted in a student election 3 2 1 Worked on a local, state, or national political campaign 3 2 1
16. How important do you think it is for college-age students to vote in a presidential election?
a. ___ very important b. ___ important c. ___ unimportant d. ___ very unimportant
17. Did you personally vote in the 2004 presidential election? a. ___ I was not eligible to vote because I was not a U.S. citizen. b. ___ Yes, I did vote c. ___ No, I did not vote
V. Satisfaction
18. If you were to do it all over again, would you attend George Mason? ____ definitely yes ____ probably yes ____ probably no ____ definitely no
19. How satisfied are you with the following aspects of your education at Mason?
Very satisfied Satisfied Dissatisfied Very
dissatisfied Not
applicable
Academic courses 4 3 2 1 NA Education you received in general 4 3 2 1 NA Education you received in your major 4 3 2 1 NA Advising you received in your major 4 3 2 1 NA Opportunities to improve your writing 4 3 2 1 NA Preparation for work 4 3 2 1 NA Preparation for post-baccalaureate study 4 3 2 1 NA Overall Mason experience 4 3 2 1 NA Sense of belonging at Mason 4 3 2 1 NA

Graduating Senior Survey Report, 2005-2006 Office of Institutional Assessment, June 2007
40
20. How satisfied are you with the following aspects of campus life and services?
Very satisfied Satisfied Dissatisfied Very
dissatisfied Not
applicable
Campus life 4 3 2 1 NA Campus climate for the broad diversity of students at Mason 4 3 2 1 NA Life in residence halls 4 3 2 1 NA Opportunities to interact with students from diverse backgrounds 4 3 2 1 NA Out-of-class access to Mason faculty 4 3 2 1 NA Career counseling 4 3 2 1 NA Counseling for personal concerns 4 3 2 1 NA Financial aid services 4 3 2 1 NA Food services 4 3 2 1 NA Parking 4 3 2 1 NA
VI. Future Plans
21. Do you plan to pursue additional education within the next year? a. ___ Yes, I will enroll full-time in graduate/professional school. b. ___ Yes, I will enroll part-time in graduate/professional school. c. ___ Yes, I will enroll in courses leading to a certificate/professional license. d. ___ Yes, I plan to take courses, but not as part of a degree or certificate program. e. ___ No, I don’t plan to be enrolled in course work.
22. As a Mason alumnus, which of the following would bring you back to campus? (Select ALL that apply.)
a. ___ Career networking b. ___ Professional development seminar c. ___ Interaction with classmates d. ___ Faculty presentation e. ___ Interaction with current students f. ___ Alumni homecoming
g. ___ Sports events h. ___ Recreational events i. ___ Short courses j. ___ Interaction with faculty k. ___ Other, please specify ___________________________
VII. Comments/recommendations/observations on your experiences at Mason
23. Please select those areas on which you wish to comment and use the space below to make comments/recommendations/observations about Mason: (Add additional pages if necessary and attach and return with survey.)
a. ___ Academic advising b. ___ Admissions and tuition c. ___ Career services and counseling d. ___ Education in Major e. ___ Faculty, general f. ___ Financial aid
g. ___ General Education h. ___ Resources (lab, Internet, library, book store, etc.) i. ___ Staff, general j. ___ Student life and residence halls k. ___ University Management (food, gym, parking, etc.) l. ___ Other
_______________________________________________________________________________________________________________________________________________________________________________________________________________________________________________________________________________________________________________________________________________________________________________________________________________________________
Please enter your GMU student identification number which begins with the letter “G.” Student identification number: G _ _ _ _ _ _ _ _
Your G- number is necessary for us to verify that only graduating seniors have completed the survey. All individual responses are confidential and no report will identify you as an individual. Thank you for your participation.
This survey was prepared and distributed by the Office of Institutional Assessment
http://assessment.gmu.edu

Office of Institutional Assessment D111 Mason Hall, MS 3D2
703-993-8834 [email protected]
http://assessment.gmu.edu
Associate Provost Karen M. Gentemann, Ph.D.
Associate Director Ying Zhou, Ph.D. [email protected]
Assistant Director
Mary Zamon, M.A.T. [email protected]
Programmer/Analyst
Rawa Abdalla, M.S. [email protected]
Program Support
Erin McSherry, B.A. [email protected]
Cover photograph provided by Evan Cantwell, Creative Services