Embed Size (px)
Citation preview

REPORT DOCUMENTATION PAGE ' (hie rntlii ■ tr n r !■ ' ''''
Form Approved 0MB No. 0704-0188 Public reporting bumen for this collection of information Is estimated'lo averaae 1 hour DPT ,»..nr,n.. mn H- .- .■ . 1 0MB No. 0704-0188
1. REPORT DATE (DD-MM-YY) May 1999 4. TfTLE AND SUBTITLE
2. REPORT TYPE Final Report
An Analysis of the University of Virginia Medical Center Service Center Approach
6. AUTHOR{S)
Captain Neal E. Jennings, USAF, MSC
3. DATES COVERED (From - To) July 1998 to July 1999
5a. CONTRACT NUMBER
5b. GRANT NUMBER
5c. PROGRAM ELEMENT NUMBER
5d. PROJECT NUMBER
5e. TASK NUMBER
5f. WORK UNIT NUMBER
7. PEKI-OKIVIING ORGANIZATION NAME(S) AND ADDRESS(ES)
University of Virginia Medical Center Charlottesville, Virginia
8. PERFOKMING ORGANIZATION REPORT NUMBER
9. SPONSORING / MONITORING AGENCY NAME(S) AND ADDRESS(ES) US Army Medical Department Center and School
?i^^^ 2841 MCCS-HRA (Army-Baylor Program in Healthcare Administration) j 151 Scott Road, Suite 1411 Fort Sam Houston, TX 78234-6135 20040226 164
34-99 12. DISTRIBUTION / AVAILABILITY STATEMENT " —
DISTRIBUTION A - Approved for public release; distribution is unlimited
13. SUPPLEMENTARY NOTES
14. ABSTRACT " '■ '
15. SUBJECT TERMS Health care delivery
16. SECURITY CLASSIFICATION OF:
a. REPORT U
b. ABSTRACT U
C. THIS PAGE U
17. LIMITATION OF ABSTRACT
UU
18. NUMBER OF PAGES
66
19a. NAME OF RESPONSIBLE PERSON Education Technician 19b. TELEPHONH NUMBER (include area code) (210) 221-6443
Standard Form 298 (Rev. 8-98) (Prescribed by ANSI Std. 239.18

Graduate Management Project
An Analysis of the University of Virginia Medical Center
Service Cienter Approach
University of Virginia Medical Center
Charlottesville, Virginia
Capt Neal E. Jennings, USAF, MSC
May 1999
DiSTRieUTIOM STATEMENT A Approved for Public Release
Distribution Unlimited

Service Center Approach
Running head: THE SERVICE CENTER APPROACH
An Analysis of the University of Virginia Medical Center
Service Center Approach
Capt Neal E. Jennings, USAF, MSC
University of Virginia Medical Center
Charlottesville, Virginia
Graduate Management Project
May 1999
Baylor University
Masters in Health Administration

Service Center Approach
Acknowledgments
I would like to thank Jim McGowan (Administrator, Patient
Care Services at University of Virginia Medical Center) for his
guidance and support throughout the development of this project.
His input was invaluable for keeping me on track and ensuring
that the studies conducted were appropriate and valid.
I would like to extend my appreciation to Elizabeth
O'Halloran (Director, Resource Analysis at University of
Virginia Medical Center) and Major Barry Evans (Professor, Army-
Baylor Masters in Health Administration Program) for their
review and editorial suggestions. Their input helped immensely
in the flow and organization of the paper.

Service Center Approach 3
Abstract
The ever-spiraling costs of health care is a prevalent
issue in the health care arena. Finding ways to curb these costs
is an inundating task, especially as expenses and pharmaceutical
costs are beginning to climb out of control again. This paper
analyzes one institutions response to addressing the current
turmoil in health care.
In 1993;. the University of Virginia Medical Center took an
innovated approach to health care with the implementation of a
sei:vice center organizational structure. This idea was taken
from other industries where it has seen success. The philosophy
is focusing on the customer, placing needed resources as close
to the point of health care delivery as possible.
This paper addresses several issues that resulted from
implementing the service center model. First, more detailed
cost accounting can be achieved by having all resources needed
to provide a service under one umbrella. Second, a benchmarking
study showed an ancillary service (Respiratory Care) should use
a "virtual centralized" approach to benefit from economies-of-
scale while still realizing benefits from a decentralized
structure. Lastly, patient satisfaction trends were studied
from 1993 to 1998. The result shows that, from a patient's
perspective, the health care team's communication and
coordination have increased, however staff time spent with the
patient has decreased. The latter finding can be attributed to
the current "do more with less" health care environment than the
service center model approach.

Service Center Approach 4
Table of Contents
ACKNOWLEDGMENTS 2
ABSTRACT 3
TABLE OF CONTENTS 4
LIST OF TABLES 5
LIST OF FIGURES 6
INTRODUCTION 7
BACKGROUND 7
CONDITIONS WHICH PROMPTED THE STUDY 12
STATEMENT OF THE ISSUES 13
LITERATURE REVIEW 14
The New Paradigm , 14 Patient Satisfaction and Quality Indicators 21 Operational Efficiencies 24
PURPOSE 29
METHOD AND PROCEDURES 30
RESEARCH METHODOLOGY 30
DATA COLLECTION 31
DISCUSSION 32
FINANCIAL ACCOUNTING 32
DECENTRALIZATION AND CENTRALIZATION ANALYSIS 3 6
Decentralization 36 RC FTE Projection Model 40 Centralization 43 Findings 47 The UVaMC Re-design 49 Implementation 50
PATIENT SATISFACTION ANALYSIS , 51
CONCLUSION 56
REFERENCES , 58
FOOTNOTES 63

Service Center Approach 5
List of Tables
Table 1: Changing Corporate Culture (Jackson Memorial Medical
Center) •• 1^
Table 2: Planning Session: Prioritization of Heart Services'
Goals 1^
Table 3: Patient Satisfaction Survey (Jackson Memorial) 23
Table 4: Surgical Operating Room Services Cost Allocations 34
Table 5: Data from the UHC E-mail Survey 39
Table 6: MECON Data 39
Table 7: Benchmark Data from Five University Hospitals 42
Table 8: Patient Satisfaction Trends 53

Service Center Approach 6
List of Figures
Figure 1: Continuiom of Managed Care 9
Figure 2: Heart Service Line Structure (Intermountain Health
Care) .20
Figure 3: Patient Experiences Flowchart 24
Figure 4: Projected Respiratory Care FTEs 43
Figure 5: Patient Transportation Workload Graph 46

Service Center Approach 1
An Analysis of the University of Virginia Medical Center
Service Center Approach
Introduction
Background
The ever-upward spiraling cost of health care has been a
major issue over the last several decades. Currently, health
care in the United States amounts to approximately 14 percent of
the Gross National Product. From 1932 to 1994, health care
costs increased more than 300 fold; greatly higher than what can
be explained by inflation over that time frame (Kovner, 1995).
The increase is troublesome because it affects all elements of
society - industry, government and individuals who have to bear
these costs'^.
Williams and Torrens (1993) attribute this phenomenal rise
to four major factors:
• The Hill-Burton program;
• The increase in the number of physicians;
• The growth in medical science and technology; and
• The proliferation of health care insurance.
The first factor was brought about in 1947 when Congress
established the Hill-Burton Act, a federal program to generate
growth in the number of hospitals throughout the United States.
Here, government subsidies provided incentives for the building
and expansion of hospitals. This initiative led to substantial
hospital growth and in turn increased the number of beds. The
increase of beds then led to a greater number of admissions

Service Center Approach 8
(i.e., if beds are available physicians will fill them).
The second factor was an initiative to increase the number
of physicians throughout the? United States. The purpose was to
increase access to health care, especially in rural areas. This
was accomplished by increasing the number of, or expanding
existing medical schools. This approach worked well, generating
more physicians per capita. With more physicians per capita,
they were able to provide more services, which, ironically drove
up health care costs. This is counterintuitive to the
traditional laws of economics, where more supply typically means
lower costs.
The third factor is the dramatic advancements in medical
science and technology. The exponential growth here was
stimulated through the use of donations and grants provided by
public, government and private entities. The main thrust was to
improve the quality of health care. For example, finding
alternative ways to treat patients that are less invasive,
thereby reducing the risk to the patient (i.e., heart disease
medicines, magnetic resonance imaging, etc.). However, the
increase in quality also came with an increase in cost.
The fourth factor is the effect that insurance, whether
private or public, has had on increased demand for health care^.
With insurance paying the majority of health care costs,
consumers did not have incentive to curb their demand, question
costs, or seek less expensive options. In 1965, the government
added substantially to this demand with the introduction of
Medicare and Medicaid. However, over the last several years, the
Service Center Approach 9
government and insurers (to include self-insured employers) have
taken several steps to reduce the rise in health care
expenditures.
Although the rise in health care costs are in some way
understandable, the increased emphasis on reducing this rising
cost has generated a push to manage the delivery of health care.
After approximately 10 years of ad hoc initiatives and limited
legislative activity^ "Managed Care" burst onto the scene as the
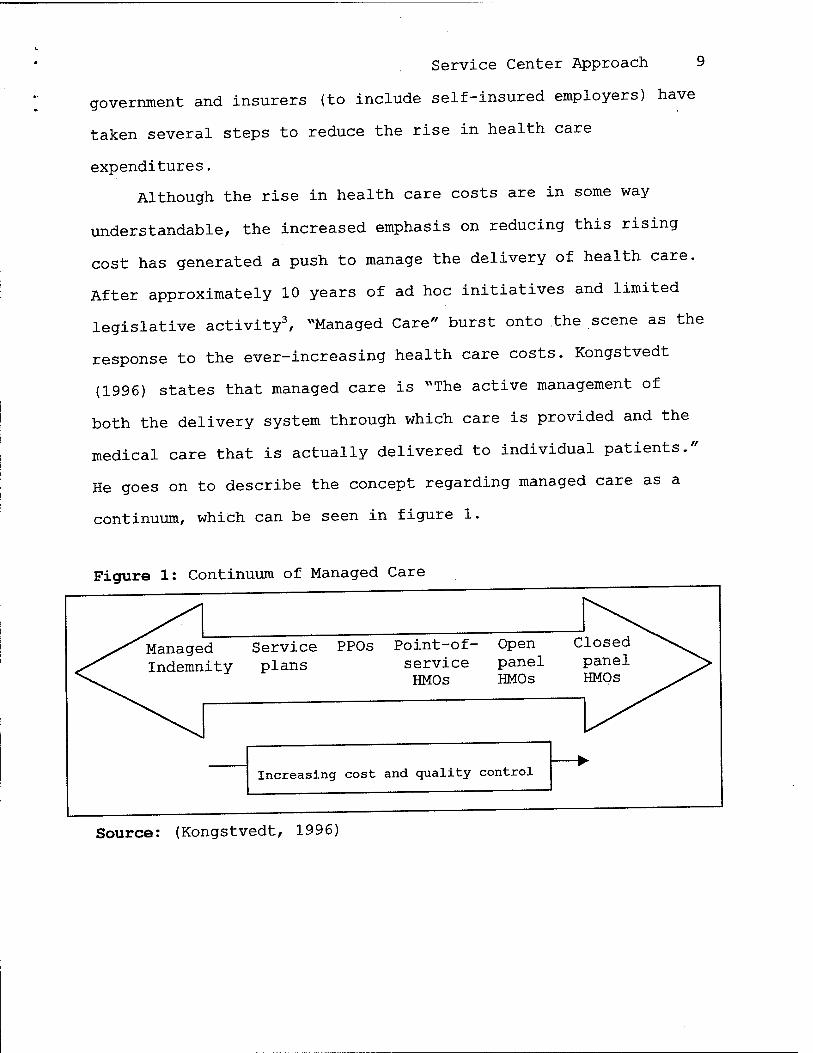
response to the ever-increasing health care costs. Kongstvedt
(1996) states that managed care is "^The active management of
both the delivery system through which care is provided and the
medical care that is actually delivered to individual patients."
He goes on to describe the concept regarding managed care as a
continuum, which can be seen in figure 1.
Figure 1: Continuum of Managed Care
^^ ^^^
^.y^ Manage ^^^ Indemn
d ity
Service PPOs Point-of- plans service
HMOs
Open panel HMOs
C losed ^^\^^ panel j> HMOs ^^
^^^ .^
Increasing cost and quality control fe ►
Source: (Kongstvedt, 1996)

Service Center Approach 10
However, results are now indicating that managed care has
only temporarily curbed the escalating costs. In fact, the
improvement is thought to be a transitory affect resulting from
people enrolling in managed care plans. Once the transition
stabilizes, some predict that health care will continue at its
previous, rapid pace. A new report from the Department of
Health and Human Services states that managed care measures have
peaked and that health care spending may double from $1 trillion
to $2.1 trillion by the year 2007 (Stern, 1999). It is apparent
that additional measures must be taken if the United States is
to gain control of health care expenditures.
Barlett (1997) recommends that health care organizations
look to other industries for best practices, and adapt
strategies that can improve the delivery of health care. She
also states that organizations should think benefits, not
features, as well as integrate morbidity and mortality with
product management. The issue here is that the customer is
concerned with the end result, not the method of achieving it.
"...Companies developing best practices always seek ways to make
improvements in their products and services as well as enhance
their relationships with suppliers and customers." (Hiebeler,
Kelly, Ketteman, 1998) With properly implemented controls,
health care organizations can ensure they are providing health
care that meets customers expectations while minimizing costs.
Pence (1997) states that for hospitals to compete in
today's market place, with reduction in reimbursement rates and
the growing emphasis on quality and patient satisfaction, they

Service Center Approach 11
must find new and innovative ways to deliver health care.
Similarly, Patronis-Jones, Doughtery, and Martin (1997) state
^^To compete, and possibly survive, hospitals and caregivers are
attempting to restructure work environments to provide high-
quality patient care combined with the right blend of customer
service while still keeping costs low."
Additionally, as the media and the health care industry
continue to disseminate information regarding health care,
consumers of this market will become more educated and demand
higher quality services at a reasonable cost. "As health care
executives and their boards begin to rethink traditionally held
assumptions about hospitals, we will see totally revised systems
that are re-designed to truly respond to a much more
sophisticated, scrutinizing, and cost conscious customer."
(Mueller, Marinari, Kunkel, 1995). Barlett, (1997) states
^\..health care historically has been practitioner active and
patient passive..." and "As the baby boomer generation begins to
worry about osteoporosis and chest pain, it will become
sophisticated, demanding, and well informed."
Currently, one.measure gaining popularity in meeting these
challenges is the service center model, Similar concepts are
"product-line"' and "focused factories"^ These practices have
been successful in other industries by enhancing customer
satisfaction, quality and reducing costs. The methodology
enables a company to better control its processes, and thus,
optimize its products or services. The main thrust is delivering
services that focus on the customer. The strategy places the

Service Center Approach 12
needed resources as close to the point of service as possible.
The concept is thought to enhance operational efficiencies and
thereby reduce costs while raising customer satisfaction; a win-
win in the market place. This ultimately will heighten an
organization's competitiveness, thereby strengthening their
chance of survivability.
Several health care organizations who have implemented this
model are Jackson Memorial Medical Center (Miami, Florida),
Intermountain Health Care (Salt Lake City, Utah), and the
University of Virginia Medical Center. They believe this method
will address the issues health care organizations are currently
undergoing and will face in the future. Their philosophy is
that areas responsible for providing the service should also be
empowered to improve the process as they deem necessary. By
implementing this concept, stovepipes are eliminated and issues
can be resolved in a diversified-team approach.
Conditions Which Prompted the Study
In 1993, the University of Virginia Medical Center (UVaMC)
implemented the "service center" model, which at the time was an
innovative approach toward health care delivery. UVaMCs
purpose for implementing this approach was to provide health
care that focused on the patient rather than functions or
physicians. The goal was to provide high quality care that
resulted in high patient satisfaction. UVaMC believed that the
service center model would meet this objective by structuring
health care delivery based on the continuum of care, and
aggregating the administration of similar services.

Service Center Approach 13
The UVaMC environment provides an excellent opportunity to
study how well this approach serves the health care industry.
Now in place at UVaMC for over five years, the service center
model's charter of providing high quality care is evident from
the levels of patient satisfaction and quality indicator
results. UVaMC was recently named by HCIA as one of the nations
top 100 hospitals^.
However, up until now, cost and resource accounting have
not been as much a focus as quality and patient satisfaction
indicators. With decreasing government funding and third-party
payer reimbursements, cost accounting is now a critical issue to
the survival of UVaMC and other health care organizations.
Statement of the Issues
As noted earlier, the service center approach has been
proven effective in other industries. However, it is a new
concept for health care organizations. As such, issues of how
to best adapt this model to the health care environment are
still being addressed. Issues such as quality and patient
satisfaction indicators, benchmarking, and financial models are
works in progress. Finding the right complement will take time,
but these elements will have to remain flexible as the health
care market changes constantly.
Additionally, the service center concept is based on the
principle of decentralization. This was thought to give each
area's administration more control of its services. However,
now implemented, problems directly related to this type of
management structure are coming to light. The decentralized
Service Center Approach 14
services find it is difficult to augment resources during peak
workloads and when personnel take leave or unscheduled absences.
The issue here is what is the best management structure for the
service center model; decentralization or a balance between
decentralization and centralization?
Literature Review
There are numerous articles that discuss the concept of the
service center methodology. Although some articles address the
concept by a different name, the main thrust is to focus on the
patient while maximizing efficiency and effectiveness in the
delivery of health care. Other names referenced by articles are
patient-focused care, patient-centered care, "hospitals within
hospitals", product-line method, and service centers. These
concepts will be discussed throughout the literature review.
The New Paradigm
Intermountain Health Care's management philosophy reflects
the service center approach by focusing on the customer: "...We
need to meet or exceed our customer's expectation 100% of the
time. If we are successful, we will develop a relationship
with our customers that builds trust and confidence in us as
their health care provider, ultimately allowing us to maintain
market share." (Frommater, Marshall, Halford, Rimmasch, Coons,
1995) Again, the most important aspect of the service center
approach is providing care that focuses on the patient's needs.
One new concept for health care is being discussed by Regina
Herzlinger in her new book called "Market Driven Health Care".
In it she discusses the term "focused factories", where a

Service Center Approach 15
diversified team is focused on delivery of one specific type of
service (e.g., hernia repair). The goal here is to become a
"center of excellence". Carnegie states: "And here is the
prime condition of success, the great secret: concentrate your
energy, thought, and capital exclusively upon the business in
which you are engaged. Having begun in one line, resolve to
fight it out on that line, to lead in it; adopt every
improvement, have the best machinery, and know the most about
it."
These concepts are derived from a similar idea that has
been used in several other industries for a couple of decades
now''. "The busiiless industry has been decentralizing and
restructuring companies for years to improve worker
productivity, decrease costs, and enhance customer
satisfaction." (Patronis-Jones, et al., 1997) Additionally,
"The patient-focused care concept first appeared in literature
in the late 1980's. Eight to ten years later, there is still no
one accepted definition or clearly explicated model for this
care philosophy." (Johnston and Cooper, 1997) One example of
an adaptation strategy is shown in table 1, which was
implemented at Jackson Memorial Medical Center.
Even though there is no single definition for this new
management approach, initial experience indicates that it has
considerable advantages over the traditional model. With the
service center approach, resources are placed as close to as
possible to the point of service delivery. This enhances
communication and coordination, and ultimately the delivery of

Service Center Approach 16
health care.
In the past, with a departmental approach, there was no one
point of control for the process. As such, there was little
incentive to improve the process as a whole. The services
provided to the patient crossed several departmental boundaries
with each department focusing on their specific tasks.
Communication and coordination across these boundaries left a
lot to be desired.
Table 1: Changing Corporate Culture (Jackson Memorial Medical Center)
Current state Future state
Reactive Proactive
Management Leadership
Crisis management-oriented Shared vision
Problem-oriented Solution-oriented
Minimal focus on customer Customer friendly/oriented
Policy- and procedure-driven Flexible policies and
procedures
Decision making pushed to top
executives
Quick to make decisions at
lower levels
Territoriality Teamwork
Minimal risk-taking Risk-taking
Resistant to change Open to new ideas
Political Open, honest communication
Conflict avoidance Conflict-tolerant
Apathy Energetic
Source: Beerman, et al. (1998)

Service Center Approach 17
However, the departmental paradigm is quickly changing with
the increasing pressures of competition in the health care
market. "It is becoming increasingly evident that traditionally
organized, functionally structured health care institutions will
no longer be able to deliver valuable services to their
customers." (Duffy and Lemieux, 1995) The new organization
structure must be able to respond quickly to changes in the
health care environment. "The new vision and mission will
demand new flexible, rapidly responsive, and well-integrated
systems; redefined roles; transformed work and paradigm shifts
in providers; redefined information management systems; and
significantly different approaches to resource allocations,
especially capital." (Mueller, et al, 1995) The organizations
who can rapidly adapt to this new philosophy will be able to
survive, and even prosper in the new age of health care.
Regardless of the approach taken, the focus in the new era
of health care is the same; to provide patient-centered health
care that produces high quality, patient satisfaction, and is
cost effective. The model developed at a community hospital
located in Thomasville, North Carolina was designed with three
goals in mind: ^. ^ 1. Improve patient satisfaction through more timely,
responsive and less personnel contacts; 2 Streamline systems and reduce overall inefficiencies; and 3. Reduce expenses through a reduction in personnel and/or
reduction in skill mix requirements. (Rouch and Stafford,
1996) .
Service Center Approach 18
Kimble (1997) lists the most common goals identified by
several hospitals for the patient-focused process: 1. Grouping patients by common characteristics; 2. Decentralization of services; 3. Cross-training and multi-skilling; 4. Streamlining process and reporting structures; 5. Empowerment of staff.
Goals established by Intermountain Health Care are listed in
table 2 and their implementation model can be seen in figure 2.
The organizational structure required to implement a
process that will meet the above goals requires substantial
change from the traditional structure. "We needed to simplify
processes, open lines of communication, and begin to focus on
the customer." (Beerman, Bensell, Breeden, Denker, Gallego,
Harvin, Kontz, Krueger-Jones, Martin, Mass, Oza, Perdue, Rogers,
Sears, Williams-Welch, 1998) This will be a major step to
tearing down the barriers typically associated with a
departmental organization. The re-organization must incorporate
re-engineering throughout the entire organization. Patronis-
Jones (1997) states that "The theme of patient-focused care is
operational restructuring involving the physical plant, job
descriptions, and processes to organize more efficiently and
effectively the delivery of health care that is centered on the
patient." The restructuring is designed to provide a more
streamlined approached to delivering health care to the patient.
"Patient-focused care combines all the elements of re-design,
re-engineering, and restructuring. It places the patient -at the
center of the delivery of care and redirects activities so that

Service Center Approach 19
the right job is performed effectively by the right person at
the right time." (Pence, 1997)
In converting to a patient centered environment, the
patient's requirements must be kept at the forefront of the re-
design process. To determine where to begin this process,
Mancini (1995) states that, "Making changes to establish a
supportive, healing environment must start by identifying what
the patient needs and wants, rather than how the hospital has
always functioned."
Table 2: Planning Session: Prioritization of Heart Services' Goals
(Intermountain Health Care)
1. Develop an operational system that supports a smooth flow of
patients through the continuum of care. ,
2. Maintain state-of-the-art clinical services through research
and development.
3. Develop a comprehensive marketing plan for in-state and out-
of-state markets^
4. Increase education of patients and staff.
5. Appropriately address new reimbursement methods.
6. Develop a unified process to assess quality.
7. Develop a comprehensive referral network.
8. Develop a multidisciplinary resource plan
(facility/equipment/people) .
9. Communicate position excellence.
Source: (Frommater, et al. 1995)

Figure 2: Heart Service Line Structure (Intennoimtain Health Care) Source: (Frommater, et al. 1995)
Service Center Approach 20
Cardiovascular Medical Staff Work Group
Chief, Surgery (CT Surgeon) Chief, Cardiology Chief, Thoracic Surgery Chief, CV Anesthesia Chief, Pulmonary Medicine Director, CVLab (Cottonwood) Director, CV Lab (LDSH) Director, ICU (Cottonwood) Director, Mechanical Circulation Support SLV Administration Director, IHC Heart Services SLV Cardiology SLV Nursing SLV Case Management SLV Operating Room SLV Quality Resources mC Health Plans
Teams Extubation Activity Pain Nutrition Social-emotional Pharmacy Operating Room
PTCA Team
Open Heart Team
Multidisciplinary Communication
Team
Customer Satisfaction Team
Communications Team
Marketing Team
Database Team
Analysis Team
Financial Team
Members
Cardiac Executive Council Administration Division of Cardiology Division of Thoracic Surgery Division of Critical Care Medicine Department of Anesthesia Nursing Case Management Operating Room Corporate Office Organization's Insurance Plans Quality Resources
Time-Limited Work Teams SLV Frontline Nursing Staff CCU,
TICU, Acute Care Units SLV Respiratory Care SLV Case Management SLV Social Services SLV Pharmacy SLV Operating Room SLV Diet Services SLV Cardiac Rehabilitation SLV Quality Resources
Division of Cardiology Public Relations Planning and Marketing
Patient Relations Cardiac Rehabilitation Quality Resources
Division of Cardiology Quality Resources:
Research Analyst Quality Consultant
Plarming and Marketing DRG Coordinator Finance Patient Account Services Health Information Services
Functions
Cardiac Executive Council -Identity major goals for the Heart Service Line -Identify key processes -Set priorities for the Heart Service Line -Direct work teams -Make data-driven process changes to improve quality and decrease cost
Clinical Process and Outcome Team -Coordinate all clinical projects -Analyze clinical pjocesses -Initiate and oversee time-limited work teams -Facilitate communications between work teams -Implement changes in care processes -Evaluate impact of process changes
Satisfaction Team -Assess expectations of customers -Measure perceptions of quality and service -Analyze and communicate results -Develop internal/external commimication plan for the Heart Service Line -Develop marketing strategies for Service Line -Program evaluation
Resource Team -Information Central for Heart Service Line -Support data needs for all Service Line Teams -Report key Service Line data -Assist in business plan development -Provide market/enviroiunental assessments -Assist in packaged Heart Services planning

Service Center Approach 21
Patient Satisfaction and Quality Indicators
As this methodology is based on centering care around the
patient, patient satisfaction and quality indicators will be the
drivers in meeting the objectives. However, it is important to
understand the meaning of the indicators from the patient's
perspective. For example, in Mancini's 1995 article, she
mentions that the number one patient satisfier is the quality of
nursing care. Yet, Mancini goes on to ask the question "What
does ^nursing' mean to the patient? Does it mean care provided
by a registered nurse, or does it mean care given by anyone who
helps keep the patients warm, dry, and pain free? Do patients
even know who their registered nurses are and what they do?"
Whatever the indicators, the results of these metrics must be a
catalyst for continually improving quality through fine-tuning
the system for optimal health care delivery.
As such, the patient satisfaction and quality indicators
should be designed to guide the organization in meeting the
patient-centered goals. Here, it is important that the metrics
incorporate flexibility. Lanza, Binus, McMillan (1997) state
that "Indicators focus on both improvement in patient
performance and organizational performance. They are
interdisciplinary in nature and outline data gathering and
reporting schedules and responsibilities." These metrics will
be works in progress, constantly changing as process
improvements are made, "...we must continue learning and adapting
to meet current needs." (Frommater, et al., 1995) Lanza, and
his colleagues also recommend that a log be kept for each

Service Center Approach 22
quality metric to record strength and weaknesses. This
information can be used to make the necessary fine-tuning during
periodical review of the measures. Table 3 lists a sample of
patient satisfaction questions asked by Jackson Memorial Medical
Center.
Additionally, communication of metric results is essential
to provide the necessary feedback to make needed changes. The
dissemination of information must be throughout the
organization. Rouch and Stafford (1996) state that the results
must be communicated to both "internal and external
constituents". Furthermore, Niles, Tarbox, Schults, Swartz,
Wolf, Robb, Plume, Nelson and Nugent (1996), emphasize that it
is important to understand the service from the perspective of
the patient. They did this by flowcharting the process (see
figure 3). Furthermore, they broke down the key quality
indicators into six categories: 1. Comfort; 2. Convenience; 3. Caring; 4. Communication; 5. Certainty; and 6. Cost (to the patient).
Although it is the patient satisfaction and quality of
services that will be driving the patient-centered methodology,
it is important to monitor other aspects as well. Several
articles point out the importance of monitoring the family,
staff, and physician satisfaction (Patronis-Jones, et al., 1997,
Reisdorfer, 1996, and Kirkhart, 1995). After all, if these
areas are not doing well, it is improbable that patient
satisfaction and perceived quality will be high. At Mercy San

Service Center Approach 23
Juan Hospital in Carmichael, California, Kirkhart (1995) states
that surveys were taken on a bimonthly basis of physicians,
nursing staff, student nurses, patients, and family for use in
determining satisfaction trends.
Table 3: Patient Satisfaction Survey (Jackson Memorial)
1. If you had to do it again, would JMH be your choice for
prenatal care and delivery? If not, why?
2. Were the services received provided in a timely manner?
3. What creates the most frustration for you as our patient?
4. How can we help you most during your visit here?
5. What do you like most/least about us and the services we
provide ^
6. What can we do to make your visit less stressful?
7. Was the staff courteous/caring to you?
8. If you could make one significant change to improve our
services, what would it be?
9. After your delivery, do you plan to continue to use JMH for
health care services for yourself and your child? If no, why
not?
Source: Beerman, et al. (1998)

Service Center Approach
Figure 3: Patient Experiences Flowchart
24
^ 1
I have a problem
2 Seeing my doctor
3 I need a
cardiologist
4 Testing:
Finding out about my heart
W P
1 + 5
Deciding about a certain procedure
6 Coming to the hospital for the procedure
7 Procedure and first 24 hours
after
8 Recovering:
The rest of my hospital stay
1
+ w
9 Getting ready- to go home and leaving the
10 Recovering: At
home
11 Adjusting to a new lifestyle:
Cardiac reh^h-l 1 i tati nn
12 Following up: Seeing my
doctor again
F
Source: Niles, et al (1996)
Operational Efficiencies
As mentioned above, , it is important to deliver high
quality health care that satisfies the patient. However, for
the institution to survive it is also essential that this care
be provided in a cost effective manner. Therefore, it is
essential to monitor operational efficiencies, especially in
this era of decreasing budgets and reimbursements. Common
metrics used have been length of stay, cost per patient per day,
hours per patient per day, paid hours per adjusted discharges
and full time equivalents (Patronis-Jones, et al., 1997,
Kirkhart, 1995). "The challenge is relating costs appropriately
with the specific services provided." (Goodman, Campbell,
Millar, Cook, Jennings, Rimmer, Evans, 1998). In other words,
it is becoming important to associate costs to the service that
generates them so that when cuts have to be made, organizations

Service Center Approach 25
can distinguish between the more efficient from the least
efficient services. With decreasing reimbursement rates, this
will be the "make or break" of many organizations.
One aspect commonly looked at to enhance operational
efficiencies was the cross-training of personnel. By cross-
training personnel, individuals are capable of doing several
tasks making for a more flexible work force. Flexibility is
extremely important with the decentralized approach. In the
centralized approach, staffing can be moved from area to area to
meet inevitable situations such as vacations, sick leave, or
increased workload. The decentralized approach design is not as
flexible and thus does not accommodate these instances as
readily.
Pence states that "Unanticipated activities and tasks make
staffing decisions [difficult]. Staffing plans must be flexible
to respond to changes in the numbers and acuity of the
patients." He notes that a cross-training approach can meet
this requirement. However, UVaMCs Jim McGowan^ stresses that it
is important to consider the "...issue of state licensure laws and
limits placed on, or what work can be delegated to, those cross-
trained." For example, what additional roles can LPNs take on
that were previously the responsibility of the RW, and still
adhere to state licensing regulations.
When an organization implements cross-training, it in turn
must re-design the staff roles to reflect these new
responsibilities. The new roles in the patient-centered system
varied somewhat across the facilities that implemented cross-

Service Center Approach 2 6
training. Although there were variations in the implementation,
each of these facility's goal was to institute a more flexible
team with the ability to handle the day to day tasks of the unit
in the most efficient manner possible.
At San Juan Hospital, the staff went from an all RN nursing
staff to a combination of RNs, LVNs and NAs. In addition, there
was a pharmacy and respiratory therapist located on the unit.
The pharmacy ensures that the patients are receiving the correct
medication by staffing a pharmacist there during peak hours.
The respiratory therapist does tasks previously performed by the
nursing staff. (Kirkhart, 1995)
At Albert Einstein Medical Center, six new job roles were
developed and implemented for a unit. They were physical
therapist, registered nurse, licensed caregiver, non-licensed
technician, support associate, and administrative associate.
Although some of these positions were in existence with the
former structure, the roles of these positions changed to allow
the staff more flexibility. For instance, the licensed
caregiver was trained to provide basic respiratory interventions
and the non-licensed technician performed tasks such as
phlebotomy, eletrocardiography, assisting physical therapy,
vital signs measurements and bed making. (Patronis-Jones, et
al., 1997)
The Sioux Valley Hospital created new roles for director,
clinical care coordinator, primary nurse, associate nurse,
patient care technician (PCT), health unit coordinator (HUC),
and patient support representative (PSR). Here, the nursing

Service Center Approach 27
duties were divided into three separate tiers, based on
experience, competence, and preference. The PCT assists the RNs
by performing basic patient care as well as phlebotomy and
oxygen therapy. The PSR performs housekeeping, stocking
supplies, patient care and transport duties. The HUC handles
non-clinical patient care aspects such as coordinating financial
counseling, record-keeping and reception tasks. (Reisdorfer,
1996)
Although the role names vary from organization to
organization, the basic duties for the roles are similar in
nature. The cross-training approach provides the necessary
resources to give comprehensive patient care that is dedicated
to the unit and falls under the unit director's control.
Furthermore, since some duties overlap, the roles of multi-
skilled personnel are flexible. This allows the unit to handle
occurrences of increased patient activities or filling in for
personnel who are sick or on vacation without having to seek
external assistance.
There have been both negative and positive consequences in
implementing the new roles in support of the patient-centered
approach. Kimble (1997) highlights several of these in his
article discussing the structural change from the perspective of
respiratory care practitioners (RCP). The 4 main negatives he
finds are:
1. Elimination of the department and support staff; 2. Removal of the RCP from key areas of the hospital, such as intensive care and the emergency room;

Service Center Approach 21 3. Elimination of respiratory care management staff and shifting of responsibility to another department, usually nursing; and 4. Shifting of the focus of the RCPs work from clinical to supportive (nursing assistant, patient support, or housekeeping duties).
The positives that Kimble discusses are centered around
increased job responsibilities. He lists 4 favorable outcomes
with the patient center-approach:
1. Some institutions have added pulmonary function assessment, noninvasive and invasive cardiology, phlebotomy, electroencephalography, polysomnography, hyperbaric oxygen therapy, and bronchoscopy to the RCPs responsibilities; 2. Through the development of patient care protocols, algorithms, and critical pathways, RCPs assess, implement, and modify care without direct physician involvement; 3. RCPs have served on planning and implementation teams for the patient-focused model; and 4. Respiratory care managers have been granted additional duties such as overseeing biomedical engineering, infection control, and electrocardiology.
It is important to match the new roles of the health care
professionals (HCP) with their skills in a way that can best be
utilized in the organization. An important consideration is not
to inundate any one specialty with more responsibilities than
can be appropriately handled. Input from the HCPs will be the
best resource for this determination. Additionally, adequate
training must be provided for a smooth and successful transition
to the new roles. This will minimize disruptions and incidents
in the daily delivery of health care.

Service Center Approach 29
Purpose
The purpose of this study is to examine the service center
model at UVaMC, researching and studying methods for
establishing appropriate indicators and models that are needed
to optimize the service center concept. Issues such as quality
and patient satisfaction indicators, benchmarking, and financial
models will be addressed. In addition, methods to address
problems relating to decentralization will be studied, to
include an analysis of possible centralization of certain
resources. Three specific areas will be looked at in this study.
The first area of study will focus on detailed financial
accounting of a service center to assess if it will more
accurately determine its value to the organization. The issue
here is allocating true costs and resources to the services that
use them rather than an across-the-board allocation. This
theory will be tested by developing a financial model that
allocates costs to the services in Surgery. This model will
include capital depreciation, operating expenses, and operating
room time as inputs.
The second area will focus on the issue that certain
positions and resources that are currently decentralized may be
more efficient if they were centralized. For example, certain
services only need one type of discipline (i.e.. Respiratory
Care, Physical Therapy, etc), however when the individual
filling that role is sick or takes a vacation it is difficult to
augment the position. Furthermore, ways of benchmarking will be
looked at, comparing UVaMC's operational efficiencies with other

Service Center Approach 30
similar institutions.
The third area will look at metric indicators and compare
them over a five year period. Observations will be made to
determine if the indicators are improving, staying the same, or
declining.
Method and Procedures
Research Methodology
The study will use both qualitative and quantitative c;iata
to assess the effectiveness and efficiencies of operations. The
qualitative data will be from perceptions and opinions of the
people who work at or use the UVa Health System. The portion of
the study using quantitative data will look at management
indicators such as patient satisfaction and quality, and use
this data to compare with prior years.
The goal will be to gather information on the current
functions and processes, how it has evolved, and where it is
expected to go in the future. Types of information will include
costs associated with services provided, patient satisfaction
levels, and operating efficiencies. This information will be
compared with past data and with data from other similar
organizations. The purpose will be to identify the strengths
and weaknesses of the service center methodology.
It is important to note that the analysis must distinguish
between results that were influenced by the service center model
as opposed to other factors. For example, were improvements in
efficiencies a result of the implementation of the service
center model or a change in hiring practices (e.g., soliciting
Service Center Approach 31
staff with more skills, change in leadership, etc.)^ or a
combination of both? The analysis will have to address the
various possibilities.
Data Collection
The data in this study shall be collected from both primary
and secondary sources. The primary data will be collected from
historical, financial, and metrics used at UVaMC. Additionally,
opinions and perceptions from the staff at UVaMC will be
collected. Secondary data will be collected from literature
reviews and organizations such as the University HealthSystem »
Consortium information.
Additionally, observation of operations will be used to
assess efficiency and effectiveness of the processes throughout
the Surgical Services. This will be accomplished through the
use of reports, interviews, and from the experience of staff.
Furthermore, during the monitoring process, interviews will
be conducted with the administrator, managers and various
employees throughout the Surgical Services. The purpose of
these interviews will be to gain an assessment of how the
service center model functions based on opinions and perceptions
of the personnel who work in the area on a day-to-day basis.
Questions will be along the lines of:
• How the process worked approximately five years ago;
• How it has evolved;
• Lessons learned; and
• What changes will be needed in the future.
It is critical to an accurate study that validity and

Service Center Approach 32
reliability issues are observed closely. This will be
accomplished by ensuring that data is collected in a consistent
format, which will minimize the possibility of errors or bias.
In addition, the study will encompass adequate coverage of the
issues through the use of a comprehensive literature and
background search, as well as drawing from the experience of the
UVaMC staff.
Discussion
Financial Accounting
This section will discuss a cost allocation model for the
Surgery Services. With the guidance of Jim McGowan, I developed
a model to better allocate costs to service lines under Surgery.
This model distributed expenses associated with medical
supplies, operational and capital costs. The goal of this model
was to allocate cost in a better manner than the traditional
across-the-board method.
With health care costs climbing out of control it is
important to know what is generating the expenses so that they
may be better contained. By having this knowledge, necessary
business decisions can be made with accuracy; the more detailed
the knowledge the more accurate the decision. With traditional
cost accounting, expenses that can be easily attributed to a
specific service line typically were. The remaining costs were
then allocated, for the most part, in an across-the-board
fashion (e.g., equipment depreciation, supplies, etc.). This
type of cost accounting was adequate in the past. However, with
the pressure to bring health care expenditures in check, and for

Service Center Approach 33
health care organizations to operate more efficiently, it is now
imperative to accurately know what costs are associated with a
particular service.
Many health care organizations are finding themselves in
the red. With this dilemma, health care organization leaders
are looking for ways to cut costs in an effort to move their
operating finances back in to the black. -Increasing health care
costs are weighing heavily on the University of Virginia Health
System's finances and will force the hospital to reduce costs
considerably to remain fiscally healthy, officials said
Saturday." (Sanminiatelli, 1999) To decrease expenses
appropriately, rather than the traditional «salami-slice" budget
cuts, leaders must know what their organization does well and
not so well. By having this detailed information, a more
accurate strategic plan can be laid out based on targets.
Service lines that do not meet the established targets can be
dealt with appropriately, either by initiating an attempt to
bring them in line with the targets or possibly consider their
elimination. Obviously costs are not the only factor that will
be looked at when making changes (e.g., politics, community,
etc.), however, it should be a major input to the equation.
The allocation of the costs were distributed based on OR
utilization time, equipment depreciation for specific services,
and detailed medical supply costs that were tracked to specific
services. In developing this model, data was retrieved from
several sources. These were the Depreciation Report, Monthly OR
Service Base Supply Cost Report, OR Cases and Minutes Report,

Service Center Approach . 34
and the UVaMC Direct and Indirect Expenses Report. The results
of the model are in table 4.
Table 4: Surgi( ::al Operating Room Services Cost Allocat ions
Direct Indirect Total Surgery Services Total Direct Total Indirect Total Cosl/IVfin Cost/Min Cost/Min Service 1 $72,276 $50,844 $123,120 $6.47 $4.55 $11.01 Service 2 $722,683 $508,381 $1,231,064 $9.78 $6.88 $16.66
Service 3 $3,557,150 $2,502,321 $6,059,471 $10.04 $7.06 $17.10 Service 4 $1,181,812 $831,360 $2,013,173 $7.66 $5.39 $13.06 Service 5 $1,704,726 $1,199,211 $2,903,937 $10.27 $7.23 $17.50
Service 6 $4,401,099 $3,096,008 $7,497,107 $14.04 $9.88 $23.92
Service 7 $526,614 $370,453 $897,068 $10.84 $7.63 $18.47 Service 8 $1,213,125 $853,388 $2,066,512 $8.63 $6.07 $14.70 Service 9 $634,810 $446,565 $1,081,374 $7.90 $5.56 $13.46 Service 10 $4,428,843 $3,115,524 $7,544,367 $8.55 $6.02 $14.57 Service 11 $4,485,801 $3,155,592 $7,641,394 $10.09 $7.10 $17.18 Service 12 $1,255,485 $883,186 $2,138,671 $9.04 $6.36 $15.39 Total $24,184,424 $17,012,833 $41,197,257 $9.90 $6.96 $16.86
In the past, the costs from the above reports were
allocated evenly across the 12 services. Thus, a service that
used more OR time or more expensive equipment had an operational
efficiency that looked better on paper than it actually was, and
vice versa.
The results of the analysis show that the model provides a
detailed distribution of expenses to more accurately reflect the
true costs of each service. In the past, an across-the-board
cost of $16.86 per minute would be allocated to each service.
However, as can be seen from table 4, there is a wide variance
in cost per minute among the services when expenses are more
accurately distributed. For example, service 6's costs are more
than double that of service I's.
The wide variance between the traditional method and the

Service Center Approach 35
more detailed allocation shows that some services are clearly
being attributed excess costs while other services are receiving
much less than appropriate. For example, the two extremes are
service 1 and 6 ($11.01 and $23.92), respectively, which vary
from the across-the-board figure ($16.86) by 34.7% and 41.9%,
respectively. Say, for instance, that these services are truly
break-even. Then using the traditional method would give
service 1 the appearance of having a profit margin of negative
34.7% and service line 6 a profit margin of 41.9%. The across-
the-board methodology paints a bleak picture of service 1 and a
highly favorable picture of service 6. If an organization were
to make a decision of which service to scale back or cut,
service 1 would obviously be unfairly put on the chopping block
first.
By using more detailed cost accounting information,
organizations can make better decisions. This will help the
organization to operate more efficiently by trimming areas that
are less profitable. In addition, the organization will also
understand what is required to support a particular service.
The effect will be better use of resources and thus bringing
about a better return on investment. The end result should be
higher profit margins, enabling the organization to remain
competitive and survive through the turmoil of the current
health care environment. Finally, as insurance companies
negotiate their reimbursement rates for services, an
organization will know better what price is acceptable and when
it is time to walk away from the table.

Service Center Approach 36
Decentralization and Centralization Analysis
The purpose of this section is to look at two methods of
management organization, decentralized and centralized. As
mentioned earlier, the emphasis of the service center approach
is to place needed resources as close to the point of health
care delivery as possible. A truly stand alone service center
concept lends itself to a structure that is based on
decentralization. This concept appears to be effective and
efficient in theory, however, from a practical analysis, there
are several drawbacks that will be discussed.
Decentralization
There are several undesirable features to decentralization
that have come to light over the last several years at UVaMC.
Interviews with leaders throughout the organization have made
reference to this issue. The problems are related to both
efficiencies and organizational cohesiveness. In particular,
decentralization requires resources to be placed in each service
center to support all needed contingencies. The
decentralization structure is set up in a way that each service
is independent. Such a configuration requires that resources
needed to provide the particular service be dedicated to that
service. Inefficiencies result when these requirements are not
fully utilized. For example, if a service requires .3 FTE for
respiratory care, a full FTE must be assigned to meet that
requirement. The inefficient use of resources is inherent with
decentralization. In contrast, a centralized structure allows
peak workloads to be augmented with staff from a central labor

Service Center Approach 37
pool.
Furthermore, having various disciplines (e.g., respiratory
care, occupational therapy, physical therapy, etc.) assigned via
service centers in a decentralized approach eliminates the
cohesive structure of the professional group. For example, in a
centralized structure, staff report to and are evaluated by
peers in the same discipline. In a decentralized approach the
various disciplines report to managers that are not typically
experts in their fields. Problems result from issues such as
lack of career guidance, mentorship and unfair distribution of
continuing education (CME).
In my analysis of the decentralized approach, I focused on
Respiratory Care. Respiratory Care is one of the largest
staffed disciplines at UVaMC. A Study of this area was prompted
by the assumed gains that could be realized by reducing FTEs.
I used benchmarking to compare UVaMCs resources in
Respiratory Care to that of other institutions organized around
departments. Benchmarking is becoming an established method for
organizations to compare their operational efficiency with other
similar organizations. "To remain competitive in this tough
environment, hospitals need to closely examine - and consider
adopting - the best practices of consistent top performers."
(HCIA, 1999) ''Administrators seek best practices to improve the
efficiency of an organization's various functions, including
scheduling, medical group practice management, and home health
staffing patterns." (Kibbe, Smith, LaVallee, Bailey and Bard)
(1997) The data used to accomplish the benchmark comparisons

Service Center Approach 38
were derived from three different sources; two different
benchmarking systems (HBSI and MECQN) and a survey generated via
e-mail among University HealthSystem Consortium (UHC) members.
The HBSI benchmarking system was recently implemented at
the UVa Medical Center. This system has been in place for
approximately one year and was selected because of the
recommendation based on a UHC analysis. This system is
replacing MECON, the previous benchmarking system used by UVaMC.
The e-mail survey of several UHC members was conducted to give
real time data and to verify and validate the data reported in
the benchmarking systems.
The data used can be seen in tables 5 and 6. The results
show that the respiratory care FTE efficiency at UVaMC is less
than ideal. UVaMC currently has approximately 94 FTE's. This
is above average for the majority of the comparison facilities.
The analysis will show this in more detail below.
The data obtained from the UHC e-mail survey was paired
down from the original twelve respondents to six organizations,
including UVaMC. This was done because of the additional
information available on these organizations in the HBSI system
(e.g., patient days and adjusted discharges). By using the UHC
e-mail survey and HBSI data, I was able to validate the data and
ensure a parallel comparison. One of the six organizations was
eliminated because the data reported via UHC e-mail was not
consistent with the data in HBSI.

Service Center Approach
Table 5: Data from the UHC E-mail Survey
39
Total Patient
Discharge Beds in excluding Respiratory
Sites Use New Borns Care FTE's Site 1 474 18,540 97 Site 2 331 12,424 46 Site 3 396 17,109 70 Site 4 478 21,112 67 Site 5 678 28,809 80 Site 6 644 26,653 40 Site? 567 29,196 94 Sites 1020 No Data 82 Site 9 600 No Data 77
Site 10 600 No Data 66 Site 11 350 No Data 57 Site 12 350 No Data 54
Table 6: MECON Data
Total Patient
Discharge exciMding Respiratory New Borns Care FTE's
33,761 137 32.679 102 23.980 92 27.056 89 26.451 68 27.623 64 28.746 61 25.780 61 30,759 54 25,154 47 23,831 32

Service Center Approach 40
The five facilities selected for the analysis were West
Virginia Medical Center, University of Utah Medical Center,
University of Wisconsin Medical Center, University of North
Carolina Medical Center, and University of Virginia Medical
Center. For the purpose of this model, the facility with the
most efficient use of Respiratory Care personnel was selected as
the "gold standard". This was site four, with an adjusted
discharge per FTE of 489.9.
Adjusted discharges were used because it reflects only the
workload associated with acute care. It eliminates discharges
associated with infants, rehabilitation, and psychiatric stays.
By eliminating non-acute care discharges, a reliable workload
figure is obtained that is consistent across institutions.
Adjusted discharges is a typical unit used in benchmarking as it
facilitates an "apples to apples" comparison among
organizations.
The results of this analysis indicates that UVaMC s FTE
level is approximately 15% above the benchmark. This finding
lends itself to further analysis to determine what number of
FTEs UVaMC should have based on its number of adjusted
discharges.
RC FTE Projection Model
A model was developed to project the number of FTEs a
facility should have based on the established benchmark.
Adjusted discharges were used for calculating the projected
FTEs. This model was developed using adjusted discharges from
the HBSI system and the FTE numbers from the UHC e-mail survey.

Service Center Approach 41
The FTE projection coefficient was generated from the
benchmark hospital's (Site 4) data and used to calculate the
number of FTEs each of the other four facilities should have
based on their adjusted discharge numbers. The coefficient was
calculated by taking the number of adjusted discharges for Site
4 and dividing it by Site 4's number of FTEs. The result was
489.9. The coefficient, adjusted discharges and FTEs can be
seen in table 7.
Using the model, the projected ninnber of FTEs for UVaMC is
83.87. This number was calculated by multiplying the FTE
projection coefficient by the number bf UVaMC adjusted
discharges. To validate this model, the Site 3 data was used.
Based on the HBSI system's data. Site 3's Respiratory Care
resource efficiency is very close to Site 4's. With the
projection model. Site 3's projected FTEs were within 1.5% from
their actual FTE numbers. Additionally, Jim McGowan is familiar
with Site 3's Respiratory Care program and is confident with the
projected FTE number. The projection graph can be seen in
figure 4.
Based on the 1.5% difference, I believe that an error'
tolerance of plus or minus 3% is conservative^. Using this
tolerance, the projected range for Respiratory Care FTEs at
UVaMC is between 86.39 and 81.35. This projection estimates a
potential FTE reduction of between 7.7 6 to 12.8. The finding
indicates that a centralized approach with Respiratory Care has
the potential of being more efficient (i.e., better assigning
FTE's based on workload).

Service Center Approach 42
Table 7: Benchmark Data from Five University Hospitals
P^ent Current Bed Days Adjusted
Respiratory Beds in excluding Adjusted IDischart|es^ Sites CareFTEs Use NewBoms Discharges FTE Site1 46 331 83,295 17,250 375.0 Site 2 70 396 105,984 23,670 338.1 Sites 67 478 125,121 31,945 476.8 Site 4 80 678 177,491 39,241 489.9 Sites 94 567 166,461 41,088 4371
Note: Data obtained from UHC e-mail and HBSI Benchmarking system
From the analysis there is potential of reducing costs by
adjusting the UVaMC Respiratory Care FTEs to the projected
figure from the model above. With an estimated average annual
salary plus benefits of $44,716 per FTE^°. The potential cost
avoidance ranges between $346,996 and $572,365 annually.
In conclusion, this finding provides evidence that similar
organizations which operate in a department approach have a more
efficient use of Respiratory Care resources. Based on this
finding and interviews with UVaMC managers, some service centers
have a higher number of Respiratory Care FTEs due to the
inherent nature of decentralization. That is, flexibility to
adjust staff based on workload fluctuations is not conducive in
a decentralized approach. As a result, there are possible gains
in resource efficiencies if a balance between centralization and
decentralization can be obtained.

Service Center Approach 43
Figure 4: Projected Respiratory Care FTEs
Projected RC FTE's Based on Adjusted Discharges
-Current FTE's Projected FTE's
-Adjusted Discharges Sttes
Centralization
The centralization approach lends itself to the
departmental organization structure. Here, all similar
resources are controlled by a department. The resources are
allocated as needed, however this is often not on a consistent
basis. Furthermore, this management structure provides less
control at the point of health care delivery due to the

Service Center Approach 44
"stovepipe" nature of the department structure. Murphy (1995)
notes that faster processes and responses for patients and
employees are achieved by moving the services closer to the
patient. This is not an advantage of the centralized method.
Deriving a balance between these two types of management
structures in a hybrid approach is believed to provide the best
of both worlds while minimizing the less desirable features.
There were several functions within UVaMC that remained
centralized. These include Medical Material, Clinical
Engineering, and the Transportation Department. One area in
particular, the Transportation Department, has had problems in
supporting the infrastructure. Here there were various
complaints in regard to delays in transporting patients,
equipment, specimens and stat pharmaceuticals. The most
distressing of these complaints were those involving patients.
Numerous complaints were sent to the administration by both
patients and staff with regard to the time taken to respond to
transportation requests. My study of the centralization focuses
on the Transportation Department.
In assessing the underlying causes of the recurring
problems, the predominate issue was the lack of control of the
process. One department was responsible for overseeing the
transportation of patients, equipment, stat pharmaceuticals,
etc. throughout the entire medical center. By the nature of the
centralized approach, the majority of the transportation staff
were not assigned to specific areas. This did not lend itself
to a sense of ownership or belonging to a team. Furthermore,

Service Center Approach 45
there was no method to track or monitor the various
transportation requirements ih place.
With this premise, the UVaMC leadership believed that the
Transportation Department would be more effective and efficient
if the staff were dedicated to areas of high use, a "virtual
decentralization" if you will. This was based on input from the
staff and on the experience from several pilots which dedicated
staff in small numbers to specific areas such as Radiology and
Surgery.
Based on results of a data analysis of the patient
transportation workload, patient transportation staff are being
assigned to specific areas. The majority of this dispersion of
staff is to the Radiology and Heart Center areas. The graph of
the workload requirements can be seen in figure 5. By virtually
decentralizing the staff, management believes that the staff
members will develop a sense of membership within the location
they are working.
Additionally, by working in the same area on a daily basis,
an individual will become familiar with the location and
operations of that area. This familiarity should increase the
efficiency and effectiveness of the Transportation Department's
responsibilities. Murphy, 1995 states, "While each partner
group applies its expertise and professional or technical
skills, each knows elements of other partner roles that can be
provided safely and with quality to benefit patients and team."
Waters and Young (1997) state, "Teamwork and togetherness were
identified as cornerstone values../'. Furthermore, the local

Service Center Approach 4 6
areas will have day to day oversight of the transportation staff
and will be able to utilize the staff in the best way for that
area (i.e., control of their support resources). This will more
than likely increase patient and staff satisfaction.
Figure 5: Patient Transportation Workload Graph
Patient Transportation Workload other 7%
Endoscopy 3%
Surgery 7% "^
Emergency Department
7%
West Complex
8%
Discharges 8% Heart
Center 13%
Radiology 47%
Note: Based on 14 consecutive days of data from August 1998

Service Center Approach 47
I interviewed a supervisor of an area with dedicated
transportation staff and a transportation employee. From their
experience they both agreed -virtual decentralization" was the
better approach. In particular, throughout the day the
supervisor knew where the transporters were and was able to
assign them as needed based on workload requirements. In cases
of peak workload, augmentation was provided by additional
support from the Transportation Department. This allows for a
streamlined system, giving the area the needed support for
typical daily operations with the option of additional support
through a resource pool for peak workloads.
The transportation staff member was in favor of working in
a specific location on a consistent basis. He said that this
allows the staff member to become familiar with their duties,
and thus he knows what to expect. This approach also allows the
staff member to become part of that local team, which provides a
sense of ownership and team building. This psychosocial element
promotes a positive work environment. "An interdisciplinary,
collaborative team attitude permeates the organization and
energizes the work in all spheres." (Weitekamp, Thorndyke,
McCollister, 1996)
Findings
In looking at the decentralization and centralization
structures, evidence from several analyses provide support for
the premise that neither centralization nor decentralization is
the best method; rather a hybrid approach of the two can capture
the positive elements of both systems and mitigate the

Service Center Approach 48
negatives. For example, pros to the decentralized approach are:
Control is put as close to the point of health care delivery as
possible and a sense of ownership and belonging to the team are
achieved. The pro of centralization is the economy of scale that
allows flexibility, camaraderie and peer review. By
centralizing hiring, training, etc. these areas of
responsibility can be accomplished more effectively and
efficiently. Furthermore, staff can still retain a sense of
belonging to their area of discipline; getting adequate CME,
having a point of contact for guidance and mentorship, etc.
From the experience of both organizational structures,
UVaMC and UHC believe that a mixture of both centralization and
decentralization is the more appropriate method. This concept
pushes the staff out to the area of health care delivery as much
as possible, yet keeps responsibilities that would be more
effective under an economies of scale in a centralized
structure. Ancillary disciplines such as Respiratory Care,
Physical Therapy, etc. would hire, train, and oversee CME in a
centralized manner. However, the staff would be predominately
dedicated to specific areas where they would report on a daily
basis. The exception is where the Workload does not require a
full FTE. This requirement would be supported in a centralized
fashion. For example, if an area requires 4.6 FTEs, 4 FTEs
would be dedicated to the area and the .6 FTE would be supported
by a resource pool, which is managed centrally.

Service Center Approach 49
The UVaMC Re-design
After five years of delivering health care in a
predominately decentralized approach, UVaMC is revisiting the
service center concept and looking to make changes that will
continue to provide high quality health care, yet in a more
efficient manner. Jim McGowan has been tasked to lead this re-
design effort.
The concept that UVaMC is moving towards is a hybrid
approach between decentralization and centralization for some of
the ancillary services. This approach will establish, as Jim
McGowan puts it, "virtual centralized" departments for ancillary
disciplines such as Respiratory Care. The purpose of this
initiative is to structure core responsibilities in a more
efficient manner while still maintaining the benefits of the
decentralized approach by dedicating staff where needed.
The UHC conducted a study in 1997 of service center models
and made recommendations of what worked best. For ancillary
services, they recommended that they stay centralized, however
the functions should report directly to the service
administrators. Also, staff should be dedicated to the services
wherever possible (i.e., high-use service lines). Additionally,
contracts should be used to delineate the expected service and
that these contracts be reviewed periodically to ensure that the
performance standards are being met. (University HealthSystem
Consortium, 1997)
Service Center Approach 50
Implementation
The Implementation of the UVaMC re-deslgn was started in
February, 1999. The driver for this re-deslgn was the
increasing costs of health care and a declining increase in
revenues. As with other health care organizations, UVaMC is
experiencing the effect of this with decreasing profit margins.
Re-design at UVaMC would be the first step to cutting costs by
restructuring the organization, making it more efficient
wherever possible.
The re-design is currently ongoing. Jim McGowan's emphasis
in bringing about this change has been to thoroughly communicate
with the medical center staff. Change in an organization is
difficult, with the staff going through anxiety and fears of how
it will effect their world. The best way to ease these fears
and anxiety is through two-way communication. Mailkot states,
"Without effective communication, an organization cannot build a
trusting relationship with employees...Cqmmunication must flow
upwards and downwards...Ineffective communication leads to wrong
impressions, missed deadlines, incorrect assiomptions, riamors and
costly fixes." As Jim McGowan puts it, "Leaders must listen,
listen, and listen some more."
The biggest issues staff bring up from the re-design are
"Who will I report to", "Who writes my evaluation", and "Will I
be relocated in another area now that I am comfortable working
in the location I am currently in". Jim McGowan's approach is
to ease into the re-design so that the correct changes are made
in a methodical manner that minimizes the disruptions to the

Service Center Approach 51
organization, staff, and patients.
The re-design will be interesting to watch over the next
several months. In addition, it will provide an excellent
opportunity to observe first hand how change is accomplished in
an organization.
Patient Satisfaction Analysis
As mentioned earlier, enhanced quality and patient
satisfaction was the primary purpose of implementing the service
center approach at UVaMC. This section analyzes patient
satisfaction at UVaMC, looking at the overall patient
satisfaction for the medical center and detailed patient
satisfaction levels specific to the Surgical Service. The
analysis will review quarterly data over a five year period.
The data captured begins with the implementation of the service
center model. There was no patient satisfaction data available
prior to the implementation of the service center model, so a
direct comparison between the two organizational structures was
not possible.
The first step in the analysis was to discern major
changes in the patient satisfaction results. This was
accomplished with the use of control charts. Upper and lower
control limits were set based on the formula in the book
Continuous Quality Improvement in Health Care''^''^. Here, trends
were observed and selected based on their consistency across all
of the indicators.
The analysis indicates that one goal of the service center
model, enhancing patient satisfaction, is not being met. Both

Service Center Approach 52
the overall and the majority of the Surgical Service patient
satisfaction levels have been declining over the last five
years. Overall patient satisfaction with Nurses, Physicians,
Nursing time spent with patients, and hospital stays have
declined the most. Other declines are related to environment
and staff time spent with the patients.
An important finding was related to decreased staff time
spent with the patient. This finding is consistent with the
current health care environment. With managed care driving down
reimbursement rates, organizations are forced to cut costs to
respond to declining revenues. This introduces the "do more
with less" philosophy where staff must streamline their
interaction with the patient.
With declining resources resulting in efforts to
reduce costs, a cdnclusion can be drawn with the satisfaction
levels that have been decreasing. Table 8 shows the declining
levels that are related to the time spent with the patient,
whether it be overall interaction with the patient, explaining
what the staff is doing, conversational time, or educating the
patient on how to take care of themselves once they leave. It
appears that the decline can be attributed to the current
situation in health care more than the service center model.
For example. Tenet Health Care spokesman Harry Anderson
indicated that they will lay off 200 employees throughout
Philadelphia hospitals in order to bring costs in line with

Service Center Approach 53
declining revenues. These cuts cover a range of professions to
include housekeeping, nursing, management and dietary services.
(Hensley, 1999)
Table 8: Patient Satisfaction Trends
Survey Question Change over five
year period Overall satisfaction with MDs -5.85% Overall satisfaction with stay -4.53% RNs spent enough time with me -3.59% Overall satisfaction with RNs -3.58% My room was quiet -2.20% Nurses introduced themselves -1.86% RNs explained what they were doing -0.94% IMy room was clean -0.70% Understood how to take care of myself at home -0.46% Knew who to call for help if signs occurred -0.11%
Someone met me when 1 got to my room 5.67% RNs responded to my needs quickly 0.98% Health care team communicated well with each other 0.60%
The analysis further indicates that managed care may be
influencing the perception of quality based from the patients
perspective. Organizations have multiple concerns to include
financial and regulatory considerations which tend to degrade
the overall commitment of patient care, therefore, the service
rendered becomes more depersonalized. (Niles, et al., 1996)
The study shows that patients perceive that the nursing staff is
not spending adequate time with them. This perception can be
expected with the push to treat more patients with less
resources and as a result staff members must spend less time
with each patient. Additionally, the added stress to "do more
with less"" inherently will affect interpersonal relationships
because reducing time with the patient makes interpersonal
Service Center Approach 54
activities such as introducing themselves and taking the time to
explain what they are doing a low priority.
Furthermore, major events which occurred within the
organization seem to be correlated with patient satisfaction.
Several organizational events appear to affect patient
satisfaction due to the effect these changes had on the employee
satisfaction. Reisdorfer (1996) points out that there is a
direct correlation between patient satisfaction and employee
satisfaction. There were two major drops in patient
satisfaction across all survey questions analyzed. These two
events correlated with two significant events within the
organization. The first major drop started with the April-June
1995 quarter. This coincided with a budgeting event that
occurred in which there was a discussion of downsizing from
between 200 to 300 positions. The organization never took this
drastic measure, which is believed to be the reason for the
marked rebound in the October-December 1995 period.
The second major decline occurred during the April 1996 -
March 1997 time frame. At the beginning of this decline, one of
the well respected leaders at UVaMC was expected to leave and
did in June 1996. This individual was the Chief Nursing Officer
and was nationally recognized. There were significant changes
implemented during her time at UVaMC focusing on the nursing
staff. For example, she implemented a promotion track for
clinical nurses. Before, if a nurse wanted to be promoted after
a certain level he/she would have to move into an
administrative/management roll. Additionally, an employee

Service Center Approach 55
satisfaction survey was conducted to determine the staff needs.
Once she left, this program was dropped.
Although the majority of patient satisfaction levels
have decreased, there are several that have increased. The
areas that increased over the years were related to
communication between health team members, coordination, and
efficiency. Note, these are also goals of the service center
concept.
An indicator which relates to efficiency is better
coordination with the health care teams. The patients perceive
that the communication with health care team members is better.
Furthermore, the units were ready for the patient when they
arrived and the patients needs were responded to quickly.
From the data analysis, the core goals of the service
center approach appear to have been met, however, underlying
factors have kept the overall desire from being achieved. It
appears that better coordination and communication is taking
place with service center teams. Events outside the control of
the service center approach appear to be adversely affecting
patient satisfaction. These mainly center around the available
time staff has to spend with the patient. Even though the
overall patient satisfaction continues to decline, I would
conclude that this decline is lessened by the service center
model. If there were not the improvements in coordination and
communication, the effects would be a greater decline on patient
satisfaction and more than likely quality.

Service Center Approach 56
Conclusion
The service center model is becoming a more adapted strategy
in the health care sector. This is mostly due to its success in
other industries and success seen by health care organizations
who were willing to be early adapters of the model. UVaMC was
recently selected as the HCIA top 100 Hospitals to benchmark.
Although UVaMC is seeing declining increases in revenues and
increasing costs, they are fairing much better than many other
academic health care institutions (e.g.. University of
Georgetown Medical Center, Medical College of Virginia,
University of California-San Francisco Medical Center, etc.).
While many other university medical centers are operating in the
red, UVaMC is managing to stay in the black. All-be-it with
declining profit margins, it is still a positive profit margin
none the less.
Even with the success realized thus far, UVaMC
continues to refine the service center organizational structure,
attempting to make operations more efficient, and ultimately
enhancing quality while reducing costs. Change initiatives
include developing the proper balance between centralized and
decentralized operations and reducing the number of service
lines. Both of these initiatives are supported by the 1997
study conducted by UHC.
The service center model, as it applies to the health
care industry, is still in its infancy, yet it is learning to
crawl. As with other industries, I believe this approach will
bring the needed efficiencies to the health care industry to

Service Center Approach 57
help curb escalating costs. As more health care organizations
come on board, more ideas will be developed of how to maximize
the benefits of this structure. I am pleased to say that the
service center approach is a viable choice in answering the
ever-increasing challenges in the new era of health care. I
believe that this concept will take health care delivery to
higher levels in the new millenium. I feel very fortunate to
have had the opportunity to view the operation of the service
center model, the future of health care delivery, first hand.

Service Center Approach 58
References
Barlett, D. (1997). Preparing for the Coming Consumer
Revolution in Health Care. Journal of Health Care Finance^
23(4), 33-39.
Beerman, R., Bensell, A., Breeden, A., Denker, A., Gallego,
G., Harvin, V., Kontz, M., Krueger-Jones, J., Martin, M., Mass,
J., Oza, K., Perdue, M., Rogers, J., Sears, S., Williams-Welch,
A. (1998). University of Miami/Jackson Memorial Medical Center
Restructures its health Care System for the 21st Century.
Nursing Administration Quarterly, 22(3), 18-65.
Carnegie, A. (1997). The Road to Business Success. In Krass,
P. (Ed.), The Book of Business Wisdom (pp. 3-9). New York: John
Wiley & Sons, Inc..
Duffy, J., Lemieux, K. (1995). A Cardiac Service Line
Approach to Patient-Centered Care. Nursing Administration
Quarterly, 20(1), 12-23.
Frommater, D., Marshall, D., Halford, G., Rimmasch, H.,
Coons, M. (1995). How a Three-Campus Heart Service Line Improves
Clinical Processes and Outcomes. Joint Commission on
Accreditation of Healthcare Organizations, 21(6), 263-276.
Goodman, R., Campbell, K., Millar, W., Cook, J., Jennings,
N., Rimmer, J. Evans, B. (1998). The EEF and its Use in Service
Line Evaluation. Army Medical Department Journal, Jul-Sep, 2-8.
Griffith, J. (1995) . The Well-Managed Health Care
Organization (3rd ed.). Ann Arbor, Michigan: AUPHA Pres/Health
Administration Press.

Service Center Approach 59
HCIA (1999, February 4). 100 Top Hospitals Named for 1998
[WWW document]. http://www2.hcia.com/newsline
Hensley, S. (1999, February 22 ). Tenet lays off 200 at
Philadelphia hospitals. Modern Healthcare, 29:8, 22.
Herzlinger, R. (1997). Market-Driven Health Care: Who Wins,
Who Loses in the Transformation of America's Largest Service
Industry. New York: Addison-Wesley Publishing Company, Inc..
Herzlinger, R. (1998). The Managerial Revolution in the U.S.
Health Care Sector: Lessons from the U.S. Economy. Health Care
Management Review, 23(3), 19-29.
Hiebeler, R., Kelly, T., Ketteman, C. (1998). Best
Practices. New York: Simon & Schuster.
lacocca, L., Novak, W. (1984). lacocca: An Autobiography.
New York: Bantam Books.
Johnston, C, Cooper, P. (1997). Patient-Focused Care: What
Is It? Holistic Nursing Practice, 11(3), 1-7.
Kibbe, D., Smith, P., LaVallee, R., Bailey, D., Bard, M.
(1997). A guide to finding and evaluating best practices health
care information on the Internet: The truth is out there? The
Joint Commission Journal on Quality Improvement, 23(12), 678-
689.
Kimble, J. (1997). Issues in Patient-Focused Care for the
Respiratory Care Practitioner. Holistic Nursing Practice, 11(3),
21-30.
Kirkhart, D. (1995). Shared Care: Improving Health Care,
Reducing Costs. Nursing Management, 26(6), 26-32.

Service Center Approach 60
Kongstvedt, P. (1996). The Managed Health Care Handbook (3rd
ed.). Gaithersburg, Maryland: Aspen Publishers Inc..
Kovner, A. (1995). Jonas's Health Care Delivery in the
United States (5th ed.). New York: Springer Publishing Company.
Lanza, M., Binus, G., McMillan, F. (1997). Quality Plan for
a Product Line. Journal of Nursing Care Quality, 12(2), 27-32.
Macintyre, K., Kleman, C. (1994). Measuring Customer
Satisfaction. In Mclaughlin, C, Kaluzny, A. (Ed.), Continuous
Quality improvement in Health Care (pp. 102-126). Gaithersburg,
Maryland: Aspen Publishers, Inc..
Mailkot, C. (1996). Reengineering: Avoiding the pitfalls and
Overcoming the barriers. Nursing Management, 27, 48-49.
Mancini, M. (1995). Patient-Focused Care: A Response to the
Healthcare Crisis. Journal of Intravenous Nursing, 18, 307-316.
Morrissey, J. (1998, December 7). All benchmarked out: Even
the top 100 hospitals can't find many more ways to be more
productive. Modern Healthcare, 38-46.
Mueller, J., Marinari, B., Kunkel, S. (1995). Flipping
Assumptions and Revisioning Perioperative Services. Journal of
Nursing Administration, 25(3), 22-26.
Murphy, L. (1995). Mercy Healthcare's CARE 2000: An
evolution in progress. Nursing Administration, 20(1), 47-80.
Niles, N., Tarbox, G., Schults, W., Swartz, W., Wolf, E.,
Robb, J., Plume, S., Nelson, E., Nugent, W. (1996). Using
Qualitative and Quantitative Patient Satisfaction Data to
Improve the Quality of Cardiac Care. The Joint Commission
Journal on Quality Improvement, 22, 323-335.

Service Center Approach 61
Patronis-Jones, R. (1997). Foreword. Holistic Nursing
Practice, 11(3), vi-vii.
Patronis-Jones, R. (1997). Multidisciplinary Collaboration:
Conceptual Development as a Foundation for Patient-Focused Care.
Holistic Nursing Practice, 11 (3), 8-16.
Patronis-Jones, R., Doughtery, M., Martin, S. (1997).
Program Evaluation of a Unit Re-engineered for Patient^Focused
Care. Holistic Nursing Practice, 11(3), 31-46.
Pence, M. (1997). Patient-Focused Models of Care. Journal of
Obstetric, Gynecologic, & Neonatal Nursing, 26, 320-326.
Reisdorfer, J. (1996). Building a Patient-Focused Care Unit.
Nursing Management, 27(10), 38-44.
Rouch, B., Stafford, R. (1996). Implementing a Patient-
Focused Care Delivery Model. Journal of Nursing Staff
Development, 12, 208-212.
Sanminiatelli, M. (1999, March 28). Hospital looks to cut
costs. The Daily Progress, pp. Bl,2.
Stern, H. (1999, March 29). Cut health care costs through
outsourcing. Federal Computer Week, , 15,23.
University HealthSystem Consortium (1997). 1997 Service
Center Study. UHC Organizational Structure Analysis
Walton, M. (1986). The Deming Management Method. New York:
The Putnam Publishing Company.
Waters, B., Young, G. (1997). Fast, Flexible, and Fluid: The
Continuing Success of the Charlotte-Mecklenburg Hospital
Authority in an Era of Public Hospital Crisis. Journal of Health
Care Finance, 23, 51-59.

Service Center Approach 62 }
Weitekamp, M., Thorndyke, L., McCollister, E. (1996).
Strategic Planning for Academic Health Centers. The American
Journal of Medicine, 101, 309-315.
Williams, S., Torrens, P. (1993). Introduction to Health
Services (4th ed.). Albany, New York: Delmar Publishers Inc.
>

Service Center Approach 63
Footnotes
^ A dramatic illustration is the automobile industry where
health care benefits for autoworkers increased to approximately
$600 per automobile, which amounts to as much as seven percent
of the sticker price (lacocca and Novak, 1984).
^ Health insurance basically started in 1929 when Baylor
Hospital in Texas offered 1,500 teachers prepaid health care
coverage (Kongstvedt, 1996).
^ In 1910, Western Clinic in Tacoma, Washington started what
was considered to be the first Health Maintenance Organization
(HMO) with a $.50 per member per month fee (Kongsveldt, 1996).
Initiatives such as this were few until the 1970's. A primer
for generating greater interest in managing care was the HMO Act
of 1973. Through this act, incentives were provided such as
start-up funding and access to employer-based insurance. As
expected, this move was met with resistance from physicians.
Physicians thought this to be the practice of "'cooperate
medicine" and interfered with their autonomy to treat the
patient. However, as more health plans moved in this direction,
physicians felt pressured to succumb to the movement or be left
out all together.
^ The ptoduct line approach is a management structure that
is a decentralized multi-disciplinarily method to providing a
product or service. It is a change from a centralized based
structure where tasks are accomplished by specialists that then
send to the next group of specialists to perform their task in

Service Center Approach 64
completing the product or service. The Product-line approach
empowers control to those who are directly involved with the
process. (Lanza, et al., 1997)
^ ''Focused factories" is a concept that came about in the
early 1970's. Wickham Skinner published an article on this
method in the 1974 issue of the Harvard Business Review.
Skinner states that one of the solutions to solving the
productivity dilemma is, "Learning to structure basic
manufacturing policies and supporting services so that they
focus on one explicit manufacturing objective instead of many
inconsistent, conflicting, implicit objectives." He argued that
complex and overly ambitious factories were at the heart of the
country's productivity crisis. The advantages mentioned with
this approach is the ability to provide higher quality health
care at lower costs. Herzlinger states that, "The ease of
evaluating the price and quality of care provided by focused
factories will cause ferocious competition to break out among
[health care organizations]." (Herzlinger, 1998)
^ The analysis was conducted by two health care management
and consulting firms, HCIA and William M. Mercer, Incorporated.
HCIA is a Baltimore-based health care information company and
Mercer is a New York-based human resources management consulting
firm. This annual benchmark study started in 1993 and has been
evolving since then. The study analyzes areas of clinical,
operational and financial performance. The data was obtained
from the 1997 Medicare cost and discharge data from 3,258 acute
Service Center Approach 65
care hospitals. (Morrissey, 1998)
'^ Industries have been using this approach for several
decades. The automobile industry moved to this concept when
fierce competition moved in from Japan in the 1970's. It was
its only way to survive. "Successful automobile executives
learned to pay attention to the customer. Automobile dealers
who paid attention to customers' complaints about their sales
process found that busy, well-informed Americans did not enjoy
haggling over prices." (Herzlinger, 1998)
^ Jim McGowan has extensive experience in health care. He
has been Director of Respiratory Therapy and Respiratory Care at
three separate institutions over the past 20 years. He is
currently the Service Center Administrator for Surgical Services
at UVaMC. Jim McGowan has various degrees from 5 academic
institutions. His most recent is an MBA from Strayer
University, Washington D.C. (1994). Currently, he is pursing an
Executive Doctoral degree in Healthcare Administration through
the Medical University of South Carolina, Charleston, South
Carolina.
^ Jim McGowan felt that this range should be more than
adequate based on his experience in respiratory care and
knowledge of site 3 and their respiratory care FTE requirements.
^° The average salary was calculated based on the average
pay range for each Respiratory Care role. The percentage of
personnel in each role was calculated and the average salary for
that role was applied and totaled based on the percentage of

Service Center Approach 66
personnel in each role. The roles were Respiratory Therapist
Supervisor, Respiratory Therapist, and Respiratory Technician.
The average salary was calculated to be $36,354. After the
total estimated salary was calculated, a benefits cost of 23% of
the average salary was applied. This brought the total average
cost of a Respiratory Care FTE to be $44,716. Jim McGowan felt
that this was a good approximation for the average payment for a
Respiratory Care FTE.
^^ The standard deviation was taken and divided by the
sample size to give the standard error of the mean. This was
then multiplied by three to give the upper and lower limits.