Embed Size (px)
Citation preview

GRADING PRACTICES:
WHAT ADMISSIONS OFFICERS
NEED TO KNOW
NAFSA Conference, Vancouver
Pat Parker
Iowa State University
Emily Tse
International Education Research Foundation
2011
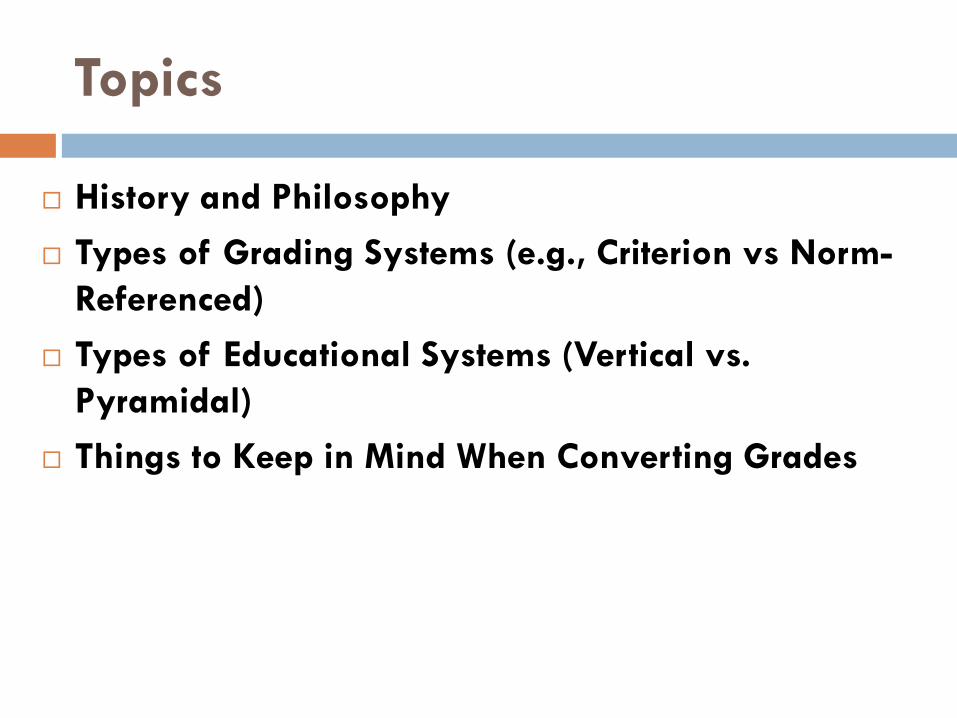
Topics
History and Philosophy
Types of Grading Systems (e.g., Criterion vs Norm-
Referenced)
Types of Educational Systems (Vertical vs.
Pyramidal)
Things to Keep in Mind When Converting Grades
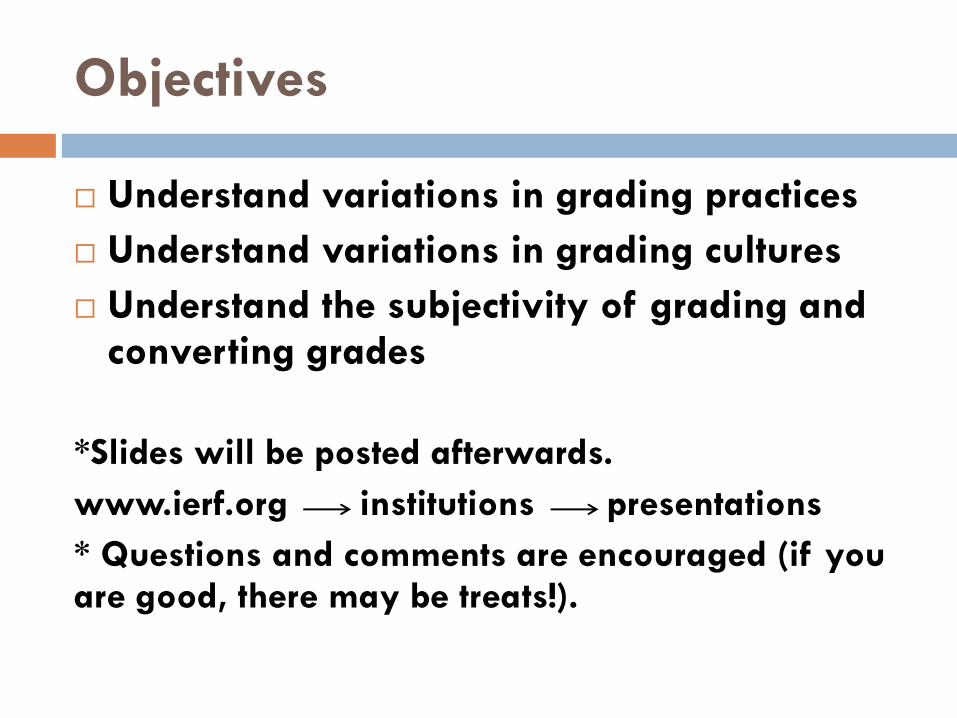
Objectives
Understand variations in grading practices
Understand variations in grading cultures
Understand the subjectivity of grading and converting grades
*Slides will be posted afterwards.
www.ierf.org institutions presentations
* Questions and comments are encouraged (if you are good, there may be treats!).

Historical Overview
Religious texts
Civil service / professional exams
Oral assessments
Written examinations (18th century)
China: national and written examinations

Philosophies
Instructional
Diagnosis
Gatekeeping
Next grade or level (China, France, Japan)
Sought-after subjects (India, Germany)
Accountability
School and teacher performance (England,
British Columbia)
Allocation of resources (China, Ontario)
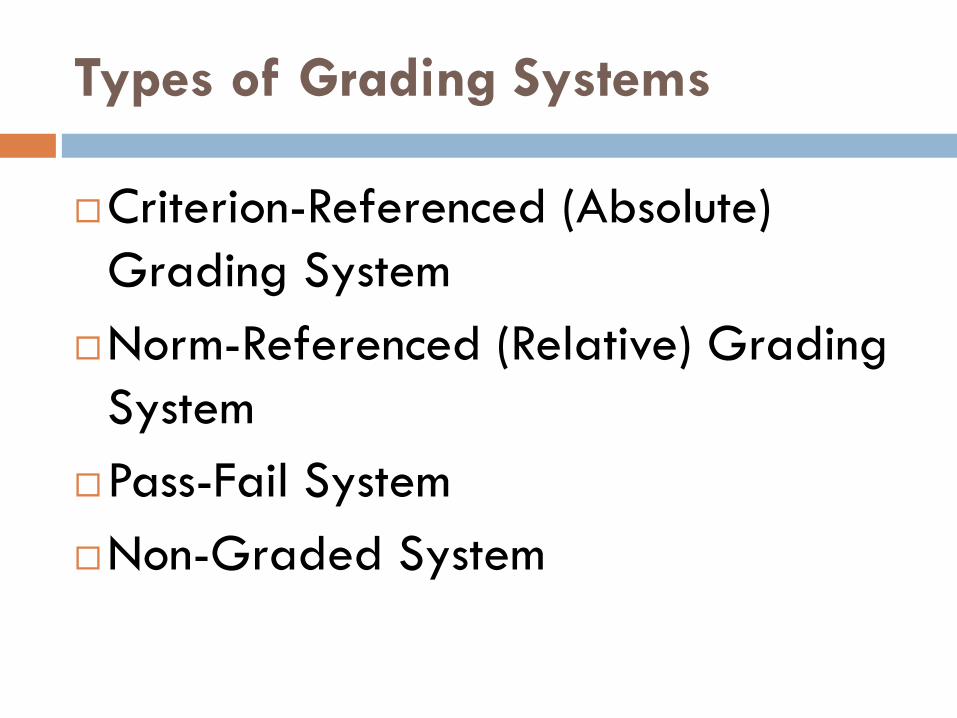
Types of Grading Systems
Criterion-Referenced (Absolute)
Grading System
Norm-Referenced (Relative) Grading
System
Pass-Fail System
Non-Graded System
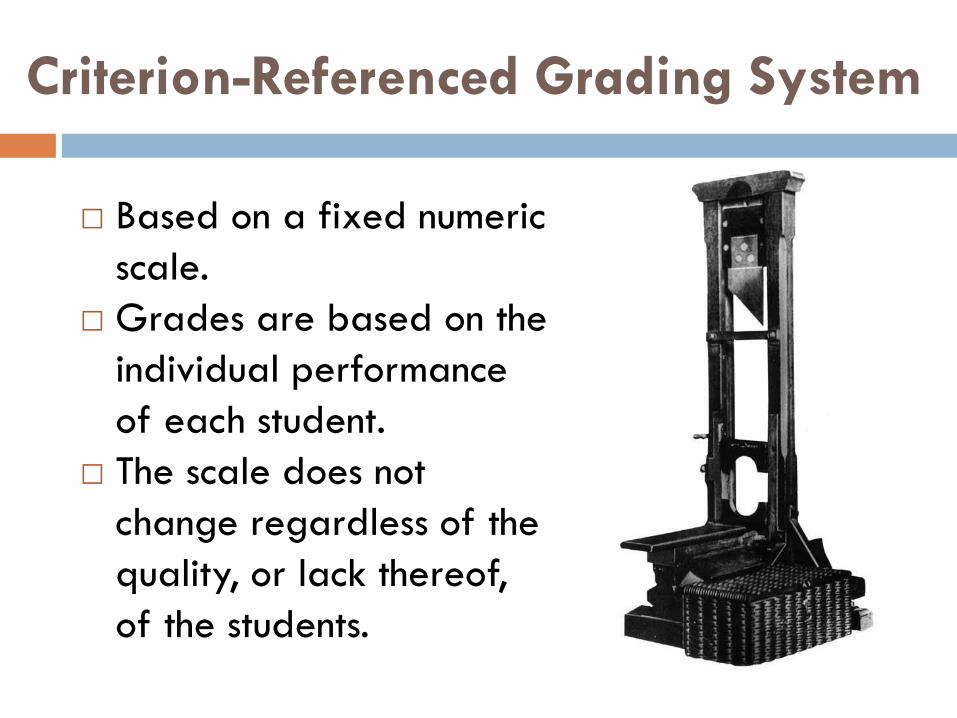
Criterion-Referenced Grading System
□ Based on a fixed numeric
scale.
□ Grades are based on the
individual performance
of each student.
□ The scale does not
change regardless of the
quality, or lack thereof,
of the students.

Example: Indonesia
Notice the
KKM column
(Criteria for
Minimum
Completion).
These are
minimum
scores set
for
competency.
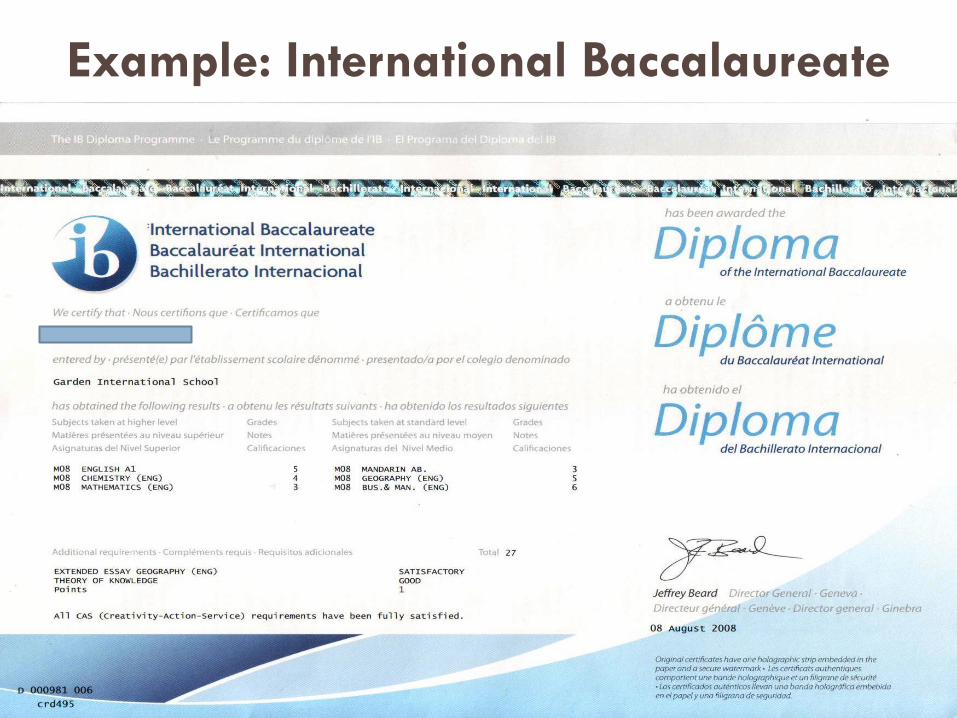
Example: International Baccalaureate
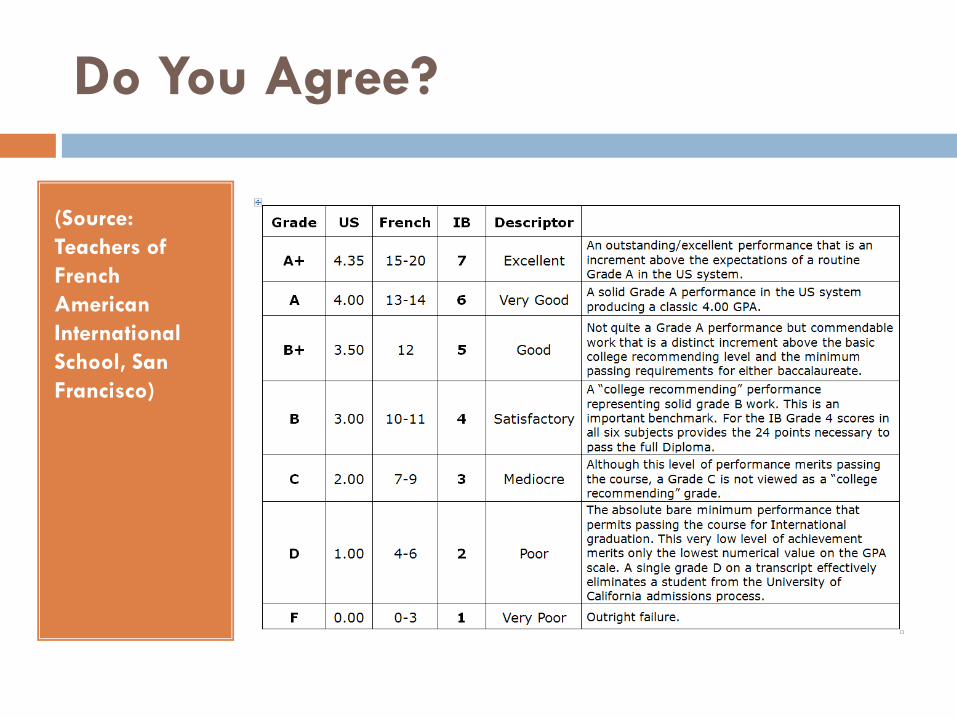
Do You Agree?
(Source:
Teachers of
French
American
International
School, San
Francisco)

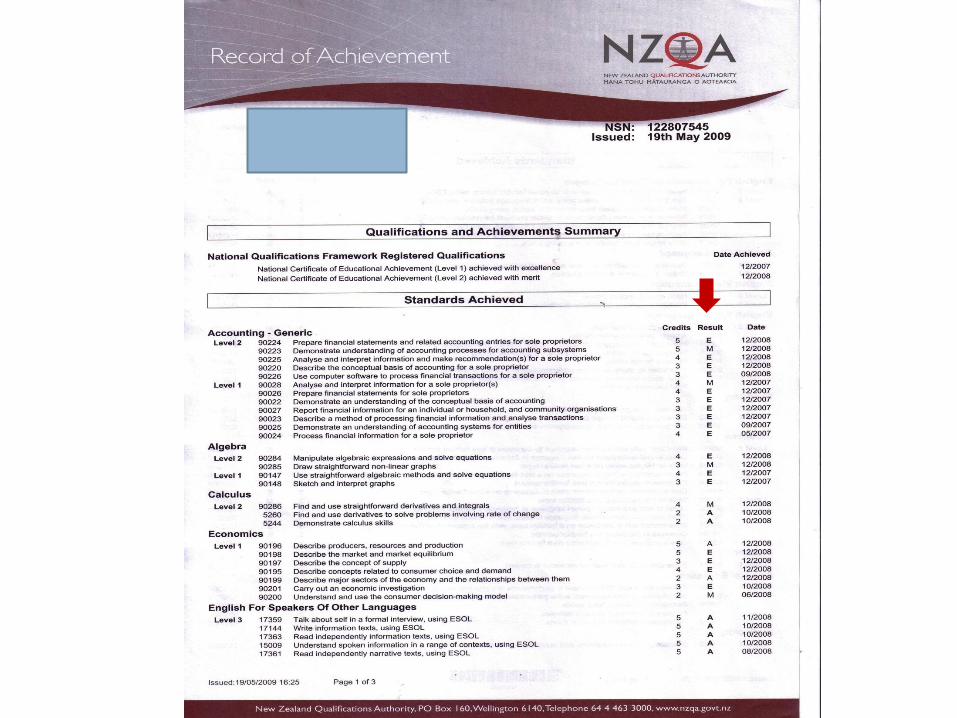
Example: New Zealand
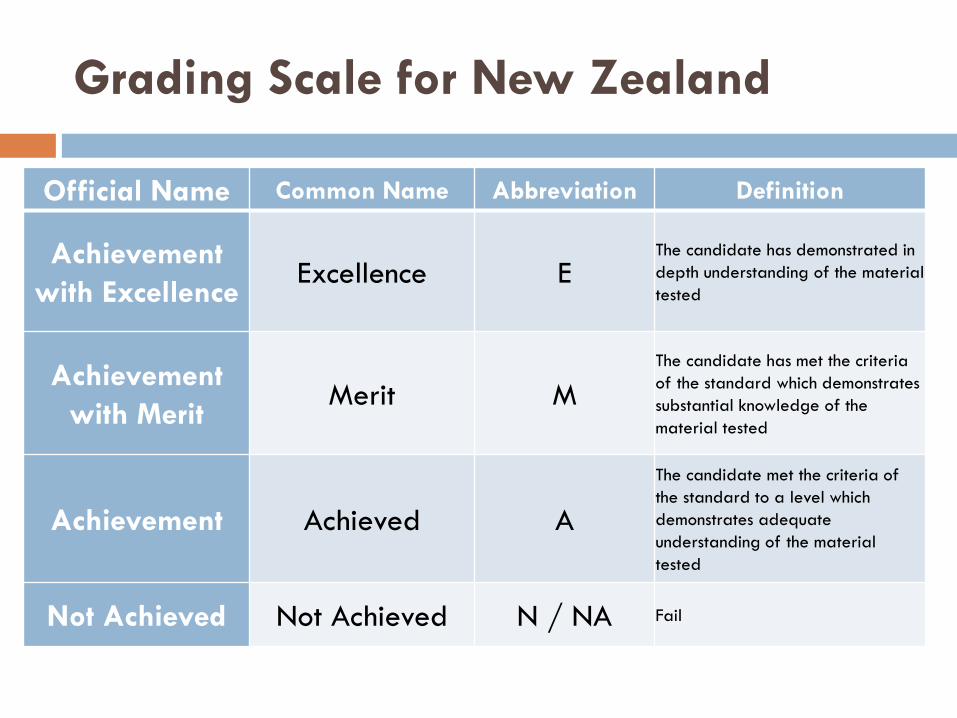
Grading Scale for New Zealand
Official Name Common Name Abbreviation Definition
Achievement
with Excellence Excellence E
The candidate has demonstrated in
depth understanding of the material
tested
Achievement
with Merit Merit M
The candidate has met the criteria
of the standard which demonstrates
substantial knowledge of the
material tested
Achievement Achieved A
The candidate met the criteria of
the standard to a level which
demonstrates adequate
understanding of the material
tested
Not Achieved Not Achieved N / NA Fail

Case Study: Criterion-Referenced
Grade
%
A 90-100%
B 80-89%
C 70-79%
D 60-69%
F 0-59%
Let’s look at the grades of two
students in a specific class.
Billy: 72
Jane: 67
You’re probably thinking, “won’t be admitting those students!”
But what if the course was Quantum Physics and was taught by Stephen Hawking,
and these were the top grades in the class; the rest of the class earned scores lower
than 65%?
On the other hand, let’s say the course was Music Appreciation, and students only
had to turn in their notes once a week, and take an open book test at the end. The
average grade in the class was an 89%. Totally different story, eh?
Criterion referenced grades do not tell you the whole story either.

Norm-Referenced Grading System
Based on a pre-established
formula regarding the
percentage or ratio of
students within a whole
class who will be assigned
each grade or mark.
The students are actually in
competition.
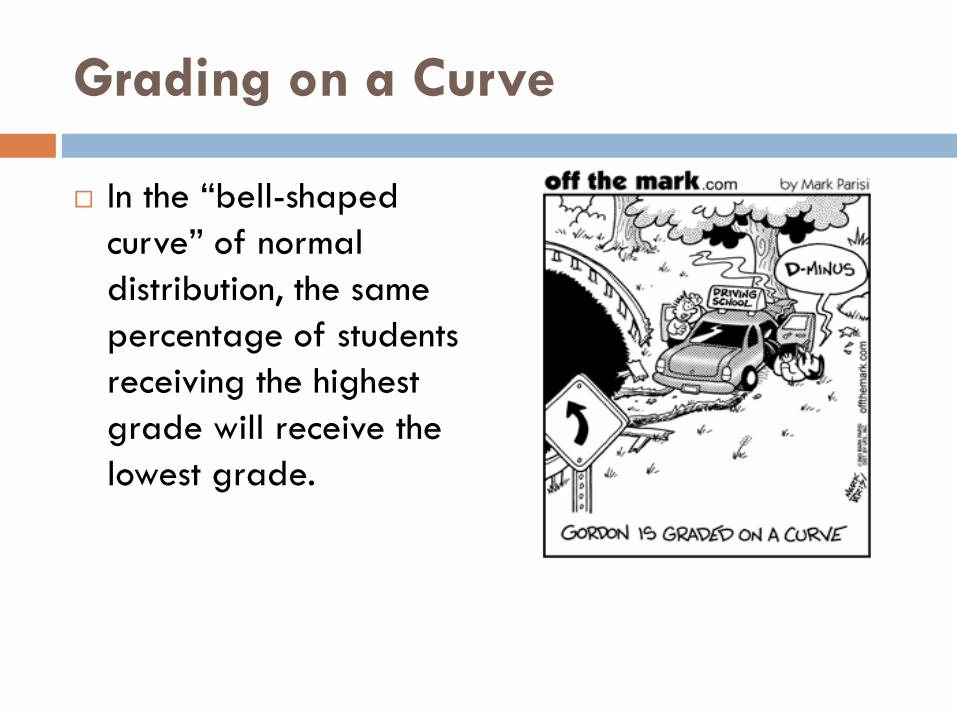
Grading on a Curve
In the “bell-shaped
curve” of normal
distribution, the same
percentage of students
receiving the highest
grade will receive the
lowest grade.

Bell-Shaped Curve
Grade % of Class
A (Excellent) Top 10%
B (Good) Next 20%
C (Average) Next 40%
D (Poor) Next 20%
F (Failure) Bottom 10%

Example: ECTS Credits
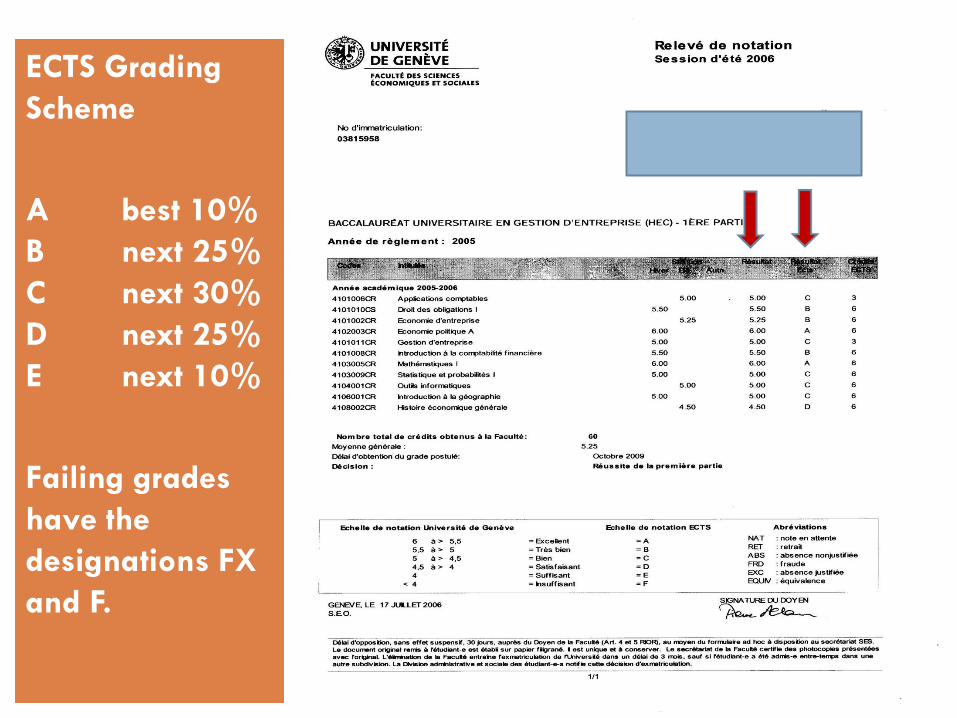
ECTS Grading
Scheme
A best 10%
B next 25%
C next 30%
D next 25%
E next 10%
Failing grades have the
designations FX and F.
ECTS Grading
Scheme
A best 10%
B next 25%
C next 30%
D next 25%
E next 10%
Failing grades
have the
designations FX
and F.
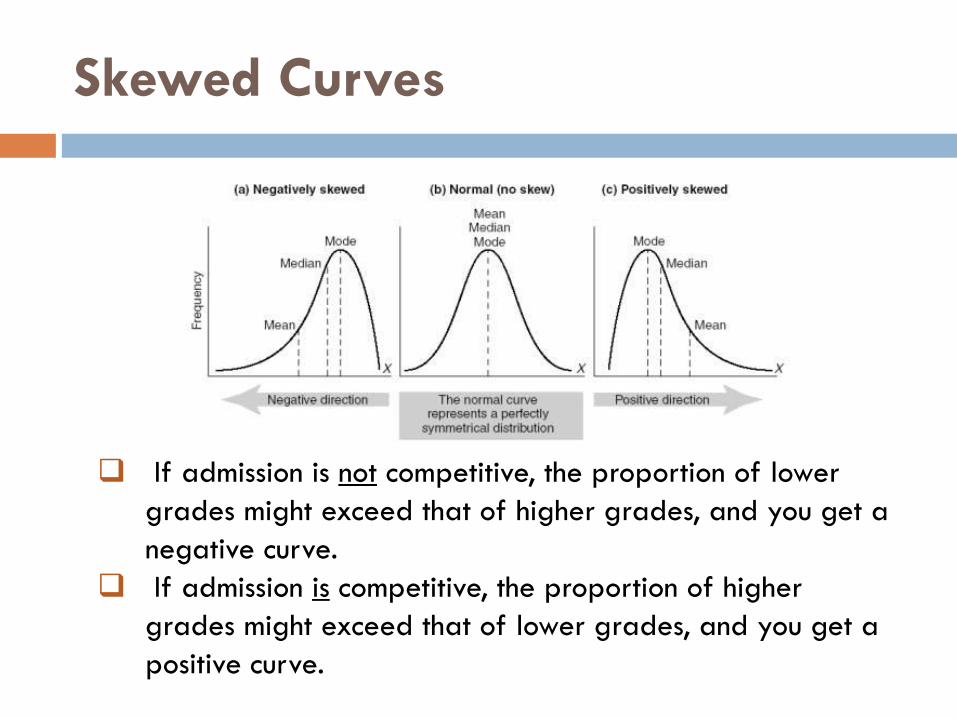
Skewed Curves
If admission is not competitive, the proportion of lower
grades might exceed that of higher grades, and you get a
negative curve.
If admission is competitive, the proportion of higher
grades might exceed that of lower grades, and you get a
positive curve.
Activity
Name the national capitals of the following countries:
1. United States
2. Mexico
3. France
4. Nigeria
5. India
6. Italy
7. China
8. South Korea
9. Egypt
10. Afghanistan
Answers
National capitals of the following countries:
1. United States (Washington DC)
2. Mexico (Mexico City)
3. France (Paris)
4. Nigeria (Abuja) (was Lagos until 1991)
5. India (New Delhi)
6. Italy (Rome)
7. China (Beijing)
8. South Korea (Seoul)
9. Egypt (Cairo)
10. Afghanistan (Kabul)

Our Grading Scale
Each question is worth 10 points. Count up your number of correct answers and write down that number. Using the scale below, assign a letter grade.
A = 90-100
B = 80-89
C = 70-79
D = 60-69
F = 50-59
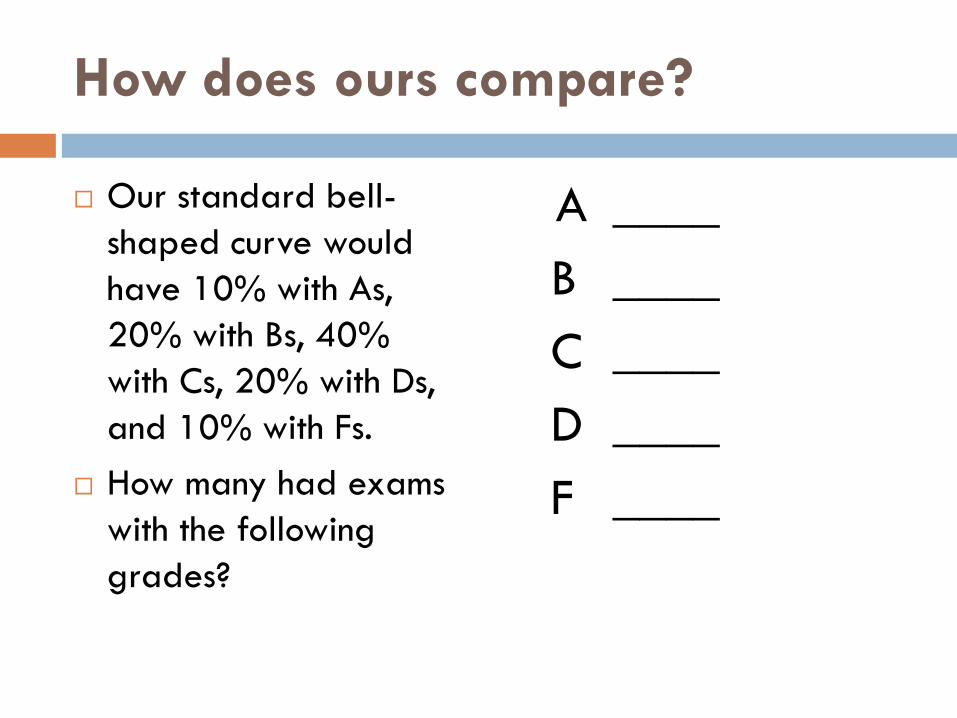
How does ours compare?
Our standard bell-
shaped curve would
have 10% with As,
20% with Bs, 40%
with Cs, 20% with Ds,
and 10% with Fs.
How many had exams
with the following
grades?
A ____
B ____
C ____
D ____
F ____
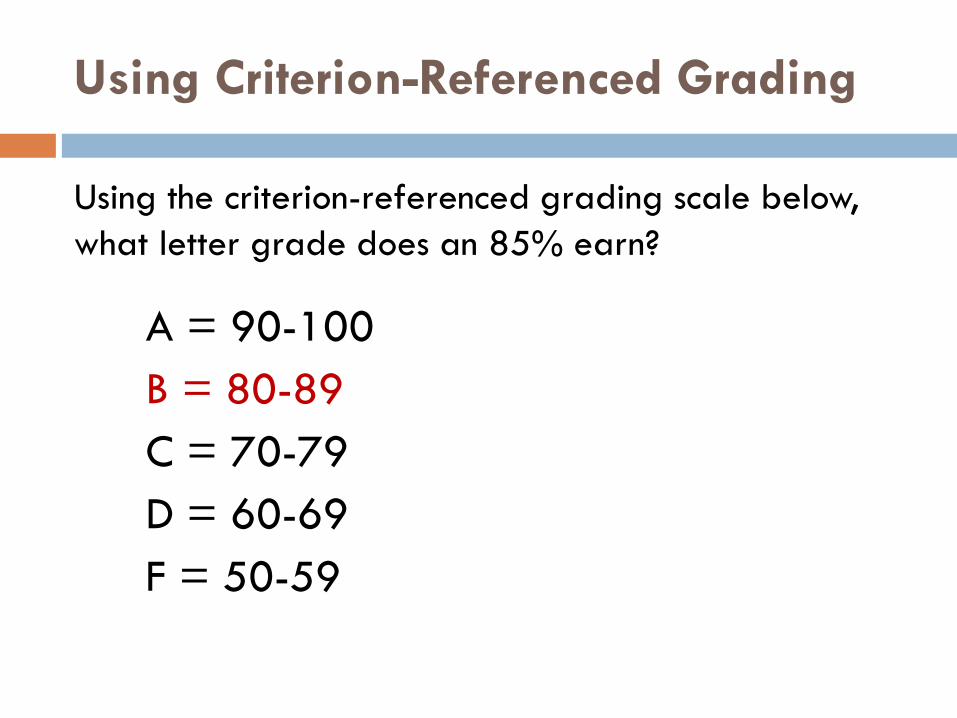
Using Criterion-Referenced Grading
Using the criterion-referenced grading scale below,
what letter grade does an 85% earn?
A = 90-100
B = 80-89
C = 70-79
D = 60-69
F = 50-59
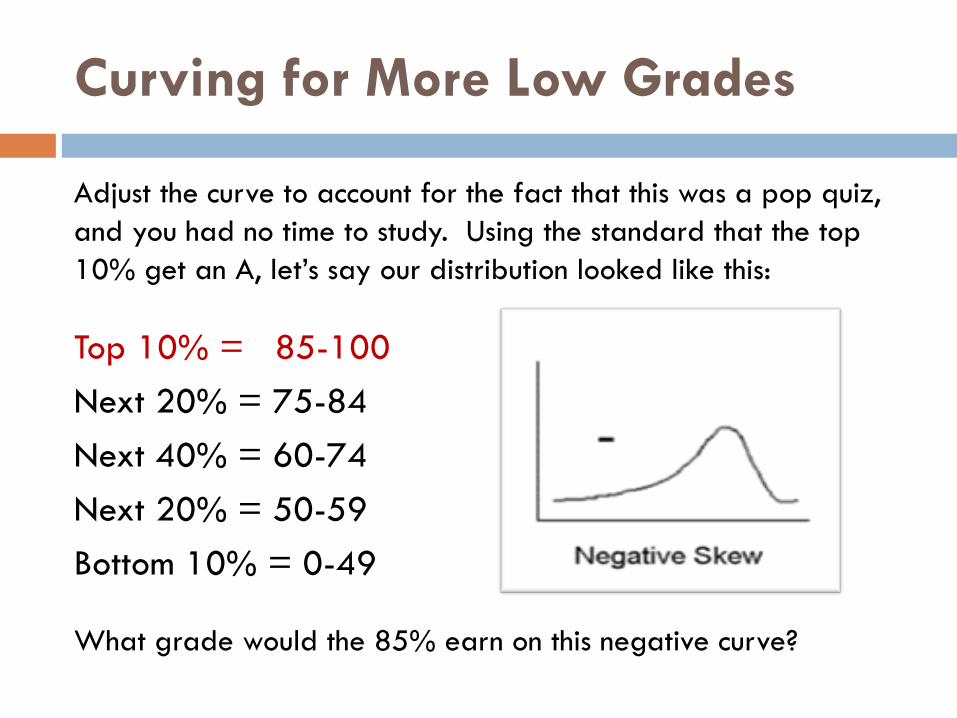
Curving for More Low Grades
Adjust the curve to account for the fact that this was a pop quiz,
and you had no time to study. Using the standard that the top
10% get an A, let’s say our distribution looked like this:
Top 10% = 85-100
Next 20% = 75-84
Next 40% = 60-74
Next 20% = 50-59
Bottom 10% = 0-49
What grade would the 85% earn on this negative curve?
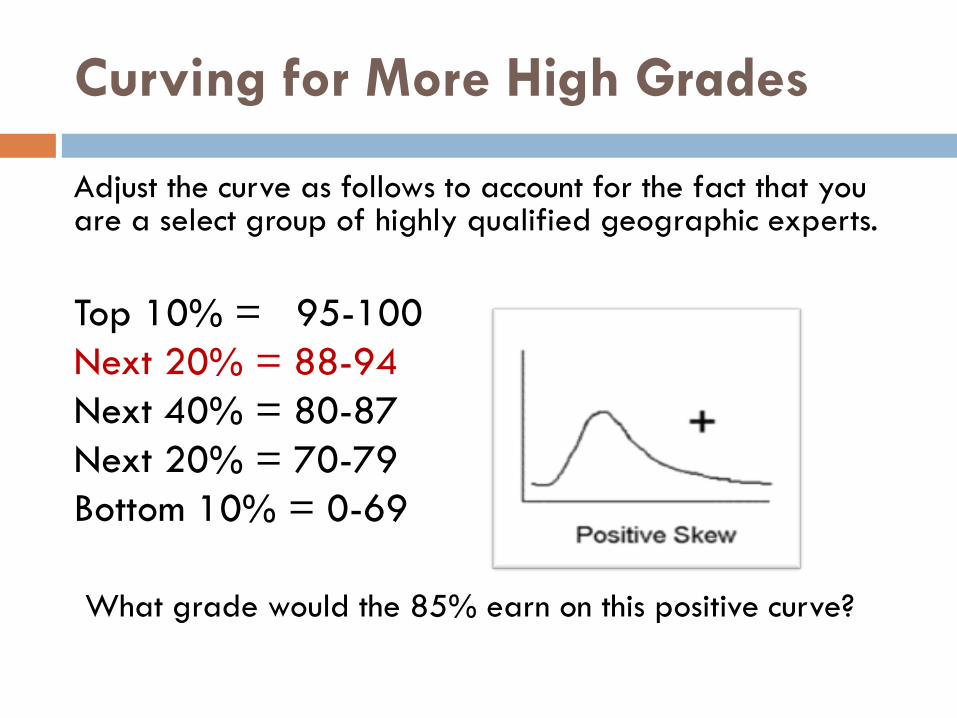
Curving for More High Grades
Adjust the curve as follows to account for the fact that you are a select group of highly qualified geographic experts.
Top 10% = 95-100
Next 20% = 88-94
Next 40% = 80-87
Next 20% = 70-79
Bottom 10% = 0-69
What grade would the 85% earn on this positive curve?
Same Test, Same Score . . .
Using a criterion-referenced grading scale,
you earned a B.
Using norm-referencing on a negative curve,
you earned an A.
Using norm-referencing on a positive curve,
you earned a C.
Different Grade!
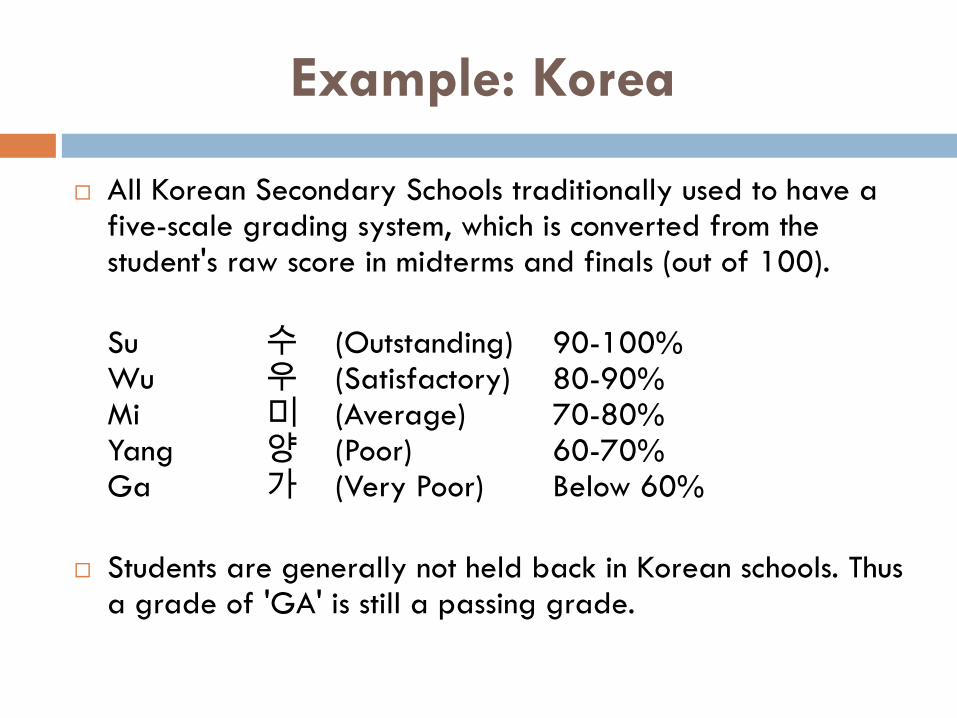
Example: Korea
All Korean Secondary Schools traditionally used to have a five-scale grading system, which is converted from the student's raw score in midterms and finals (out of 100).
Su 수 (Outstanding) 90-100% Wu 우 (Satisfactory) 80-90% Mi 미 (Average) 70-80% Yang 양 (Poor) 60-70% Ga 가 (Very Poor) Below 60%
Students are generally not held back in Korean schools. Thus a grade of 'GA' is still a passing grade.
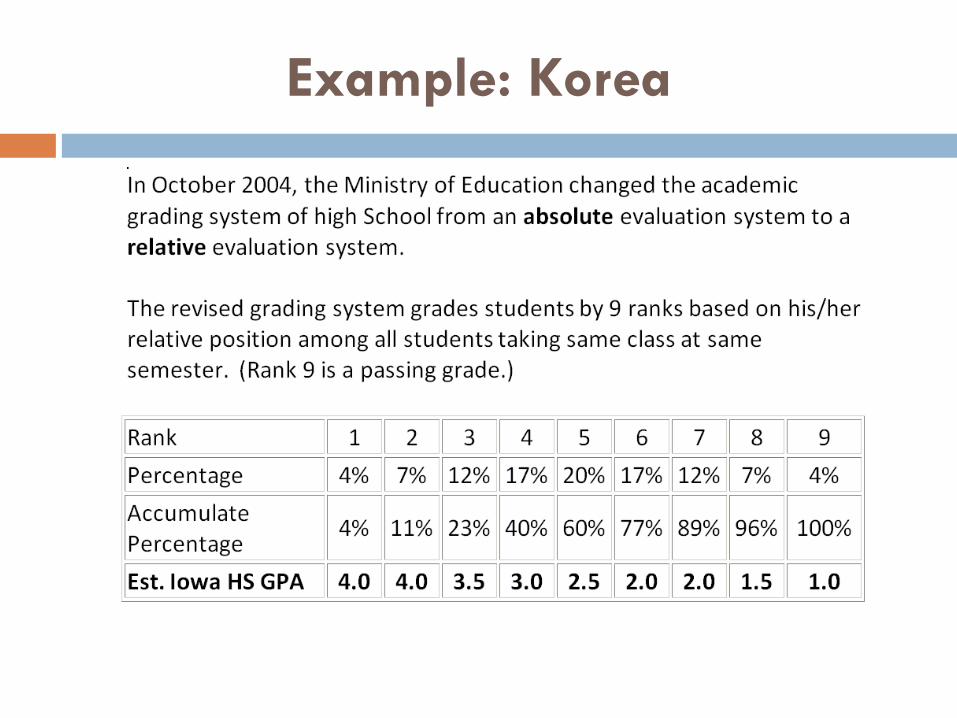
Example: Korea
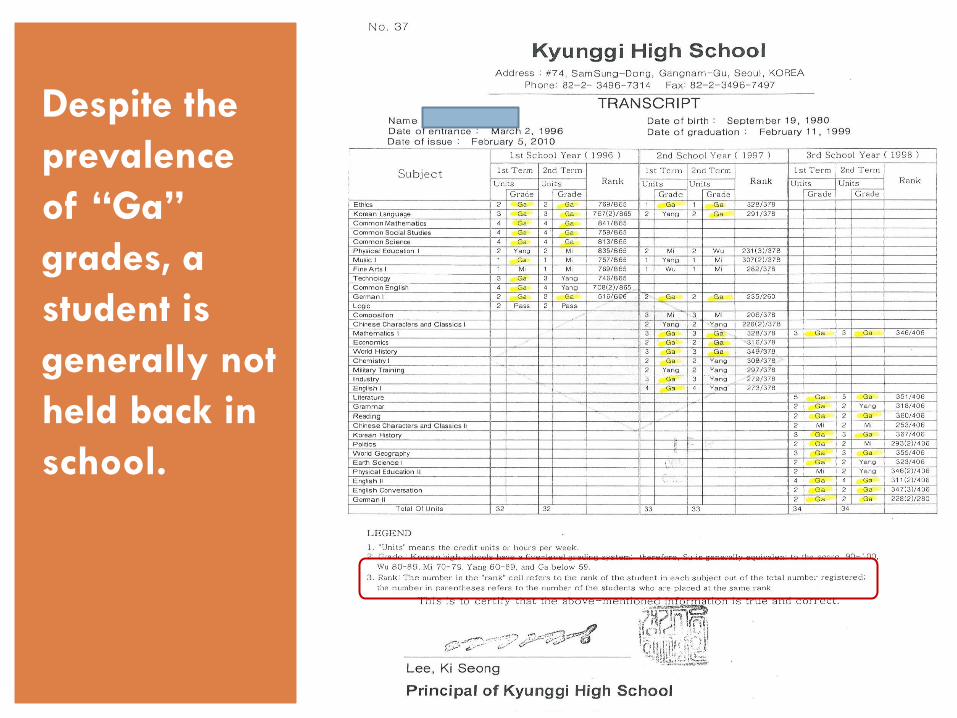
Despite the
prevalence
of “Ga”
grades, a
student is
generally not
held back in
school.

Case Study: US State University
%
90-99
80-89
70-79
60-69
50-59
40-49 X
30-39 X
20-29 X
10-19
0-9 X X A B C D F
Here are the
percentage of
grades actually
given annually in
a US university.
Looks like the
previous
conversion looks
close (even a
little tough).
Apples to Apples?
But what if we told you that you were comparing
grades from an engineering class where most
students are from the top 10% of their high school
classes to students in a vocational school working
toward an electrician certificate for which
completion of high school is the only entry
requirement?
Norm-referenced systems don’t tell you the whole
story. Context is important.
Types of Educational Systems
Vertical
Pyramidal
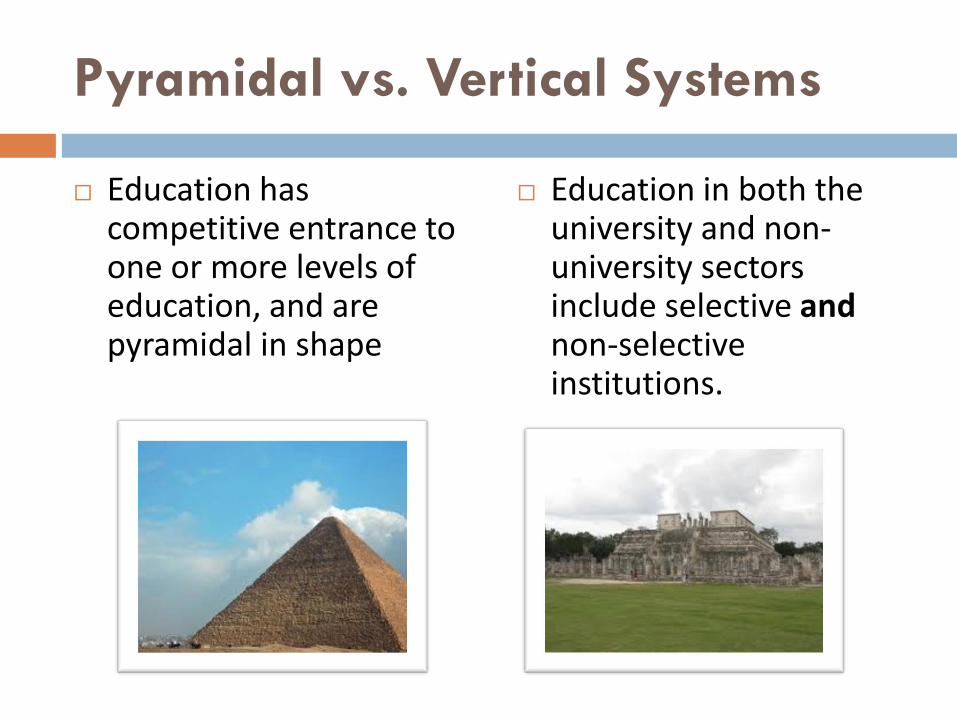
Pyramidal vs. Vertical Systems
Education has competitive entrance to one or more levels of education, and are pyramidal in shape
Education in both the university and non-university sectors include selective and non-selective institutions.
Vertical Educational Systems
Large % of secondary
graduates qualify for
higher education.
Lowest passing grade
in scale is usually the
equivalent of “D” on
U.S. A-F scale.
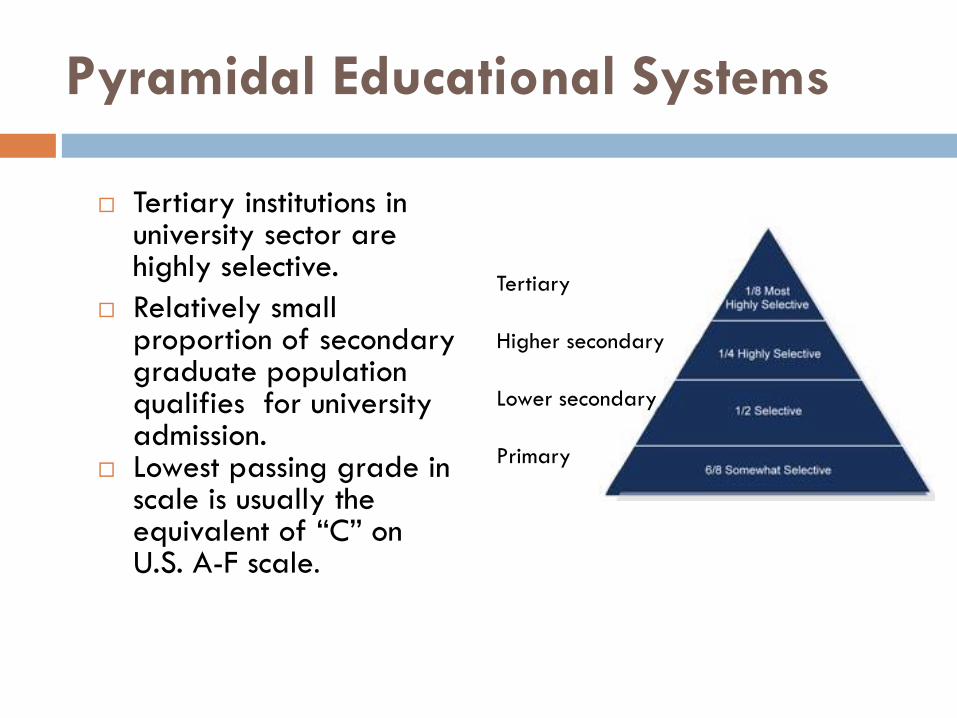
Pyramidal Educational Systems
Tertiary institutions in university sector are highly selective.
Relatively small proportion of secondary graduate population qualifies for university admission.
Lowest passing grade in scale is usually the equivalent of “C” on U.S. A-F scale.
Tertiary
Higher secondary
Lower secondary
Primary
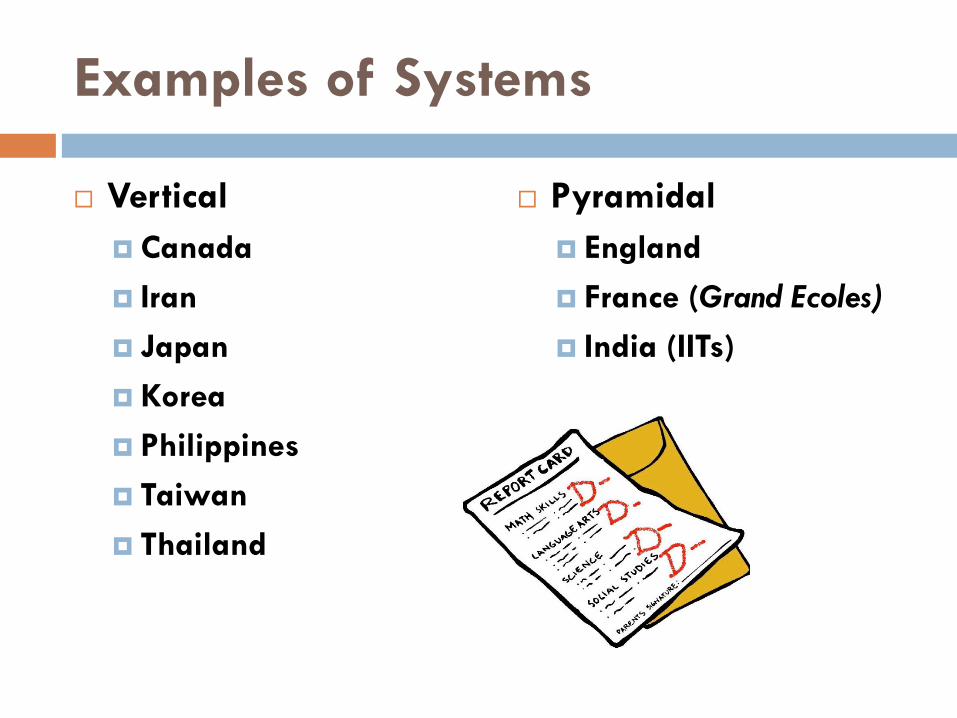
Examples of Systems
Vertical
Canada
Iran
Japan
Korea
Philippines
Taiwan
Thailand
Pyramidal
England
France (Grand Ecoles)
India (IITs)
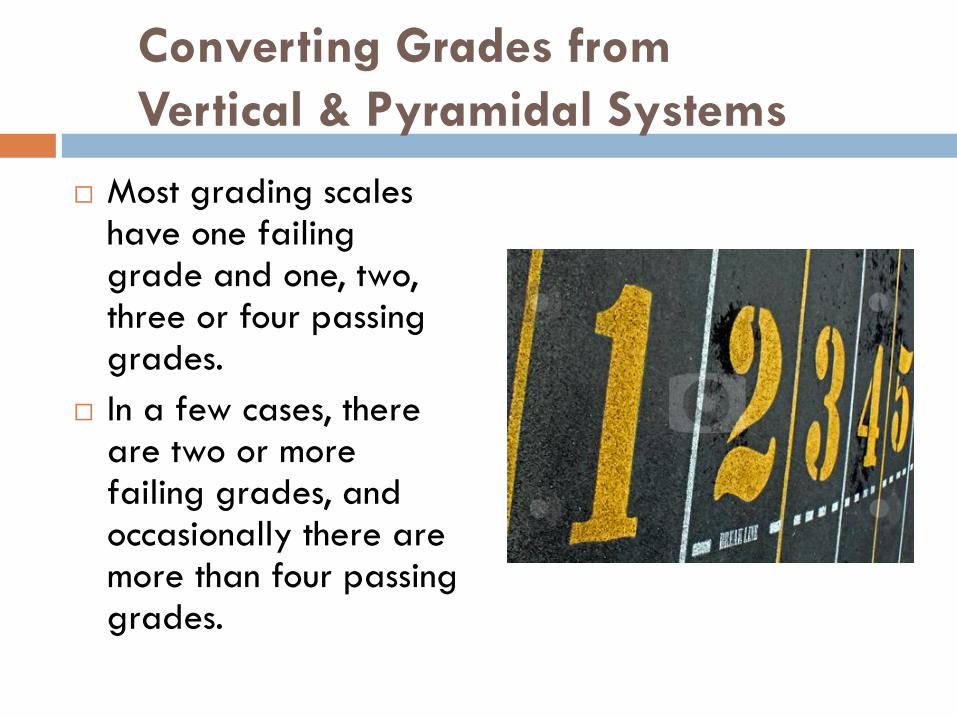
Converting Grades from
Vertical & Pyramidal Systems
Most grading scales have one failing grade and one, two, three or four passing grades.
In a few cases, there are two or more failing grades, and occasionally there are more than four passing grades.

Vertical Educational System
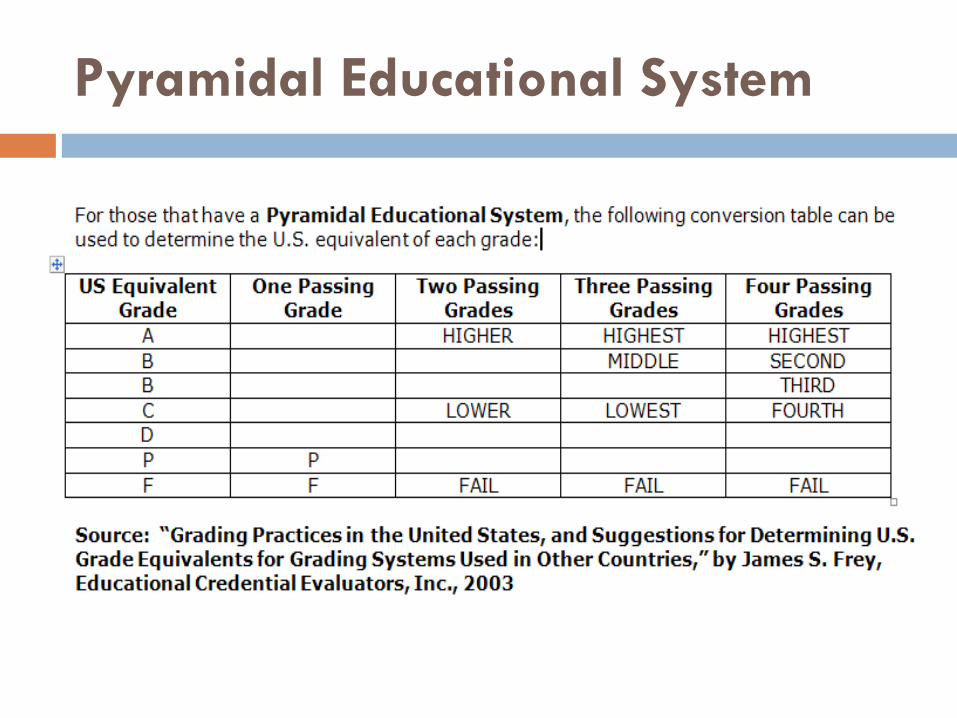
Pyramidal Educational System

Case Study: China
Pyramidal or vertical?
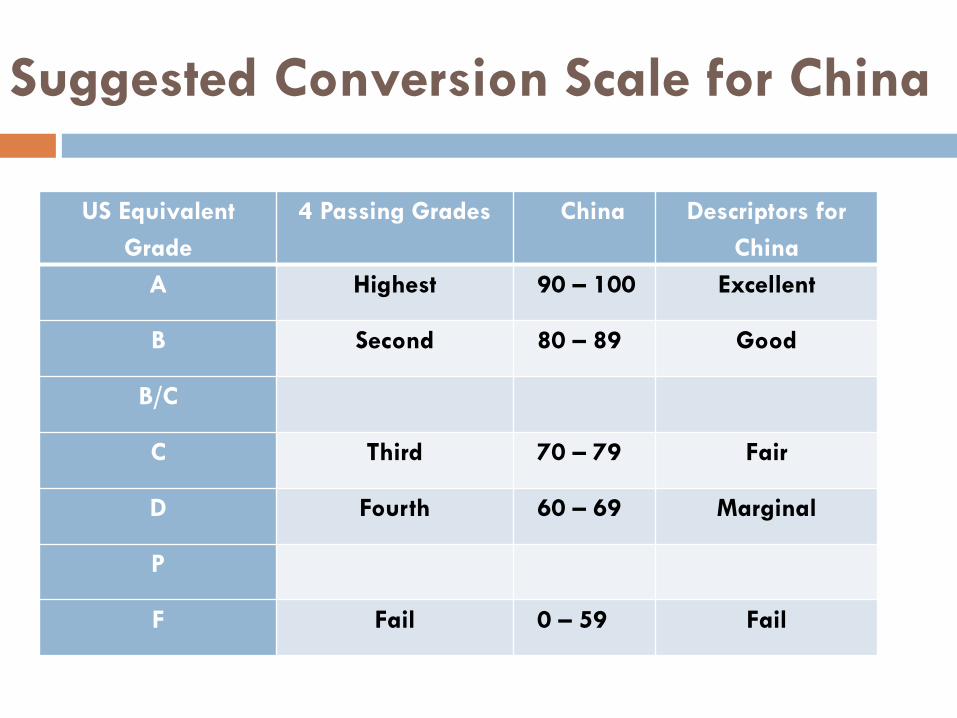
Suggested Conversion Scale for China
US Equivalent
Grade
4 Passing Grades China Descriptors for
China
A Highest 90 – 100 Excellent
B Second 80 – 89 Good
B/C
C Third 70 – 79 Fair
D Fourth 60 – 69 Marginal
P
F Fail 0 – 59 Fail

Things to Keep in Mind
When Interpreting Grades
Distributions can be skewed.
Grading systems can be non-
continuous.
Subjectivity
Variations

Distributions Can Be Skewed
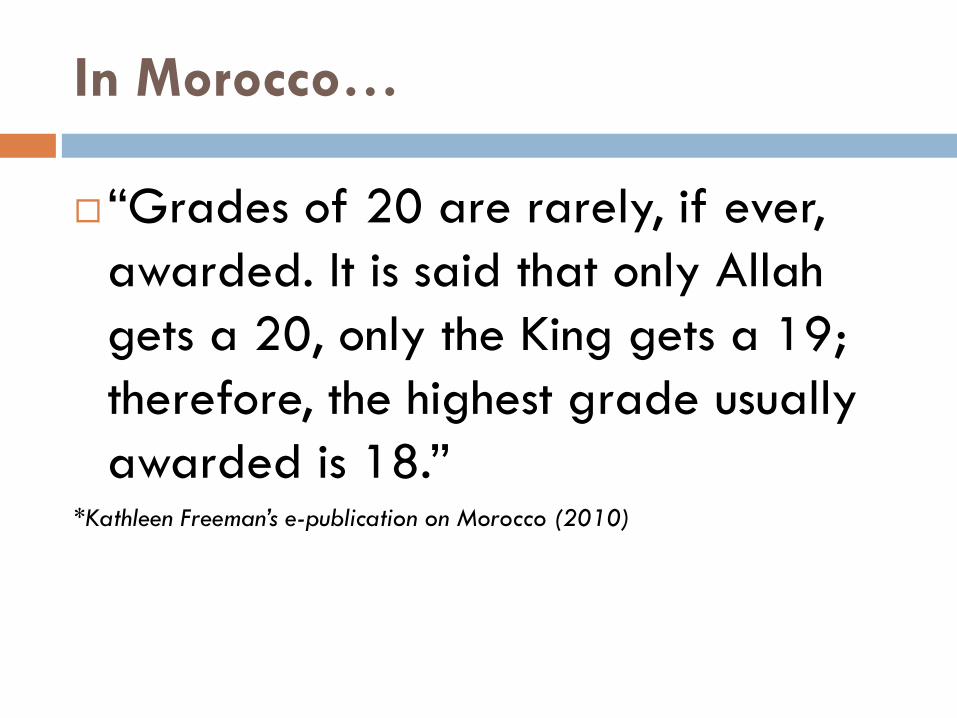
In Morocco…
“Grades of 20 are rarely, if ever,
awarded. It is said that only Allah
gets a 20, only the King gets a 19;
therefore, the highest grade usually
awarded is 18.” *Kathleen Freeman’s e-publication on Morocco (2010)
Things to Keep in Mind
When Interpreting Grades
Grading scales can be non-
continuous.
Example: degree classifications vs
cumulative GPAs
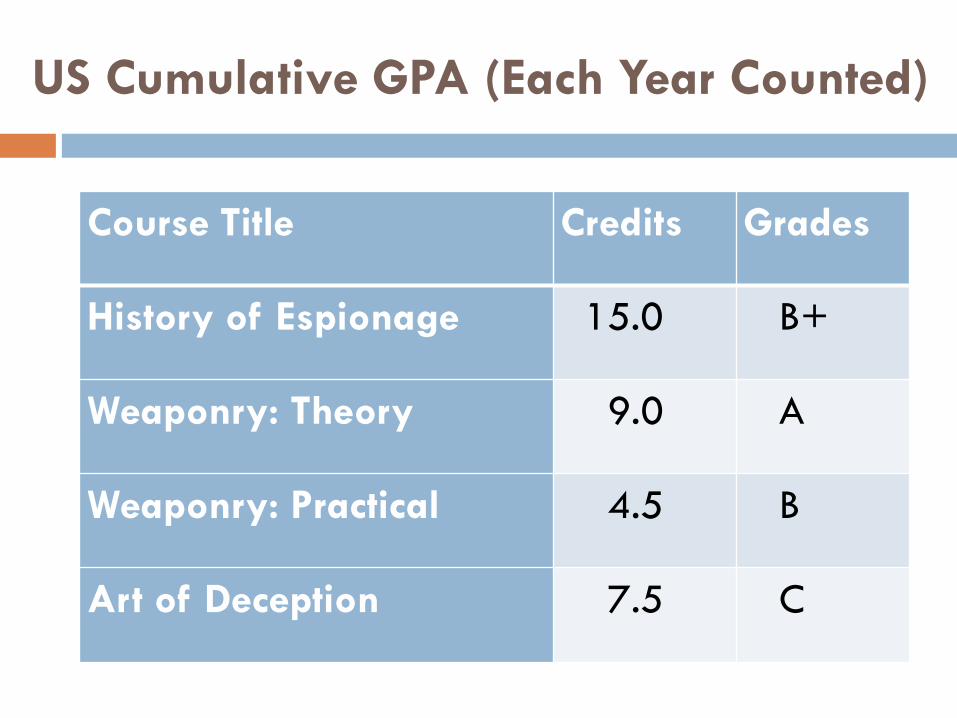
US Cumulative GPA (Each Year Counted)
Course Title Credits Grades
History of Espionage 15.0 B+
Weaponry: Theory 9.0 A
Weaponry: Practical 4.5 B
Art of Deception 7.5 C
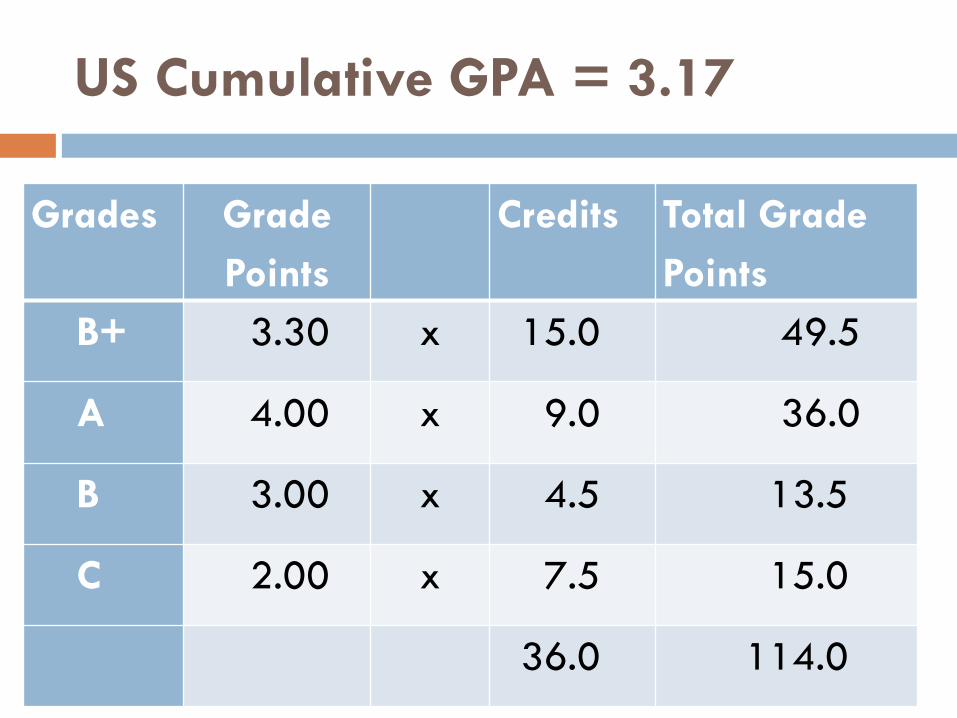
US Cumulative GPA = 3.17
Grades Grade
Points
Credits Total Grade
Points
B+ 3.30 x 15.0 49.5
A 4.00 x 9.0 36.0
B 3.00 x 4.5 13.5
C 2.00 x 7.5 15.0
36.0 114.0
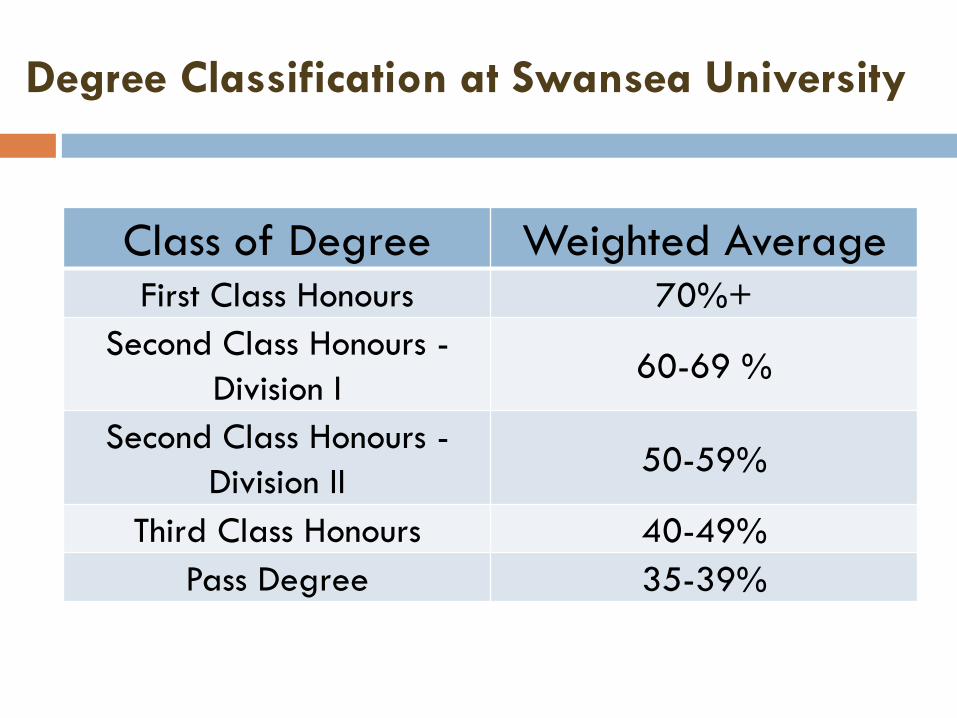
Degree Classification at Swansea University
Class of Degree Weighted Average First Class Honours 70%+
Second Class Honours -
Division I 60-69 %
Second Class Honours -
Division II 50-59%
Third Class Honours 40-49%
Pass Degree 35-39%
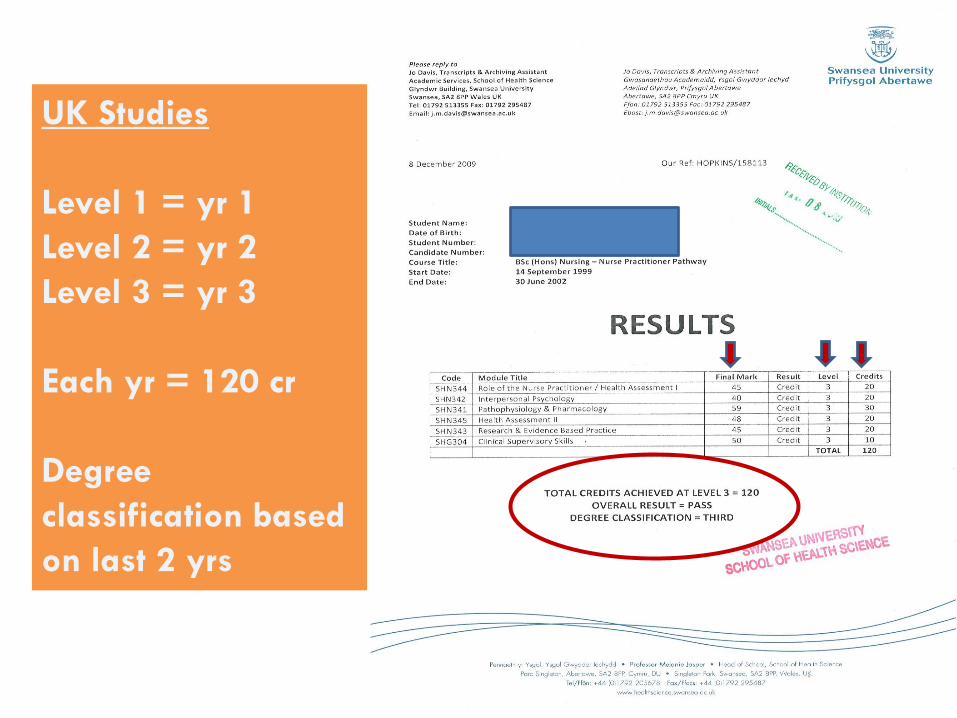
UK Studies
Level 1 = yr 1
Level 2 = yr 2
Level 3 = yr 3
Each yr = 120 cr
Degree
classification based
on last 2 yrs

Calculation of Degree Classification
for 3-year programs
• Weighting of 3: best marks achieved in 80 credits
pursued at Level 3
• Weighting of 2: remaining 40 credits pursued at
Level 3 and the best marks achieved in 40 credits
pursued at Level 2
• Weighting of 1: remaining 80 marks pursued at
Level 2
• A formula is then applied to calculate the degree
classification average.
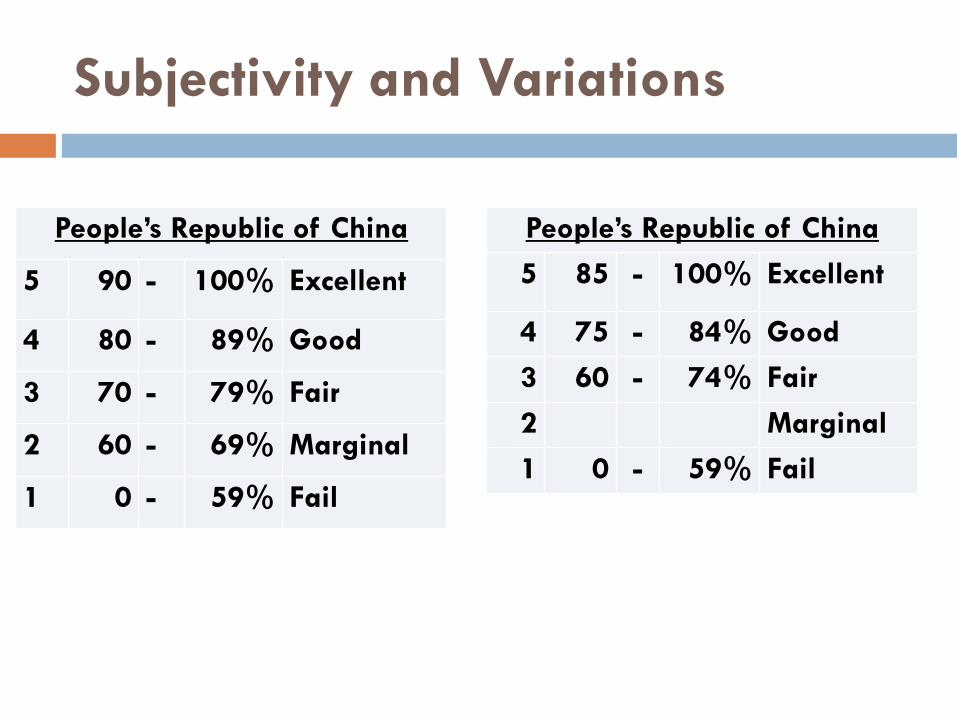
Subjectivity and Variations
People’s Republic of China
5 90 - 100% Excellent
4 80 - 89% Good
3 70 - 79% Fair
2 60 - 69% Marginal
1 0 - 59% Fail
People’s Republic of China
5 85 - 100% Excellent
4 75 - 84% Good
3 60 - 74% Fair
2 Marginal
1 0 - 59% Fail

US Grading Practices
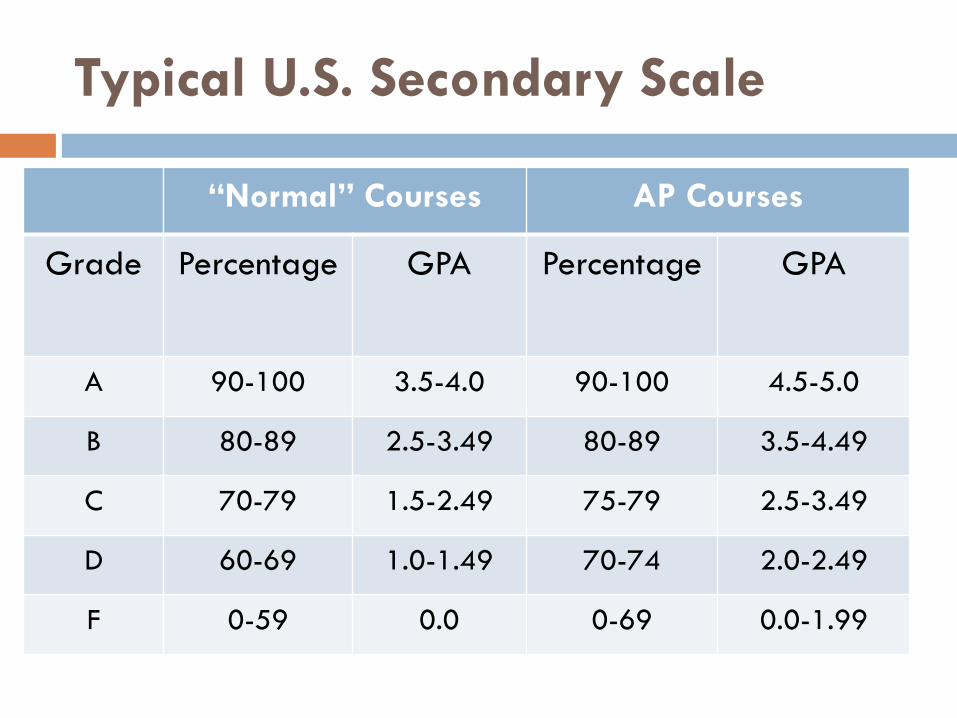
Typical U.S. Secondary Scale
D is lowest passing for high school
“Normal” Courses AP Courses
Grade Percentage GPA Percentage GPA
A 90-100 3.5-4.0 90-100 4.5-5.0
B 80-89 2.5-3.49 80-89 3.5-4.49
C 70-79 1.5-2.49 75-79 2.5-3.49
D 60-69 1.0-1.49 70-74 2.0-2.49
F 0-59 0.0 0-69 0.0-1.99

Typical U.S. University Scale
C is usually lowest passing for undergraduate study
B is usually lowest passing for graduate study
Grade Description Grade Points
A Excellent, outstanding, superior,
distinction
4.0 4.0
A- 3.7
B+ Above average, good, better than
average, very good
3.3
B 3.0 3.0
B- 2.7
C+ Average, adequate, satisfactory,
fair
2.3
C 2.0 2.0
C- 1.7
D+ Barely passing, below average,
inferior, lowest passing, marginal,
poor, inadequate
1.3
D 1.0 1.0
D- 0.7
F Failing, unsatisfactory 0.0 0.0
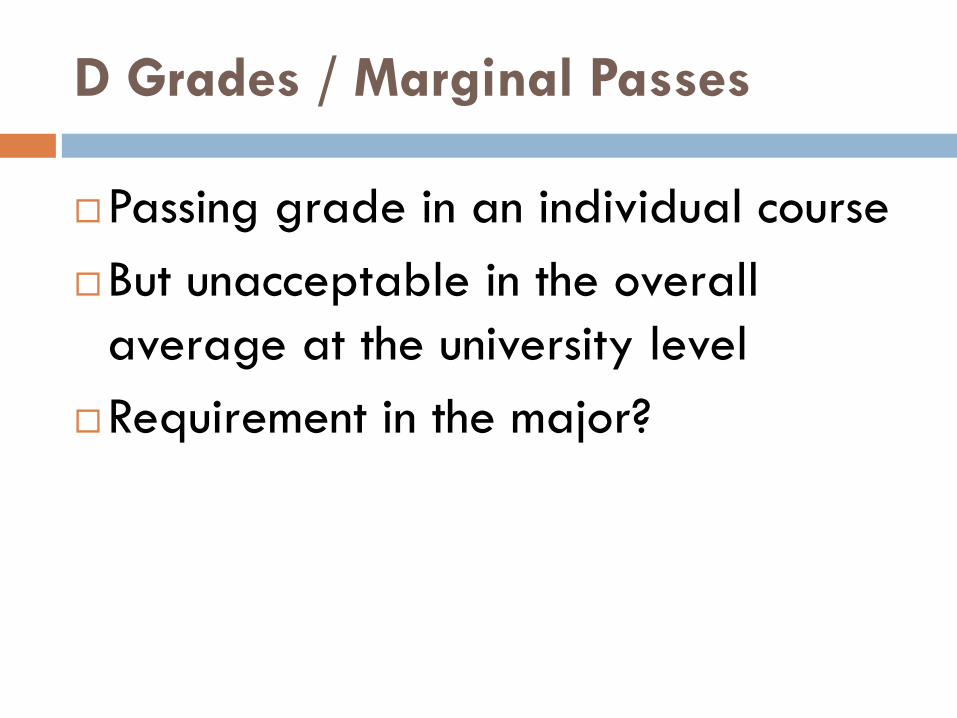
D Grades / Marginal Passes
Passing grade in an individual course
But unacceptable in the overall
average at the university level
Requirement in the major?

France: Conceded Passes
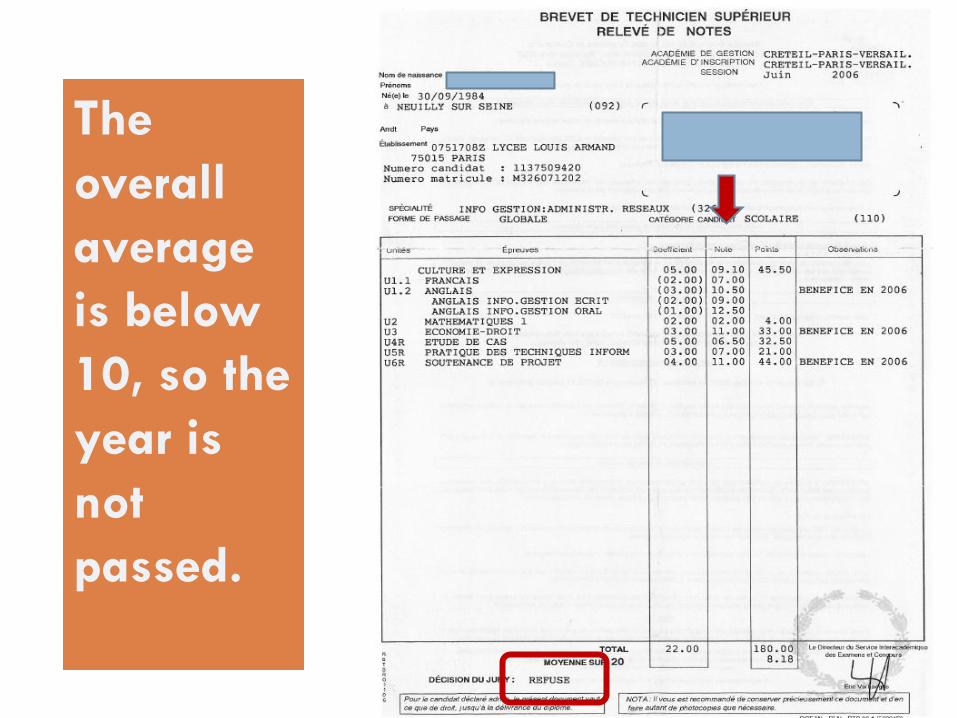
The
overall
average
is below
10, so the
year is
not
passed.
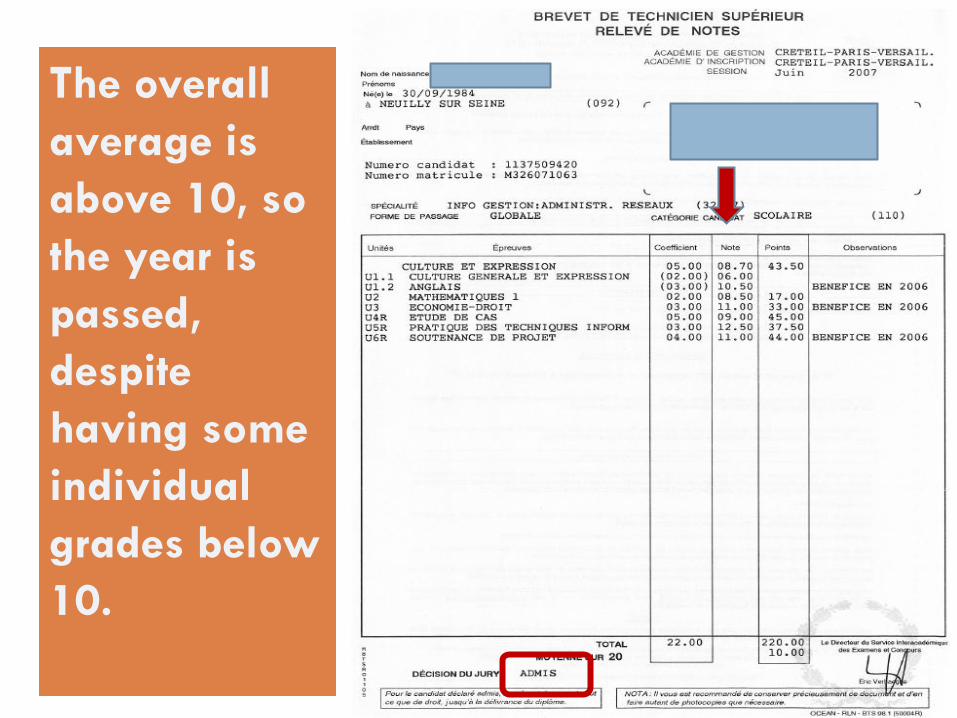
The overall
average is
above 10, so
the year is
passed,
despite
having some
individual
grades below
10.
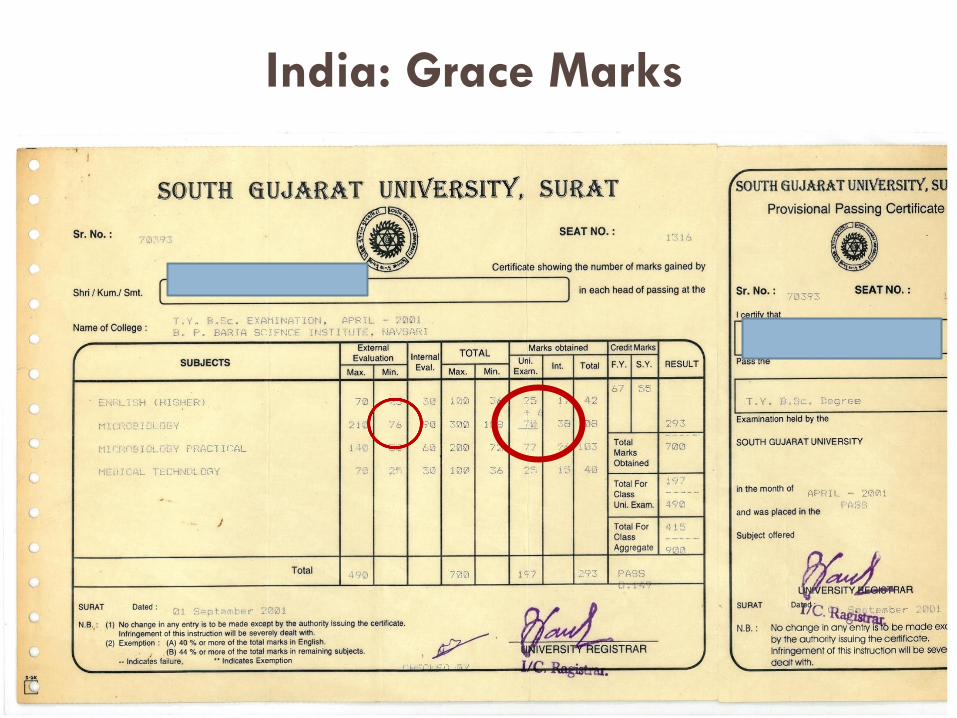
India: Grace Marks
Interpreting Grades
Get as much information as possible (often transcripts have information listed at the bottom or the back).
Identify the lowest passing and failing grades.
Determine the distribution and range of grades.

Take Away’s
We grade for reasons that may have nothing to do with student performance.
Students can take the same test, perform the same, yet be assessed in entirely different ways.
It is imperative for the admission officer to understand the context in which the grading occurs.
Grading conversion cannot be reduced to a mathematical formula.
Bibliography
Center for Teaching and Learning (1991). “Grading Systems,” For Your
Consideration: Suggestions and Reflections on Teaching and Learning, No.
10. University of North Carolina at Chapel Hill.
Jim Frey (2003). Grading Practices in the United States, and Suggestions
for Determining US Grade Equivalents for Grading Systems Used in Other
Countries. ECE Insights.
Guy Haug (1997). “Capturing the Message Conveyed by Grades:
Interpreting Foreign Grades,” World Education News and Reviews, Vol.
10, No. 2.
Philip Nagy (2000). “The 3 Roles of Assessment: Gatekeeping,
Accountability and Instructional Diagnosis,” Canadian Journal of
Education 25, 4: 262-279.
Ben Willbrink (1997). “Assessment in Historical Perspective,” Studies in
Educational Evaluation, 23: 31-48.