Embed Size (px)
Citation preview

Educational Measurement: Issues and PracticeSummer 2013, Vol. 32, No. 2, pp. 26–36
Grading as a Reform Effort: Do Standards-Based GradesConverge With Test Scores?
Megan E. Welsh, University of Connecticut, Jerome V. D’Agostino, The Ohio StateUniversity, and Burcu Kaniskan, Pearson
Standards-based progress reports (SBPRs) require teachers to grade students using theperformance levels reported by state tests and are an increasingly popular report card format. Theymay help to increase teacher familiarity with state standards, encourage teachers to excludenonacademic factors from grades, and/or improve communication with parents. The current studyexamines the SBPR grade–state test score correspondence observed across 2 years in 125 thirdand fifth grade classrooms located in one school district to examine the degree of consistencybetween grades and state test results. It also examines the grading practices of a subset of 37teachers to determine whether there is an association between teacher appraisal style andconvergence rates. A moderate degree of grade–test score convergence was observed using threeagreement estimates (coefficient kappa, tau-b correlations, and classroom-level mean differencesbetween grades and test scores). In addition, only small amounts of grade–test score convergencewere observed between teachers; a much greater proportion of variance lay within classrooms andsubjects. Appraisal style correlated weakly with convergence rates, but was most strongly relatedto assigning students to the same performance level as the test. Therefore using recommendedgrading practices may improve the quality of SBPR grades to some extent.
Keywords: assessment, grading, multiple measures
S tandards-based progress reports (SBPRs) differ from tra-ditional letter grade, percentage, narrative, or pass/fail
report cards by requiring teachers to report student perfor-mance levels on specific educational goals instead of broadcontent areas. It is believed that if teachers must assess stu-dent progress on precise goals or objectives, they will be morelikely to focus their instruction on them as well. Therefore,SBPRs have emerged as a standards-based reform lever. Dis-tricts often implement SBPRs to provide a measure of stan-dards attainment that supplements state assessment scoresin helping parents to understand student achievement. Takentogether, SBPRs and state assessment scores can provide aricher description of academic progress than is provided withtraditional report cards.
SBPRs are increasing in popularity in part because they arebelieved to improve communication with parents (Guskey &Jung, 2009). Currently used in a wide array of school dis-tricts across the United States, SBPRs take a variety of forms.While they usually report performance on specific skills ratherthan broad content areas (e.g., rating grasp of number senseinstead of overall mathematics achievement) and abandontraditional letter grades in favor of other descriptors, SBPRs
Megan E. Welsh, Department of Educational Psychology, GentryBuilding Room 335, 249 Glenbrook Road, Unit 3064, Storrs, CT06269-3064; [email protected]. Jerome D’Agostino, Collegeof Education and Human Ecology, 210A Ramseyer Hall, 29 W.Woodruff Avenue, Columbus, OH 43210. Burcu Kaniskan, Pearson,19500 Bulverde Road, San Antonio, TX 78259-3701.
vary in their choice of skills and descriptors. Some SBPRsinclude many quite specific objectives (e.g., “multiplies two-digit numbers,” “identifies author purpose,” etc.) while othersuse a smaller number of more general terms (e.g., “numbersense,” “comprehension,” etc.) and districts might choose toadopt the performance level descriptors used on the stateassessment (e.g., “advanced,” “proficient,” “basic,” and “belowbasic”) while others use district-developed terms.
SBPRs are an established way of reporting student learning,and have been addressed in the literature for the past 20years (Clarridge & Whitaker, 1994; Guskey, 2001; Guskey &Bailey, 2009; Scriffiny, 2008). One established advantage ofSBPRs is that they improve communication about studentachievement, in particular helping teachers to differentiatebetween process, progress, and the quality of student workproducts (Guskey, 2001). They have emerged more recently asa standards-based reform lever in that they require teachersto become intimately familiar both with state standards andwith the performance level descriptors used on high-stakesassessments; one way to get teachers to focus their instructionon state standards is to mandate that they grade students onthem. However, as far as we know, the linkage between SBPRgrades and standards-based assessment scores has not beenexplored in the academic literature.
In addition, districts might use SBPRs to provide an alter-native measure of standards attainment that they can couplewith state test scores within a multiple measures framework.As such, we would expect convergence between grades andtest scores. The value in SBPR grades, however, lies in the
26 C© 2013 by the National Council on Measurement in Education

information provided about student performance that statetest scores do not capture: attainment of skills at differentpoints in the school year, performance on tasks that requirestudents to more deeply explore a skill, and/or the abilityto demonstrate knowledge in ways that paper and penciltests cannot address (Baker, 2003; Guskey, 2007). We firstaddress the literature on grade–test score convergence andthen further discuss the importance of including classroomassessment results as one of multiple measures of studentperformance.
Literature on Grade–Test Score Convergence
Several researchers have examined the correspondencebetween grades and test scores, but have not examined thecorrespondence between SBPR grades and standards-basedassessment scores. Studies have generally found a moderateassociation between grades and test scores and oftenattribute discrepancies to incorporation of nonacademicfactors into grades (Brennan, Kim, Wenz-Gross, & Siperstein,2001; Martinez, Stecher, & Borko, 2009; Willingham, Pollack,& Lewis, 2002).
We believe that challenges to convergence extend beyondteachers’ use of nonacademic factors in grading. First, large-scale assessments may not adequately capture student at-tainment of the standards. Polikoff, Porter, and Smithson(2011) examined the alignment between standards and as-sessments in 19 states and found that only about half oftest items addressed state standards. In addition, only halfof the standards were included on the test. Teachers seemaware of this disconnect. McCombs (2005) surveyed teach-ers and principals about their opinions of state standardsand assessments in three states and found that teachers feltthat state assessments were not good measures of standardsattainment.
Second, teachers may have difficulty interpreting the intentof state standards and therefore operationalize them incor-rectly in their classrooms. During her observations of dis-trict curriculum committees working to align state standardsand district curriculum materials, Hill (2001) concluded thatteachers interpreted the same objective quite differently andexperienced difficulty in coming to consensus about what isintended by standards documents. Similarly, Conley (2000,April) theorized that the grade–test score relationship maybe weakened due to variations in the way that teachers op-erationalize learning goals and in their requirements for a“proficient” grade. D’Agostino, Welsh, & Corson (2007) con-firmed this theory by examining the degree of alignment be-tween operationalization of state mathematics standards on astate test and in classrooms. They then used degree of align-ment to predict mathematics performance and found boththat teachers varied in the ways that they implemented thestandards and that the degree of alignment predicted studentachievement.
Third, the grading practices teachers use may jeopardizethe reliability of grades and therefore weaken the link be-tween grades and academic achievement. Teachers may in-flate grades with nonacademic extra credit assignments, basegrades on improvement instead of mastery, or incorporateformative assessments into summative scores, all of whichare unrelated to how much a student knows and can do at theend of a grading period (Brookhart, 1994; McMillan, 2001).
In addition, grading practices may differ across content ar-eas, by perceived rigor of the course, and by the policies of aparticular school or district.
Finally, because classroom assessments and large-scaletests are used differently, and the characteristics requiredfor the assessments to be of high quality vary (Airasian &Jones, 1993; Brookhart, 2003; Cizek, 2009), scores on class-room assessments and state tests might yield different butequally valid information. For example, a student may re-ceive a grade of “exceeds” on extended projects that requiredeep thinking about a topic, but only receive a score of “meets”on the state assessment because it requires students to workquickly and to think through problems on a wide array ofcontent—a very different (but also important) skill.
Despite these concerns, the degree of SBPR grade–standards-based assessment score convergence should be ex-amined. Both measures purport to address the same constructand are the main sources of information parents get abouttheir child’s school performance. If the two measures providedrastically different information about student performance,parents are likely to be confused and concerned. Therefore,it is important to examine both the degree of convergencebetween the two measures and factors that contribute todifferences between the two scores.
Conceptualizing SBPR and Standards-Based Test ScoreConvergence
SBPRs offer a unique opportunity to examine the connectionbetween teacher appraisals and state test scores becauseSBPRs require teachers to report student progress on theeducational objectives which the state test was designed tomeasure. Although the studies we have discussed thus far areinformative, they suffer from a common limitation—teacherratings did not necessarily address the same skills as thosemeasured by the test. Because SBPR scores directly reflectthe attainment of state standards using the same performancelevel descriptors employed by the state test, we can exam-ine the convergent validity of SBPRs and state test scores(Campbell & Fiske, 1959).
Convergent information is a fundamental source of validityevidence as stipulated in the Standards for Educational andPsychological Testing (Standards; American Educational Re-search Association, American Psychological Association, &National Council on Measurement in Education, 1999). How-ever besides the technical reasons, convergent evidence isnecessary given the mistrust of grades and state tests by keystakeholders. Parents should be ensured that both indicatorsprovide supporting evidence of student progress, and teach-ers must believe the state tests yield accurate results beforethey will embrace the standards-based reform effort.
In addition, it is important to identify grading practiceslikely to yield SBPR appraisals consistent with state test re-sults. Little is known about how teachers convert studentperformance on classroom assessments into SBPR grades.And, while parents might expect that the same degree ofknowledge and skill required to meet the standard on a stateassessment is required for a “meet” the standard grade, itis unclear whether teachers picture grades in the same way(Waltman & Frisbie, 1994). Even when teachers and parentshave a shared interpretation, it may be difficult for teachersto generate grades that set cuts between performance levels
Summer 2013 C© 2013 by the National Council on Measurement in Education 27
consistently with the state test. This difficulty is likely at-tributable both to a mismatch between teachers and the testin the degrees of competency required for different perfor-mance levels and with measurement error surrounding cutpoints on both measures. Regardless of the cause, steps shouldbe taken to strengthen the consistency in how performancelevel cuts are envisioned and implemented.
Guskey and Bailey (2001) discuss the four main steps thatmust be taken to produce accurate SBPRs. First, the learninggoals that define what students will know and do must bearticulated. Oftentimes those goals are prespecified withina set of district or state academic standards. Second, thestudent performance indicators of each goal must be stated.Hence, teachers must figure out the tasks and activities thatwill reveal each student’s progress in meeting the goals. Thethird step requires teachers to define graduated steps of per-formance that indicate a student’s development on multipleperformance levels. The teacher must consider the differ-ent degrees of student performance on the indicators anddefine the thresholds between each level. Finally, the ac-tual reporting devices and SBPR format must be createdto communicate the results most effectively to parents andstudents.
This is obviously a very challenging process, one that re-quires teachers to interpret and operationalize often vaguegoals in a way that is consistent with the intentions of stan-dards developers and assessment publishers. For example,one mathematics standard requires students to “solve grade-level appropriate problems using estimation” without guid-ance about what constitutes a “grade-level appropriate prob-lem.” It is likely that instruction and assessment on this skilllooks very different from classroom to classroom and may beinconsistent with the intentions of standards writers. Deter-mining student performance levels also requires a commonunderstanding of behaviors associated with each level, a taskmade more difficult because state performance level defini-tions are also often ambiguous. Therefore, it is unlikely thatteachers similarly conceptualize attainment of state stan-dards or that they use a completely consistent approach inassigning SBPR grades.
Some assessment programs address this issue by provid-ing detailed performance level descriptors for each objective.For example, the Namibian National Standardized Achieve-ment Test (NNSAT) provides descriptions of performancelevel categories by competency that describe the varying lev-els of achievement related to “identify and place numbers ona number chart and number line” such that a learner who isbelow basic can “identify and place up to 2-digit numbers”;a basic learner can “identify and place up to 3-digit num-bers;” an above-basic learner can “identify and place up to4-digit numbers;” and an excellent learner can “identify andplace numbers up to 10,000” (NNSAT, 2011). This practice islikely to yield a greater degree of consistency between gradesand test scores because it helps to clarify what different lev-els of performance looks like on an objective-by-objectivebasis.
In our opinion, however, the promise of SBPRs to offerrich descriptions of student achievement outweighs the chal-lenges. In particular, SBPRs present an opportunity to com-bine with test scores in generating multiple measures of stu-dent performance and are especially appealing because theyare expressed on the same scale as the state test. The contri-bution of SBPRs to multiple measures is discussed next.
Benefits of Including SBPR Grades in Multiple Measures ofStudent Achievement
Multiple measures are intended to improve the quality ofinformation about students and decisions related to their ed-ucation. As measurement professionals, we recognize that allmeasures are flawed, necessitating the integration of manysources of evidence in decision making. This is captured inthe Standards (American Educational Research Association,American Psychological Association, & National Council onMeasurement in Education, 1999), which state: “In educa-tional settings, a decision or characterization that will havemajor impact on a student should not be made on a simpletest score. Other relevant information should be taken intoaccount if it will enhance the overall validity of the deci-sion” (pp. 147–148). However, little consensus exists aboutwhat constitutes a multiple measure, how measures shouldbe evaluated for inclusion in a decision-making system, andhow they should be combined (Henderson-Montero, Julian,& Yen, 2003).
Baker (2003) argues that including classroom-based as-sessments as a multiple measure broadens inferences aboutlearning to reflect deeper and more intensive aspects of stu-dent achievement, allowing students a wider array of methodsthey could use to demonstrate their knowledge, an opinionshared by Guskey (2007), who asserts that multiple mea-sures that incorporate performance on classroom assess-ments, teacher observations of students, and other teacher-generated measures are needed to fully capture the array ofskills students are expected to learn.
A key challenge to combining multiple measures to makeinferences about student performance is finding measuresthat address attainment of state performance standards,conceptualize performance in similar ways, and that arescaled similarly to allow for meaningful aggregation of results(Schafer, 2003). If the convergence between SBPR gradesand standards-based assessments is established and if per-formance level cuts are roughly equivalent, then SBPRs offera unique opportunity to easily construct a multiple measure ofstudent achievement that combines grades and test scores be-cause the results of each measure are presented on the samescale and share the same interpretation. Therefore, researchis needed to determine whether SBPR grades and test scoresshare similar conceptualizations of proficiency and to identifypromising strategies for transforming classroom assessmentresults into SBPR grades. This study examines grading prac-tices in one district to address the following questions:
1. What degree of correspondence is observed in SBPRgrades and state test scores in reading, writing andmathematics?
2. How much do convergence rates vary across teachers,years, and content areas?
3. Do teacher appraisal styles correlate with degree ofgrade–test score convergence?
MethodParticipants
Teachers from 11 elementary schools in one suburban schooldistrict located in the southwestern United States partici-pated in the study. Like other suburban districts, the dis-trict serves a predominantly white (68%), middle-class (33%eligible for free or reduced-price lunch) student body, and is
28 C© 2013 by the National Council on Measurement in Education Educational Measurement: Issues and Practice
moderately sized, serving approximately 13,000 students in17 schools. Students in the district are also relatively high-performing. They outperformed the state as a whole on thestate assessment; 84% of district third-graders met or ex-ceeded mathematics standards, compared with 76% of third-graders statewide.
The district implemented SBPRs for 3 years at the time ofdata collection. In the first year, teachers were instructed tograde student performance on specific objectives using thesame performance level descriptors as appear on the statetest. A brief definition of each performance level consistentwith that provided for the state assessment program was in-cluded on the SBPR form and also on informational materialsdistributed to teachers and parents. It is unclear how famil-iar teachers were with the more detailed performance leveldescriptors generated by the state department of education.When asked how they define “meeting” state standards, teach-ers tended to say either that “meets” is analogous to receiving a“B” grade or that “meets” represents grade-level mastery of allor most objectives, but falls short of exceptional performance.No teacher mentioned the state-generated performance leveldescriptors when questioned about their definition of “meetsthe standard.”
To help teachers adjust to the new reporting system, the dis-trict provided professional development on standards-basedassessment and grading. These sessions emphasized the im-portance of keeping effort separate from standards-basedgrades (effort is graded in its own section of the standardsreports) and suggested approaches for generating objective-level scores. However, SBPR forms and instructions for gen-erating grades were changed after the first year.
Teachers were initially asked to grade based on “patternsof progress” over the school year by grading according toboth overall level of achievement and degree of improvementachieved. That is, they were instructed to consider whetherstudent performance consistently improved (or declined) onspecific objectives over the course of the semester ratherthan taking an average across all assessments used. Districtofficials believed this method more accurately reflected com-petency because those who started out having mastered theconcept and those who did not initially understand but even-tually attained the skill would be graded differently.
Teachers were also asked to provide performance levelgrades consistent with the state definitions. For example, thedefinition of a score of “meets” the standard involved “demon-strate(ing) solid academic performance on subject matter asreflected by the reading, math, and writing standards. Stu-dents who perform at this level are prepared to begin work onmaterials that may be required for the next grade level. Attain-ment of at least this level is the goal for all students” (ArizonaDepartment of Education, 2005). Applying this definition ingrading proved especially challenging and was changed in thesecond year. Instead of using the state’s definitions, teacherstook averages across assessments and converted them to per-formance levels using the standard method applied to lettergrades. That is, students who average 90% correct and abovewere graded “exceeds,” those who average between 80 and 90%correct were graded “meets,” and so on. These adaptations tothe grading system eased the record-keeping requirementsplaced on teachers, made grades more interpretable for par-ents, and generally resulted in a more straightforward gradingsystem. They also introduced inconsistencies in the way thatSBPRs and the state test conceptualized performance levels.
The study used data collected from all third- and fifth-gradeteachers in the 11 schools for some analyses and a smallersubset of teachers for others. Third- and fifth-grade teacherswere selected because state test scores were only availableat Grades 3 and 5 in the years in which test score–SBPRconvergence was examined. Participants can be separatedinto two categories: teachers who participated only in admin-istrative record review and teachers who were interviewed.Administrative data (SBPR grades and state test scores) wereprovided for all third- and fifth-grade teachers working in thedistrict over a 2-year period (39 third grade classrooms in Year1, 40 third grade classrooms in Year 2, and 43 fifth grade class-rooms in both Years 1 and 2). Fewer teachers are includedin most analyses because only a small number of studentshad both valid test scores and SBPR grades in some class-rooms. Ten third grade teachers (9 interviewees) and 15 fifthgrade teachers (7 interviewees) had 2 years of SBPR gradesand tests scores in all three content areas (reading, writing,and mathematics). Partial results were collected for manymore teachers (and interviewees), they were missing data ina particular content area or for an entire year.
Thirty-seven teachers (17 third-grade teachers and 20 fifth-grade teachers) participated in interviews about their math-ematics assessment and grading practices at the end of thethird year of SBPR implementation. Interviews were con-ducted in the third year of SBPR implementation with teach-ers who had participated in at least one full year of SBPRgrading at third or fifth grade and who were currently respon-sible for mathematics instruction (the focus of the largerstudy from which these data were drawn). We identified 67teachers who met these criteria (36 third grade, 31 fifth grade)and attempted to recruit every teacher.
The 30 teachers who were not interviewed did not par-ticipate for the following reasons: they simply declined toparticipate (23 teachers), they were out on disability leaveduring the data collection period or had a major medical is-sue (3 teachers), they did not teach math (the focus of thelarger study, 3 teachers), and they went on maternity leave (1teacher). Participants and nonparticipants had similar levelsof experience teaching at third or fifth grade: 60% of partici-pants had taught at their assigned grade level for more than2 years (and should therefore be familiar with the standards)compared with 53% of nonparticipants.
The interviewed teachers varied a great deal in their edu-cation level, overall teaching experience, and number of yearswith the district. Although participants taught for 13 years onaverage, we spoke with two first-year teachers who were simul-taneously refining their instructional skills, learning the cur-riculum, and developing their approach to standards-basedgrading. Others had been teaching for as long as 25 years andwere either creating new strategies to support the reform orwere using the parts of the grading system they found valu-able and ignoring less helpful components. Approximatelyone-third of teachers had master’s degrees in education, butonly one had content area expertise in mathematics (thatteacher was working towards a mathematics endorsement atthe time of interviews).
Finally, at the time of interviews, all teachers were requiredto use a district-adopted mathematics text and the adoptionof a district reading text was in progress, with implemen-tation slated for the following year. The district emphasizedthat teachers should not supplement material or deviate fromthe text pacing. The text provides a range of assessment
Summer 2013 C© 2013 by the National Council on Measurement in Education 29

options to teachers, which serves as additional encourage-ment to use only the provided materials. Many third-gradeteachers said that the text did not address most state stan-dards and believed that their students would not do well onthe test if they followed the district directive. While someteachers opted to stick with the text, many deviated from itbecause of this concern. In contrast, fifth grade teachers re-ported a high degree of alignment between the mathematicstext and state standards. Therefore, we anticipated signif-icant variation in the degree to which teachers implementstandards-based instruction, especially at third grade.
Materials
Three data sources contribute to this study: standards-basedreport card grades, state test scores, and teacher interviews.Standards-based progress report grades from two school yearswere collected for all third- and fifth-grade students in the dis-trict. SBPRs varied a great deal from grade level to grade leveland from year to year, as described in the participant section,necessitating analyses by grade level/school year cohort.
The SBPR form itself changed substantially from Year 1to Year 2 of the study; the number of grades generated andthe level of detail in graded skills changed. Teachers wereinitially asked to grade on a variety of performance objec-tives from the state standards in math, reading, and writing(e.g., “multiplies whole numbers”), while content area gradeswere not required. In the second year, objective-level gradeswere abandoned in favor of grading by subject (fifth grade)and strand (third grade). Strands require teachers to groupobjectives into broad categories within a content area (e.g.,number sense or geometry) while subject grades refer tothe content area involved (e.g., reading, math, writing). Tofurther alleviate the challenges associated with standards-based grading, strand-level grades were no longer reportedusing performance level descriptors at fifth grade. Teachersused one of four ratings for each strand: “demonstrates con-sistently,” “developing,” “needs support,” and “not evaluated.”
State test scores were also collected for the same 2-year pe-riod. The state standards-based test gauges student contentknowledge in reading, writing, and mathematics. The read-ing and mathematics tests are comprised of between 76 and84 multiple choice items. The writing test is a constructed-response test which requires students to respond to a writingprompt. In all subjects, performance level scores are gen-erated on a four point scale: “falls far below,” “approaches,”“meets,” and “exceeds.” The test is used to meet the require-ments of the No Child Left Behind Act of 2001 (NCLB, 2002)and to determine state accountability ratings. Because ofits strong association with state and federal accountabilitysystems, teachers are keenly aware that the test is used toevaluate their instruction.
It is important to note that the approaches used to deter-mine performance levels are different for each measure. Onthe fifth grade state mathematics test, students were requiredto correctly answer at least 86% of items to receive a scoreof “exceeds,” between 80 and 85% of items to receive a scoreof “meets,” between 52 and 79% of items to receive a score of“approaches,” and 51% or fewer items to receive a score of“falls far below.” In contrast, SBPR grades were conceptual-ized similarly to letter grades (“exceeds” is an A, “meets” isa B, etc.) or were based on each teachers’ perception of thekinds of performance associated with different scores.
Test scores were matched to spring progress report gradesto gauge test score–SBPR convergence. Analyses were re-stricted to students both with valid state test scores (e.g.,those students tested off grade level or with nonstandard ac-commodations were omitted) and with progress report gradesthat focused on grade-level standards (some students gradeswere adjusted per their individualized educational plans).The scores for approximately 750 students could be mergedper year at each grade level, for a total sample size of 3,026students nested in roughly 80 classrooms and 11 elementaryschools.
Finally, teachers were interviewed about their assessmentand grading practices in mathematics. Interviews were part ofa larger study of standards-based instruction and assessmentin elementary mathematics. As such, interview topics rangedfrom instructional practices used with specific mathematicsobjectives, to assessment and grading methods, to teacher re-views of test items. Interviews were conducted after the studyteam analyzed the degree of convergence between standards-based report card grades and state test scores and had con-cluded that teachers generally assigned grades below statetest scores in mathematics and above state test scores in read-ing and writing. Teachers were also asked if they could provideany insight into this discrepancy. Interviews lasted between90 minutes and 2 hours, with approximately 30 minutes de-voted to assessment and grading. The assessment and gradingportion of the interview addressed the following topics:
� How teachers assess student learning, both formally andinformally,
� the purposes of different assessments,� how teachers decide which skills to assess (e.g., do they
base assessments solely on the curriculum or do theytake state standards into account?),
� what types of information teachers use in assigninggrades,
� the role of overall achievement level, amount of improve-ment made over the school year, and effort in assigninggrades,
� the weight assigned to different types of information inassigning grades,
� what a grade of “meets” represents to teachers,� the frequency of assessment (especially those that con-
tribute to grades), and� the methods used to convert assessment scores to
progress report grades.
Procedure
Spring SBPR grades were entered into a database along withstudent identification numbers provided by the school dis-trict. Fifth-grade scores were provided for each content area(i.e., math, reading, and writing) and were entered as they ap-peared on progress reports. All other grades were presentedby strand or objective and were averaged and rounded to thenearest whole number to arrive at overall content area scores.SBPR grades were then merged with student-level test scoresusing the student identifiers and convergence was examinedaccording to a variety of indices intended to gauge the de-gree of consensus and consistency between scores and alsoteacher rigor in grading.
We define consensus as the degree to which ratings matchexactly and examine consistency according to the similar-ity in student rank orders on grades and on test scores, a
30 C© 2013 by the National Council on Measurement in Education Educational Measurement: Issues and Practice

distinction elucidated by Kozlowski & Hattrup’s (1992) paperon interrater agreement. It is important to consider both con-sensus and consistency because it is possible for convergenceestimates to be rather low, but correlation indices to be strongif one indicator yielded scores that were more stringent thanthe other. Consensus is gauged using Cohen’s (1960) coef-ficient kappa, while the degree of consistency is measuredusing Kendall’s (1955) tau-b rank order correlation coeffi-cient. Cohen’s kappa estimates the degree of consensus whilecorrecting for chance agreement rates by adjusting agree-ment rates with the marginal distribution of scores (Cohen,1960) while Kendall’s tau-b values estimate the differencebetween the probability that SBPR grades and state test scoresare in the same order and the probability that they are in dif-ferent orders (Kendall, 1955). Both kappa and tau-b rangein value from zero to one, with values close to one indicatinga strong relationship and, like correlation coefficients, canhave positive or negative values with polarity indicating thedirection of the relationship (Agresti, 1996).
Finally, we assessed teacher rigor in grading by takingthe difference between state test scores and SBPR gradeswhere positive difference scores indicate that teachers as-signed grades lower than those observed on the state test.All agreement indices were calculated at the classroom levelwhere rigor is determined by taking the mean differencewithin each classroom.
Teacher interviews were audiotaped and transcribed. Alltranscripts were initially coded by the first author who is ameasurement faculty member with elementary school teach-ing experience and who teaches classroom assessment meth-ods classes to preservice teachers. Interviews were tran-scribed and coded iteratively. Initial codes were generatedbased on methods widely believed to yield reliable grades(Linn & Miller, 2005; Oosterhof, 2003). As transcripts werereviewed, the coder took notes on additional themes thatemerged from the data. Based on these notes, transcriptswere reread and additional codes were generated.
The following assessment characteristics were coded usinga three-point scale (“clearly evident,” “somewhat evident,”and “not evident”) for each teacher. Coding schemes arepresented below:
� Performance-focused. Whether the teacher focused onmeasuring standards achievement instead of effort.Teachers who reported taking class participation andeffort into account in assigning grades were scored “0,”those who more subtly included effort in grading (suchas increasing borderline grades because of good effort)were coded “1,” and those who reported not taking effortinto account in any way were coded “2.”
� Overall achievement. Extent of focus on overall achieve-ment rather than student progress. Teachers who re-ported grading students based on the progress made overthe course of the semester, rather than on skill attain-ment were coded “0,” teachers who calculated grades andthen made adjustments based on progress were coded“1,” and teachers who graded students based solely onoverall achievement level were coded “2.”
� Frequently assessed. Teachers who collected assess-ment data for grading purposes less than once a weekwere coded “0”, those who assessed weekly were coded“1”, and those who assessed at least twice a week werecoded “2.”
� Multiple approaches. Use of approaches that allowteachers to gauge different aspects of a skill. Teacherswho used only the assessments provided by the districtmathematics text were coded “0,” those who occasion-ally supplemented text-based assessments with otherassessments were coded “1,” and teachers who regularlyassessed in ways that required students to show under-standing using a variety of modalities (presentations,performance tasks, paper and pencil tests, etc.) werecoded “2.”
� Linked assessments to objectives. Whether teachersmaintained objective-based records. Teachers who didnot maintain records on the objectives assessed werecoded “0,” teachers who only identified the general area(e.g., algebra, geometry, etc.) assessed or only linkedassessments and objectives in a limited number of caseswere coded “1,” and those who consistently linked as-sessments to objectives were coded “2.”
� Clear grading method. Whether teachers had a clearmethod of converting students’ scores on assessmentsto progress report grades. Teachers who could not ex-plain a set grading method were coded “0,” those whodescribed a method but also said that they use theirgeneral knowledge of students in grading were coded“1,” and those who described their method and reportedconsistently employing it were coded “2.”
� Created assessments. Teachers who did not create as-sessments were coded “0,” teachers who created theirown assessments to measure skills also assessed by text-based assessments were coded “1,” and teachers whocreated assessments to address objectives not coveredby the text were coded “2.”
� Assessed most objectives. Teachers who did not make aneffort to assess the objectives in the state standards werecoded “0,” teachers who assessed some state standardsbut did not attempt to cover the full range of objectiveswere coded “1,” and teachers who reported assessing thefull range of performance objectives were coded “2.”
� Standards-focused. The degree to which teachers fo-cused on assessing standards more than curriculum at-tainment. Teachers who limited their assessment to thedistrict-adopted text were coded “0,” teachers who fo-cused both on curriculum attainment and on the stan-dards were coded “1,” and teachers who concentratedon state standards were coded “2.”
A doctoral student in educational measurement coded 10randomly selected transcripts to establish inter-rater reliabil-ity after being trained on the coding scheme and completingthree practice transcripts. The scores were compared us-ing a weighted kappa statistic, which examines the degreeof agreement after correcting for chance agreement levelsand assigns partial credit for ratings that are similar but donot match exactly (Cohen, 1968). Weightings gave full creditto exact matches, half a point to ratings only one categoryapart, and scores two categories apart were not counted asmatching. We then calculated the maximum weighted kappapossible based on the marginal distributions of scores andexamined agreement rates relative to the maximum pos-sible level of agreement. We found strong levels of agree-ment for all indicators, the smallest κweighted / κmx = .71(Table 1).
We created a composite mathematics appraisal style mea-sure using exploratory factor analysis; we generated a factor
Summer 2013 C© 2013 by the National Council on Measurement in Education 31
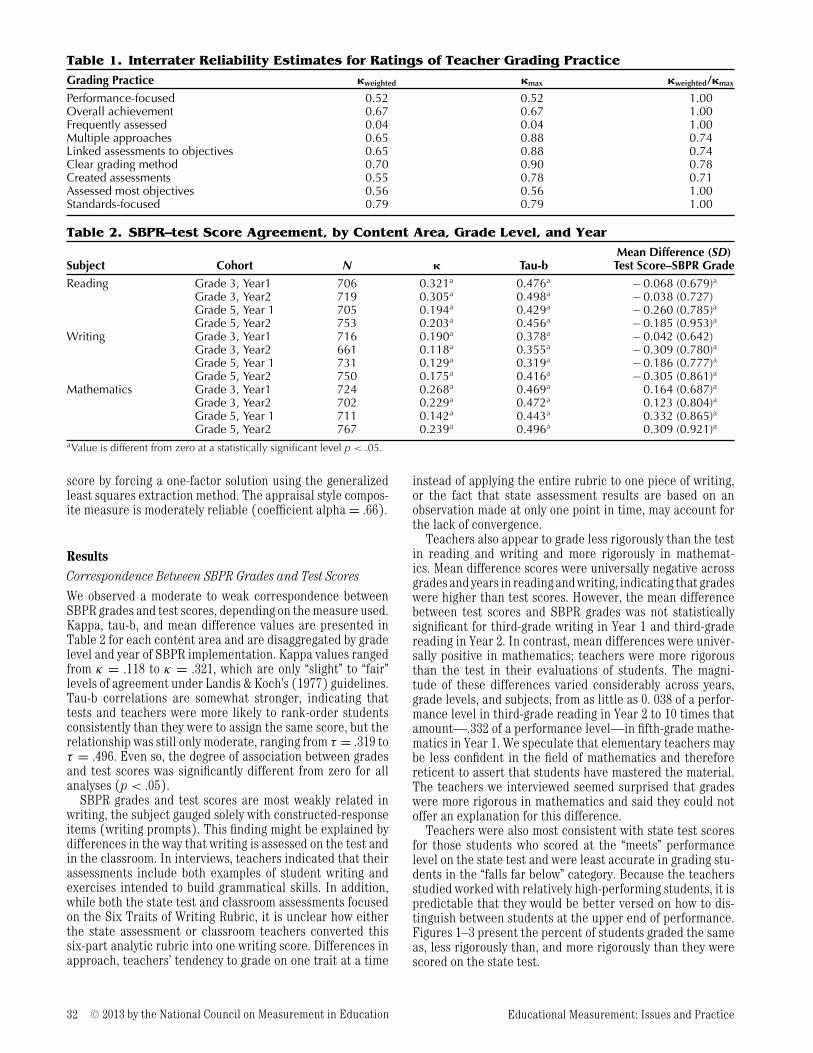
Table 1. Interrater Reliability Estimates for Ratings of Teacher Grading Practice
Grading Practice �weighted �max �weighted/�max
Performance-focused 0.52 0.52 1.00Overall achievement 0.67 0.67 1.00Frequently assessed 0.04 0.04 1.00Multiple approaches 0.65 0.88 0.74Linked assessments to objectives 0.65 0.88 0.74Clear grading method 0.70 0.90 0.78Created assessments 0.55 0.78 0.71Assessed most objectives 0.56 0.56 1.00Standards-focused 0.79 0.79 1.00
Table 2. SBPR–test Score Agreement, by Content Area, Grade Level, and Year
Mean Difference (SD)Subject Cohort N � Tau-b Test Score–SBPR Grade
Reading Grade 3, Year1 706 0.321a 0.476a − 0.068 (0.679)aGrade 3, Year2 719 0.305a 0.498a − 0.038 (0.727)Grade 5, Year 1 705 0.194a 0.429a − 0.260 (0.785)aGrade 5, Year2 753 0.203a 0.456a − 0.185 (0.953)a
Writing Grade 3, Year1 716 0.190a 0.378a − 0.042 (0.642)Grade 3, Year2 661 0.118a 0.355a − 0.309 (0.780)aGrade 5, Year 1 731 0.129a 0.319a − 0.186 (0.777)aGrade 5, Year2 750 0.175a 0.416a − 0.305 (0.861)a
Mathematics Grade 3, Year1 724 0.268a 0.469a 0.164 (0.687)aGrade 3, Year2 702 0.229a 0.472a 0.123 (0.804)aGrade 5, Year 1 711 0.142a 0.443a 0.332 (0.865)aGrade 5, Year2 767 0.239a 0.496a 0.309 (0.921)a
aValue is different from zero at a statistically significant level p < .05.
score by forcing a one-factor solution using the generalizedleast squares extraction method. The appraisal style compos-ite measure is moderately reliable (coefficient alpha = .66).
ResultsCorrespondence Between SBPR Grades and Test Scores
We observed a moderate to weak correspondence betweenSBPR grades and test scores, depending on the measure used.Kappa, tau-b, and mean difference values are presented inTable 2 for each content area and are disaggregated by gradelevel and year of SBPR implementation. Kappa values rangedfrom κ = .118 to κ = .321, which are only “slight” to “fair”levels of agreement under Landis & Koch’s (1977) guidelines.Tau-b correlations are somewhat stronger, indicating thattests and teachers were more likely to rank-order studentsconsistently than they were to assign the same score, but therelationship was still only moderate, ranging from τ = .319 toτ = .496. Even so, the degree of association between gradesand test scores was significantly different from zero for allanalyses (p < .05).
SBPR grades and test scores are most weakly related inwriting, the subject gauged solely with constructed-responseitems (writing prompts). This finding might be explained bydifferences in the way that writing is assessed on the test andin the classroom. In interviews, teachers indicated that theirassessments include both examples of student writing andexercises intended to build grammatical skills. In addition,while both the state test and classroom assessments focusedon the Six Traits of Writing Rubric, it is unclear how eitherthe state assessment or classroom teachers converted thissix-part analytic rubric into one writing score. Differences inapproach, teachers’ tendency to grade on one trait at a time
instead of applying the entire rubric to one piece of writing,or the fact that state assessment results are based on anobservation made at only one point in time, may account forthe lack of convergence.
Teachers also appear to grade less rigorously than the testin reading and writing and more rigorously in mathemat-ics. Mean difference scores were universally negative acrossgrades and years in reading and writing, indicating that gradeswere higher than test scores. However, the mean differencebetween test scores and SBPR grades was not statisticallysignificant for third-grade writing in Year 1 and third-gradereading in Year 2. In contrast, mean differences were univer-sally positive in mathematics; teachers were more rigorousthan the test in their evaluations of students. The magni-tude of these differences varied considerably across years,grade levels, and subjects, from as little as 0. 038 of a perfor-mance level in third-grade reading in Year 2 to 10 times thatamount—.332 of a performance level—in fifth-grade mathe-matics in Year 1. We speculate that elementary teachers maybe less confident in the field of mathematics and thereforereticent to assert that students have mastered the material.The teachers we interviewed seemed surprised that gradeswere more rigorous in mathematics and said they could notoffer an explanation for this difference.
Teachers were also most consistent with state test scoresfor those students who scored at the “meets” performancelevel on the state test and were least accurate in grading stu-dents in the “falls far below” category. Because the teachersstudied worked with relatively high-performing students, it ispredictable that they would be better versed on how to dis-tinguish between students at the upper end of performance.Figures 1–3 present the percent of students graded the sameas, less rigorously than, and more rigorously than they werescored on the state test.
32 C© 2013 by the National Council on Measurement in Education Educational Measurement: Issues and Practice

FIGURE 1. Percent of students graded higher, lower, and equal to their state test score in reading across grade levels and years.
FIGURE 2. Percent of students graded higher, lower, and equal to their state test score in mathematics across grade levels and years.
FIGURE 3. Percent of students graded higher, lower, and equal to their state test score in writing across grade levels and years.
Variability in Convergence Rates
We calculated the proportion of variability in classroom-levelagreement rates found between teachers, subjects, and yearsand in the interactions among them, conducting separateanalyses with tau-b, kappa, and mean difference scores as thedependent variables. To do so, we conducted a generalizabilitystudy (Brennan, 2001), treating classroom-level convergenceestimates as teacher scores. Our study followed a p × S ×Y design, with teachers (p) fully crossed with subjects (S),and years (Y). We used the variance components procedurefound in SPSS Statistics 17, Release Version 17. 0. 0 (SPSS,Inc. 2008) using restricted maximum likelihood estimation.
This approach is preferred because it allows us to decom-pose the variance between the three elements while allow-ing for only one score within each cell of the design. Inaddition it focuses on estimation of variance componentswhich supports the goal of this analysis—to describe theamount of variation in convergence rates attributable to dif-ferences between teachers, subject areas, and years which wetreat as a proxy for different SBPR forms and policies giventhe changes in SBPR implementation between Years 1 and 2discussed earlier. Although the main goal of most generaliz-ability studies is to generate variance components that canbe used to estimate the reliability of scores, estimating the
Summer 2013 C© 2013 by the National Council on Measurement in Education 33

Table 3. Estimated Variance Components and Their Percentages for SBPR–Test ScoreComparisons
Mean Test–gradeKappa Tau-b Difference
Source Estimated Percentage Estimated Percentage Estimated Percentageof Variance of Total Variance of Total Variance of TotalVariability n Component Variance N Component variance n Component Variance
Teacher 38 .0012 3.5% 38 .0031 7.2% 47 .0028 1.6%Subject 3 .0044 12.7% 3 .0090 20.7% 3 .0600 34.1%Year 2 .0000 .0% 2 .0000 .0% 2 .0000 .0%Teacher* Subject 114 .0013 3.7% 114 .0000 .0% 141 .0146 8.3%Teacher*Year 76 .0000 .0% 76 .0053 12.2% 94 .0440 25.0%Subject*Year 6 .0000 .0% 6 .0002 .6% 6 .0060 3.4%Teacher*Subject*Year, error 228 .0277 80.1% 228 .0257 59.4% 282 .0487 27.7%
reliability of kappa, tau-b, and mean difference scores is nota goal of this study and reliability estimates are not provided.
Results for all three convergence estimates are presentedin Table 3, which shows that teachers did not vary much intheir SBPR grade–state test score convergence rates, whilethe proportion of unexplained variation within teachers re-mained quite large. This suggests that convergence rates arenot affected much by the particular teacher who did thegrading, but may be greatly affected by other factors withinthe classroom, such as student characteristics, a factor thatwas not accounted for in this analysis. Interestingly, the pro-portion of unexplained variance was largest for the kappaestimates and much smaller for our measure of rigor. Thisseems to suggest that teacher rigor in grading is affected con-siderably less by within-classroom factors than is teacher skillin assigning grades that match state test scores.
In addition, the subject graded greatly impacts conver-gence. Thirty-four percent of the variation in rigor (meandifference) estimates is attributable to the subject studied,and 20.7% of the variance in tau-b correlations is due to sub-ject, as is 12.7% of the variation in kappa. In contrast, the yearof SBPR implementation had no impact on convergence; theparticular report card form or approach to generating SBPRgrades did not affect the correspondence between grades andtest scores. This finding is somewhat mitigated by interviewdata, which indicate that many teachers continued to gradeon a pattern of progress instead of calculating SBPR gradesby taking the mean of classroom assessment scores.
Interactions between year and subject also failed to ex-plain variation in convergence. However, the teacher by yearinteraction explained substantial amounts of variation inrigor (25.0%) and tau-b correlations (12.2%); certain teach-ers did a better job of rank-ordering students and/or weredifferentially rigorous graders relative to state test perfor-mance depending on the SBPR form and associated grad-ing method implemented. Teachers were also differentiallyrigorous and/or differentially adept at assigning grades thatmatched test performance depending on the subject graded.However, the proportions of variance explained by the teacherby subject interactions were smaller than for the otherinteractions.
Relationship Between Appraisal Style and SBPR–Test ScoreConvergence
The frequency with which teachers adopted each gradingpractice is presented in Table 4. The teachers in our sample
tended to assess students frequently and to focus on overallachievement instead of taking progress into account. Many(but fewer) teachers also linked assessment items to spe-cific objectives, could describe a clear method used to assigngrades, focused on attainment of state standards instead ofthe district curriculum, or regularly created their own assess-ments. Clear evidence of grading on performance instead ofeffort, of assessing most objectives, or of using multiple ap-proaches to gauge student performance existed for a third orfewer of the teachers interviewed.
Correlations between the mathematics appraisal stylecomposite and convergence estimates are presented inTable 5. We observed small correlations between AppraisalStyle and kappa coefficients, which reflect the consistencyin grades and test scores, in all three subject areas and nocorrelation with tau-b correlations, which gauge the degreeto which rank order based on grades is consistent with rankorder based on test scores. Interestingly, appraisal style wasweakly and negatively associated with the mean differencebetween state test scores and grades in mathematics, notcorrelated in reading, and weakly and positively correlated inwriting. This corresponds with the positive mean differencescores in mathematics, negative (and near zero) mean dif-ferences in reading, and negative (and slightly larger) meandifferences in writing. That is, higher appraisal style scoresseem to counteract teachers’ tendency to underestimate per-formance in mathematics and to overestimate performancein writing, relative to state test performance. Strong positivecorrelations were observed between coefficient kappa andtau-b correlations in the same subject and other small corre-lations (both positive and negative) were observed betweenmany of the SBPR grade–test score convergence measures.
DiscussionSBPR grades were moderately associated with state testscores, indicating that grades and test scores converged. Themoderate degree of association may also suggest that gradescapture different aspects of student performance than thetest. However, it is also probable that measurement error as-sociated both with test scores and with grades affects thisfinding, as they likely attenuate the magnitude of associa-tion. This finding is consistent with other studies that haveshown grades and test scores to be moderately related (Bren-nan et al., 2001; Conley 2000, April), and illustrates the im-portance of gathering multiple sources of information whenmaking judgments about students. However, the usefulness
34 C© 2013 by the National Council on Measurement in Education Educational Measurement: Issues and Practice

Table 4. Percentage of Teachers Adopting Each Grading Practice
Grading Practice N Clearly Evident Somewhat Evident Not Evident
Performance-focused 37 35.1 16.2 48.6Overall achievement 37 70.3 18.9 10.8Frequently assessed 37 64.9 29.7 5.4Multiple approaches 37 21.6 37.8 40.5Linked assessments to objectives 37 54.1 10.8 35.1Clear grading method 37 48.6 27.0 24.3Created assessments 37 43.2 21.6 35.1Assessed most objectives 37 32.4 16.2 51.4Standards-focused 37 45.9 16.2 37.8
Table 5. Correlation Between Appraisal Style and Convergence Estimates, Pooled Across Yearsand Grade Levels
1 2 3 4 5 6 7 8 9 10
1. Appraisal style –2. Kappa math .214 –3. Kappa reading .240 .008 –4. Kappa writing .229 .036 .298a –5. Tau-b math .129 .446a −.184 −.110 –6. Tau-b reading .037 −.177 .656a .207 −.215 –7. Tau-b writing .036 .312a .137 .630a .214 .287 –8. Mean difference math −.237 −.096 −.103 −.104 .087 −.175 −.056 –9. Mean difference reading .057 .026 .289 −.221 −.178 .043 −.117 .088 –10. Mean difference writing .331a .235 .204 .063 −.097 .098 .011 −.263 .129 –aCorrelation is significantly different from zero, p < .05 (N = 48).
of SBPRs as a communication tool is limited if parents re-ceive contradictory information about student performance.Therefore, it is important to identify and reduce sources ofinconsistency.
One reason that grades and test scores may differ is thatteachers set different internal cut points between perfor-mance levels than the test. “Meeting” or “approaching” astandard are somewhat ambiguous concepts, tricky to op-erationalize; teachers must determine how to implement theobjective and what kinds of behaviors constitute differentlevels of proficiency. The teachers studied grade consistentlywith the test when students “meet” state standards. This re-sult is promising; understanding what proficiency looks likeis the first step in determining achievement levels associatedwith higher and lower degrees of performance. However, it isalso important to make sure that teachers also understandhow to identify where students fit across all gradations ofperformance.
Because the teachers in this study worked with relativelyhigh-performing students, it is predictable that they wouldbe better versed on how to distinguish between students atthe upper end. Further research might also examine whetherteachers in low-performing schools are most consistent withthe test in distinguishing between performance levels at thelower end of the spectrum. If so, then teachers may requireadditional training to set cuts at performance levels theyencounter less often. On the other hand, if teachers in lowperforming schools are also more consistent at the “meets”level, SBPR implementation may indeed help to elucidatewhat proficiency looks like. State departments of educationcould also support this effort by providing concrete infor-mation about the skills that delineate between performancelevels on an objective by objective basis, as is provided for theNNSAT (2011).
In addition to working towards a common understandingof each performance level, consistency is improved when themethods used to generate grades are standardized. For ex-ample, some teachers in our study graded both on achieve-ment and on improvement made during the year while othersgraded solely on achievement. And half of the teachers eithercould not explain the process they used to grade or coulddescribe the process they used but admitted that they didnot strictly adhere to it. For standards-based grading to workas a multiple measure, teachers need training on the ex-pected grading method and on the importance of its faithfulimplementation.
While past research has speculated that teacher grad-ing practices contribute to moderate convergence rates(Willingham et al., 2002), we found only small correlationsbetween teacher appraisal style and test-grade convergence,indicating that other factors are at play. However, the factthat the appraisal style measure correlated more stronglywith kappa values than with tau-b correlations may suggestthat using appropriate grading practices squarely focused onattainment of state standards might have some impact onimproving the match between SBPR grades and state testscores. Further study, with a larger and more diverse sampleof teachers, is needed to identify those practices that yieldhigh degrees of convergence.
Finally, the limited variation in convergence rates acrossteachers may indicate that SBPR implementation helps im-prove consistency in grading practices. Even so, some teach-ers varied in convergence rates according to the subjectgraded and the report card form. Therefore, districts shouldcarefully attend to the design of report cards and on themethods teachers might use to distinguish between perfor-mance levels in grading, to training teachers on operational-ization of the standards, on setting proficiency levels for each
Summer 2013 C© 2013 by the National Council on Measurement in Education 35
objective, on good grading practices, and on the usefulness ofSBPRs as a multiple measure that provides information aboutstudent attainment of the standards throughout the schoolyear.
For standards-based reform to work, it is important thatteachers be well versed not only in the content of state stan-dards, but also in what it means to assign students to specificperformance levels in terms of the skills that must be attainedor that are yet to be mastered. SBPRs are one promising ap-proach to help achieve that goal in that they can help bothparents and teachers think more deeply about student at-tainment of the standards at multiple points in the schoolyear with results provided proximally to instruction. Strug-gling with these concepts is the real work of standards-basedreform, one in which SBPRs may assist. It is likely that SBPRgrades and state test scores will always differ to some extent,the very reason why multiple measures are needed. Carefulattention to the grading methods used could limit the degreeof discordance and improve the quality of information parentsreceive.
ReferencesAgresti, A. (1996). Introduction to categorical data analysis. New York,
NY: John Wiley and Sons.Airasian, P. W., & Jones, A. M. (1993). The teacher as applied mea-
surer: Realities of classroom management and assessment. AppliedMeasurement in Education, 6, 241–254.
American Educational Research Association, American PsychologicalAssociation, & National Council on Measurement in Education.(1999). Standards for educational and psychological testing. Wash-ington, DC: American Educational Research Association.
Arizona Department of Education. (2005). Arizona’s instrument tomeasure standards: State board approved AIMS performancelevel descriptors. Phoenix, AZ: Author. Retrieved on May 29, 2007from http://www. azed. gov/standards/aims/PerformanceStandards/GeneralAIMSPerformanceLevelDescriptors. pdf
Baker, E. L. (2003). Multiple measures: Toward tiered systems. Educa-tional Measurement: Issues and Practice, 22(2), 13–17.
Brennan, R. L. (2001). Generalizability theory. New York, NY: Springer.Brennan, R. T., Kim, J., Wenz-Gross, M., & Siperstein, G. N. (2001). The
relative equitability of high-stakes testing versus teacher-assignedgrades: An analysis of the Massachusetts Comprehensive AssessmentSystem (MCAS). Harvard Educational Review, 71, 173–216.
Brookhart, S. M. (1994). Teacher’s grading: Practice and theory.Applied Measurement in Education, 7, 279–301.
Brookhart, S. M. (2003). Development measurement theory for class-room assessment purposes and uses. Educational Measurement:Issues and Practice, 22(4), 5–12.
Campbell, D., & Fiske, D. (1959). Convergent and discriminant valida-tion by the multitrait-multimethod matrix. Psychological Bulletin,56, 81–105.
Cizek, G. J. (2009). Reliability and validity of information about studentachievement: Comparing large-scale and classroom testing contexts.Theory into Practice, 48, 63–71.
Clarridge, P. B., & Whitaker, E. M. (1994). Implementing a new elemen-tary progress report. Educational Leadership, 52(2), 7–9.
Cohen, J. (1960). A coefficient of agreement for nominal scales. Educa-tional and Psychological Measurement, 20, 37–46.
Cohen, J. (1968). Weighed kappa: Nominal scale agreement with provi-sion for scaled disagreement or partial credit. Psychological Bulletin,70, 213–220.
Conley, D. T. (2000, April). Who is proficient?: The relationship be-tween proficiency scores and grades. Paper presented at the meet-
ing of the American Educational Research Association. New Orleans,LA.
D’Agostino, J. V., Welsh, M. E., & Corson, N. M. (2007). Instructionalvalidity of a state’s standards-based assessment. Educational Assess-ment, 12(1), 1–22.
Guskey, T. R. (2001). Helping standards make the grade. EducationalLeadership, 59(1), 20–27.
Guskey, T. R. (2007). Multiple sources of evidence: An analysis of stake-holders’ perceptions of various indicators of student learning. Edu-cational Measurement: Issues and Practice, 26(1), 19–27.
Guskey, T. R., & Bailey, J. M. (2001). Developing grading and reportingsystems for student learning. Thousand Oaks, CA: Corwin.
Guskey, T. R., & Bailey, J. M. (2009). Developing standards based reportcards. Thousand Oaks, CA: Corwin.
Guskey, T. R., & Jung, L. A. (2009). Grading and reporting in a standards-based environment: Implications for students with special needs.Theory into Practice, 48, 53–62.
Henderson-Montero, D., Julian, M. W., & Yen, W. M. (2003). Multipleperspectives on multiple measures: An introduction. EducationalMeasurement: Issues and Practice, 22(2), 7–12.
Hill, H. C. (2001). Policy is not enough: Language and the interpretationof state standards. American Educational Research Journal, 38,298–318.
Kendall, M. G. (1955). Rank correlation methods. New York, NY: Hafner.Kozlowski, S. W. J. & Hattrup, K. (1992). A disagreement about within
group agreement: Disentangling issues of consistency versus consen-sus. Journal of Applied Psychology, 77, 161–167.
Landis, J. R., & Koch, G. G. (1977). The measurement of observeragreement for categorical data. Biometrics, 33, 159–174.
Linn, R. L., & Miller, M. D. (2005). Measurement and assessment inteaching (9th ed.). Upper Saddle River, NJ: Pearson Education.
Martinez, J. F., Stecher, B., & Borko, H. (2009). Classroom assessmentpractices, teacher judgments, and student achievement in mathe-matics: Evidence from the ECLS. Educational Assessment, 14, 78–102.
McCombs, J. S. (2005). Progress in implementing standards, assess-ments, and the highly qualified teacher provisions of NCLB: Perspec-tives from California, Georgia, and Pennsylvania (Rand TechnicalReport No. WR-256-EDU). Santa Monica, CA: RAND. Retrieved July19, 2005, from http://www.rand.org/publications/WR/WR256/
McMillan, J. H. (2001). Secondary teachers’ classroom assessment andgrading practices. Educational Measurement: Issues and Practice,20(1), 20–32.
Namibian National Standardized Achievement Test. (2011). Descrip-tion of performance level categories by competencies Grade 5 math-ematics standard setting workshop. Windhoek, Namibia: NamibianMinistry of Education.
No Child Left Behind Act of 2001. (2002) Pub. L. No. 107–110, 115 Stat.1425.
Oosterhof, A. (2003). Developing and using classroom assessments(3rd ed.). Upper Saddle River, NJ: Pearson Education.
Polikoff, M. S., Porter, A. C., & Smithson, J. (2011). How well alignedare state assessments of student achievement with state con-tent standards? American Educational Research Journal, 48, 965–995.
Schafer, W. D. (2003). A state perspective on multiple measures inschool accountability. Educational Measurement: Issues and Prac-tice, 22(2), 27–31.
Scriffiny, P. L. (2008). Expecting excellence: Seven reasonsfor standards-based grading. Educational Leadership, 66(2),70–74.
Waltman, K. K., & Frisbie, D. A. (1994). Parents’ understanding of theirchildren’s report card grades. Applied Measurement in Education,7, 223–240.
Willingham, W. W., Pollack, J. M., and Lewis, C. (2002). Grades and testscores: Accounting for observed differences. Journal of EducationalMeasurement, 39, 1–37.
36 C© 2013 by the National Council on Measurement in Education Educational Measurement: Issues and Practice