Embed Size (px)
Citation preview
Page 1/20
Niche conservatism drives the elevational diversitygradient in major groups of free-living soilunicellular eukaryotesLeonardo D. Fernández ( [email protected] )
Universidad Bernardo O’Higgins and University of Neuchâtel https://orcid.org/0000-0001-9550-1921Christophe V. W. Seppey
University of Neuchâtel and UiT The Arctic University of NorwayDavid Singer
University of Neuchâtel, University of São Paulo and Université d’AngersBertrand Fournier
University of PotsdamDylan Tatti
Bern University of Applied Sciences BFHEdward A. D. Mitchell
University of NeuchâtelEnrique Lara
University of Neuchâtel
Research Article
Keywords: microbial biogeography, microbial macroecology, mid-domain effect, protists, Rapoport effect,species–energy effect
Posted Date: December 21st, 2020
DOI: https://doi.org/10.21203/rs.3.rs-133244/v1
License: This work is licensed under a Creative Commons Attribution 4.0 International License. Read Full License
Version of Record: A version of this preprint was published at Microbial Ecology on May 30th, 2021. Seethe published version at https://doi.org/10.1007/s00248-021-01771-2.

Page 2/20
AbstractAncestral adaptations to warm and humid climates drive the biogeographical and macroecologicalpatterns of numerous multicellular organisms. Recent evidence suggests that this niche conservatismmay also be shaping broad-scale diversity patterns of soil unicellular organisms, although empiricalevidence is limited to Acidobacteria and testate amoebae. Herein, we tested the predictions of thishypothesis for �ve major soil protist groups (Bacillariophyta, Cercomonadida, Ciliophora, Euglyphida andKinetoplastida), separately, as well as combined, along an elevational gradient in Switzerland. We foundsupport for the predictions of this hypothesis in all protist groups, including decreasing diversity andincreasing geographical ranges towards high and cold elevations (Rapoport effect); correlations betweendiversity and temperature (species-energy effect); and communities phylogenetically structured bycompetition (phylogenetic overdispersion) at warm-humid sites and habitat �ltering (phylogeneticclustering) at cold-humid sites. Mid-domain null models con�rmed that these �ndings were not the resultof stochastic processes. Our results therefore suggest that soil protists exhibit evolutionary constraints towarm and humid climates, probably linked to an ancestral adaptation to (sub)tropical-like environments,which limits their survival in exceedingly cold sites. This niche conservatism possibly drives theirbiogeographical and macroecological patterns both at the local (e.g., temperature, humidity gradientsalong elevation gradients) and more global (e.g., latitudinal gradients) spatial scales.
IntroductionBiological diversity varies over spatial gradients, giving rise to biogeographical and macroecologicaldiversity patterns [1]. Diversity patterns are considered to result from a combination of ecologicalprocesses (e.g., habitat �ltering, competition) and historical contingencies (e.g., climatic stability,diversi�cation), which together in�uence the spatial variation in speciation, extinction and dispersal rates[2].
Phylogenetic niche conservatism (PNC) is a holistic, parsimonious and increasingly accepted hypothesisthat integrates the processes involved in the formation of diversity patterns. This hypothesis proposesthat taxa retain their ecophysiological traits (e.g., thermal tolerance) over evolutionary time and that,therefore, they tend to remain in environments that exhibit the abiotic conditions within which theyevolved [3]. This evolutionary trend has been proposed to explain why most modern taxa fail to disperseinto new environments, offering an underlying explanation to the diversity patterns that we observe todayin nature [4–6].
The PNC offers testable predictions that together can shed light on the relative role played by ecologicalprocesses and historical contingencies in shaping diversity patterns. The basic prediction of thishypothesis is that diversity will peak in warm and moist (optimal) sites [7, 8], because they mirror thetropical-like environmental conditions within which most modern plants and animals originated [9].Accordingly, this hypothesis also predicts that diversity will decline towards exceedingly hot or cold(suboptimal) sites because the ancestral adaptation of modern taxa to moist (sub)tropical-like
Page 3/20
environments imposes a strong constraint on their ability to tolerate extremely high or low temperatures[3]. Others predictions of the PNC include a positive correlation between diversity and temperature [4, 5, 7],an increase in the size of taxa distribution ranges towards the colder end of an environmental gradient[10, 11], giving place to a macroecological pattern known as the Rapoport effect [12]; and localcommunities structured by competition in warm sites and structured by habitat �ltering in cold sites [3,13].
These predictions have been extensively tested in multicellular organisms, proving useful to explain theirdiversity patterns in terms of both ecological processes and historical contingencies (e.g., [4–7]). Bycontrast, these predictions have been investigated in few studies dealing with unicellular organisms,including bacteria (e.g., [8, 14, 15]) and protists such as testate amoebae [11]. Thus, manybiogeographical and macroecological generalizations proposed for plants and animals have not yet beensu�ciently tested for microorganisms. Accordingly, we still do not know whether multicellular andunicellular diversity patterns are produced and maintained by similar processes [16, 17]. This gap inknowledge is even more serious for free-living soil eukaryotic microorganisms (soil protists), since mostresearch on microbial biogeography and macroecology has been traditionally conducted on prokaryotes,fungi or aquatic protists [18]. Unravelling the processes that originate and maintain the spatialdistribution of soil protist diversity could therefore contribute to �lling gaps in knowledge and to theconstruction of ecological and evolutionary generalization for all forms of life on Earth.
Soil protists represent a good model to test the predictions of the PNC hypothesis. Research suggeststhat, just like several groups of plants and animals, they also seem to retain their ecophysiological traitsover evolutionary time [11, 19]. Particularly, it appears that their current need for warm and humidclimates is well-rooted in their evolutionary history. While the origin of the �rst eukaryotic microorganismsprobably dates back to the Proterozoic (e.g., [20]), fossil evidence available (e.g., [21, 22]), and timeestimates from molecular clock studies (e.g., [23, 24], suggest that at least some extant terrestrial (soil)protist taxa evolved under the warm and humid terrestrial environments that characterized much of theMesozoic [9]. The climatic conditions under which they possibly evolved seem to have imposedevolutionary constraints on their ability to adapt to regions with exceedingly hot or cold temperatures,thus in�uencing their current diversity patterns, performance and �tness. Indeed, nowadays, soil protistsexhibit peaks of diversity in warm and humid environments, such as temperate and tropical rain forests[25, 26] and declines in diversity towards hot [27] and cold [28] deserts. Soil protist biogeography isusually predicted either by temperature [26], water [29] or both variables (a water-energy balance, [11]).Experimental evidence also shows that soil protists exhibit higher performance and �tness (e.g., theyhave high survival, growth and reproductive rates) at warm (ca. 18 and 24 °C) than at exceedingly cold orhot temperatures (e.g., [30, 31]). Taken together, these facts suggest that most of them lack the necessaryecophysiological adaptations to survive and reproduce in exceedingly cold or hot environments. Probably,the retention of their ancestral adaptation to warm and humid climates imposes strong constraints ontheir ability to colonize sites with extreme temperatures and drives their current biogeographical andmacroecological patterns on Earth.
Page 4/20
Herein, we tested the predictions of the PNC hypothesis for the elevational diversity gradient (see Table 1)on �ve major soil protist groups: Bacillariophyta, Cercomonadida, Ciliophora, Euglyphida, Kinetoplastidaand a group combining all these taxa (i.e., “the soil protist group”). To do so, we used a high-throughputsequencing approach to test for correlations between their richness, elevation and temperature (plus otherenvironmental variables); as well as to investigate their elevational patterns in range distribution andphylogenetic community structure along a humid but increasingly cold elevational gradient of beechforests in Switzerland. We selected the above-mentioned soil protist taxa because (1) they are frequentand diverse in soils, (2) they have different life history strategies and functional roles, and (3) they arewell distributed across the eukaryotic tree (Geisen et al. 2018). Our rationale behind that choice was to beable to generalize conclusions to as many soil eukaryotes as possible.
Material And MethodsStudy Site and Sampling Strategy
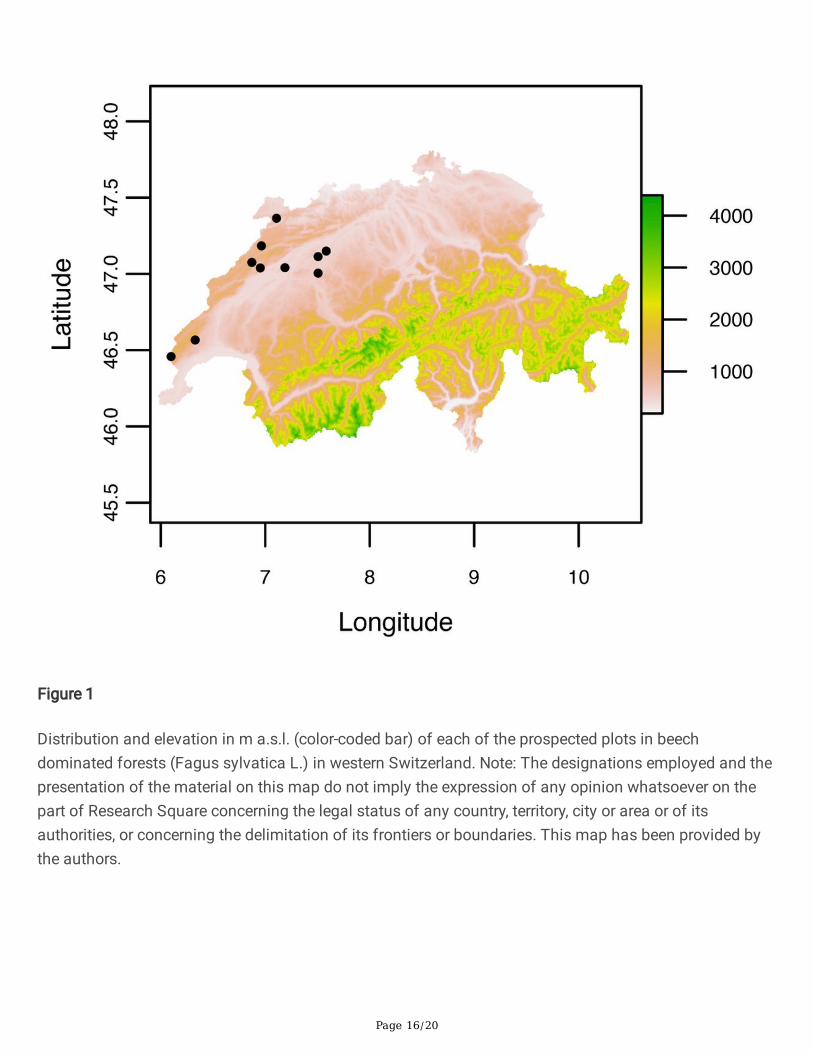
We collected soil samples in ten permanent plots of the Swiss Biodiversity Monitoring program BDM(http://www.biodiversitymonitoring.ch/en/home.html). The plots were selected in beech forests (Fagussylvatica L.) which are among the few natural beech-dominated forests remaining in Europe [32]. Theplots are distributed across Western Switzerland and range from 458 to 1,308 m a.s.l. (Fig. 1). Theclimate of the study area is maritime temperate with an average annual precipitation and temperature of1,200 mm and 8.3 °C, respectively [32].
At each forest, we randomly collected three soil cores at a depth and diameter of 5 cm at the periphery ofthe area used for repeated vegetation survey as part of the BDM monitoring program. The three coreswere then pooled to obtain a representative soil sample of the site. The samples were kept cool duringtransport and DNA was extracted in the laboratory immediately after sampling.
Characterization of Soil Protist Communities
DNA extraction, PCR, sequencing (Illumina, targeting the SSU rRNA gene V9 region of eukaryotes) andsubsequent taxonomic assignment of the obtained reads followed [17] (as described in Appendix S1). Werandomly subsampled 50,000 reads from each site to account for unequal sample sizes between soilprotist communities. From these subsamples, we selected those assigned to Bacillariophyta,Cercomonadida, Ciliophora, Euglyphida and Kinetoplastida. We also combined all the reads assigned tothe abovementioned taxa into a group herein referred to as the “soil protist group”. Species accumulationcurves con�rmed that sampling effort and sequencing covering were enough to record a signi�cantproportion of the total OTU richness found at each sampling site (Appendix S1: Fig. S1). We de�ned acommunity as all OTUs originating from a single beech forest sample. The taxonomic richness withineach community was calculated as the total number of OTUs within each community. This diversitymetric was correlated to phylogenetic diversity (Appendix S1: Fig. S2).
Assessment of the Predictions of the PNC Hypothesis
Page 5/20
Table 1 summarises predictions that can be drawn and test from the PNC, which proposes that climaticconditions within which a taxon evolved (i.e. warm and humid conditions for most modern taxa) shouldbe conserved in the present [3]. These predictions stem from biogeographical and macroecologicalmechanisms that once were independently proposed to explain the occurrence of biodiversity patterns.These predictions are valid for temperate elevational gradients, which often exhibit increasingprecipitation and decreasing temperature with elevation [33].
Species-energy Effect
This mechanism predicts correlations between temperature and biological diversity [34]. At the study sitetemperature decreases and precipitation increases with elevation [31, 35]. It is thus expected that soilprotist diversity will decrease with elevation (Prediction 1.1.1.) and show a positive relationship withtemperature (Prediction 1.1.2.). To test these predictions, we standardised OTU richness (as described inAppendix 2) to avoid sampling biases introduced here by the unequal distribution shown by the beechforests sampled along the elevational gradient investigated. Then, we estimated the average annualtemperature based on the average annual temperature reported for the lowest sampling site (10 °C, [35])and assuming a moist adiabatic lapse rate of 0.6 °C for each 100-m increase in elevation [33]. Finally, weconstructed linear and quadratic models using richness as response variable and both the elevation andthe average annual temperature as descriptor variables. The best-�tting model was selected based on theAkaike’s information criterion (AIC) for each model. We also assessed the role played by otherenvironmental variables, such as humidity, pH, humus content, etc. (as measured by Landolt’s indicatorvalues). However, we did not record any correlation between these variables and richness (Appendix S3).
Elevational Ranges of Distribution
Climate becomes harsher with altitude, and thus habitat �ltering plays a major role in the distribution ofdiversity on mountainsides [7]. If soil protists have evolutionary constraints to adapt to cold climates, wepredict that they will exhibit a Rapoport effect [12]; i.e., their distribution ranges will become broader withelevation because colder temperatures at higher sites will select a few eurythermal taxa with highdispersal capability towards the mountaintop (Prediction 2.1.1.). By contrast, if thermal constraints (andthus habitat �ltering) do not drive soil protists distribution in the humid but increasingly cold elevationalgradient studied, we predict that they will exhibit a mid-domain effect [36]; i.e., their distribution rangeswill be randomly distributed within the lower and upper (hard) limits of the elevational gradient studiedresulting in a unimodal diversity gradient (Prediction 2.1.2.). The Rapoport effect was tested usingPearson’s correlations to assess the relationship between the mean elevational range size of all OTUs co-occurring in the same forest site and elevation. The unimodal diversity curve predicted by the mid-domaineffect and its con�dence intervals were computed using the Mid-Domain Null program [7] based on50,000 Monte Carlo simulations sampled without replacement from empirical taxa-range-sizedistributions.
Niche-based Processes
Page 6/20
We also explored the existence of a constrained evolutionary response to temperature by assessing therole of biotic interactions and habitat �ltering in community structuring. If soil protists do not have aconstrained evolutionary response to cold temperatures, then their communities will be structured bybiotic interactions and composed by distantly related taxa in the study site (phylogenetic overdispersion,Prediction 3.1.1.). By contrast, if they cannot cope with decreasing temperature, then their communitieswill be structured by habitat �ltering, since cold temperatures will only favour the occurrence of closelyrelated taxa with broad thermal tolerances (phylogenetic clustering, Prediction 3.2.1.). The existence ofphylogenetic overdispersion/clustering was tested using the standardised version of both the meanpairwise distance and the mean nearest taxon distance indices (i.e., –NRI and –NTI, respectively) [37].Negative values of these indices denote phylogenetic clustering, whereas positive values indicatephylogenetic overdispersion. Both indices were computed using the R package picante [37] against a trialswap null model (999,000 swaps).
ResultsCercomonadida (373 OTUs: 12,437 reads) and Ciliophora (582 OTUs: 15,599 reads) were the mostdiverse and abundant heterotrophic taxa at each forest site, followed by Kinetoplastida (223 OTUs:10,377 reads) and Euglyphida (157 OTUs: 8,058 reads). The phototrophic taxon Bacillariophyta was theless diverse and abundant (78 OTUs: 923 reads) (Appendix S1: Fig. S3). So, the taxon combining all thesetaxa (i.e., the soil protist group) represented 1,413 OTUs and 47,394 reads along the elevational gradient(Appendix S4).
Species-energy Effect
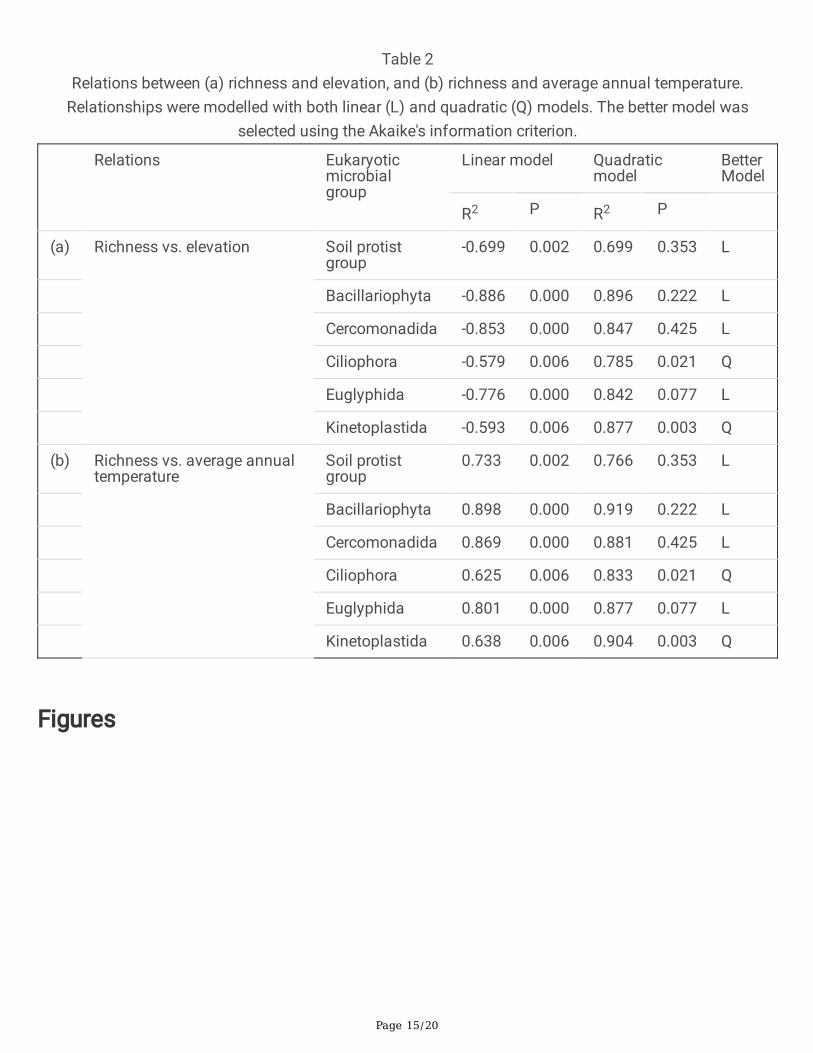
The diversity of all taxa showed a negative correlation with elevation and a positive correlation withaverage annual temperature (Table 2), supporting the expectations of the species-energy effect(Predictions 1.1.1. and 1.1.2.).
Elevational Ranges of Distribution
The size of the mean elevational range of all taxa exhibited a positive correlation with elevation,conforming to a Rapoport effect (Fig. 2, Prediction 2.1.1.). We did not �nd support for a mid-domaineffect (Fig. 3, Prediction 2.2.1.). This outcome con�rmed the role of habitat �ltering in structuring soilprotist communities along the elevational gradient investigated.
Niche-based Processes
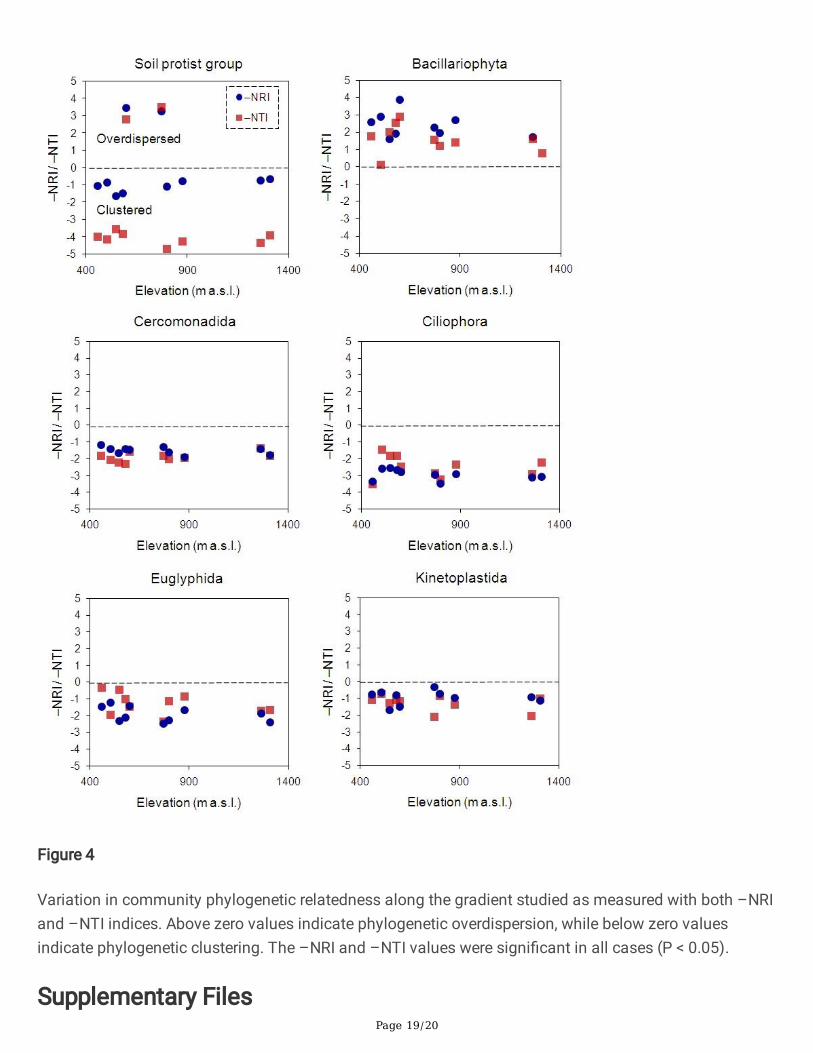
The assessment of the phylogenetic structure within communities yielded different results among taxa(Fig. 4). The soil protist group exhibited local communities of both distantly and closely related taxa overthe elevational gradient. This outcome did not support any of the predictions proposed (see Table 1).However, Bacillariophyta only exhibited local communities of distantly related taxa, which agreed with
Page 7/20
prediction 3.1.1. The remaining taxa were represented by local communities of closely related taxa in thestudy site. This result supported prediction 3.2.1.
DiscussionPrevious research (e.g., [26, 29, 38] and the present study support the idea that soil protist diversityincreases at warm (and humid) sites. However, the novelty of our study is that we also provide evidencesupporting the idea that this temperature-diversity relationship (or species-energy effect) might have anevolutionary origin rooted in the conservatism of ancestral regimes rather than on present-day thermalconditions. Here, we explored the phylogenetic signal for this thermal niche conservatism amongdistantly related soil protists by also assessing their elevational patterns in range-size distributions andtheir within-community phylogenetic structure over an elevational gradient.
In our study, average annual temperature was identi�ed as the main driver of the decline in soil protistdiversity with increasing elevation. This result was consistent with a species-energy effect, a climaticallybased mechanism proposed to explain the occurrence of diversity patterns in nature [34]. The species-energy effect often proposes temperature as a proxy of ambient energy and as the main driver ofbiodiversity patterns [34]. That prediction is true in places where temperature is at or below the tolerancerange for life [39], such as on the way to mountaintops [7]. In mountain slopes, temperature decreases~0.6 °C for each 100-m increase in elevation [33], a trend that also applies to the elevational gradientstudied herein. Since our lowest and warmest sampling site exhibits an average annual temperature of 10°C [35], a temperature value that is already below the thermal optimum for most protists [30, 31, 40], it isobvious that environmental conditions, including temperature, become harsher for soil protists towardsthe top of the elevational gradient investigated despite the increase in precipitation along the gradient.
The abovementioned species-energy effect (as measured by the average annual temperature) does notprevent site-speci�c (local) abiotic factors to shape soil protist diversity. Indeed, soil protist diversity hasbeen shown to vary in relation to nutrient availability, pH and conductivity, among others local abioticfactors [18]. However, these factors seem to be more relevant at �ne spatial scales, or microbial cultures[41, 42]. By contrast, climatic conditions seem to explain better the diversity patterns at broad-spatialscales, which are relevant for soil protist biogeography and macroecology [11, 17, 26, 29]. In fact, localabiotic factors often lose power to predict diversity patterns at increasing spatial scales [1]. This is mainlybecause the factors in�uencing diversity gradients are scale dependent, and thus, explanations vary withthe spatial scope of the analysis (extent) and with sample resolution (grain) [43]. Also, climatic conditionsultimately regulate local abiotic conditions, explaining why climate often arises as the main driver ofbiogeographical and macroecological patterns of eukaryotic organisms [1], including soil protists [17, 29].Nevertheless, some studies also highlight the joint role of local abiotic factors and climate in shapingelevational gradients in soil protist diversity (e.g., [44, 45]. However, as these studies did not control forconfounding effects of local abiotic conditions, the relative contribution of local and climatic drivers inshaping soil protist diversity could not be determined.

Page 8/20
In this study, we did control for confounding effects of local abiotic conditions since we always sampledalong an elevational gradient of beech-dominated forests. Beech and other dominant trees homogenizesoil properties and change their physicochemical characteristics (pH, conductivity, organic matter, etc.)[46, 47]. This contributes to reducing the effect of site-speci�c abiotic factors in driving soil protistdiversity along elevational gradients [38, 48]. This could explain why local abiotic factors had little, or nopredictive power as compared to temperature (species-energy effect) to explain protist diversity patterns.
Water, either alone [29] or in conjunction with temperature [11], is another driver of soil protist diversityacross broad spatial scales. However, the role of water as a predictor of biodiversity varies spatially,becoming more important in sites where it is scarce [39]. In fact, water does not predict soil protistdiversity in wet environments [49]. We did not record any relationship between humidity and soil protistdiversity. So, as we expected, water was not a limiting factor at the study site. Indeed, precipitation(another proxy of water availability) increases along the elevation gradient investigated [50], while ourresults show that protist diversity tends to decrease. So, while temperature is really putting the �tness ofprotists to the test, water availability seems to be high enough (at least on average despite the regularoccurrence of drought periods in summer) to not limit their physiological functions in the study site.
The assessment of the elevational patterns in soil protist range-size distributions suggested that thespecies-energy effect observed might be ultimately driven by a thermal niche conservatism. Indeed, allsoil protist taxa investigated exhibited a Rapoport effect depicted by a progressive increase in theirdistribution ranges from lower and warmer sites to higher and colder sites. The occurrence of a Rapoporteffect has been related to the existence of thermal evolutionary constraints that prevent multicellularorganisms [10, 51] and soil protists [11] from adapting to and eventually colonizing areas with severe,often exceedingly cold (or hot) climates. So, the observation of a Rapoport effect suggests that, ingeneral, soil protists lack ecophysiological traits to overcome the low temperatures that predominate athigher elevational sites over the year. Indeed, the low diversity recorded at higher and colder sites, coupledwith the occurrence of a Rapoport effect supports the idea that few soil protist taxa can physiologicallyovercome the lower temperatures of higher sites. Probably at higher and colder elevations, habitat�ltering processes select comparatively few eurythermal protists, which, in turn, represent cases of recentadaptation to exceedingly cold temperatures.
In addition to assessing the elevational patterns in soil protist range-sizes distributions, we alsoinvestigated their within-community phylogenetic structure to track the existence of a thermal nicheconservatism. The soil protist group that combines all the taxa investigated exhibited bothphylogenetically clustered and phylogenetically over-dispersed communities over the elevational gradient.This suggests that, overall, the soil protist group is represented both by taxa with broad and narrowthermal tolerances. The analyses performed on individual taxonomic groups, con�rmed the above-mentioned outcome. Bacillariophyta, the only phototrophic taxon included in our study, exhibitedphylogenetic overdispersion among co-occurring representatives and, therefore, communities structuredby biotic processes [13, 37]. This outcome suggests that Bacillariophyta have broader thermal tolerancesthan the heterotrophic soil protist taxa investigated. Indeed, phototrophic protists exhibit higher

Page 9/20
reproductive rates than heterotrophic protists at cold temperatures [30, 31, 40]. Given that the temperaturerange recorded at our study sites seems not to play an important role on the structuring of Bacillariophytacommunities, we hypothesize that habitat �ltering (as measured by the average annual temperature)possibly plays a pivotal role in the assembly of Bacillariophyta communities at higher and colderelevations than those surveyed at our study site (and thus not in beech forests). Probably, at our studysite, competition for sunlight is the most important biotic process in the assembly of their localcommunities, since spotlights are scarce and unevenly distributed in forests. Future research performedover broader elevational ranges are needed to test our hypothesis. By contrast, Cercomonadida,Ciliophora, Euglyphida and Kinetoplastida (all of them heterotrophic taxa), exhibited phylogeneticclustering among their co-occurring representatives. This result con�rmed that these taxa exhibit localcommunities structured by habitat �ltering over the elevational gradient investigated [13, 37]. Therefore,heterotrophic soil protists exhibit a narrower thermal tolerance than Bacillariophyta to the monotonicdecrease in temperature observed in the study site.
ConclusionHerein, we have shown that diversity patterns in soil protists such as Bacillariophyta, Cercomonadida,Ciliophora, Euglyphida and Kinetoplastida, could be explained through the phylogenetic nicheconservatism. In particular, the evidence suggests that most soil protists exhibit evolutionary constraintsto temperature, which imposes strong restrictions on their ability to colonize sites with extremetemperatures. This thermal constraint might also be driving their current biogeographical andmacroecological patterns on Earth and might be the reason why temperature often arises as an importantpredictor of soil protist diversity over latitudinal and elevational gradients. Considering that thephylogenetic niche conservatism has contributed to successfully explain the occurrence of diversitypatterns in plants and animals, we could also state that our study contributes with additional evidence todemonstrate that eukaryotic multicellular and unicellular diversity patterns might be produced andmaintained by similar processes. Our �ndings contribute thus to generalizing broad evolutionarymechanisms to the whole domain Eukarya and, arguably, to all life on Earth.
DeclarationsFunding: L.D.F. was supported by ANID (grants 21110037 and 78130011) and ANID-FONDECYT (project11170927); C.V.W.S by the University of Neuchâtel and the Norwegian Research Council (projects 256132and 270252), D.S. by the Swiss National Science Foundation (P2NEP3 178543) and E.A.D.M. by theSwiss Federal O�ce for the Environment (FOEN) to cover sampling and sequencing costs.
Con�icts of interest/Competing interests: The authors declare that there is no con�ict of interest orcompeting interests
Availability of data and material: We provide all complementary and relevant information assupplementary material
Page 10/20
Code availability: Not applicable
Authors’ contributions: L.D.F. conceived the idea and wrote a �rst draft. L.D.F, C.V.W.S, D.S., B.F., E.L., D.T.performed the statistical and/or molecular analyses. E.A.D.M. provided funding. All authors contributed towrite the �nal version of this manuscript
References1. Gaston K, Blackburn T (2008) Pattern and process in macroecology. John Wiley & Sons
2. Mittelbach GG, Schemske DW, Cornell HV et al (2007) Evolution and the latitudinal diversity gradient:speciation, extinction and biogeography. Ecol Lett 10:315–331. https://doi.org/10.1111/j.1461-0248.2007.01020.x
3. Wiens JJ, Ackerly DD, Allen AP et al (2010) Niche conservatism as an emerging principle in ecologyand conservation biology. Ecol Lett 13:1310–1324. https://doi.org/10.1111/j.1461-0248.2010.01515.x
4. Dorey JB, Groom SVC, Freedman EH et al (2020) Radiation of tropical island bees and the role ofphylogenetic niche conservatism as an important driver of biodiversity. Proceedings of the RoyalSociety B: Biological Sciences 287:20200045. https://doi.org/10.1098/rspb.2020.0045
5. Li F, Shao L, Li S (2020) Tropical Niche Conservatism Explains the Eocene Migration from India toSoutheast Asia in Ochyroceratid Spiders. Syst Biol 69:987–998.https://doi.org/10.1093/sysbio/syaa006
�. Su X, Shrestha N, Xu X et al (2020) Phylogenetic conservatism and biogeographic a�nity in�uencewoody plant species richness–climate relationships in eastern Eurasia. Ecography 43:1027–1040.https://doi.org/10.1111/ecog.04839
7. McCain CM (2009) Global analysis of bird elevational diversity. Glob Ecol Biogeogr 18:346–360.https://doi.org/10.1111/j.1466-8238.2008.00443.x
�. Choudoir MJ, Buckley DH (2018) Phylogenetic conservatism of thermal traits explains dispersallimitation and genomic differentiation of Streptomyces sister-taxa. The ISME Journal 12:2176–2186.https://doi.org/10.1038/s41396-018-0180-3
9. Evolution of Terrestrial Ecosystems Consortium, Behrensmeyer AK, Damuth JD et al (1992)Terrestrial Ecosystems Through Time: Evolutionary Paleoecology of Terrestrial Plants and Animals.University of Chicago Press
10. Moreno RA, Rivadeneira MM, Hernández CE et al (2008) Do Rapoport’s rule, the mid-domain effect orthe source–sink hypotheses predict bathymetric patterns of polychaete richness on the Paci�c coastof South America? Glob Ecol Biogeogr 17:415–423. https://doi.org/10.1111/j.1466-8238.2007.00372.x
11. Fernández LD, Fournier B, Rivera R et al (2016) Water–energy balance, past ecological perturbationsand evolutionary constraints shape the latitudinal diversity gradient of soil testate amoebae in south-western South America. Glob Ecol Biogeogr 25:1216–1227. https://doi.org/10.1111/geb.12478
Page 11/20
12. Stevens GC (1989) The Latitudinal Gradient in Geographical Range: How so Many Species Coexist inthe Tropics. Am Nat 133:240–256. https://doi.org/10.1086/284913
13. Webb CO, Ackerly DD, McPeek MA, Donoghue MJ (2002) Phylogenies and Community Ecology. AnnuRev Ecol Syst 33:475–505. https://doi.org/10.1146/annurev.ecolsys.33.010802.150448
14. Bryant JA, Lamanna C, Morlon H et al (2008) Microbes on mountainsides: Contrasting elevationalpatterns of bacterial and plant diversity. Proc Natl Acad Sci USA 105:11505.https://doi.org/10.1073/pnas.0801920105
15. Andam CP, Doroghazi JR, Campbell AN et al (2016) A Latitudinal Diversity Gradient in TerrestrialBacteria of the Genus Streptomyces. mBio 7:e02200–e02215. https://doi.org/10.1128/mBio.02200-15
1�. Geisen S, Mitchell EAD, Wilkinson DM et al (2017) Soil protistology rebooted: 30 fundamentalquestions to start with. Soil Biol Biochem 111:94–103. https://doi.org/10.1016/j.soilbio.2017.04.001
17. Seppey CVW, Broennimann O, Buri A et al (2020) Soil protist diversity in the Swiss western Alps isbetter predicted by topo-climatic than by edaphic variables. J Biogeogr 47:866–878.https://doi.org/10.1111/jbi.13755
1�. Geisen S, Mitchell EAD, Adl S et al (2018) Soil protists: a fertile frontier in soil biology research. FEMSMicrobiol Rev 42:293–323. https://doi.org/10.1093/femsre/fuy006
19. Singer D, Mitchell EAD, Payne RJ et al (2019) Dispersal limitations and historical factors determinethe biogeography of specialized terrestrial protists. Mol Ecol 0: https://doi.org/10.1111/mec.15117
20. Lahr DJG, Kosakyan A, Lara E et al (2019) Phylogenomics and morphological reconstruction ofArcellinida testate amoebae highlight diversity of microbial eukaryotes in the Neoproterozoic. CurrBiol. https://doi.org/10.1016/j.cub.2019.01.078
21. Harwood DM, Nikolaev VA, Winter DM (2007) Cretaceous records of diatom evolution, radiation, andexpansion. The Paleontological Society Papers 13:33–59
22. Martín-González A, Wierzchos J, Gutiérrez JC et al (2008) Morphological Stasis of Protists in LowerCretaceous Amber. Protist 159:251–257. https://doi.org/10.1016/j.protis.2007.08.006
23. Lahr DJG, Bosak T, Lara E, Mitchell EAD (2015) The Phanerozoic diversi�cation of silica-cyclingtestate amoebae and its possible links to changes in terrestrial ecosystems. PeerJ 3:e1234.https://doi.org/10.7717/peerj.1234
24. Fernandes NM, Schrago CG (2019) A multigene timescale and diversi�cation dynamics of Ciliophoraevolution. Mol Phylogenet Evol 139:106521. https://doi.org/10.1016/j.ympev.2019.106521
25. Fernández LD, Lara E, Mitchell EAD (2015) Checklist, diversity and distribution of testate amoebae inChile. Eur J Protistol 51:409–424. https://doi.org/10.1016/j.ejop.2015.07.001
2�. Lara E, Roussel-Delif L, Fournier B et al (2015) Soil microorganisms behave like macroscopicorganisms: patterns in the global distribution of soil euglyphid testate amoebae. J Biogeogr 43:520–532. https://doi.org/10.1111/jbi.12660
Page 12/20
27. Pérez-Juárez H, Serrano-Vázquez A, Lara E et al (2019) Population dynamics of amoeboid protists ina tropical desert: seasonal changes and effects of vegetation and soil conditions. ActaProtozoologica; Volume 57 Issue 4
2�. Thompson AR, Powell GS, Adams BJ (2019) Provisional checklist of terrestrial heterotrophic protistsfrom Antarctica. Antarct Sci 31:287–303. https://doi.org/10.1017/S0954102019000361
29. Bates ST, Clemente JC, Flores GE et al (2013) Global biogeography of highly diverse protistancommunities in soil. ISME J 7:652. https://doi.org/10.1038/ismej.2012.147
30. Souffreau C, Vanormelingen P, Verleyen E et al (2010) Tolerance of benthic diatoms from temperateaquatic and terrestrial habitats to experimental desiccation and temperature stress. null 49:309–324.https://doi.org/10.2216/09-30.1
31. Li C, Xu K, Lei Y (2011) Growth and grazing responses to temperature and prey concentration ofCondylostoma spatiosum, a large benthic ciliate, feeding on Oxyrrhis marina. Aquatic microbialecology 64:97–104
32. Heiri C, Wolf A, Rohrer L, Bugmann H (2009) Forty years of natural dynamics in Swiss beech forests:structure, composition, and the in�uence of former management. Ecol Appl 19:1920–1934.https://doi.org/10.1890/08-0516.1
33. Burt PJA (2010) Roger G, Barry, 2008. Mountain Weather and Climate, Cambridge University Press,Cambridge, UK. ISBN 978-0-521-86295-0. xxiv + 506 pp. Meteorological Applications 17:382–382.https://doi.org/10.1002/met.222
34. Evans KL, Warren PH, Gaston KJ (2005) Species-energy relationships at the macroecological scale: areview of the mechanisms. Biol Rev 80:1–25
35. Swiss Federal Statistical Department (2014) Territory and environment: Panorama. BFS
3�. Colwell RobertK, Lees DC (2000) The mid-domain effect: geometric constraints on the geography ofspecies richness. Trends Ecol Evol 15:70–76. https://doi.org/10.1016/S0169-5347(99)01767-X
37. Kembel SW, Cowan PD, Helmus MR et al (2010) Picante: R tools for integrating phylogenies andecology. Bioinformatics 26:1463–1464. https://doi.org/10.1093/bioinformatics/btq166
3�. Heger TJ, Derungs N, Theurillat J-P, Mitchell EAD (2016) Testate amoebae like it hot: species richnessdecreases along a subalpine-alpine altitudinal gradient in both natural Calluna vulgaris litter andtransplanted Minuartia sedoides cushions. Microbial ecology 71:725–734.https://doi.org/10.1007/s00248-015-0687-3
39. Eiserhardt WL, Bjorholm S, Svenning J-C et al (2011) Testing the Water–Energy Theory on AmericanPalms (Arecaceae) Using Geographically Weighted Regression. PLOS ONE 6:e27027.https://doi.org/10.1371/journal.pone.0027027
40. Rose JM, Caron DA (2007) Does low temperature constrain the growth rates of heterotrophicprotists? Evidence and implications for algal blooms in cold waters. Limnol Oceanogr 52:886–895.https://doi.org/10.4319/lo.2007.52.2.0886
41. Ehrmann O, Puppe D, Wanner M et al (2012) Testate amoebae in 31 mature forest ecosystems –Densities and micro-distribution in soils. European Journal of Protistology 48:161–168.
Page 13/20
https://doi.org/10.1016/j.ejop.2012.01.003
42. Krashevska V, Sandmann D, Maraun M, Scheu S (2014) Moderate changes in nutrient input altertropical microbial and protist communities and belowground linkages. The ISME Journal 8:1126–1134. https://doi.org/10.1038/ismej.2013.209
43. Willis KJ, Whittaker RJ (2002) Species Diversity–Scale Matters. Science 295:1245.https://doi.org/10.1126/science.1067335
44. Shen C, Liang W, Shi Y et al (2014) Contrasting elevational diversity patterns between eukaryotic soilmicrobes and plants. Ecology 95:3190–3202. https://doi.org/10.1890/14-0310.1
45. Lanzén A, Epelde L, Blanco F et al (2016) Multi-targeted metagenetic analysis of the in�uence ofclimate and environmental parameters on soil microbial communities along an elevational gradient.Sci Rep 6:28257. https://doi.org/10.1038/srep28257
4�. Ayres E, Steltzer H, Berg S et al (2009) Tree Species Traits In�uence Soil Physical, Chemical, andBiological Properties in High Elevation Forests. Plos One 4:e5964.https://doi.org/10.1371/journal.pone.0005964
47. Chandra LR, Gupta S, Pande V, Singh N (2016) Impact of forest vegetation on soil characteristics: acorrelation between soil biological and physico-chemical properties. 3 Biotech 6:188.https://doi.org/10.1007/s13205-016-0510-y
4�. Mitchell EAD, Bragazza L, Gerdol R (2004) Testate amoebae (Protista) communities in Hylocomiumsplendens (Hedw.) BSG (Bryophyta): relationships with altitude, and moss elemental chemistry.Protist 155:423–436. https://doi.org/10.1078/1434461042650334
49. Fournier B, Coffey EED, van der Knaap WO et al (2016) A legacy of human-induced ecosystemchanges: spatial processes drive the taxonomic and functional diversities of testate amoebae inSphagnum peatlands of the Galápagos. J Biogeogr 43:533–543. https://doi.org/10.1111/jbi.12655
50. Derungs N (2007) Étude sur I’écologie des thécamobiens des sols le long d’un gradient altitudinal:in�uence des facteurs environnementaux sur la distribution des espèces. MSc thesis, Université deNeuchâtel–Laboratoire Sol & Végétation and Swiss Federal Research Institute WSL-LaboratoireECOS (EPFL) 135
51. Veter NM, DeSantis LRG, Yann LT et al (2013) Is Rapoport’s rule a recent phenomenon? A deep timeperspective on potential causal mechanisms. Biol Let 9:20130398.https://doi.org/10.1098/rsbl.2013.0398
Tables
Page 14/20
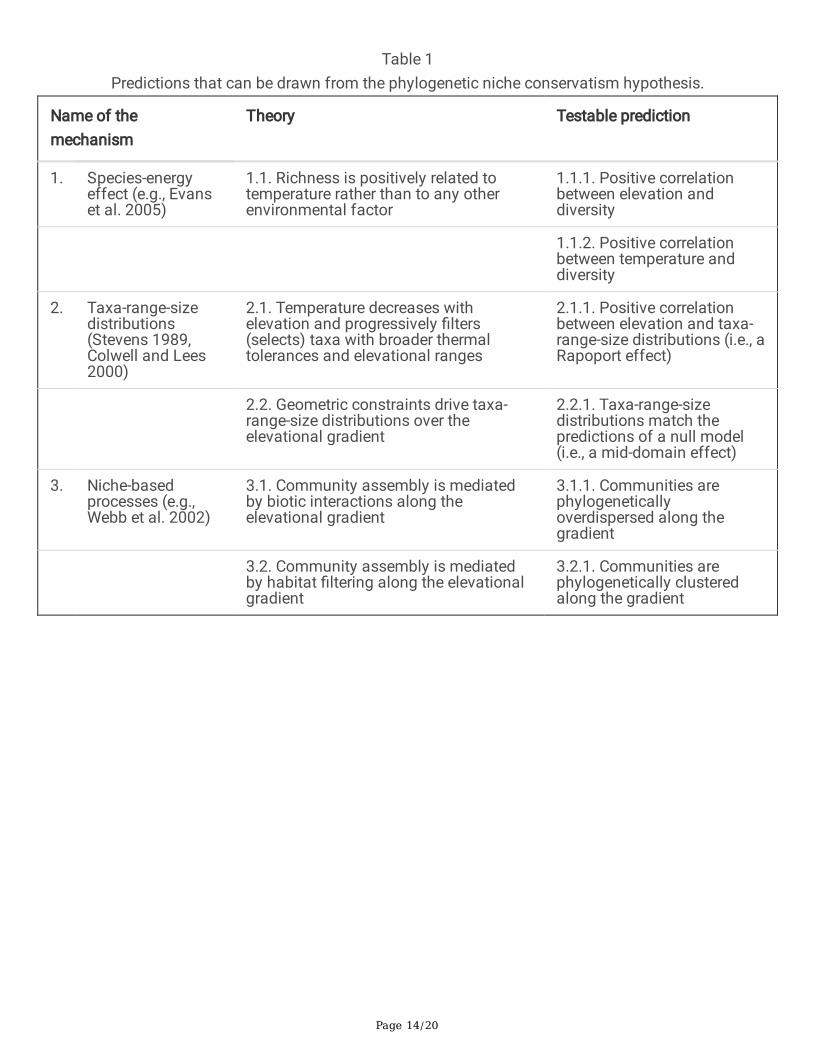
Table 1Predictions that can be drawn from the phylogenetic niche conservatism hypothesis.
Name of themechanism
Theory Testable prediction
1. Species-energyeffect (e.g., Evanset al. 2005)
1.1. Richness is positively related totemperature rather than to any otherenvironmental factor
1.1.1. Positive correlationbetween elevation anddiversity
1.1.2. Positive correlationbetween temperature anddiversity
2. Taxa-range-sizedistributions(Stevens 1989,Colwell and Lees2000)
2.1. Temperature decreases withelevation and progressively �lters(selects) taxa with broader thermaltolerances and elevational ranges
2.1.1. Positive correlationbetween elevation and taxa-range-size distributions (i.e., aRapoport effect)
2.2. Geometric constraints drive taxa-range-size distributions over theelevational gradient
2.2.1. Taxa-range-sizedistributions match thepredictions of a null model(i.e., a mid-domain effect)
3. Niche-basedprocesses (e.g.,Webb et al. 2002)
3.1. Community assembly is mediatedby biotic interactions along theelevational gradient
3.1.1. Communities arephylogeneticallyoverdispersed along thegradient
3.2. Community assembly is mediatedby habitat �ltering along the elevationalgradient
3.2.1. Communities arephylogenetically clusteredalong the gradient
Page 15/20
Table 2Relations between (a) richness and elevation, and (b) richness and average annual temperature.
Relationships were modelled with both linear (L) and quadratic (Q) models. The better model wasselected using the Akaike's information criterion.
Relations Eukaryoticmicrobialgroup
Linear model Quadraticmodel
BetterModel
R2 P R2 P
(a) Richness vs. elevation Soil protistgroup
-0.699 0.002 0.699 0.353 L
Bacillariophyta -0.886 0.000 0.896 0.222 L
Cercomonadida -0.853 0.000 0.847 0.425 L
Ciliophora -0.579 0.006 0.785 0.021 Q
Euglyphida -0.776 0.000 0.842 0.077 L
Kinetoplastida -0.593 0.006 0.877 0.003 Q
(b) Richness vs. average annualtemperature
Soil protistgroup
0.733 0.002 0.766 0.353 L
Bacillariophyta 0.898 0.000 0.919 0.222 L
Cercomonadida 0.869 0.000 0.881 0.425 L
Ciliophora 0.625 0.006 0.833 0.021 Q
Euglyphida 0.801 0.000 0.877 0.077 L
Kinetoplastida 0.638 0.006 0.904 0.003 Q
Figures
Page 16/20
Figure 1
Distribution and elevation in m a.s.l. (color-coded bar) of each of the prospected plots in beechdominated forests (Fagus sylvatica L.) in western Switzerland. Note: The designations employed and thepresentation of the material on this map do not imply the expression of any opinion whatsoever on thepart of Research Square concerning the legal status of any country, territory, city or area or of itsauthorities, or concerning the delimitation of its frontiers or boundaries. This map has been provided bythe authors.

Page 17/20
Figure 2
Relationship between the mean elevational range size (MER) of all eukaryotic microbial groups studiedand elevation. All eukaryotic microbial groups exhibited a signi�cant increase of their elevational rangeswith elevation, conforming to the macroecological pattern of the Rapoport effect.

Page 18/20
Figure 3
Richness (solid circles), upper and lower 95% con�dence limits (broken lines) and average null modelpredictions (dotted line) computed with the Mid-Domain Null program (50,000 Monte Carlo simulationssampled without replacement from empirical taxa-range-size distributions). In all cases, the observedrichness did not show signi�cant relationship (P > 0.05) with null model predictions, indicating that theobserved patterns where not signi�cantly in�uenced by random effects.
Page 19/20
Figure 4
Variation in community phylogenetic relatedness along the gradient studied as measured with both –NRIand –NTI indices. Above zero values indicate phylogenetic overdispersion, while below zero valuesindicate phylogenetic clustering. The –NRI and –NTI values were signi�cant in all cases (P < 0.05).
Supplementary Files

Page 20/20
This is a list of supplementary �les associated with this preprint. Click to download.
AppendixS1.docx
AppendixS2.docx
AppendixS3.docx
AppendixS4.docx


![Lunar Surface Systems Concept Study Innovative Low ...2. Penetration resistance gradient, G [Pa/mm] • Compact the soil to match the penetration resistance gradient of the Apollo](https://img.pdfslide.us/doc/110x75/5fed1d002ae03915723e6b34/lunar-surface-systems-concept-study-innovative-low-2-penetration-resistance.jpg)