Embed Size (px)
Citation preview
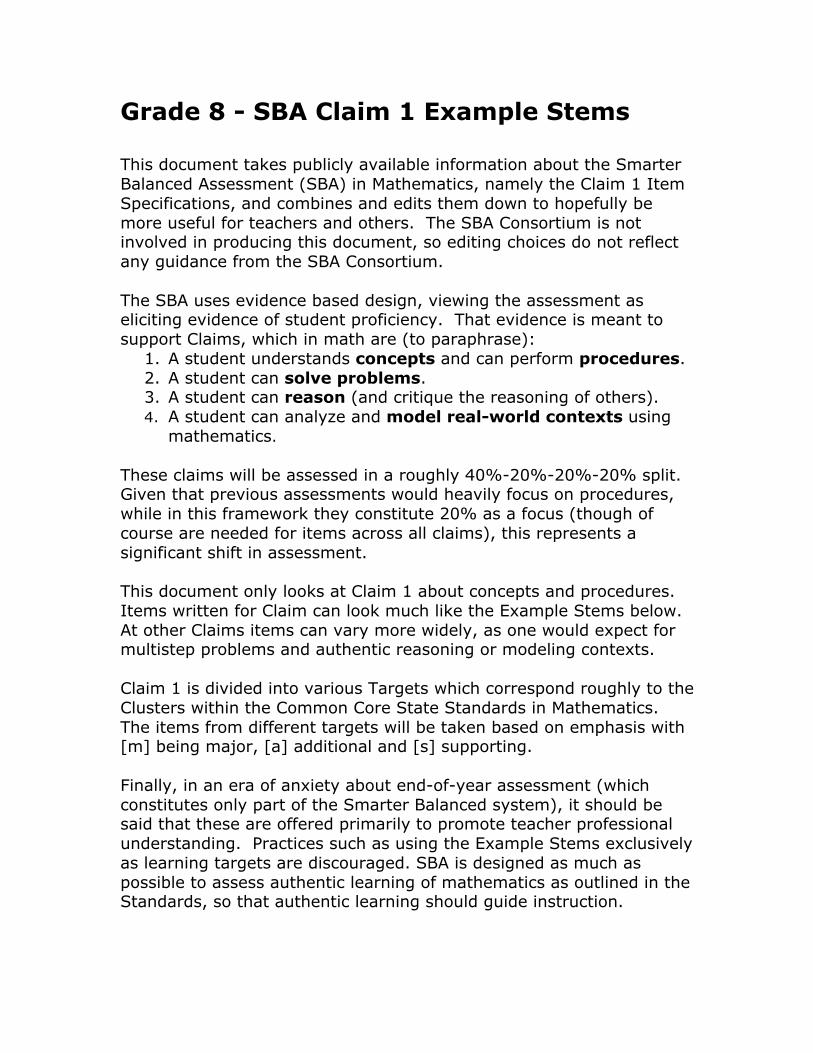
Grade 8 - SBA Claim 1 Example Stems This document takes publicly available information about the Smarter Balanced Assessment (SBA) in Mathematics, namely the Claim 1 Item Specifications, and combines and edits them down to hopefully be more useful for teachers and others. The SBA Consortium is not involved in producing this document, so editing choices do not reflect any guidance from the SBA Consortium. The SBA uses evidence based design, viewing the assessment as eliciting evidence of student proficiency. That evidence is meant to support Claims, which in math are (to paraphrase):
1. A student understands concepts and can perform procedures. 2. A student can solve problems. 3. A student can reason (and critique the reasoning of others). 4. A student can analyze and model real-world contexts using
mathematics. These claims will be assessed in a roughly 40%-20%-20%-20% split. Given that previous assessments would heavily focus on procedures, while in this framework they constitute 20% as a focus (though of course are needed for items across all claims), this represents a significant shift in assessment. This document only looks at Claim 1 about concepts and procedures. Items written for Claim can look much like the Example Stems below. At other Claims items can vary more widely, as one would expect for multistep problems and authentic reasoning or modeling contexts. Claim 1 is divided into various Targets which correspond roughly to the Clusters within the Common Core State Standards in Mathematics. The items from different targets will be taken based on emphasis with [m] being major, [a] additional and [s] supporting. Finally, in an era of anxiety about end-of-year assessment (which constitutes only part of the Smarter Balanced system), it should be said that these are offered primarily to promote teacher professional understanding. Practices such as using the Example Stems exclusively as learning targets are discouraged. SBA is designed as much as possible to assess authentic learning of mathematics as outlined in the Standards, so that authentic learning should guide instruction.
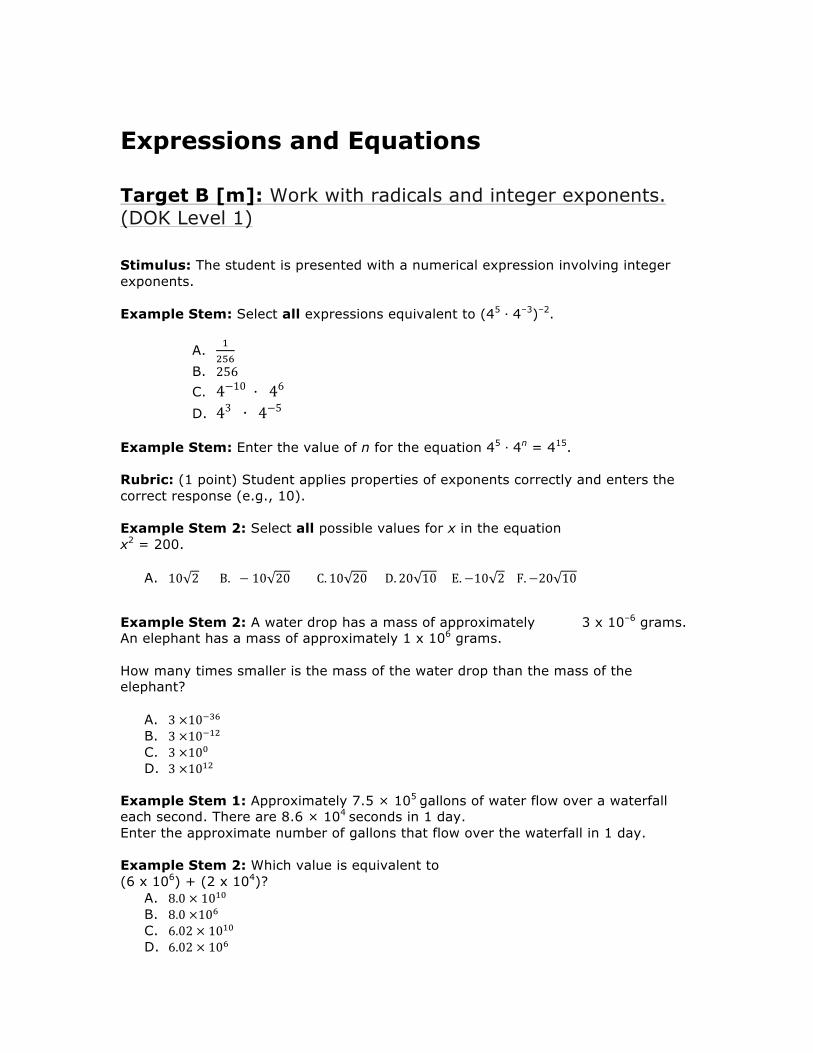
Expressions and Equations Target B [m]: Work with radicals and integer exponents. (DOK Level 1) Stimulus: The student is presented with a numerical expression involving integer exponents. Example Stem: Select all expressions equivalent to (45 ∙ 4–3)–2.
A. !!"#
B. 256 C. 4−10 · 46 D. 43 ∙ 4−5
Example Stem: Enter the value of n for the equation 45 ∙ 4n = 415. Rubric: (1 point) Student applies properties of exponents correctly and enters the correct response (e.g., 10). Example Stem 2: Select all possible values for x in the equation x2 = 200.
A. 10 2 B. − 10 20 C. 10 20 D. 20 10 E.−10 2 F.−20 10
Example Stem 2: A water drop has a mass of approximately 3 x 10⁻⁶ grams. An elephant has a mass of approximately 1 x 10⁶ grams. How many times smaller is the mass of the water drop than the mass of the elephant?
A. 3 ×10!!" B. 3 ×10!!" C. 3 ×10! D. 3 ×10!"
Example Stem 1: Approximately 7.5 × 10⁵ gallons of water flow over a waterfall each second. There are 8.6 × 10⁴ seconds in 1 day. Enter the approximate number of gallons that flow over the waterfall in 1 day. Example Stem 2: Which value is equivalent to (6 x 10⁶) + (2 x 10⁴)?
A. 8.0 × 10!" B. 8.0 ×10! C. 6.02 × 10!" D. 6.02 × 10!
.
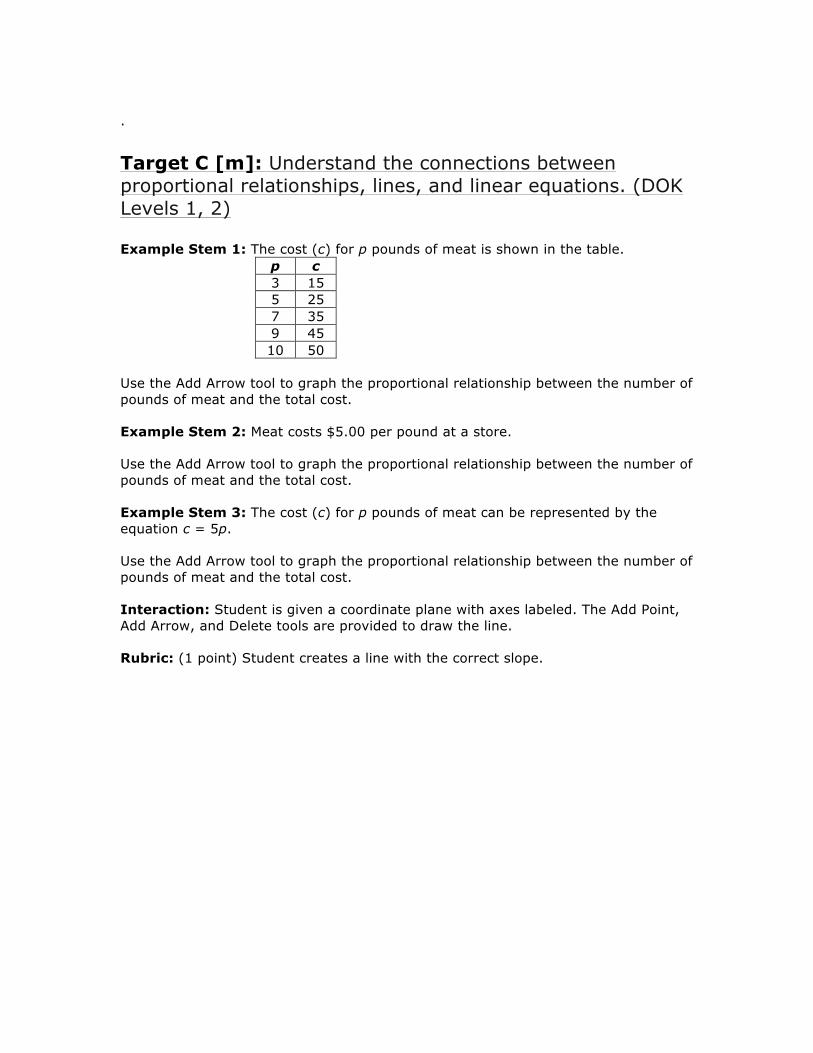
Target C [m]: Understand the connections between proportional relationships, lines, and linear equations. (DOK Levels 1, 2) Example Stem 1: The cost (c) for p pounds of meat is shown in the table.
p c 3 15 5 25 7 35 9 45 10 50
Use the Add Arrow tool to graph the proportional relationship between the number of pounds of meat and the total cost. Example Stem 2: Meat costs $5.00 per pound at a store. Use the Add Arrow tool to graph the proportional relationship between the number of pounds of meat and the total cost. Example Stem 3: The cost (c) for p pounds of meat can be represented by the equation c = 5p. Use the Add Arrow tool to graph the proportional relationship between the number of pounds of meat and the total cost. Interaction: Student is given a coordinate plane with axes labeled. The Add Point, Add Arrow, and Delete tools are provided to draw the line. Rubric: (1 point) Student creates a line with the correct slope.
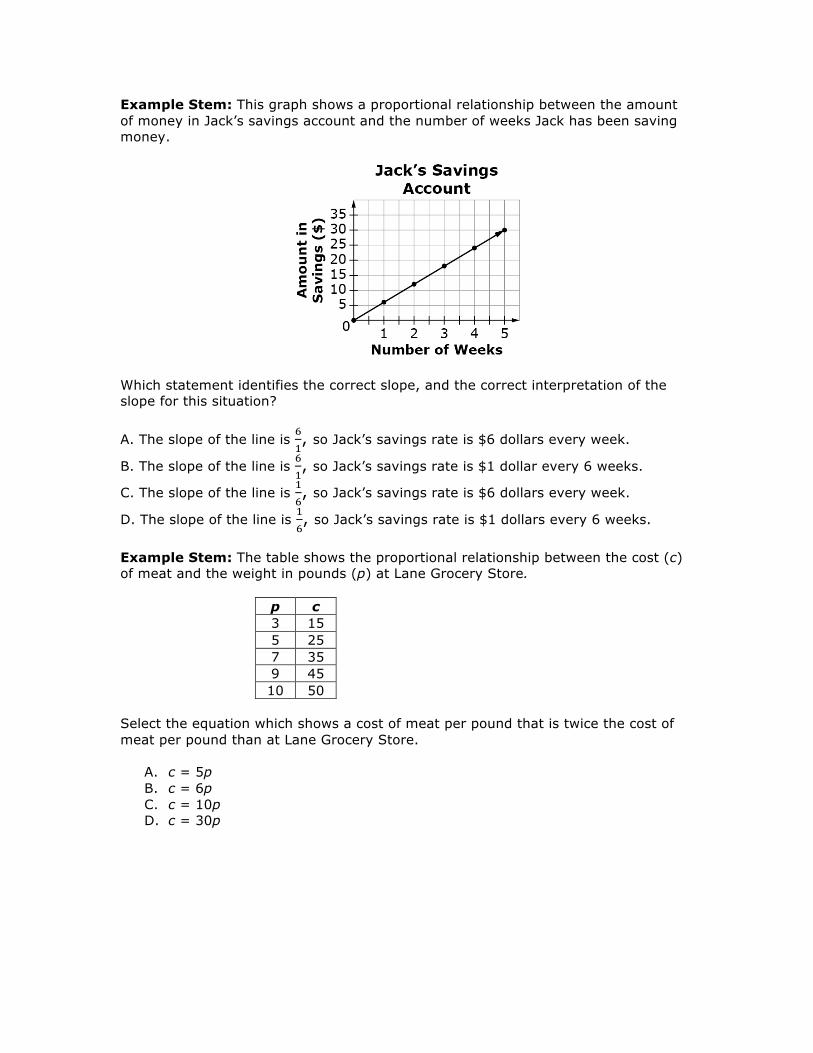
Example Stem: This graph shows a proportional relationship between the amount of money in Jack’s savings account and the number of weeks Jack has been saving money.
Which statement identifies the correct slope, and the correct interpretation of the slope for this situation?
A. The slope of the line is !!, so Jack’s savings rate is $6 dollars every week.
B. The slope of the line is !!, so Jack’s savings rate is $1 dollar every 6 weeks.
C. The slope of the line is !!, so Jack’s savings rate is $6 dollars every week.
D. The slope of the line is !!, so Jack’s savings rate is $1 dollars every 6 weeks.
Example Stem: The table shows the proportional relationship between the cost (c) of meat and the weight in pounds (p) at Lane Grocery Store.
p c 3 15 5 25 7 35 9 45 10 50
Select the equation which shows a cost of meat per pound that is twice the cost of meat per pound than at Lane Grocery Store.
A. c = 5p B. c = 6p C. c = 10p D. c = 30p
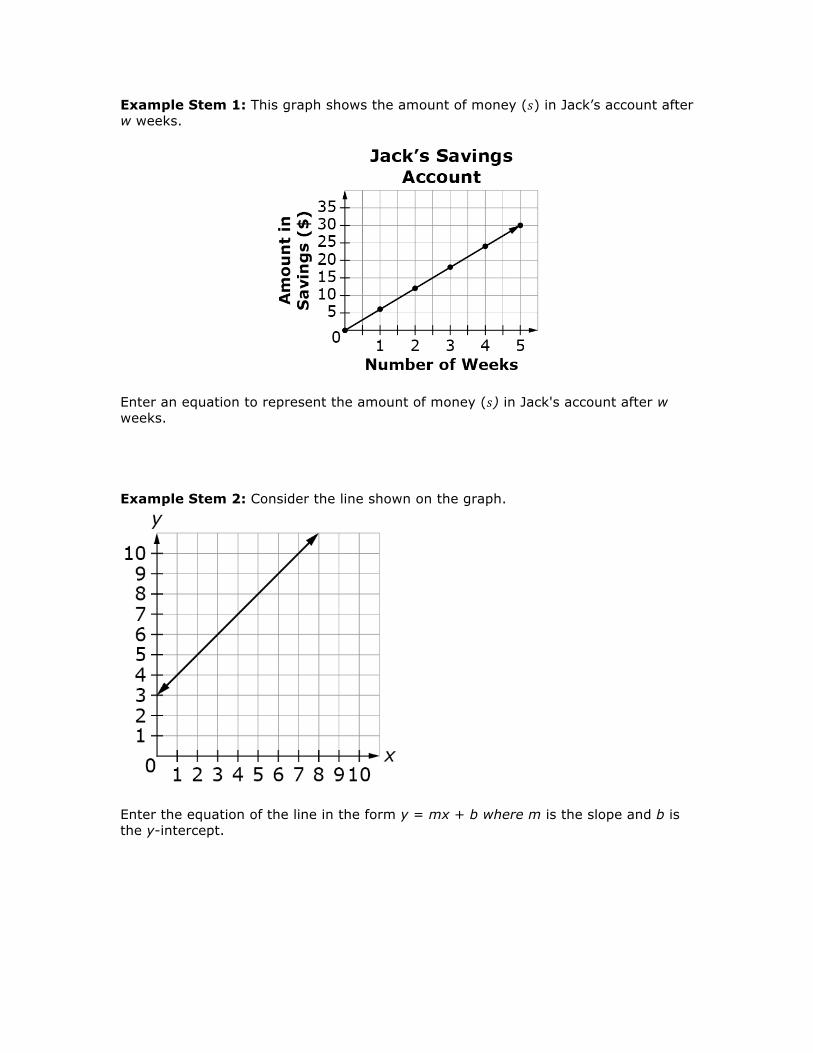
Example Stem 1: This graph shows the amount of money (𝑠) in Jack’s account after w weeks.
Enter an equation to represent the amount of money (𝑠) in Jack's account after w weeks. Example Stem 2: Consider the line shown on the graph.
Enter the equation of the line in the form y = mx + b where m is the slope and b is the y-intercept.
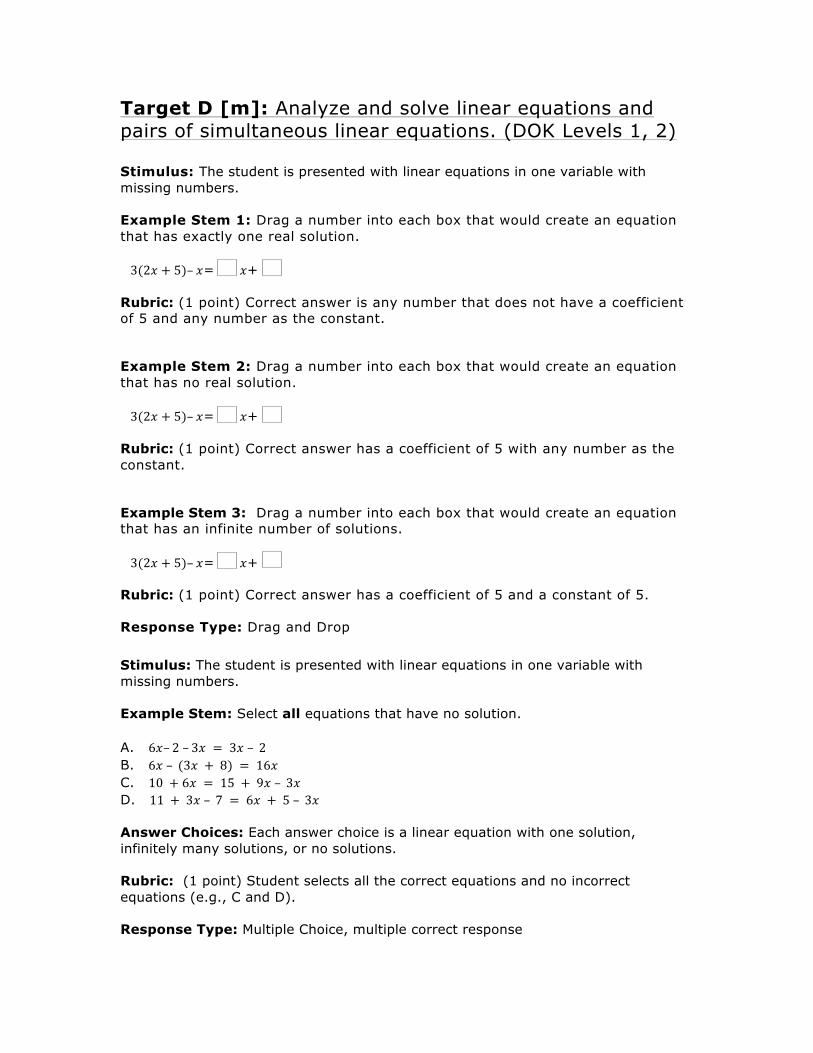
Target D [m]: Analyze and solve linear equations and pairs of simultaneous linear equations. (DOK Levels 1, 2) Stimulus: The student is presented with linear equations in one variable with missing numbers. Example Stem 1: Drag a number into each box that would create an equation that has exactly one real solution. 3(2𝑥 + 5)– 𝑥= 𝑥+ Rubric: (1 point) Correct answer is any number that does not have a coefficient of 5 and any number as the constant.
Example Stem 2: Drag a number into each box that would create an equation that has no real solution. 3(2𝑥 + 5)– 𝑥= 𝑥+ Rubric: (1 point) Correct answer has a coefficient of 5 with any number as the constant.
Example Stem 3: Drag a number into each box that would create an equation that has an infinite number of solutions. 3(2𝑥 + 5)– 𝑥= 𝑥+ Rubric: (1 point) Correct answer has a coefficient of 5 and a constant of 5. Response Type: Drag and Drop Stimulus: The student is presented with linear equations in one variable with missing numbers. Example Stem: Select all equations that have no solution. A. 6𝑥– 2 – 3𝑥 = 3𝑥 – 2 B. 6𝑥 – (3𝑥 + 8) = 16𝑥 C. 10 + 6𝑥 = 15 + 9𝑥 – 3𝑥 D. 11 + 3𝑥 – 7 = 6𝑥 + 5 – 3𝑥 Answer Choices: Each answer choice is a linear equation with one solution, infinitely many solutions, or no solutions. Rubric: (1 point) Student selects all the correct equations and no incorrect equations (e.g., C and D). Response Type: Multiple Choice, multiple correct response
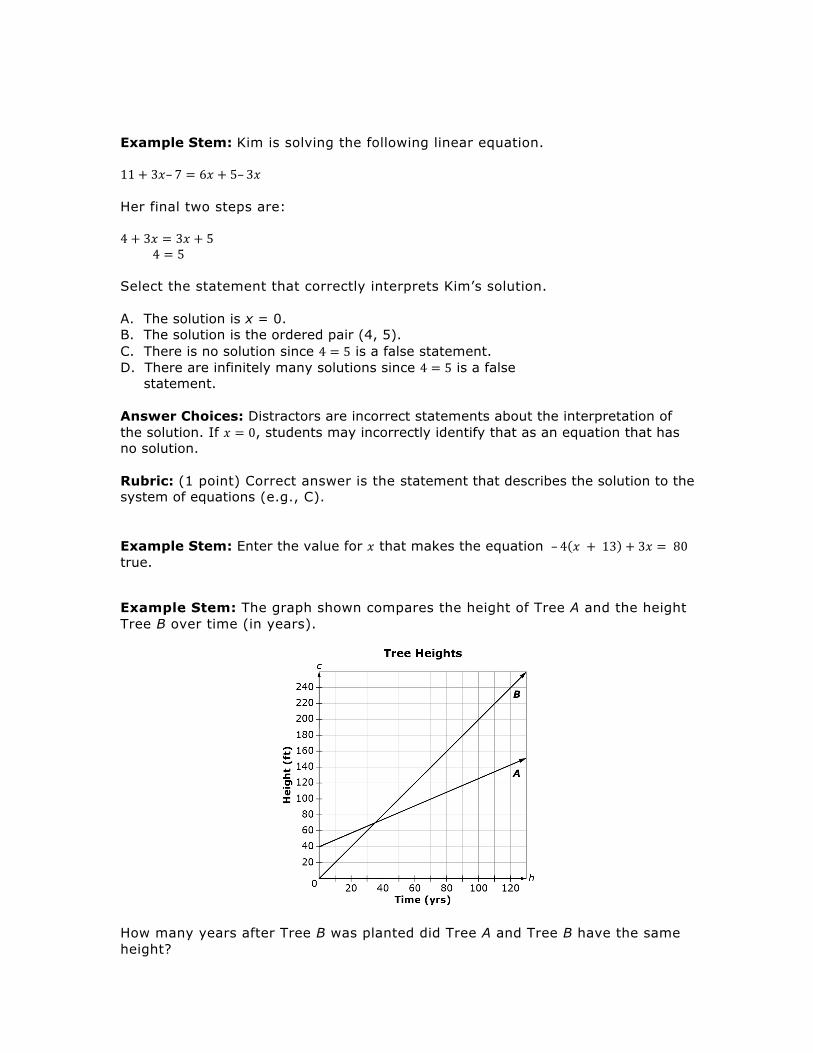
Example Stem: Kim is solving the following linear equation. 11 + 3𝑥– 7 = 6𝑥 + 5– 3𝑥 Her final two steps are: 4 + 3𝑥 = 3𝑥 + 5 4 = 5 Select the statement that correctly interprets Kim’s solution. A. The solution is x = 0. B. The solution is the ordered pair (4, 5). C. There is no solution since 4 = 5 is a false statement. D. There are infinitely many solutions since 4 = 5 is a false statement. Answer Choices: Distractors are incorrect statements about the interpretation of the solution. If 𝑥 = 0, students may incorrectly identify that as an equation that has no solution. Rubric: (1 point) Correct answer is the statement that describes the solution to the system of equations (e.g., C).
Example Stem: Enter the value for 𝑥 that makes the equation – 4 𝑥 + 13 + 3𝑥 = 80 true.
Example Stem: The graph shown compares the height of Tree A and the height Tree B over time (in years).
How many years after Tree B was planted did Tree A and Tree B have the same height?
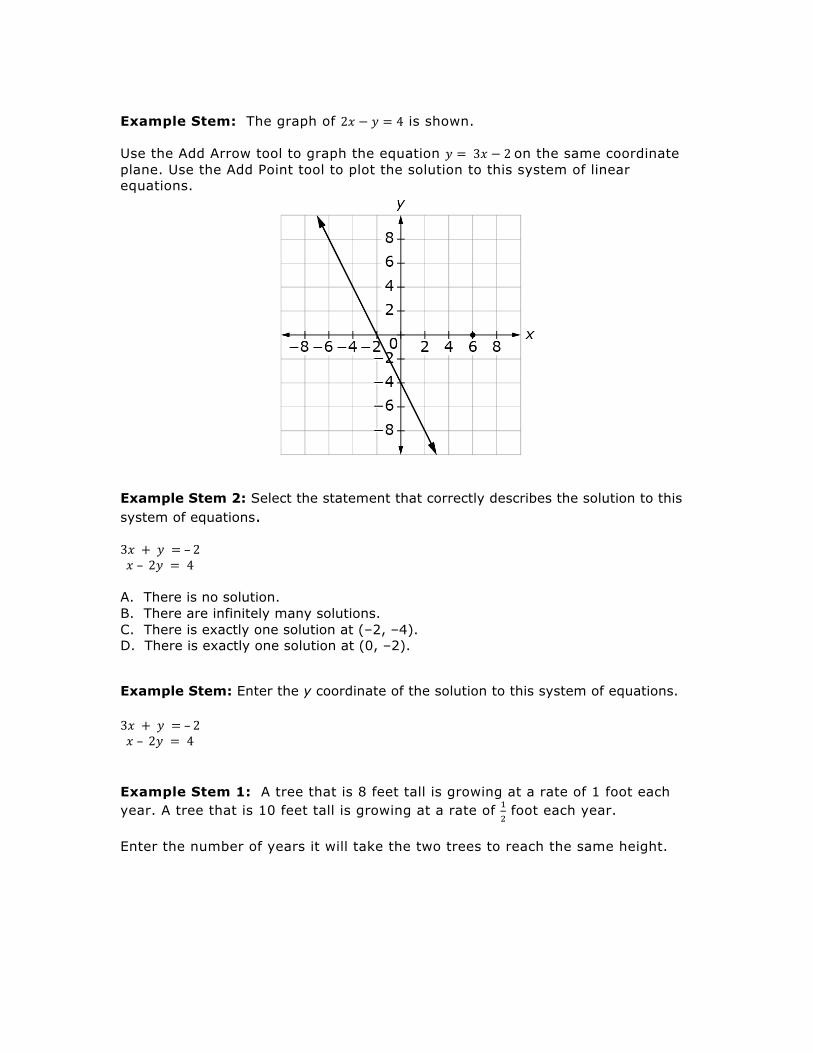
Example Stem: The graph of 2𝑥 − 𝑦 = 4 is shown. Use the Add Arrow tool to graph the equation 𝑦 = 3𝑥 − 2 on the same coordinate plane. Use the Add Point tool to plot the solution to this system of linear equations.
Example Stem 2: Select the statement that correctly describes the solution to this system of equations. 3𝑥 + 𝑦 = – 2 𝑥 – 2𝑦 = 4 A. There is no solution. B. There are infinitely many solutions. C. There is exactly one solution at (–2, –4). D. There is exactly one solution at (0, –2).
Example Stem: Enter the y coordinate of the solution to this system of equations. 3𝑥 + 𝑦 = – 2 𝑥 – 2𝑦 = 4 Example Stem 1: A tree that is 8 feet tall is growing at a rate of 1 foot each year. A tree that is 10 feet tall is growing at a rate of !
! foot each year.
Enter the number of years it will take the two trees to reach the same height.
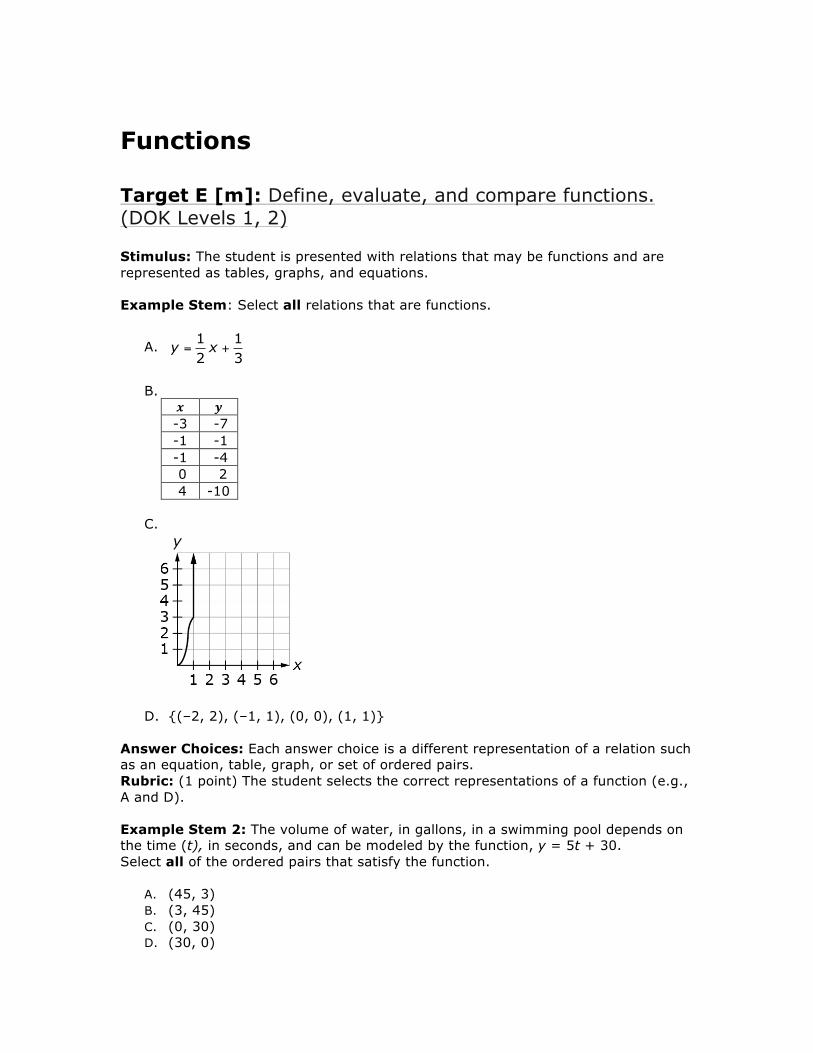
Functions Target E [m]: Define, evaluate, and compare functions. (DOK Levels 1, 2) Stimulus: The student is presented with relations that may be functions and are represented as tables, graphs, and equations. Example Stem: Select all relations that are functions.
A. 31
21 += xy
B.
𝒙 𝒚 -3 -7 -1 -1 -1 -4 0 2 4 -10
C.
D. {(–2, 2), (–1, 1), (0, 0), (1, 1)} Answer Choices: Each answer choice is a different representation of a relation such as an equation, table, graph, or set of ordered pairs. Rubric: (1 point) The student selects the correct representations of a function (e.g., A and D). Example Stem 2: The volume of water, in gallons, in a swimming pool depends on the time (t), in seconds, and can be modeled by the function, y = 5t + 30. Select all of the ordered pairs that satisfy the function.
A. (45, 3) B. (3, 45) C. (0, 30) D. (30, 0)
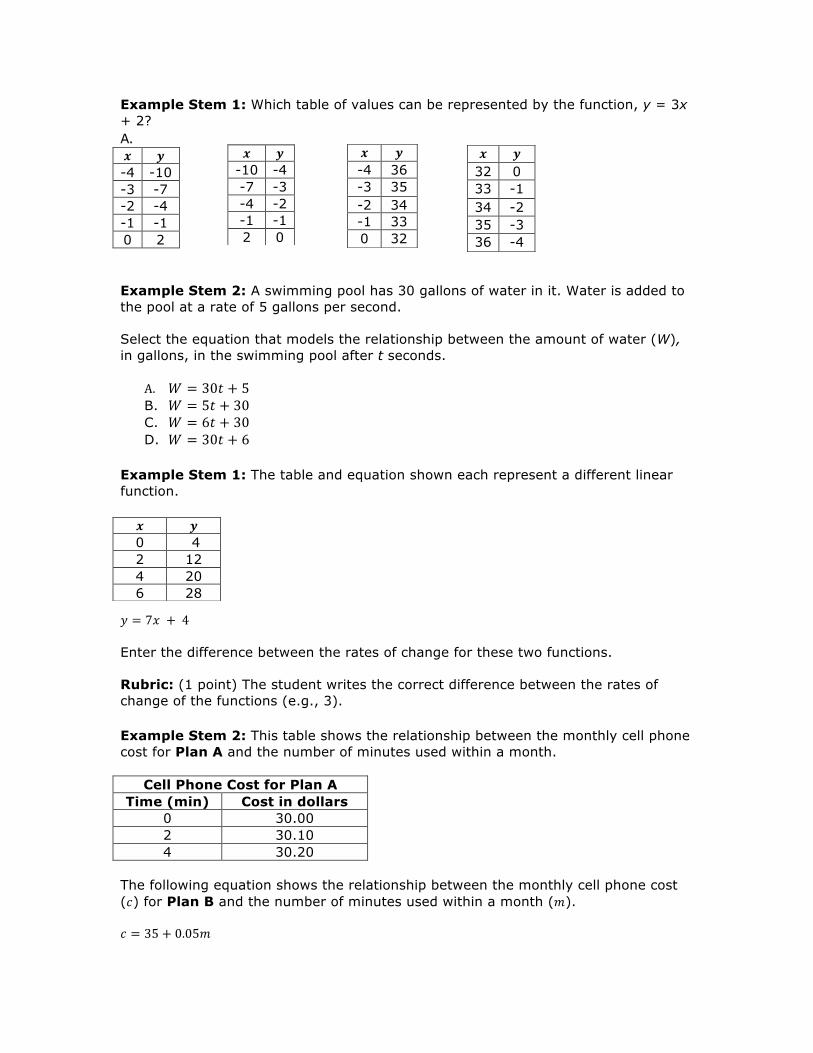
Example Stem 1: Which table of values can be represented by the function, y = 3x + 2? A. 𝒙 𝒚 -4 -10 -3 -7 -2 -4 -1 -1 0 2
Example Stem 2: A swimming pool has 30 gallons of water in it. Water is added to the pool at a rate of 5 gallons per second. Select the equation that models the relationship between the amount of water (W), in gallons, in the swimming pool after t seconds.
A. 𝑊 = 30𝑡 + 5 B. 𝑊 = 5𝑡 + 30 C. 𝑊 = 6𝑡 + 30 D. 𝑊 = 30𝑡 + 6
Example Stem 1: The table and equation shown each represent a different linear function.
𝑦 = 7𝑥 + 4 Enter the difference between the rates of change for these two functions. Rubric: (1 point) The student writes the correct difference between the rates of change of the functions (e.g., 3). Example Stem 2: This table shows the relationship between the monthly cell phone cost for Plan A and the number of minutes used within a month.
Cell Phone Cost for Plan A Time (min) Cost in dollars
0 30.00 2 30.10 4 30.20
The following equation shows the relationship between the monthly cell phone cost (𝑐) for Plan B and the number of minutes used within a month (𝑚). 𝑐 = 35 + 0.05𝑚
𝒙 𝒚 -10 -4 -7 -3 -4 -2 -1 -1 2 0
𝒙 𝒚 -4 36 -3 35 -2 34 -1 33 0 32
𝒙 𝒚 32 0 33 -1 34 -2 35 -3 36 -4
𝒙 𝒚 0 4 2 12 4 20 6 28
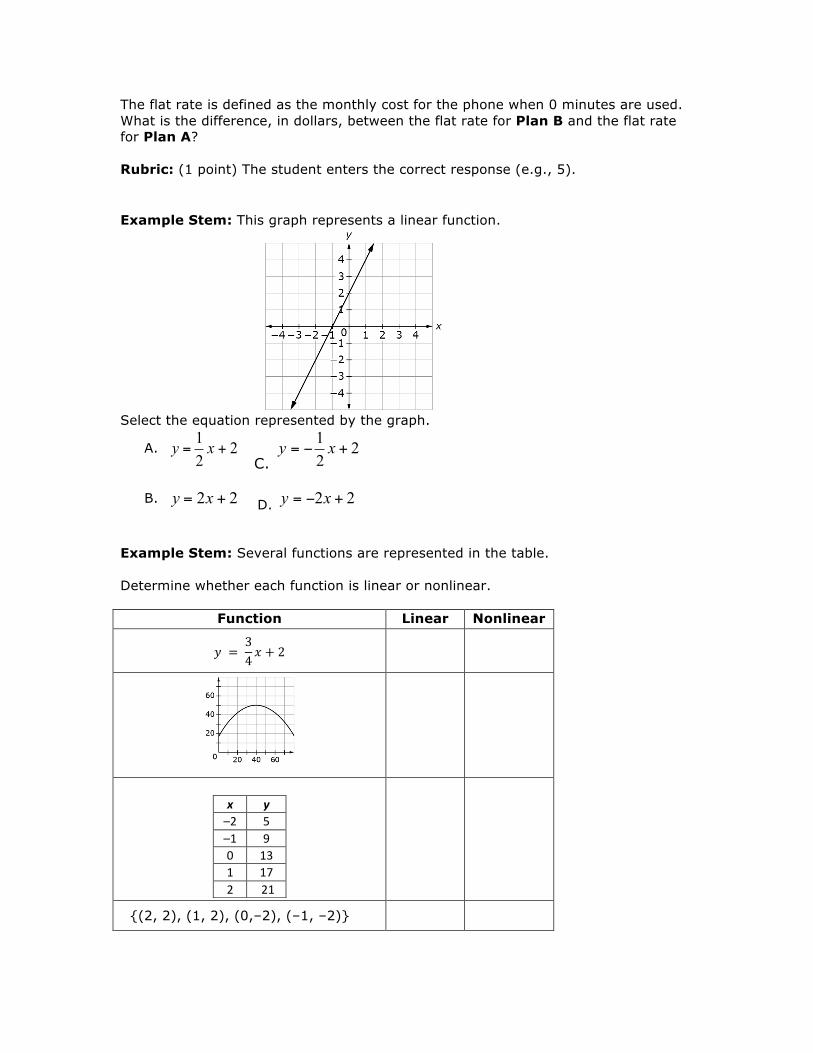
The flat rate is defined as the monthly cost for the phone when 0 minutes are used. What is the difference, in dollars, between the flat rate for Plan B and the flat rate for Plan A? Rubric: (1 point) The student enters the correct response (e.g., 5). Example Stem: This graph represents a linear function.
Select the equation represented by the graph.
A. 221
+= xy C.
221
+−= xy
B. 22 += xy D. 22 +−= xy
Example Stem: Several functions are represented in the table. Determine whether each function is linear or nonlinear.
Function Linear Nonlinear
𝑦 = 34𝑥 + 2
x y –2 5 –1 9 0 13 1 17 2 21
{(2, 2), (1, 2), (0,–2), (–1, –2)}
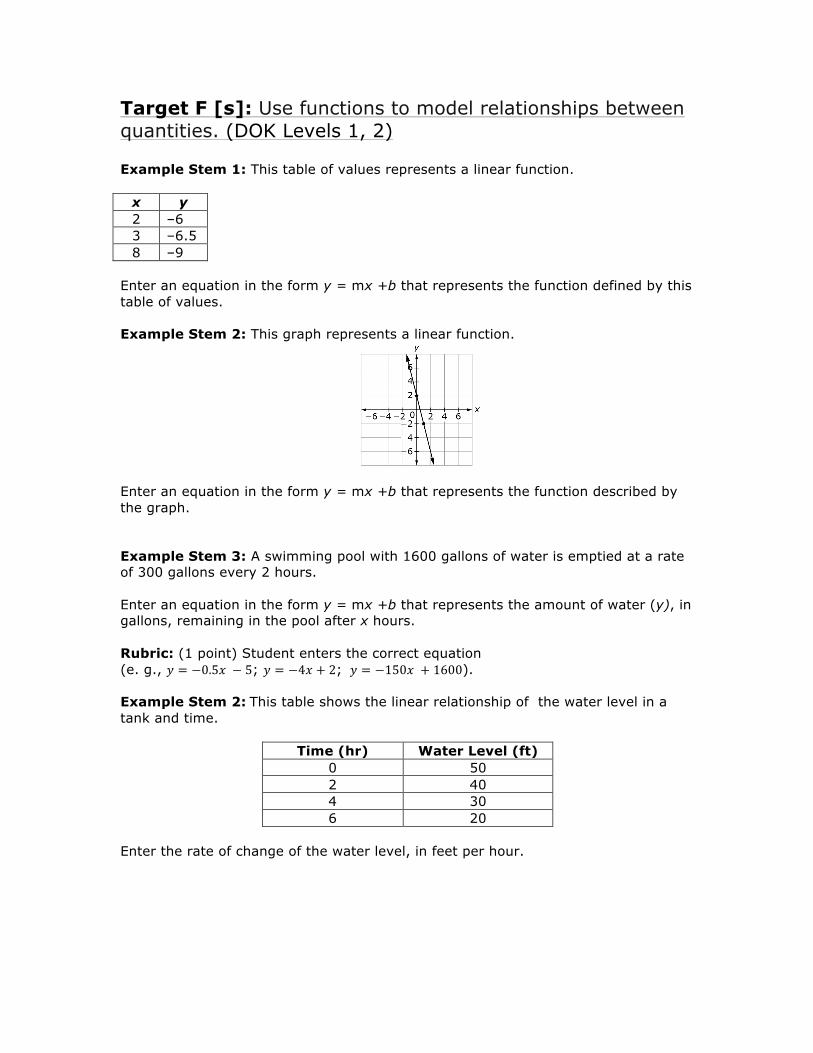
Target F [s]: Use functions to model relationships between quantities. (DOK Levels 1, 2) Example Stem 1: This table of values represents a linear function.
x y 2 –6 3 –6.5 8 –9
Enter an equation in the form y = mx +b that represents the function defined by this table of values. Example Stem 2: This graph represents a linear function.
Enter an equation in the form y = mx +b that represents the function described by the graph. Example Stem 3: A swimming pool with 1600 gallons of water is emptied at a rate of 300 gallons every 2 hours. Enter an equation in the form y = mx +b that represents the amount of water (y), in gallons, remaining in the pool after x hours. Rubric: (1 point) Student enters the correct equation (e. g., 𝑦 = −0.5𝑥 − 5; 𝑦 = −4𝑥 + 2; 𝑦 = −150𝑥 + 1600). Example Stem 2: This table shows the linear relationship of the water level in a tank and time.
Time (hr) Water Level (ft) 0 50 2 40 4 30 6 20
Enter the rate of change of the water level, in feet per hour.
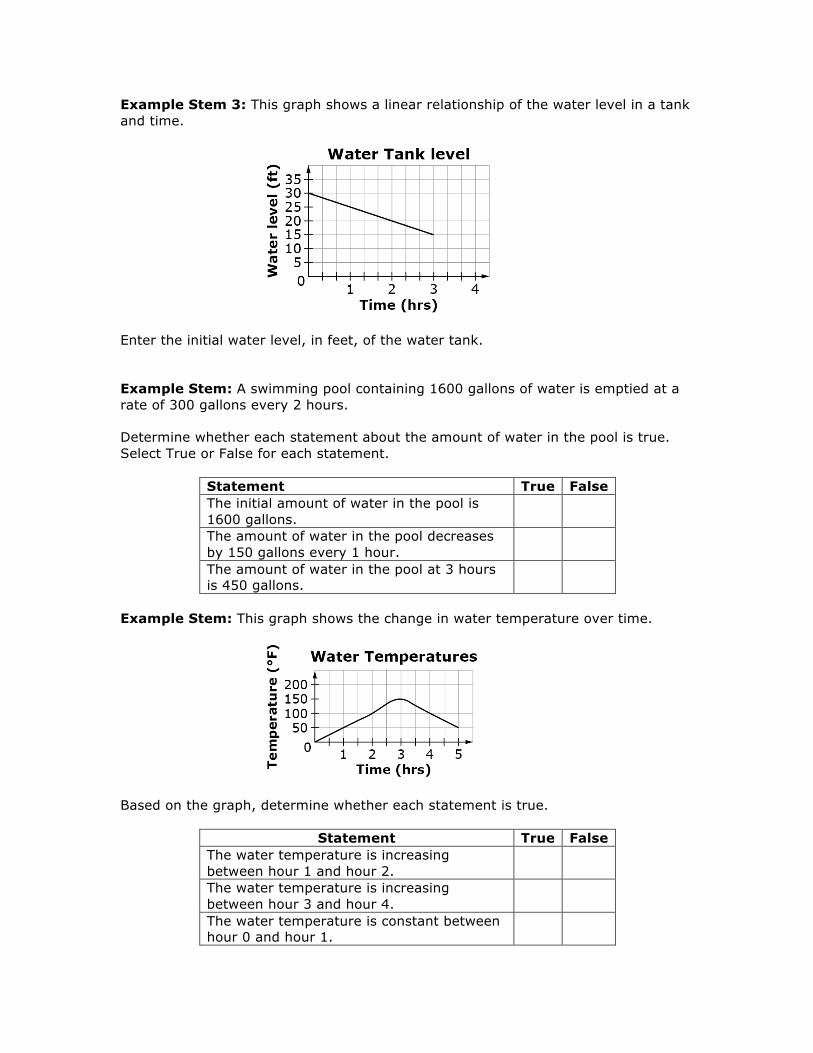
Example Stem 3: This graph shows a linear relationship of the water level in a tank and time.
Enter the initial water level, in feet, of the water tank. Example Stem: A swimming pool containing 1600 gallons of water is emptied at a rate of 300 gallons every 2 hours. Determine whether each statement about the amount of water in the pool is true. Select True or False for each statement.
Statement True False The initial amount of water in the pool is 1600 gallons.
The amount of water in the pool decreases by 150 gallons every 1 hour.
The amount of water in the pool at 3 hours is 450 gallons.
Example Stem: This graph shows the change in water temperature over time.
Based on the graph, determine whether each statement is true.
Statement True False The water temperature is increasing between hour 1 and hour 2.
The water temperature is increasing between hour 3 and hour 4.
The water temperature is constant between hour 0 and hour 1.
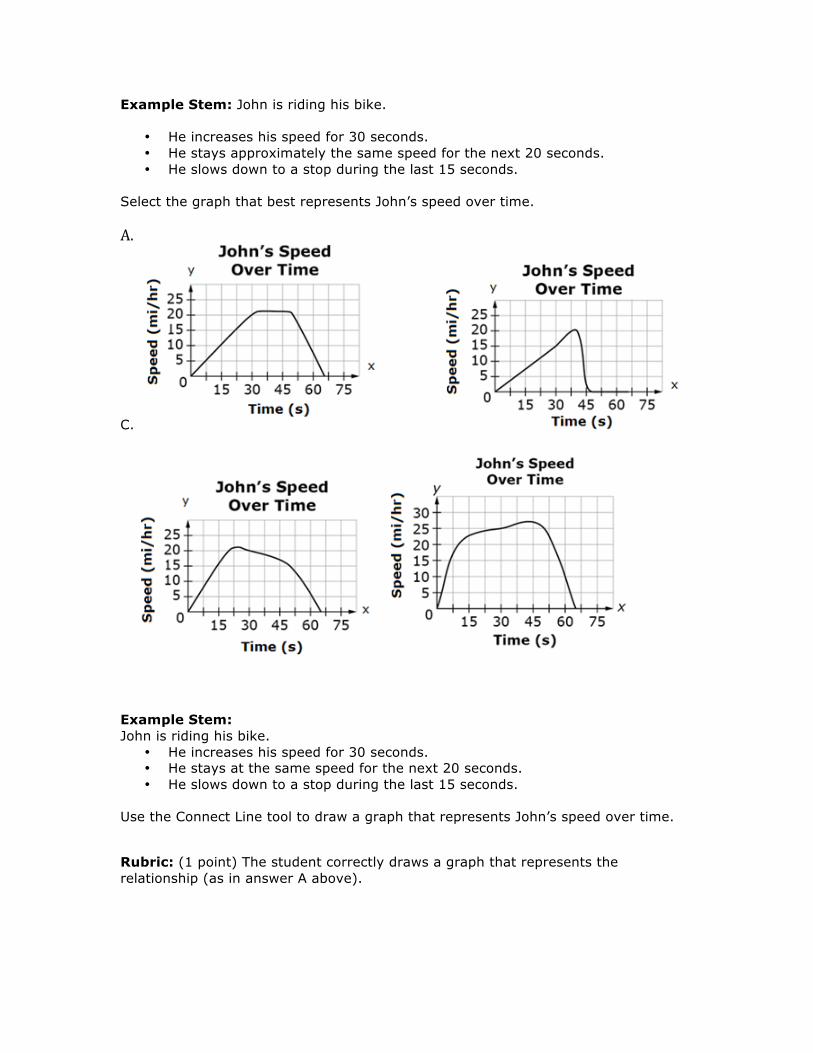
Example Stem: John is riding his bike.
• He increases his speed for 30 seconds. • He stays approximately the same speed for the next 20 seconds. • He slows down to a stop during the last 15 seconds.
Select the graph that best represents John’s speed over time. A. C.
Example Stem: John is riding his bike.
• He increases his speed for 30 seconds. • He stays at the same speed for the next 20 seconds. • He slows down to a stop during the last 15 seconds.
Use the Connect Line tool to draw a graph that represents John’s speed over time.
Rubric: (1 point) The student correctly draws a graph that represents the relationship (as in answer A above).
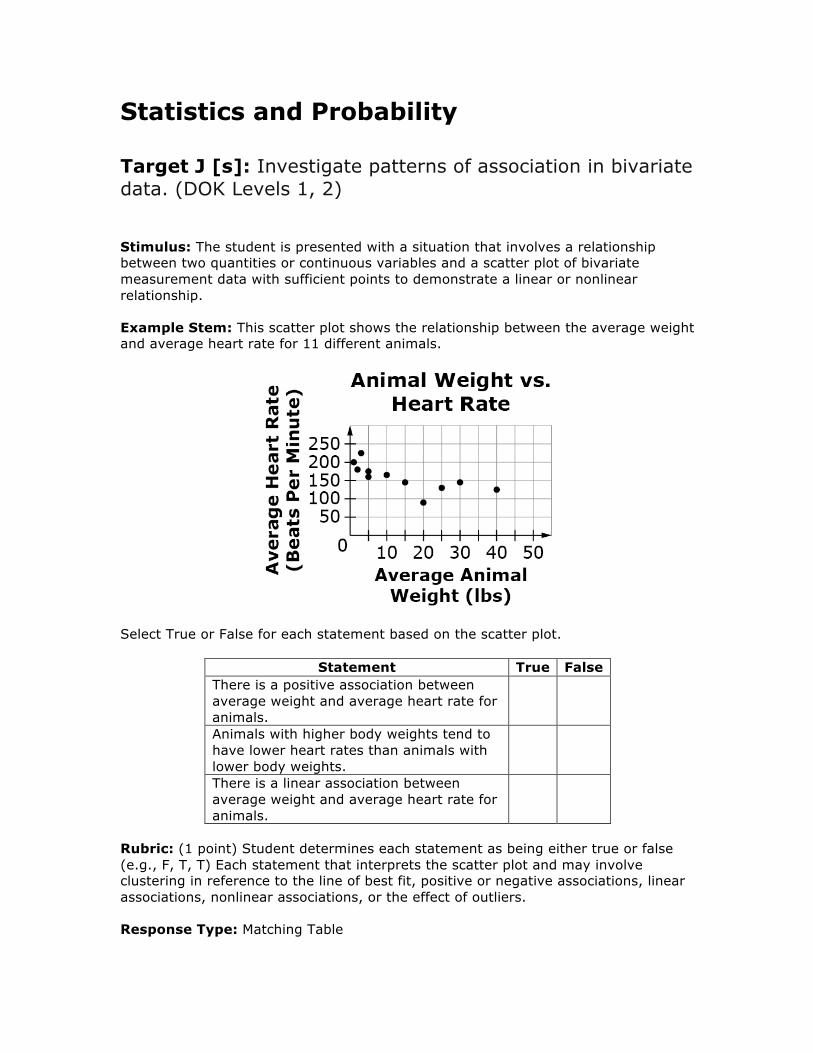
Statistics and Probability Target J [s]: Investigate patterns of association in bivariate data. (DOK Levels 1, 2) Stimulus: The student is presented with a situation that involves a relationship between two quantities or continuous variables and a scatter plot of bivariate measurement data with sufficient points to demonstrate a linear or nonlinear relationship. Example Stem: This scatter plot shows the relationship between the average weight and average heart rate for 11 different animals.
Select True or False for each statement based on the scatter plot.
Statement True False There is a positive association between average weight and average heart rate for animals.
Animals with higher body weights tend to have lower heart rates than animals with lower body weights.
There is a linear association between average weight and average heart rate for animals.
Rubric: (1 point) Student determines each statement as being either true or false (e.g., F, T, T) Each statement that interprets the scatter plot and may involve clustering in reference to the line of best fit, positive or negative associations, linear associations, nonlinear associations, or the effect of outliers. Response Type: Matching Table
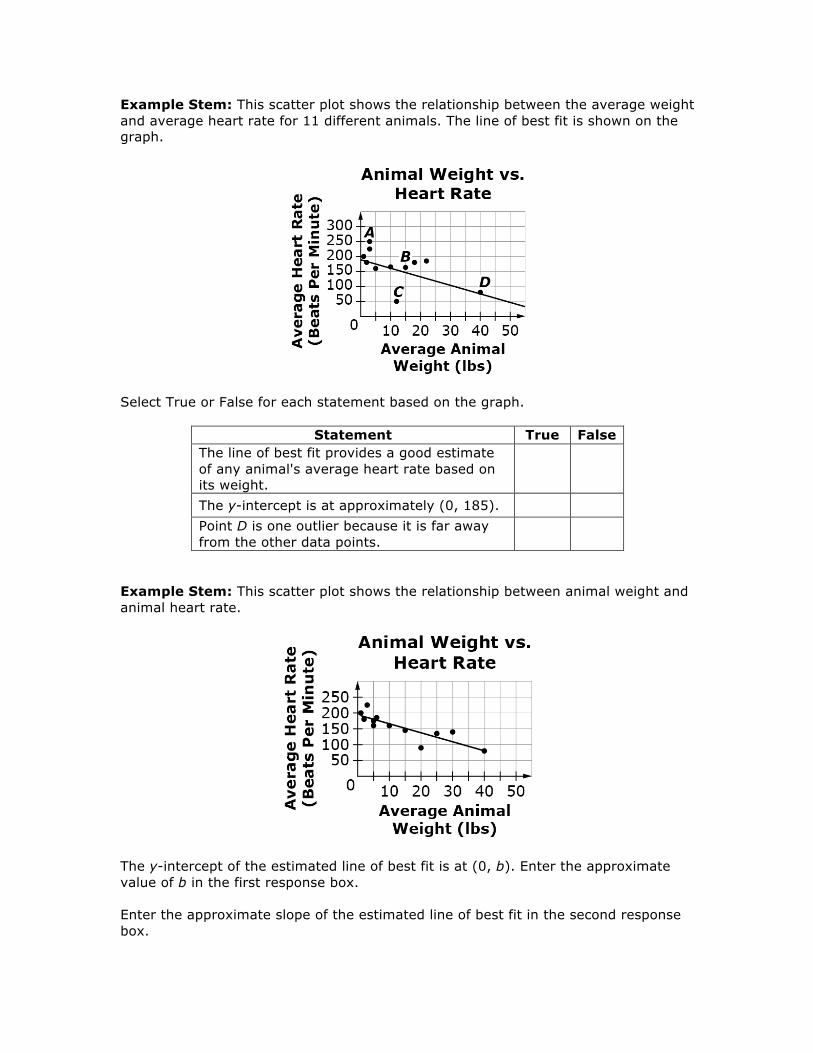
Example Stem: This scatter plot shows the relationship between the average weight and average heart rate for 11 different animals. The line of best fit is shown on the graph.
Select True or False for each statement based on the graph.
Statement True False The line of best fit provides a good estimate of any animal's average heart rate based on its weight.
The y-intercept is at approximately (0, 185). Point D is one outlier because it is far away from the other data points.
Example Stem: This scatter plot shows the relationship between animal weight and animal heart rate.
The y-intercept of the estimated line of best fit is at (0, b). Enter the approximate value of b in the first response box. Enter the approximate slope of the estimated line of best fit in the second response box.
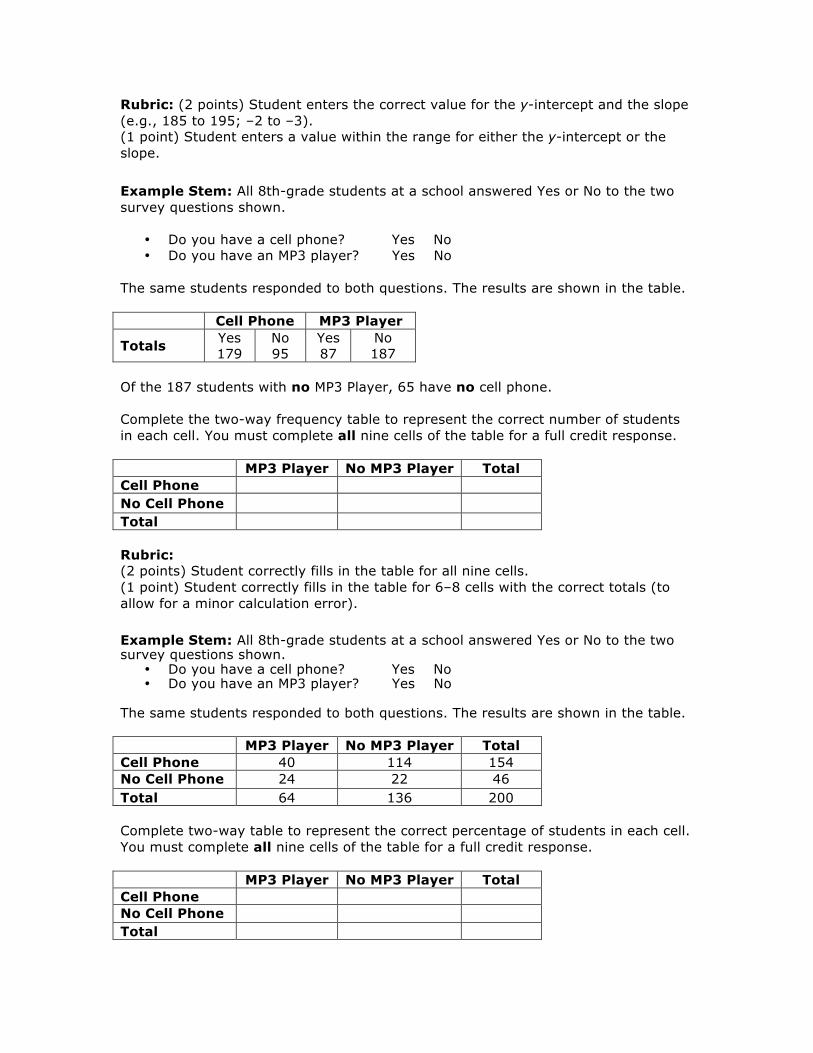
Rubric: (2 points) Student enters the correct value for the y-intercept and the slope (e.g., 185 to 195; –2 to –3). (1 point) Student enters a value within the range for either the y-intercept or the slope. Example Stem: All 8th-grade students at a school answered Yes or No to the two survey questions shown.
• Do you have a cell phone? Yes No • Do you have an MP3 player? Yes No
The same students responded to both questions. The results are shown in the table.
Cell Phone MP3 Player
Totals Yes 179
No 95
Yes 87
No 187
Of the 187 students with no MP3 Player, 65 have no cell phone. Complete the two-way frequency table to represent the correct number of students in each cell. You must complete all nine cells of the table for a full credit response.
MP3 Player No MP3 Player Total Cell Phone No Cell Phone Total Rubric: (2 points) Student correctly fills in the table for all nine cells. (1 point) Student correctly fills in the table for 6–8 cells with the correct totals (to allow for a minor calculation error). Example Stem: All 8th-grade students at a school answered Yes or No to the two survey questions shown.
• Do you have a cell phone? Yes No • Do you have an MP3 player? Yes No
The same students responded to both questions. The results are shown in the table.
MP3 Player No MP3 Player Total Cell Phone 40 114 154 No Cell Phone 24 22 46 Total 64 136 200 Complete two-way table to represent the correct percentage of students in each cell. You must complete all nine cells of the table for a full credit response.
MP3 Player No MP3 Player Total Cell Phone No Cell Phone Total
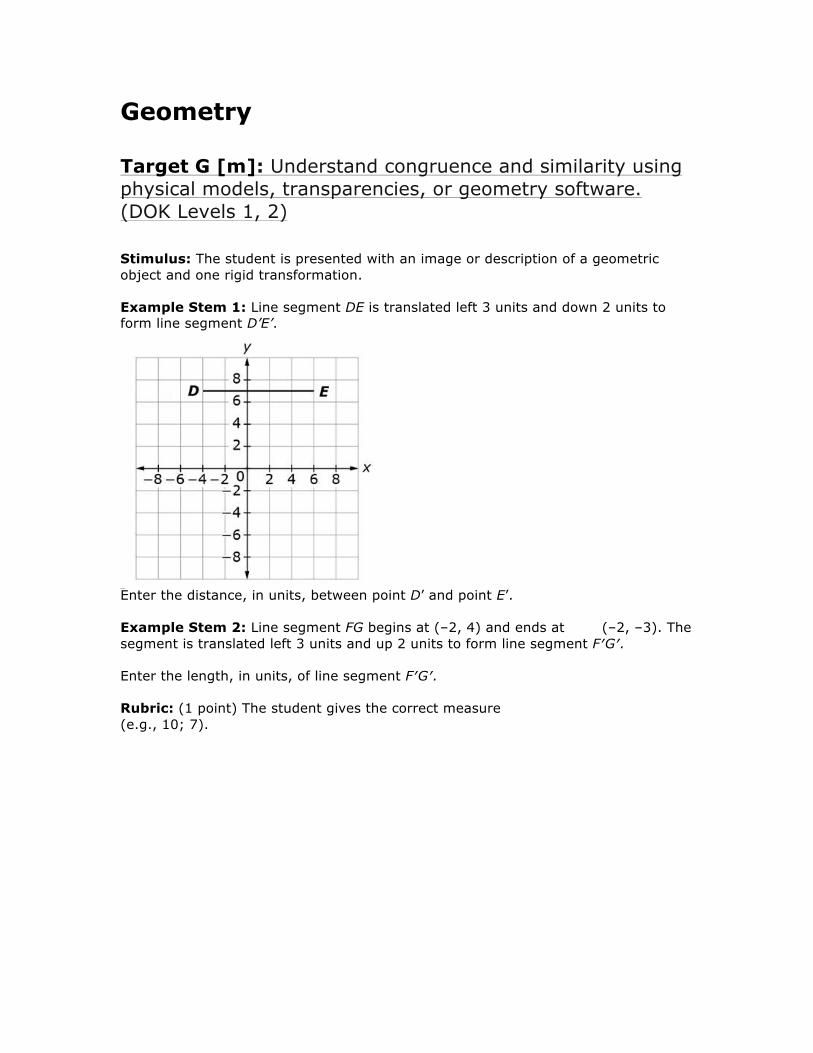
Geometry Target G [m]: Understand congruence and similarity using physical models, transparencies, or geometry software. (DOK Levels 1, 2) Stimulus: The student is presented with an image or description of a geometric object and one rigid transformation. Example Stem 1: Line segment DE is translated left 3 units and down 2 units to form line segment D’E’.
Enter the distance, in units, between point D’ and point E’. Example Stem 2: Line segment FG begins at (–2, 4) and ends at (–2, –3). The segment is translated left 3 units and up 2 units to form line segment F′G′.
Enter the length, in units, of line segment F′G′.
Rubric: (1 point) The student gives the correct measure (e.g., 10; 7).
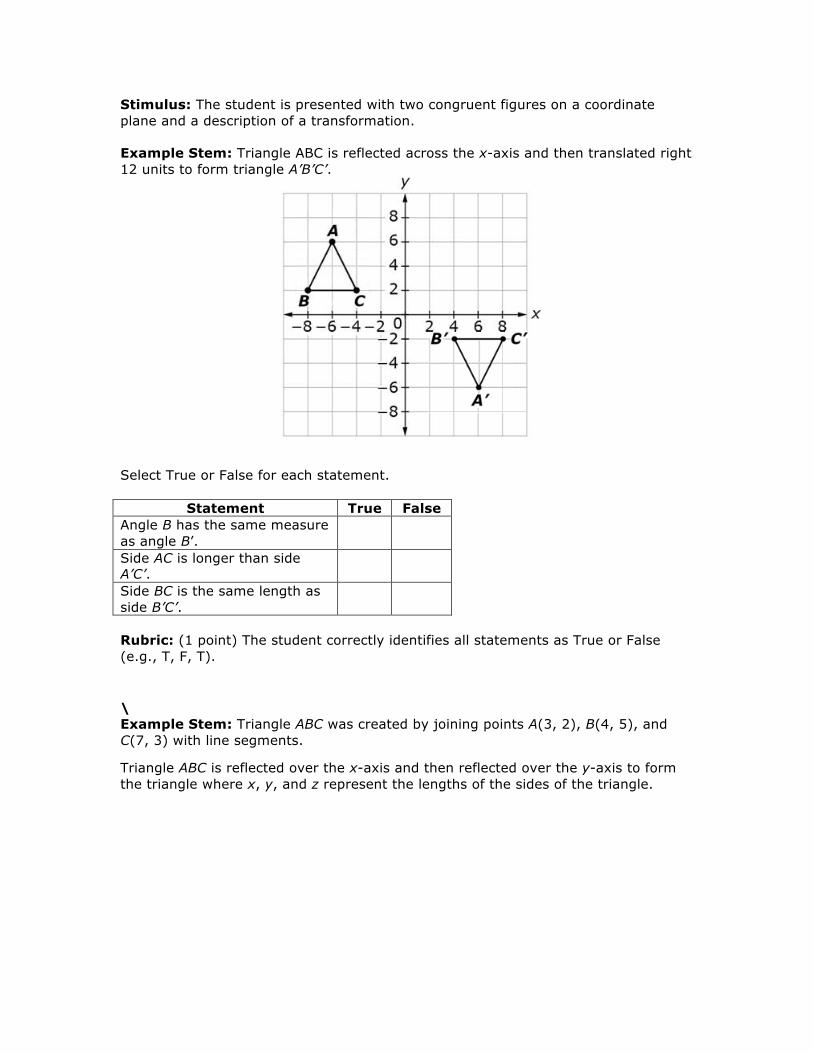
Stimulus: The student is presented with two congruent figures on a coordinate plane and a description of a transformation. Example Stem: Triangle ABC is reflected across the x-axis and then translated right 12 units to form triangle A’B’C’.
Select True or False for each statement.
Statement True False Angle B has the same measure as angle B’.
Side AC is longer than side A’C’.
Side BC is the same length as side B’C’.
Rubric: (1 point) The student correctly identifies all statements as True or False (e.g., T, F, T). \ Example Stem: Triangle ABC was created by joining points A(3, 2), B(4, 5), and C(7, 3) with line segments. Triangle ABC is reflected over the x-axis and then reflected over the y-axis to form the triangle where x, y, and z represent the lengths of the sides of the triangle.
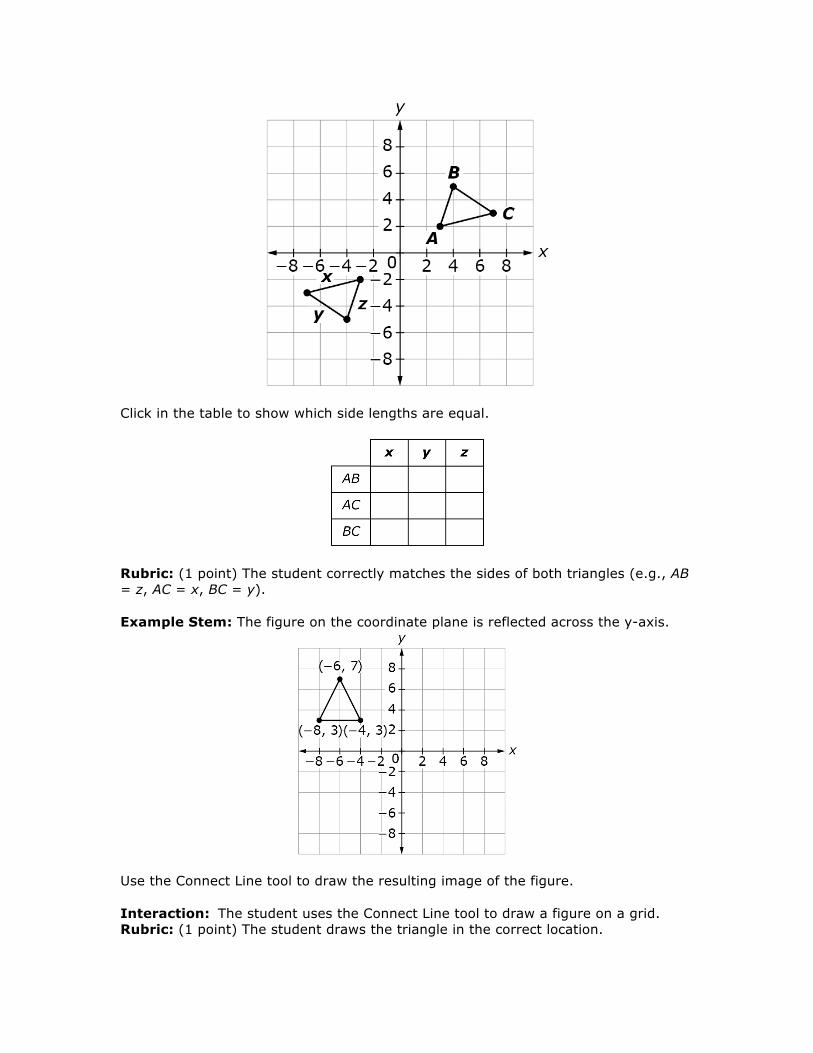
Click in the table to show which side lengths are equal.
Rubric: (1 point) The student correctly matches the sides of both triangles (e.g., AB = z, AC = x, BC = y). Example Stem: The figure on the coordinate plane is reflected across the y-axis.
Use the Connect Line tool to draw the resulting image of the figure. Interaction: The student uses the Connect Line tool to draw a figure on a grid. Rubric: (1 point) The student draws the triangle in the correct location.
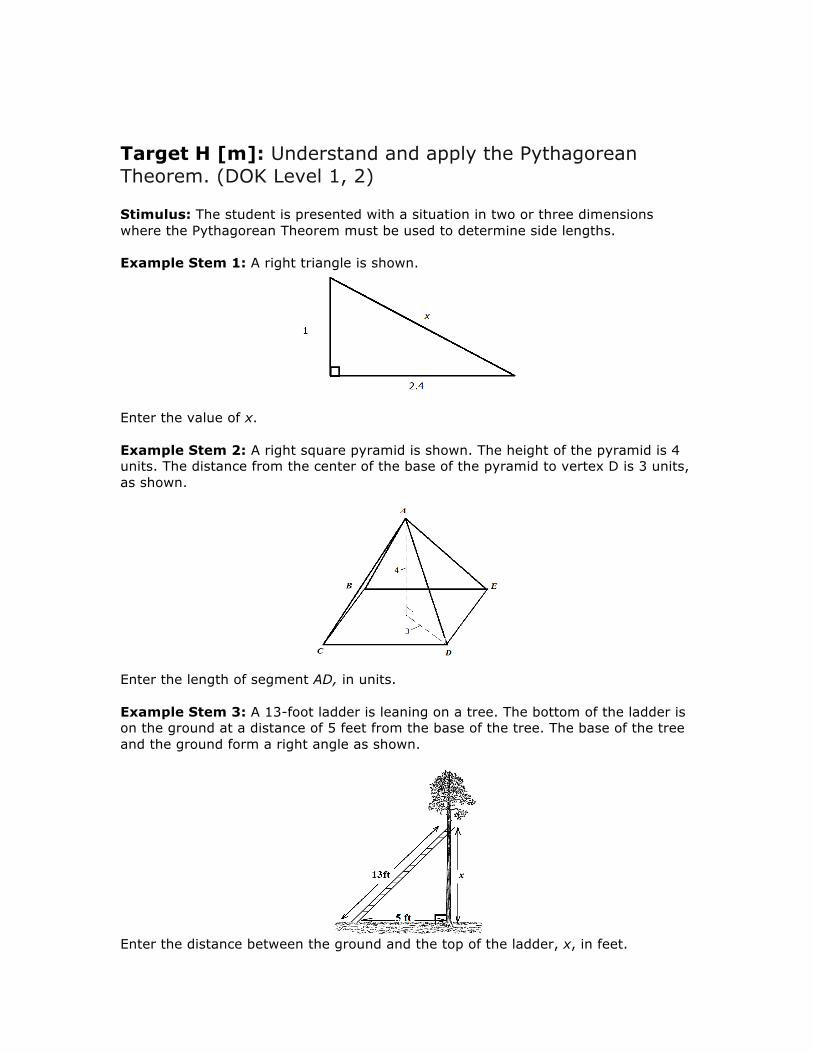
Target H [m]: Understand and apply the Pythagorean Theorem. (DOK Level 1, 2) Stimulus: The student is presented with a situation in two or three dimensions where the Pythagorean Theorem must be used to determine side lengths. Example Stem 1: A right triangle is shown.
Enter the value of x. Example Stem 2: A right square pyramid is shown. The height of the pyramid is 4 units. The distance from the center of the base of the pyramid to vertex D is 3 units, as shown.
Enter the length of segment AD, in units. Example Stem 3: A 13-foot ladder is leaning on a tree. The bottom of the ladder is on the ground at a distance of 5 feet from the base of the tree. The base of the tree and the ground form a right angle as shown.
Enter the distance between the ground and the top of the ladder, x, in feet.
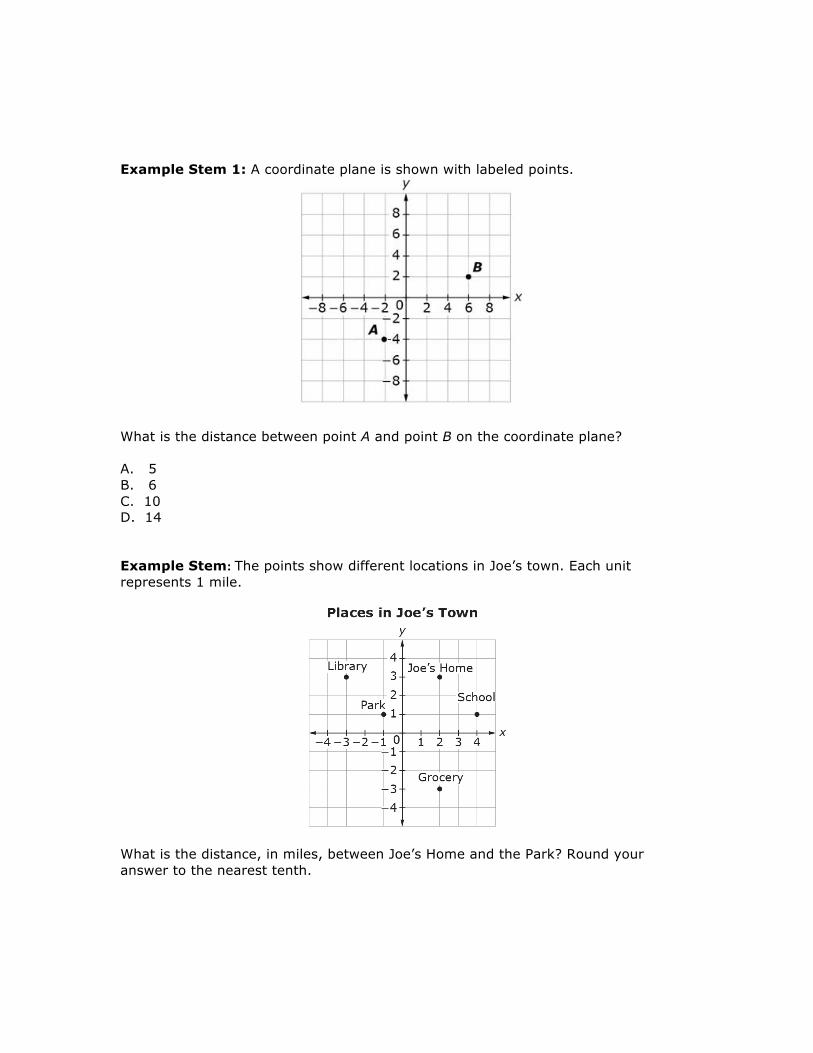
Example Stem 1: A coordinate plane is shown with labeled points.
What is the distance between point A and point B on the coordinate plane? A. 5 B. 6 C. 10 D. 14 Example Stem: The points show different locations in Joe’s town. Each unit represents 1 mile.
What is the distance, in miles, between Joe’s Home and the Park? Round your answer to the nearest tenth.
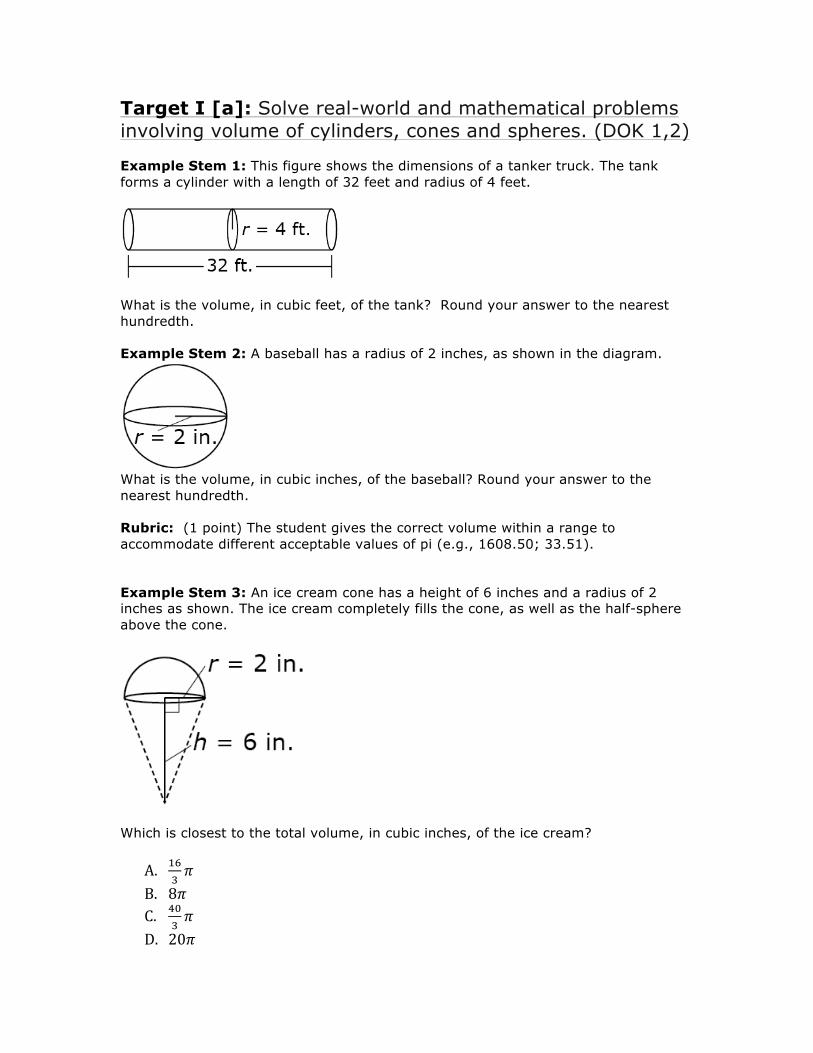
Target I [a]: Solve real-world and mathematical problems involving volume of cylinders, cones and spheres. (DOK 1,2) Example Stem 1: This figure shows the dimensions of a tanker truck. The tank forms a cylinder with a length of 32 feet and radius of 4 feet.
What is the volume, in cubic feet, of the tank? Round your answer to the nearest hundredth. Example Stem 2: A baseball has a radius of 2 inches, as shown in the diagram.
What is the volume, in cubic inches, of the baseball? Round your answer to the nearest hundredth. Rubric: (1 point) The student gives the correct volume within a range to accommodate different acceptable values of pi (e.g., 1608.50; 33.51). Example Stem 3: An ice cream cone has a height of 6 inches and a radius of 2 inches as shown. The ice cream completely fills the cone, as well as the half-sphere above the cone.
Which is closest to the total volume, in cubic inches, of the ice cream?
A. !"!𝜋
B. 8𝜋 C. !"
!𝜋
D. 20𝜋
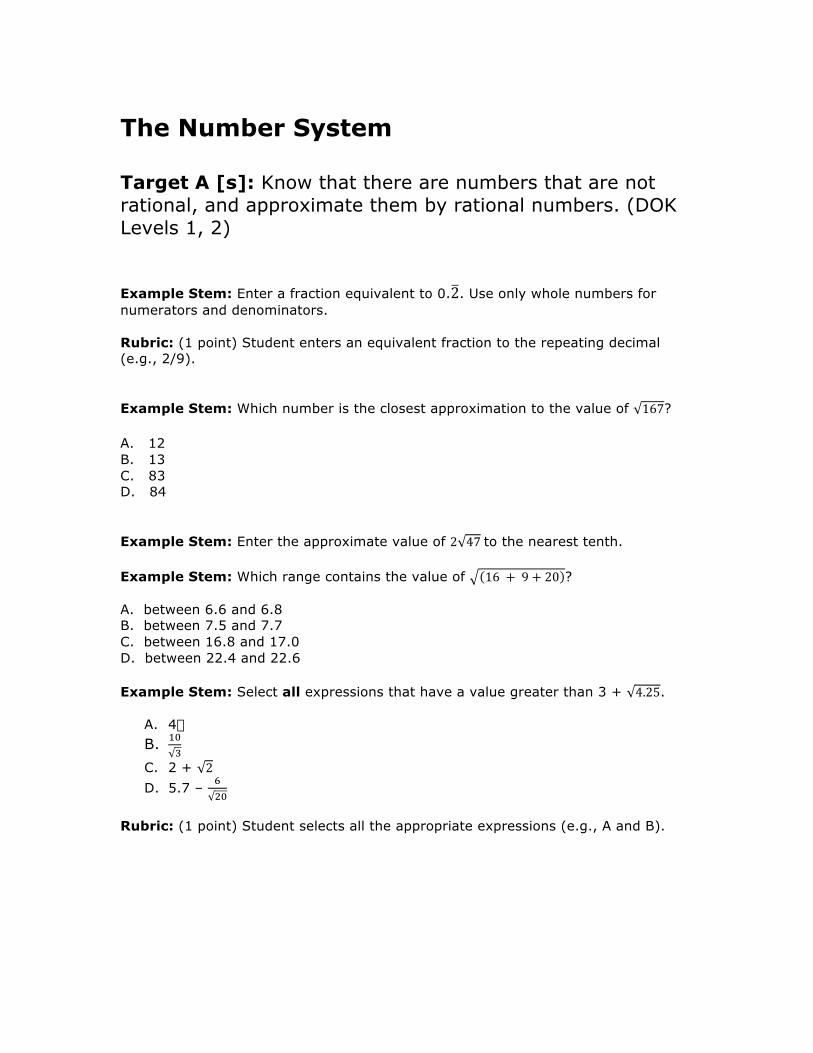
The Number System Target A [s]: Know that there are numbers that are not rational, and approximate them by rational numbers. (DOK Levels 1, 2) Example Stem: Enter a fraction equivalent to 0.2. Use only whole numbers for numerators and denominators. Rubric: (1 point) Student enters an equivalent fraction to the repeating decimal (e.g., 2/9). Example Stem: Which number is the closest approximation to the value of 167? A. 12 B. 13 C. 83 D. 84 Example Stem: Enter the approximate value of 2 47 to the nearest tenth. Example Stem: Which range contains the value of 16 + 9 + 20 ? A. between 6.6 and 6.8 B. between 7.5 and 7.7 C. between 16.8 and 17.0 D. between 22.4 and 22.6 Example Stem: Select all expressions that have a value greater than 3 + 4.25.
A. 4� B. !"
!
C. 2 + 2 D. 5.7 –
!!"
Rubric: (1 point) Student selects all the appropriate expressions (e.g., A and B).
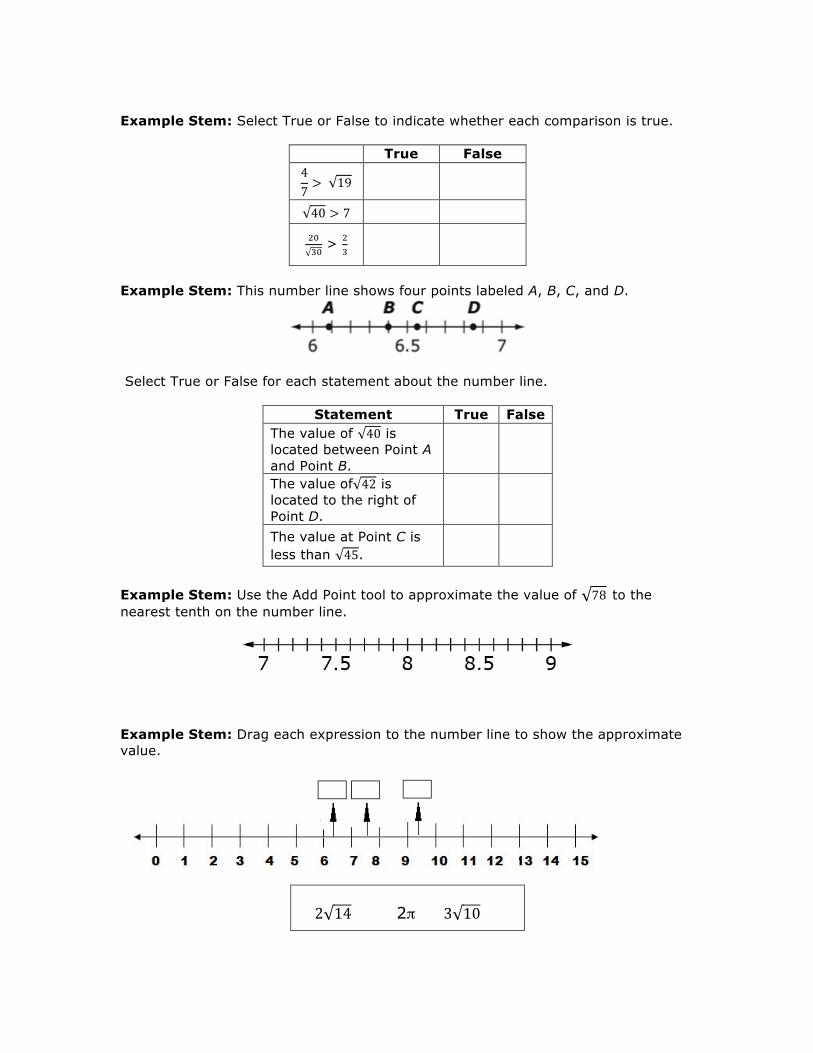
Example Stem: Select True or False to indicate whether each comparison is true.
True False 47> 19
40 > 7
!"!"
> !!
Example Stem: This number line shows four points labeled A, B, C, and D.
Select True or False for each statement about the number line.
Statement True False The value of 40 is located between Point A and Point B.
The value of 42 is located to the right of Point D.
The value at Point C is less than 45.
Example Stem: Use the Add Point tool to approximate the value of 78 to the nearest tenth on the number line.
Example Stem: Drag each expression to the number line to show the approximate value.
2 14 2π 3 10