Embed Size (px)
Citation preview


PROBABILITY AND STATISTICS CURRICULUM GUIDE (Revised 2011) PRINCE WILLIAM COUNTY SCHOOLS
This page is intentionally left blank.

PROBABILITY AND STATISTICS CURRICULUM GUIDE (Revised 2011) PRINCE WILLIAM COUNTY SCHOOLSIntroduction
The Mathematics Curriculum Guide serves as a guide for teachers when planning instruction and assessment. It defines the content knowledge, skills, and understandings that are measured by the Standards of Learning assessment. It provides additional guidance to teachers as they develop an instructional program appropriate for their students. It also assists teachers in their lesson planning by identifying essential understandings, defining essential content knowledge, and describing the intellectual skills students need to use. This Guide delineates in greater specificity the content that all teachers should teach and all students should learn.
The format of the Curriculum Guide facilitates teacher planning by identifying the key concepts, knowledge, and skills that should be the focus of instruction for each objective. The Curriculum Guide is divided into sections: Curriculum Information, Essential Knowledge and Skills, Key Vocabulary, Essential Questions and Understandings, Teacher Notes and Elaborations, Resources, and Sample Instructional Strategies and Activities. The purpose of each section is explained below.
Curriculum Information:This section includes the objective, focus or topic, and in some, not all, foundational objectives that are being built upon.
Essential Knowledge and Skills:Each objective is expanded in this section. What each student should know and be able to do in each objective is outlined. This is not meant to be an exhaustive list nor a list that limits what is taught in the classroom. This section is helpful to teachers when planning classroom assessments as it is a guide to the knowledge and skills that define the objective.
Key Vocabulary:This section includes vocabulary that is key to the objective and many times the first introduction for the student to new concepts and skills.
Essential Questions and Understandings:This section delineates the key concepts, ideas, and mathematical relationships that all students should grasp to demonstrate an understanding of the objectives.
Teacher Notes and Elaborations:This section includes background information for the teacher. It contains content that is necessary for teaching this objective and may extend the teachers’ knowledge of the objective beyond the current grade level. It may also contain definitions of key vocabulary to help facilitate student learning.
Resources:This section lists various resources that teachers may use when planning instruction. Teachers are not limited to only these resources.
Sample Instructional Strategies and Activities:This section lists ideas and suggestions that teachers may use when planning instruction.
1

PROBABILITY AND STATISTICS CURRICULUM GUIDE (Revised 2011) PRINCE WILLIAM COUNTY SCHOOLSProbability and Statistics in Prince William County is a semester course. The following chart lists the objectives for the Probability and Statistics Curriculum organized by topic. Specific objectives have been selected from the Virginia Department of Education Probability and Statistics Standards to meet the objectives of this semester course. The chart organizes the objectives by topic. The Prince William County cross-content vocabulary terms that are in this course are: analyze, compare and contrast, conclude, evaluate, explain, generalize, question/inquire, sequence, solve, summarize, and synthesize.
Topic ObjectivesDescriptive Statistics PS 1, PS 2, PS 3, PS 4Data Collection PS 8, PS 9Probability PS 11, PS 12, PS 13, PS 16Inferential Statistics PS 17
2

PROBABILITY AND STATISTICS CURRICULUM GUIDE (Revised 2011) PRINCE WILLIAM COUNTY SCHOOLS
Curriculum Information Essential Knowledge and SkillsKey Vocabulary
Essential Questions and UnderstandingsTeacher Notes and Elaborations
TopicDescriptive Statistics
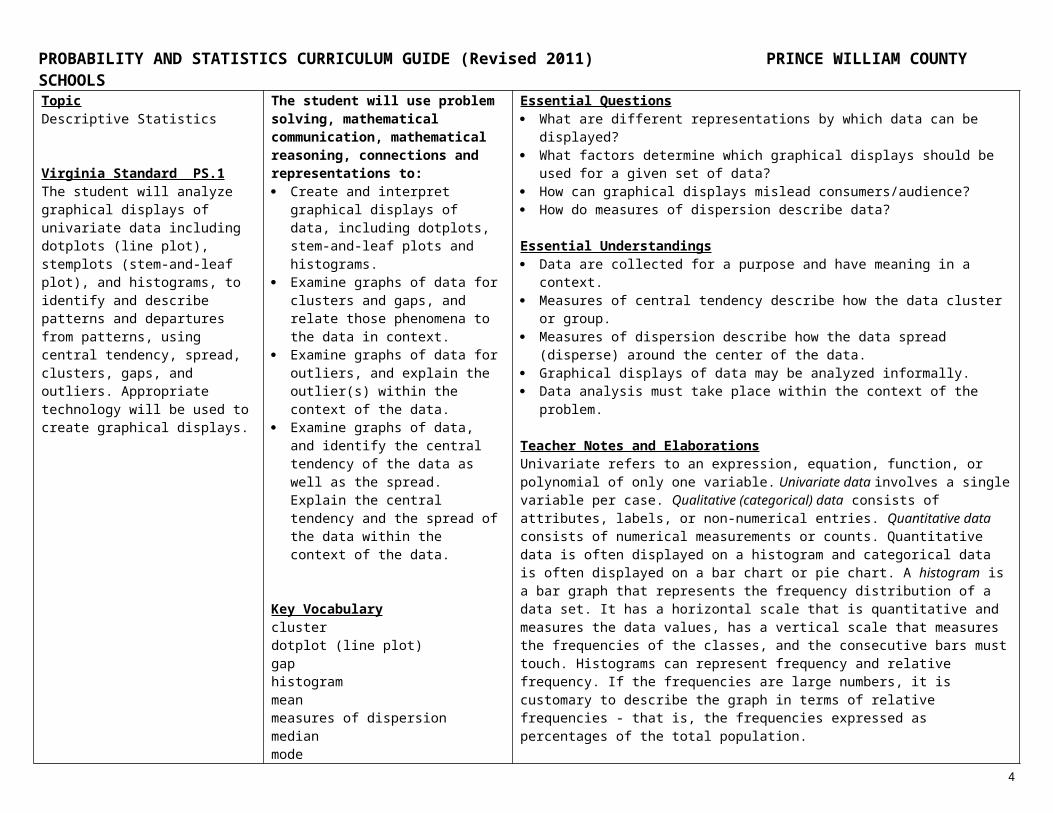
Virginia Standard PS.1The student will analyze graphical displays of univariate data including dotplots (line plot), stemplots (stem-and-leaf plot), and histograms, to identify and describe patterns and departures from patterns, using central tendency, spread, clusters, gaps, and outliers. Appropriate technology will be used to create graphical displays.
The student will use problem solving, mathematical communication, mathematical reasoning, connections and representations to: Create and interpret graphical displays
of data, including dotplots, stem-and-leaf plots and histograms.
Examine graphs of data for clusters and gaps, and relate those phenomena to the data in context.
Examine graphs of data for outliers, and explain the outlier(s) within the context of the data.
Examine graphs of data, and identify the central tendency of the data as well as the spread. Explain the central tendency and the spread of the data within the context of the data.
Key Vocabularyclusterdotplot (line plot)gaphistogrammeanmeasures of dispersionmedianmodeoutlierspopulationqualitative (categorical) dataquantitative dataspreadstemplots (stem-and-leaf plot)univariate data
Essential Questions What are different representations by which data can be displayed? What factors determine which graphical displays should be used for a given set of data? How can graphical displays mislead consumers/audience? How do measures of dispersion describe data?
Essential Understandings Data are collected for a purpose and have meaning in a context. Measures of central tendency describe how the data cluster or group. Measures of dispersion describe how the data spread (disperse) around the center of the
data. Graphical displays of data may be analyzed informally. Data analysis must take place within the context of the problem.
Teacher Notes and ElaborationsUnivariate refers to an expression, equation, function, or polynomial of only one variable. Univariate data involves a single variable per case. Qualitative (categorical) data consists of attributes, labels, or non-numerical entries. Quantitative data consists of numerical measurements or counts. Quantitative data is often displayed on a histogram and categorical data is often displayed on a bar chart or pie chart. A histogram is a bar graph that represents the frequency distribution of a data set. It has a horizontal scale that is quantitative and measures the data values, has a vertical scale that measures the frequencies of the classes, and the consecutive bars must touch. Histograms can represent frequency and relative frequency. If the frequencies are large numbers, it is customary to describe the graph in terms of relative frequencies - that is, the frequencies expressed as percentages of the total population.
A Pareto chart is a type of chart that contains both bars and a line graph, where individual values are represented in descending order by bars, and the cumulative total is represented by the line.
Population is the entire set of individuals from which samples are drawn. It is the set of people or things (units) that is being investigated.
A measure of central tendency is a value that represents a typical or central entry of a data set. The three most commonly used measures of central tendency are the mean, the median, and the mode.
(continued)
3

PROBABILITY AND STATISTICS CURRICULUM GUIDE (Revised 2011) PRINCE WILLIAM COUNTY SCHOOLS
Curriculum Information Essential Questions and UnderstandingsTeacher Notes and Elaborations
TopicDescriptive Statistics
Virginia Standard PS.1The student will analyze graphical displays of univariate data including dotplots (line plot), stemplots (stem-and-leaf), and histograms, to identify and describe patterns and departures from patterns, using central tendency, spread, clusters, gaps, and outliers. Appropriate technology will be used to create graphical displays.
Teacher Notes and Elaborations (continued)The mean of a data set is the sum of the data entries divided by the number of entries. It is the balance point of a distribution. To find the mean of a data set, use one of the following formulas.
Population Mean: Sample Mean:
The lowercase Greek letter (pronounced mu) represents the population mean and (read as: “x bar”) represents the sample mean. Note that N represents the number of entries in a population and n represents the number of entries in a sample.
When mean is computed, there is a convenient notation to indicate the sum. Let x represent any value in the data set. Then the notation (read "the sum of all given x values") means to find the sum of all the data values. In other words find the sum of all the entries in the distribution. The summation symbol Σ means "sum the following" and is a capital sigma. (In Algebra II the state resources use n to represent the number of elements in a data set. Students may need clarification.)
The median is the midpoint of a distribution, the number such that half the data set is smaller and the other half is larger. To find the median of a distribution:
1. Arrange all data in the set in order of size, from smallest to largest.2. If the number n of data in the set is odd, the median M is the center in the ordered list. The location of the median is found by
counting data up from the bottom of the list.
3. If the number n of data in the set is even, the median M is the average of the two center data in the ordered list. The location of the
median is again from the bottom of the list.
The mode of a data set is the data entry that occurs with the greatest frequency. If no data entry is repeated, the data set has no mode. If two entries occur with the same greatest frequency, each entry is a mode and the data set is called bimodal. The mode is a peak of the distribution. There may be one, more than one, or no mode.
A cluster is a naturally occurring subgroup of a population used in sampling. On a plot, a cluster is a group of data “clustering” close to the same value, away from other groups.
The gap is a piece of data with no data in it between two pieces of data with data in it. There can be more than one gap between data pieces. For example, say people were being asked about their favored color. Out of ten people, 3 said yellow, 0 said orange, 4 said blue, and 3 said green. Orange would be the gap in the data. On a plot, a gap is the space that separates clusters of data.
A stemplot (stem and leaf plot) is similar to a histogram but has the advantage that the graph still contains the original data values. In a stemplot, each number is separated into a stem (the entries leftmost digits) and a leaf (the rightmost digit).
(continued)4
PROBABILITY AND STATISTICS CURRICULUM GUIDE (Revised 2011) PRINCE WILLIAM COUNTY SCHOOLS
Curriculum Information Essential Questions and UnderstandingsTeacher Notes and Elaborations
TopicDescriptive Statistics
Virginia Standard PS.1The student will analyze graphical displays of univariate data including dotplots (line plot), stemplots (stem-and-leaf), and histograms, to identify and describe patterns and departures from patterns, using central tendency, spread, clusters, gaps, and outliers. Appropriate technology will be used to create graphical displays.
Teacher Notes and Elaborations (continued)A dotplot (line plot) is used to graph quantitative data. Each data entry is plotted using a point above its value on a horizontal axis. Like a stemplot, a dotplot illustrates how data are distributed, determines specific data entries, and identifies unusual data values (outliers). An outlier is a data entry that is far removed from the other entries in the data set. It is data that falls outside the overall pattern of the graph.
Spread is the degree to which values in a distribution differ. Measures of variability or spread, for quantitative variables include the standard deviation, interquartile range, and range. Statisticians like to measure and analyze the measures of dispersion (spread) of the data set about the mean in order to assist in making inferences about the population. One measure of spread would be to find the sum of the deviations between each element and the mean whose sum is always zero. There are two methods to overcome this mathematical dilemma:
1. take the absolute value of the deviations before finding the average; or 2. square the deviations before finding the average.
The mean absolute deviation uses the first method and the variance and standard deviation uses the second.
5

PROBABILITY AND STATISTICS CURRICULUM GUIDE (Revised 2011) PRINCE WILLIAM COUNTY SCHOOLS
Curriculum Information Resources Sample Instructional Strategies and Activities
TopicDescriptive Statistics
Virginia Standard PS.1
Text:Elementary Statistics: Picturing the World, 3rd Edition, 2006, Larson and Farber, Pearson Prentice Hall
Elementary Statistics: A Step by Step Approach, Sixth Edition, 2007, Bluman, Glencoe McGraw-Hill
PWC Mathematics websitehttp://pwcs.math.schoolfusion.us/
Virginia Department of Education website http://www.doe.virginia.gov/instruction/mathematics/index.shtml
6

PROBABILITY AND STATISTICS CURRICULUM GUIDE (Revised 2011) PRINCE WILLIAM COUNTY SCHOOLS
Curriculum Information Essential Knowledge and SkillsKey Vocabulary
Essential Questions and UnderstandingsTeacher Notes and Elaborations
TopicDescriptive Statistics
Virginia Standard PS.2The student will analyze numerical characteristics of univariate data sets to describe patterns and departure from patterns, using mean, median, mode, variance, standard deviation, interquartile range, range, and outliers.
The student will use problem solving, mathematical communication, mathematical reasoning, connections and representations to: Interpret mean, median, mode, range,
interquartile range, variance, and standard deviation of a univariate data set in terms of the problem’s context.
Identify possible outliers, using an algorithm.
Explain the influence of outliers on a univariate data set.
Explain ways in which standard deviation addresses dispersion by examining the formula for standard deviation.
Key Vocabularydeviationdispersioninterquartile rangemeanmedianmodeoutlierrangestandard deviationvariance
Essential Questions Why is data collected? What is an outlier and how does it influence a data set? Which measure of central tendency best describes the data set? What is meant by the spread of the data?
Essential Understandings Data are collected for a purpose and have meaning within a context. Analysis of the descriptive statistical information generated by a univariate data set
should include the interplay between central tendency and dispersion as well as among specific measures.
Data points identified algorithmically as outliers should not be excluded from the data unless sufficient evidence exists to show them to be in error.
Teacher Notes and ElaborationsThe mean of a data set is the sum of the data entries divided by the number of entries.
The median of a data set is the value that lies in the middle of the data when the data set is ordered. If the data set has an odd number of entries, the median is the middle data entry. If the data set has an even number of entries, the median is the mean of the two middle data entries.
The mode of a data set is the data entry that occurs with the greatest frequency. If no data entry is repeated, the data set has no mode. If two entries occur with the same greatest frequency, each entry is a mode and the data set is called bimodal.
The range of a data set is the difference between the maximum and minimum data entries in the set.
Range = (Maximum data entry) – (Minimum data entry)
Deviation of a data entry in a population data set is the difference between the entry and the mean of the data set. It is the difference from the mean , or other measure of center.
Deviation of
Dispersion is the degree to which the values of a frequency distribution are scattered around some central point, usually the arithmetic mean or median.
7

PROBABILITY AND STATISTICS CURRICULUM GUIDE (Revised 2011) PRINCE WILLIAM COUNTY SCHOOLS
(continued)
Curriculum Information Essential Questions and UnderstandingsTeacher Notes and Elaborations
8

PROBABILITY AND STATISTICS CURRICULUM GUIDE (Revised 2011) PRINCE WILLIAM COUNTY SCHOOLSTopicDescriptive Statistics
Virginia Standard PS.2The student will analyze numerical characteristics of univariate data sets to describe patterns and departure from patterns, using mean, median, mode, variance, standard deviation, interquartile range, range and outliers.
Teacher Notes and Elaborations (continued)Another characteristic of data is its level of measurement. The level of measurement determines which statistical calculations are meaningful. The four levels of measurement, in order from lowest to highest, are nominal, ordinal, interval, and ratio. The following table summarizes the four levels of measurement.
Level of Measurement Meaningful CalculationsNominal
(Qualitative data)Put in a category.
Ordinal(Qualitative or quantitative data)
Put in a category and put in order.
Interval(Quantitative data)
Put in a category, put in order, and find differences between values.
Ratio(Quantitative data)
Put in a category, put in order, find differences between values, and find ratios of values.
A variance is a measure of spread equal to the square of the standard deviation. The average of the squared deviations from the mean is known as the variance, and is another measure of the spread of the elements in a data set.
To calculate variance use , where µ represents the mean of the data set, n represents the number of elements in the data
set, and xi represents the ith element of the data set. (This is the formula that is used on the Algebra I SOL assessment and included on the formula sheet for the Algebra EOC SOL.)
The differences between the elements and the arithmetic mean are squared so that the differences do not cancel each other out when finding the sum. When squaring the differences, the units of measure are squared and larger differences are “weighted” more heavily than smaller differences. In order to provide a measure of variation in terms of the original units of the data, the square root of the variance is taken, yielding the standard deviation.
The standard deviation is the positive square root of the variance of the data set. The greater the value of the standard deviation, the more spread out the data are about the mean. The lesser (closer to 0) the value of the standard deviation, the closer the data are clustered about the mean.
(continued)
Curriculum Information Essential Questions and Understandings
9
PROBABILITY AND STATISTICS CURRICULUM GUIDE (Revised 2011) PRINCE WILLIAM COUNTY SCHOOLSTeacher Notes and Elaborations
TopicDescriptive Statistics
Virginia Standard PS.2The student will analyze numerical characteristics of univariate data sets to describe patterns and departure from patterns, using mean, median, mode, variance, standard deviation, interquartile range, range, and outliers.
Teacher Notes and Elaborations (continued)
To calculate standard deviation use , where µ represents the mean of the data set, n represents the number of elements
in the data set, and xi represents the ith element of the data set. (This is the formula that is used on the Algebra I SOL assessment and included on the formula sheet for the Algebra EOC SOL.)
Often, textbooks will use two distinct formulas for standard deviation. In these formulas, the Greek letter “σ ”, written and read “sigma”, represents the standard deviation of a population, and “s” represents the sample standard deviation. The population standard deviation can be estimated by calculating the sample standard deviation. The formulas for sample and population standard deviation look very similar except that in the sample standard deviation formula, n – 1 is used instead of n in the denominator. The reason for this is to account for the possibility of greater variability of data in the population than what is seen in the sample. When n – 1 is used in the denominator, the result is a larger number. Therefore, the calculated value of the sample standard deviation will be larger than the population standard deviation. As sample sizes get larger (n gets larger), the difference between the sample standard deviation and the population standard deviation gets smaller. The use of n – 1 to calculate the sample standard deviation is known as Bessel’s correction.
To locate the center of distribution, divide the data into a lower and upper half. Find the values that divide each half in half again. These two values, the lower quartile, Q1 and the upper quartiles, Q3, together with the median, divide the data into fourths. The interquartile range or measure of spread is the distance between upper and lower quartiles (IQR = Q3 – Q1). IQR represents 50% of the data. Outliers are unusual data values. Typically, outliers are 1.5 IQR away from Q1 and Q3. It is possible that distributions will not contain outliers. For example, in a normal distribution, there are no outliers.
Appropriate technology will be used to calculate statistics.
10

PROBABILITY AND STATISTICS CURRICULUM GUIDE (Revised 2011) PRINCE WILLIAM COUNTY SCHOOLSCurriculum Information Resources Sample Instructional Strategies and Activities
TopicDescriptive Statistics
Virginia Standard PS.2
Text:Elementary Statistics: Picturing the World, 3rd Edition, 2006, Larson and Farber, Pearson Prentice Hall
Elementary Statistics: A Step by Step Approach, Sixth Edition, 2007, Bluman, Glencoe McGraw-Hill
PWC Mathematics websitehttp://pwcs.math.schoolfusion.us/
Virginia Department of Education website http://www.doe.virginia.gov/instruction/mathematics/index.shtml
Calculator key strokes for computation of descriptive statistics for TI and Casio calculators are in Algebra I, objective 9 and Algebra II, objective 11.
Texas Instrument website http://education.ti.com/educationportal/sites/US/homePage/index.html
Casio websitehttp://www.casio.com/support/manuals/
11

PROBABILITY AND STATISTICS CURRICULUM GUIDE (Revised 2011) PRINCE WILLIAM COUNTY SCHOOLS
Curriculum Information Essential Knowledge and SkillsKey Vocabulary
Essential Questions and UnderstandingsTeacher Notes and Elaborations
TopicDescriptive Statistics
Virginia Standard PS.3The student will compare distributions of two or more univariate data sets, analyzing center and spread (within group and between group variations), clusters and gaps, shapes, outliers, or other unusual features.
The student will use problem solving, mathematical communication, mathematical reasoning, connections and representations to: Compare and contrast two or more
univariate data sets by analyzing measures of center and spread within a contextual framework.
Describe any unusual features of the data, such as clusters, gaps, or outliers, within the context of the data.
Analyze in context kurtosis and skewness in conjunction with other descriptive measures.
Key Vocabularykurtosismeasure of centernormal distributionskewnessstatistical tendency
Essential Questions How can unusual data features be identified and interpreted? What features should be used to make comparisons between univariate data sets?
Essential Understandings Data are collected for a purpose and have meaning in a context. Statistical tendency refers to typical cases but not necessarily to individual cases.
Teacher Notes and ElaborationsA measure of center is a single number summary that measures the “center” of a distribution; usually the mean (or average) is used. Median and mode are also measures of center.
A normal distribution is a useful probability distribution that has a symmetric bell or mound shape and tails extending infinitely in both directions. Normal distributions are a family of probability models that assign probabilities to events as areas under a curve. The normal curves are symmetric and bell-shaped. A specific normal curve is completely described by giving its mean, μ, and its standard deviation, σ.
Kurtosis is a descriptive property of distributions designed to indicate the general form of concentration around the mean.
Statistical tendency is a way in which something (data) typically behaves or happens or is likely to react, behave or happen.
Skewness is a measure of the symmetry of a distribution about its mean. If the mean equals the median there is no skew, the distribution is symmetric. If the mean is smaller than the median the distribution will be left skewed. If the mean is larger than the median the distribution will be right skewed.
Distributions are skewed when they show bunching at one end and a long tail stretching out in the other direction.
Data are useful only if it can be organized and presented so the meaning is clear. Two principles that are useful in exploring and analyzing data are:
1. Examine each variable by itself, and then look at the relationship among the variables.
2. Begin with a graph or graphs then add numerical summaries of specific aspects of the data. In any graph of data, the overall pattern can be described by its shape, center, and spread. Outliers fall outside the overall pattern.
Appropriate technology will be used to generate graphical displays.
12

PROBABILITY AND STATISTICS CURRICULUM GUIDE (Revised 2011) PRINCE WILLIAM COUNTY SCHOOLS
Curriculum Information Resources Sample Instructional Strategies and Activities
TopicDescriptive Statistics
Virginia Standard PS.3
Text:Elementary Statistics: Picturing the World, 3rd Edition, 2006, Larson and Farber, Pearson Prentice Hall
Elementary Statistics: A Step by Step Approach, Sixth Edition, 2007, Bluman, Glencoe McGraw-Hill
PWC Mathematics websitehttp://pwcs.math.schoolfusion.us/
Virginia Department of Education website http://www.doe.virginia.gov/instruction/mathematics/index.shtml
13

PROBABILITY AND STATISTICS CURRICULUM GUIDE (Revised 2011) PRINCE WILLIAM COUNTY SCHOOLS
Curriculum Information Essential Knowledge and SkillsKey Vocabulary
Essential Questions and UnderstandingsTeacher Notes and Elaborations
TopicDescriptive Statistics
Virginia Standard PS.4The student will analyze scatterplots to identify and describe the relationship between two variables, using shape; strength of relationship; clusters; positive, negative, or no association; outliers; and influential points.
The student will use problem solving, mathematical communication, mathematical reasoning, connections and representations to: Examine scatterplots of data, and
describe skewness, kurtosis, and correlation within the context of the data.
Describe and explain any unusual features of the data, such as clusters, gaps or outliers, within the context of the data.
Identify influential data points (observations that have great effect on a line of best fit because of extreme x-values) and describe the effect of the influential points.
Key Vocabularybivariate datacorrelationinfluential pointkurtosisregressionscatterplot
Essential Questions How can scatterplots be used to examine data? What is the role of outliers in data observations? What is strength of an association between two variables?
Essential Understandings A scatterplot serves two purposes:
- to determine if there is a useful relationship between two variables, and- to determine the family of equations that describes the relationship.
Data are collected for a purpose and have meaning in a context. Association between two variables considers both the direction and strength of the
association. The strength of an association between two variables reflects how accurately the value
of one variable can be predicted based on the value of the other variable. Outliers are observations with large residuals and do not follow the pattern apparent in
the other data points.
Teacher Notes and ElaborationsA scatterplot is a plot that shows the relationship between two quantitative variables, usually with each case represented by a dot. On a scatterplot, an influential point is a point that strongly influences the regression equation and correlation. To judge a point’s influence, fit a line and compute a correlation first with, and then without, the point in question.
Kurtosis is a descriptive property of distributions designed to indicate the general form of concentration around the mean.
A correlation is a numerical value between and 1 inclusive that measures the strength and direction of a linear relationship between two variables. Strength of an association between two variables is strong if there is little variation within each vertical strip (conditional distribution of y given x). If there is a lot of variation, the relationship is weak.
A regression is the statistical study of the relationship between two (or more) quantitative variables, such as fitting a line to bivariate data.
Bivariate data is data that involve two variables per case. For quantitative variables, it is often displayed on a scatterplot.
14

PROBABILITY AND STATISTICS CURRICULUM GUIDE (Revised 2011) PRINCE WILLIAM COUNTY SCHOOLS
(continued)
Curriculum Information Essential Questions and UnderstandingsTeacher Notes and Elaborations
TopicDescriptive Statistics
Virginia Standard PS.4The student will analyze scatterplots to identify and describe the relationship between two variables, using shape; strength of relationship; clusters; positive, negative, or no association; outliers; and influential points.
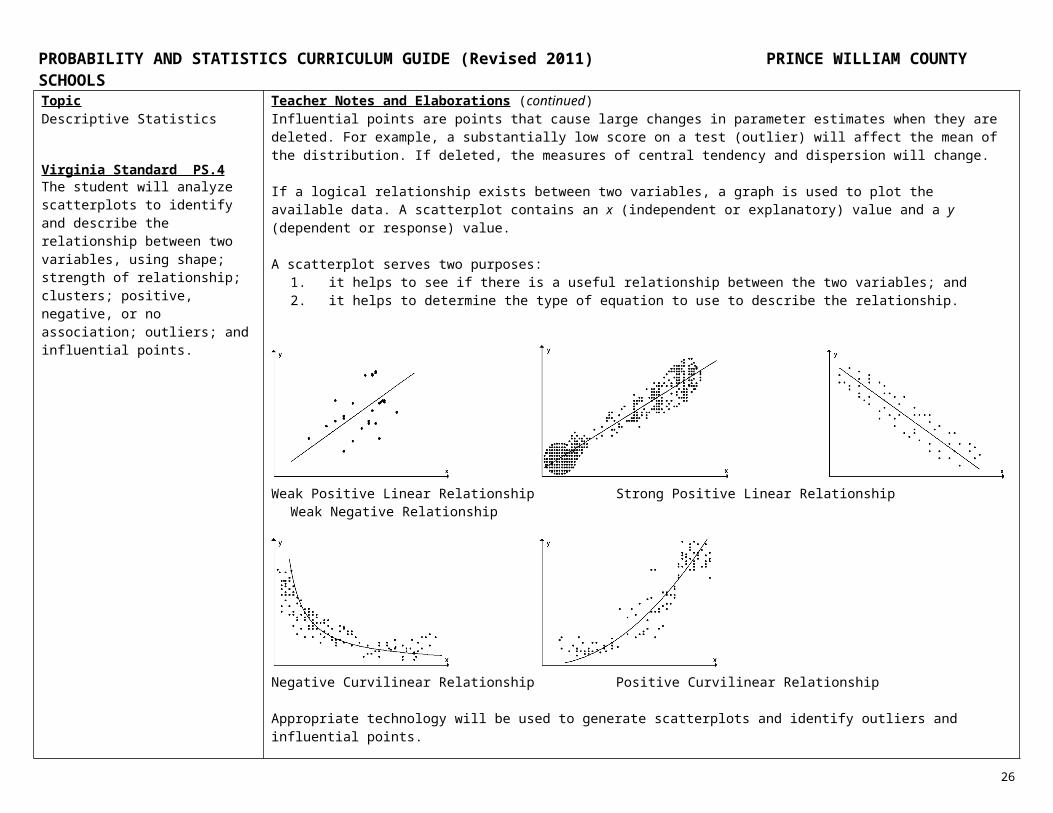
Teacher Notes and Elaborations (continued)Influential points are points that cause large changes in parameter estimates when they are deleted. For example, a substantially low score on a test (outlier) will affect the mean of the distribution. If deleted, the measures of central tendency and dispersion will change.
If a logical relationship exists between two variables, a graph is used to plot the available data. A scatterplot contains an x (independent or explanatory) value and a y (dependent or response) value.
A scatterplot serves two purposes:1. it helps to see if there is a useful relationship between the two variables; and2. it helps to determine the type of equation to use to describe the relationship.
Weak Positive Linear Relationship Strong Positive Linear Relationship Weak Negative Relationship
Negative Curvilinear Relationship Positive Curvilinear Relationship
Appropriate technology will be used to generate scatterplots and identify outliers and influential points.
15

PROBABILITY AND STATISTICS CURRICULUM GUIDE (Revised 2011) PRINCE WILLIAM COUNTY SCHOOLS
Curriculum Information Resources Sample Instructional Strategies and Activities
TopicDescriptive Statistics
Virginia Standard PS.4
Text:Elementary Statistics: Picturing the World, 3rd Edition, 2006, Larson and Farber, Pearson Prentice Hall
Elementary Statistics: A Step by Step Approach, Sixth Edition, 2007, Bluman, Glencoe McGraw-Hill
PWC Mathematics websitehttp://pwcs.math.schoolfusion.us/
Virginia Department of Education website http://www.doe.virginia.gov/instruction/mathematics/index.shtml
16

PROBABILITY AND STATISTICS CURRICULUM GUIDE (Revised 2011) PRINCE WILLIAM COUNTY SCHOOLS
17

PROBABILITY AND STATISTICS CURRICULUM GUIDE (Revised 2011) PRINCE WILLIAM COUNTY SCHOOLS
This page is intentionally left blank.
Curriculum Information Essential Knowledge and SkillsKey Vocabulary
Essential Questions and UnderstandingsTeacher Notes and Elaborations
18

PROBABILITY AND STATISTICS CURRICULUM GUIDE (Revised 2011) PRINCE WILLIAM COUNTY SCHOOLSTopicData Collection
Virginia Standard PS.8The student will describe the methods of data collection in a census, sample survey, experiment, and observational study and identify an appropriate method of solution for a given problem setting.
The student will use problem solving, mathematical communication, mathematical reasoning, connections and representations to: Compare and contrast controlled
experiments and observational studies and the conclusions one can draw from each.
Compare and contrast population and sample and parameter and statistic.
Identify biased sampling methods. Describe simple random sampling. Select a data collection method
appropriate for a given context.
Key Vocabularybiasedbiased samplingcensuscontrol groupexperimentobservational studyparameterpopulationsample surveysimple random samplingstatistic
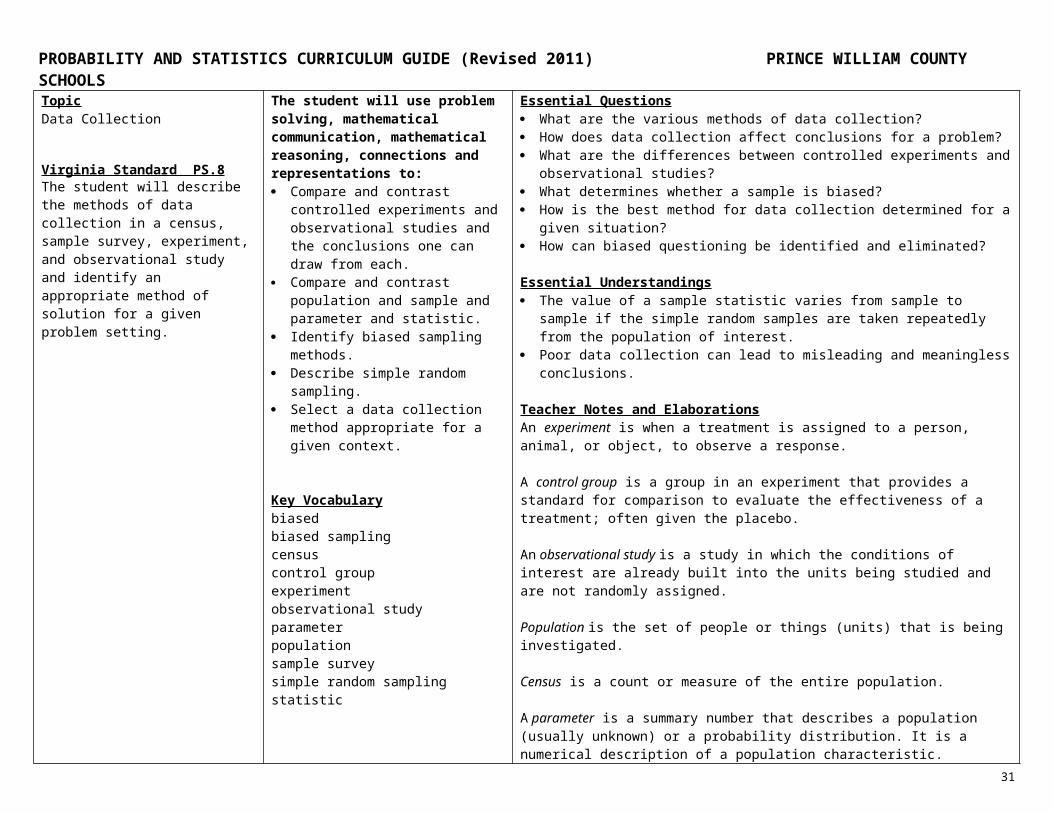
Essential Questions What are the various methods of data collection? How does data collection affect conclusions for a problem? What are the differences between controlled experiments and observational studies? What determines whether a sample is biased? How is the best method for data collection determined for a given situation? How can biased questioning be identified and eliminated?
Essential Understandings The value of a sample statistic varies from sample to sample if the simple random
samples are taken repeatedly from the population of interest. Poor data collection can lead to misleading and meaningless conclusions.
Teacher Notes and ElaborationsAn experiment is when a treatment is assigned to a person, animal, or object, to observe a response.
A control group is a group in an experiment that provides a standard for comparison to evaluate the effectiveness of a treatment; often given the placebo.
An observational study is a study in which the conditions of interest are already built into the units being studied and are not randomly assigned.
Population is the set of people or things (units) that is being investigated.
Census is a count or measure of the entire population.
A parameter is a summary number that describes a population (usually unknown) or a probability distribution. It is a numerical description of a population characteristic.
A statistic is any function of a number of random variables usually identically distributed, that may be used as an estimator for a population parameter. A statistic is a numerical description of a sample characteristic. The value of a statistic is known when a sample is taken, but it can change from sample to sample.
A sampling method is biased if it tends to give samples in which some characteristic of the population is underrepresented or overrepresented (biased sampling).
Sample selection bias (convenience sampling) is the extent to which a sampling procedure produces samples that tend to result in numerical summaries that are systematically too high or too low.
(continued)
Curriculum Information Essential Questions and Understandings
19

PROBABILITY AND STATISTICS CURRICULUM GUIDE (Revised 2011) PRINCE WILLIAM COUNTY SCHOOLSTeacher Notes and Elaborations
TopicData Collection
Virginia Standard PS.8The student will describe the methods of data collection in a census, sample survey, experiment, and observational study and identify an appropriate method of solution for a given problem setting.
Teacher Notes and Elaborations (continued)The way the questions in many surveys are phrased can itself be a source of bias. When a question is worded in such a way as to predispose the respondent to provide a particular response, the results of the survey are tainted by a special type of bias called leading-question bias.
Simple random sampling is a sample in which every possible sample of the same size has the same chance of being selected.
A sample survey is an investigation of one or more characteristics of a population.
Statistical Studies Observational Experimental (Observe and measure (Apply some but do not modify) treatment)
20
Differences
Impose some treatment on individuals in order to observe their responses. The purpose of an experiment is to study whether the treatment causes a change in the response.
Observe individuals and measure variables of interest but do not influence the responses. The purpose is to describe some group or situation.

PROBABILITY AND STATISTICS CURRICULUM GUIDE (Revised 2011) PRINCE WILLIAM COUNTY SCHOOLSCurriculum Information Resources Sample Instructional Strategies and Activities
TopicData Collection
Virginia Standard PS.8
Text:Elementary Statistics: Picturing the World, 3rd Edition, 2006, Larson and Farber, Pearson Prentice Hall
Elementary Statistics: A Step by Step Approach, Sixth Edition, 2007, Bluman, Glencoe McGraw-Hill
PWC Mathematics websitehttp://pwcs.math.schoolfusion.us/
Virginia Department of Education website http://www.doe.virginia.gov/instruction/mathematics/index.shtml
Information about biased questioninghttp://www.icoachmath.com/math_dictionary/biased_question.html
21

PROBABILITY AND STATISTICS CURRICULUM GUIDE (Revised 2011) PRINCE WILLIAM COUNTY SCHOOLS
22

PROBABILITY AND STATISTICS CURRICULUM GUIDE (Revised 2011) PRINCE WILLIAM COUNTY SCHOOLSThis page is intentionally left blank.
Curriculum Information Essential Knowledge and SkillsKey Vocabulary
Essential Questions and UnderstandingsTeacher Notes and Elaborations
TopicData Collection
Virginia Standard PS.9The student will plan and conduct a survey. The plan will address sampling techniques (e.g., simple random and stratified) and methods to reduce bias.
The student will use problem solving, mathematical communication, mathematical reasoning, connections and representations to: Investigate and describe sampling
techniques, such as simple random sampling, stratified sampling, and cluster sampling.
Determine which sampling technique is best, given a particular context.
Plan a survey to answer a question or address an issue.
Given a plan for a survey, identify possible sources of bias, and describe ways to reduce bias.
Design a survey instrument. Conduct a survey.
Key Vocabularybiased sampleclustercluster sampleconvenience samplesimple random samplingstratified samplingsurveysystematic samplevoluntary response sample
Essential Questions What is required to plan and conduct a survey? What are sampling techniques and how do they reduce bias?
Essential Understandings The purpose of sampling is to provide sufficient information so that population
characteristics may be inferred. Inherent bias diminishes as sample size increases.
Teacher Notes and ElaborationsA survey is an investigation of one or more characteristics of a population. Surveys can be valuable in determining the attitude of a population about a candidate, product, or issue. The most common types of surveys are done by interview, mail, telephone, or internet. In designing a survey, it is important to word the questions so they do not lead to biased results.
The design of a statistical study is biased if it systematically favors certain outcomes.
A biased sample has a distribution that is not determined only by the population from which it is drawn, but also by some property that influences the distribution of the sample. Biased samples do not represent the entire population of the study. For example, an opinion poll might be biased by geographical location.
Another source of bias is voluntary response samples. These are biased because people with strong opinions are more likely to respond. A voluntary response sample consists of people who choose themselves by responding to a general appeal. Voluntary response samples are biased because people with strong opinions, especially negative opinions, are most likely to respond.
A type of sample that often leads to biased studies is a convenience sample. A convenience sample consists only of available members of the population or members of the population that are easiest to reach. For this reason, this is not a recommended sampling technique.
A cluster is a naturally occurring subgroup of a population used in stratified sampling. A cluster sample is when a population falls into a naturally occurring subgroup which has similar characteristics.
23
PROBABILITY AND STATISTICS CURRICULUM GUIDE (Revised 2011) PRINCE WILLIAM COUNTY SCHOOLS(continued)
Curriculum Information Essential Questions and UnderstandingsTeacher Notes and Elaborations
TopicData Collection
Virginia Standard PS.9The student will plan and conduct a survey. The plan will address sampling techniques (e.g., simple random and stratified) and methods to reduce bias.
Teacher Notes and Elaborations (continued)A systematic sample is a sample in which each member of the population is assigned a number. The members of the population are ordered in some way, a starting number is randomly selected, and then sample members are selected at regular intervals from the starting number.
Simple random sampling is the process of collecting samples devised to avoid any interference from any shared property of, or relation between the elements selected. Its distribution is affected only by that of the whole population and can therefore be taken to be representative of it.
A stratified sample is a sample that is not drawn at random from the whole population, but is drawn separately from a number of disjoint strata of the population in order to ensure a more representative sample. To achieve a stratified random sample, divide the units of the sampling frame into non-overlapping subgroups and choose a simple random sample from each subgroup.
24

PROBABILITY AND STATISTICS CURRICULUM GUIDE (Revised 2011) PRINCE WILLIAM COUNTY SCHOOLS
Curriculum Information Resources Sample Instructional Strategies and Activities
TopicData Collection
Virginia Standard PS.9
Text:Elementary Statistics: Picturing the World, 3rd Edition, 2006, Larson and Farber, Pearson Prentice Hall
Elementary Statistics: A Step by Step Approach, Sixth Edition, 2007, Bluman, Glencoe McGraw-Hill
PWC Mathematics websitehttp://pwcs.math.schoolfusion.us/
Virginia Department of Education website http://www.doe.virginia.gov/instruction/mathematics/index.shtml
25

PROBABILITY AND STATISTICS CURRICULUM GUIDE (Revised 2011) PRINCE WILLIAM COUNTY SCHOOLS
26
PROBABILITY AND STATISTICS CURRICULUM GUIDE (Revised 2011) PRINCE WILLIAM COUNTY SCHOOLS
This page is intentionally left blank.
Curriculum Information Essential Knowledge and SkillsKey Vocabulary
Essential Questions and UnderstandingsTeacher Notes and Elaborations
27

PROBABILITY AND STATISTICS CURRICULUM GUIDE (Revised 2011) PRINCE WILLIAM COUNTY SCHOOLSTopicProbability
Virginia Standard PS.11The student will identify and describe two or more events as complementary, dependent, independent, and/or mutually exclusive.
The student will use problem solving, mathematical communication, mathematical reasoning, connections and representations to: Define and give contextual examples of
complementary, dependent, independent, and mutually exclusive events.
Given two or more events in a problem setting, determine if the events are complementary, dependent, independent, and/or mutually exclusive.
Key Vocabularycomplementdependent eventindependent eventmutually exclusive
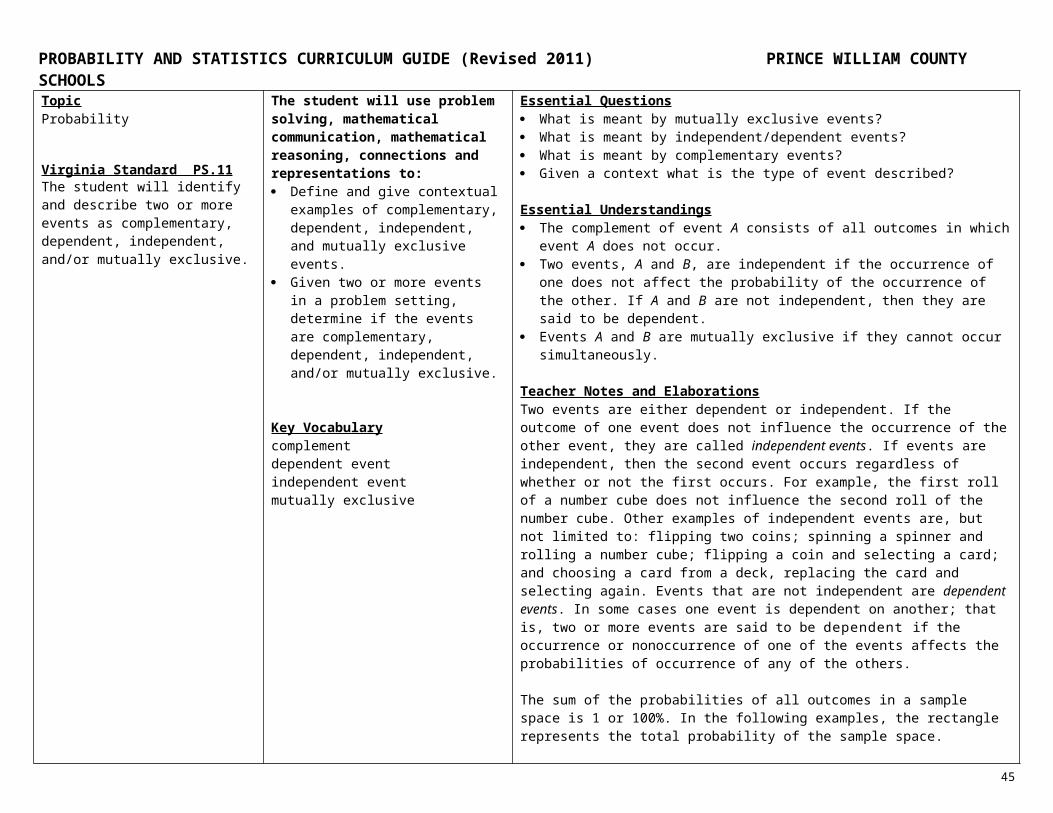
Essential Questions What is meant by mutually exclusive events? What is meant by independent/dependent events? What is meant by complementary events? Given a context what is the type of event described?
Essential Understandings The complement of event A consists of all outcomes in which event A does not occur. Two events, A and B, are independent if the occurrence of one does not affect the
probability of the occurrence of the other. If A and B are not independent, then they are said to be dependent.
Events A and B are mutually exclusive if they cannot occur simultaneously.
Teacher Notes and ElaborationsTwo events are either dependent or independent. If the outcome of one event does not influence the occurrence of the other event, they are called independent events. If events are independent, then the second event occurs regardless of whether or not the first occurs. For example, the first roll of a number cube does not influence the second roll of the number cube. Other examples of independent events are, but not limited to: flipping two coins; spinning a spinner and rolling a number cube; flipping a coin and selecting a card; and choosing a card from a deck, replacing the card and selecting again. Events that are not independent are dependent events. In some cases one event is dependent on another; that is, two or more events are said to be dependent if the occurrence or nonoccurrence of one of the events affects the probabilities of occurrence of any of the others.
The sum of the probabilities of all outcomes in a sample space is 1 or 100%. In the following examples, the rectangle represents the total probability of the sample space.
Two events A and B are mutually exclusive if A and B cannot occur at the same time.
A A and B are mutually exclusive. B
(continued)
Curriculum Information Essential Questions and Understandings
28

PROBABILITY AND STATISTICS CURRICULUM GUIDE (Revised 2011) PRINCE WILLIAM COUNTY SCHOOLSTeacher Notes and Elaborations
TopicProbability
Virginia Standard PS.11The student will identify and describe two or more events as complementary, dependent, independent, and/or mutually exclusive.
Teacher Notes and Elaborations (continued)The complement of event E is the set of all outcomes in a sample space that are not included in event E. The complement of event E is denoted by and is read as “E prime”. The probability of the complement of E is calculated as follows:
E 16 2
53
4
The area of the circle represents the probability of event E, and the area outside the circle represents the probability of the complement of event E.
29

PROBABILITY AND STATISTICS CURRICULUM GUIDE (Revised 2011) PRINCE WILLIAM COUNTY SCHOOLSCurriculum Information Resources Sample Instructional Strategies and Activities
TopicProbability
Virginia Standard PS.11
Text:Elementary Statistics: Picturing the World, 3rd Edition, 2006, Larson and Farber, Pearson Prentice Hall
Elementary Statistics: A Step by Step Approach, Sixth Edition, 2007, Bluman, Glencoe McGraw-Hill
PWC Mathematics websitehttp://pwcs.math.schoolfusion.us/
Virginia Department of Education website http://www.doe.virginia.gov/instruction/mathematics/index.shtml
30

PROBABILITY AND STATISTICS CURRICULUM GUIDE (Revised 2011) PRINCE WILLIAM COUNTY SCHOOLS
31
PROBABILITY AND STATISTICS CURRICULUM GUIDE (Revised 2011) PRINCE WILLIAM COUNTY SCHOOLSThis page is intentionally left blank.
Curriculum Information Essential Knowledge and SkillsKey Vocabulary
Essential Questions and UnderstandingsTeacher Notes and Elaborations
TopicProbability
Virginia Standard PS.12The student will find probabilities (relative frequency and theoretical), including conditional probabilities for events that are either dependent or independent, by applying the Law of Large Numbers concept, the addition rule, and the multiplication rule.
The student will use problem solving, mathematical communication, mathematical reasoning, connections and representations to: Calculate relative frequency and
expected frequency. Find conditional probabilities for
dependent, independent, and mutually exclusive events.
Key Vocabularyaddition ruleconditional probabilityexperimental probability Law of Large Numbersmultiplication rulerelative frequencytheoretical probability (expected
frequency)
Essential Questions How are probabilities calculated? How is the Law of Large Numbers applied?
Essential Understandings Data are collected for a purpose and have meaning in a context. Venn diagrams may be used to find conditional probabilities. The Law of Large Numbers states that as a procedure is repeated again and again, the
relative frequency probability of an event tends to approach the actual probability.
Teacher Notes and ElaborationsThe experimental probability of an event is determined by carrying out a simulation or an experiment. The experimental probability is found by repeating an experiment many times and using the ratio.
Experimental probability
Experimental probability is not exact since the results may vary if the experiment is repeated.
The relative frequency of a class is the portion or percentage of the data that falls in that class. To find the relative frequency of a class, divide the frequency f by the sample size n.
=
Theoretical probability is used when each outcome in a sample space is equally likely to occur.
A conditional probability is the probability of an event occurring, given that another event has already occurred. The conditional probability of event B occurring, given that event A has occurred, is denoted by and is read as “probability of B, given A.
32

PROBABILITY AND STATISTICS CURRICULUM GUIDE (Revised 2011) PRINCE WILLIAM COUNTY SCHOOLS(continued)
Curriculum Information Essential Questions and UnderstandingsTeacher Notes and Elaborations
TopicProbability
Virginia Standard PS.12The student will find probabilities (relative frequency and theoretical), including conditional probabilities for events that are either dependent or independent, by applying the Law of Large Numbers concept, the addition rule, and the multiplication rule.
Teacher Notes and Elaborations (continued)To find the probability of two events occurring in sequence, use the multiplication rule. To use the multiplication rule, first find the probability that the first event occurs, find the probability the second event occurs given the first event has occurred, and then multiply these two probabilities. The probability that two events A and B will occur in sequence is
If events A and B are independent, then the rule can be simplified to This simplified rule can be extended for any number of independent events.
Two events A and B are mutually exclusive if A and B cannot occur at the same time. The addition rule for the probability of A or B states that the probability that events A or B will occur (A or B) is given by:
P(A or B) = P(A) + P(B) – P(A and B).
If events A and B are mutually exclusive, then the rule can be simplified to:P(A or B) = P(A) + P(B).
As the number of times a probability experiment is repeated, the empirical probability (relative frequency) of an event approaches the theoretical (actual) probability of the event (The Law of Large Numbers).
33

PROBABILITY AND STATISTICS CURRICULUM GUIDE (Revised 2011) PRINCE WILLIAM COUNTY SCHOOLS
Curriculum Information Resources Sample Instructional Strategies and Activities
TopicProbability
Virginia Standard PS.12
Text:Elementary Statistics: Picturing the World, 3rd Edition, 2006, Larson and Farber, Pearson Prentice Hall
Elementary Statistics: A Step by Step Approach, Sixth Edition, 2007, Bluman, Glencoe McGraw-Hill
PWC Mathematics websitehttp://pwcs.math.schoolfusion.us/
Virginia Department of Education website http://www.doe.virginia.gov/instruction/mathematics/index.shtml
34

PROBABILITY AND STATISTICS CURRICULUM GUIDE (Revised 2011) PRINCE WILLIAM COUNTY SCHOOLS
35

PROBABILITY AND STATISTICS CURRICULUM GUIDE (Revised 2011) PRINCE WILLIAM COUNTY SCHOOLS
This page is intentionally left blank.
Curriculum Information Essential Knowledge and SkillsKey Vocabulary
Essential Questions and UnderstandingsTeacher Notes and Elaborations
36

PROBABILITY AND STATISTICS CURRICULUM GUIDE (Revised 2011) PRINCE WILLIAM COUNTY SCHOOLSTopicProbability
Virginia Standard PS.13The student will develop, interpret, and apply the binomial probability distribution for discrete random variables, including computing the mean and standard deviation for the binomial variable.
The student will use problem solving, mathematical communication, mathematical reasoning, connections and representations to: Develop the binomial probability
distribution within a real-world context. Calculate the mean and standard
deviation for the binomial variable. Use the binomial distribution to
calculate probabilities associated with experiments for which there are only two possible outcomes.
Key Vocabularybinomial distributionprobability distribution
Essential Questions How is the mean and standard deviation calculated for a binomial variable? What is a probability distribution? What is meant by binomial distribution? How are binomial probabilities determined? How can the binomial distribution be applied to real-world applications?
Essential Understandings A probability distribution is a complete listing of all possible outcomes of an
experiment together with their probabilities. The procedure has a fixed number of independent trials.
A random variable assumes different values depending on the event outcome. A probability distribution combines descriptive statistical techniques and probabilities to
form a theoretical model of behavior.
Teacher Notes and ElaborationsA binomial experiment is a probability experiment that satisfies the following conditions:
1. The experiment is repeated for a fixed number n of trials, where each trial is independent of the other trials.
2. There are only two possible outcomes of interest for each trial. The outcomes can be classified as a success or as a failure.
3. The probability of a success is the same for each trial.4. The random variable x counts the number of successful trials out of the n trials.
The parameters of a binomial distribution are n and p.
If data are produced in a binomial setting, then the random variable x = number of successes is called a binomial random variable, and the probability distribution of x is called a binomial distribution. The distribution of the count x of successes in the binomial setting is the binomial distribution with parameters n and p. The parameter n is the number of observation, and p is the probability of a success on any one observation. The possible values of x are the whole numbers from 0 to n or x is B(n, p).
(continued)
Curriculum Information Essential Questions and UnderstandingsTeacher Notes and Elaborations
37

PROBABILITY AND STATISTICS CURRICULUM GUIDE (Revised 2011) PRINCE WILLIAM COUNTY SCHOOLSTopicProbability
Virginia Standard PS.13The student will develop, interpret, and apply the binomial probability distribution for discrete random variables, including computing the mean and standard deviation for the binomial variable.
Teacher Notes and Elaborations (continued)There are several ways to find the probability of x successes in n trials. One way is to use the binomial probability formula.
where: x = the number of successes in n trialsp = the probability of success in a single trialq = probability of failure in a single trialq = 1 – p
The mean and the standard deviation of a binomial distribution can be computed using the formulas: and .
Curriculum Information Resources Sample Instructional Strategies and Activities
38

PROBABILITY AND STATISTICS CURRICULUM GUIDE (Revised 2011) PRINCE WILLIAM COUNTY SCHOOLS
TopicProbability
Virginia Standard PS.13
Text:Elementary Statistics: Picturing the World, 3rd Edition, 2006, Larson and Farber, Pearson Prentice Hall
Elementary Statistics: A Step by Step Approach, Sixth Edition, 2007, Bluman, Glencoe McGraw-Hill
PWC Mathematics websitehttp://pwcs.math.schoolfusion.us/
Virginia Department of Education website http://www.doe.virginia.gov/instruction/mathematics/index.shtml
39

PROBABILITY AND STATISTICS CURRICULUM GUIDE (Revised 2011) PRINCE WILLIAM COUNTY SCHOOLS
This page is intentionally left blank.
40

PROBABILITY AND STATISTICS CURRICULUM GUIDE (Revised 2011) PRINCE WILLIAM COUNTY SCHOOLS
Curriculum Information Essential Knowledge and SkillsKey Vocabulary
Essential Questions and UnderstandingsTeacher Notes and Elaborations
TopicProbability
Virginia Standard PS.16The student will identify properties of a normal distribution and apply the normal distribution to determine probabilities, using a table or graphing calculator.
The student will use problem solving, mathematical communication, mathematical reasoning, connections and representations to: Identify the properties of a normal
probability distribution. Describe how the standard deviation
and the mean affect the graph of the normal distribution.
Determine the probability of a given event, using the normal distribution.
Key Vocabularycontinuous probability distributionnormal curvenormal distribution
Essential Questions What are the properties of a normal probability distribution? How does the standard deviation and mean affect the graph of the normal distribution? How is the probability of an event calculated using the normal distribution?
Essential Understandings The normal distribution curve is a family of symmetrical curves defined by the mean
and the standard deviation. Areas under the curve represent probabilities associated with continuous distributions. The normal curve is a probability distribution and the total area under the curve is 1.
Teacher Notes and ElaborationsA continuous random variable has an infinite number of possible values that can be represented by an interval on the number line. Its probability distribution is called a continuous probability distribution. A normal distribution is a continuous probability distribution for a random variable x.
A normal distribution can have any mean and any positive standard deviation. These two parameters, µ and σ, completely determine the shape of the normal curve. The mean gives the location of the line of symmetry, and the standard deviation describes how much the data are spread out.
The graph of a normal distribution is called the normal curve and has the following properties:
1. The mean, median, and mode are equal.2. The normal curve is bell shaped and is symmetric about the mean.3. The total area under the normal curve is equal to one. 4. The normal curve approaches but never touches the x-axis as it extends farther and
farther away from the mean. 5. Between and (in the center of the curve) the graph curves downward.
The graph curves upward to the left of and to the right of . The points at which the curve changes from curving upward to curving downward are called inflection points.
(continued)
41

PROBABILITY AND STATISTICS CURRICULUM GUIDE (Revised 2011) PRINCE WILLIAM COUNTY SCHOOLS
Curriculum Information Essential Questions and UnderstandingsTeacher Notes and Elaborations
TopicProbability
Virginia Standard PS.16The student will identify properties of a normal distribution and apply the normal distribution to determine probabilities, using a table or graphing calculator.
Teacher Notes and Elaborations (continued)
Normal Curve
Inflection points
x -3σ -2σ -1σ μ 1σ 2σ 3σ
68%
95%
99.7%
If a random variable x is normally distributed, the probability that x will fall in a given interval can be found by calculating the area under the normal curve for the given interval. To find the area under any normal curve, first convert the upper and lower bounds of the interval to z-scores. Then use the standard normal distribution to find the area.
Tables and/or graphing calculators should be used when making calculations. Additional instructions for TI calculators can be on the following website: http://education.ti.com/calculators/downloads/US/Guidebooks/Search/Results?cp=17.
42

PROBABILITY AND STATISTICS CURRICULUM GUIDE (Revised 2011) PRINCE WILLIAM COUNTY SCHOOLS
Curriculum Information Resources Sample Instructional Strategies and Activities
TopicProbability
Virginia Standard PS.16
Text:Elementary Statistics: Picturing the World, 3rd Edition, 2006, Larson and Farber, Pearson Prentice Hall
Elementary Statistics: A Step by Step Approach, Sixth Edition, 2007, Bluman, Glencoe McGraw-Hill
PWC Mathematics websitehttp://pwcs.math.schoolfusion.us/
Virginia Department of Education website http://www.doe.virginia.gov/instruction/mathematics/index.shtml
43

PROBABILITY AND STATISTICS CURRICULUM GUIDE (Revised 2011) PRINCE WILLIAM COUNTY SCHOOLS
44

PROBABILITY AND STATISTICS CURRICULUM GUIDE (Revised 2011) PRINCE WILLIAM COUNTY SCHOOLS
This page is intentionally left blank.
Curriculum Information Essential Knowledge and SkillsKey Vocabulary
Essential Questions and UnderstandingsTeacher Notes and Elaborations
TopicInferential Statistics
Virginia Standard PS.17The student, given data from a large sample, will find and interpret point estimates and confidence intervals for parameters. The parameters will include proportion and mean, difference between two proportions, and difference between two means (independent and paired).
The student will use problem solving, mathematical communication, mathematical reasoning, connections and representations to: Construct confidence intervals to
estimate a population parameter, such as a proportion or the difference between two proportions; or a mean or the difference between two means.
Select a value for alpha (Type I error) for a confidence interval.
Interpret confidence intervals in the context of the data.
Explain the importance of random sampling for confidence intervals.
Calculate point estimates for parameters, and discuss the limitations of point estimates.
Key Vocabularyconfidence intervalmargin of errorparameterpoint estimateType I error
Essential Questions Why are confidence intervals and tests of significance important? How is sampling used and why is it important?
Essential Understandings A primary goal of sampling is to estimate the value of a parameter based on a statistic. Confidence intervals use the sample statistic to construct an interval of values that one
can be reasonably certain contains the true (unknown) parameter. Confidence intervals and tests of significance are complementary procedures. Paired comparisons experimental design allows control for possible effects of
extraneous variables.
Teacher Notes and ElaborationsA parameter is a numerical description of a population characteristic. In statistical inference, the goal is often to estimate an unknown parameter or make a decision about its value.
A statistic is a numerical description of a sample characteristic.
A Type I error is the error of rejecting the null hypothesis when it is in fact true. In a hypothesis test, the level of significance is the maximum allowable probability of making a Type I error. To decrease the probability of a Type I error, decrease the significance level. Changing the sample size has no effect of the probability of a Type I error. A Type I error is denoted by , the lowercase Greek letter alpha.
A point estimate is a single value estimate for a population parameter. The most unbiased point estimate of the population means μ is the sample mean .
Using a point estimate and a margin of error, an interval estimate of a population parameter such as can be constructed. This interval estimate is called a confidence interval.
The margin of error, E, is calculated by the z-score for the given confidence level times the standard error. Given a level of confidence c, the margin of error (sometimes called the maximum error of estimate or error tolerance) E is the greatest possible distance between the point estimate and the value of the parameter it is estimating.
When , the sample standard deviation s can be used in place of σ.45
PROBABILITY AND STATISTICS CURRICULUM GUIDE (Revised 2011) PRINCE WILLIAM COUNTY SCHOOLS
(continued)
Curriculum Information Essential Questions and UnderstandingsTeacher Notes and Elaborations
46

PROBABILITY AND STATISTICS CURRICULUM GUIDE (Revised 2011) PRINCE WILLIAM COUNTY SCHOOLSTopicInferential Statistics
Virginia Standard PS.17The student, given data from a large sample, will find and interpret point estimates and confidence intervals for parameters. The parameters will include proportion and mean, difference between two proportions, and difference between two means (independent and paired).
Teacher Notes and Elaborations (continued)
For proportions, the standard error can be computed using the formula .
A confidence interval for proportion is plus or minus margin of error.
A c-confidence interval for the population mean is . The probability that the confidence interval contains is c.
Curriculum Information Resources Sample Instructional Strategies and Activities
47

PROBABILITY AND STATISTICS CURRICULUM GUIDE (Revised 2011) PRINCE WILLIAM COUNTY SCHOOLS
TopicInferential Statistics
Virginia Standard PS.17
Text:Elementary Statistics: Picturing the World, 3rd Edition, 2006, Larson and Farber, Pearson Prentice Hall
Elementary Statistics: A Step by Step Approach, Sixth Edition, 2007, Bluman, Glencoe McGraw-Hill
PWC Mathematics websitehttp://pwcs.math.schoolfusion.us/
Virginia Department of Education website http://www.doe.virginia.gov/instruction/mathematics/index.shtml
48


![[PAGE INTENTIONALLY LEFT BLANK]€¦ · inogen, inc. fiscal 2015 annual report. [page intentionally left blank]](https://img.pdfslide.us/doc/110x75/603dd78a05f41851485839e0/page-intentionally-left-blank-inogen-inc-fiscal-2015-annual-report-page-intentionally.jpg)