Embed Size (px)
Citation preview
Grade 3 Data Management & Probability
Teacher’s Notes

Ontario Mathematics Curriculum Grades 1 to 8, 1997Strand: Data Management and ProbabilityGrade: 3
© Math Wizards, 2003All rights reservedDeveloped by T. TaskerMay be photocopied for classroom use. Further replication or commercial use is strictlyprohibited.
Overall Expectations:- sort, classify, and cross-classify objects and data- collect and organize data- interpret displays of data, present the information, and discuss it using mathematical language- demonstrate an understanding of probability and demonstrate the ability to apply probability infamiliar day-to-day situations- relate meaningful experiences about probability
This resource is based on Data Management & Probability Friday’s. That is, every Friday abreak from the current mathematical unit is taken and Data Management & Probability isstudied. Therefore there are 34 activities, one for almost every Friday of the year. This methodcan also help make the five mathematic strands more manageable.
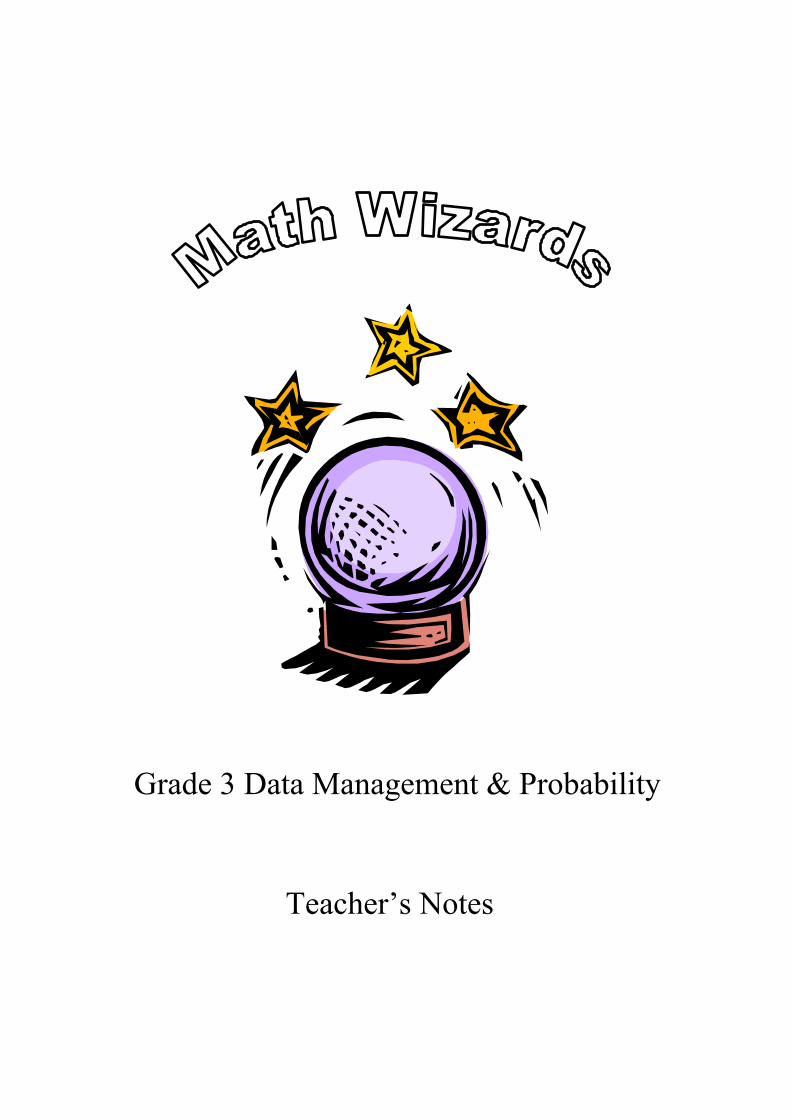
Resource Overview
Every class could warm up by turning the attendance graph into a human pie graph!
Directions for the human pie graph:1) Have the students group themselves according to the category they chose in theattendance graph.2) The groups then come to the carpet in a line.3) The group lines join up to make a circle.4) A large string can be laid around the inside perimeter of the circle.5) A string can then be laid from the centre of the circle to where the various groups startand stop (see the diagram to the right).6) Label the sections of the pie graph.7) Discuss and interpret the pie graph.
** The daily attendance graph information can be found in the resource “Every day grade 3mathematics” in the math room at www.bonfieldpublicschool.com.**
Graphing and Interpretation
Activity 1IntroductionBar graph (1:1) ofschool supplies
Activity 2Interpret bargraphs
Activity 3Given data to bargraph (1:1)
Activity 4Given data to bargraph (1:1)
Activity 5Bar graph (1:10)of bugs
Activity 6Bar graph (1:5)of leaves
Activity 7Given data to bargraph (1: multiple)
Activity 8Given data to bargraph (1:multiple)
Activity 9Interpretpictograph (1:10)
Activity 10Magic pebblespictograph(1:multiple)
Activity 11Given data topictograph(1:multiple)
Activity 12Given data topictograph(1:multiple)
Activity 13Interpret pie orcircle graphs
Activity 14Class survey
Activity 15School survey
Activity 15(continued)School survey
Activity 16Interpret linegraph
Sorting &Classifying
Activity 17Sorting buttons
Activity 18Double Venndiagrams(buttons)
Activity 19Double Venndiagrams (food)
Activity 20Double Venndiagram (shapes)
Activity 21Triple Venndiagram(snowmen)
Probability Activity 22Probability withcoin tossing
Activity 23Probability withdice rolling
Activity 24Leap Frog
Activity 25Probability withspinners (half)
Activity 26Probability withspinners (fairthirds)
Activity 27Probability withspinners (unfairthirds)
Activity 28Probability withspinners (fairquarters)
Activity 29Probability withspinners (unfairquarters)
Activity 30Probability withspinners (unfairquarters)
Activity 31Merlin’s magicaljar of insects
Activity 32Merlin’s magical jar of flowers
Activity 33Merlin’s MagicBag (6:3:1)
Activity 34Merlin’s MagicBag (4:4:2)

Materials1) white lima beans (thesemay be purchased at agrocery store)2) spray paint of variouscolours (red, yellow, blue,green, brown, etc.)
Materials:1) different shaped pasta2) various colours offood colouring3) jar4) tin foil
Materials Box
The materials to implement this data management resource are easily and inexpensively made. Below is a list of those materials that you will need, organized by activity.
Activity FIVE - film canisters or cups** If you would like to use film canisters on your magneticattendance graph board, just take a small magnet and tape it ontothe bottom of the film canister. **
Activity SIX - film canisters or cups** If you would like to use film canisters on your magneticattendance graph board, just take a small magnet and tape it ontothe bottom of the film canister. **
Activity TEN - smarties in a small cup OR multi coloured lima beans in a small cup
To make coloured lima beans:Method:1) Lay the lima beans on a newspaper.2) Spray paint them and let them dry.3) Once dry, turn them over and spraypaint the other side.
Activity FIFTEEN - a spread sheet software program like Appleworks, Quatro Pro orExcel.- if you have Excel you can download a ready to use spreadsheet atwww.bonfieldpublicschool.com
ActivitySEVENTEEN
- buttons or beads for sorting (you may also choose another object)
ActivityEIGHTEENNINETEENTWENTYTWENTY-ONE
- sorting objects commercial or home made coloured pasta
To make coloured pasta:Method:1) Put the pasta and the food colouringinto the jar.2) Close the jar lid tight and shake.3) Once colouring is evenly spread ontothe pasta, spread out onto tin foil to dry.
ActivityTWENTY-TWO
- a class set of real coins (pennies or nickles)
ActivityTWENTY-THREE
- a class set of dice
ActivityTWENTY-FOUR
- coloured lima beans (each pair of students requires 6 lima beans of twodifferent colours - see directions in Activity TEN)- a class set of dice (each pair of students get two die)
ActivityTWENTY-FIVETWENTY-SIXTWENTY-SEVENTWENTY-EIGHTTWENTY-NINETHIRTY
- commercial spinners OR CD spinners (building instruction follow thislist of materials)
Activity THIRTY-ONE
- a jar with TEN objects inside. There should be three objects with aratio of 5:3:1 (similar to Merlin’s Magical Jar of Insects)
Activity THIRTY-TWO
- a jar with TEN objects inside. There should be three objects with aratio of 5:2:2 (similar to Merlin’s Magical Jar of Flowers)
Activity THIRTY-THREE
- a nice material bag with three different kinds of objects (example:erasers, pencils, markers) and have a ratio of 6:3:1 in the bag.
Activity THIRTY-FOUR
- a nice material bag with three different kinds of objects (example:erasers, pencils, markers) and have a ratio of 4:4:2 in the bag.
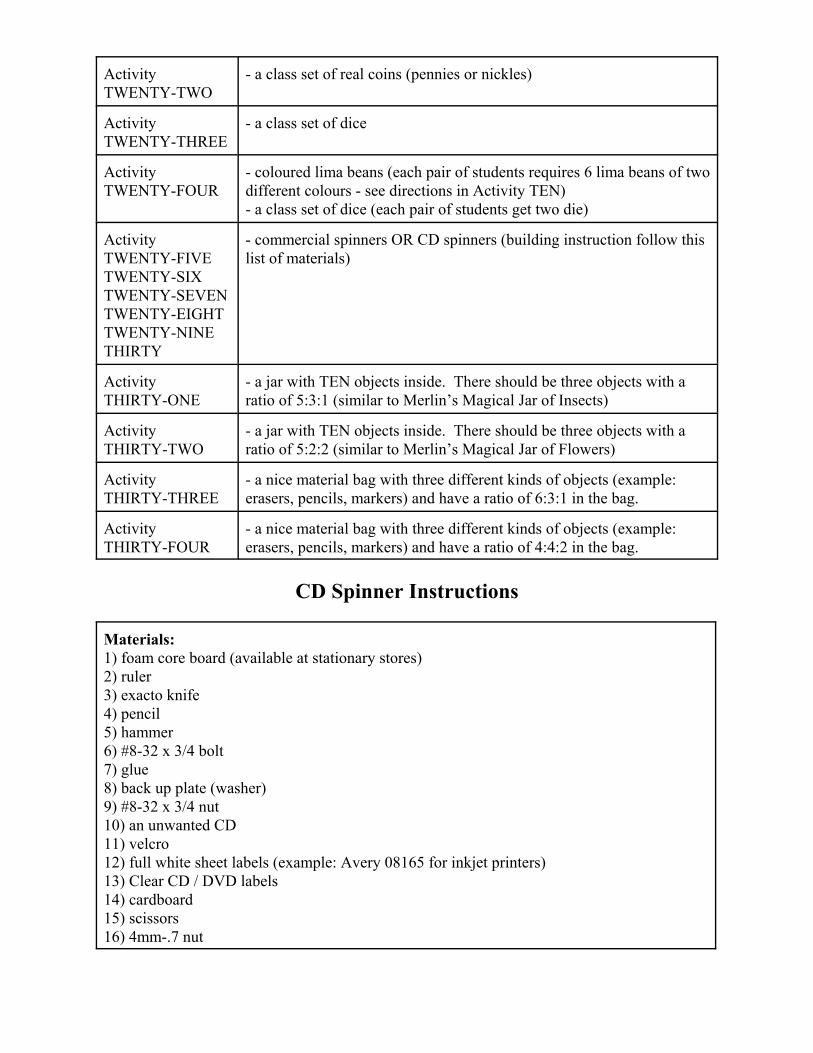
CD Spinner Instructions
Materials:1) foam core board (available at stationary stores)2) ruler3) exacto knife4) pencil5) hammer6) #8-32 x 3/4 bolt7) glue8) back up plate (washer)9) #8-32 x 3/4 nut10) an unwanted CD11) velcro12) full white sheet labels (example: Avery 08165 for inkjet printers)13) Clear CD / DVD labels14) cardboard15) scissors16) 4mm-.7 nut

Directions
1) Cut two 7.5cm x 7.5cm squares of foam core with anexacto knife.
2) Mark the centre of one square on both sides, and on oneside of the second square.
3) Hammer the bottom of the bolt into the centre of ONEfoam core square to form a hole in which the bolt may beinserted.
4) Lightly hammer the head of the bolt into the SECONDfoam core square so that it makes a small dimple.
5) Insert the bolt through the FIRST foam core square(through the hole).
6) Glue the dimple foam core square and place the dimpleover the head of the bolt. This piece will help to keep thespinner flat.

7) Place one metal washer over the bolt and then screw onthe medium hexagonal nut tightly.
8) Print off the spinner templates that follow these directionsonto the full white sheet labels (example: Avery 08165 forinkjet printers) OR decorate your own CD labels. You maychoose to use the clear CD labels to place over top thedecorated label for protection.(When printing the spinner templates select print currentpage or print pages x to y options)
9) Attach one side of the velcro to the base and the other sideto your CD. Remember while placing the velcro to keepthings centred and that the velcro pieces match up. The boltshould come up through the hole in the CD.
10) Place the second metal washer over the bolt. This willreduce the friction between the CD and the pointer.
11) Print off the pointer templates that follow thesedirections onto the full white sheet labels (example: Avery08165 for inkjet printers). Peel and stick the full label ontocardboard (cereal box guage is appropriate) and cut out thepointers. Punch a hole through the centre of the pointer.OR trace pointer onto cardboard and cut out. You maychoose to decorate it in your own way.
12) Place the pointer over the bolt and then screw on thesmall hexagonal nut just enough to prevent the pointer fromflying off.
© Math Wizards, 2003


Data Management & ProbabilityActivity ONE
As a class, let’s make a list of where we see data.______________________________________________________________________________________________________________________________________________________________________________________________________
Why do we communicate data in the form of graphs and charts?______________________________________________________________________________________________________________________________________________________________________________________________________
Today we will be completing a bar graph on the next page. Remember to:- identify the four parts of the graph; (title, labels, scale, data)- create an appropriate title for the graph; and- make sure all columns are properly labelled
When you have completed the graph, answer the following questions:
1) What does Merlin have most of?________________________________________________________________________________________________________
2) What does Merlin need to buy?_________________________________________________________________________________________________________
3) How many pencils and erasers does Merlin have altogether?__________________________________________________________________________________
4) What other information does this graph tell you?________________________________________________________________________________________________________________________________________________________________________________________________________________________________________________________________________
Grade 3 DMactivity001 covers:D7: construct bar graphs (with discrete classes on one axis and number on the other) and pictographs using scales with multiples of 2, 5 and 10D8: interpret data from graphs (eg. bar graphs, pictographs, and circle graphs)© Math Wizards, 2003

Merlin is preparing to go back to school. He needs you to help him organize hisschool supplies. Would you show Merlin how to graph his school supplies so hecan easily see what he has of each kind?
_____________________________________________________________
7
6
5
4
3
2
1
eraser _____________ scissors _________
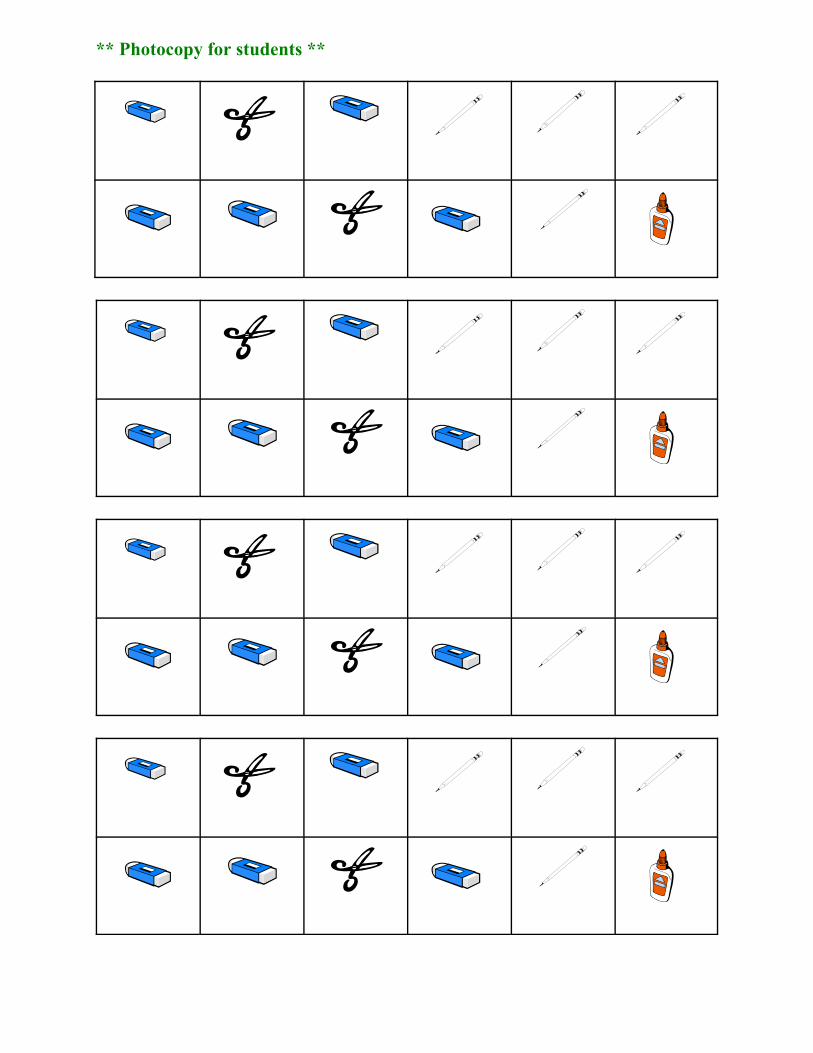
** Photocopy for students **

500 rolls of one die
020406080100120140
1 2 3 4 5 6
Face value
Freq
uenc
y
Data Management & ProbabilityActivity TWO
With a partner, look at the following three bar graphs. In the space provideddescribe three things that the bar graph communicates.
What does the graph “500 rolls of one die” communicate?1) __________________________________________________________________________________________________________________________________
2) __________________________________________________________________________________________________________________________________
3) __________________________________________________________________________________________________________________________________
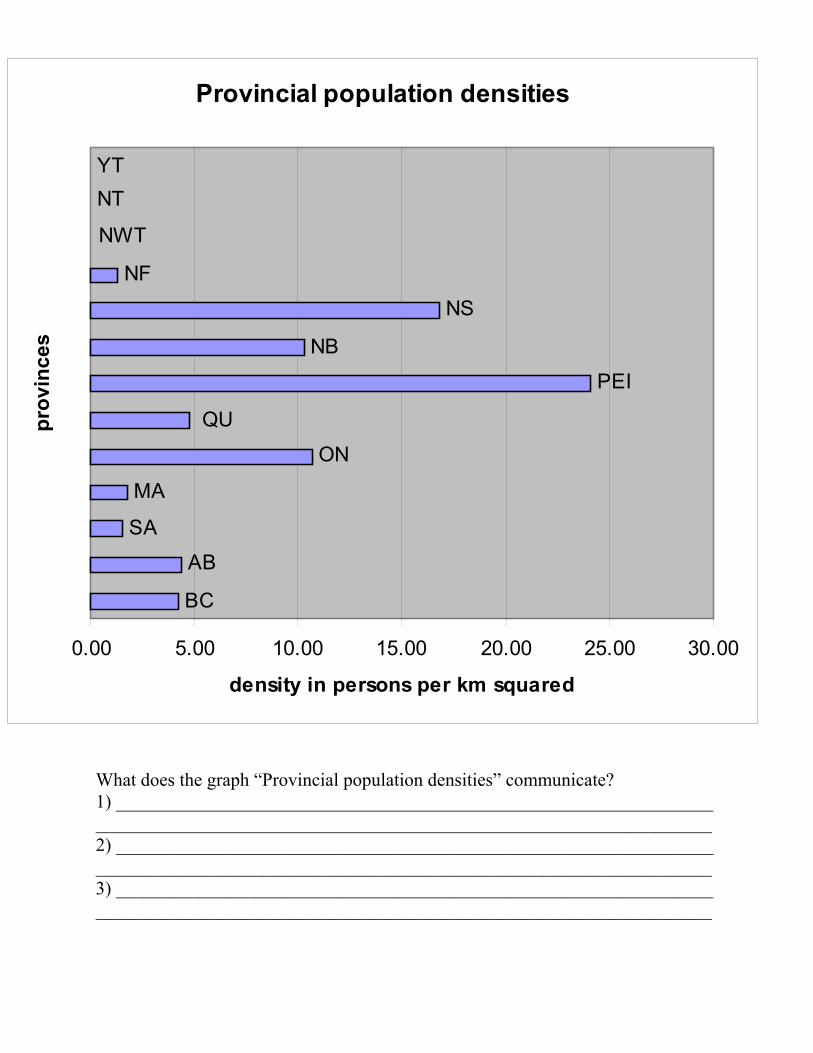
Provincial population densities
BC
ABSA
MA
ON
PEINB
NSNF
YT
QU
NWT
NT
0.00 5.00 10.00 15.00 20.00 25.00 30.00
prov
ince
s
density in persons per km squared
What does the graph “Provincial population densities” communicate?1) __________________________________________________________________________________________________________________________________2) __________________________________________________________________________________________________________________________________3) __________________________________________________________________________________________________________________________________

220
230
240
250
260
270
heads tails
500 flips of one coin
What does the graph “500 flips of one coin” communicate?1) __________________________________________________________________________________________________________________________________2) __________________________________________________________________________________________________________________________________3) __________________________________________________________________________________________________________________________________
What are some similarities between the three different kinds of bar graphs?______________________________________________________________________________________________________________________________________________________________________________________________________
What are some differences between the three different kinds of bar graphs?______________________________________________________________________________________________________________________________________________________________________________________________________
Grade 3 DMactivity002 covers:D8:interpret data from graphs (eg. bar graphs, pictographs, and circle graphs)© Math Wizards, 2003

Data Management & ProbabilityActivity THREE
Merlin was given some flower bulbs as a gift. Flower bulbs are planted in the fall,stay dormant for the winter and then bloom in the spring! But of course Merlinturned his gardening into mathematics. Let’s graph Merlin’s flower bulbs.
Tulips Daffodils Crocuses Hyacinths
| | | | | | | | | | | | | | | | | | | | | | |
___________________________________________
Scale ¸
What does Merlin have most of?__________________________________________________________________
What does Merlin have least of?__________________________________________________________________
How many tulips and crocuses does Merlin have altogether?__________________________________________________________________
What else does the graph tell you?________________________________________________________________________________________________________________________________________________________________________________________________________________________________________________________________________Grade 3 DMactivity003 covers:D7:construct bar graphs (with discrete classes on one axis and number on the other) and pictographs using scales with multiples of 2, 5, and 10D8:interpret data from graphs(eg. bar graphs, pictographs, and circle graphs)© Math Wizards, 2003

Data Management & ProbabilityActivity FOUR
Merlin loves fall leaves. He decided to collect some of the fallen leaves for acollage art project. Let’s graph how many of each colour Merlin collected.
Red Yellow Green Brown
4 7 3 9
___________________________________________
Scale ¸
What colour does Merlin have the most of?__________________________________________________________________
What does colour does Merlin have the least of?__________________________________________________________________
How many red and green leaves does Merlin have altogether?__________________________________________________________________
What else does the graph tell you?________________________________________________________________________________________________________________________________________________________________________________________________________________________________________________________________________Grade 3 DMactivity004 covers:D7:construct bar graphs (with discrete classes on one axis and number on the other) and pictographs using scales with multiples of 2, 5, and 10D8:interpret data from graphs(eg. bar graphs, pictographs, and circle graphs)© Math Wizards, 2003
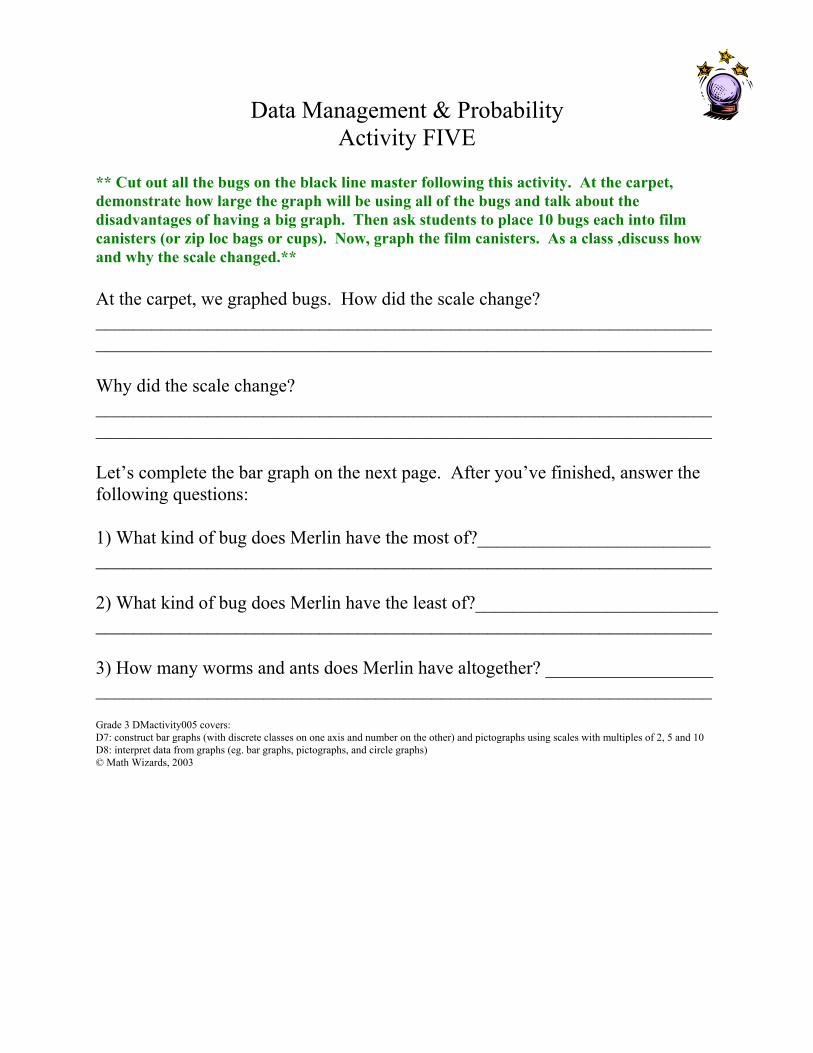
Data Management & ProbabilityActivity FIVE
** Cut out all the bugs on the black line master following this activity. At the carpet,demonstrate how large the graph will be using all of the bugs and talk about thedisadvantages of having a big graph. Then ask students to place 10 bugs each into filmcanisters (or zip loc bags or cups). Now, graph the film canisters. As a class ,discuss howand why the scale changed.**
At the carpet, we graphed bugs. How did the scale change?____________________________________________________________________________________________________________________________________
Why did the scale change?____________________________________________________________________________________________________________________________________
Let’s complete the bar graph on the next page. After you’ve finished, answer thefollowing questions:
1) What kind of bug does Merlin have the most of?___________________________________________________________________________________________
2) What kind of bug does Merlin have the least of?____________________________________________________________________________________________
3) How many worms and ants does Merlin have altogether? ____________________________________________________________________________________
Grade 3 DMactivity005 covers:D7: construct bar graphs (with discrete classes on one axis and number on the other) and pictographs using scales with multiples of 2, 5 and 10D8: interpret data from graphs (eg. bar graphs, pictographs, and circle graphs)© Math Wizards, 2003

Merlin has noticed a lot of bugs in his garden. He needs you to help him sortthrough the different kinds of bugs in his garden. Would you show Merlin how tograph the bugs so he can easily see how many he has of each kind?
____________________________________________________________
70
60
50
40
30
20
10
___________lady bug earthworm bee
** Photocopy for students**

** Photocopy and cut out for the grouping activity at the carpet.**

Data Management and ProbabilityActivity SIX
** Cut out all the leaves on the black line master following this activity. At the carpet,demonstrate how large the graph will be using all of the leaves and talk about thedisadvantages of having a big graph. Then ask students to place 5 leaves each into filmcanisters (or ziploc bags or cups). Now, graph the film canisters. As a class, discuss howand why the scale changed.**
Why do we change the scale on graphs?______________________________________________________________________________________________________________________________________________________________________________________________________
Complete the bar graph on the next page. After you’ve finished, answer thefollowing questions:
1) What kind of leaf does Merlin have most of?______________________________________________________________________________________________
2) What kind of leaf does Merlin have least of?______________________________________________________________________________________________
3) How many oak and maple leaves does Merlin have altogether? _________________________________________________________________________________________________________________________________________________
Grade 3 DMactivity006 covers:D7: construct bar graphs (with discrete classes on one axis and number on the other) and pictographs using scales with multiples of 2, 5 and 10D8: interpret data from graphs (eg. bar graphs, pictographs, and circle graphs)© Math Wizards, 2003

Merlin is raking the leaves in his yard. He needs you to help him sort the leavesinto different bins. Would you show Merlin how to graph his leaves so that he caneasily see how many he has of each kind?
_____________________________________________________________
35
30
25
20
15
10
5
oak maple elm willow

** Photocopy for students**

** Photocopy and cut out for the demonstration at the carpet.**

Data Management & ProbabilityActivity SEVEN
After raking the leaves in his lawn, Merlin decided to rake Gweneth’s lawn. Merlin took a tally of each kind of leaf and he now needs your help to graph them.Remember, you might need to use a different kind of scale!
Oak Maple Elm Willow
45 60 30 25
___________________________________________
Scale ¸
What kind of leaf does Merlin have most of?__________________________________________________________________
What kind of leaf does Merlin have least of?__________________________________________________________________
How many maple and willow leaves does Merlin have altogether?__________________________________________________________________
What else does the graph tell you?________________________________________________________________________________________________________________________________________________________________________________________________________________________________________________________________________Grade 3 DMactivity007 covers:D7:construct bar graphs (with discrete classes on one axis and number on the other) and pictographs using scales with multiples of 2, 5, and 10D8:interpret data from graphs(eg. bar graphs, pictographs, and circle graphs)© Math Wizards, 2003

Data Management & ProbabilityActivity EIGHT
Merlin surveyed the wizards at his school to see what ice cream flavour was theirfavourite. He tallied his results below, but he doesn’t think he can graph it becausethe numbers are too big! Will you help Merlin graph his ice cream survey results.
Chocolate Vanilla Strawberry Other
110 90 60 20
___________________________________________
What is the favourite ice cream flavour of the wizards surveyed?__________________________________________________________________
What is the least favourite ice cream flavour of the wizards surveyed?__________________________________________________________________
How many wizards were surveyed by Merlin?__________________________________________________________________
What else does the graph tell you?________________________________________________________________________________________________________________________________________________________________________________________________________________________________________________________________________Grade 3 DMactivity008 covers:D7:construct bar graphs (with discrete classes on one axis and number on the other) and pictographs using scales with multiples of 2, 5, and 10D8:interpret data from graphs(eg. bar graphs, pictographs, and circle graphs)© Math Wizards, 2003
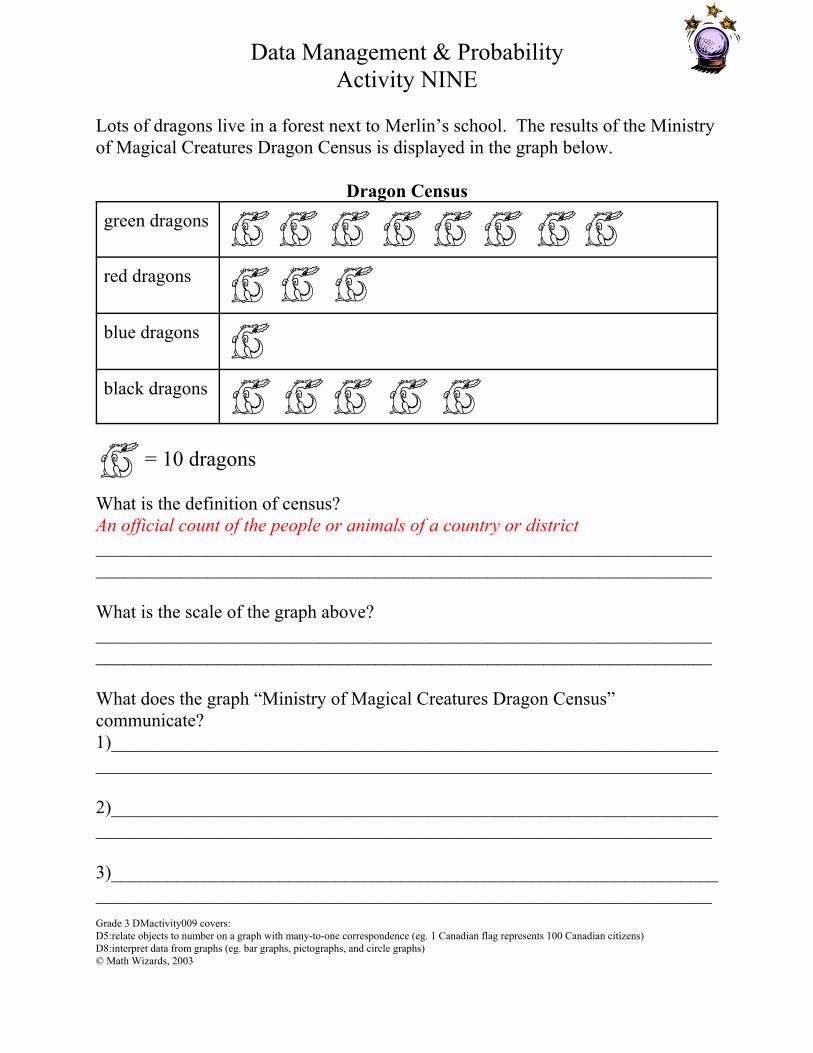
Data Management & ProbabilityActivity NINE
Lots of dragons live in a forest next to Merlin’s school. The results of the Ministryof Magical Creatures Dragon Census is displayed in the graph below.
Dragon Censusgreen dragons
red dragons
blue dragons
black dragons
= 10 dragons
What is the definition of census?An official count of the people or animals of a country or district____________________________________________________________________________________________________________________________________
What is the scale of the graph above?____________________________________________________________________________________________________________________________________
What does the graph “Ministry of Magical Creatures Dragon Census”communicate?1)___________________________________________________________________________________________________________________________________
2)___________________________________________________________________________________________________________________________________
3)___________________________________________________________________________________________________________________________________Grade 3 DMactivity009 covers:D5:relate objects to number on a graph with many-to-one correspondence (eg. 1 Canadian flag represents 100 Canadian citizens)D8:interpret data from graphs (eg. bar graphs, pictographs, and circle graphs)© Math Wizards, 2003
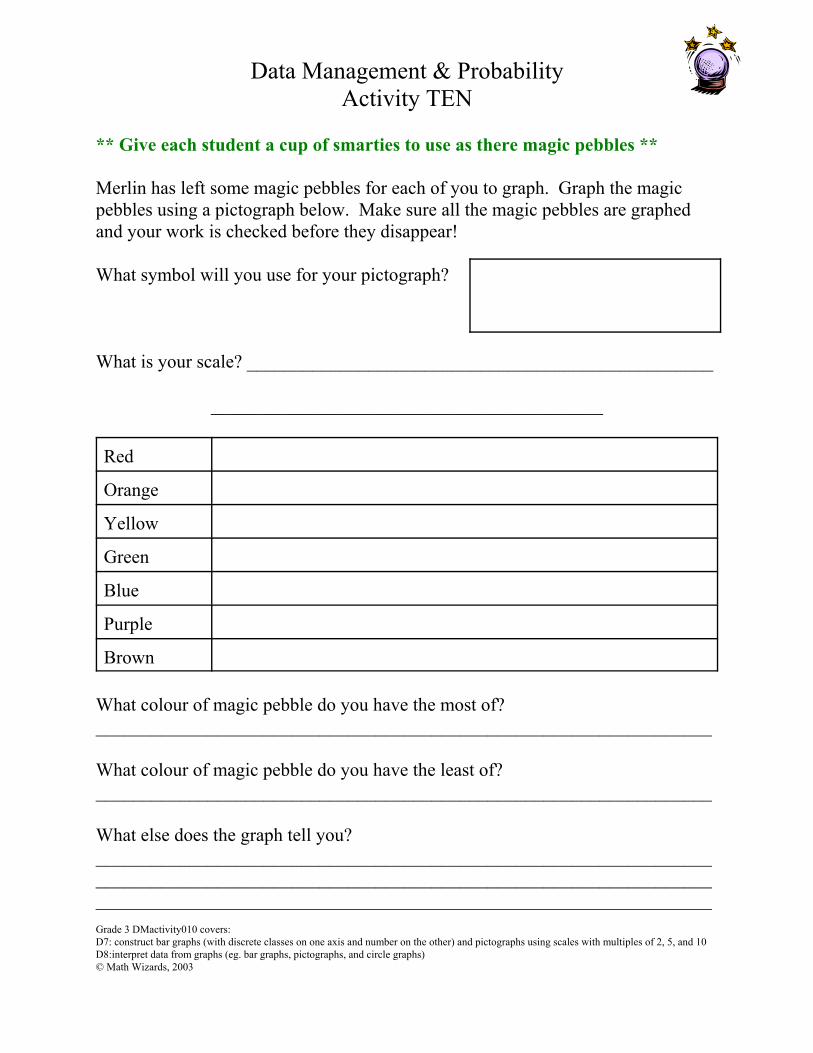
Data Management & ProbabilityActivity TEN
** Give each student a cup of smarties to use as there magic pebbles **
Merlin has left some magic pebbles for each of you to graph. Graph the magicpebbles using a pictograph below. Make sure all the magic pebbles are graphedand your work is checked before they disappear!
What symbol will you use for your pictograph?
What is your scale? __________________________________________________
__________________________________________
Red
Orange
Yellow
Green
Blue
Purple
Brown
What colour of magic pebble do you have the most of?__________________________________________________________________
What colour of magic pebble do you have the least of?__________________________________________________________________
What else does the graph tell you?______________________________________________________________________________________________________________________________________________________________________________________________________Grade 3 DMactivity010 covers:D7: construct bar graphs (with discrete classes on one axis and number on the other) and pictographs using scales with multiples of 2, 5, and 10D8:interpret data from graphs (eg. bar graphs, pictographs, and circle graphs)© Math Wizards, 2003

Data Management & ProbabilityActivity ELEVEN
** At the carpet, complete the “Shoot and Score Pictograph” activity outlinedon the next page**
At the carpet, we created the “Shoot and Score Pictograph” (Merlin likes hockeybut he can’t skate!). Recently, Merlin has been studying the night sky. He hascounted quite a few heavenly bodies and tallied them below. Help him create apictograph of his night sky sightings.
Planets Stars Moons Comets
100 950 200 300
What symbol will you use for your pictograph?
What is your scale? _________________________________________________
_________________________________________
What has Merlin seen most in the night sky?__________________________________________________________________
How many planets, moons and comets has Merlin seen altogether?__________________________________________________________________
What else does the graph tell you?______________________________________________________________________________________________________________________________________________________________________________________________________Grade 3 DMactivity011 covers:D5:relate objects to number on a graph with many-to-one correspondence (eg. 1 Canadian flag represents 100 Canadian citizens)D7: construct bar graphs (with discrete classes on one axis and number on the other) and pictographs using scales with multiples of 2, 5, and 10D8: interpret data from graphs (eg. bar graphs, pictographs, and circle graphs)© Math Wizards, 2003

Shoots and Score Pictograph
** Photocopy the hockey puck graphics on the next page twice. Cut out thepucks. Make sure you have at least 40 **** Reproduce the data below on the chalk board or chart paper **** At the carpet, or as a class create a pictograph using Hockey’s top fivecareer goal scorers data. Talk about how the pictograph will use the symbolof hockey pucks, and each hockey puck represents 100 goals scored. Talkabout cutting a puck in half to represent 50 goals **
Name WayneGretzky
GordieHowe
MarcelDionne
PhilEsposito
MarkMessier
GoalsScored
862 801 731 717 575


Data Management & ProbabilityActivity TWELVE
Merlin’s dog, Leo, loves to dig up bones. He finds all kinds of different colouredbones! Merlin has tallied all the bones Leo has dug up. Create a pictograph ofLeo’s bone collection.
Purple Green Blue Orange
35 20 5 15
What symbol will you use for your pictograph?
What is your scale? __________________________________________________
_________________________________________
What colour of bone has Leo dug up the most?__________________________________________________________________
What colour of bone has Leo dug up the least?__________________________________________________________________
How many blue and orange bones has Leo dug up altogether?__________________________________________________________________
What else does the graph tell you?______________________________________________________________________________________________________________________________________________________________________________________________________Grade 3 DMactivity012 covers:D5:relate objects to number on a graph with many-to-one correspondence (eg. 1 Canadian flag represents 100 Canadian citizens)D7: construct bar graphs (with discrete classes on one axis and number on the other) and pictographs using scales with multiples of 2, 5, and 10D8: interpret data from grpahs (eg. bar graphs, pictographs, and circle graphs)© Math Wizards, 2003

����������������������������������������������������������������������������������������������������������������������������������������������������������������������������������������������������������������������������������������������������������������������������������������������������������������������������������������������������������������������������������������������������������������������������������������������������������������������������
������������������������������������������������������������������������������������������������������������������������������������������������������������������������������������������������������������������������������������������������������������
The Population of Ontario and Quebec
ON
QU
Data Management & ProbabilityActivity THIRTEEN
** Turning the daily attendance graph into pie graphs on data managementFridays is an excellent introduction to pie graphs. **
With a partner, look at the following three pie graphs. In the space provided,describe three things that the pie graphs communicate.
What does the graph “The population of Ontario and Quebec” communicate?1) __________________________________________________________________________________________________________________________________
2) __________________________________________________________________________________________________________________________________
3) __________________________________________________________________________________________________________________________________
������������������������
������������������������������������������������������������������������������������������������
��������������������������������������������������������������������������������
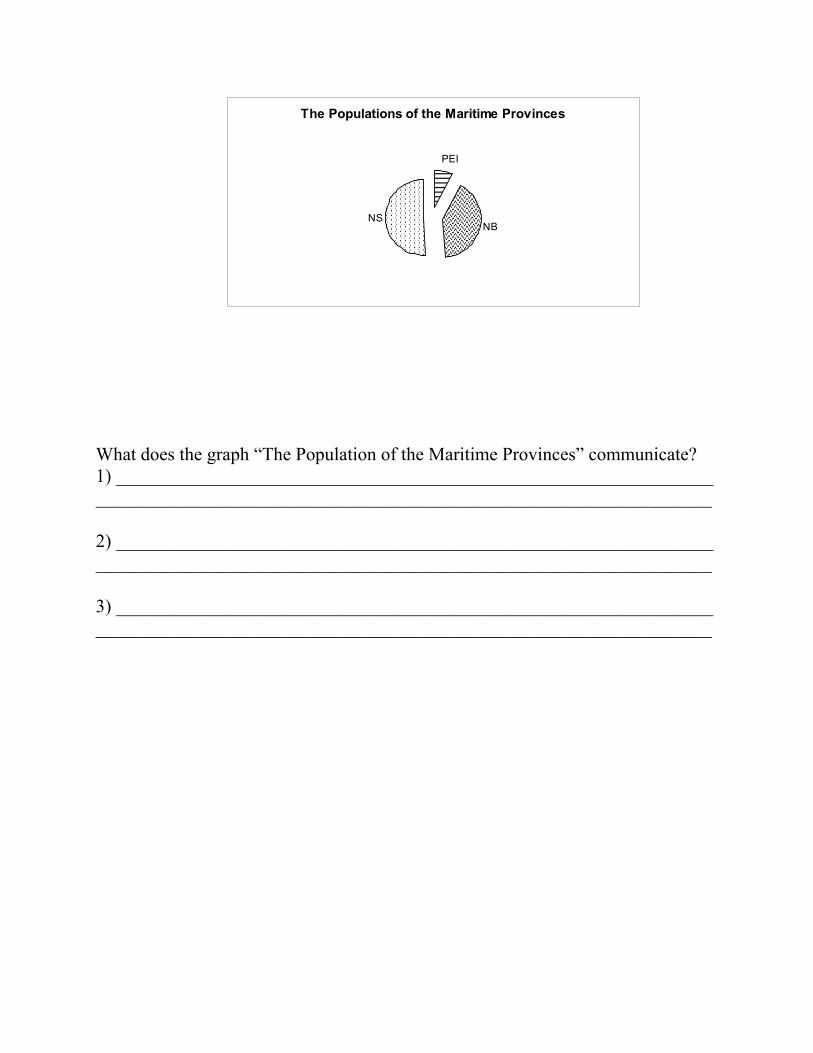
The Populations of the Maritime Provinces
PEI
NBNS
What does the graph “The Population of the Maritime Provinces” communicate?1) __________________________________________________________________________________________________________________________________
2) __________________________________________________________________________________________________________________________________
3) __________________________________________________________________________________________________________________________________

������������������������������������������������������������������������������������������������������������������������������������������������������������������������������������������������������������������������������������������������������������
���������������������������������������������������������������������������������������������������������������������������������������������������������������������������������������������������
����������������������������������������������������������������������������������������������������������������������������������������������������������������������������������������������������
The Populations of Canada's Territories
NWT
NT
YT
What does the graph “The Population of Canada’s Territories” communicate?1) __________________________________________________________________________________________________________________________________
2) __________________________________________________________________________________________________________________________________
3) __________________________________________________________________________________________________________________________________
What are some similarities between the three different kinds of pie graphs?______________________________________________________________________________________________________________________________________________________________________________________________________
What are some differences between the three different kinds of pie graphs?______________________________________________________________________________________________________________________________________________________________________________________________________Grade 3 DMactivity013 covers:D8:interpret data from graphs (eg. bar graphs, pictographs, and circle graphs)© Math Wizards, 2003

Data Management & ProbabilityActivity FOURTEEN
Today we will be conducting class surveys. In groups of four, you will worktogether to create a good survey question, survey the class, create a graph andpresent your results to the class.
** Groups may be formed through a random process (like selecting the samepieces of a four piece puzzle in a pile), by a teacher selected process, by astudent selected process, or by using regular seating arrangement groups. **My group includes: ____________________________________________________________________________________________________________________
Step ONE:
Our survey question is:____________________________________________________________________________________________________________________________________
This question is important because:____________________________________________________________________________________________________________________________________
Our choices include (up to five choices):____________________________________________________________________________________________________________________________________
Step TWO:
Survey the class using your tally chart below. Make sure you put your choices onthe top of each column.

Step THREE:
Graph your data using the chart paper below.
Step FOUR:
What three things does your survey communicate?1) __________________________________________________________________________________________________________________________________
2) __________________________________________________________________________________________________________________________________
3) __________________________________________________________________________________________________________________________________

Step FIVE:
Present your findings to the class. Be sure to describe the importance of yoursurvey question and how you are going to use this data to make our classroom abetter place. You will be marked using the following rubric:
Criteria Level 1 Level 2 Level 3 Level 4
Understanding ofconcepts
• A question withfinite answers waschosen• Transfer of datafrom tally chart tograph wasincomplete
• A question withfinite answers waschosen• Tally data wastransferred to thegraph
• An appropriatequestion with finiteanswers was chosen• Tally data wastransferred to thegraph effectively
• A question withsignificance to dailyclassroom life wasposed• Tally data wastransferred to thegraph effectively,and helpedcommunicate thesurvey results to theaudience
Communication ofrequired knowledge
• Survey results areexplained, however,are incomplete
• Survey results areexplained• Importance orapplicability arelimited
• Survey results,importance ofsurvey andimplications for theclassroom wereclearly explained
• The surveyconducted wasclearly explained• Results areenlightening andimplementable
Grade 3 DMactivity014 covers:D3:generate questions that have a finite number of responses for their own surveysD4:use their questions as a basis for collecting dataD7:construct bar graphs (with discrete classes on one axis and number on the other) and pictographs using scales with multiples of 2, 5, and 10D8:interpret data from graphs (eg. bar graphs, pictographs, and circle graphs)© Math Wizards, 2003
Data Management & ProbabilityActivity FIFTEEN
For the next two data management & probability classes we will be conducting aschool survey. We will be asking two different survey questions. These questionsshould reflect important issues in the school and may help create some solutions.
Step ONE:
As a class, let’s decide what our school survey questions are:1)___________________________________________________________________________________________________________________________________
2)___________________________________________________________________________________________________________________________________
These questions are important because:________________________________________________________________________________________________________________________________________________________________________________________________________________________________________________________________________
Our choices include (up to four choices):For question 1:________________________________________________________________________________________________________________________
For question 2:________________________________________________________________________________________________________________________
Step TWO:
To survey the school, we will divide the classrooms up amongst the groups. Eachgroup will be responsible for recording the data from their assigned classrooms foreach question.My group includes: ____________________________________________________________________________________________________________________
When you enter the classroom, make sure you show the teacher the note on thefollowing page, so that they can help you conduct the survey.

Dear Teacher,We are surveying the school about three important questions. We will read thequestion and the four available choices. We will then repeat each choice, one at atime, giving the students a chance to respond by raising their hands. We appreciateyour help.
Question 1: __________________________________________________________________________________________________________________________
Tally ChartChoices Û
class one:___________
class two:___________
class three:___________
Question 2: __________________________________________________________________________________________________________________________
Tally ChartChoices Û
class one:___________
class two:___________
class three:___________

Step THREE:
Graph the data from the classes you surveyed using the chart paper below.

Step FOUR:
What three things does your survey communicate?1) __________________________________________________________________________________________________________________________________
2) __________________________________________________________________________________________________________________________________
3) __________________________________________________________________________________________________________________________________
Step FIVE:
Once you’ve finished analysing the data you collected from your assignedclassrooms, enter the data into the spread sheet program.** Choose the spread sheet software program you are most comfortable with(Excel, Quatro Pro or Appleworks are examples). Set up a spreadsheet in thechosen software so that the individual class tallies can be entered and thenadded up automatically into a school total. Make sure all students save to themaster file and that all students are able to access this file later. A sample ofthis spreadsheet is available at www.bonfieldpublicschool.com in MicrosoftExcel. Once you’ve downloaded the file you may personalize it by replacingthe actual questions, choices and class names (3A or by teacher names). **
Step SIX:
Open the spread sheet file with the school survey data. Make a computer graph ofboth questions and print them off.
What two conveniences did the spread sheet offer you in analysing your data?1) __________________________________________________________________________________________________________________________________
2) __________________________________________________________________________________________________________________________________
Grade 3 DMactivity014 covers:D3:generate questions that have a finite number of responses for their own surveysD4:use their questions as a basis for collecting dataD7:construct bar graphs (with discrete classes on one axis and number on the other) and pictographs using scales with multiples of 2, 5, and 10D8:interpret data from graphs (eg. bar graphs, pictographs, and circle graphs)© Math Wizards, 2003

Temperatures Across Canada
-40
-30-20
-100
1020
30
Month
Tem
pera
ture
(Cel
cius
)
St. John'sBaker LakeSaskatoonVictoria
Data Management & ProbabilityActivity SIXTEEN
** Recording the daily temperature with a line graph is a great introductionto line graphs. **
Line graphs are another kind of graph. They are usually used for recordingtemperature, the ups and downs of the stock market, or the speed of a car. Linegraphs are used when you want to record information from one source over aperiod of time.
With a partner, look at the following line graph. It is a graph of the averagemonthly temperature in four different cities across Canada. In the space provided,describe three things that the line graph communicates.
What does the graph “Temperatures Across Canada” communicate?1) __________________________________________________________________________________________________________________________________
2) __________________________________________________________________________________________________________________________________
3) __________________________________________________________________________________________________________________________________Grade 3 DMactivity016 covers:D8:interpret data from graphs (eg. bar graphs, pictographs, and circle graphs)© Math Wizards, 2003

Data Management & ProbabilityActivity SEVENTEEN
** You could use buttons or beads for this activity.**
Merlin has left you a cup of buttons. He would like your help sorting them. Sortyour magical buttons and then draw and write about what you did.
Draw your sort:
Describe your sort in words:________________________________________________________________________________________________________________________________________________________________________________________________________________________________________________________________
What rule did you use?________________________________________________________________________________________________________________________________

Merlin has a Problem!
Merlin has a problem. He is brewing a new spell and he needs three numbers. When he opens the package of numbers he finds four. Help Merlin pick whichnumber doesn’t belong and doesn’t go in the spell.
1993 19911919 9191
Circle the number that doesn’t belong.
Explain why it doesn’t belong in the spell.________________________________________________________________________________________________________________________________________________________________________________________________________________________________________________________________________________________________________________________________________________________________________________________________________________________________________________________________________________________________________________________________________________
Answer:1993 - because it has a three instead of just ones and nines1991 - because it is a palindrome and none of the other numbers are palindromes1919 - because it has a one in the tens column instead of a nine9191 - because it starts with a nine instead of a one
Grade 3 DMactivity017 covers:D1: use two or more attributes (eg. colour, texture, length) to sort objects and dataD2: select appropriate methods (eg. charts, Venn diagrams) to cross-classify objects© Math Wizards, 2003

Data Management & ProbabilityActivity EIGHTEEN
** Do an example at the carpet with coloured pasta (see materials for recipe) or using sorting objects.**Help Merlin sort his buttons into a DOUBLE Venn diagram.
Grade 3 DMactivity018 covers:D1: use two or more attributes (eg. colour, texture, length) to sort objects and dataD2:select appropriate methods (eg. charts, Venn diagrams) to cross-classify objectsD6:organize data in Venn diagrams and charts using several criteria© Math Wizards, 2003

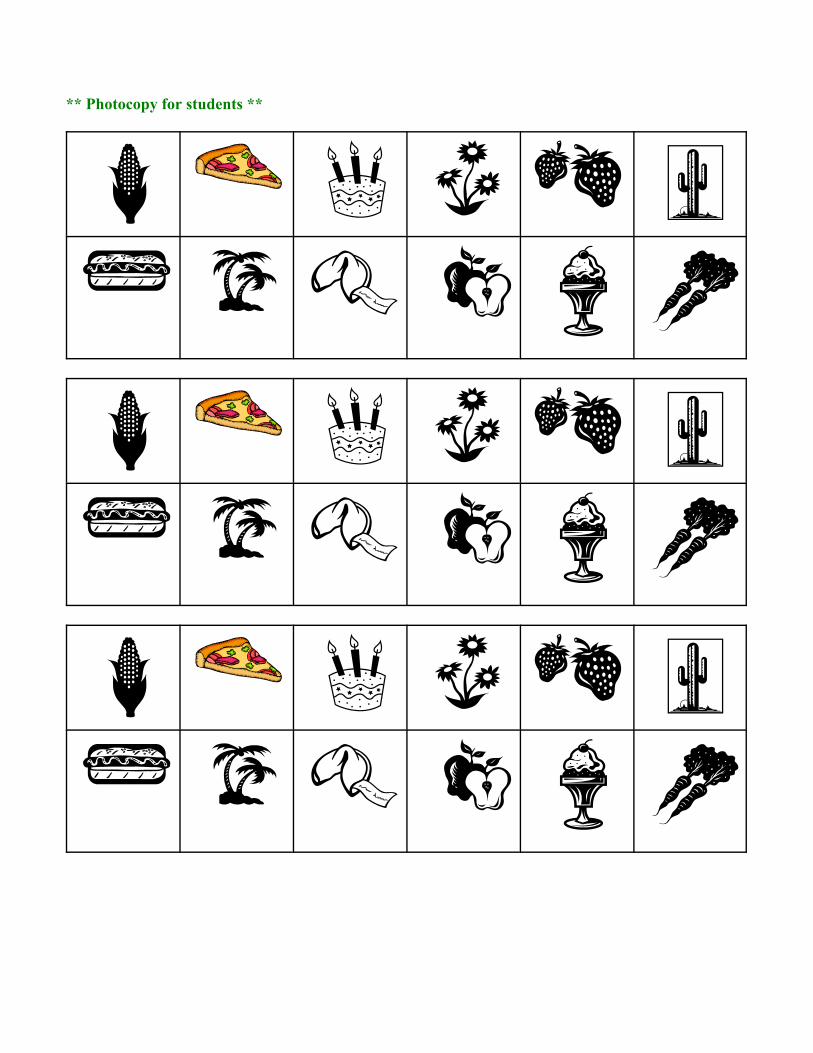
** Photocopy for students **

Data Management & ProbabilityActivity NINETEEN
** Do an example at the carpet.**Help Merlin sort the plants and food into a DOUBLE Venn diagram.
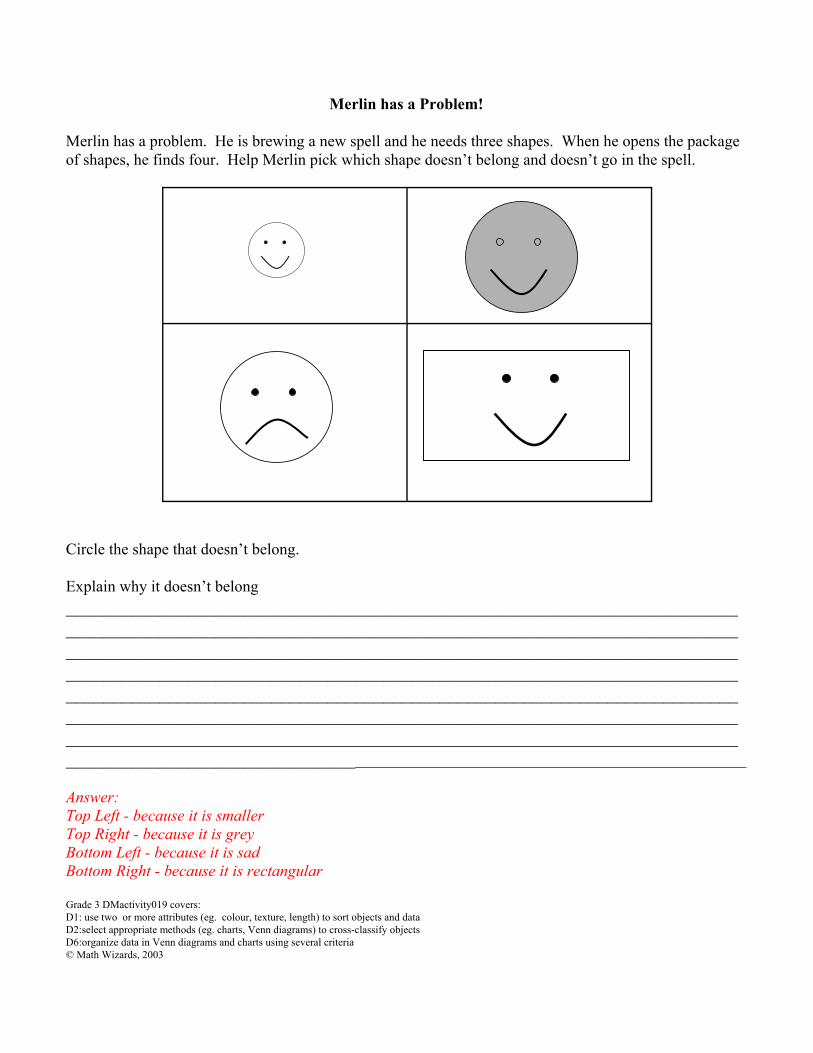
Merlin has a Problem!
Merlin has a problem. He is brewing a new spell and he needs three shapes. When he opens the packageof shapes, he finds four. Help Merlin pick which shape doesn’t belong and doesn’t go in the spell.
Circle the shape that doesn’t belong.
Explain why it doesn’t belong________________________________________________________________________________________________________________________________________________________________________________________________________________________________________________________________________________________________________________________________________________________________________________________________________________________________________________________________________________________________________________________________________________________________________________________________________
Answer:Top Left - because it is smallerTop Right - because it is greyBottom Left - because it is sadBottom Right - because it is rectangular
Grade 3 DMactivity019 covers:D1: use two or more attributes (eg. colour, texture, length) to sort objects and dataD2:select appropriate methods (eg. charts, Venn diagrams) to cross-classify objectsD6:organize data in Venn diagrams and charts using several criteria© Math Wizards, 2003
** Photocopy for students **

Data Management & ProbabilityActivity TWENTY
** Do an example at the carpet with sorting objects.**Help Merlin sort the two-dimensional shapes into a DOUBLE Venn diagram.
Grade 3 DMactivity020 covers:D1: use two or more attributes (eg. colour, texture, length) to sort objects and dataD2:select appropriate methods (eg. charts, Venn diagrams) to cross-classify objectsD6:organize data in Venn diagrams and charts using several criteria© Math Wizards, 2003

** Photocopy for students **
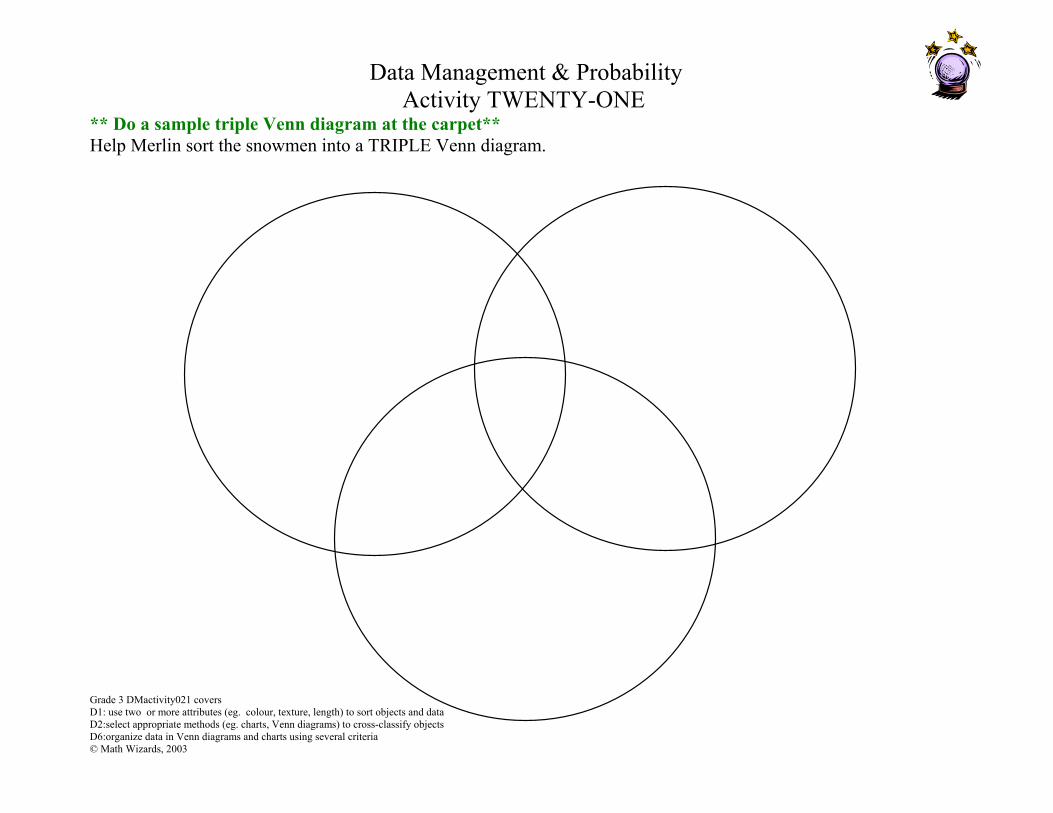
Data Management & ProbabilityActivity TWENTY-ONE
** Do a sample triple Venn diagram at the carpet**Help Merlin sort the snowmen into a TRIPLE Venn diagram.
Grade 3 DMactivity021 coversD1: use two or more attributes (eg. colour, texture, length) to sort objects and dataD2:select appropriate methods (eg. charts, Venn diagrams) to cross-classify objectsD6:organize data in Venn diagrams and charts using several criteria© Math Wizards, 2003
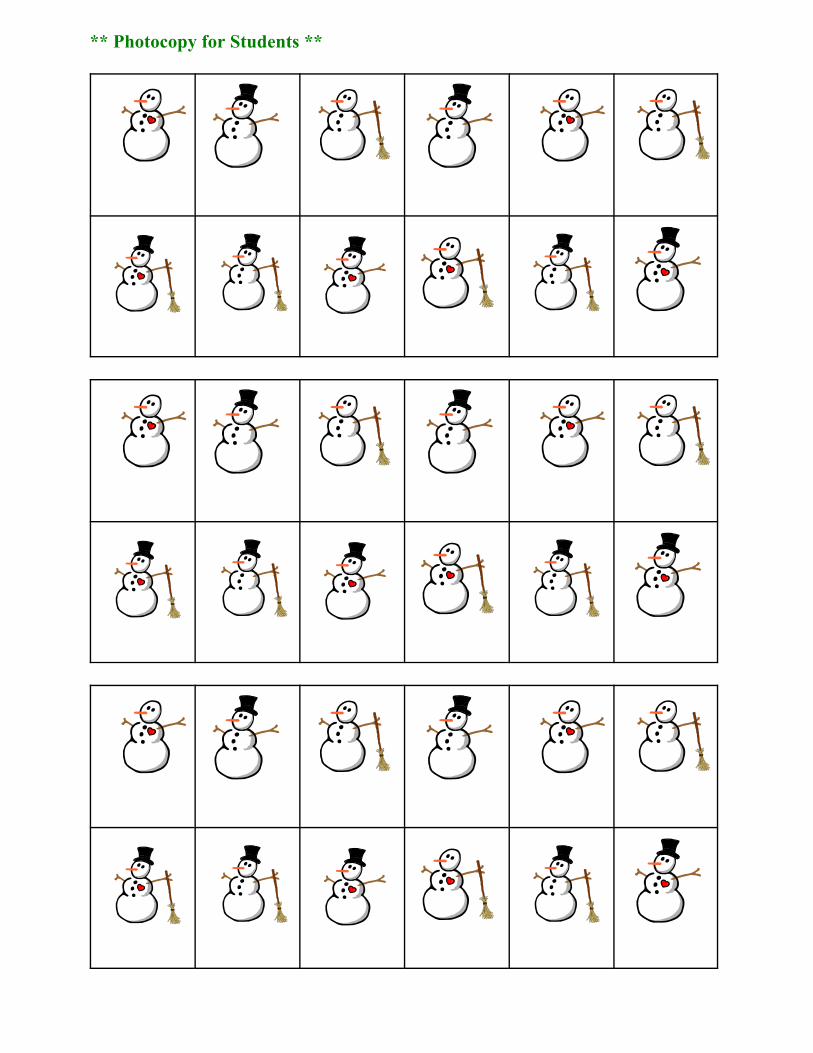
** Photocopy for Students **

Data Management & ProbabilityActivity TWENTY-TWO
Today we are going to start studying probability. What is the definition ofprobability?It is a number that shows how likely it is that an event will happen.__________________________________________________________________
Coins have two sides. One side is called “heads” because it has a picture of QueenElizabeth’s head and the other side is called “tails”. Different types of coins have adifferent tail picture. All Canadian nickels have beavers.
Merlin has given you a magic coin to conduct some probability experiments.** Conduct a probability experiment at the carpet and demonstrate that probability isrepresented as a fraction (the result / the total number of tosses) **
Probability Experiment ONE
PREDICT which side you think is luckier? Circle one.
Heads Tails
Toss the coin TEN times. Record your results in the tally chart below.
Tally Marks Total
Heads
Tails
Which side came up the most?__________________________________________
Did you predict correctly? _____________________________________________
What is the probability of tossing a HEADS?______________________________
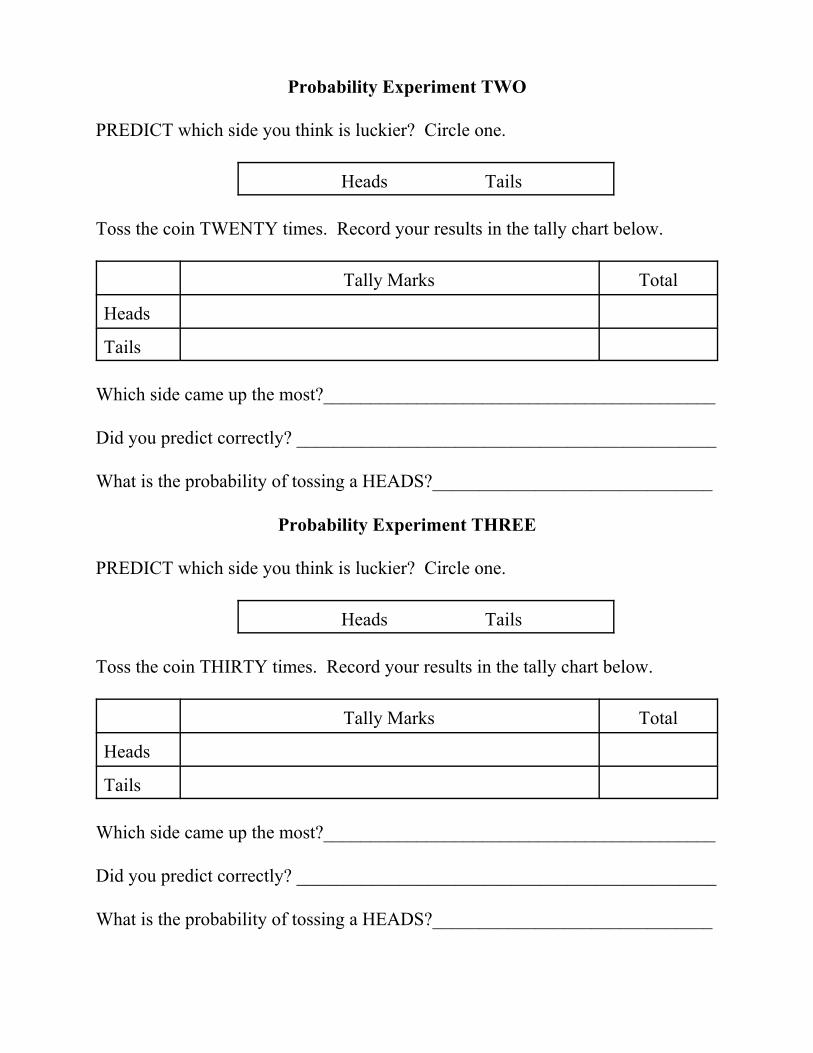
Probability Experiment TWO
PREDICT which side you think is luckier? Circle one.
Heads Tails
Toss the coin TWENTY times. Record your results in the tally chart below.
Tally Marks Total
Heads
Tails
Which side came up the most?__________________________________________
Did you predict correctly? _____________________________________________
What is the probability of tossing a HEADS?______________________________
Probability Experiment THREE
PREDICT which side you think is luckier? Circle one.
Heads Tails
Toss the coin THIRTY times. Record your results in the tally chart below.
Tally Marks Total
Heads
Tails
Which side came up the most?__________________________________________
Did you predict correctly? _____________________________________________
What is the probability of tossing a HEADS?______________________________

Is there an equal chance of tossing a heads or tails each time you toss the coin?__________________________________________________________________
Explain:__________________________________________________________________________________________________________________________________________________________________________________________________________________________________________________________________________________________________________________________________________
Merlin has a problem!
Gweneth ordered an ice-cream cone with one scoop of chocolate, one scoop ofstrawberry and one scoop of vanilla. How many different ways could Merlin placethe scoops on Gweneth’s cone?Explain your answer:
Grade 3 DMactivity022 covers:D9:conduct simple probability experiments (eg. rolling a number cube, spinning a pinner) and predict the results© Math Wizards, 2003
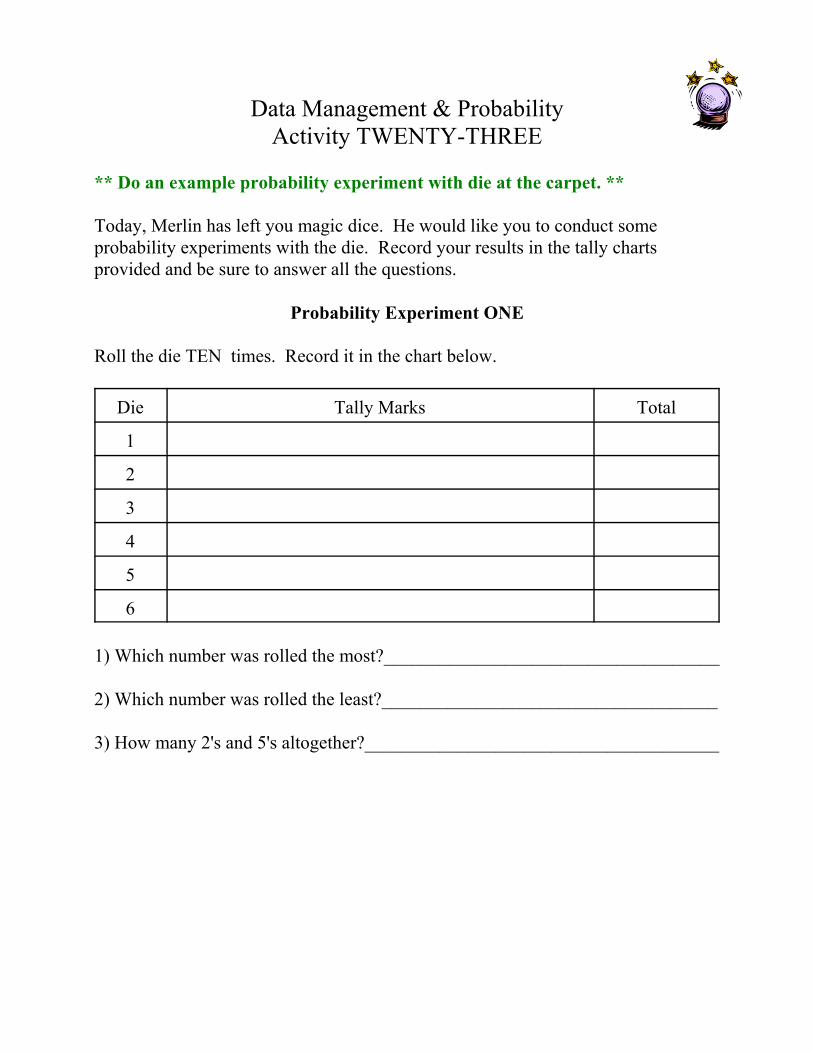
Data Management & ProbabilityActivity TWENTY-THREE
** Do an example probability experiment with die at the carpet. **
Today, Merlin has left you magic dice. He would like you to conduct someprobability experiments with the die. Record your results in the tally chartsprovided and be sure to answer all the questions.
Probability Experiment ONE
Roll the die TEN times. Record it in the chart below.
Die Tally Marks Total
1
2
3
4
5
6
1) Which number was rolled the most?____________________________________
2) Which number was rolled the least?____________________________________
3) How many 2's and 5's altogether?______________________________________
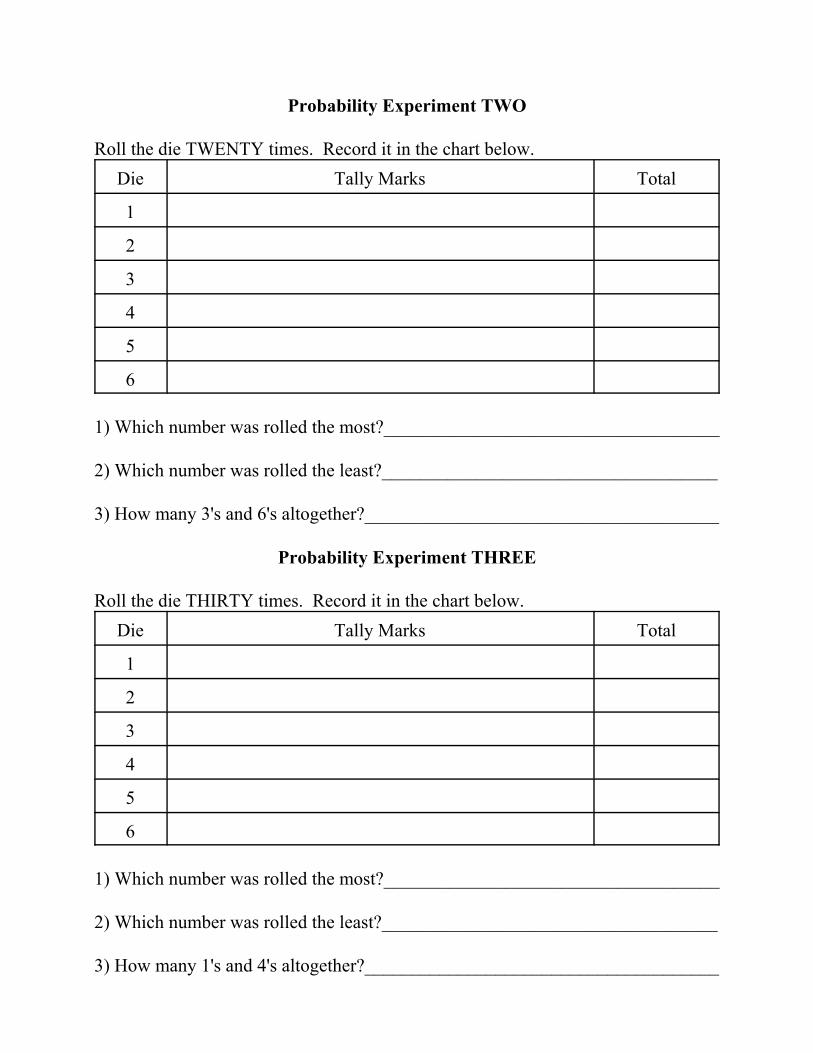
Probability Experiment TWO
Roll the die TWENTY times. Record it in the chart below.Die Tally Marks Total
1
2
3
4
5
6
1) Which number was rolled the most?____________________________________
2) Which number was rolled the least?____________________________________
3) How many 3's and 6's altogether?______________________________________
Probability Experiment THREE
Roll the die THIRTY times. Record it in the chart below.Die Tally Marks Total
1
2
3
4
5
6
1) Which number was rolled the most?____________________________________
2) Which number was rolled the least?____________________________________
3) How many 1's and 4's altogether?______________________________________

Merlin wants to know how many of each number you rolled altogether, in all threetally charts? Fill in the chart below.
Die 1 2 3 4 5 6
Altogether
What do you think will be your luckiest number and why? ________________________________________________________________________________________________________________________________________________________________________________________________________________________________________________________________________
With a witness watching, roll your die and record what you received.
You rolled a
If you predicted correctly, write your name on the board.
Do you think there is an equal chance of receiving any number on the die? _______
Explain:____________________________________________________________________________________________________________________________________________________________________________________________________________________________________________________________________________________________________________________________________________________________________________________________________________Grade 3 DMactivity024 covers:D9:conduct simple probability experiments (eg. rolling a number cube, spinning a spinner) and predict the resultsD11:predict the probability that an event will occur© Math Wizards, 2003
Data Management & ProbabilityActivity TWENTY-FOUR
Merlin has a Problem!
Merlin just received three new shirts and three new pants as a gift! He got a redshirt, a green shirt and a yellow shirt. The three pants he got were brown, blackand blue. How many different combinations of shirts and pants could Merlin makeinto outfits?
Explain your solution:

Leap Frog
Directions:1) This game is for TWO players.2) You will need 6 red lima beans and 6 blue lima bean markers.3) You will also need a pair of dice and the game board on the next page.4) Each person will roll one die. The person with the highest roll will pick theirlima bean marker colour and place ONE lima bean on any lily pad numbered 1 to12.5) The other person will place ONE of their lima beans on any lily pad numbered 1to 12. BUT you can’t put a lima bean on a number that has already been chosen.6) Keep taking turns placing a lima bean on the numbered lily pads until they haveall been filled up.7) The first person will roll BOTH die. Add the die together. If the sum is equal toa lily pad where one of your markers is placed, you may move ONE squaretowards the fly.8) The next person will repeat step six. Roll BOTH die. Add the numberstogether. IF the sum is equal to a lily pad where the player’s marker is placed theymay move ONE square towards the fly.9) Repeat until one player has moved all their lima beans to the other side and hascaught all their flies.
Is this game fair? ____________________________________________________
How would you change the rules?________________________________________________________________________________________________________________________________________________________________________________________________________________________________________________________________________________________________________________________________________________________________________________________________________________________________________________________________________________________________________________________________________________Grade 3 DMactivity024 covers:D9:conduct simple probability experiments (eg. rolling a number cube, spinning a spinner) and predict the resultsD10:apply the concept of likelihood to events in solving simple problems© Math Wizards, 2003
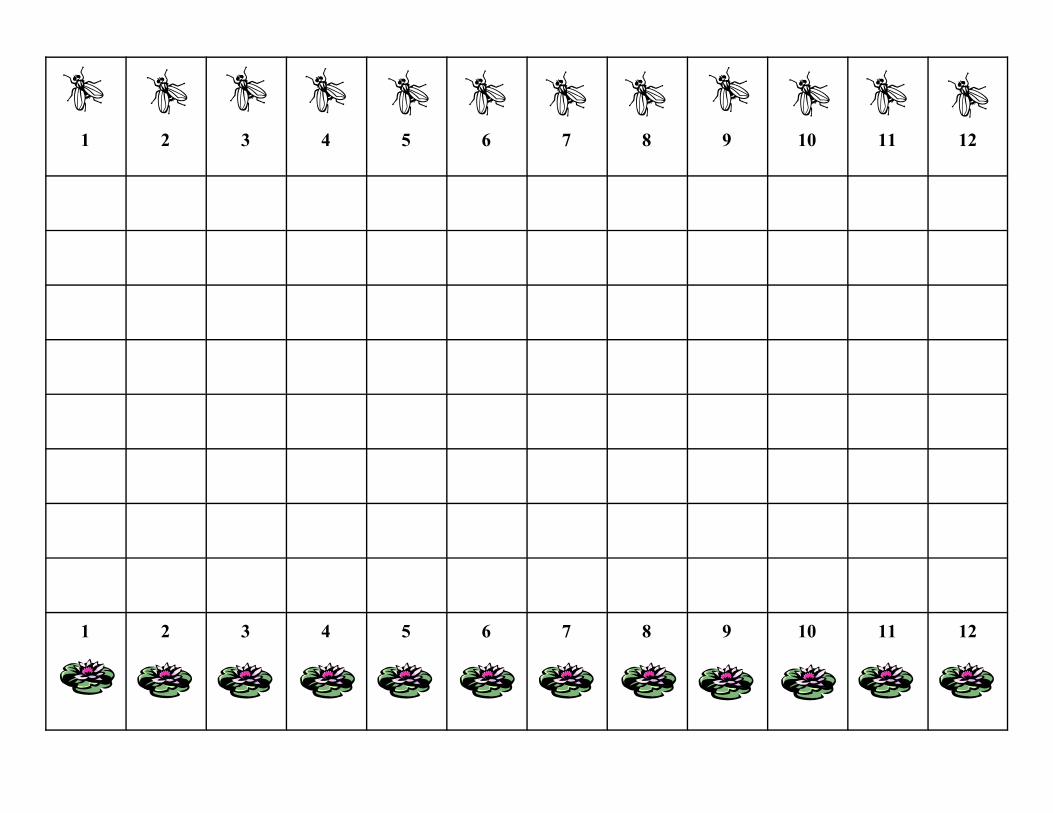
1 2 3 4 5 6 7 8 9 10 11 12
1 2 3 4 5 6 7 8 9 10 11 12

RED BLUE
Data Management & ProbabilityActivity TWENTY-FIVE
** Do an example probability experiment with the spinners at the carpet. Youwill need to have one base and one labelled CD for each student (see materialsbox for building instructions). **
Merlin wants us to do a probability experiment witha spinner. He has left us a spinner with a top thatlooks like the picture on the right.Spin the spinner 30 times and record your results inthe tally chart below.
My PredictionI think the spinner will land more often on thecolour:__________________________________________
Colour Tally
RED
BLUE
Complete the following questions:
1) What colour did the spinner land on the most?__________________________
2) Did you predict correctly?__________________________________________
3) Is there an equal chance of landing on the red side or the blue side?__________
4) Put the probability of landing on the red side into a fraction.________________
5) Put the probability of landing on the blue side into a fraction._______________Grade 3 DMactivity025 covers:D9: conduct simple probability experiments (eg. rolling a number cube, spinning a spinner) and predict the resultsD11:predict the probability that an event will occur© Math Wizards, 2003

RED BLUE
YELLOW
Data Management & ProbabilityActivity TWENTY-SIX
Merlin wants us to do a probability experiment witha spinner. He has left us a spinner with a top thatlooks like the picture on the right.Spin the spinner 30 times and record your results inthe tally chart below.
My PredictionI think the spinner will land more often on thecolour:__________________________________________
Colour Tally
RED
BLUE
YELLOW
Complete the following questions:
1) What colour did the spinner land on the most?___________________________
2) Did you predict correctly?___________________________________________
3) Is there an equal chance of landing on any colour?________________________
4) Put the probability of landing on the red section into a fraction.______________
5) Put the probability of landing on the blue section into a fraction._____________
6) Put the probability of landing on the yellow section into a fraction.___________Grade 3 DMactivity026 covers:D9: conduct simple probability experiments (eg. rolling a number cube, spinning a spinner) and predict the resultsD11:predict the probability that an event will occur© Math Wizards, 2003

RED RED
BLUE
Data Management & ProbabilityActivity TWENTY-SEVEN
Merlin wants us to do a probability experiment witha spinner. He has left us a spinner with a top thatlooks like the picture on the right.Spin the spinner 30 times and record your results inthe tally chart below.
My PredictionI think the spinner will land more often on thecolour:__________________________________________
Colour Tally
RED
BLUE
Complete the following questions:
1) What colour did the spinner land on the most?___________________________
2) Did you predict correctly?___________________________________________
3) Why did you predict that colour? _______________________________________________________________________________________________________
4) Is there an equal chance of landing on either red or blue?__________________
5) Put the probability of landing on the red section into a fraction.______________
6) Put the probability of landing on the blue section into a fraction._____________Grade 3 DMactivity027 covers:D9: conduct simple probability experiments (eg. rolling a number cube, spinning a spinner) and predict the resultsD11:predict the probability that an event will occur© Math Wizards, 2003

BLUERED
YELLOW GREEN
Data Management & ProbabilityActivity TWENTY-EIGHT
Merlin wants us to do a probability experiment witha spinner. He has left us a spinner with a top thatlooks like the picture on the right.Spin the spinner 30 times and record your results inthe tally chart below.
My PredictionI think the spinner will land more often on thecolour:__________________________________________
Colour Tally
RED
BLUE
YELLOW
GREEN
Complete the following questions:
1) What colour did the spinner land on the most?___________________________
2) Is there an equal chance of landing on any colour?________________________
3) Put the probability of landing on the red section into a fraction.______________
4) Put the probability of landing on the blue section into a fraction._____________
5) Put the probability of landing on the yellow section into a fraction.___________
6) Put the probability of landing on the green section into a fraction.____________Grade 3 DMactivity028 covers:D9: conduct simple probability experiments (eg. rolling a number cube, spinning a spinner) and predict the resultsD11:predict the probability that an event will occur© Math Wizards, 2003

BLUERED
YELLOW YELLOW
Data Management & ProbabilityActivity TWENTY-NINE
Merlin wants us to do a probability experiment witha spinner. He has left us a spinner with a top thatlooks like the picture on the right.Spin the spinner 30 times and record your results inthe tally chart below.
My PredictionI think the spinner will land more often on thecolour:__________________________________________
Colour Tally
RED
BLUE
YELLOW
Complete the following questions:
1) What colour did the spinner land on the most?___________________________
2) Did you predict correctly?___________________________________________
3) Why did you predict that colour? _______________________________________________________________________________________________________
4) Is there an equal chance of landing on any colour?________________________
5) Put the probability of landing on the red section into a fraction.______________
6) Put the probability of landing on the blue section into a fraction._____________
7) Put the probability of landing on the yellow section into a fraction.___________Grade 3 DMactivity029 covers:D9: conduct simple probability experiments (eg. rolling a number cube, spinning a spinner) and predict the resultsD11:predict the probability that an event will occur© Math Wizards, 2003

BLUE
YELLOW YELLOW
YELLOW
Data Management & ProbabilityActivity THIRTY
Merlin wants us to do a probability experiment witha spinner. He has left us a spinner with a top thatlooks like the picture on the right.Spin the spinner 30 times and record your results inthe tally chart below.
My PredictionI think the spinner will land more often on thecolour:__________________________________________
Colour Tally
RED
YELLOW
Complete the following questions:
1) What colour did the spinner land on the most?___________________________
2) Did you predict correctly?___________________________________________
3) Why did you predict that colour? _______________________________________________________________________________________________________
4) Is there an equal chance of landing on either colour?______________________
5) Put the probability of landing on the red section into a fraction.______________
6) Put the probability of landing on the yellow section into a fraction.___________Grade 3 DMactivity030 covers:D9: conduct simple probability experiments (eg. rolling a number cube, spinning a spinner) and predict the resultsD11:predict the probability that an event will occur© Math Wizards, 2003

Merlin’s Magical Jar of Insects
Data Management & ProbabilityActivity THIRTY-ONE
** Do an example magical jar probability experiment at the carpet.**
Using the words “POSSIBLE” or “IMPOSSIBLE,” describe the possibility ofpulling out each of the following insects from Merlin’s Magical Jar of Insects.
What is the probability of pulling out a butterfly? __________________________
What is the probability of pulling out a ladybug?___________________________
What is the probability of pulling out a spider? ____________________________Grade 3 DMactivity031 covers:D9:conduct simple probability experiments (eg. rolling a number cube, spinning a spinner) and predict the resultsD10: apply the concept of likelihood to events in solving simple problemsD12:use mathematical language (eg. possible, impossible) in discussion to describe probability© Math Wizards, 2003

Merlin’s Magical Jar of Flowers
Data Management & ProbabilityActivity THIRTY-TWO
** Do an example magical jar probability experiment at the carpet.**
Using the words “POSSIBLE” or “IMPOSSIBLE,” describe the possibility ofpulling out each of the following flowers from Merlin’s Magical Jar of flowers.
forget-me not lily pad lily tulip
What is the probability of pulling out a tulip? _____________________________
What is the probability of pulling out a lily pad?____________________________
What is the probability of pulling out a forget-me-not? ______________________Grade 3 DMactivity031 covers:D9:conduct simple probability experiments (eg. rolling a number cube, spinning a spinner) and predict the resultsD10: apply the concept of likelihood to events in solving simple problemsD12:use mathematical language (eg. possible, impossible) in discussion to describe probability© Math Wizards, 2003

Data Management & ProbabilityActivity THIRTY-THREE
** Pick any three different kinds of objects for this activity (example: erasers,pencils, markers) and have a ratio of 6:3:1 in the bag. **
Merlin is up to his usual bag of tricks. In fact, he has TEN tricks in his bag. As aclass, let’s pull out one object at a time to see what tricks Merlin has and then placeit back into the bag. Record what tricks we pulled out in the chart below:
1 2 3 4 5
From the data above, draw the TEN tricks you think Merlin has in his bag.
My Prediction of Tricks in Merlin’s Bag
1 2 3 4 5
6 7 8 9 10
What makes you think this?________________________________________________________________________________________________________________________________________________________________________________________________________________________________________________________________________
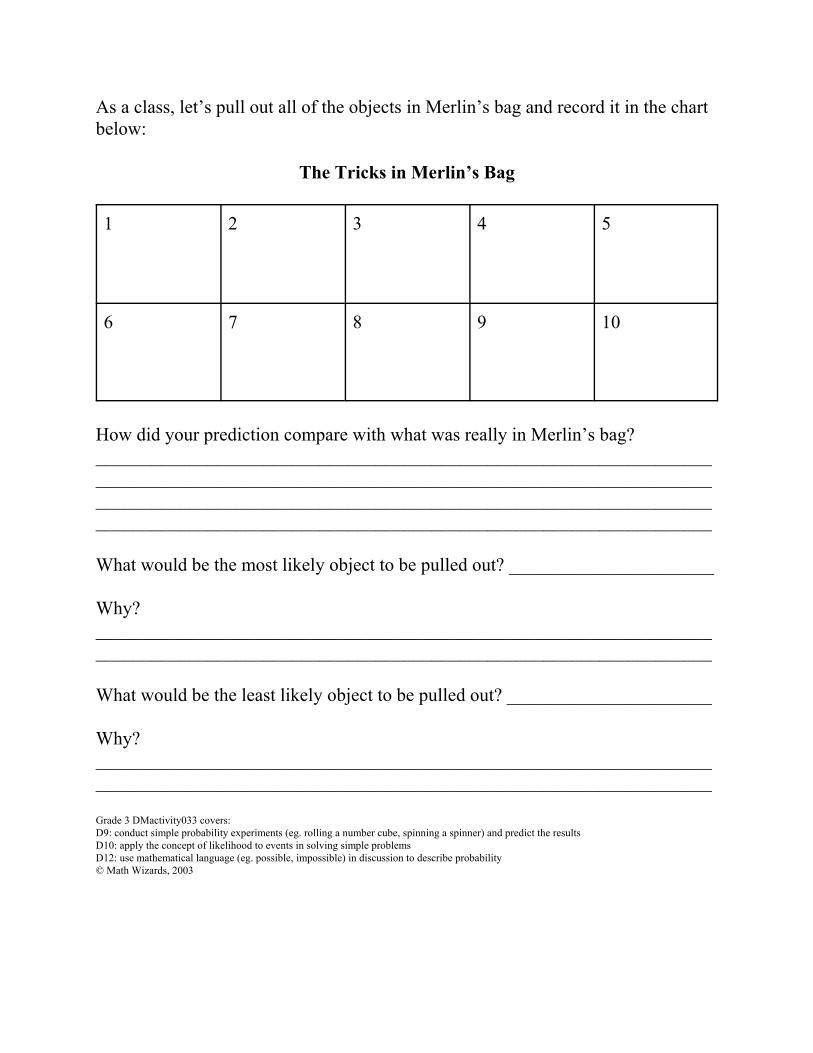
As a class, let’s pull out all of the objects in Merlin’s bag and record it in the chartbelow:
The Tricks in Merlin’s Bag
1 2 3 4 5
6 7 8 9 10
How did your prediction compare with what was really in Merlin’s bag?________________________________________________________________________________________________________________________________________________________________________________________________________________________________________________________________________
What would be the most likely object to be pulled out? ______________________
Why?____________________________________________________________________________________________________________________________________
What would be the least likely object to be pulled out? ______________________
Why?____________________________________________________________________________________________________________________________________
Grade 3 DMactivity033 covers:D9: conduct simple probability experiments (eg. rolling a number cube, spinning a spinner) and predict the resultsD10: apply the concept of likelihood to events in solving simple problemsD12: use mathematical language (eg. possible, impossible) in discussion to describe probability© Math Wizards, 2003

Data Management & ProbabilityActivity THIRTY-FOUR
** Pick any three different kinds of objects for this activity (example: erasers,pencils, markers) and have a ratio of 4:4:2 in the bag. **
Merlin is up to his usual bag of tricks. In fact, he has TEN tricks in his bag. As aclass, let’s pull out one object at a time to see what tricks Merlin has and then placeit back into the bag. Record what tricks we pulled out in the chart below:
1 2 3 4 5
From the data above, draw the TEN tricks you think Merlin has in his bag.
My Prediction of Tricks in Merlin’s Bag
1 2 3 4 5
6 7 8 9 10
What makes you think this?________________________________________________________________________________________________________________________________________________________________________________________________________________________________________________________________________
As a class, let’s pull out all of the objects in Merlin’s bag and record it in the chartbelow:
The Tricks in Merlin’s Bag
1 2 3 4 5
6 7 8 9 10
How did your prediction compare with what was really in Merlin’s bag?________________________________________________________________________________________________________________________________________________________________________________________________________________________________________________________________________
What would be the most likely object to be pulled out? ______________________
Why?____________________________________________________________________________________________________________________________________
What would be the least likely object to be pulled out? ______________________
Why?____________________________________________________________________________________________________________________________________
Merlin has a Problem!
Gweneth has a dish of red and green jelly beans. Suppose Merlin closes his eyesand takes three jelly beans. How many different combinations of jelly beancolours (in any order) could he take?Explain your answer:
Grade 3 DMactivity034 covers:D9: conduct simple probability experiments (eg. rolling a number cube, spinning a spinner) and predict the resultsD10: apply the concept of likelihood to events in solving simple problemsD12: use mathematical language (eg. possible, impossible) in discussion to describe probability© Math Wizards, 2003