Embed Size (px)
Citation preview
Mathematical Literacy (NCS)/Grade 12/P2 72 Exemplar
Grade 12 Mathematical Literacy: Question Paper 2
MARKS: 150 TIME: 3 hours
QUESTION 1
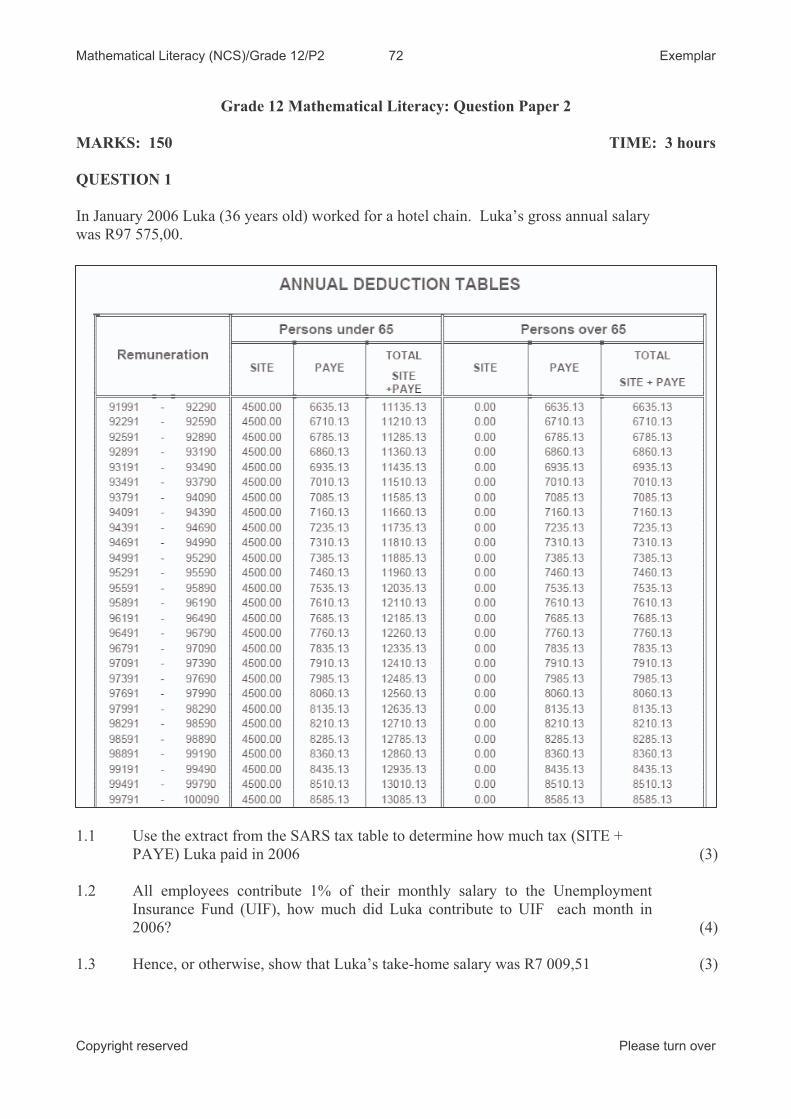
In January 2006 Luka (36 years old) worked for a hotel chain. Luka’s gross annual salary
was R97 575,00.
1.1 Use the extract from the SARS tax table to determine how much tax (SITE +
PAYE) Luka paid in 2006 (3)
1.2 All employees contribute 1% of their monthly salary to the Unemployment
Insurance Fund (UIF), how much did Luka contribute to UIF each month in
2006? (4)
1.3 Hence, or otherwise, show that Luka’s take-home salary was R7 009,51 (3)
Copyright reserved Please turn over
Mathematical Literacy (NCS)/Grade 12/P2 73 Exemplar
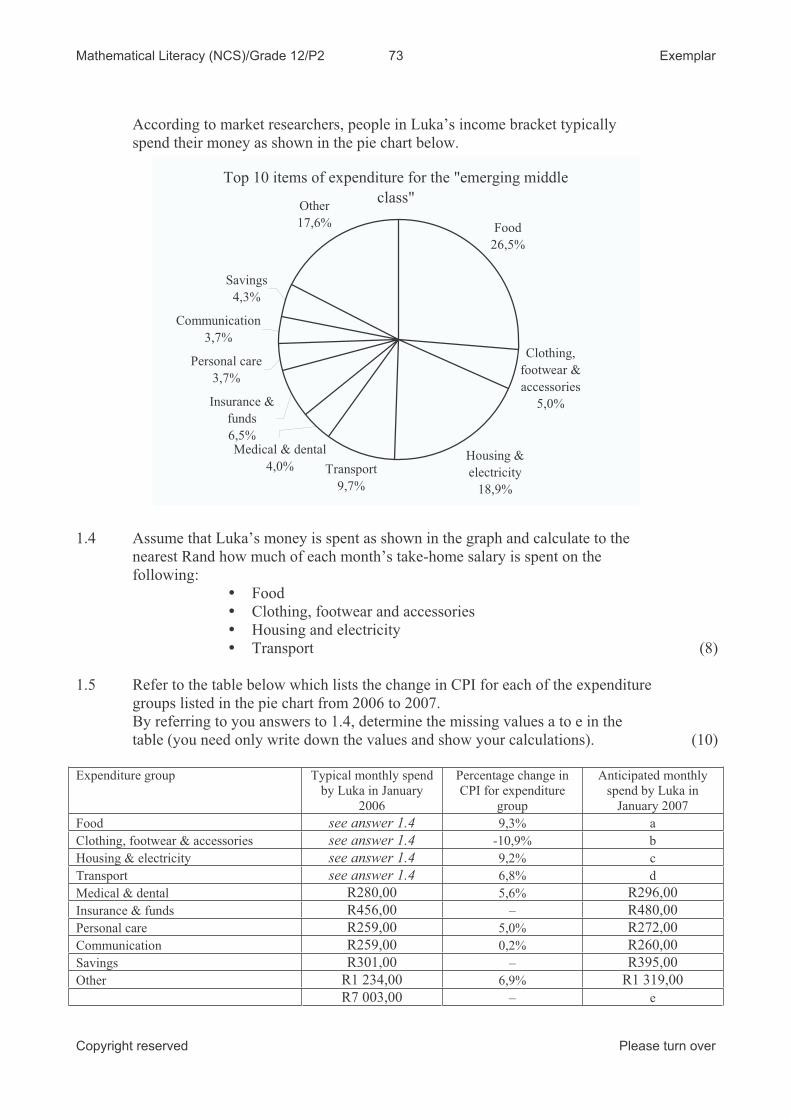
According to market researchers, people in Luka’s income bracket typically
spend their money as shown in the pie chart below.
Top 10 items of expenditure for the "emerging middle
class"
Food
26,5%
Clothing,
footwear &
accessories
5,0%
Housing &
electricity
18,9%
Insurance &
funds
6,5%
Personal care
3,7%
Communication
3,7%
Savings
4,3%
Other
17,6%
Medical & dental
4,0% Transport
9,7%
1.4 Assume that Luka’s money is spent as shown in the graph and calculate to the
nearest Rand how much of each month’s take-home salary is spent on the
following:
Food
Clothing, footwear and accessories
Housing and electricity
Transport (8)
1.5 Refer to the table below which lists the change in CPI for each of the expenditure
groups listed in the pie chart from 2006 to 2007.
By referring to you answers to 1.4, determine the missing values a to e in the
table (you need only write down the values and show your calculations). (10)
Expenditure group Typical monthly spend
by Luka in January
2006
Percentage change in
CPI for expenditure
group
Anticipated monthly
spend by Luka in
January 2007
see answer 1.4 Food 9,3% a
see answer 1.4 Clothing, footwear & accessories -10,9% b
see answer 1.4 Housing & electricity 9,2% c
see answer 1.4 Transport 6,8% d
R280,00 R296,00 Medical & dental 5,6%
R456,00 R480,00 Insurance & funds –
R259,00 R272,00 Personal care 5,0%
R259,00 R260,00 Communication 0,2%
R301,00 R395,00 Savings –
R1 234,00 R1 319,00 Other 6,9%
R7 003,00 – e
Copyright reserved Please turn over
Mathematical Literacy (NCS)/Grade 12/P2 74 Exemplar
1.6 Calculate the percentage change in total expenses for Luka from 2006 to 2007. (4)
1.7 Luka’s employer offers Luka an “inflation-linked” salary increase of 5% for
2007.W hat would Luka’s gross salary be after this increase? (3)
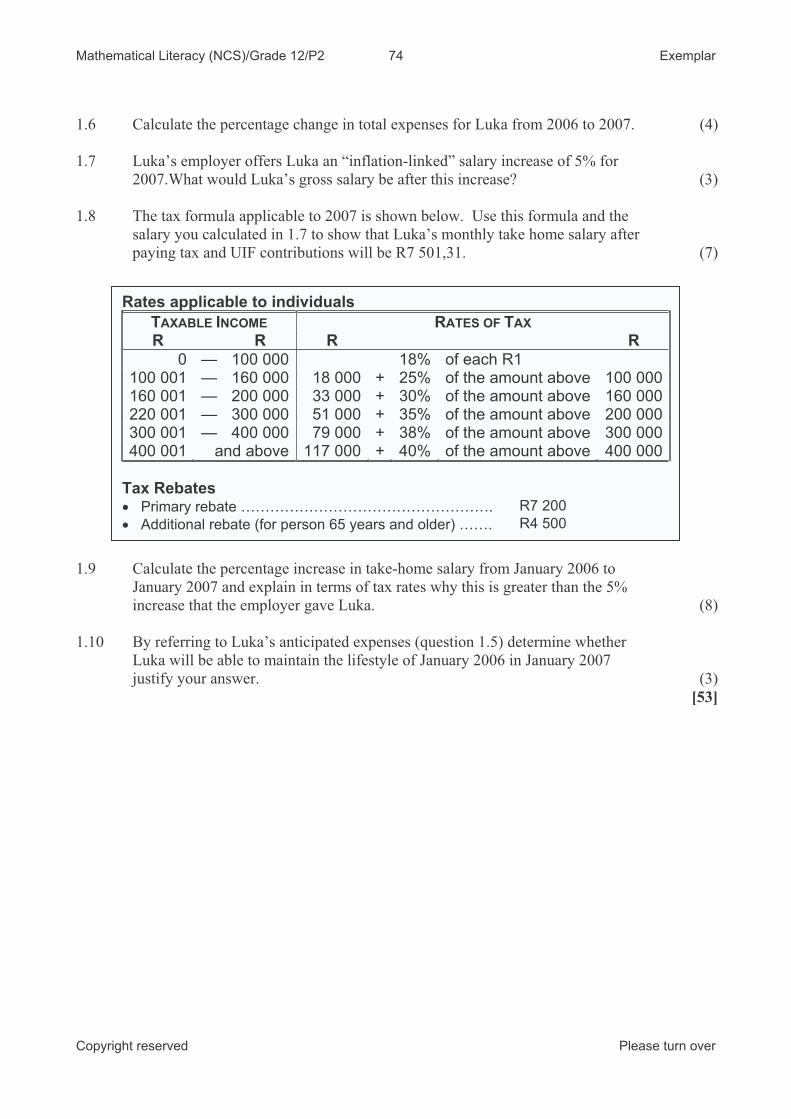
1.8 The tax formula applicable to 2007 is shown below. Use this formula and the
salary you calculated in 1.7 to show that Luka’s monthly take home salary after
paying tax and UIF contributions will be R7 501,31. (7)
Rates applicable to individuals
TAXABLE INCOME RATES OF TAX
R R R R
0 — 100 000 18% of each R1 100 001 — 160 000 18 000 + 25% of the amount above 100 000160 001 — 200 000 33 000 + 30% of the amount above 160 000220 001 — 300 000 51 000 + 35% of the amount above 200 000300 001 — 400 000 79 000 + 38% of the amount above 300 000400 001 and above 117 000 + 40% of the amount above 400 000
Tax Rebates R7 200 Primary rebate … … … … … … … … … … … … … … … … … . R4 500 Additional rebate (for person 65 years and older) … … .
1.9 Calculate the percentage increase in take-home salary from January 2006 to
January 2007 and explain in terms of tax rates why this is greater than the 5%
increase that the employer gave Luka. (8)
1.10 By referring to Luka’s anticipated expenses (question 1.5) determine whether
Luka will be able to maintain the lifestyle of January 2006 in January 2007
justify your answer. (3)
[53]
Copyright reserved Please turn over
Mathematical Literacy (NCS)/Grade 12/P2 75 Exemplar
QUESTION 2
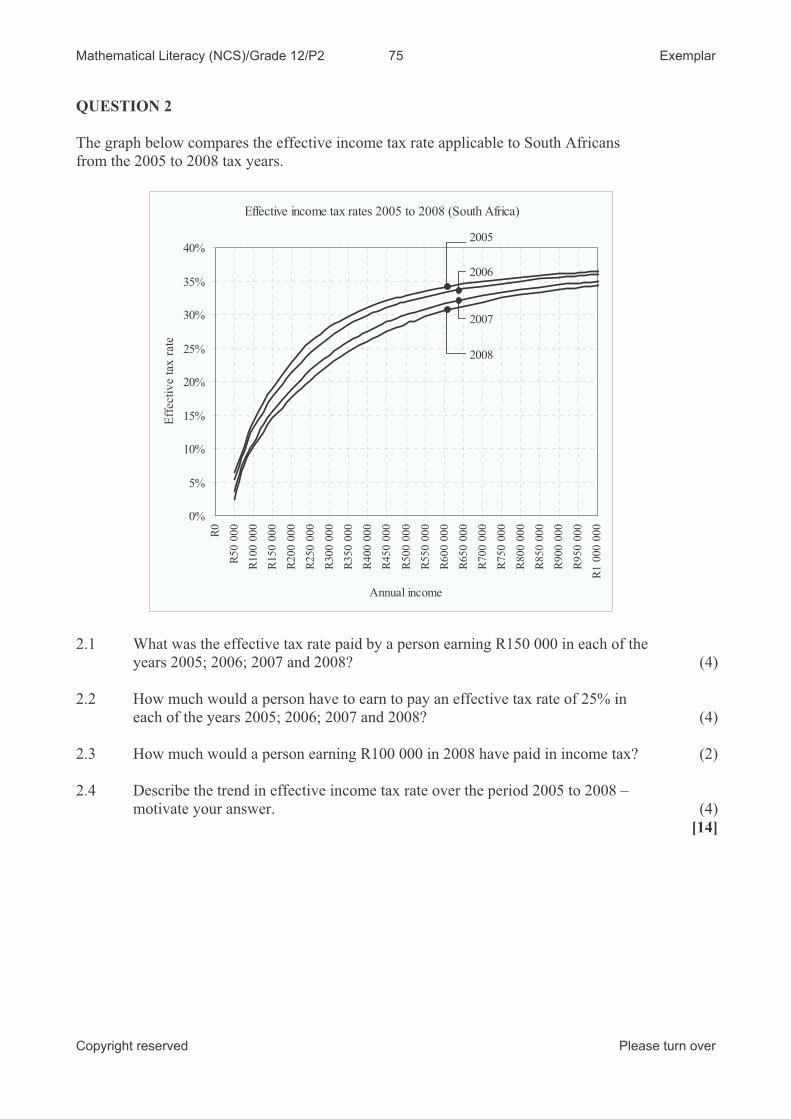
The graph below compares the effective income tax rate applicable to South Africans
from the 2005 to 2008 tax years.
Effective income tax rates 2005 to 2008 (South Africa)
0%
5%
10%
15%
20%
25%
30%
35%
40%
R0
R5
0 0
00
R10
0 0
00
R15
0 0
00
R20
0 0
00
R25
0 0
00
R30
0 0
00
R35
0 0
00
R40
0 0
00
R45
0 0
00
R50
0 0
00
R55
0 0
00
R60
0 0
00
R65
0 0
00
R70
0 0
00
R75
0 0
00
R80
0 0
00
R85
0 0
00
R90
0 0
00
R95
0 0
00
R1
00
0 0
00
Annual income
Eff
ecti
ve t
ax
rate
2005
2006
2007
2008
2.1 What was the effective tax rate paid by a person earning R150 000 in each of the
years 2005; 2006; 2007 and 2008? (4)
2.2 How much would a person have to earn to pay an effective tax rate of 25% in
each of the years 2005; 2006; 2007 and 2008? (4)
2.3 How much would a person earning R100 000 in 2008 have paid in income tax? (2)
2.4 Describe the trend in effective income tax rate over the period 2005 to 2008 –
motivate your answer. (4)
[14]
Copyright reserved Please turn over
Mathematical Literacy (NCS)/Grade 12/P2 76 Exemplar
QUESTION 3
3.1 Describe in your own words what is meant by the following: “the student taking
the test scored at the 75th percentile” (2)
3.2 Test results for a particular test are
summarised alongside. In which
quartile would a person with a total of
88 fall?
Test Scores Frequency
66 - 70 4
71 - 75 3
76 - 80 2
81 - 85 6
86 - 90 3
91 - 95 2(2)
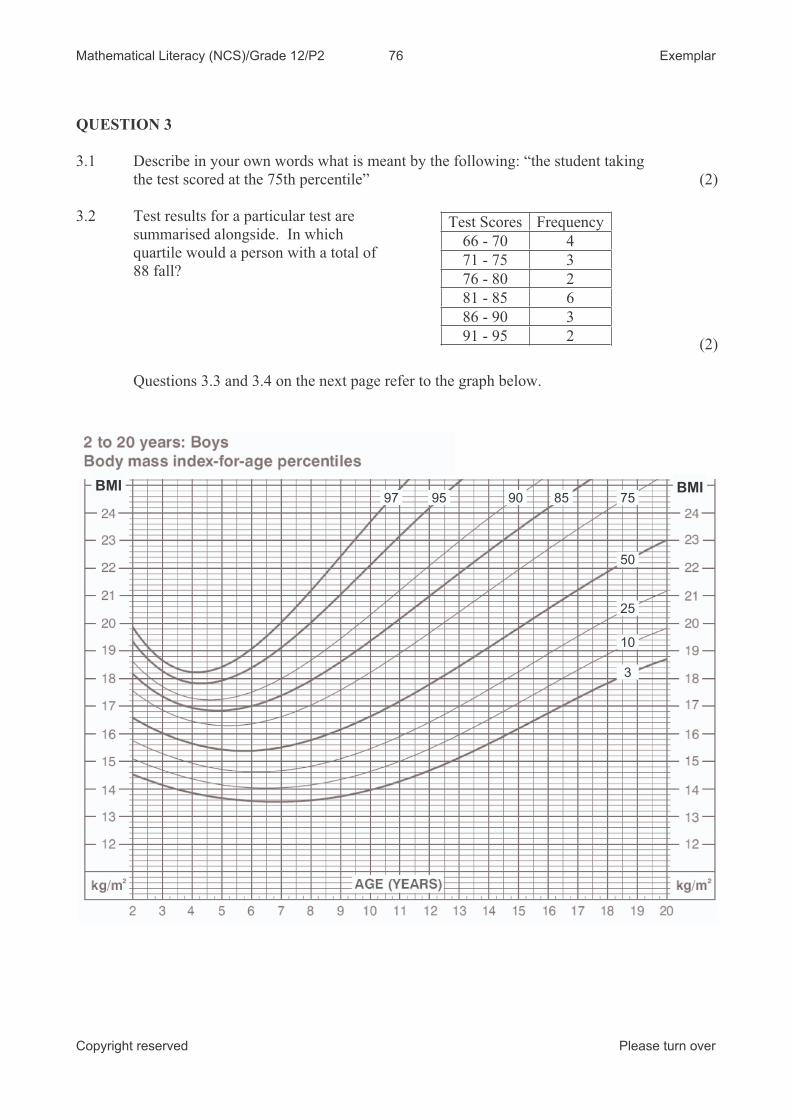
Questions 3.3 and 3.4 on the next page refer to the graph below.
BMI BMI85909597 75
50
25
10
3
Copyright reserved Please turn over
Mathematical Literacy (NCS)/Grade 12/P2 77 Exemplar
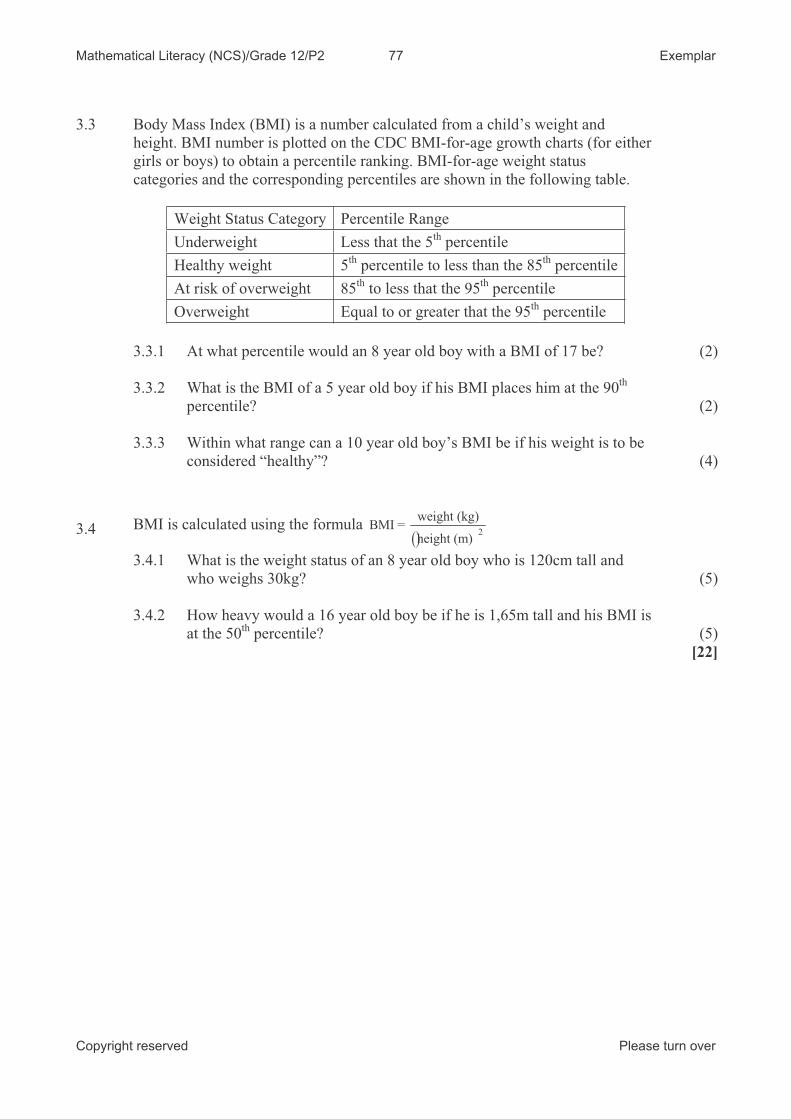
3.3 Body Mass Index (BMI) is a number calculated from a child’s weight and
height. BMI number is plotted on the CDC BMI-for-age growth charts (for either
girls or boys) to obtain a percentile ranking. BMI-for-age weight status
categories and the corresponding percentiles are shown in the following table.
Weight Status Category Percentile Range th
Underweight Less that the 5 percentile
Healthy weight 5th
percentile to less than the 85th
percentile th
At risk of overweight 85 to less that the 95th
percentile th
Overweight Equal to or greater that the 95 percentile
3.3.1 At what percentile would an 8 year old boy with a BMI of 17 be? (2)
3.3.2 What is the BMI of a 5 year old boy if his BMI places him at the 90th
percentile? (2)
3.3.3 Within what range can a 10 year old boy’s BMI be if his weight is to be
considered “healthy”? (4)
2
weight (kg)BMI =
height (m)BMI is calculated using the formula 3.4
3.4.1 What is the weight status of an 8 year old boy who is 120cm tall and
who weighs 30kg? (5)
3.4.2 How heavy would a 16 year old boy be if he is 1,65m tall and his BMI is
at the 50th
percentile? (5)
[22]
Copyright reserved Please turn over
Mathematical Literacy (NCS)/Grade 12/P2 78 Exemplar
QUESTION 4
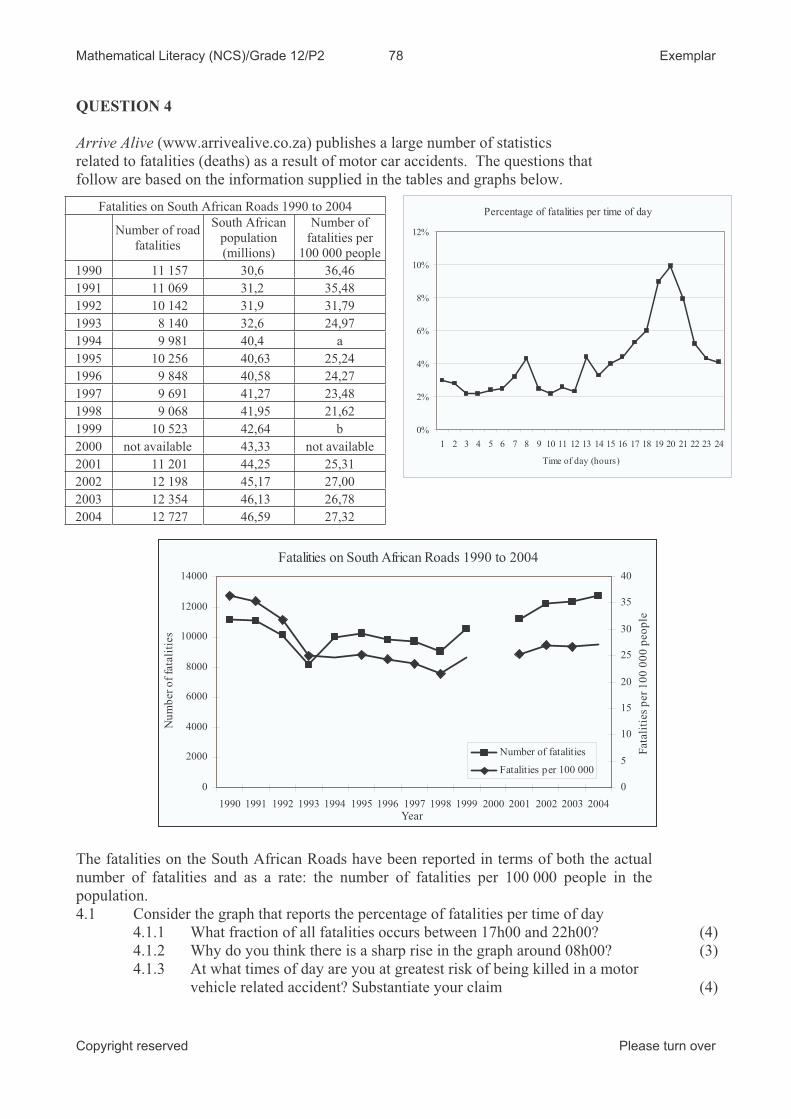
Arrive Alive (www.arrivealive.co.za) publishes a large number of statistics
related to fatalities (deaths) as a result of motor car accidents. The questions that
follow are based on the information supplied in the tables and graphs below.
The fatalities on the South African Roads have been reported in terms of both the actual
number of fatalities and as a rate: the number of fatalities per 100 000 people in the
population.
4.1 Consider the graph that reports the percentage of fatalities per time of day
4.1.1 What fraction of all fatalities occurs between 17h00 and 22h00? (4)
4.1.2 Why do you think there is a sharp rise in the graph around 08h00? (3)
4.1.3 At what times of day are you at greatest risk of being killed in a motor
vehicle related accident? Substantiate your claim (4)
Fatalities on South African Roads 1990 to 2004
0
2000
4000
6000
8000
10000
12000
14000
1990 1991 1992 1993 1994 1995 1996 1997 1998 1999 2000 2001 2002 2003 2004
Year
Nu
mb
er
of
fata
liti
es
0
5
10
15
20
25
30
35
40
Fata
liti
es
per
10
0 0
00
peo
ple
Number of fatalities
Fatalities per 100 000
Percentage of fatalities per time of day
0%
2%
4%
6%
8%
10%
12%
1 2 3 4 5 6 7 8 9 10 11 12 13 14 15 16 17 18 19 20 21 22 23 24
Time of day (hours)
Fatalities on South African Roads 1990 to 2004
umber of road
fatalities
South African
population
(millions)
Number of
fatalities per
100 000 people
N
1990 11 157 30,6 36,46
1991 11 069 31,2 35,48
1992 10 142 31,9 31,79
1993 8 140 32,6 24,97
1994 9 981 40,4 a
1995 10 256 40,63 25,24
1996 9 848 40,58 24,27
1997 9 691 41,27 23,48
1998 9 068 41,95 21,62
1999 10 523 42,64 b
2000 not available 43,33 not available
2001 11 201 44,25 25,31
2002 12 198 45,17 27,00
2003 12 354 46,13 26,78
2004 12 727 46,59 27,32
Copyright reserved Please turn over
Mathematical Literacy (NCS)/Grade 12/P2 79 Exemplar
Copyright reserved Please turn over
4.2 Refer to the table and graph that report on the fatalities from 1990 to 2004
4.2.1 Why is there a gap in each of the broken line graphs? (2)
4.2.2 Calculate the missing values a and b on the table. (8)
4.3 Calculate the change in the number of fatalities from:
4.3.1 1994 to 1999
4.3.2 1999 to 2004 (4)
4.4 Calculate the change in the number of fatalities per 100 000 people from
4.3.1 1994 to 1999
4.3.2 1999 to 2004 (4)
4.5 Consider the graphs of the two statistics and discuss which graph might be used
by the Minister of Transport to support an argument that claims progress in
managing road accident fatalities and which graph might be used by somebody
trying to contradict the Minister. Provide a detailed motivation for your answer. (6)
4.6 Which statistic (actual number of fatalities or number of fatalities per 100 000)
best represents the risk (likelihood) of dying in a motor vehicle related accident.
Motivate your answer. (4)
Shosholoza Meyl to K om atip oort (R 7 0 ,0 0 ) & Min ib u s T ax i to Map u to (R 1 0 ,0 0 )
G reyhou n d b u s (R 2 2 0 ,0 0 )
Sou th A fric an A irw ays (R 1 4 5 0 ,0 0 )
Mozam b iq u e A irlin es (R 1 4 8 5 ,0 0 )
1 2 :0 0 1 8 :0 0 0 0 :0 0 0 6 :0 0 1 2 :0 0F rid ay Satu rd ay
1 8 :1 0 0 6 :4 0
1 hr
2 2 :0 0 0 8 :3 0
1 3 :5 0– 1 4 :5 5
0 9 :3 5– 1 0 :4 0
1 9 :1 0– 2 0 :1 0
0 7 :0 0– 0 8 :0 0
[37]
QUESTION 5
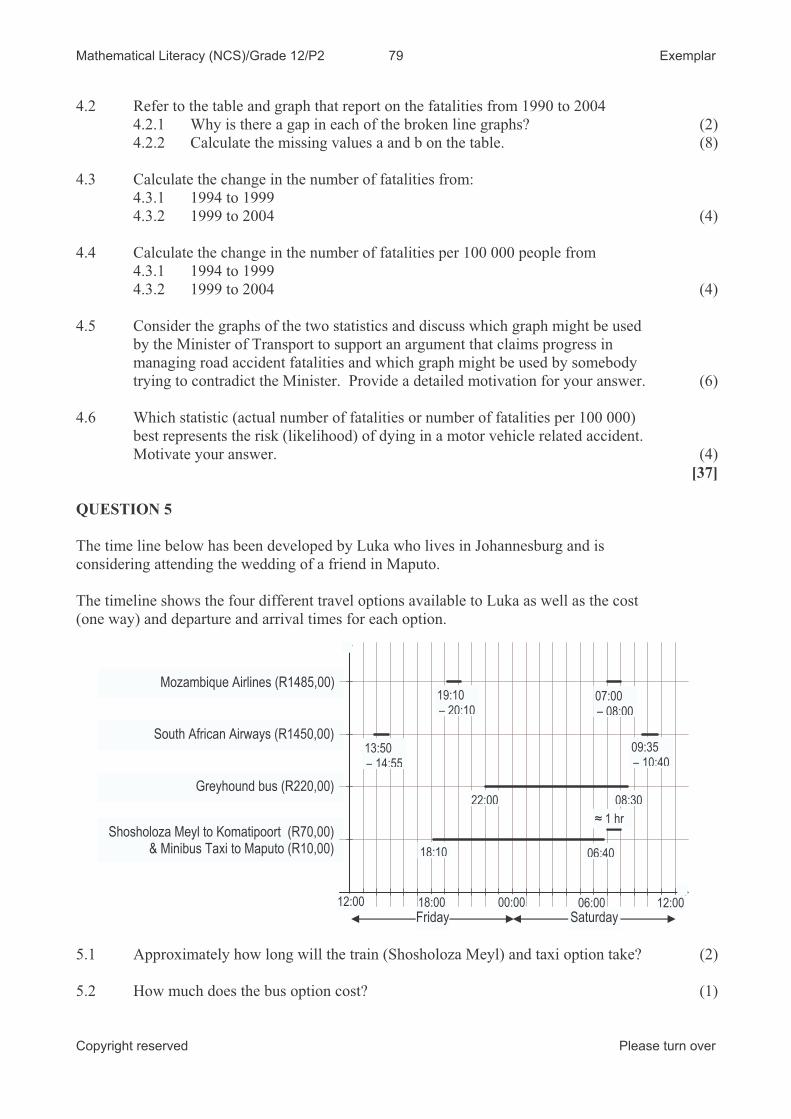
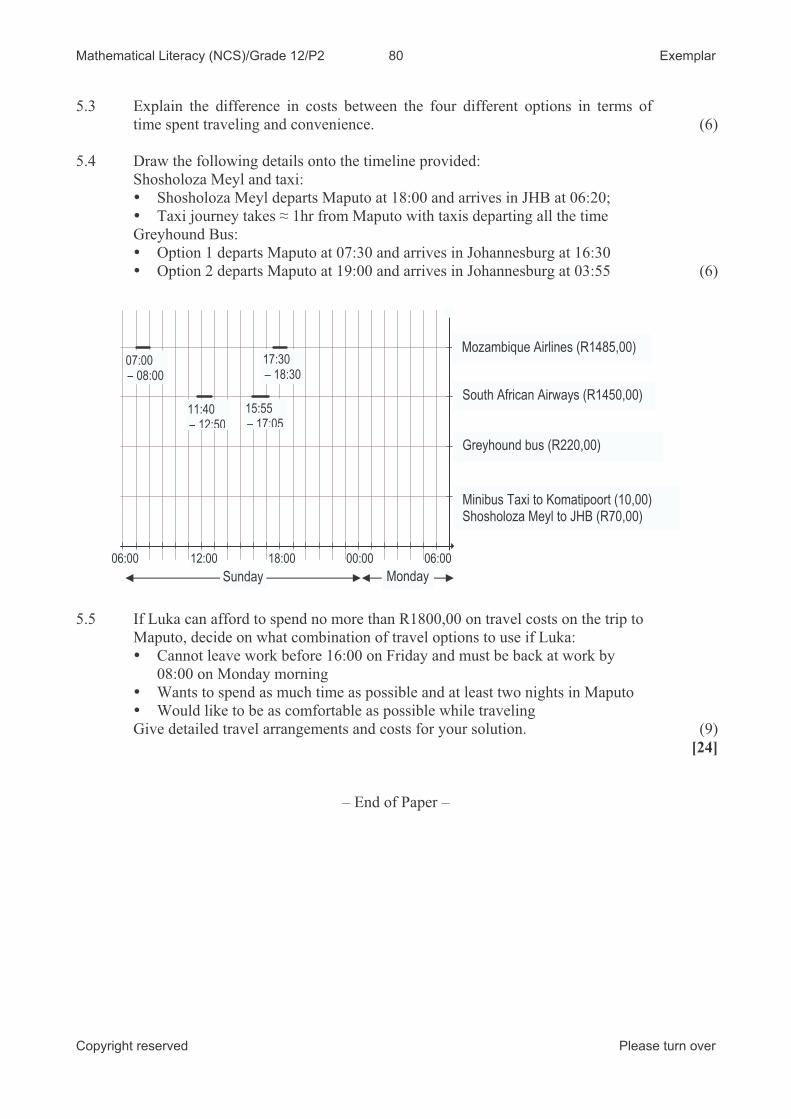
The time line below has been developed by Luka who lives in Johannesburg and is
considering attending the wedding of a friend in Maputo.
The timeline shows the four different travel options available to Luka as well as the cost
(one way) and departure and arrival times for each option.
5.1 Approximately how long will the train (Shosholoza Meyl) and taxi option take? (2)
5.2 How much does the bus option cost? (1)
Mathematical Literacy (NCS)/Grade 12/P2 80 Exemplar
Copyright reserved Please turn over
5.3 Explain the difference in costs between the four different options in terms of
time spent traveling and convenience. (6)
5.4 Draw the following details onto the timeline provided:
Shosholoza Meyl and taxi:
Shosholoza Meyl departs Maputo at 18:00 and arrives in JHB at 06:20;
Taxi journey takes 1hr from Maputo with taxis departing all the time
Greyhound Bus:
Option 1 departs Maputo at 07:30 and arrives in Johannesburg at 16:30
Option 2 departs Maputo at 19:00 and arrives in Johannesburg at 03:55 (6)
06:00 12:00 18:00 00:00 06:00
Sunday Monday
11:40– 12:50
15:55– 17:05
07:00– 08:00
17:30– 18:30
Minibus Taxi to Komatipoort (10,00) Shosholoza Meyl to J H B (R70,00)
Greyhound bus (R220,00)
South African Airways (R1450,00)
Mozambique Airlines (R1485,00)
5.5 If Luka can afford to spend no more than R1800,00 on travel costs on the trip to
Maputo, decide on what combination of travel options to use if Luka:
Cannot leave work before 16:00 on Friday and must be back at work by
08:00 on Monday morning
Wants to spend as much time as possible and at least two nights in Maputo
Would like to be as comfortable as possible while traveling
Give detailed travel arrangements and costs for your solution. (9)
[24]
– End of Paper –