Embed Size (px)
Citation preview

Dr. Frank Mueller Nishanth Balasubramanian
North Carolina State University
GPU Acceleration of CFD Codes and
Optimizing for GPU Memory Hierarchies

2
Infrastructure: ARC cluster at NCSU
l Hardware — 2x AMD Opteron 6128 (8 cores each),
120 nodes = ~2000 CPU cores — NVIDIA GTX480, GTX680 , C2050, K20c, K40c: 108 GPUs — Mellanox QDR InfiniBand: 40Gbit/s
l Software — CUDA 5.5 — PGI Compilers V13.9 w/ CUDA Fortran & OpenACC support — OpenMPI & MVAPICH2-1.9 w/ GPUDirect V2 capability — Torque/Maui job management system

3
Topic 1: GPU Acceleration for CFD
l CFD targeted: RDGFLO l an MPI-based parallel discontinuous Galerkin finite element solver l GPU technology: OpenACC l Identify compute intensive regions in code
— Run them on GPU l Aided in porting code to
— At first: single GPU, no MPI

4
Initial attempt
l Compute intensive regions considered of mainly 2 loops — where > 50% of run time was spent
l First approach: Naïve parallelization — add OpenACC directives around loops — with data copy in/out statements
l opened up set of new problems…

5
Challenges / Solutions
l Compiler Auto Optimizations: — Compiler matched variables inside/outside kernel
– automatically upgraded them to live out variables Ø made code run serially
– since last value of variables needs to be computed — Solution: variable renaming inside kernel
– ensures that variables not matched by compiler l Subroutines:
— Subroutine calls not supported in OpenACC — Manual inlining of essential parts per subroutine

6
Race condition
l Data dependence check disabled — compiler too conservative to get good speedups
l Naïve parallelization produced incorrect output data l Race condition:
— Single array location w/ >1 writes from different threads — Solution: Update data in batches
– indices to be updated were reordered to create batches – Each batch modifies only unique elements in its batch
l Overheads: extra data structures — to reorder and maintain batch information

7
Other Subroutines + Results
l Problem: data copy — Frequent copies CPU ßà GPU: lots of time spent here
l Objective: ensure only 1 copy in + 1 copy out of GPU l Effect: had to move essential parts
of other subroutines à GPU — Majority: computation
(w/o memory contention) — Minority: memory contention
à batching strategy used again
8
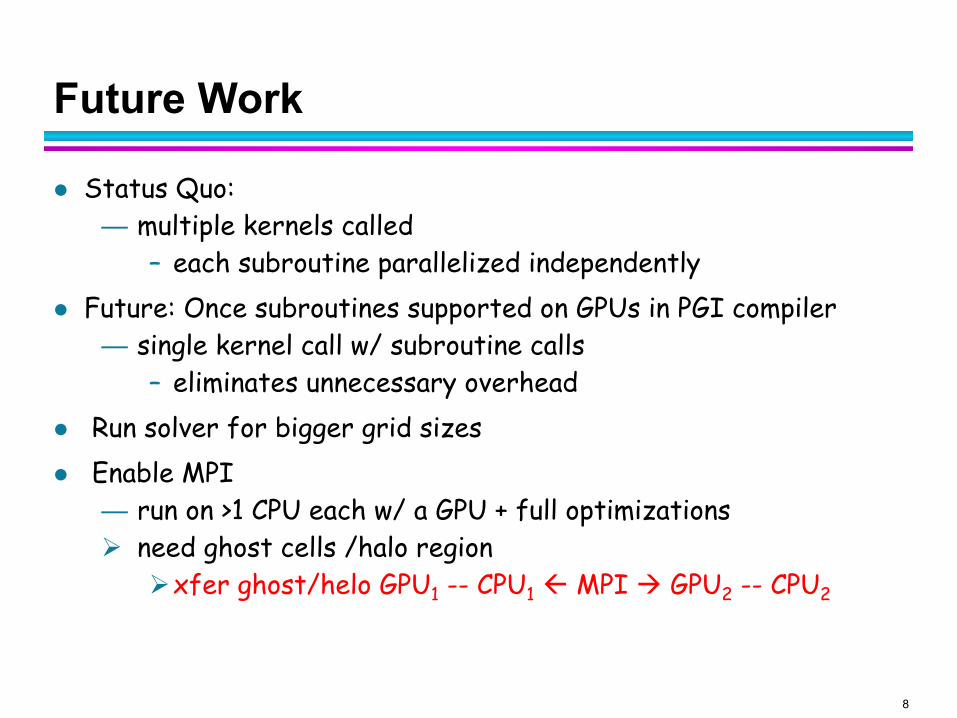
Future Work
l Status Quo: — multiple kernels called
– each subroutine parallelized independently l Future: Once subroutines supported on GPUs in PGI compiler
— single kernel call w/ subroutine calls – eliminates unnecessary overhead
l Run solver for bigger grid sizes l Enable MPI
— run on >1 CPU each w/ a GPU + full optimizations Ø need ghost cells /halo region
Ø xfer ghost/helo GPU1 -- CPU1 ß MPI à GPU2 -- CPU2

9
Topic 2: Caches in GPUs [ISPASS’14]
l Architectures feature reconfigurable memory hierarchies — Support hybrid scratch pad + cache
l NVIDIA: scratch pad “shared” (shmem)/L1 cache per SM l Intel MIC (KNL): scratch pad “near memory”/L1 cache
l Which one should be use? — Cache: à always best?
– Transparent, no pgm change — Scratch pad:
– explicit addressing – more control
10
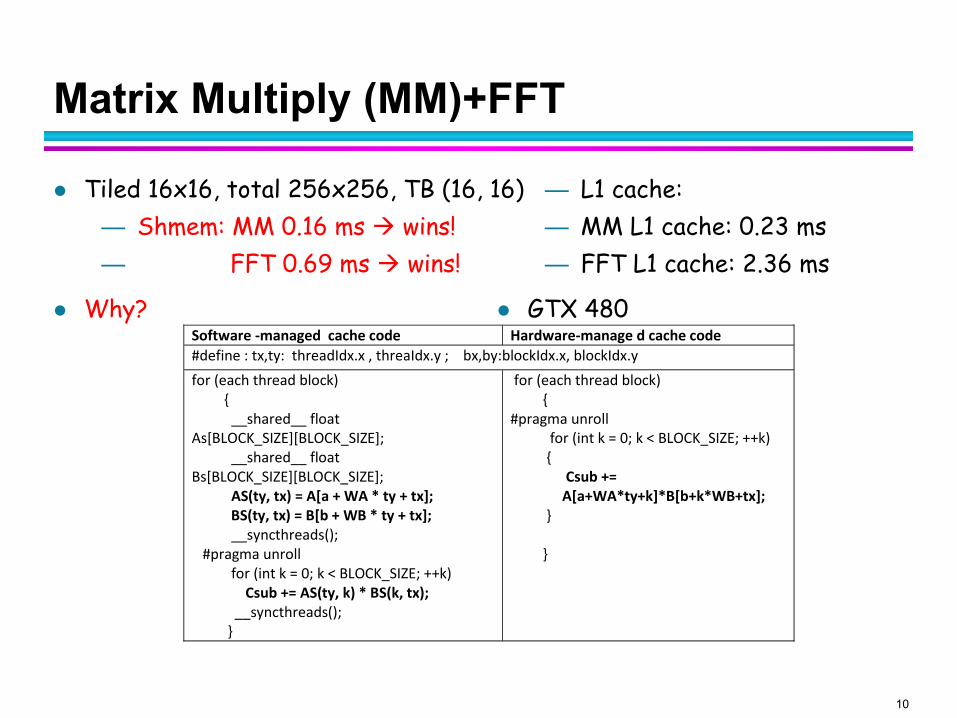
Matrix Multiply (MM)+FFT
l Tiled 16x16, total 256x256, TB (16, 16) — Shmem: MM 0.16 ms à wins! — FFT 0.69 ms à wins!
l Why?
— L1 cache: — MM L1 cache: 0.23 ms — FFT L1 cache: 2.36 ms
l GTX 480 Software -‐managed cache code Hardware-‐manage d cache code #define : tx,ty: threadIdx.x , threaIdx.y ; bx,by:blockIdx.x, blockIdx.y for (each thread block) { __shared__ float As[BLOCK_SIZE][BLOCK_SIZE]; __shared__ float Bs[BLOCK_SIZE][BLOCK_SIZE]; AS(ty, tx) = A[a + WA * ty + tx]; BS(ty, tx) = B[b + WB * ty + tx]; __syncthreads(); #pragma unroll for (int k = 0; k < BLOCK_SIZE; ++k) Csub += AS(ty, k) * BS(k, tx); __syncthreads(); }
for (each thread block) { #pragma unroll for (int k = 0; k < BLOCK_SIZE; ++k) {
Csub += A[a+WA*ty+k]*B[b+k*WB+tx];
} }

11
Matrix Multiply+FFT: GPGPUSim Analysis
l Shmem: 0.16 ms à wins – why? — 5 thread blocks (TBs) à regs limit — Latency: 44us, +12% instr. (copies) — 1 mem block access / warp
– Same bank+row (32 banks) – Due to user-based mapping
l Matmult: shmem good for — High memory-level parallelism:
Accesses from threads overlapped — Classical cache misses
à do not matter much – Confirmed w/ fully assoc L1
— Memory coalescing almost for free!
l L1 cache version — 5 TBs, no conflict misses (sim.) — Latency 80us (TLP hides this) — 2 cache block accesses / warp
– Block size 128B – Due to phys. addr. map à L1
l FFT: L1 write misses high — Allocate-on write L1 policy bad!
– Verified in simulation — Associativity/capacity don’t
matter here

12
Marching Codes (MC) + Path Finder (PF)
l Shmem: — MC 0.139 ms — PF 0.108 ms
l MC: Max. 5 active thread blocks / SM à only 5 warps active
l PF: need syncthread() for shmem
l L1 cache: — MC 0.115 ms à wins! Why? — PF 0.096 ms à wins! Why?
l Max. 8 active thread blocks / SM à no artificial shmem limit
l PF: fewer address calculations Software_managed cache hardware_managed cache MC extracts a geometric isosurface from a volume dataset. <Generatetriangles> kernel is a key step; it looks up the fields values and generates the triangle voxel data. Each TB 32 threads: NTHREADS, each grid 1024 TB: NBLOCKS, generate 32768 voxels Cacl_vertex_pos(); Lookup_filed(); _shared float vertlist[12*NTHREADS]; _shared float normlist[12*NTHREADS]; //each tb in shared memory //i: 0~11 Compute_vertlist ( [tidx+i*NTHREADS] ); Compute_normlist( [tidx+i*NTHREADS] ); //each tb Write_global();
Cacl_vertex_pos(); Lookup_filed(); float vertlist[12]; float normlist[12]; //each thread in local memory //i: 0~11 Compute_vertlist ( [i] ); Compute_normlist( [i] ); //each thread Write_global();

13
Marching Codes + PathFinder
l Thread-level parallelism (TLP) study l Control # thread blocks (TBs)
— Via fake shmem array (limits TBs)
l 4 benchmarks: best performance NOT at max. # TBs! — Problem: L1 capacity vs. TB pressure for L1 space
0
1
2
3
4
5
6
7
8
FFT MC CV HG
Execu&
on Tim
e (n
ormalize to sh
ared
mem
ory code
)
8 TBs
7TBs
6 TBs
5TBs
4 TBs
3TBs
2 TBs

14
GTX 480
l shmem wins, except for PF, MC l On average (geom. Mean): 55.7% performance win

15
GTX 680
l shmem wins, except for PF, MC l more ALUs, less latency compared to GTX480 à higher wins!

16
Scratch Pad vs. Cache Conclusion
l In-depth study — reveals interesting, unexpected tradeoffs
l TLP can significantly hide performance impact of L1 cache misses l more subtle factors for performance & energy:
— Key reasons for differences: l shmem: +MLP and coalescing l D-cache: +Improved TLP and store data into registers
l Most benchmarks favor shmem àJustifies software complexity to manage them

17
Topic 3: Memory Tracing, Cache Analysis
l ScalaMemTrace: — Tool built at NCSU — uses PIN to instrument
loads/stores of a program — creates compressed memory traces
as RSDs/PRSDs
l Reuse Distance := # of distinct accesses b/w 2 memory accesses
l used to predict hit/misses in a cache given its configuration
ScalaMemTrace
SPM
D
App
18
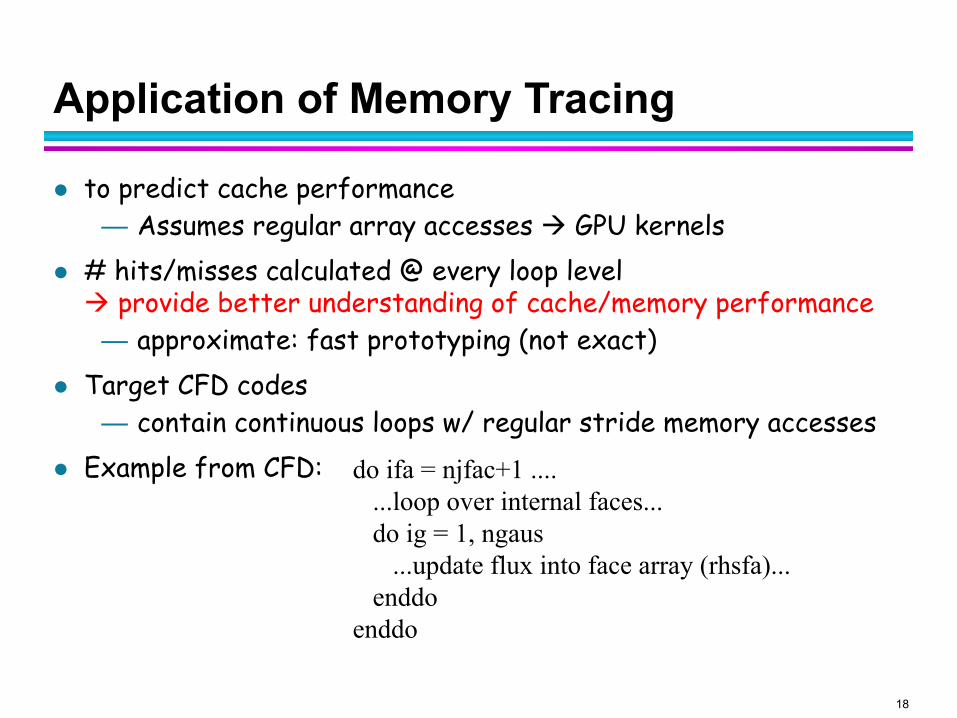
Application of Memory Tracing
l to predict cache performance — Assumes regular array accesses à GPU kernels
l # hits/misses calculated @ every loop level à provide better understanding of cache/memory performance
— approximate: fast prototyping (not exact) l Target CFD codes
— contain continuous loops w/ regular stride memory accesses l Example from CFD: do ifa = njfac+1 ....
...loop over internal faces... do ig = 1, ngaus ...update flux into face array (rhsfa)... enddo enddo

19
Overview of Memory Tracer
Predict cache hits/misses based on cache config
Trace Compressor to generate RSDs
Memory Instrumentation tool (PIN)
Application

20
Memory Trace Represented as a Tree
Main
PRSD1
PRSD2
RSD1 RSD2
PRSD3
RSD4 RSD5
PRSD4
RSD6 RSD7
Indicates loop
Nested loop
21
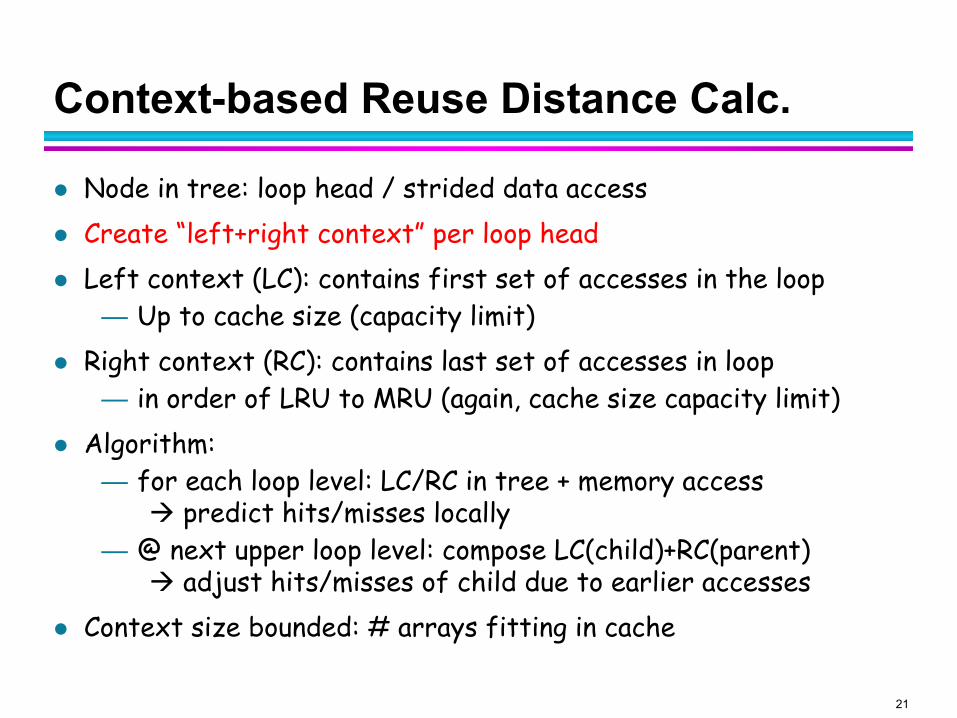
Context-based Reuse Distance Calc.
l Node in tree: loop head / strided data access l Create “left+right context” per loop head l Left context (LC): contains first set of accesses in the loop
— Up to cache size (capacity limit) l Right context (RC): contains last set of accesses in loop
— in order of LRU to MRU (again, cache size capacity limit) l Algorithm:
— for each loop level: LC/RC in tree + memory access à predict hits/misses locally
— @ next upper loop level: compose LC(child)+RC(parent) à adjust hits/misses of child due to earlier accesses
l Context size bounded: # arrays fitting in cache

22
Assumptions
l For following example: — Fixed context size — All arrays of size N — Size per element is fixed to 4 bytes (sizeof(int)).
l In general: — All cold misses counted as capacity misses — No partial replacement of arrays in cache

23
Example
l Left context (LC): contains first set of accesses in the loop — Up to cache size (capacity limit)
l Right context (RC): contains last set of accesses in loop — in order of LRU to MRU (again, cache size capacity limit)
24
Example
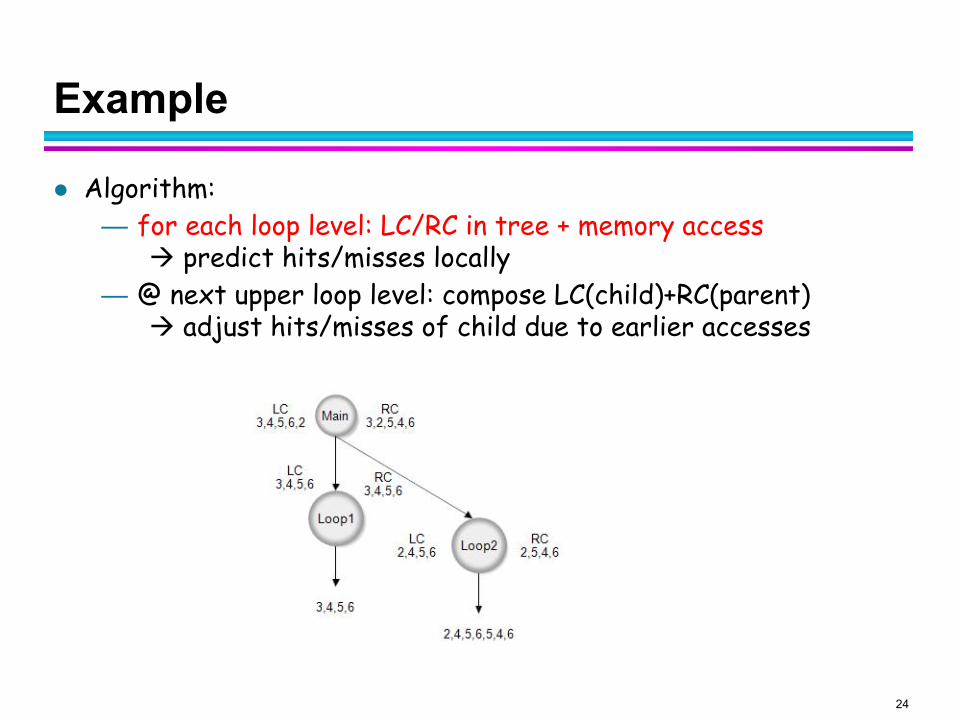
l Algorithm: — for each loop level: LC/RC in tree + memory access
à predict hits/misses locally — @ next upper loop level: compose LC(child)+RC(parent)
à adjust hits/misses of child due to earlier accesses

25
Example
l Algorithm: — for each loop level: LC/RC in tree + memory access
à predict hits/misses locally — @ next upper loop level: compose LC(child)+RC(parent)
à adjust hits/misses of child due to earlier accesses

26
Example
l Algorithm: — for each loop level: LC/RC in tree + memory access
à predict hits/misses locally — @ next upper loop level: compose LC(child)+RC(parent)
à adjust hits/misses of child due to earlier accesses

27
Partial Array Replacement
l Approach: find overlapping region first l Hits+misses assigned to conflicting arrays
— Depends on overlap region l Part of an array may be left in cache
— Keeping partial info à increases algorithm complexity l Instead: if only part of array left in cache
— Consider it not present in cache à removed from context l Option (later): use % overlap to remove array from context based

28
Testing
l DineroIV:trace-driven simulator from University of Wisconsin — as reference: provides hits/misses for uncompressed trace
l compare the total misses (Dinero vs. our ScalaMemTrace) l Results from compressed traces match DineroIV for
— different cache sizes — associativity levels
– under given assumptions – for a cache configuration

29
Current Progress
l Initial implementation — Single loops: works, validated — partial array replacement case — run test cases to check difference Dinero/ScalaMemTrace
– for different cache configs l Ongoing
— test nested loops
Overall Objective: Provide a quick answer to: Ø Which loops should become GPU kernels?

30
Future Work
l identify where most misses occur — based on cache performance data — provide suggestions to increase cache hits — extrapolate to GPU memory usage
l Build multi-processor cache/memory model — Runs multiple instances of uni-processor cache simulator
l Cache simulator’s output à DRAM latency simulator — predict time taken for memory accesses
Ø Extrapolate GPU behavior (1000s threads) from CPU behavior (memory trace of 10s of threads)

31
Future Work