Embed Size (px)
Citation preview
GPS & Seismic Studies of GPS & Seismic Studies of Episodic Tremor & Slip on the Episodic Tremor & Slip on the Nicoya Peninsula, Costa RicaNicoya Peninsula, Costa Rica
Timothy H DixonTimothy H Dixon
MARGINS LecturerMARGINS Lecturer
February/March 2009February/March 2009
Observing Subduction Zone Deformation
Seismology has been the traditional tool; limited to events with periods shorter than a few hours (dynamic offset due to earthquake waves)Ground-based geodesy (eg leveling) showed interseismic strain accumulation, static offset due to earthquakes, & post-seismic deformation (tool of choice until ~ 1990)Space geodesy (InSAR, GPS) began in late 1980’s - early 1990’sInSAR has excellent spatial resolution; good for co-seismic offset; time resolution limited to repeat time of satellite orbit (several weeks - several months)Campaign style GPS also misses rapid time variation
Observing slow slip events
Observation gap: deformation phenomena with periods longer than a few hours (seismology) and shorter than a few weeks or months (InSAR, campaign GPS) could be missedMaturing GPS technology allows installation of Continuous GPS (C-GPS) networks; common in last decadeSlow slip and other transient deformation phenomena may be common in subduction zones, perhaps plate boundariesWell-documented in Cascadia, Japan, Mexico
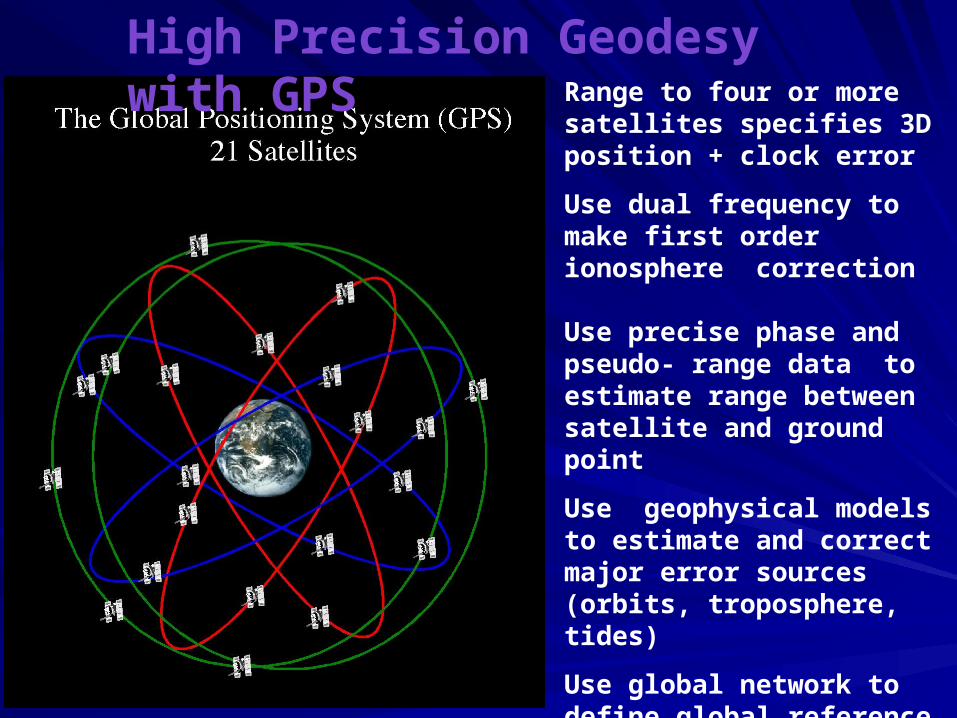
Range to four or more satellites specifies 3D position + clock error
Use dual frequency to make first order ionosphere correction Use precise phase and pseudo- range data to estimate range between satellite and ground point
Use geophysical models to estimate and correct major error sources (orbits, troposphere, tides)
Use global network to define global reference frame
High Precision Geodesy with GPS
BackgroundBackground
locked
slipped
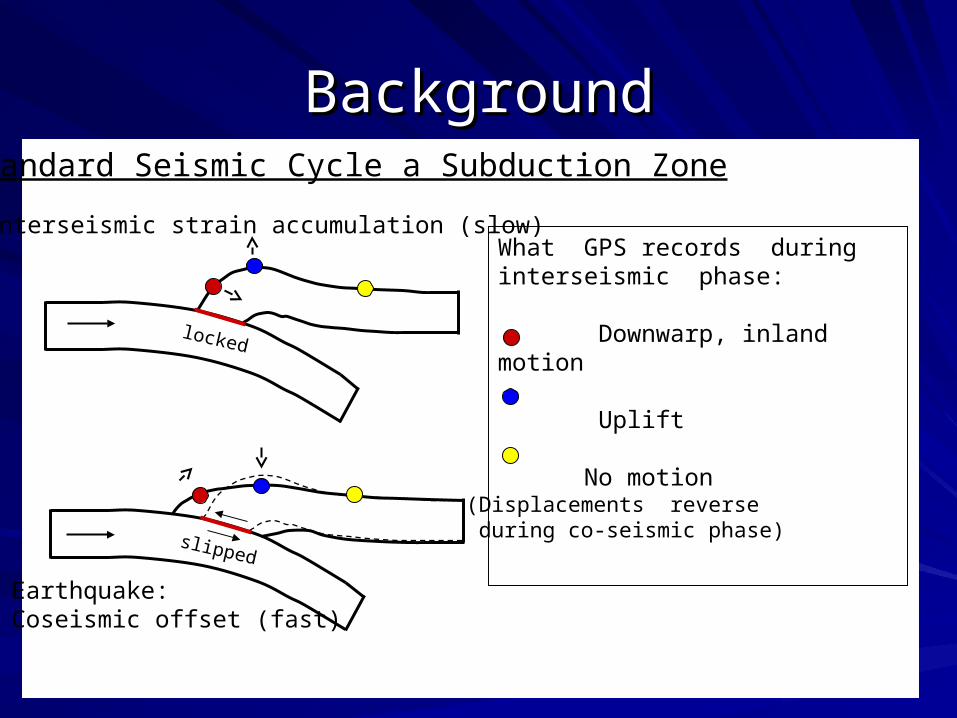
What GPS records during interseismic phase:
Downwarp, inland motion Uplift No motion
Interseismic strain accumulation (slow)
Earthquake: Coseismic offset (fast)
Standard Seismic Cycle a Subduction Zone
(Displacements reverse during co-seismic phase)
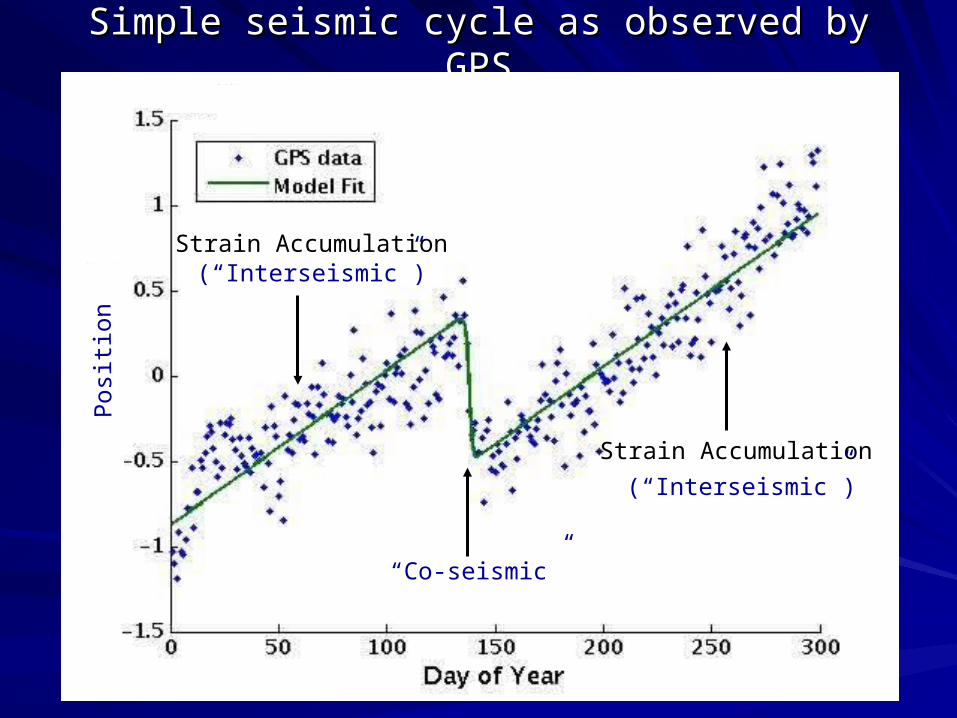
Simple seismic cycle as observed by GPSSimple seismic cycle as observed by GPS
Strain Accumulation
Strain Accumulation
(“Interseismic”)
(“Interseismic”)
“Co-seismic”
Position P
ositi
on
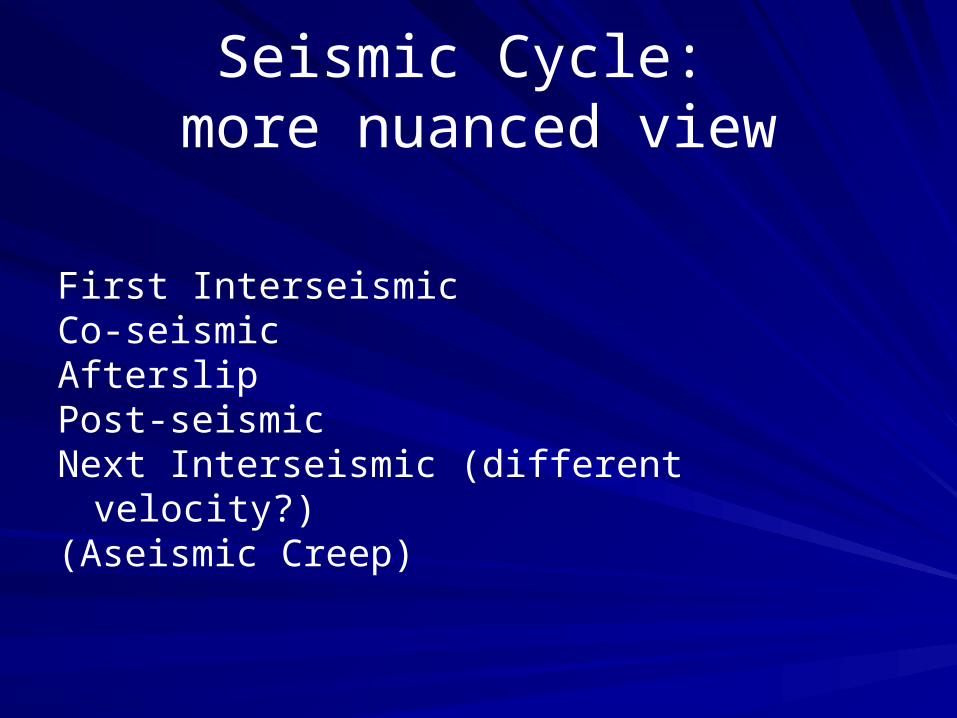
Seismic Cycle: more nuanced view
First InterseismicCo-seismicAfterslipPost-seismicNext Interseismic (different velocity?)(Aseismic Creep)
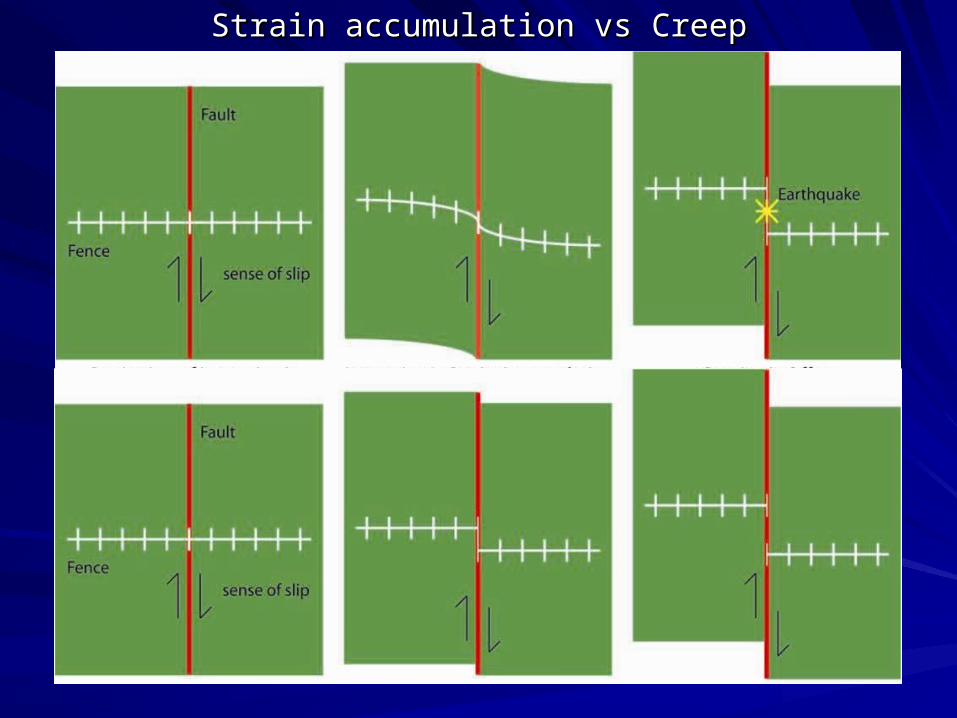
Strain accumulation vs CreepStrain accumulation vs Creep
Aseismic Aseismic CreepCreep
Creep can be stopped,it just takes more & stronger curbs*
*In the 2009Stimulus Package
What is Episodic Tremor and Slip?What is Episodic Tremor and Slip?
•A slow slip event (“ very slow earthquake”) A slow slip event (“ very slow earthquake”) accompanied by seismic tremoraccompanied by seismic tremor•May repeat at regular intervals (every few May repeat at regular intervals (every few months - every few years)months - every few years)•A new class of Earth deformation A new class of Earth deformation phenomenon, with characteristics phenomenon, with characteristics intermediate between standard earthquake intermediate between standard earthquake and aseismic creepand aseismic creep
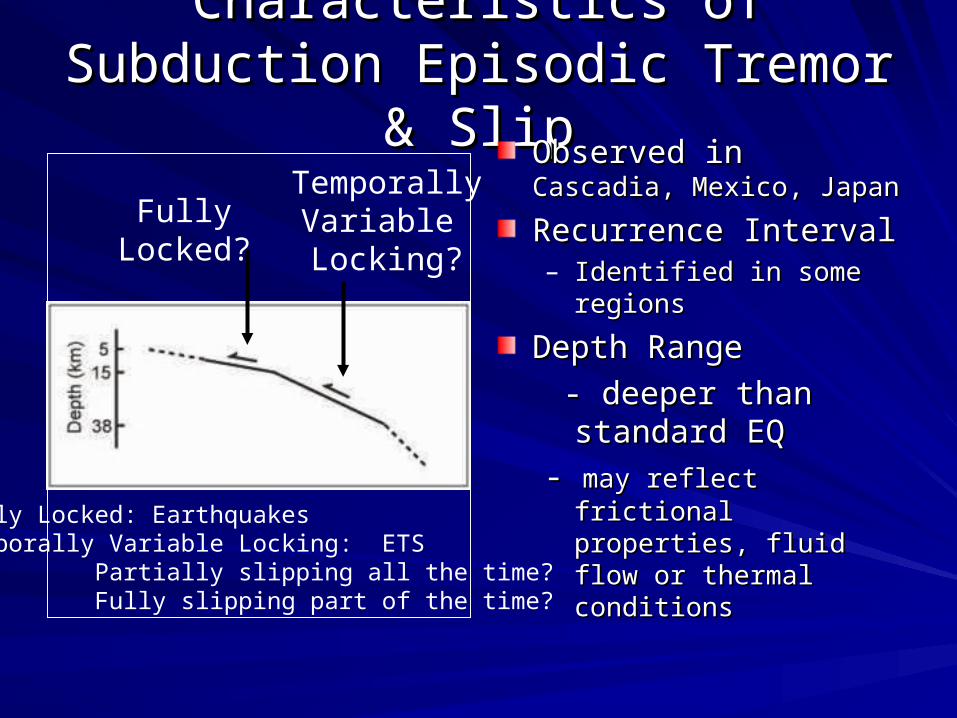
Characteristics of Subduction Characteristics of Subduction Episodic Tremor & SlipEpisodic Tremor & Slip
Observed in Observed in Cascadia, Cascadia, Mexico, JapanMexico, Japan
Recurrence IntervalRecurrence Interval– Identified in some regionsIdentified in some regions
Depth RangeDepth Range
- deeper than standard - deeper than standard EQEQ
- - may reflect fmay reflect frictional rictional properties, fluid flow or properties, fluid flow or thermal conditionsthermal conditions
FullyLocked?
TemporallyVariable Locking?
Fully Locked: EarthquakesTemporally Variable Locking: ETS Partially slipping all the time? Fully slipping part of the time?
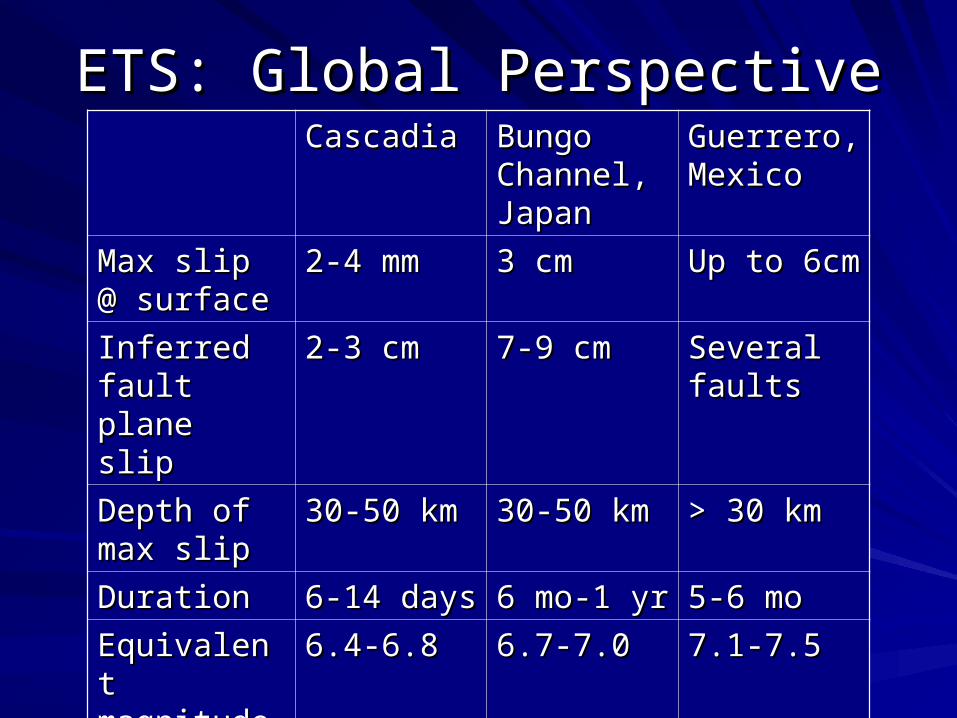
ETS: Global PerspectiveETS: Global PerspectiveCascadiaCascadia Bungo Bungo
Channel, Channel, JapanJapan
Guerrero, Guerrero, MexicoMexico
Max slip @ Max slip @ surfacesurface
2-4 mm2-4 mm 3 cm3 cm Up to 6cmUp to 6cm
Inferred fault Inferred fault plane slipplane slip
2-3 cm2-3 cm 7-9 cm7-9 cm Several Several faultsfaults
Depth of Depth of max slipmax slip
30-50 km30-50 km 30-50 km30-50 km > 30 km> 30 km
DurationDuration 6-14 days6-14 days 6 mo-1 yr6 mo-1 yr 5-6 mo5-6 mo
Equivalent Equivalent magnitudemagnitude
6.4-6.86.4-6.8 6.7-7.06.7-7.0 7.1-7.57.1-7.5
SourceSource Dragert et Dragert et al 2001al 2001
Ozawa et al Ozawa et al 2001, 20042001, 2004
Larson et al Larson et al 2004, 20062004, 2006
Costa Rica Project GoalsCosta Rica Project GoalsSet up network of continuous GPS in “typical” Set up network of continuous GPS in “typical”
subduction zone (fast subduction, young crust, subduction zone (fast subduction, young crust, frequent earthquakes)frequent earthquakes)
Inspect data for phenomena that have so far Inspect data for phenomena that have so far escaped attention, eg ETS eventsescaped attention, eg ETS events
Are ETS events common in Middle America Are ETS events common in Middle America subduction zone?subduction zone?
How do their characeristics differ from other How do their characeristics differ from other subduction zones?subduction zones?
What can they tell us about subduction What can they tell us about subduction earthquakes?earthquakes?
–Implications for Seismic HazardImplications for Seismic Hazard–Implications for Earthquake ProcessImplications for Earthquake Process
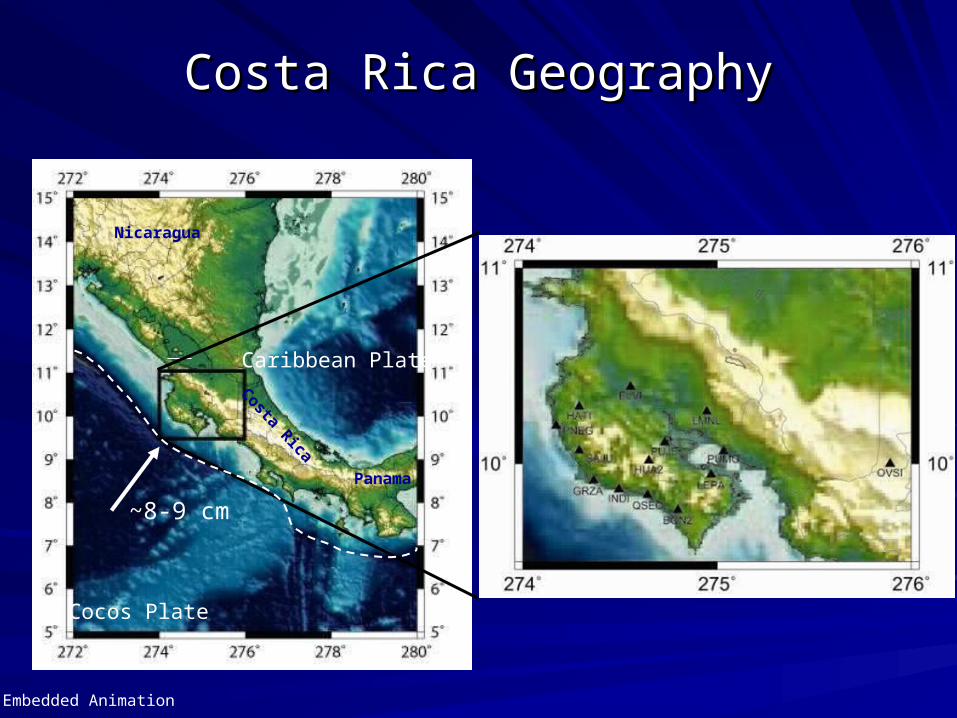
Costa Rica GeographyCosta Rica Geography
~8-9 cm
Cocos Plate
Caribbean Plate
Nicaragua
Panama
Costa Rica
Embedded Animation
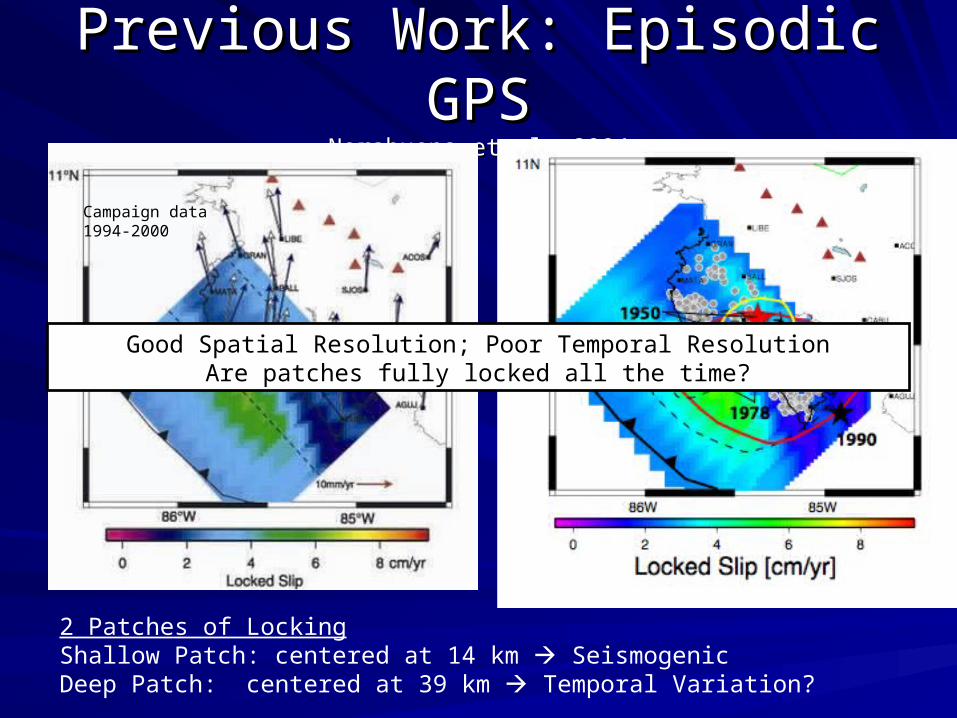
Previous Work: Episodic GPSPrevious Work: Episodic GPSNorabuena et al, 2004Norabuena et al, 2004
2 Patches of LockingShallow Patch: centered at 14 km SeismogenicDeep Patch: centered at 39 km Temporal Variation?
Campaign data1994-2000
Spatial locking patterns
Good Spatial Resolution; Poor Temporal ResolutionAre patches fully locked all the time?
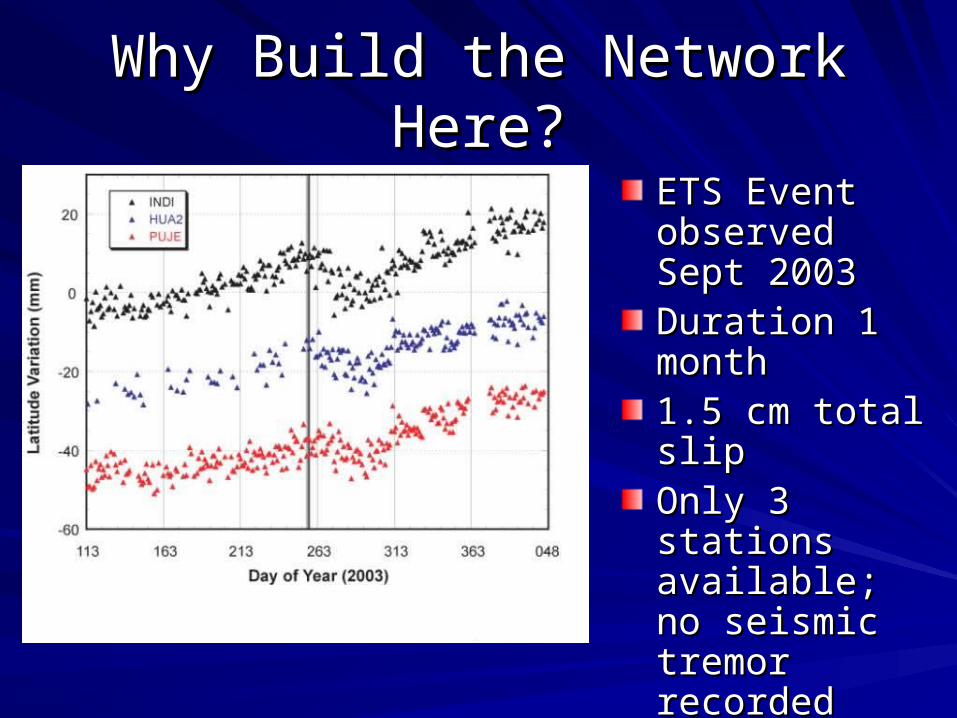
Why Build the Network Here?Why Build the Network Here?
ETS Event ETS Event observed Sept observed Sept 20032003Duration 1 Duration 1 monthmonth1.5 cm total slip1.5 cm total slipOnly 3 stations Only 3 stations available; no available; no seismic tremor seismic tremor recordedrecorded
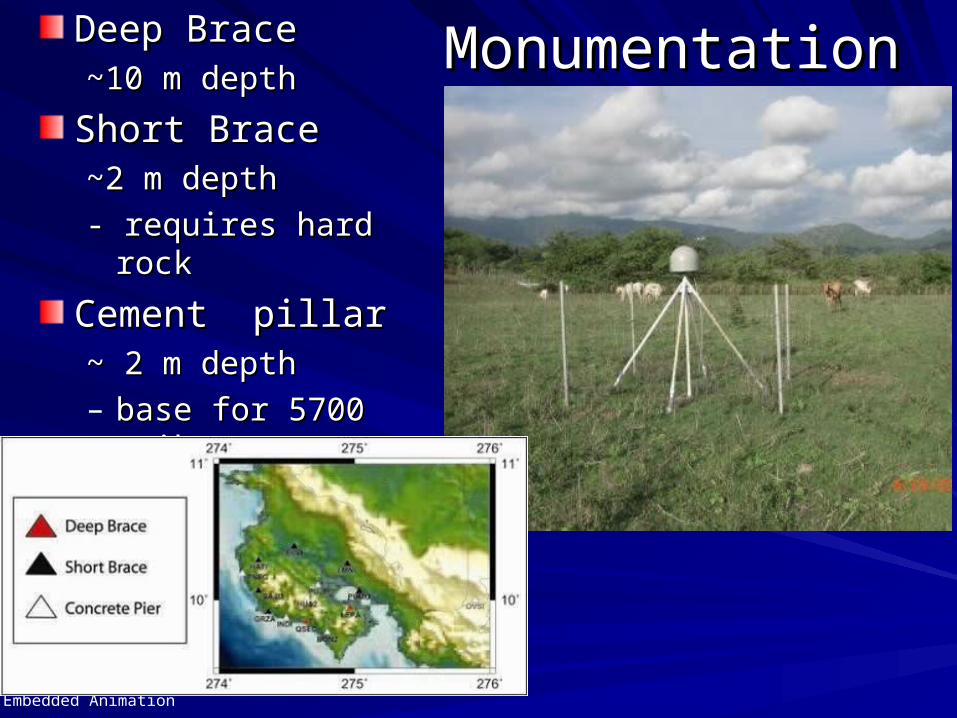
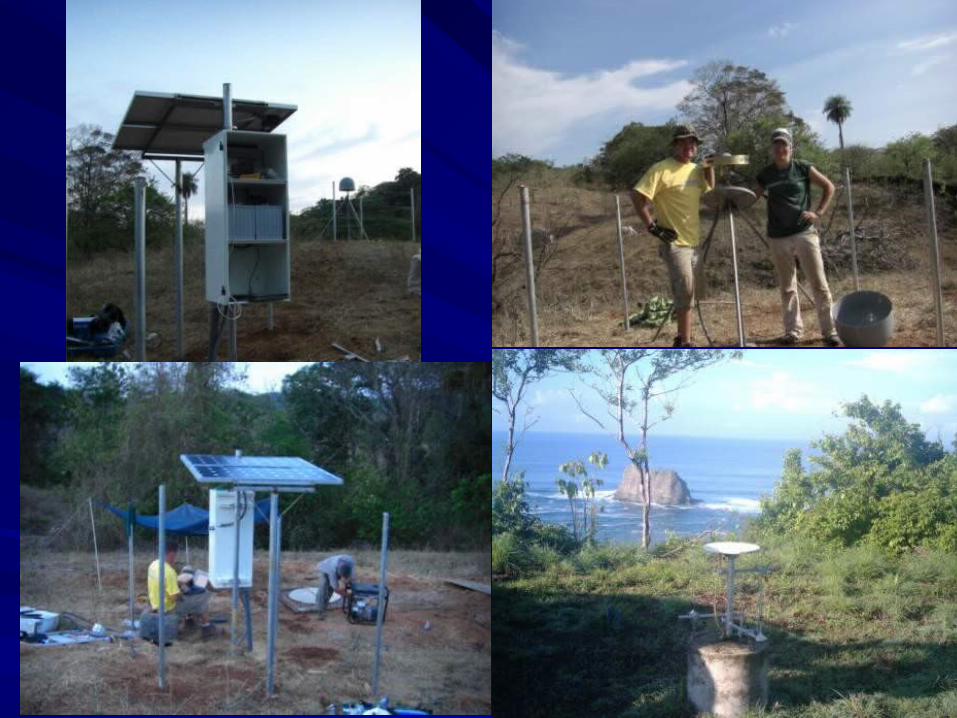
MonumentationMonumentationDeep BraceDeep Brace~10 m depth~10 m depth
Short BraceShort Brace~2 m depth ~2 m depth
- requires hard rock- requires hard rock
Cement pillarCement pillar~ 2 m depth~ 2 m depth– base for 5700 spike base for 5700 spike
mountsmounts
Embedded Animation
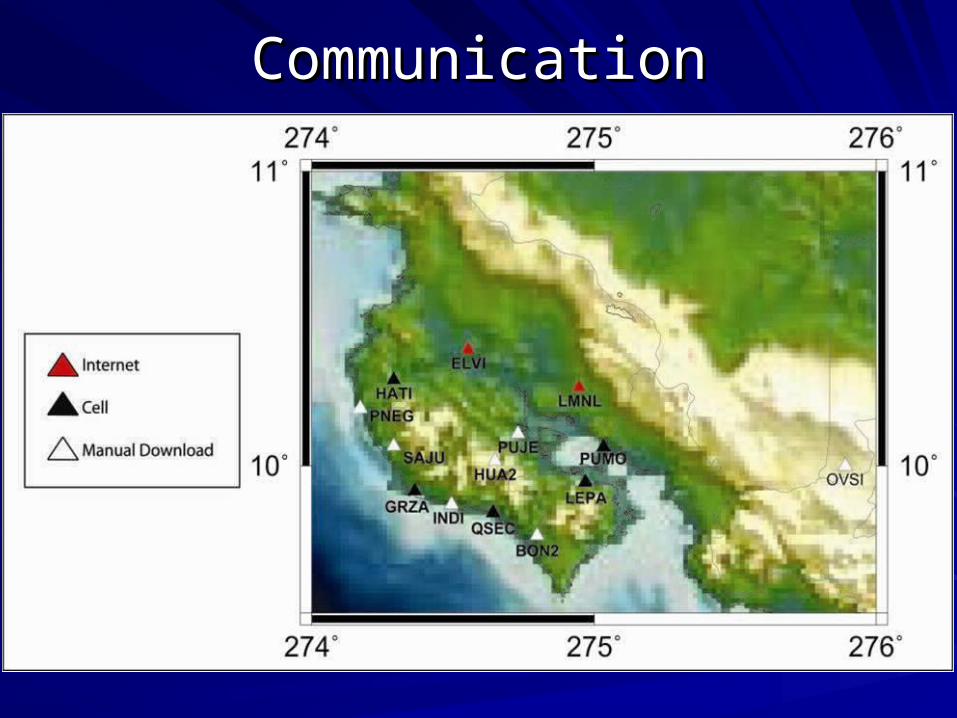
CommunicationCommunication
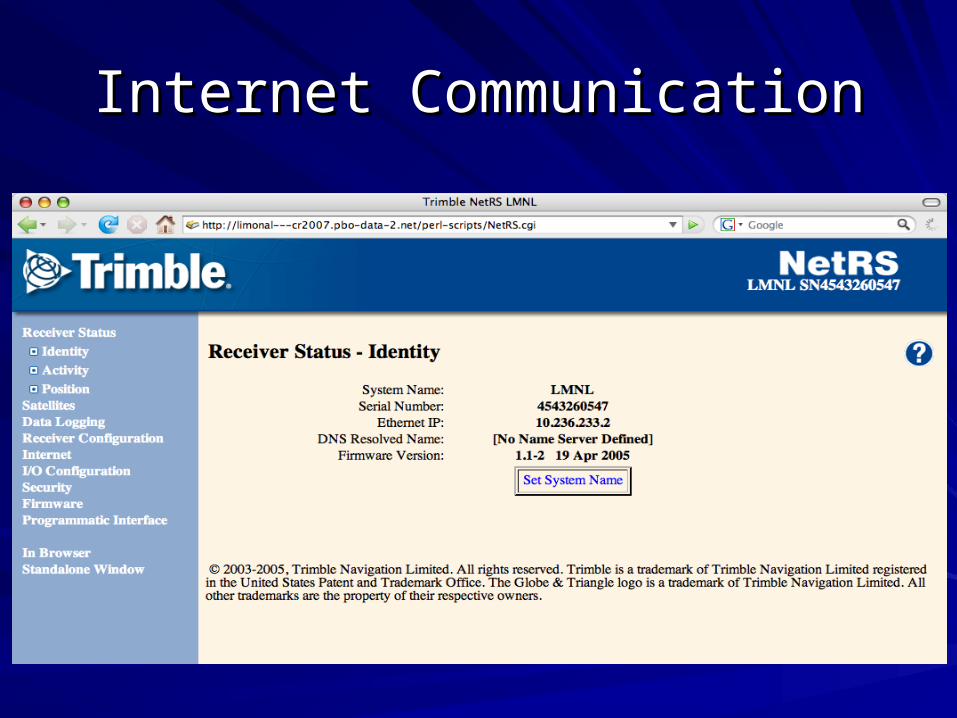
Internet CommunicationInternet Communication
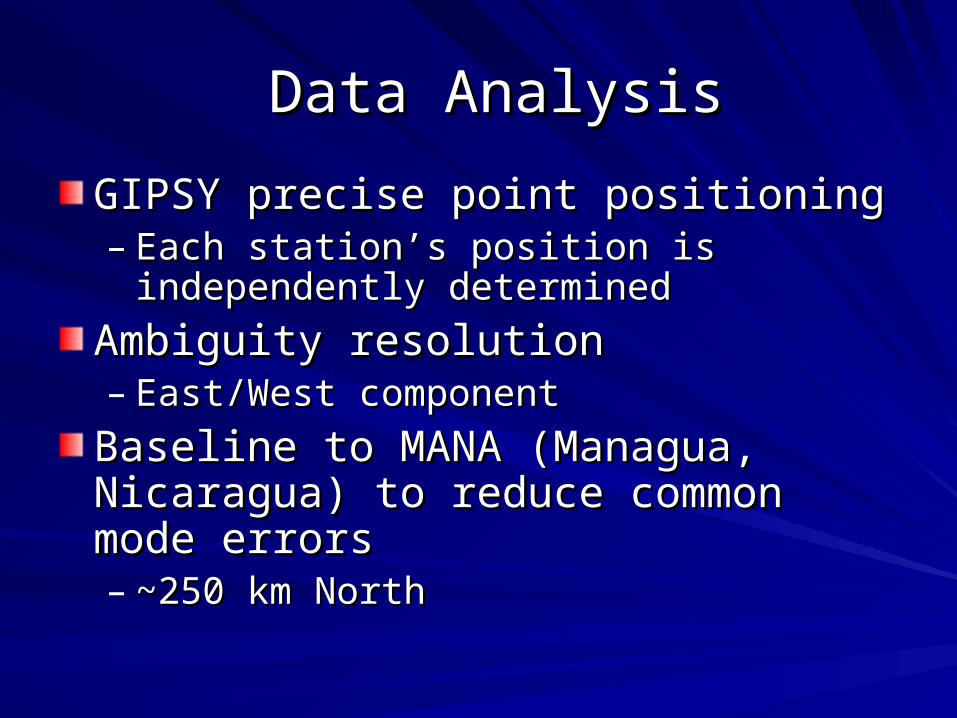
Data AnalysisData Analysis
GIPSY precise point positioningGIPSY precise point positioning– Each station’s position is independently Each station’s position is independently
determineddetermined
Ambiguity resolutionAmbiguity resolution– East/West component East/West component
Baseline to MANA (Managua, Nicaragua) Baseline to MANA (Managua, Nicaragua) to reduce common mode errorsto reduce common mode errors– ~250 km North~250 km North
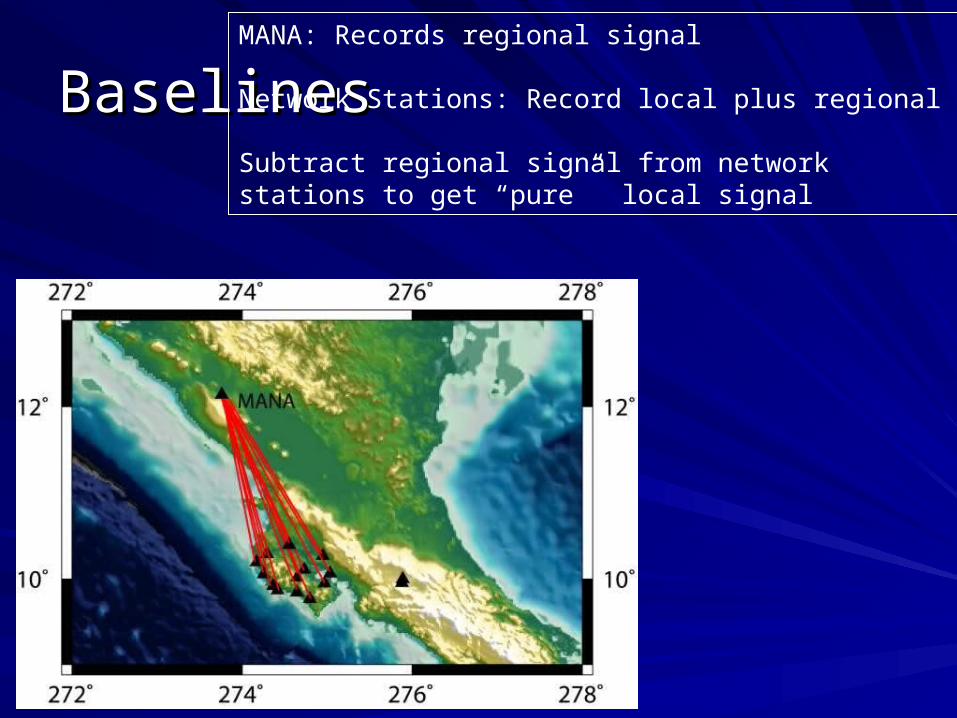
BaselinesBaselinesMANA: Records regional signal
Network Stations: Record local plus regional Signal
Subtract regional signal from network stations to get “pure” local signal
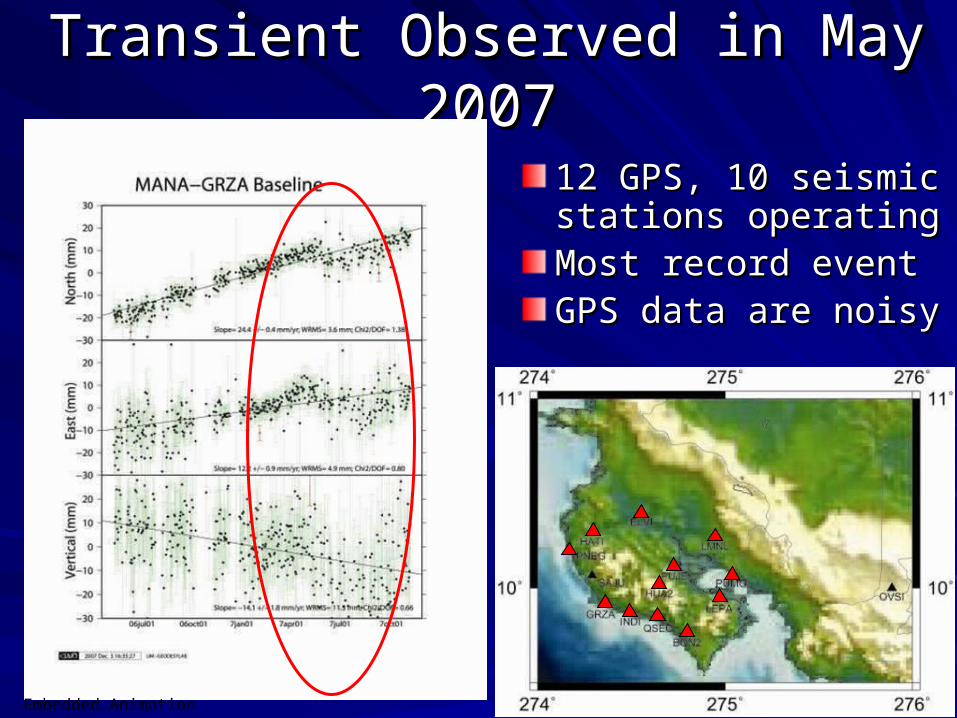
Transient Observed in May 2007Transient Observed in May 2007
12 GPS, 10 seismic 12 GPS, 10 seismic stations operatingstations operatingMost record eventMost record eventGPS data are noisyGPS data are noisy
Embedded Animation
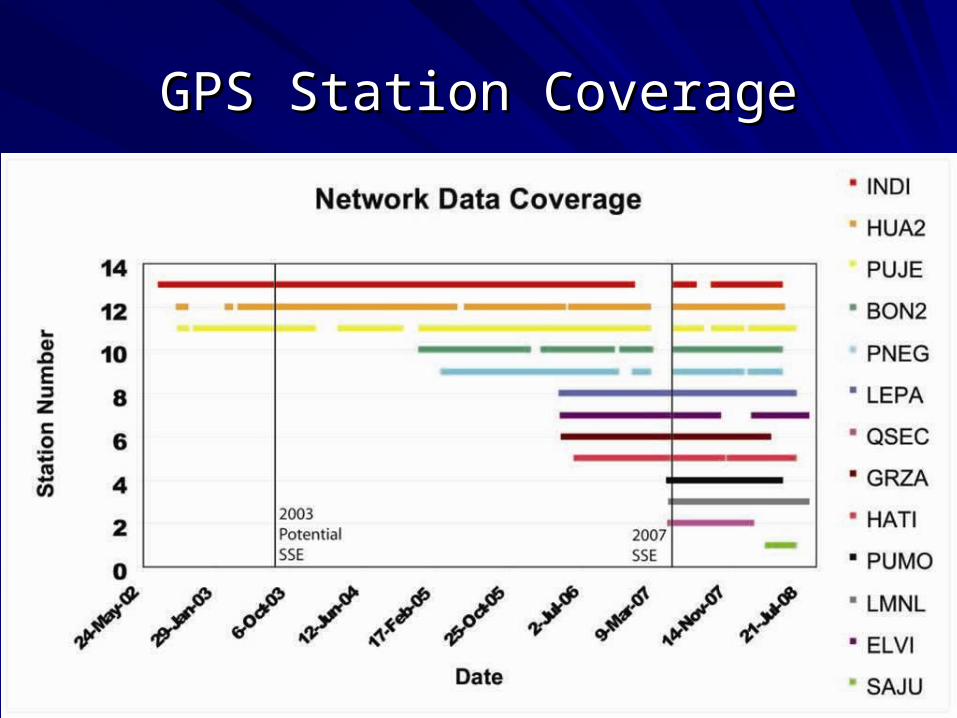
GPS Station CoverageGPS Station Coverage
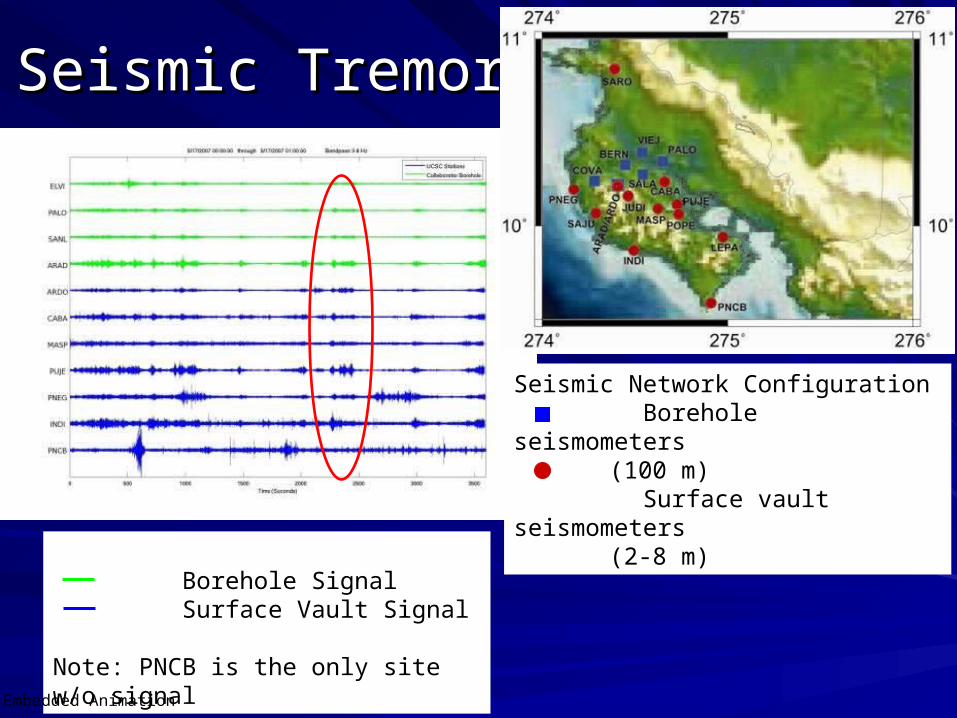
Seismic TremorSeismic Tremor
Borehole Signal Surface Vault Signal
Note: PNCB is the only site w/o signal
Seismic Network Configuration Borehole seismometers
(100 m) Surface vault seismometers
(2-8 m)
Embedded Animation
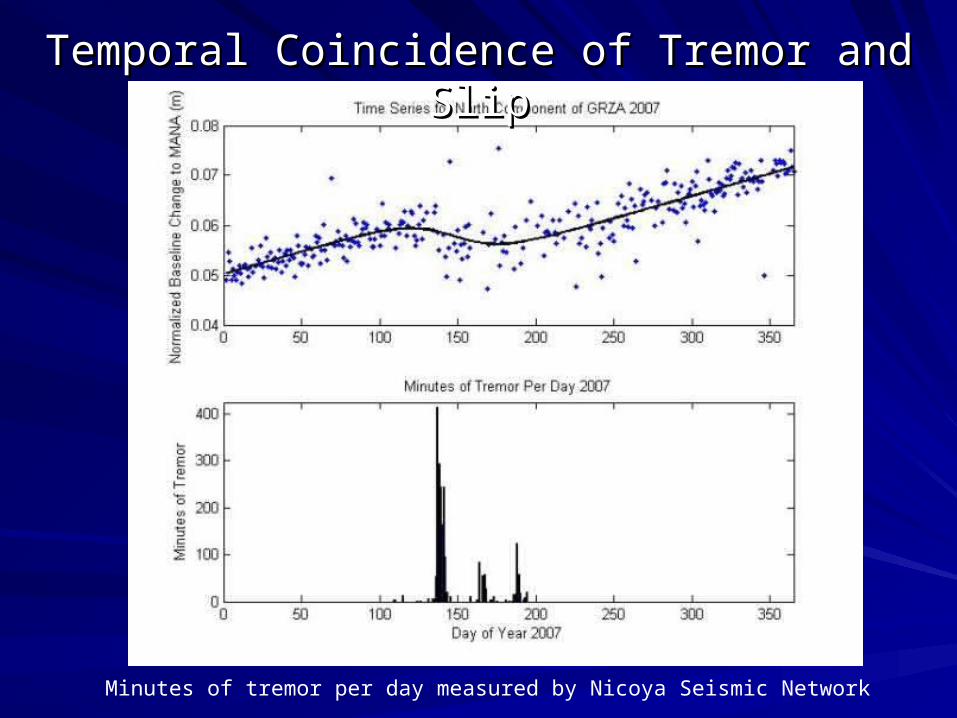
Temporal Coincidence of Tremor and SlipTemporal Coincidence of Tremor and Slip
Minutes of tremor per day measured by Nicoya Seismic Network
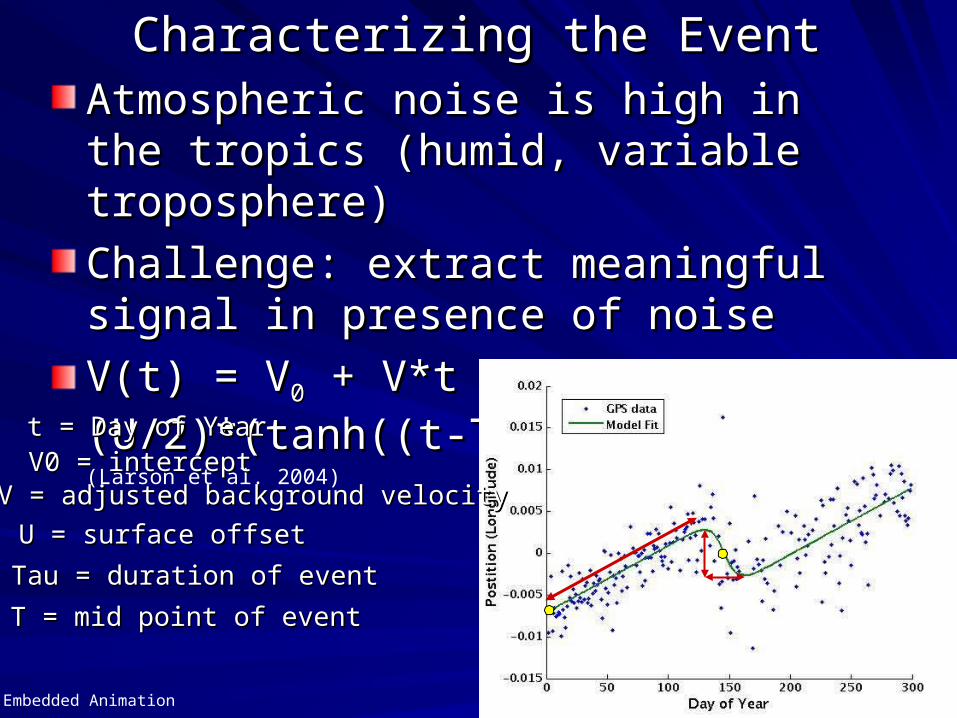
Characterizing the EventCharacterizing the EventAtmospheric noise is high in the tropics Atmospheric noise is high in the tropics (humid, variable troposphere)(humid, variable troposphere)
Challenge: extract meaningful signal in Challenge: extract meaningful signal in presence of noisepresence of noise
V(t) = VV(t) = V00 + V*t + (U/2)*(tanh((t-T)/tau)-1) + V*t + (U/2)*(tanh((t-T)/tau)-1)(Larson et al. 2004)
V0 = interceptV0 = interceptV = adjusted background velocityV = adjusted background velocity
U = surface offsetU = surface offset
T = mid point of eventT = mid point of event
Tau = duration of eventTau = duration of event
t = Day of Yeart = Day of Year
Embedded Animation
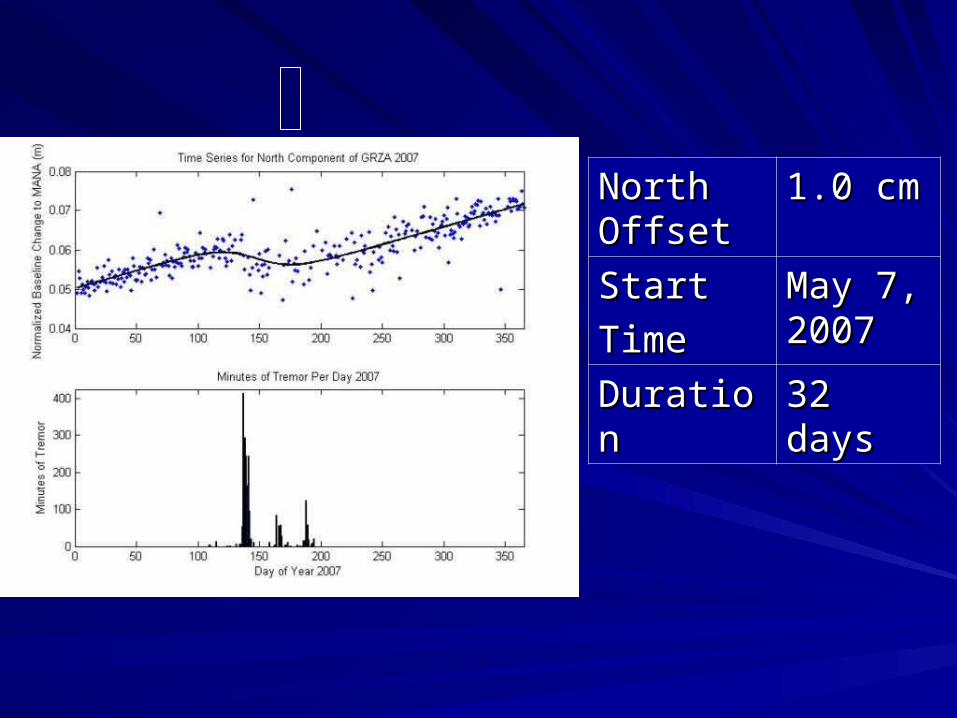
North North OffsetOffset
1.0 cm1.0 cm
Start Start
TimeTime
May 7, May 7, 20072007
DurationDuration 32 days32 days
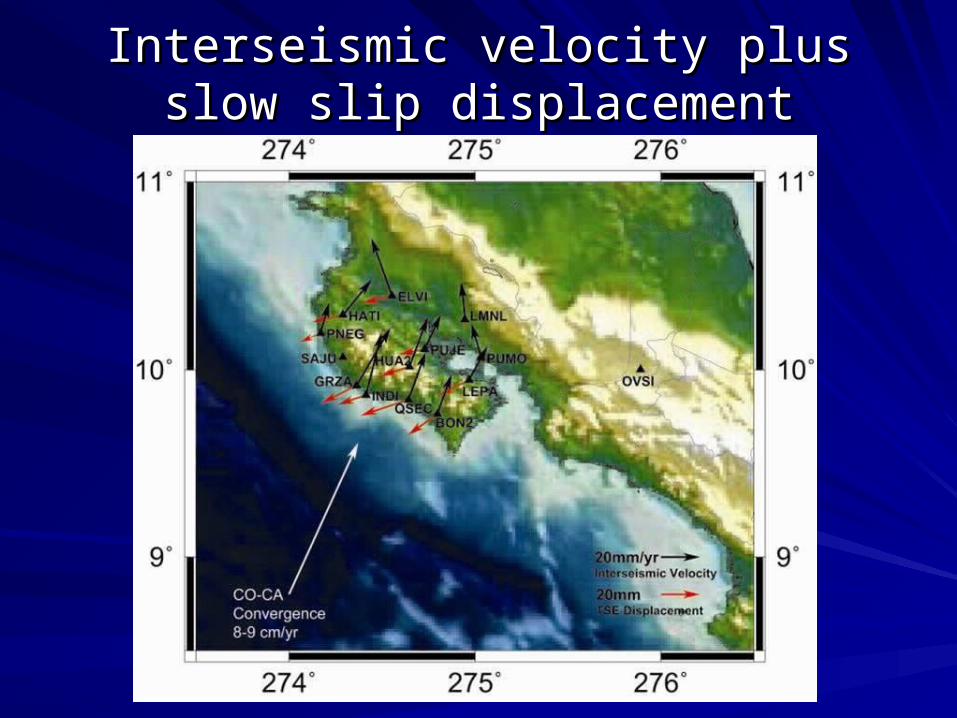
Interseismic velocity plus slow slip Interseismic velocity plus slow slip displacementdisplacement
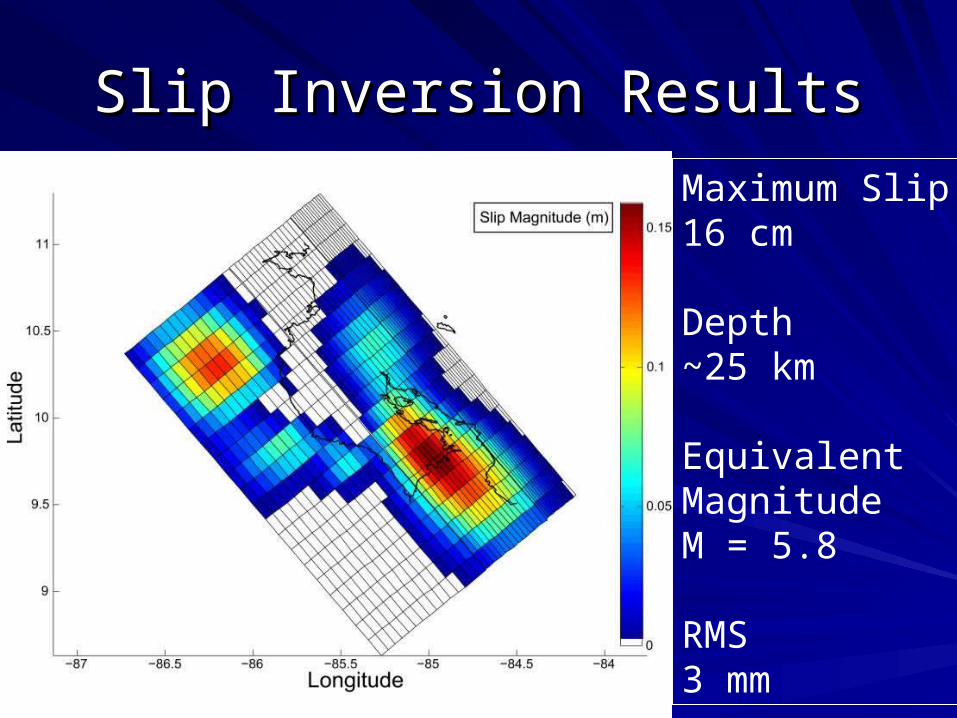
Slip Inversion ResultsSlip Inversion Results
Maximum Slip16 cm
Depth~25 km
Equivalent MagnitudeM = 5.8
RMS 3 mm
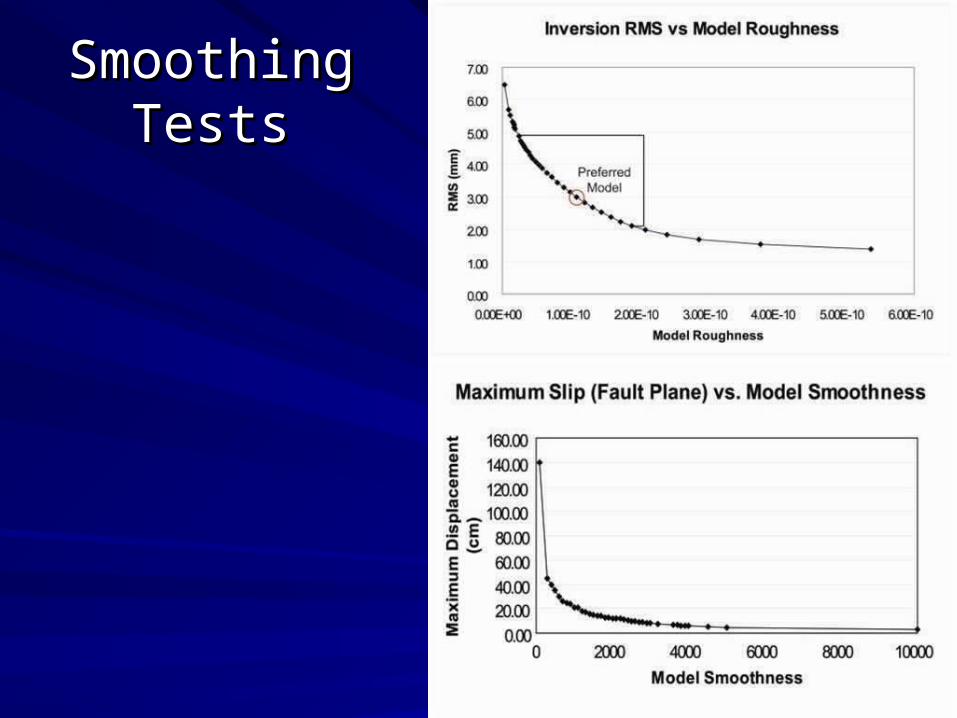
Smoothing TestsSmoothing Tests
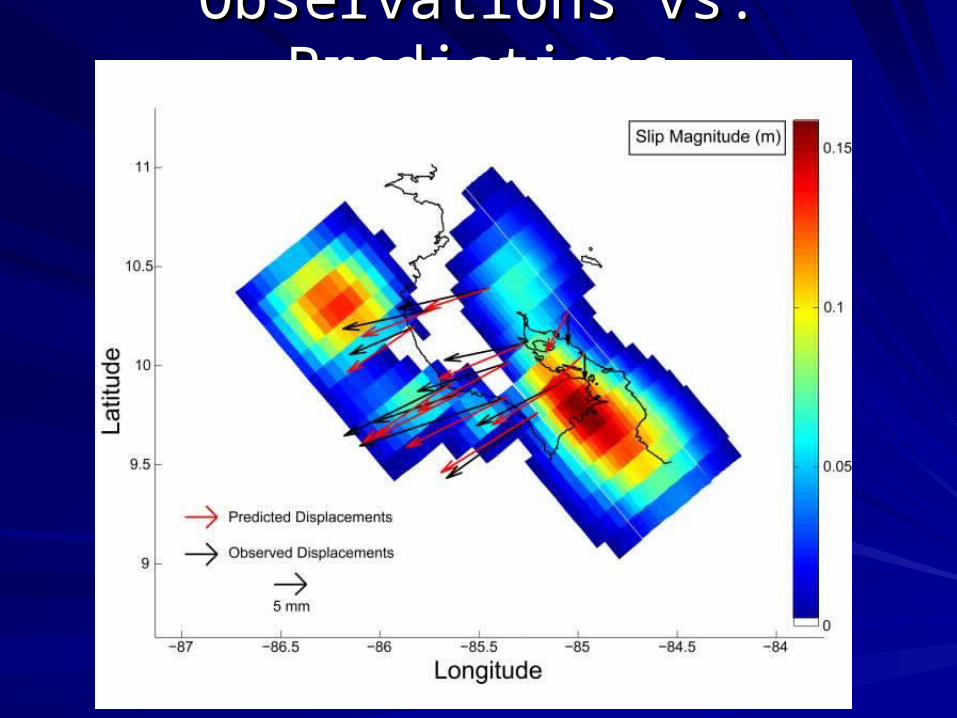
Observations vs. PredictionsObservations vs. Predictions
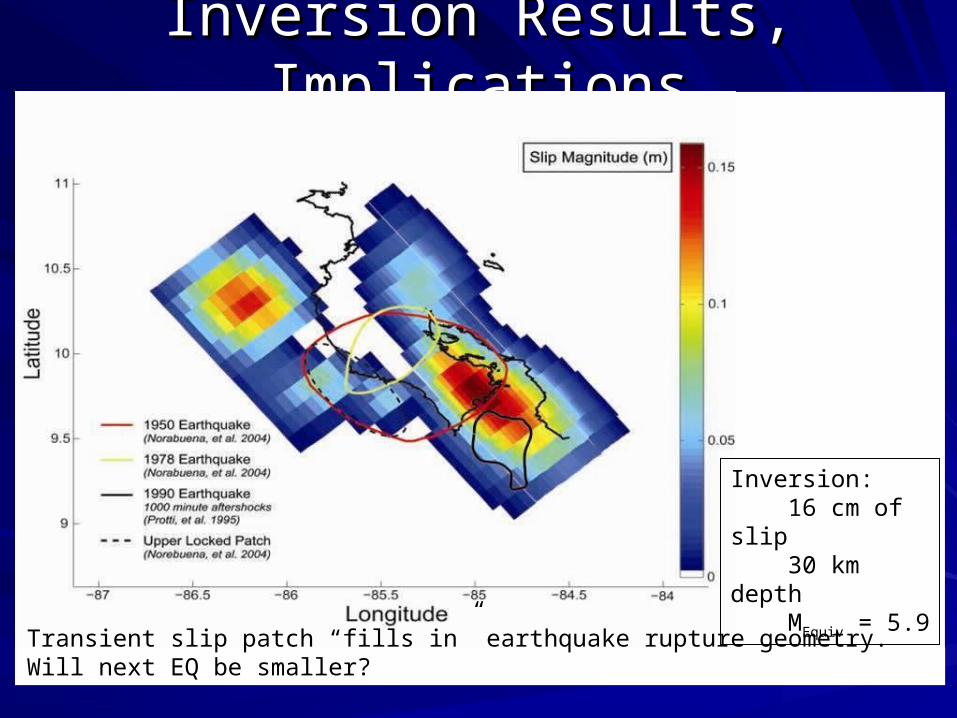
Inversion Results, ImplicationsInversion Results, Implications
Inversion: 16 cm of slip 30 km depth MEquiv = 5.9
Transient slip patch “fills in” earthquake rupture geometry.Will next EQ be smaller?
Implications for Earthquake cycle, slip budgetImplications for Earthquake cycle, slip budget
– Stress: More updip stress after ETS event (makes next Stress: More updip stress after ETS event (makes next major earthquake more likely)major earthquake more likely)
– ETS event fills in “slip gap” from the 1950 (Mw = 7.7) ETS event fills in “slip gap” from the 1950 (Mw = 7.7) event, meaning that the next earthquake could be event, meaning that the next earthquake could be smaller than the 1950 event (would require that ETS smaller than the 1950 event (would require that ETS events recur every few years)events recur every few years)
– Need to keep looking for next 3-4 years to understand Need to keep looking for next 3-4 years to understand recurrence intervalrecurrence interval
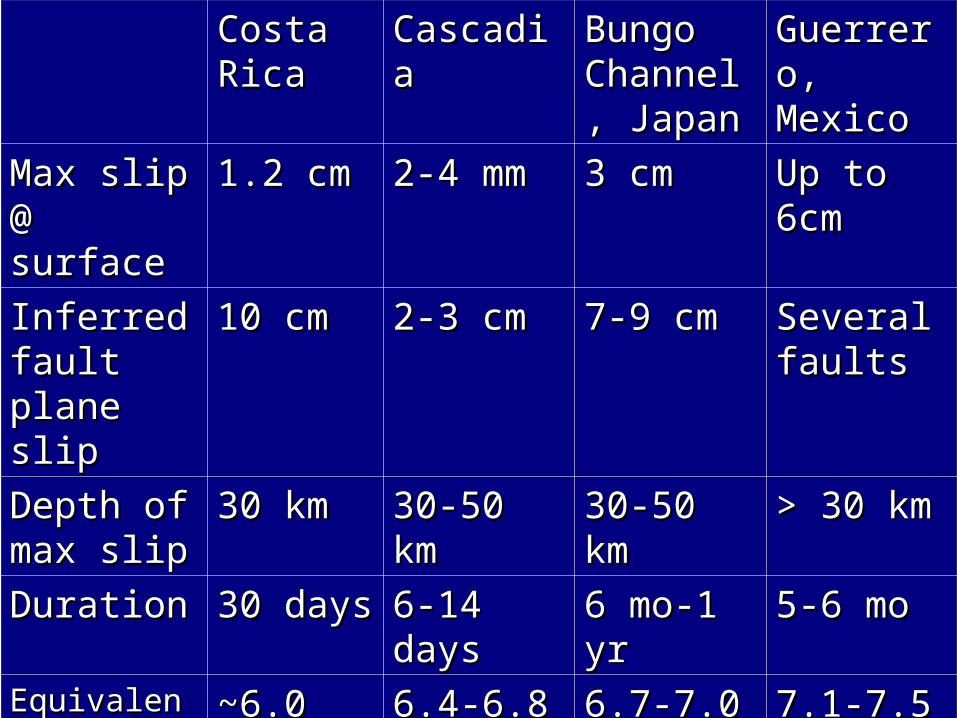
Costa Costa RicaRica
CascadiaCascadia Bungo Bungo Channel, Channel, JapanJapan
Guerrero, Guerrero, MexicoMexico
Max slip @ Max slip @ surfacesurface
1.2 cm1.2 cm 2-4 mm2-4 mm 3 cm3 cm Up to 6cmUp to 6cm
Inferred Inferred fault plane fault plane slipslip
10 cm10 cm 2-3 cm2-3 cm 7-9 cm7-9 cm Several Several faultsfaults
Depth of Depth of max slipmax slip
30 km30 km 30-50 km30-50 km 30-50 km30-50 km > 30 km> 30 km
DurationDuration 30 days30 days 6-14 days6-14 days 6 mo-1 yr6 mo-1 yr 5-6 mo5-6 moEquivalent Equivalent magnitudemagnitude
~6.0~6.0 6.4-6.86.4-6.8 6.7-7.06.7-7.0 7.1-7.57.1-7.5
SourceSource This studyThis study Dragert et al Dragert et al 20012001
Ozawa et al Ozawa et al 2001, 20042001, 2004
Larson et al Larson et al 2004, 20062004, 2006
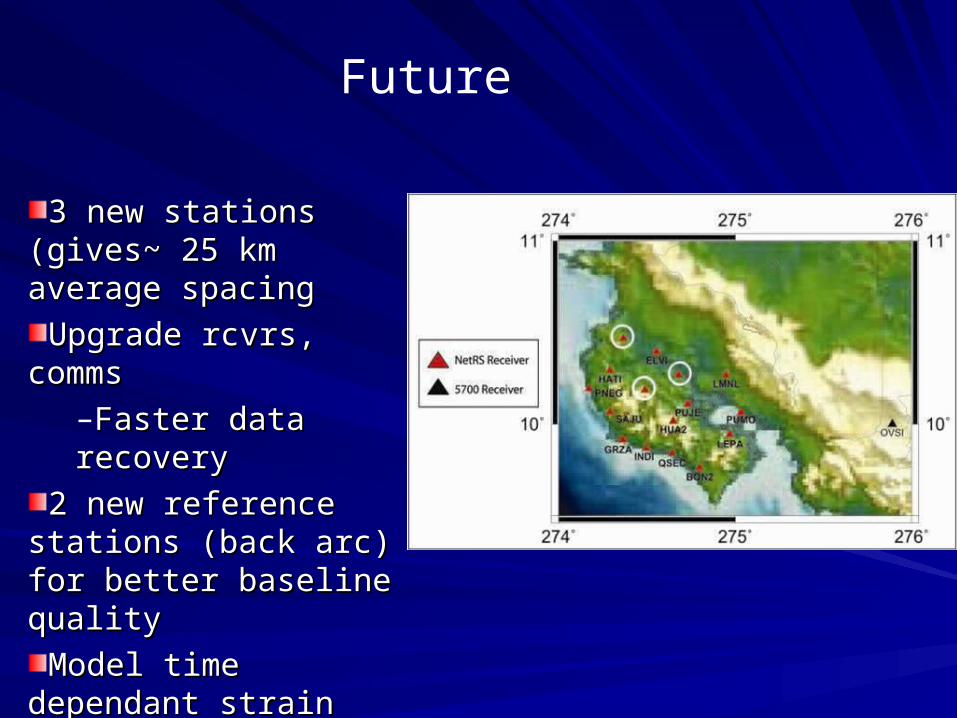
3 new stations (gives~ 3 new stations (gives~ 25 km average spacing25 km average spacing
Upgrade rcvrs, commsUpgrade rcvrs, comms–Faster data recoveryFaster data recovery
2 new reference stations 2 new reference stations (back arc) for better (back arc) for better baseline qualitybaseline quality
Model time dependant Model time dependant strainstrain
Future
ConclusionsConclusions
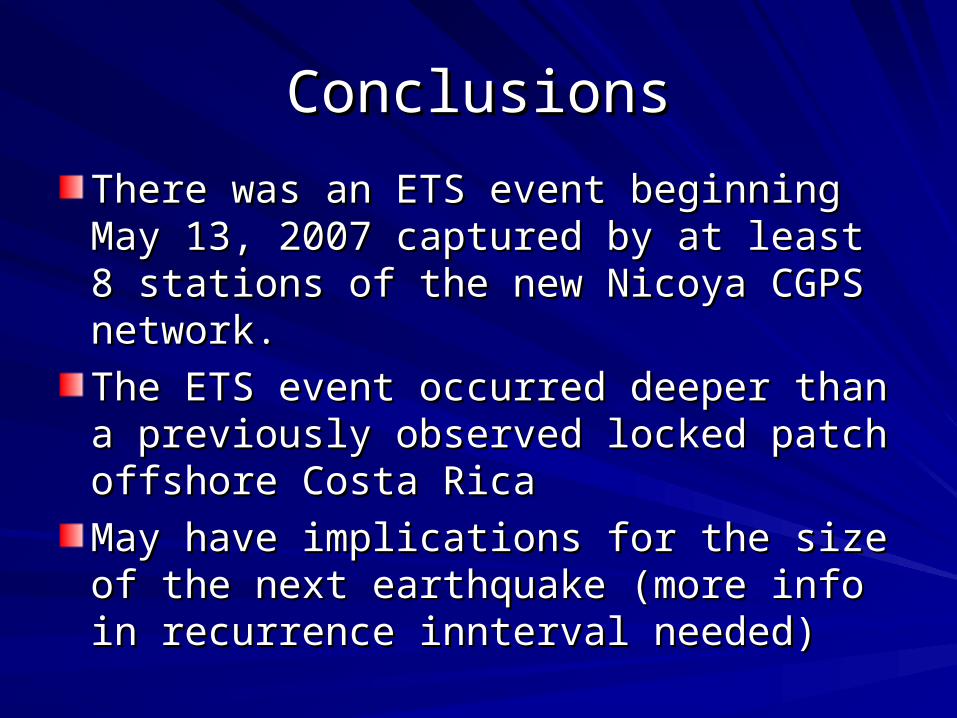
There was an ETS event beginning May There was an ETS event beginning May 13, 2007 captured by at least 8 stations of 13, 2007 captured by at least 8 stations of the new Nicoya CGPS network. the new Nicoya CGPS network.
The ETS event occurred deeper than a The ETS event occurred deeper than a previously observed locked patch offshore previously observed locked patch offshore Costa RicaCosta Rica
May have implications for the size of the May have implications for the size of the next earthquake (more info in recurrence next earthquake (more info in recurrence innterval needed)innterval needed)
AcknowledgementsAcknowledgements
NSF-MARGINS, I&FNSF-MARGINS, I&F
UNAVCOUNAVCO
OVSICORIOVSICORI
Thank you!Thank you!

Back UpBack Up
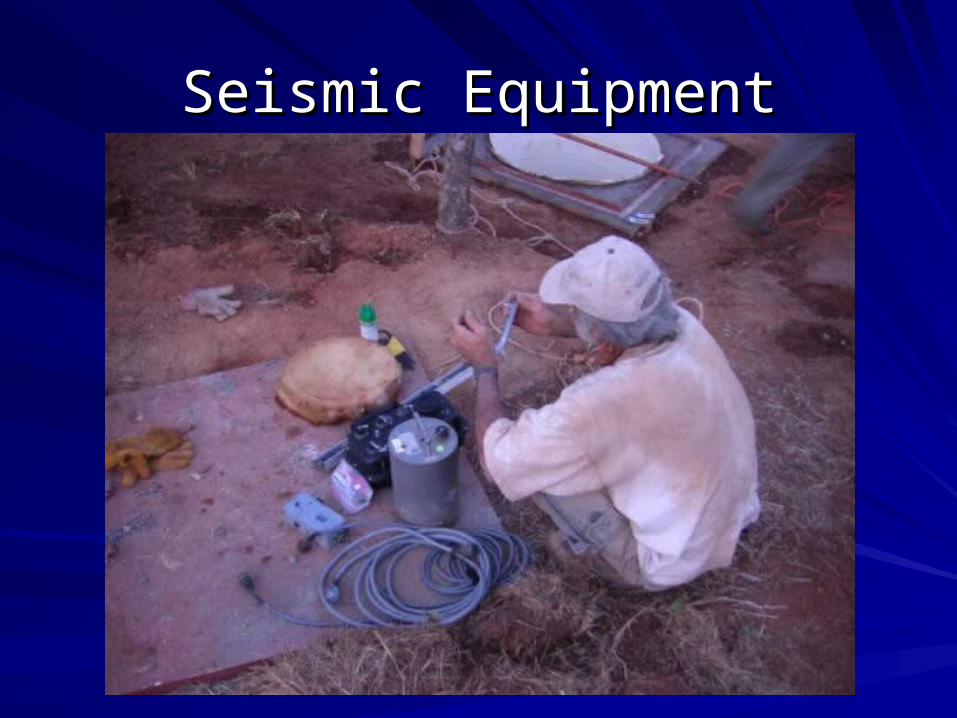
Seismic EquipmentSeismic Equipment
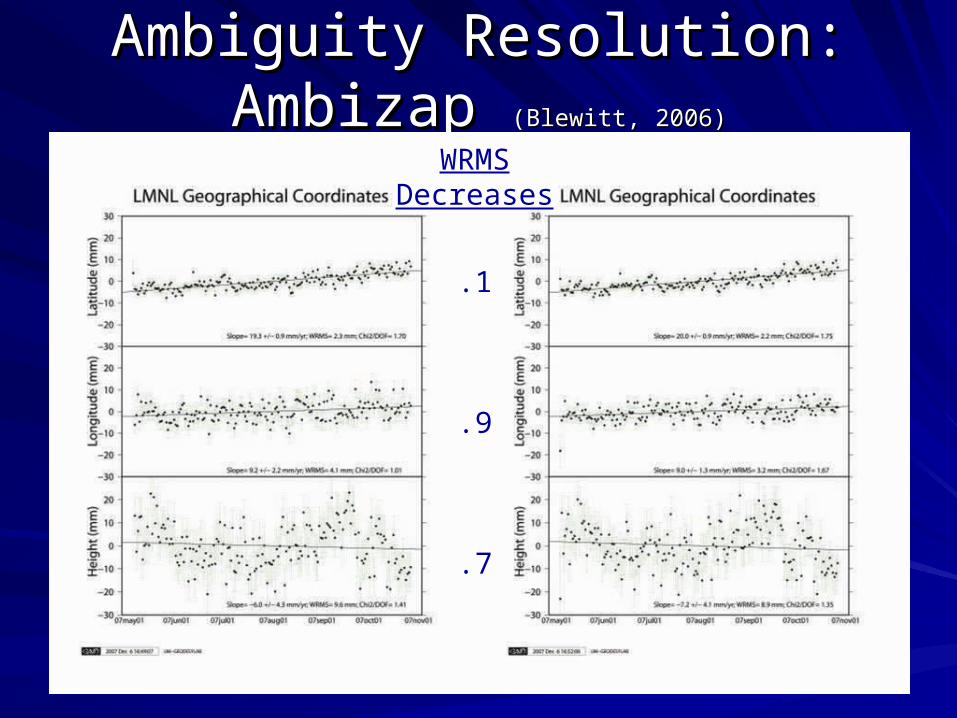
Ambiguity Resolution: Ambizap Ambiguity Resolution: Ambizap (Blewitt, 2006)(Blewitt, 2006)
WRMS Decreases
.1
.9
.7
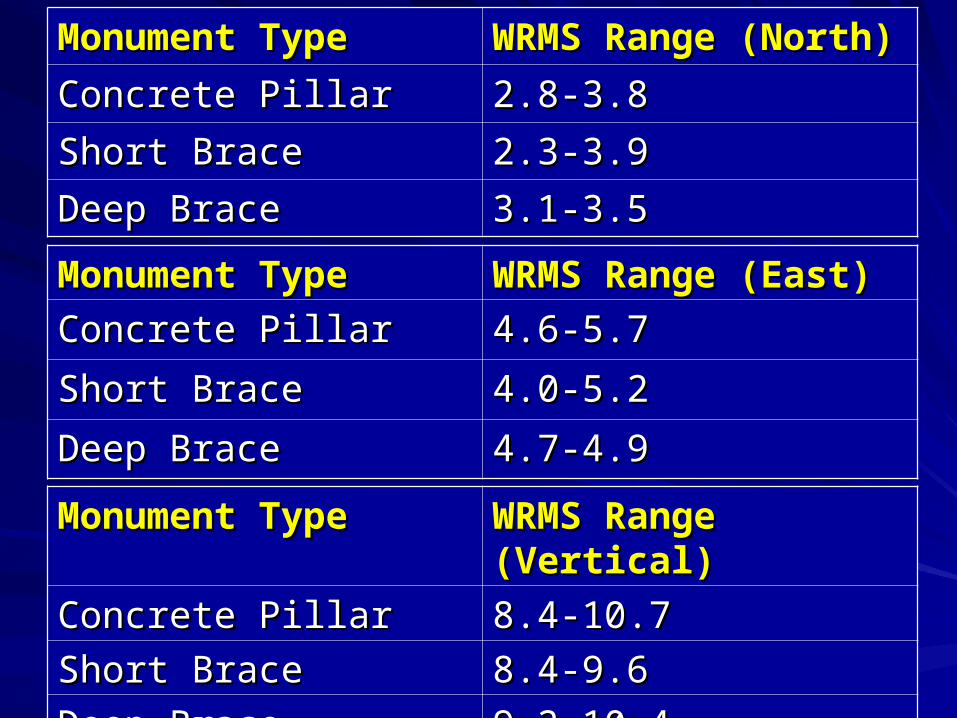
Monument TypeMonument Type WRMS Range (North)WRMS Range (North)
Concrete PillarConcrete Pillar 2.8-3.82.8-3.8
Short BraceShort Brace 2.3-3.92.3-3.9
Deep BraceDeep Brace 3.1-3.53.1-3.5
Monument TypeMonument Type WRMS Range (East)WRMS Range (East)
Concrete PillarConcrete Pillar 4.6-5.74.6-5.7
Short BraceShort Brace 4.0-5.24.0-5.2
Deep BraceDeep Brace 4.7-4.94.7-4.9
Monument TypeMonument Type WRMS Range (Vertical)WRMS Range (Vertical)
Concrete PillarConcrete Pillar 8.4-10.78.4-10.7
Short BraceShort Brace 8.4-9.68.4-9.6
Deep BraceDeep Brace 9.2-10.49.2-10.4
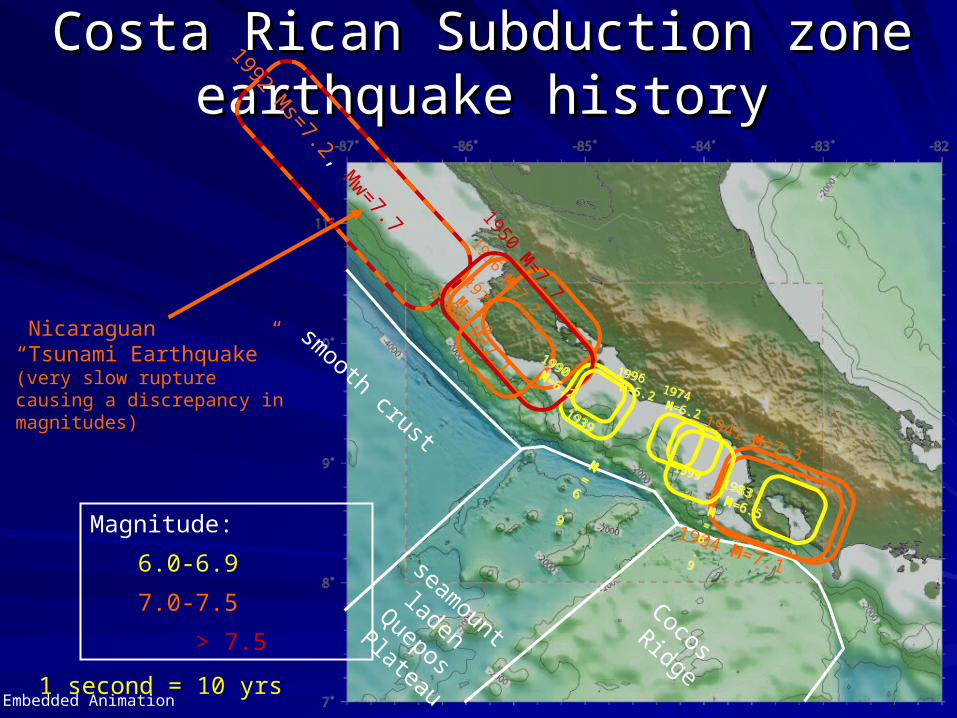
1904 M=7.1
Costa Rican Subduction zone Costa Rican Subduction zone earthquake historyearthquake history
1941 M=7.3
1916 M=7.2
1939
M=
6.
9
1939
M=
6.
9
1999
M=
6.
9
1999
M=
6.
9
1996 M=6.2
1996 M=6.2 1974
M=6.2
1974 M=6.2
1983 M=6.5
1983 M=6.5
smooth crust
seamount
laden Quepos
Plateau
Cocos Ridge
1 second = 10 yrs1992 M
s=7.2, M
w=7.7
Nicaraguan “Tsunami Earthquake”(very slow rupture causing a discrepancy in magnitudes)
Magnitude:
6.0-6.9
7.0-7.5
> 7.5
1900 M=7.1
1950 M=7.7
1978
M=7.0
1990 M=6.2
1990 M=6.2
Embedded Animation