Embed Size (px)
Citation preview

GPS NAVIGATION SIGNAL MULTIPATH INTERFERENCE
by
Ted A. McWhorter
MSEE, The Ohio State University, 1976
A Creative Investigation submitted to the Graduate Faculty of the
University of Colorado at Colorado Springs
in partial fulfillment of the
requirements for the degree of
Master of Engineering Space Operations
Department of Mechanical and Aerospace Engineering
Fall 2002

This material is a work of the U. S. Government and is not subject to copyright protection in the United States.
Reference herein to any specific commercial product, process, or service by trade name, trademark, manufacturer, or otherwise, does not constitute or imply its endorsement by the United States Government or the author.
The views expressed in this presentation are those of the author and do not necessarily reflect the official policy or position of the Air Force, the Department of Defence or the U.S. Government. The author assumes no liability in the use of this information.
iii
McWhorter, Ted A. (M.S., EE)
GPS Navigation Signal Multipath Interference
Creative Investigation directed by Senior Instructor Dr. Robert Rappold
The GPS monitor station antenna at Cape Canaveral exhibits multipath
interference. This interference is directionally dependent and continues
unabated in spite of having cut foliage and trees in the predominant signal paths.
The base antenna location is below the height of the nearby tree line and is in the
vicinity of numerous potentially reflective structures. This investigation
attempts to show potential causes of the interference. Antenna relocation
possibilities are entertained to reduce or eliminate the interference.
A recently developed multipath meter is used to take measurements.
NovAtel Inc. implemented a Multipath Meter (MPM) feature within the
Multipath Estimation Delay Lock Loop (MEDLL) portion of Wide Area
Augmentation System (WAAS) type receivers. The MPM outputs data that
describes the multipath environment that an antenna is experiencing. It uses
NovAtel's MEDLL technology that is able to model and remove multipath
signals from the direct signal. MEDLL generates enough information to calculate
residuals from the modeling process and outputs them in a standard log format,
along with multipath amplitude, delay and phase for each satellite signal
currently being tracked. This data is tracked every second.

iv
The MEDLL receiver uses narrow code correlators and maximum
likelihood estimation to resolve direct and indirect signal phenomenon as well as
a unique software package to easily gather and analyze the resulting data. In the
case of the Cape Canaveral Monitor Station antenna, comparisons at three
locations (base, high, and remote) will indicate factors leading to reduced
interference. Reduced interference is important since the Cape Canaveral
Monitor Station can be used as an input to the GPS control system’s satellite
position estimates. This, in turn, can affect the GPS user’s navigation
performance.

v
Table of Contents
CHAPTER I INTRODUCTION.......................................................................................1 GPS System Background .........................................................................................1 Typical Multipath Calculation Method.................................................................2 Multipath Rejection and Restriction......................................................................4 Antenna Characteristics...........................................................................................5 Purpose.......................................................................................................................9
CHAPTER II MULTIPATH ESTIMATING DELAY-LOCK-LOOP.........................10 Multipath Model.....................................................................................................10 Correlation Characteristics....................................................................................12 Effectiveness............................................................................................................14
CHAPTER III DATA COLLECTION AND ANALYSIS TOOLS.............................17 Satellite Geometry ..................................................................................................17 Hardware Details....................................................................................................21 Analysis Software ...................................................................................................24 Site Layout...............................................................................................................25
CHAPTER IV MULTIPATH MEASUREMENT RESULTS.......................................29 Overview..................................................................................................................29 Selected Cases .........................................................................................................35 Summary and Conclusions ...................................................................................49
Appendix..........................................................................................................................51
Works Cited .....................................................................................................................54

vi
TABLE OF FIGURES
Figure 1. Multipath for AOA equipment with SV25 ...................................................3
Figure 2. Choke Ring Antenna ........................................................................................6
Figure 3. Antenna Element Without Choke Ring.........................................................7
Figure 4. Antenna Element With Choke Ring ..............................................................8
Figure 5. Standard Monitor Station Antenna................................................................8
Figure 6. Multipath Model............................................................................................11
Figure 7. Multipath Fading............................................................................................11
Figure 8. Early Late Slope Technique...........................................................................12
Figure 9. Multiple Correlator Sampling.......................................................................13
Figure 10. Theoretical pseudorange error for MEDLL..............................................15
Figure 11. Code Minus Carrier Multipath...................................................................15
Figure 12. Base Start and End Sky Views ....................................................................18
Figure 13. High Start and End Sky Views ...................................................................19
Figure 14. Remote Start and End Sky Views...............................................................20
Figure 15. Equipment Arrangement.............................................................................22
Figure 16. Base Location Showing Operational and Test Antenna .........................22
Figure 17. High Location View With Insert ................................................................23
Figure 18. Remote Location View.................................................................................24
Figure 19. Base Site Layout (TSTS Site Plan)...............................................................26
Figure 20. Base Aerial Layout........................................................................................28
Figure 21. Remote Aerial Layout..................................................................................28

vii
Figure 22. Minimum D/U and D/U (Average) Plots for Base, High, Remote......31
Figure 23. Base and High Difference, Region of Interest ..........................................32
Figure 24. Base and Remote Difference, Region of Interest......................................33
Figure 25. Maximum PS Error (Average) and PS Error for Base, High, Remote...34
Figure 26. Selected Case PRN 02 Base, High Elevation.............................................37
Figure 27. Selected Case PRN 29 Base, Low Elevation..............................................38
Figure 28. Selected Case PRN 07 Base, Low Elevation..............................................40
Figure 29. Selected Case PRN 06 Base, Low Elevation..............................................42
Figure 30. Selected Case PRN 06 High, Low Elevation.............................................43
Figure 31. Selected Case PRN 06 Remote, Low Elevation........................................44
Figure 32. Compare D/U for PRN 06 Base and High, Same Trajectory.................45
Figure 33. Compare PS Error for PRN 06 Base and High, Same Trajectory...........46
Figure 34. Compare Elevation for PRN 06 Base and High, Same Trajectory.........46
Figure 35. Compare D/U for PRN 06 Remote and High, Same Trajectory............47
Figure 36. Compare PS Error for PRN 06 Remote and High, Same Trajectory .....48
Figure 37. Compare Elevation for PRN 06 Remote and High, Same Trajectory ...49
Figure 38. Base Individual Minimum D/U Plots.......................................................51
Figure 39. Visibility Timeline Base...............................................................................52
Figure 40. Visibility Timeline High ..............................................................................52
Figure 41. Visibility Timeline Remote ..........................................................................53
Figure 42. Source of Remote Singular Multipath Event: Aircraft ............................53

1
CHAPTER I
INTRODUCTION
GPS System Background
The Global Positioning System (GPS) provides space-based radio
positioning, time transfer, and nuclear detonation detection functions. The GPS
is composed of four segments: Space, Control, Navigation User, and Nuclear
Detection. The Control segment’s primary elements are a Master Control Station
(MCS), five Monitor Stations (MS), and three Ground Antennas (GA). (United
States, 1995) Monitor Stations are spread geographically throughout the world
to receive radio frequency signals from Space segment satellites. Each MS
collects satellite tracking and status data and local meteorological data and
forwards this data to the MCS. The GPS system uses “pseudorange and
accumulated delta range∗ tracking data to simultaneously compute precise
ephemeris and clock state estimates and to compute predictions for all GPS
operational satellites.” (United States, 1989) Clearly, the overall GPS system
depends on Monitor Station tracking data that is free of uncorrelated errors that
cannot be estimated or otherwise reduced in a Kalman filter. One such source of
tracking data error that may exist in the system is a phenomenon known as
“multipath interference.”
∗ Pseudorange is defined to be the time difference between the epoch of the received satellite
pseudorandom code and a locally generated epoch. Accumulated delta range is defined to be the
accumulated phase of the signal carrier sampled at the code epoch.

2
Multipath is a condition such that a radio frequency signal arrives at the
receiving antenna from more than one propagation route. The effect of
multipath is to skew and bias the ranging measurement. (Command Descriptions
Manual, 2001) Multipath phenomenon has been suspected at both the Cape
Canaveral Monitor Station and the Colorado Springs Monitor Station, based on
pseudorange residual data. Problems at these two sites appear to involve line-
of-sight obscura impairments as well as multipath interference. (United States,
2001)
Typical Multipath Calculation Method
The typical method for computing multipath effects is based on data from
both the code and carrier tracking loops. Multipath has previously been
estimated by examining carrier phases at both L1 (1575 MHz) and L2 (1227 MHz)
frequencies and noting the corresponding pseudorange. Thus, the following
equations, where 1p is pseudorange, have been applied:
( ) ( ) 2111 12
121 Φ−+Φ−+−= ααpMP
2
2
1
= f
fα where 57542.11 =f GHZ; 2276.12 =f GHz
1903.01 =λ m; 2442.02 =λ m; 111 Lλ=Φ (cycles); 222 Lλ=Φ (cycles)
This calculated multipath data has “a combination of low frequency change due
to multipath and high frequency change due to receiver measurement noise” as
shown in Fig. 1. According to this data, multipath variation is “around 3
minutes in period.” (Allen Osborne and STI/VEGA)

3
Figure 1. Multipath for AOA equipment with SV25
Sam Storm van Leeuwen summarized traditional multipath calculations
in the following way:
1. Collect pseudoranges and carrier phases for several hours until the full range
of satellite elevations has been covered.
2. Convert pseudoranges and carrier phases to units of length (i.e., multiply
carrier cycles by speed of light and divide by carrier frequency)
3. Subtract carrier range from pseudorange for each satellite measurement.
Common errors will cancel and only ionospheric, pseudorange multipath,
carrier phase multipath, noise terms, and carrier phase ambiguity remain.
4. Fit a second order polynomial to the resulting data and subtract it from the
data to retain primarily pseudorange multipath and some noise terms.

4
5. At the average elevation over the 15 to 20 minute interval, determine
standard deviation of residuals and subtract the pseudorange noise
contribution using 22noiseresidualmultipath SSS −= .
Multipath Rejection and Restriction
Research into the specifications shows that the topic is presented in
paragraph 3.4.1.2.2, Multipath Rejection, in the Monitor Station prime item
specification. The specification requires multipath rejection of greater than 14db
at all Monitor Stations except the Cape Canaveral Monitor Station “where it shall
be 8db at elevation angles of less than minus 15°.” Paragraph 3.4.1.2.6, MS
antenna element receiving antenna function, provides further information to
require greater than or equal to 8 db at all elevation angles less than or equal to
-15° and greater than or equal to 2db at elevation angles less than or equal to -5°.
(United States, 1980)
The Monitor Station data is restricted in terms of its use. Per the
specification, paragraph 6.2.3, Monitor Station elevation mask, satellites will be
tracked above 5° elevation for the purpose of assuring performance and
navigation service integrity. In terms of using the data for navigation
computations, the specification says:
System error analysis has indicated that data below 15 degrees
adds no significant information to the estimation of ephemeris,
clock, and troposphere state parameters. This is due to the large
5
troposphere component of measurement error encountered near
the horizon which is correlated over the smoothing interval.
Therefore, with realistic a priori measurement error profiles, the
Kalman estimation filter will utilize only that data collected above
15 degree elevations, and the precision corrections (i.e.,
troposphere) are of CS [Control Segment] performance interest at
15 degrees and above. (United States, 1980)
The Monitor Station specification for multipath rejection reads as a
requirement only on antenna gain pattern below the horizon. The processing
restriction for use in navigation computations limits the lowest elevation angle to
15°. However, data base changes have been incorporated into the system,
without changing the specifications, so that the current limits are different. In
fact, data from all Monitor Stations, except Cape Canaveral, are incorporated into
the Kalman filter at 10° elevation and above. The Cape Canaveral Monitor
Station has a limit at 25° because of interference problems. The MCS uses status
data from all stations down to the lowest acquisition or tracking elevation, which
can be below the horizon. (P.J. Mendicki) The question is, “Is there a reasonable
way to mitigate multipath effects at Cape Canaveral so that its limit can be
changed from 25° to 10°?”
Antenna Characteristics
The Cape Canaveral Monitor Station was originally a dedicated test
station and, as such, was not built with the same operational Monitor Station

6
antenna or receiver used at the other sites. However, in 1998, the site was
upgraded with a new AOA receiver and antenna. The new receiver is the same
that will be used in the other stations operationally, but the antenna is not. By
the late-1990s, the Cape Canaveral Monitor Station was used as a test asset to
support major new developments in the system, but it periodically returns to
operational use, for short periods, when live operational test needs dictate.
(Hermanson) Over the years, at least two different antennas have been used at
the site. The current antenna is a choke ring design intended to minimize
multipath interference.
Figure 2. Choke Ring Antenna
Generic antenna elements of this type are designed with broadband
radiating elements and a quadrature feed network. The broadband element
allows the antenna to provide continuous coverage from L1 (1560 to 1590 MHz)
to L2 (1212 to 1242 MHz) frequencies without regard for operating temperature.
The quadrature feed network has characteristics providing excellent circular
7
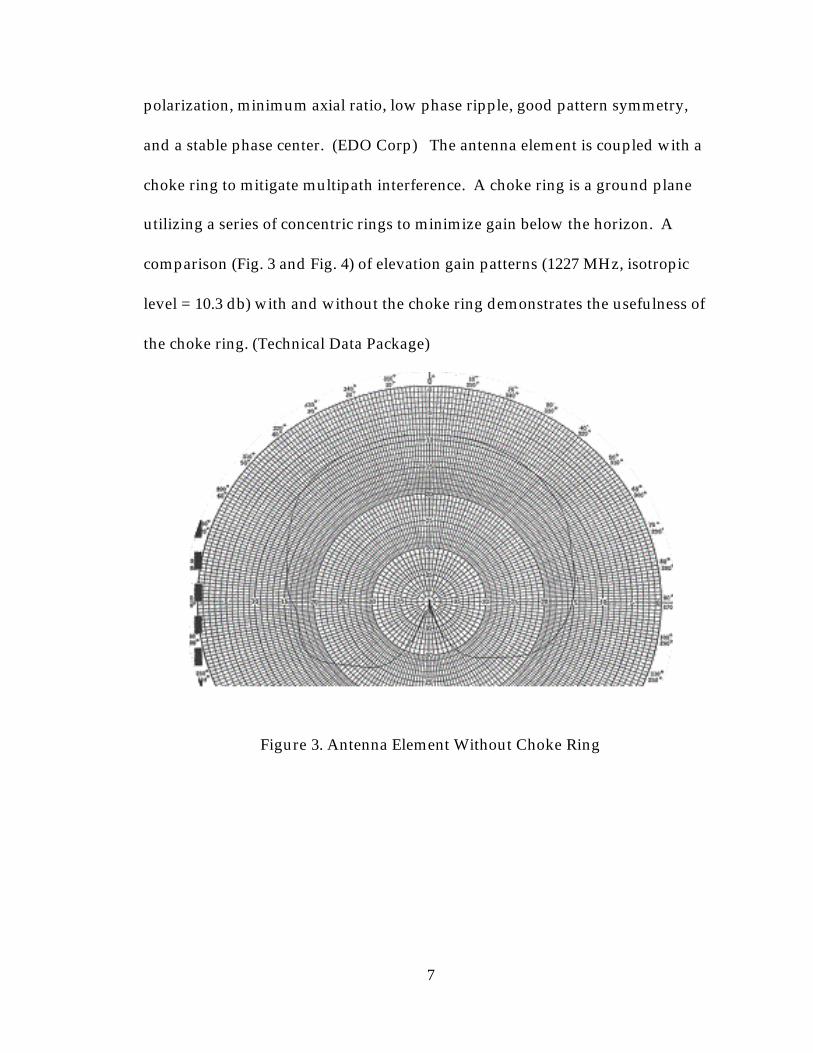
polarization, minimum axial ratio, low phase ripple, good pattern symmetry,
and a stable phase center. (EDO Corp) The antenna element is coupled with a
choke ring to mitigate multipath interference. A choke ring is a ground plane
utilizing a series of concentric rings to minimize gain below the horizon. A
comparison (Fig. 3 and Fig. 4) of elevation gain patterns (1227 MHz, isotropic
level = 10.3 db) with and without the choke ring demonstrates the usefulness of
the choke ring. (Technical Data Package)
Figure 3. Antenna Element Without Choke Ring

8
Figure 4. Antenna Element With Choke Ring
The choke ring has a diameter of 15 inches in comparison to the approximately
60-inch diameter ground plane at the other Monitor Station sites. The standard
antenna at other sites is shown in Fig. 5.
Figure 5. Standard Monitor Station Antenna

9
Purpose
This paper focuses on multipath interference characteristics at Cape
Canaveral Monitor Station using a previously unused technique to measure
multipath directly. The measurement uses a separate but identical antenna
element and choke ring (AOA antenna) and separate Novatel Multipath
Estimating Delay-Lock-Loop (MEDLL) receiver. No test or operational assets at
Cape Canaveral are used.
This investigation examines antenna location as a principle means of
minimizing multipath interference. To that end, the measurement plan is to
collect data at the base location (as near to the current operational antenna as is
reasonable), at a high location directly above the base location, and at a remote
location in a clear area at the same height as the operational antenna. This
combination allows the base multipath environment to be measured as well as
allowing a measure of how greater height can minimize multipath. The remote
location allows a verification of what a “no multipath” environment should look
like in this area. “To combat multipath, antenna siting is of prime importance.”
(Kaplan, 259)

10
CHAPTER II
MULTIPATH ESTIMATING DELAY-LOCK-LOOP
Multipath Model
Novatel’s MEDLL receiver accomplishes real-time signal quality
monitoring, including an indication of multipath interference, by separating
received signals into the line-of-sight and multipath (reflected) components. The
key parameters are delay, relative amplitude, and phase of the multipath signal,
along with the residual values for each correlator used for multipath estimation.
(Townsend, 2002)
Bryan Townsend describes some important characteristics of multipath,
which is the basis for multipath measurement:
a. The multipath signal will always arrive after the direct path
signal because it must travel a longer distance over the
propagation path.
b. The multipath signal will normally be weaker than the direct
path signal since some signal power will be lost from the
reflection.
c. If the delay of the multipath is less than two PRN code chip
lengths, the internally generated receiver signal will partially
correlate with it. If the delay is greater than 2 chips the
correlation power will be negligible.

11
J. M. Kelly and M. S. Braasch at Ohio University considered a similar
model for multipath. They recognized that the increased precision of GPS could
make uncorrelated errors, such as multipath, significant. A range bias will exist
in the widely used code tracking method in the presence of fast fading multipath
signals∗. As shown in Figure 6, fading of multipath will cause a shifted, scaled
autocorrelation lobe to fade in and out of phase with respect to the direct lobe.
(J.M. Kelly)
Figure 6. Multipath Model
Kelly quantified multipath fading through simulation as follows:
Figure 7. Multipath Fading
∗ Fading refers to the bandwidth of the spectral components that are dependent on angular
frequency of the direct signal and the phase rate of the reflections.

12
Typical receivers use early-late slope detection as follows:
Figure 8. Early Late Slope Technique
Pseudorange is measured as the time shift required to align the internally
generated signal with the IF signal, scaled by the speed of light. Three replica
codes are used for the correlation purposes: one is directly aligned with the IF
signal (punctual), one is delayed (late) and one is advanced (early). The early and
late codes lay on the slope of the autocorrelation function either side of the peak
and are used to aid the continuous tracking of the code, and to reduce the
tracking error. Two or three correlators may be used in a typical receiver.
Correlation Characteristics
Townsend uses this same model, based on his important characteristics, in
expressing the basis for MEDLL technology. He focuses on the question of
whether the direct and indirect components can be reasonably measured and/or
determined. A multipath free reference function is subtracted from the observed
correlation function to leave multipath and noise. An estimate is made of most
likely multipath delay, phase, and amplitude. A correlation function based on

13
those estimates is then subtracted from the function used to make the estimate.
The sum of the squares of the correlator values generates multipath residuals.
(Jakab)
Modern digital correlators are relatively inexpensive so that many
correlators can be used to improve performance. (Kaplan, 150) MEDLL
dedicates 10 or more correlators to each channel as shown in Figure 9.
(Townsend, 1995)
Figure 9. Multiple Correlator Sampling
The procedure depends on describing the signal at the input of the
receiver as:
∑=
++−=M
mmmm tnttpar
0
)()cos()( θωτ where
M = number of signals
t = time

14
p(t) = spread-spectrum code
n(t) = noise
ma = component signal amplitude
mτ = component signal delay
mθ = component signal phase (Townsend, 2001)
The MEDLL receiver computes the multipath estimation several times within a
second and outputs the data once a second for all satellites in view. Since the
measurement technique does not depend on code minus carrier techniques, only
the L1 C/A code is used.
Effectiveness
Townsend shows the effectiveness of this technique by simulating the
relationship between pseudorange error and multipath delay. In the following
plot, the multipath amplitude is 0.5 of the direct amplitude.

15
Figure 10. Theoretical pseudorange error for MEDLL
In comparison, similar results are obtained for the code minus carrier multipath
simulation in Figure 11. (Townsend, 2000)
Figure 11. Code Minus Carrier Multipath

16
Multipath power can be taken from this data in terms of the ratio of
desired signal power over undesired signal power (D/U), expressed in decibels.
It should be clear that the computed parameters of multipath delay, amplitude,
and phase can only be useful when there is an appreciable loss of D/U level (that
is, a significant multipath component exists). The point to observe is that
MEDLL can make good estimates of multipath down to about 0.2 chip delay.
(Townsend, 2000)

17
CHAPTER III
DATA COLLECTION AND ANALYSIS TOOLS
Satellite Geometry
The data collection plan for this effort requires that a reasonably complete
set of satellite visibility angles be obtained. Ideally, a complete set of all unique
trajectories for all satellites should be obtained. Such a set would require about
24 hours of data collection for each measurement location. Another 24 hours for
each location would be needed if the original measurement were to be verified to
assure the best possible measurement accuracy. (Jaksic) In this case, 144 hours
would be needed for the three locations (base, high, and remote). A reasonable
time frame was developed since resources did not permit such an extensive
collection effort. An approximate twelve-hour period provides one orbit
revolution of the constellation and would be the minimum needed to represent
each satellite. The criteria used here is to obtain close to the 24-hour period
subject to time constraints. About 21 hours, on average, of data was collected for
each location.
As shown in Figures 12, 13, and 14, the sky views (orientation is as if you
are looking skyward from the site) show the satellite positions at start and end
times, as well as trajectories, during the data collection effort for each location.
The plot is scaled in terms of azimuth and elevation. This collection should
provide a reasonably complete survey of multipath reflection possibilities. Refer
to the Appendix for calculated individual satellite visibility timelines.

18
Figure 12. Base Start and End Sky Views

19
Figure 13. High Start and End Sky Views

20
Figure 14. Remote Start and End Sky Views

21
Hardware Details
The two primary hardware items are the AOA antenna and the NovAtel
MEDLL receiver. Since the equipment was to be located at three different
locations and elevated to a maximum of 43 feet, the package needed to be
relatively self-contained with minimum teardown and reassembly. Figure 15
shows the antenna and receiver package as one assembly. The left view shows
the overall package and subsequent views show details of the package. When
mounted on the boom lift, as shown in Figures 16, 17, and 18, the package is
highly mobile and capable of quick repositioning with no teardown. The
package is connected by cabling to ground based computer (115 KBPS serial
link), TV monitor (coax cable), and 115-volt power (extension cord). A 100-foot
fiberglass tape measure was attached to bottom of the boom lift to determine
height above ground (the antenna base is the reference point).
The current antenna is mounted on the side of a building at 13 feet above
ground. So the base measurement antenna and the remote measurement
antenna are at the same height. The high measurement antenna height is 43 feet.
The boom lift package was wrapped and sealed in plastic to protect the
equipment from rain.
The equipment package includes a video camera focused on a bubble level
so that the antenna can be assured of being level (the boom lift has a self leveling
control feature for the platform in one axis). The bubble level has reticules at one
and two degrees. In practice, if the platform is leveled in the ground position, it

22
maintains near level conditions as it is raised. Unfortunately, the tests were
conducted during high ambient temperatures that, in combination with the
enclosing plastic wrap, rendered the video camera inoperative. No confirmation
of correct leveling during test periods was possible.
Figure 15. Equipment Arrangement
Figure 16. Base Location Showing Operational and Test Antenna

23
Figure 17. High Location View With Insert

24
Figure 18. Remote Location View
Analysis Software
NovAtel’s Multipath Assessment Tool (MAT) is a Windows based
program to collect and display multipath parameters, including signal and
satellite information. The software accepts and stores real-time data from the
serial port of a WAAS-type (Wide Area Augmentation System) MEDLL receiver.
MAT provides several tools to aid multipath analysis, ranging from top-level
“data-consolidation” plots to detail signal plots. (MAT User Manual)
Top level plots show average multipath power and pseudorange error
parameters in polar plot azimuth-elevation form. The average value is color
coded to scale and the azimuth-elevation cells represent the general location of
the satellites. Minimum multipath power and maximum pseudorange error can
also be shown in this same form. Such plots allow the entire set of data to be

25
viewed to quickly identify and isolate multipath problems. Signal plots and
histograms allow more specific problem analysis.
Specific signal plots are available for multipath strength, phase, delay, and
residuals as well as pseudorange error and signal-to-noise ratio. Satellite
azimuth and elevation plots complete the picture.
Histograms are available to show statistical results for all the primary
parameters. Although no histograms are used here, they can help group
characteristics and show trends.
Site Layout
Figure 19 shows the site layout with bearings centered on the test antenna
for base and high cases. The top-level polar plots from MAT can be related to the
bearing shown in the site layout and aerial photographs. For example, if the
minimum multipath D/U polar plot shows a significant multipath signal from a
satellite at a bearing of 135°, a probability is that a reflecting surface lies along the
line of this bearing. Thus, although there are no satellites to the North at
sufficiently low elevations to be concerned about multipath, it does not mean
that reflectors to the North can’t be sources of multipath. It should be
understood that this measurement equipment has no means of detecting
direction of the multipath signal. We safely assume the direct signal is line-of-
sight between the antenna and the satellite and the reflected signal may take any
path or direction relative to the antenna, except the direct path.

26
Figure 19. Base Site Layout (TSTS Site Plan)
Figure 19 shows the base layout with several structures in the vicinity of
the test antenna. Since the height of the antenna is 13 feet, many of the
surrounding surfaces are close to or above the zero elevation horizon of the
antenna. A sample list of above-horizon potential reflectors in the vicinity is:
• 28 foot diameter S-band antenna at 350° • 2 large metal ventilation ducts on the roof at 10° • 75 foot microwave tower at 243° • 15 foot diameter communication antenna at 280° • 25 foot tree line to the south

27
By elevating the antenna thirty feet above the base measurement case, the high
measurement antenna is positioned so that many of these same potential
reflectors are at much lower elevation angles relative to the antenna.
Figures 20 and 21 show aerial views at the measurement sites. The
purpose of these figures is to ensure that the environment around the
measurement location is fully considered. With these figures, we can see beyond
the immediate tree line and account for objects not directly visible from the test
site. For example, Figure 20 shows a large three-story hangar building at just
over 200 meters on a bearing of 130° relative to the test antenna. It also shows
how close the tree line, particularly to the south, is to the antenna location.
Figure 21 shows the remote location and shows that location relative to the base
location. Small one-story buildings are over 200 meters away at bearings of 20°
and 160° from the remote antenna location.
In summary, the base test location is used to assess the multipath
environment near the operational antenna. The high test location is used to
assess the mitigation effects of lowering the elevation angles of potential
reflectors relative to the antenna. The remote test location is used to assess a
clear field situation and to provide a relative measure to compare with the other
two cases.

28
Figure 20. Base Aerial Layout
Figure 21. Remote Aerial Layout

29
CHAPTER IV
MULTIPATH MEASUREMENT RESULTS
Overview
Figure 22 presents the top-level “big picture” results for all testing. The
figure summarizes minimum D/U and average D/U for each test case.
Inspection shows immediately that the base case has some multipath
interference, while the high and remote cases are relatively free of multipath
effects. The interest region is along a band from 0° to 25° elevation. In general,
the D/U power in the region is 3 to 6 db lower in the base case compared to
either the high or remote case. Note that the remote case is the “cleanest”
multipath case, as expected. The effect of raising the base antenna to the high
antenna height is reduced multipath, as expected. The remote case shows
several decibels greater D/U power in the interest region compared to the high
case, but, in general, both cases are better than the base case.
Figures 23 and 24 compare the base case to the high case and the remote
case, respectively, by showing differences in power level for D/U and minimum
D/U in the interest region. The comparison plots show a green cell if the
corresponding high or remote cell is 3 db or greater than the corresponding base
cell. Black represents the same level and red indicates -3 db or less. Plots from
Figure 22 are reproduced in these two figures to aid in visual comparison. As
explained, both the high and remote cases show an overall more favorable
multipath situation. The apparent bias in the plots northwest to southeast is

30
likely from inaccuracies in leveling the antenna in the respective test cases.
While this “tilt” is not desirable, it does not obscure the fact that the high and
remote locations are significantly superior.
Figure 25 summarizes maximum pseudorange error and average
pseudorange error for each test case. The indications are similar to the D/U data
with average pseudorange errors for high and remote cases in the 1-meter range.
Maximum pseudorange error for high and remote cases rarely exceed 2 meters.
Conversely, the base case average pseudorange errors reach into the 2-meter
range and maximum pseudorange error is shown as high as 5 meters.
Several azimuths in the base case show significant multipath interference
in the interest region. Strong indications are at 60° to 100° and at 200° to 230°
azimuth. Worst case interference seems to exist near 10° elevation. While there
may be reflectors along these bearings, it is virtually impossible to associate the
data with specific (obvious) reflectors in the area with any certainty. The easterly
indication could be the result of glancing reflections from the building roof in
that direction. The southwesterly indication could be from the 75-foot
microwave tower in that general direction. The southeasterly indication might
be from the distant three-story hangar in that general direction. Since we are not
proposing to remove the reflectors, but, rather, to move the antenna, there is no
compelling reason to try to isolate individual reflectors.

31
Figure 22. Minimum D/U and D/U (Average) Plots for Base, High, Remote

32
Figure 23. Base and High Difference, Region of Interest

33
Figure 24. Base and Remote Difference, Region of Interest

34
Figure 25. Maximum PS Error (Average) and PS Error for Base, High, Remote

35
It is significant to note that there are no major variations showing strong
indications in the interest region of the high case. The remote case shows one
such variation at 130° azimuth, but it is a singular, readily explained exception.
Refer to Figure 42 in the Appendix and Figure 21 to see the likely reflector as a
parked aircraft at this azimuth. Clearly, the base case shows multipath
interference and the high and remote cases show relatively free conditions.
Selected Cases
Figures 22 and 25 provide clues to where further investigation could be
beneficial. For selected strong indications, detail signal plots will show what is
actually occurring. Refer to the Appendix for a breakdown of the minimum
D/U polar plot for each satellite. Each selected case, by individual satellite, will
present a series of eight signal plots: multipath phase, multipath D/U, elevation,
azimuth, carrier noise ratio, pseudorange error, multipath delay, and multipath
residuals.
Phase is the shift between the multipath and direct signal in the range
from -π to +π . Strength is the relative power of the desired signal compared to
the undesired signal, as previously discussed. Carrier noise ratio is carrier to
noise density ratio in dB-Hz. Pseudorange error is an indication of pseudorange
error expressed in meters. Delay is the time delay between multipath and direct
signal expressed in course/acquisition code chips. Residuals provide an
indication of confidence in the multipath strength calculation.

36
First, for comparison sake, Figure 24 shows a high elevation condition
with virtually no multipath. It is presented so that “multipath-free” can be
compared with later multipath indications. Figure 24 shows almost no
pseudorange error and high D/U readings with the satellite near zenith.
Multipath phase tends toward zero, with some noise, since there is not a strong
multipath component. Residuals are low and carrier noise ratio is high.
Strong multipath indications exist for PRN 29 in the easterly direction at
low elevation (see Figure 38). Figure 27 presents the eight-parameter data for
this satellite while the satellite traverses from about 30° to about 5° elevation.
Multipath phase shows a definite pattern intermixed with noise. Multipath D/U
shows a significant multipath component with minimums below 20 db for most
of the excursion below 25° elevation. Carrier noise ratio drops off as elevation
drops, as expected. During the worst-case interval, pseudorange error exceeds 3
meters. This is an example of sustained (7000 seconds) multipath interference in
the easterly direction.

37
Figure 26. Selected Case PRN 02 Base, High Elevation

38
Figure 27. Selected Case PRN 29 Base, Low Elevation

39
Looking in a more westward direction, Figure 28 shows PRN 07 rising
from about 7° elevation at a bearing of 235°. There is an initial strong multipath
component up to about 10° as shown by the low D/U level under 20 db. The
signal continues to exhibit some multipath strength even up to 20° elevation, but
the effect on pseudorange error is generally in the 1-meter range. The multipath
delay plot shows a somewhat different pattern suggesting that the average delay
is mid-range rather than low-range as was the case in Figure 27. Multipath phase
shows a strong pattern. This is an example of sustained (2600 seconds)
multipath interference in the easterly direction.

40
Figure 28. Selected Case PRN 07 Base, Low Elevation

41
Finally, Figure 29 shows PRN 06 with visibility from about 5° to 12°
elevation on the eastern horizon. Multipath indications are very strong with
excursions below 10 db D/U. Multipath phase is a well-defined pattern. Carrier
noise ratio is in the expected range for this elevation. Multipath delay tends
toward the low-range suggesting a relatively close reflector. Pseudorange error
is dramatic as 10° elevation is approached. Multipath residuals are high. This is
a worst-case example of strong multipath interference.
For comparison purposes, PRN 06 is shown in the high test case along this
same trajectory in Figure 30. As expected, the plot shows significantly reduced
multipath effects. Multipath D/U is well above 20 db for the full 7000 seconds.
Carrier noise ratio appears about the same as with the base test case. There is
less of a pattern to the multipath phase and multipath delay is less defined.
Pseudorange error is generally in the 1-meter range with no major excursions.
Multipath residuals are reasonably well contained over the range.
For further comparison, PRN 06 is shown in the remote test case along this
same trajectory in Figure 31. The characteristics are generally the same as for the
high test case shown in Figure 30. This tends to confirm that the base case is
exhibiting multipath interference that is not present in either of the other test
cases.

42
Figure 29. Selected Case PRN 06 Base, Low Elevation

43
Figure 30. Selected Case PRN 06 High, Low Elevation

44
Figure 31. Selected Case PRN 06 Remote, Low Elevation

45
A closer inspection of the specific difference between base and high test
cases is shown in Figure 32 by comparing D/U for base with high. The signal
overlays show that the base case sustains a generally lower D/U level with some
strong lower excursions.
Figure 32. Compare D/U for PRN 06 Base and High, Same Trajectory
Figure 33 performs the same comparison on pseudorange error by
showing the base case excursion generally into the 2 meter range, with peaks as
high as 6, while the high case remains stable in the 1 meter range. Figure 34
shows that the elevation in this comparison was essentially the same for both
base and high cases.

46
Figure 33. Compare PS Error for PRN 06 Base and High, Same Trajectory
Figure 34. Compare Elevation for PRN 06 Base and High, Same Trajectory
47
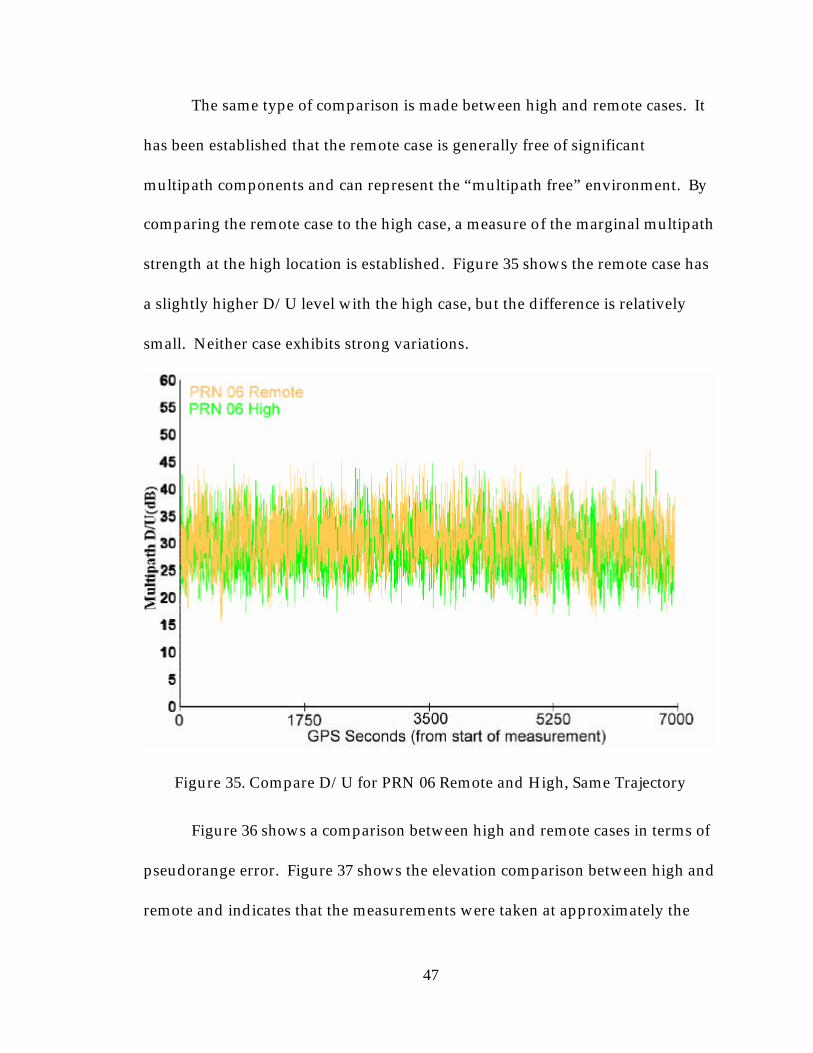
The same type of comparison is made between high and remote cases. It
has been established that the remote case is generally free of significant
multipath components and can represent the “multipath free” environment. By
comparing the remote case to the high case, a measure of the marginal multipath
strength at the high location is established. Figure 35 shows the remote case has
a slightly higher D/U level with the high case, but the difference is relatively
small. Neither case exhibits strong variations.
Figure 35. Compare D/U for PRN 06 Remote and High, Same Trajectory
Figure 36 shows a comparison between high and remote cases in terms of
pseudorange error. Figure 37 shows the elevation comparison between high and
remote and indicates that the measurements were taken at approximately the

48
same elevations. For this worst-case environment for the base test case, these
plots show that the high test case is nearly as multipath-free as the remote case,
either of which has significantly less multipath interference than the base test
case.
Figure 36. Compare PS Error for PRN 06 Remote and High, Same Trajectory

49
Figure 37. Compare Elevation for PRN 06 Remote and High, Same Trajectory
Summary and Conclusions
This paper has reviewed the unique environment of the Cape Canaveral
Monitor Station by describing how its equipment is different than other such
stations and by identifying potential multipath reflectors surrounding this
antenna. The unique multipath measurement technique of the Novatel receiver
and software was presented to show that a credible “full scope” analysis of
multipath was undertaken. The measurement results at three specific locations
have been thoroughly reviewed and differences noted.
The data shows that the best solution to reduce or remove multipath
effects would be to move the antenna to a remote location. If that were not
practical from a cost or technical viewpoint, then a good alternative would be to

50
elevate the antenna well above the surrounding potential reflectors. In this case,
all significant multipath effects would be removed. Either solution should allow
the Cape Canaveral Monitor Station to provide data suitable for use in the
Master Control Station in the same manner as other monitor stations.

Appendix
Figure 38. Base Individual Minimum D/U Plots

Figure 39. Visibility Timeline Base
Figure 40. Visibility Timeline High

Figure 41. Visibility Timeline Remote
Figure 42. Source of Remote Singular Multipath Event: Aircraft

Works Cited
Allen Osborne and STI/VEGA Receiver and Antenna Comparison. Unpublished
Technical Report
Command Descriptions Manual: Millennium GPSCard Software. Versions 4.503
and 4.52, OM-20000053. Novatel, Inc., Calgary. 2001.
EDO Corp Home Page. "DM C146 Series GPS Antenna." EDO Corp. 7 June 2002
<http://www.nycedo.com/edocorp/page9b_c146-10.pdf>.
Hermanson, John (GPS Remote Site Logistics Manager). Personal interview. 12
June 2002.
Jakab, Andy (NovAtel Systems Engineer). "MEDLL Receiver." E-mail to author.
19 June 2002.
Jaksic, Joe (NavCanada WAAS Site Survey Manager). "NovAtel Multipath
Measurements." E-mail to author. 4 February 2002.
Kaplan, Elliott D., ed. Understanding GPS: principles and applications.
Norwood, MA: ARTECH House, 1996.
Kelly, J. M., Braasch, M. S.. "Mitigation of GPS Multipath via Exploitation of
Signal Dynamics." Ohio University. 28-30 June 1999. Avionics
Engineering Center. 3 June 2002
<http://plato.phy.ohiou.edu/~kelly/JUP/>.
Mendicki, P.J. (Aerospace Navigation Analyst). Telephone Interview. 12 June
2002.

Multipath Assessment Tool (MAT) User Manual. OM-20000054 Rev 2. NovAtel,
Inc., Calgary. 2001.
Storm van Leeuwen, Sam, "Sam's GPS Software pages." Internet posting. 11 June
2002 <http://home-2.worldonline.nl/~samsvl/multipat.htm>.
Technical Data Package DM U305- Choke Ring. Brochure, D&M Engineering
First Article Report 6383.5. EDO Corp., New York. 1990.
Townsend, B., Wiebe J., Jakab A. Novatel Inc. "Results and Analysis of Using the
MEDLL Receiver as a Multipath Meter." Novatel Inc. 12 June 2002
<http://www.novatel.com/Documents/Papers/File49.pdf>.
Townsend, B., Wiebe, J., Jakab, A., et. al. Novatel, Inc. "Analysis of the Multipath
Meter Performance in Environments with Multiple Interferers." 20-22 Sept
2000. Novatel, Inc. 3 June 2002
<http://www.novatel.com/Documents/Papers/File50.pdf>.
TSTS Site Plan. Drawing 383904. The Charles Stark Draper Laboratory, Inc.,
Cambridge. 10 March 1998.
United States. Space and Missile System Center. Cape Monitor Station Obscura
Report. Gaithersburg: Lockheed Martin MDS, 21 Dec 2001.
---. Space and Missile Systems Center. System Segment Specification for the
Operational Control System Segment of the NAVSTAR Global Positioning
System. SS-CS-300A. El Segundo: SMC/CZ, 6 Jan 1989.

---. Space and Missile Systems Center. System Specification for the NAVSTAR
Global Positioning System. SS-GPS-300E. El Segundo: SMC/CZ, 30 Jan
1995.
---. Space and Missiles System Center. Prime Item Product Function Specification
for the Monitor Station. By James W. Reynolds (authenticator). CI-MS-330.
El Segundo: SMC/CZ, 1980.

Author Note
The author wishes to thank Andy Jakab, Kent Banks, Scott Taylor, and
Mike Morgan for their support in reviewing draft manuscripts. Also, thanks go
to John Hermanson for his support in the field work and in reviewing draft
manuscripts.