Embed Size (px)
Citation preview
IOSR Journal of Environmental Science, Toxicology and Food Technology (IOSR-JESTFT)
e-ISSN: 2319-2402,p- ISSN: 2319-2399.Volume 10, Issue 10 Ver. I (Oct. 2016), PP 75-86
www.iosrjournals.org
DOI: 10.9790/2402-1010017586 www.iosrjournals.org 75 | Page
GPS & GIS In Road Accident Mapping And Emergency
Response Management
Evangeline Muthoni Njeru1, Andrew Imwati
1
1Jomo Kenyatta University of Agriculture and technology, Department of Geomatic Engineering
and Geospatial Information Systems
Abstract: Road accidents is a major cause of mortality worldwide with urgent action required to mitigate
against the negative impacts. A comprehensive accident recording and analysis system can provide a GIS-
based solution for control and management of accident events as a real-time monitoring system. This paper
presents a GIS approach to road accident management based on spatial autocorrelation. It goes further to
analyzing the spatial viability of emergency services offered to the accident victims. The study starts with the
identification of the accident prone zones along Waiyaki Way in Nairobi, Kenya using GPS and GIS. For this
purpose, the road accident data for the years 2013, 2014 and 2015 pertaining to Waiyaki Way was obtained
from the traffic police department and used for analysis. Accident particulars like date, location, number of
victims (fatal, serious and slight injuries), classes of victims (drivers, motor cyclists, pedal cyclists, passengers,
pedestrians) were included in the GIS database. The “Density” function available in the spatial analyst
extension of the Arc GIS software was applied to identify the accident prone areas during the years 2013, 2014
and 2015. Assessment of spatial clustering of accidents and hotspots spatial densities was carried out following
Moran‟s I method of spatial autocorrelation, and point Kernel density functions. An effort was made to develop
a comprehensive accident information management system that can provide a GIS-based solution for control
and management of accident events. This system will inform clients about accident locations, accident and
service diagnosis, reducing the number of accidents based on the accident reports thus increasing the level of
road safety and fast delivery of emergency services.
Keywords; Accidents, GIS, AIMS
I. Introduction According to the WHO, over 1.2 million people die each year due to road accidents, with about 20 and
50 million suffering from non-fatal injuries. More damning and intriguing is that despite the increasing
sensitization on roads safety worldwide, the epidemic of road accidents is still on the rise. In the last five years
alone, most countries adopted the WHO report on the road safety guidelines(WHO 2009). But there are still
increasing trends of road accidents. Urgent action is needed to achieve the ambitious target for road safety
reflected in the newly adopted 2030 Agenda for Sustainable Development, of reducing by half the global
number of deaths and injuries from road traffic crashes by 2020(Lagarde 2007).
African countries especially those in the East African region have some of the worst rates and
incidences of road accidents(Odero et al. 1997). Kenya alone has approximately 29.1 deaths per 100,000
people(Muchene 2014). This is among the worst 20 in the world with traffic accidents in the country leading to
more deaths that the endemic malaria. Kenyan government has spent millions of money in order to reduce the
number of accident occurrence through several modes of campaign. Unfortunately, the number keeps
increasing. An effective accident management tool and model is therefore required to help manage accidents
and mitigate against its negative influences (Manyara 2015).
This paper presents a GIS approach that can be used for the management of road accidents in Nairobi,
Kenya such as the one presented in(Rudtanasudjatum 2008). GIS has wide applications including health
(Alegana et al. 2014), climate (Ouma et al. 2016), transportation(Nagne and Gawali 2013), forestry among
others. We intend to harness some of these capabilities in the area of accident management systems. The spatial
viability of the emergency services to common accident hotspots is also assessed. Accident hotspots along one
of Kenya‟s busy highways i.e. Waiyaki way are defined from existing traffic databases. In our analysis, road
accidents data for the years 2013, 2014 and 2015 are obtained from the traffic police department. Accident
particulars like date, location, number of victims (fatal, serious and slight injuries), classes of victims (drivers,
motor cyclists, pedal cyclists, passengers, pedestrians) were included in the GIS database. The “Density”
function available in the spatial analyst extension of the Arc GIS software was applied to identify the accident
prone areas during the years 2013, 2014 and 2015. Both simple and Kernel densities was applied in identifying
the accident patterns.
GPS & GIS in road accident mapping and emergency response management
DOI: 10.9790/2402-1010017586 www.iosrjournals.org 76 | Page
II. Methods Data and sources
Accident data was sourced from the Kenya Police Traffic Crash Reports (TCR) for 2013, 2014 and
2015. The reports are compiled by the Kenya police on the daily accident occurrences including information on
where the accident occurred, the timing, causes, fatalities, outcomes and whether victims were taken to hospital.
Health facility data was compiled by using two sources that exist for the country. One is health facilities data
from Kenya open data platform which was downloaded on December 2015 at (https://opendata.go.ke). The
second health facility database was obtained from the list compiled by (Noor et al. 2009). The two sources were
cross checked for any inconsistencies especially for the Nairobi area, and one final list of health facilities was
obtained. Information on the level of care and location of the health facilities was also attached to our final file.
Roads data was obtained from the Kenya roads board that maintains the most up to date and current roads
inventory in the country. The data was compiled in 2009 where GPS receivers were used to collect roads data
including the coverage, classes of the roads and conditions. This was deemed more accurate compared to the
openly provided road networks from sources such as open street maps. County boundaries were obtained from
Independent Electoral and Boundaries Commission (IEBC) which is mandated to maintain the boundary data
for the whole country.
Data Cleaning
The road accidents data had inconsistencies in both the attribute and location information. Editing was
therefore done by cross checking the attributes in Microsoft Excel to ensure that all the attributes used were
correct. In addition the latitude and longitude were assigned to each accident location through the process of
geocoding using various online mapping tools such as google maps and open street maps. All vector data (i.e.
line, polygon, point features) contained separate attribute tables. The final accident data contained information
on; Date, Location and time of occurrence, type of accident, type of injury, fatalities, the victims or the actors,
the health facility that responded to the injured parties. Descriptive statistics of data on accidents were produced
using graphs and pie charts as is shown in the results section.
Data Analysis
The road network and crash data were loaded in the ArcGIS 10.1 software program witheach of the
data points representing a single accident location. However there were cases where multiple crashes were
reported to have occurred at the same location such as an intersection or near bus stops. Therefore, the crash
data was aggregated to produce counts for each type of crashes at each location. GIS tools like proximity using
Thiessens polygons and hot spot analysis tools were applied.
GIS Proximity Analysis Defining the coverage or health facility catchment is vital in assessing population movements to health
facilities. Accurate definition of these catchment areas is therefore important when defining targeted
intervention measures. Different methods exists that can be used to define health facility catchment areas. First
and the most accurate is to collect information at each health facility on where patients are coming from termed
the patient flow method. The defined regions where patients come from to visits a certain health facility can then
be approximated to be the catchment area of that facility (Zinszer et al. 2014). Its main disadvantage is however
that the resources and time required to compile such a dataset for all health facilities makes it unfeasible. The
second method is empirical, that involves collecting data on treatment seeking rates at different locations, and
using the assumption that the nearest facilities are the ones used, catchment areas can be defined as is well
documented in (Alegana et al. 2012).Third, there is the use of straight line distances such as Euclidean distances
in GIS to define catchment areas. The disadvantage in this is that it leads to overlaps. These three methods are
however only suitable in rural areas, and less is documented on their usability in urban areas. For urban areas we
propose that Thiessen polygons are the most useful. This is because the tool splits the areas into regions
assigned to each health facilities. Because the connectivity through roads in Nairobi is excellent, we did not
expect much impact of land covers on accessibility. Finally, Voronoi diagrams are easy to generate and can be
very useful tools for defining accessibility (Noor et al. 2006). This tool was used to give useful information of
service areas that each of the health facilities served. This means it is possible to pinpoint the nearest health
facility from an accident scene at a given location. All the health facilities in Nairobi and crash data locations
were used in this proximity analysis. It should be noted that the nearest hospital to an accident scene might not
be the best equipped to handle such cases.
Hotspot Analysis
This involved use of hotspot analysis tool in ARCGIS software. This tool was used to determine the
accident hotspots for pedestrians in the study area.Before this tool was employed on the data, a severity index at
GPS & GIS in road accident mapping and emergency response management
DOI: 10.9790/2402-1010017586 www.iosrjournals.org 77 | Page
each location was computed sinceit is difficult to know whether high or low clustering exists in „unweighted‟
data. Counts of crashes are commonly used to evaluate safety problems at a location. Some experts believe that
the more severe crashes should have greater weights in identifying unsafe locations on the basis of crash costs.
Additionally, results of the crash severity method are sensitive to various weighting systems. According to
(Geurts et al. 2004) there is no consensus on how the optimum weighting system should be developed; a
compromise approach is becoming increasingly popular. The approach is to give weights to the more severe
crashes, but not with the extreme high values computed in direct proportion to the crash costs. In this case, it
was assumed that accidents involving pedestrians, cyclists, motorcyclists, passengers and vehicles higher
weights in the decreasing order and be compounded by the fatality weight to gauge the overall severity of the
accidents. Therefore fatal accidents involving pedestrians assumed the highest weight compared to the accidents
involving vehicles and no fatalities involved. The weighted severity indices attribute was used in the derivation
of the hotspot analysis map to show where more pedestrians related accident cases occurred.
Spatial database creation
The accidents database is a spatial referenced database with all data modeled as spatial objects and
encoded in geospatial format, which stores all accidents related data in a central location, and provides
functionalities to perform spatial query and spatial analysis and integration with other GIS platforms. It allows
for query searches on various accident attributes in real time compared to the traditional accident database
which is a summary spreadsheet format using general well known locations to denote location, type and
severity of accidents.
This was created using Postgres-postgis database management system to assist in future data editing
and implementation of the accidents management system. This provides an easier and free platform to manage
spatial data perform queries, update data and give real time reports. It was also meant to be interfaced with
accident management and monitoring web application that happened to be a side product of this research.From
the databases, it is possible to visualize accident historical trends and to identify and pin point accident-prone
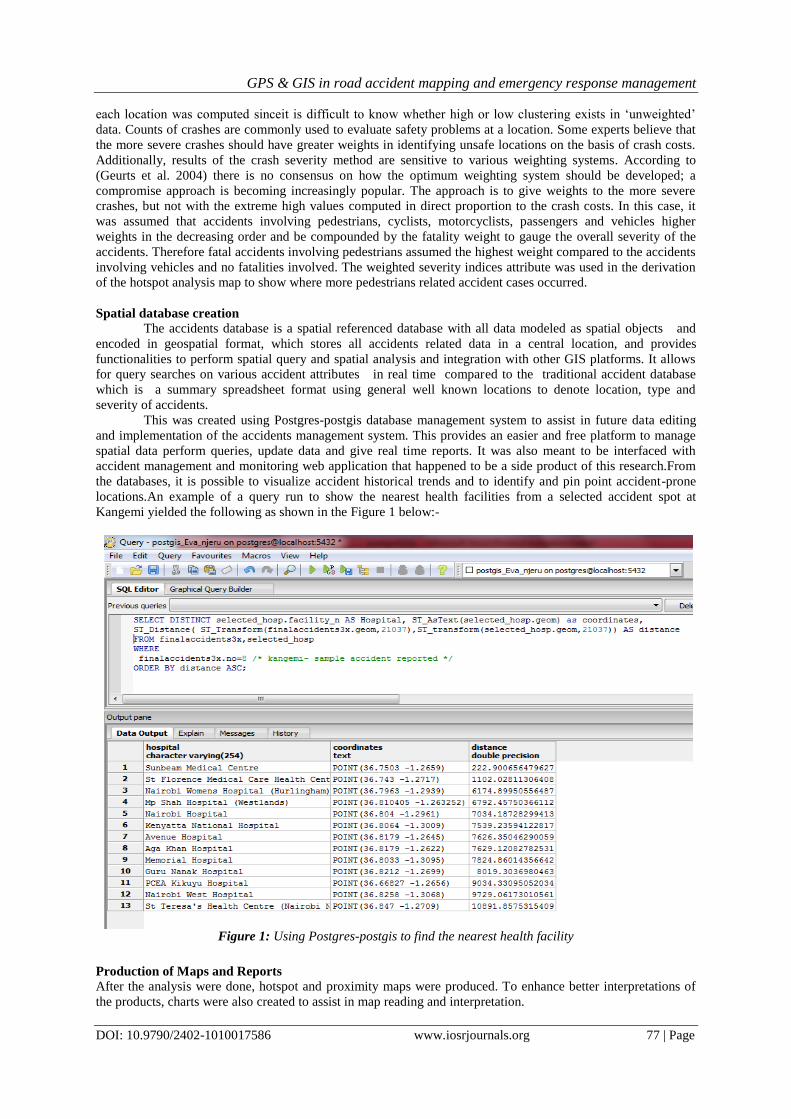
locations.An example of a query run to show the nearest health facilities from a selected accident spot at
Kangemi yielded the following as shown in the Figure 1 below:-
Figure 1: Using Postgres-postgis to find the nearest health facility
Production of Maps and Reports
After the analysis were done, hotspot and proximity maps were produced. To enhance better interpretations of
the products, charts were also created to assist in map reading and interpretation.
GPS & GIS in road accident mapping and emergency response management
DOI: 10.9790/2402-1010017586 www.iosrjournals.org 78 | Page
Development of Accident Information Management System (AIMS)
The Accident database was developed and interfaced with prototype accident information management
system (AIMS). The components of the system are;
Spatial databases: To manage and query data
Web forms: For adding new data and data filtering
Mapping APIs: Leaflet, mapbox (uses javascript to load maps onto the web page)
Server side script: To process request and link postgres to web application
Geojson data format (altenative to KML)
III. Results
It was found that the collected information about the accidents are entered by the attending officer and
stored in the hard-covered books at the police stations. There were no police officers who had specifically been
trained to handle accident data in terms of data entry, processing, analysis and interpretation.Probably the
compromised quality of the data may be attributed to the quality of information collected on particular accident
events and failure to recognize that such information is important for road safety planning and policy
interventions. This results to incomplete and sometimes inaccurate accident data. Another problem of poor data
quality could be due to accidents underreporting and lack of regular updating of the information in the records.
Accidents by Location
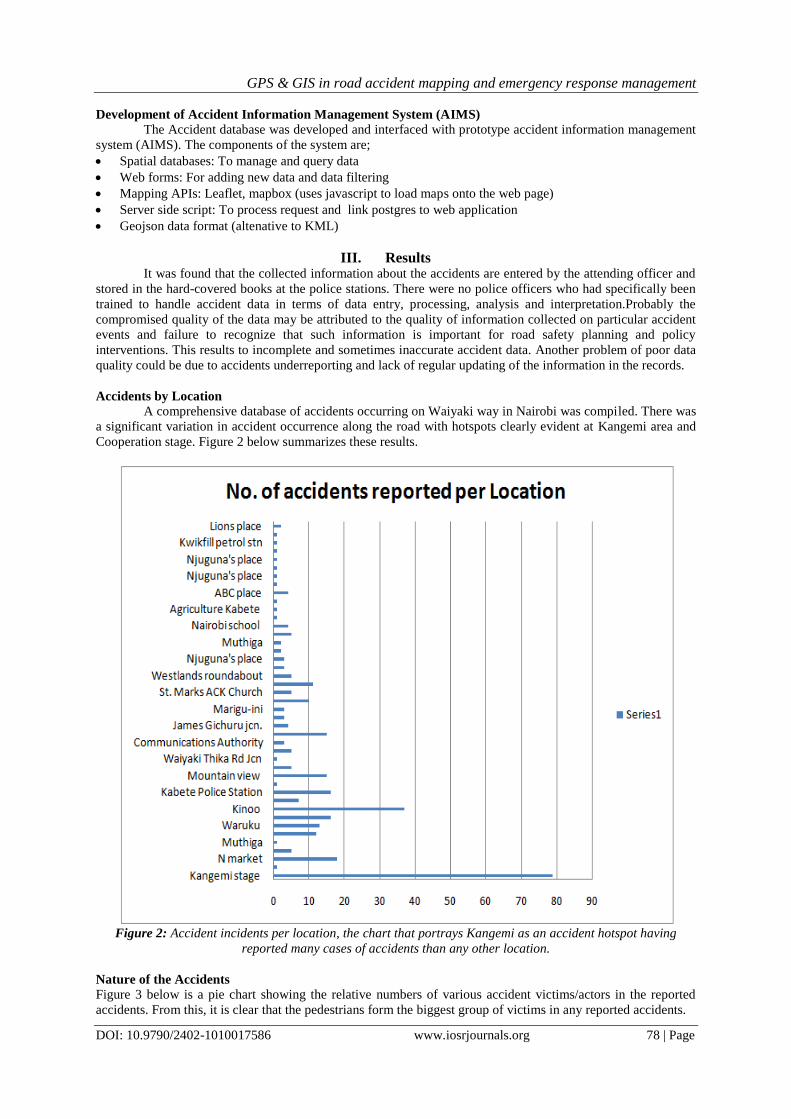
A comprehensive database of accidents occurring on Waiyaki way in Nairobi was compiled. There was
a significant variation in accident occurrence along the road with hotspots clearly evident at Kangemi area and
Cooperation stage. Figure 2 below summarizes these results.
Figure 2: Accident incidents per location, the chart that portrays Kangemi as an accident hotspot having
reported many cases of accidents than any other location.
Nature of the Accidents
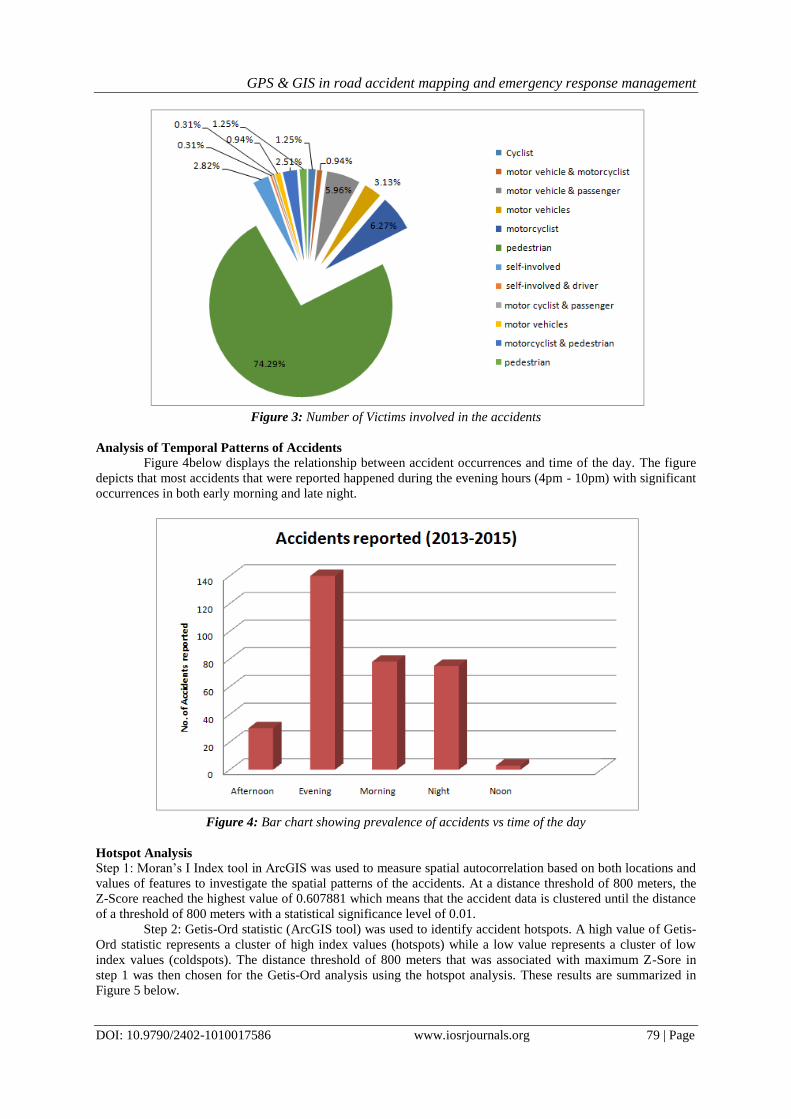
Figure 3 below is a pie chart showing the relative numbers of various accident victims/actors in the reported
accidents. From this, it is clear that the pedestrians form the biggest group of victims in any reported accidents.
GPS & GIS in road accident mapping and emergency response management
DOI: 10.9790/2402-1010017586 www.iosrjournals.org 79 | Page
Figure 3: Number of Victims involved in the accidents
Analysis of Temporal Patterns of Accidents
Figure 4below displays the relationship between accident occurrences and time of the day. The figure
depicts that most accidents that were reported happened during the evening hours (4pm - 10pm) with significant
occurrences in both early morning and late night.
Figure 4: Bar chart showing prevalence of accidents vs time of the day
Hotspot Analysis
Step 1: Moran‟s I Index tool in ArcGIS was used to measure spatial autocorrelation based on both locations and
values of features to investigate the spatial patterns of the accidents. At a distance threshold of 800 meters, the
Z-Score reached the highest value of 0.607881 which means that the accident data is clustered until the distance
of a threshold of 800 meters with a statistical significance level of 0.01.
Step 2: Getis-Ord statistic (ArcGIS tool) was used to identify accident hotspots. A high value of Getis-
Ord statistic represents a cluster of high index values (hotspots) while a low value represents a cluster of low
index values (coldspots). The distance threshold of 800 meters that was associated with maximum Z-Sore in
step 1 was then chosen for the Getis-Ord analysis using the hotspot analysis. These results are summarized in
Figure 5 below.
GPS & GIS in road accident mapping and emergency response management
DOI: 10.9790/2402-1010017586 www.iosrjournals.org 80 | Page
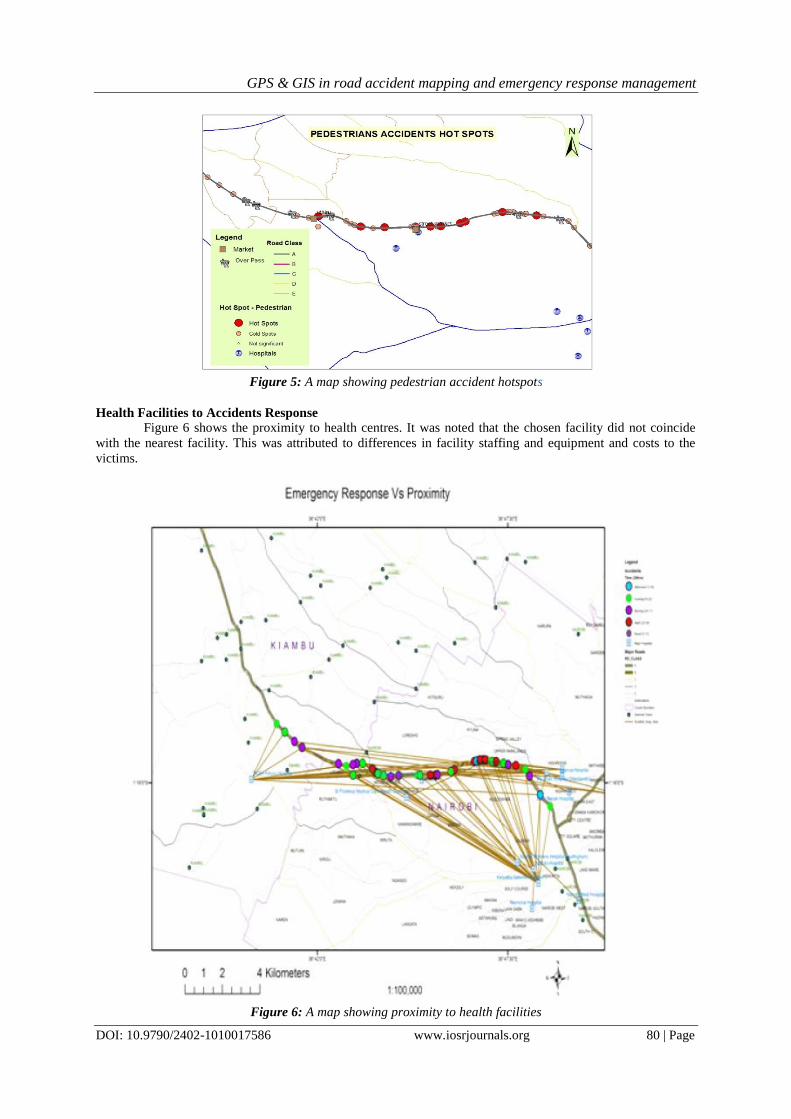
Figure 5: A map showing pedestrian accident hotspots
Health Facilities to Accidents Response
Figure 6 shows the proximity to health centres. It was noted that the chosen facility did not coincide
with the nearest facility. This was attributed to differences in facility staffing and equipment and costs to the
victims.
Figure 6: A map showing proximity to health facilities
GPS & GIS in road accident mapping and emergency response management
DOI: 10.9790/2402-1010017586 www.iosrjournals.org 81 | Page
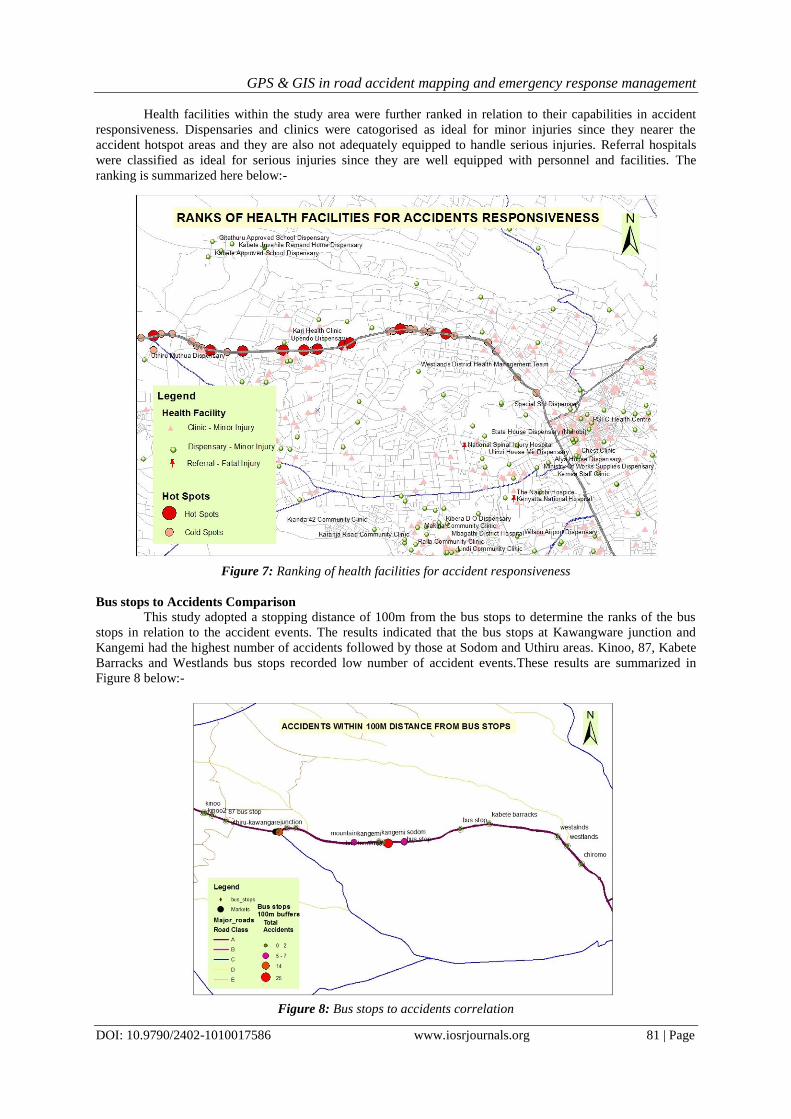
Health facilities within the study area were further ranked in relation to their capabilities in accident
responsiveness. Dispensaries and clinics were catogorised as ideal for minor injuries since they nearer the
accident hotspot areas and they are also not adequately equipped to handle serious injuries. Referral hospitals
were classified as ideal for serious injuries since they are well equipped with personnel and facilities. The
ranking is summarized here below:-
Figure 7: Ranking of health facilities for accident responsiveness
Bus stops to Accidents Comparison
This study adopted a stopping distance of 100m from the bus stops to determine the ranks of the bus
stops in relation to the accident events. The results indicated that the bus stops at Kawangware junction and
Kangemi had the highest number of accidents followed by those at Sodom and Uthiru areas. Kinoo, 87, Kabete
Barracks and Westlands bus stops recorded low number of accident events.These results are summarized in
Figure 8 below:-
Figure 8: Bus stops to accidents correlation
GPS & GIS in road accident mapping and emergency response management
DOI: 10.9790/2402-1010017586 www.iosrjournals.org 82 | Page
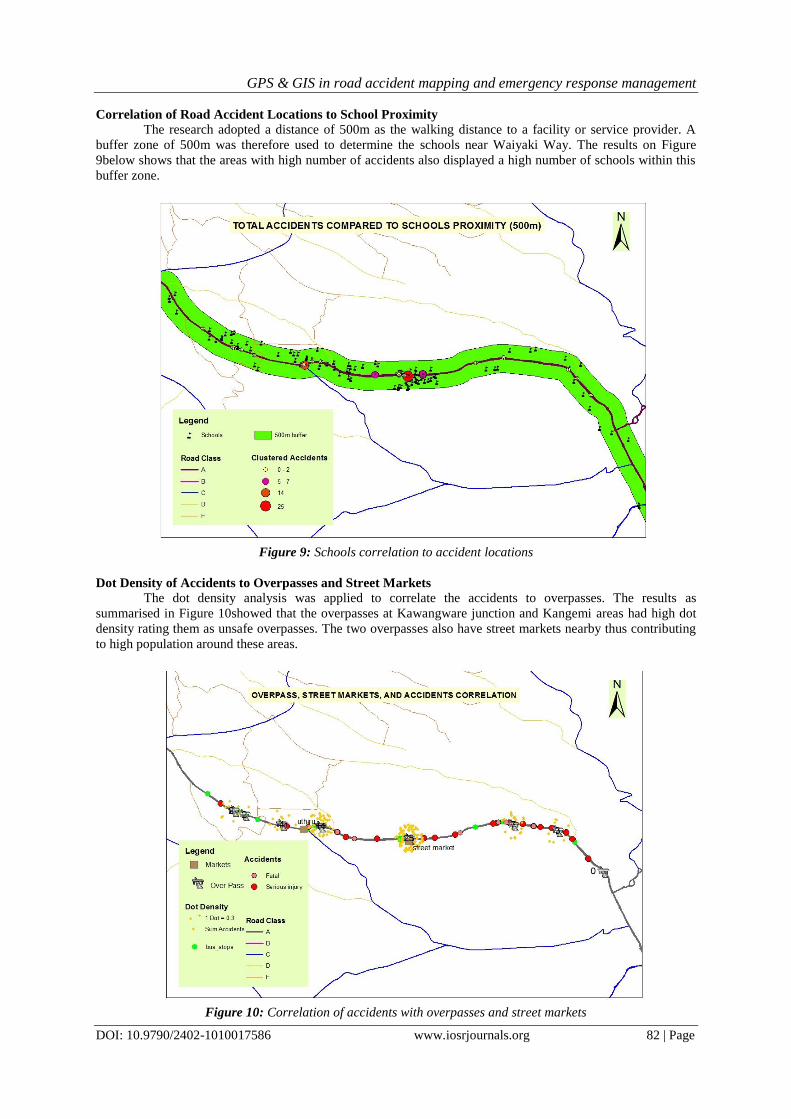
Correlation of Road Accident Locations to School Proximity
The research adopted a distance of 500m as the walking distance to a facility or service provider. A
buffer zone of 500m was therefore used to determine the schools near Waiyaki Way. The results on Figure
9below shows that the areas with high number of accidents also displayed a high number of schools within this
buffer zone.
Figure 9: Schools correlation to accident locations
Dot Density of Accidents to Overpasses and Street Markets
The dot density analysis was applied to correlate the accidents to overpasses. The results as
summarised in Figure 10showed that the overpasses at Kawangware junction and Kangemi areas had high dot
density rating them as unsafe overpasses. The two overpasses also have street markets nearby thus contributing
to high population around these areas.
Figure 10: Correlation of accidents with overpasses and street markets
GPS & GIS in road accident mapping and emergency response management
DOI: 10.9790/2402-1010017586 www.iosrjournals.org 83 | Page
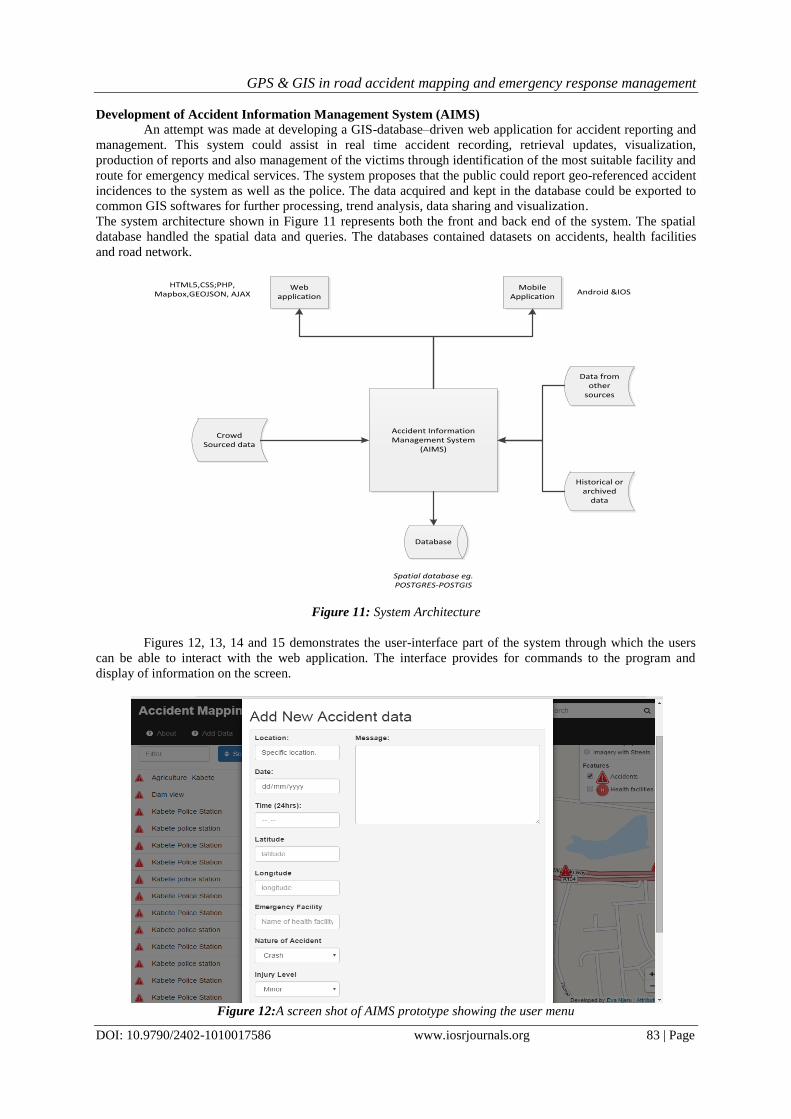
Development of Accident Information Management System (AIMS)
An attempt was made at developing a GIS-database–driven web application for accident reporting and
management. This system could assist in real time accident recording, retrieval updates, visualization,
production of reports and also management of the victims through identification of the most suitable facility and
route for emergency medical services. The system proposes that the public could report geo-referenced accident
incidences to the system as well as the police. The data acquired and kept in the database could be exported to
common GIS softwares for further processing, trend analysis, data sharing and visualization.
The system architecture shown in Figure 11 represents both the front and back end of the system. The spatial
database handled the spatial data and queries. The databases contained datasets on accidents, health facilities
and road network.
Database
Crowd Sourced data
Accident Information Management System
(AIMS)
Historical or archived
data
Data from other
sources
Web application
Mobile Application
Spatial database eg.POSTGRES-POSTGIS
Android &IOS HTML5,CSS;PHP,
Mapbox,GEOJSON, AJAX
Figure 11: System Architecture
Figures 12, 13, 14 and 15 demonstrates the user-interface part of the system through which the users
can be able to interact with the web application. The interface provides for commands to the program and
display of information on the screen.
Figure 12:A screen shot of AIMS prototype showing the user menu

GPS & GIS in road accident mapping and emergency response management
DOI: 10.9790/2402-1010017586 www.iosrjournals.org 84 | Page
Figure 13: A screen shot of AIMS prototype showing user menu and graphical user interface
Figure 14: A screen shot of AIMS prototype showing user menu and graphical user interface
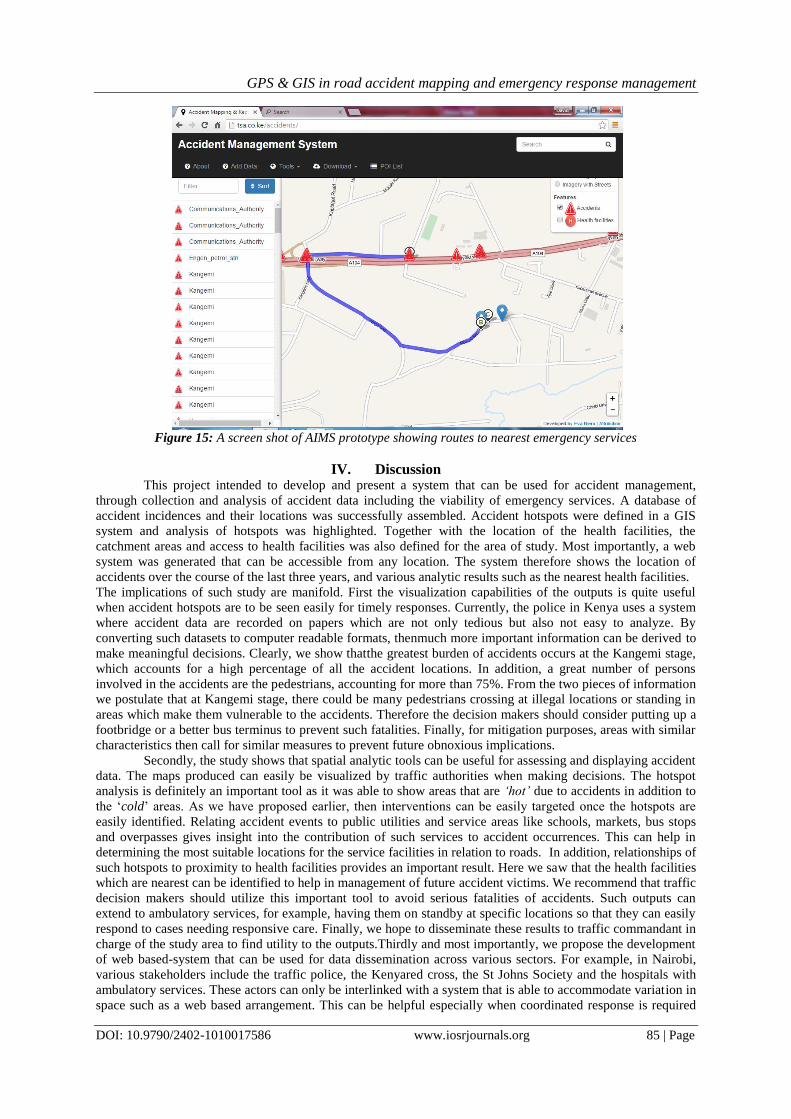
Figure 15 below is a screen shot of the AIMS showing how the system can help in establishing the
route to the nearest health facilities from locations of the accident events.
GPS & GIS in road accident mapping and emergency response management
DOI: 10.9790/2402-1010017586 www.iosrjournals.org 85 | Page
Figure 15: A screen shot of AIMS prototype showing routes to nearest emergency services
IV. Discussion
This project intended to develop and present a system that can be used for accident management,
through collection and analysis of accident data including the viability of emergency services. A database of
accident incidences and their locations was successfully assembled. Accident hotspots were defined in a GIS
system and analysis of hotspots was highlighted. Together with the location of the health facilities, the
catchment areas and access to health facilities was also defined for the area of study. Most importantly, a web
system was generated that can be accessible from any location. The system therefore shows the location of
accidents over the course of the last three years, and various analytic results such as the nearest health facilities.
The implications of such study are manifold. First the visualization capabilities of the outputs is quite useful
when accident hotspots are to be seen easily for timely responses. Currently, the police in Kenya uses a system
where accident data are recorded on papers which are not only tedious but also not easy to analyze. By
converting such datasets to computer readable formats, thenmuch more important information can be derived to
make meaningful decisions. Clearly, we show thatthe greatest burden of accidents occurs at the Kangemi stage,
which accounts for a high percentage of all the accident locations. In addition, a great number of persons
involved in the accidents are the pedestrians, accounting for more than 75%. From the two pieces of information
we postulate that at Kangemi stage, there could be many pedestrians crossing at illegal locations or standing in
areas which make them vulnerable to the accidents. Therefore the decision makers should consider putting up a
footbridge or a better bus terminus to prevent such fatalities. Finally, for mitigation purposes, areas with similar
characteristics then call for similar measures to prevent future obnoxious implications.
Secondly, the study shows that spatial analytic tools can be useful for assessing and displaying accident
data. The maps produced can easily be visualized by traffic authorities when making decisions. The hotspot
analysis is definitely an important tool as it was able to show areas that are „hot‟ due to accidents in addition to
the „cold‟ areas. As we have proposed earlier, then interventions can be easily targeted once the hotspots are
easily identified. Relating accident events to public utilities and service areas like schools, markets, bus stops
and overpasses gives insight into the contribution of such services to accident occurrences. This can help in
determining the most suitable locations for the service facilities in relation to roads. In addition, relationships of
such hotspots to proximity to health facilities provides an important result. Here we saw that the health facilities
which are nearest can be identified to help in management of future accident victims. We recommend that traffic
decision makers should utilize this important tool to avoid serious fatalities of accidents. Such outputs can
extend to ambulatory services, for example, having them on standby at specific locations so that they can easily
respond to cases needing responsive care. Finally, we hope to disseminate these results to traffic commandant in
charge of the study area to find utility to the outputs.Thirdly and most importantly, we propose the development
of web based-system that can be used for data dissemination across various sectors. For example, in Nairobi,
various stakeholders include the traffic police, the Kenyared cross, the St Johns Society and the hospitals with
ambulatory services. These actors can only be interlinked with a system that is able to accommodate variation in
space such as a web based arrangement. This can be helpful especially when coordinated response is required

GPS & GIS in road accident mapping and emergency response management
DOI: 10.9790/2402-1010017586 www.iosrjournals.org 86 | Page
from different departments. As such, our web based system provides a novel approach that can be used for
handling accident data by various sectors.Our study was not devoid of limitations. First, our accident data source
is only from those recorded by the police. We understand that there could be more information on accidents not
recorded by the police as response was arrived at much earlier. We hope that extending the AIMS to a
multidisciplinary system can help in data collection from various sectors. Secondly our accessibility analysis did
not include travel impedances such as traffic jams within the city. We believe that including such as aspect of
travelling within the city would improve the results. Finally, a time series analysis of the accident data would
have also improved the information we are able to display. Despite the availability of data on the time of the
accidents, we recognize that such an analysis would require inclusion of much more information into a model,
an area that would form an interesting area of study in the future.The study can be extended to other roads in the
future, and similar analysis carried out. Future studies should therefore focus on analyzing such information at a
wider spatial scale, especially for interlinked roads within the city. In addition, a time series model that uses
much more information such as socio-economic status of the people, time of accidents, proximity to alcohol
selling points among others would form a very interesting aspect of study. Geospatial techniques of GIS
supplemented with GPS are recommended to improve the current system on data collection, storage,
manipulation and analysis of accident data to aid in decision making. This study recommends use of accurate
geo locations for accident scenes to avoid multiplicity of accidents on one generalized location for better
analysis. This could be done by equipping police with GPS devices or at least location enabled mobile phones
with a dedicated application to capture accidents. It also recommends the adoption of real-time accident
reporting system to leveraging technological advances in web and Mobile GIS.Modern smart phones come with
inbuilt GPS hardware. This could be used in capturing and geo-tagging accident scenes and relaying this data to
central AIMS server and to emergency responders in real time. This will improve the data quality and data
storage constraints experienced today at the police department. This data can then be shared with experts,
decision makers to respond to the accident cases. This data can also be used for further analytical processing and
visualizations for better future accident related researches
V. Conclusion
The current accident reporting mechanisms and system can be revamped to capture accurate
geographical locations as one of the key attributes. This can then be done through GIS where it would involve
mapping the accident areas and visually analyzing the data. This information can be combined using GIS
applications and analyzed for clusters, proximity and trends. Today, the use of Geographical Information
System (GIS) for accident data analysis is not widely used in the police department. This is because the data is
analyzed on a computer without locating the incident spatially. The ability to analyze the data visually using
spatial GIS is most likely to give the analysts a clear understanding of the accident. By use of GIS, the time and
effort required to analyse accident data can be reduced.This study could be extended to cover wider area for
more accurate reliable results.
References [1]. Alegana VA, Wright JA, Nahzat SM, Butt W, Sediqi AW, Habib N, et al. Modelling the incidence of Plasmodium vivax and
Plasmodium falciparum malaria in Afghanistan 2006-2009. PLoS One. 2014;9(7). [2]. Alegana VA, Wright JA, Pentrina U, Noor AM, Snow RW, Atkinson PM. Spatial modelling of healthcare utilisation for treatment
of fever in Namibia. Int. J. Health Geogr. [Internet]. 2012;11(1):6. Available from: http://www.ij-health geo
graphics.com/content/11/1/6 [3]. Geurts K, Wets G, Brijs T, Karlis D, Vanhoof K. Ranking and Selecting Dangerous Accident Locations : Correcting for the Number
of Passengers and Bayesian Ranking Plots. 2004;
[4]. Lagarde E. Road Traffi c Injury Is an Escalating Burden. 2007;4(6):967–71. [5]. Manyara CG. COMBATING ROAD TRAFFIC ACCIDENTS IN KENYA: A CHALLENGE FOR AN EMERGING ECONOMY.
2015;1–7.
[6]. Muchene LK. Road accidents in Kenya : a case of poor road network or human error ? 2014; [7]. Nagne AD, Gawali BW. T RANSPORTATION N ETWORK A NALYSIS B Y U SING R EMOTE. 2013;3(3):70–6.
[8]. Noor AM, Alegana VA, Gething PW, Snow RW. A spatial national health facility database for public health sector planning in
Kenya in 2008. Int. J. Health Geogr. [Internet]. 2009 Jan [cited 2015 Mar 9];8(1):13. Available from: http://www.ij-healthgeographics.com/content/8/1/13
[9]. Noor AM, Amin A a., Gething PW, Atkinson PM, Hay SI, Snow RW. Modelling distances travelled to government health services in Kenya. Trop. Med. Int. Heal. 2006;11(2):188–96.
[10]. Odero W, Garner P, Zwi A. Road traffic injuries in developing countries : a comprehensive review of epidemiological studies.
1997;1997(5):445–60. [11]. Ouma PO, Odera PA, Mukundi JB. Spatial Modelling of Weather Variables for Plant Disease Applications in Mwea Region. J.
Geosci. Environ. Prot. 2016;(May):127–36.
[12]. Rudtanasudjatum K. Road Traffic Accidents Management Model : The Successful. 2008;1–4. [13]. WHO. Global status report on road safety. 2009;
[14]. Zinszer K, Charland K, Kigozi R, Dorsey G, Kamya MR, Buckeridge DL. Determining health-care facility catchment areas in
Uganda using data on malaria-related visits. Bull. World Health Organ. [Internet]. 2014;92(October 2013):178–86. Available from: http://www.pubmedcentral.nih.gov/articlerender.fcgi?artid=3949593&tool=pmcentrez&rendertype=abstract