Embed Size (px)
Citation preview
www.developersdilemma.org Researching structural change & inclusive growth
SUMMARY
GPID Country Note 2
POVERTY, INEQUALITY, AND STRUCTURAL CHANGE IN INDIA
Author(s): Kunal Sen
Date: 29 September 2017
Affiliation(s): Global Development Institute, University of Manchester
Email(s): [email protected]
India’s GDP per capita has increased from an average of 1.1 per cent in 1950-1991 to an average of 6.6 per cent
in 1992-2012. This dramatic growth acceleration stands vis-à-vis a more mixed track record of inclusive growth in
the past two decades: while poverty has fallen sharply, India has seen an increase in inequality post 1990.
Mirroring the acceleration in GDP per capita, there has been an acceleration in aggregate labour productivity,
driven primarily by an increase in the productivity of the market services sector. Overall, there has been a slow
but steady movement of labour out of agriculture and a shift of employment to services and industry, creating
new economic and political challenges.
About the GPID research network:
The ESRC Global Poverty and Inequality Dynamics (GPID) research network is an international network of academics, civil society organisations, and policymakers. It was launched in 2017 and is funded by the ESRC’s Global Challenges Research Fund. The objective of the ESRC GPID Research Network is to build a new research programme that focuses on the relationship between structural change and inclusive growth. See: www.gpidnetwork.org
THE DEVELOPER’S DILEMMA
The ESRC Global Poverty and Inequality Dynamics (GPID) research network is concerned with what we have called ‘the developer’s dilemma’.
This dilemma is a trade-off between two objectives that developing countries are pursuing. Specifically:
1. Economic development via structural transformation and productivity growth based on the intra- and inter-sectoral reallocation of economic activity.
2. Inclusive growth which is typically defined as broad-based economic growth benefiting the poorer in society in particular.
Structural transformation, the former has been thought to push up inequality. Whereas the latter, inclusive growth implies a need for steady or even falling inequality to spread the benefits of growth widely. The ‘developer’s dilemma’ is thus a distribution tension at the heart of economic development.

1
POVERTY, INEQUALITY, AND STRUCTURAL CHANGE IN INDIA
1. Trends in Income Dimensions of Inequality and Poverty
In Figure 1 and 2, we plot the consumption Gini –
reliable measures of income inequality are not
available for India – and the poverty headcount and
poverty gap ratios. There has been an increase in
inequality in the post-1990 period accompanied by
a sharp fall in poverty. Much of the increase in
overall inequality is due to an increase in urban
inequality, with rural inequality showing no clear
trend (Figure 3). The fall in poverty has been
particularly evident for rural households, and the
rural poverty rate has now converged to the urban
poverty rate (Figure 4)
Figure 1. Trend in Inequality, India
Source: WIID Database, our calculations
Figure 2. Trend in Poverty (Headcount Ratio and
Poverty Gap), India
Source: POVCAL data-base, our calculations.
Figure 3. Poverty Rates in India -Total, Rural,
Urban, 1950-2012
Source: Datt et al. (2016)
Figure 4. Inequality in India, Rural and Urban
1950-2012
Source: Datt et al. (2016)
The fall in poverty can be mainly attributed to the
increase in economic growth in the post-1990
period (a period when India enacted major
economic reforms). GDP per capita increased from
an average of 1.1 per cent in 1950-1991 to an
average of 6.6 per cent in 1992-2012 (Figure 5).
Datt et al. (2016) show that the sharp fall in poverty
in the post-reform period was not only due to a
higher growth rate observed in this period, but also
due a higher responsiveness of poverty to growth.
This suggests that the pattern of growth in the post-
1991 period was more pro-poor in the post-reform
period than in the pre-reform period. We discuss
possible reasons for the pro-poor bias of growth in
the post-1990 period later in the note.
0
10
20
30
40
50
60
70
1950 1960 1970 1980 1990 2000 2010 2020
RuralUrbanNational
He
ad
co
un
t in
de
x (
%, lo
we
r lin
e)
25.0
27.5
30.0
32.5
35.0
37.5
40.0
42.5
45.0
1950 1960 1970 1980 1990 2000 2010 2020
Gin
i in
de
x (
%) Urban
Rural
2
POVERTY, INEQUALITY, AND STRUCTURAL CHANGE IN INDIA
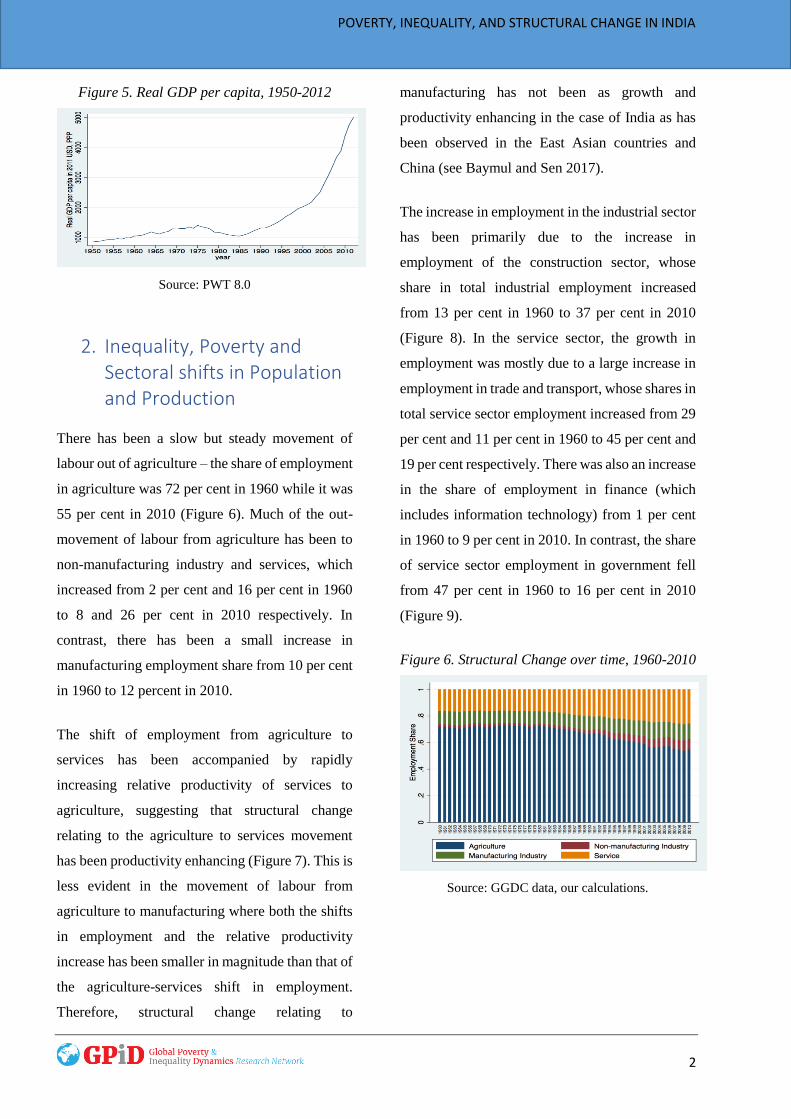
Figure 5. Real GDP per capita, 1950-2012
Source: PWT 8.0
2. Inequality, Poverty and Sectoral shifts in Population and Production
There has been a slow but steady movement of
labour out of agriculture – the share of employment
in agriculture was 72 per cent in 1960 while it was
55 per cent in 2010 (Figure 6). Much of the out-
movement of labour from agriculture has been to
non-manufacturing industry and services, which
increased from 2 per cent and 16 per cent in 1960
to 8 and 26 per cent in 2010 respectively. In
contrast, there has been a small increase in
manufacturing employment share from 10 per cent
in 1960 to 12 percent in 2010.
The shift of employment from agriculture to
services has been accompanied by rapidly
increasing relative productivity of services to
agriculture, suggesting that structural change
relating to the agriculture to services movement
has been productivity enhancing (Figure 7). This is
less evident in the movement of labour from
agriculture to manufacturing where both the shifts
in employment and the relative productivity
increase has been smaller in magnitude than that of
the agriculture-services shift in employment.
Therefore, structural change relating to
manufacturing has not been as growth and
productivity enhancing in the case of India as has
been observed in the East Asian countries and
China (see Baymul and Sen 2017).
The increase in employment in the industrial sector
has been primarily due to the increase in
employment of the construction sector, whose
share in total industrial employment increased
from 13 per cent in 1960 to 37 per cent in 2010
(Figure 8). In the service sector, the growth in
employment was mostly due to a large increase in
employment in trade and transport, whose shares in
total service sector employment increased from 29
per cent and 11 per cent in 1960 to 45 per cent and
19 per cent respectively. There was also an increase
in the share of employment in finance (which
includes information technology) from 1 per cent
in 1960 to 9 per cent in 2010. In contrast, the share
of service sector employment in government fell
from 47 per cent in 1960 to 16 per cent in 2010
(Figure 9).
Figure 6. Structural Change over time, 1960-2010
Source: GGDC data, our calculations.

3
POVERTY, INEQUALITY, AND STRUCTURAL CHANGE IN INDIA
Figure 7. Shifts of Employment and Relative
Productivity
Source: GGDC data, our calculations
Figure 8. Employment Share Shifts in the
Industrial Sector, 1960-2010
Source: GGDC data, our calculations.
Figure 9. Employment Share Shifts in the Service
Sector, 1960-2010
Source: GGDC data, our calculations.
1 We do not find any difference in our finding of a lack of
relationship between structural change and inequality, if we
What have been the observed relationships
between structural change in manufacturing and
services on one hand and poverty and inequality on
the other?
In Figures 10 and 11, we see that the shifts in
employment from agriculture to
manufacturing/non-manufacturing industry and
services have been accompanied by steadily
decreasing poverty. However, we see no clear
relationship between shifts in employment from
agriculture to manufacturing/non-manufacturing
industry and services and inequality as measured
by the net consumption Gini (Figures 12 and 13).1
Figure 10. Structural Change –
Manufacturing and Poverty
Source: GGDC and POVCAL data, our calculations.
Figure 11. Structural Change –
Services and Poverty
Source: GGDC and POVCAL data, our calculations.
use the top 10 per cent or bottom 40 per cent share in total
consumption/income.

4
POVERTY, INEQUALITY, AND STRUCTURAL CHANGE IN INDIA
Figure 12. Structural Change –
Manufacturing and Inequality
Source: GGDC and WIID data, our calculations.
Figure 13. Structural Change –
Services and Inequality
Source: GGDC and WIID data, our calculations
3. Trends in Productivity and Complexity: Causes and Consequences
In Figure 14, we plot the aggregate level of labour
productivity along with its main components over
time. Mirroring the acceleration in GDP per capita
since the early 1990s, we observe an acceleration
in aggregate labour productivity, driven primarily
by an increase in the productivity of the market
services sector. There has no perceptible
acceleration in the productivity of agriculture,
manufacturing and non-manufacturing industry.
This suggests that India’s acceleration in economic
growth has been primarily due to an increase in
market services productivity. In fact, by 2010,
market services productivity levels had caught up
with productivity levels in manufacturing and non-
manufacturing industry. This is a surprising feature
of India’s structural transformation experience as
historically the service sector of most developing
countries is far less productive than that of the
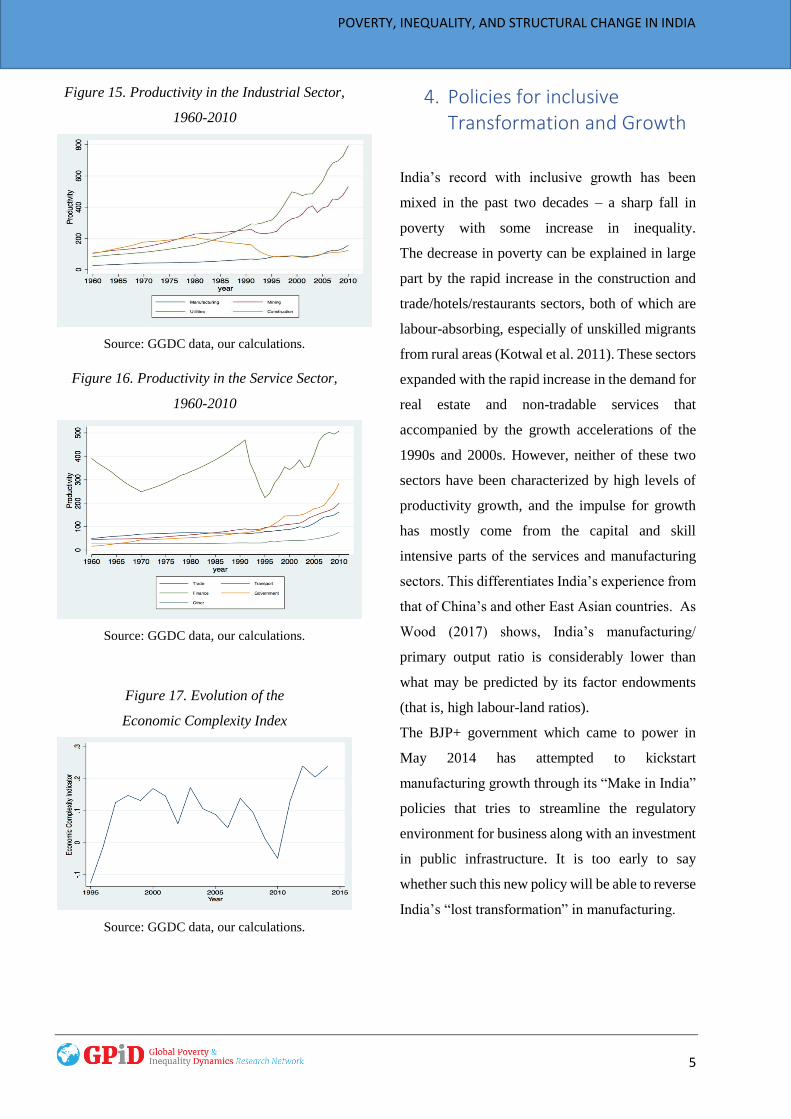
manufacturing sector. The relatively weak
productivity performance of the industrial sector in
India can be attributed to stagnant productivity
levels in the construction sector, which we have
seen is by far the largest sub-sector in the industrial
sector in terms of employment (Figure 15).
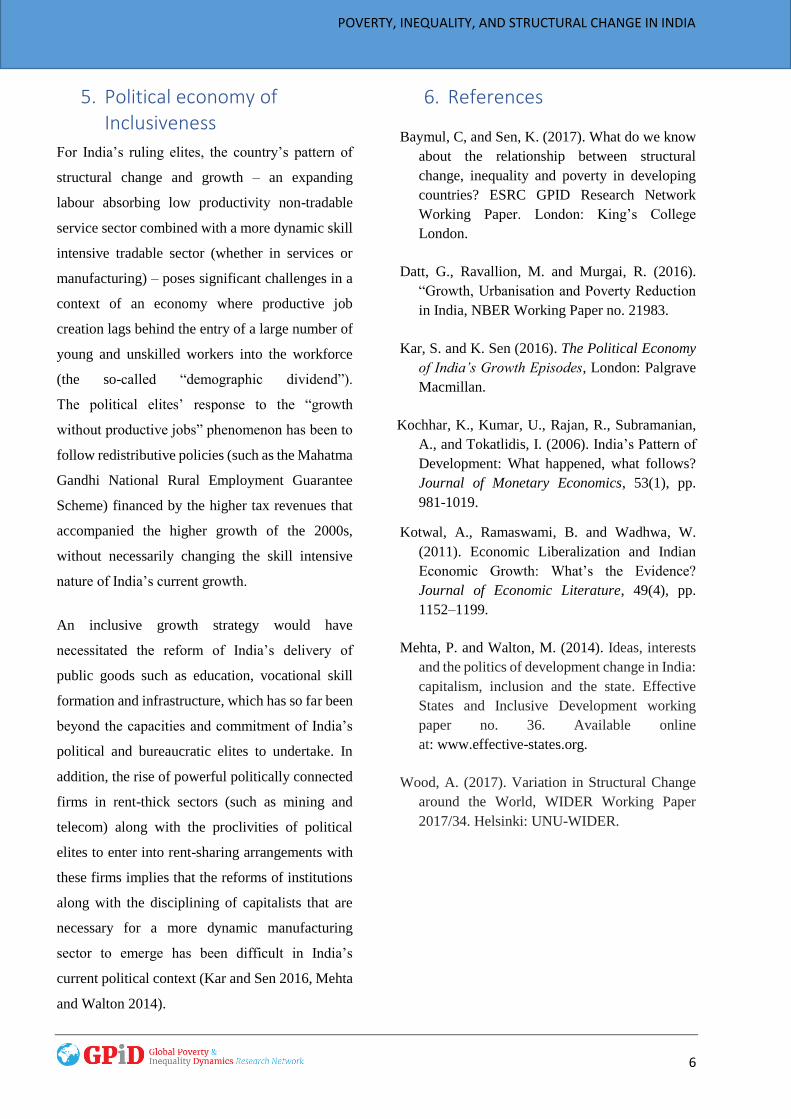
In contrast, the increase in productivity in the
services sector has been driven by the rapid
increase in productivity of the finance sector,
which includes information technology, which has
a major source of growth and innovation in the
Indian economy in the post-1990 period (Figure
16). Economic complexity does not show a clear
trend in the post-1990 period (Figure 17).
Figure 14. Aggregate and Sectoral Productivity,
1960-2010
Source: GGDC data, our calculations.
5
POVERTY, INEQUALITY, AND STRUCTURAL CHANGE IN INDIA
Figure 15. Productivity in the Industrial Sector,
1960-2010
Source: GGDC data, our calculations.
Figure 16. Productivity in the Service Sector,
1960-2010
Source: GGDC data, our calculations.
Figure 17. Evolution of the
Economic Complexity Index
Source: GGDC data, our calculations.
4. Policies for inclusive Transformation and Growth
India’s record with inclusive growth has been
mixed in the past two decades – a sharp fall in
poverty with some increase in inequality.
The decrease in poverty can be explained in large
part by the rapid increase in the construction and
trade/hotels/restaurants sectors, both of which are
labour-absorbing, especially of unskilled migrants
from rural areas (Kotwal et al. 2011). These sectors
expanded with the rapid increase in the demand for
real estate and non-tradable services that
accompanied by the growth accelerations of the
1990s and 2000s. However, neither of these two
sectors have been characterized by high levels of
productivity growth, and the impulse for growth
has mostly come from the capital and skill
intensive parts of the services and manufacturing
sectors. This differentiates India’s experience from
that of China’s and other East Asian countries. As
Wood (2017) shows, India’s manufacturing/
primary output ratio is considerably lower than
what may be predicted by its factor endowments
(that is, high labour-land ratios).
The BJP+ government which came to power in
May 2014 has attempted to kickstart
manufacturing growth through its “Make in India”
policies that tries to streamline the regulatory
environment for business along with an investment
in public infrastructure. It is too early to say
whether such this new policy will be able to reverse
India’s “lost transformation” in manufacturing.
6
POVERTY, INEQUALITY, AND STRUCTURAL CHANGE IN INDIA
5. Political economy of Inclusiveness
For India’s ruling elites, the country’s pattern of
structural change and growth – an expanding
labour absorbing low productivity non-tradable
service sector combined with a more dynamic skill
intensive tradable sector (whether in services or
manufacturing) – poses significant challenges in a
context of an economy where productive job
creation lags behind the entry of a large number of
young and unskilled workers into the workforce
(the so-called “demographic dividend”).
The political elites’ response to the “growth
without productive jobs” phenomenon has been to
follow redistributive policies (such as the Mahatma
Gandhi National Rural Employment Guarantee
Scheme) financed by the higher tax revenues that
accompanied the higher growth of the 2000s,
without necessarily changing the skill intensive
nature of India’s current growth.
An inclusive growth strategy would have
necessitated the reform of India’s delivery of
public goods such as education, vocational skill
formation and infrastructure, which has so far been
beyond the capacities and commitment of India’s
political and bureaucratic elites to undertake. In
addition, the rise of powerful politically connected
firms in rent-thick sectors (such as mining and
telecom) along with the proclivities of political
elites to enter into rent-sharing arrangements with
these firms implies that the reforms of institutions
along with the disciplining of capitalists that are
necessary for a more dynamic manufacturing
sector to emerge has been difficult in India’s
current political context (Kar and Sen 2016, Mehta
and Walton 2014).
6. References
Baymul, C, and Sen, K. (2017). What do we know
about the relationship between structural
change, inequality and poverty in developing
countries? ESRC GPID Research Network
Working Paper. London: King’s College
London.
Datt, G., Ravallion, M. and Murgai, R. (2016).
“Growth, Urbanisation and Poverty Reduction
in India, NBER Working Paper no. 21983.
Kar, S. and K. Sen (2016). The Political Economy
of India’s Growth Episodes, London: Palgrave
Macmillan.
Kochhar, K., Kumar, U., Rajan, R., Subramanian,
A., and Tokatlidis, I. (2006). India’s Pattern of
Development: What happened, what follows?
Journal of Monetary Economics, 53(1), pp.
981-1019.
Kotwal, A., Ramaswami, B. and Wadhwa, W.
(2011). Economic Liberalization and Indian
Economic Growth: What’s the Evidence?
Journal of Economic Literature, 49(4), pp.
1152–1199.
Mehta, P. and Walton, M. (2014). Ideas, interests
and the politics of development change in India:
capitalism, inclusion and the state. Effective
States and Inclusive Development working
paper no. 36. Available online
at: www.effective-states.org.
Wood, A. (2017). Variation in Structural Change
around the World, WIDER Working Paper
2017/34. Helsinki: UNU-WIDER.