Embed Size (px)
Citation preview
DRAFT ENVIRONMENT IMPACT
ASSESSMENT REPORT FOR
Amendment in EC For Change in Fuel For 9.9 MW
Captive Power Generation
Report No.: PL/EIA/JBF/DRAFT/2019
Project Sector & Category: 1(d)-Thermal Power Plant, Category B
Baseline monitoring Period: October’18 to December’18
AT
Plot No 11 & 215 TO 231,
Gujarat Industrial Development Corporation (GIDC),
Sarigam - 396155
Dist.: Valsad, Gujarat.
Project Proponent:
Prepared By:
QCI/NABET ACCREDITION NO. NABET/EIA/1518/RA012
1st Floor, Bhanujyot Complex, Plot C5/27, Opp. Oriental Ins. Co. Ltd. Nr. GIDC Char rasta, Vapi – 396195
Undertaking by Project Proponent

Declaration by Experts
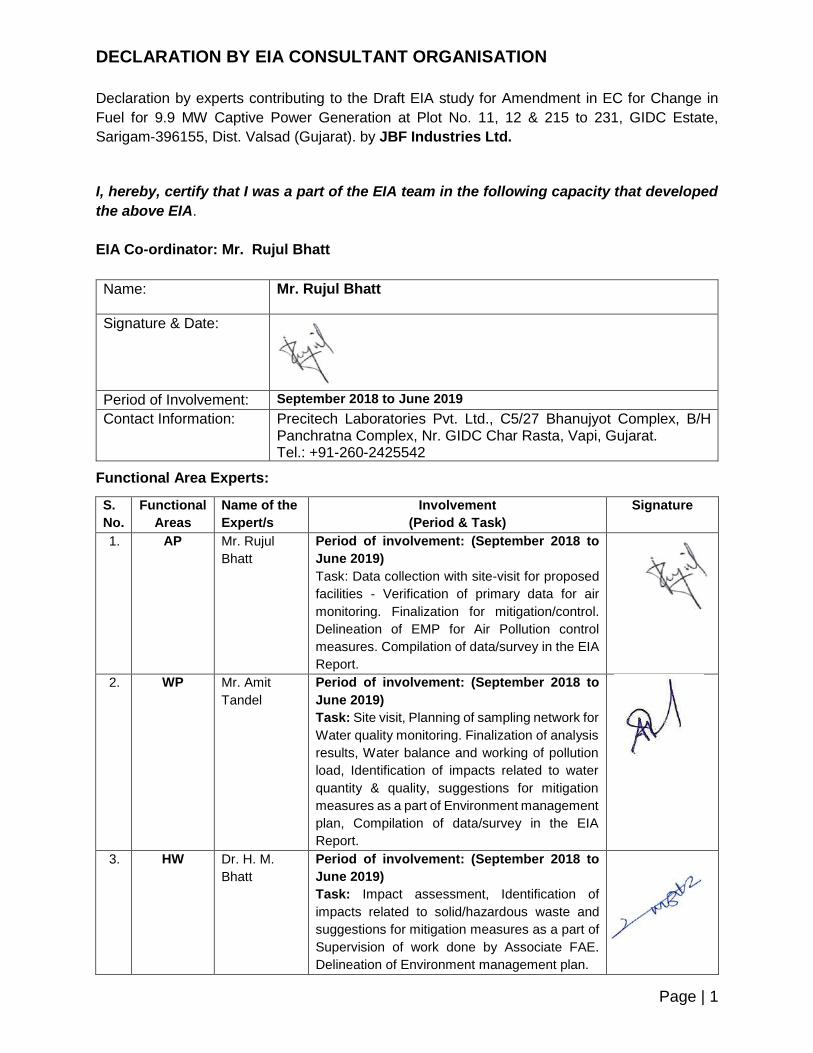
DECLARATION BY EIA CONSULTANT ORGANISATION
Page | 1
Declaration by experts contributing to the Draft EIA study for Amendment in EC for Change in
Fuel for 9.9 MW Captive Power Generation at Plot No. 11, 12 & 215 to 231, GIDC Estate,
Sarigam-396155, Dist. Valsad (Gujarat). by JBF Industries Ltd.
I, hereby, certify that I was a part of the EIA team in the following capacity that developed
the above EIA.
EIA Co-ordinator: Mr. Rujul Bhatt
Name: Mr. Rujul Bhatt
Signature & Date:
Period of Involvement: September 2018 to June 2019
Contact Information: Precitech Laboratories Pvt. Ltd., C5/27 Bhanujyot Complex, B/H Panchratna Complex, Nr. GIDC Char Rasta, Vapi, Gujarat. Tel.: +91-260-2425542
Functional Area Experts:
S.
No.
Functional
Areas
Name of the
Expert/s
Involvement
(Period & Task)
Signature
1. AP Mr. Rujul
Bhatt
Period of involvement: (September 2018 to
June 2019)
Task: Data collection with site-visit for proposed
facilities - Verification of primary data for air
monitoring. Finalization for mitigation/control.
Delineation of EMP for Air Pollution control
measures. Compilation of data/survey in the EIA
Report.
2. WP Mr. Amit
Tandel
Period of involvement: (September 2018 to
June 2019)
Task: Site visit, Planning of sampling network for
Water quality monitoring. Finalization of analysis
results, Water balance and working of pollution
load, Identification of impacts related to water
quantity & quality, suggestions for mitigation
measures as a part of Environment management
plan, Compilation of data/survey in the EIA
Report.
3. HW Dr. H. M.
Bhatt
Period of involvement: (September 2018 to
June 2019)
Task: Impact assessment, Identification of
impacts related to solid/hazardous waste and
suggestions for mitigation measures as a part of
Supervision of work done by Associate FAE.
Delineation of Environment management plan.
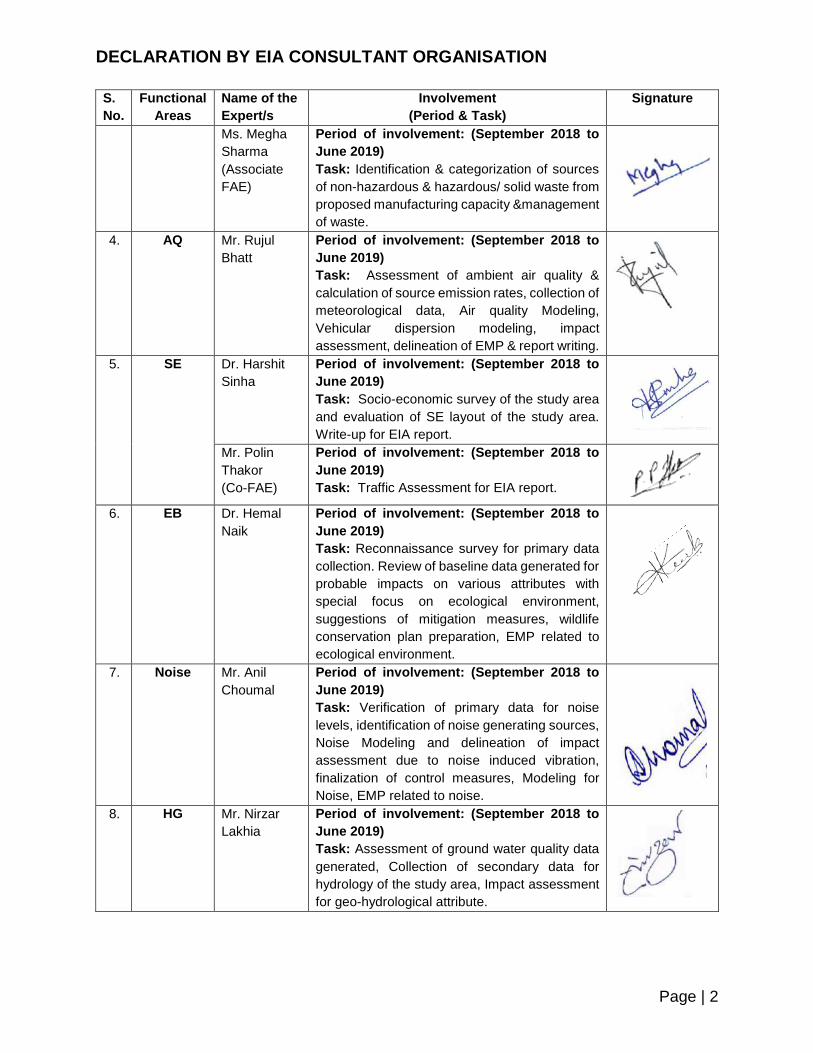
DECLARATION BY EIA CONSULTANT ORGANISATION
Page | 2
S.
No.
Functional
Areas
Name of the
Expert/s
Involvement
(Period & Task)
Signature
Ms. Megha
Sharma
(Associate
FAE)
Period of involvement: (September 2018 to
June 2019)
Task: Identification & categorization of sources
of non-hazardous & hazardous/ solid waste from
proposed manufacturing capacity &management
of waste.
4. AQ Mr. Rujul
Bhatt
Period of involvement: (September 2018 to
June 2019)
Task: Assessment of ambient air quality &
calculation of source emission rates, collection of
meteorological data, Air quality Modeling,
Vehicular dispersion modeling, impact
assessment, delineation of EMP & report writing.
5. SE Dr. Harshit
Sinha
Period of involvement: (September 2018 to
June 2019)
Task: Socio-economic survey of the study area
and evaluation of SE layout of the study area.
Write-up for EIA report.
Mr. Polin
Thakor
(Co-FAE)
Period of involvement: (September 2018 to
June 2019)
Task: Traffic Assessment for EIA report.
6. EB Dr. Hemal
Naik
Period of involvement: (September 2018 to
June 2019)
Task: Reconnaissance survey for primary data
collection. Review of baseline data generated for
probable impacts on various attributes with
special focus on ecological environment,
suggestions of mitigation measures, wildlife
conservation plan preparation, EMP related to
ecological environment.
7. Noise Mr. Anil
Choumal
Period of involvement: (September 2018 to
June 2019)
Task: Verification of primary data for noise
levels, identification of noise generating sources,
Noise Modeling and delineation of impact
assessment due to noise induced vibration,
finalization of control measures, Modeling for
Noise, EMP related to noise.
8. HG Mr. Nirzar
Lakhia
Period of involvement: (September 2018 to
June 2019)
Task: Assessment of ground water quality data
generated, Collection of secondary data for
hydrology of the study area, Impact assessment
for geo-hydrological attribute.
DECLARATION BY EIA CONSULTANT ORGANISATION
Page | 3
S.
No.
Functional
Areas
Name of the
Expert/s
Involvement
(Period & Task)
Signature
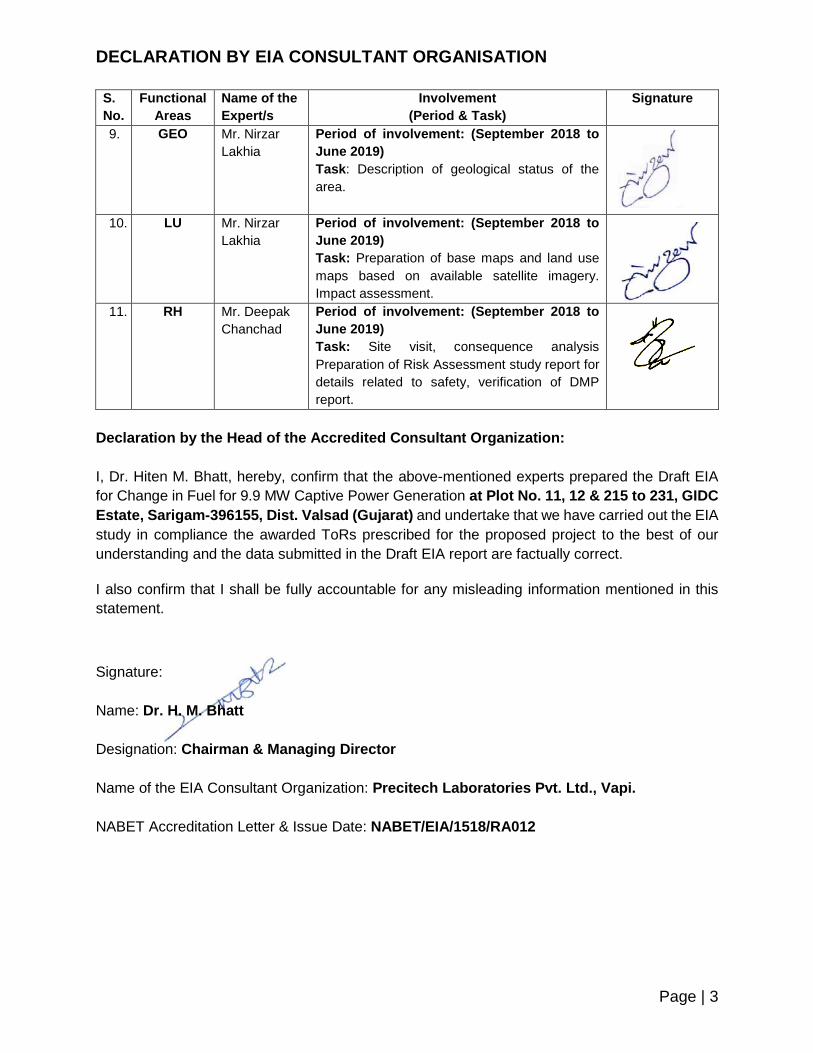
9. GEO Mr. Nirzar
Lakhia
Period of involvement: (September 2018 to
June 2019)
Task: Description of geological status of the
area.
10. LU Mr. Nirzar
Lakhia
Period of involvement: (September 2018 to
June 2019)
Task: Preparation of base maps and land use
maps based on available satellite imagery.
Impact assessment.
11. RH Mr. Deepak
Chanchad
Period of involvement: (September 2018 to
June 2019)
Task: Site visit, consequence analysis
Preparation of Risk Assessment study report for
details related to safety, verification of DMP
report.
Declaration by the Head of the Accredited Consultant Organization:
I, Dr. Hiten M. Bhatt, hereby, confirm that the above-mentioned experts prepared the Draft EIA
for Change in Fuel for 9.9 MW Captive Power Generation at Plot No. 11, 12 & 215 to 231, GIDC
Estate, Sarigam-396155, Dist. Valsad (Gujarat) and undertake that we have carried out the EIA
study in compliance the awarded ToRs prescribed for the proposed project to the best of our
understanding and the data submitted in the Draft EIA report are factually correct.
I also confirm that I shall be fully accountable for any misleading information mentioned in this
statement.
Signature:
Name: Dr. H. M. Bhatt
Designation: Chairman & Managing Director
Name of the EIA Consultant Organization: Precitech Laboratories Pvt. Ltd., Vapi.
NABET Accreditation Letter & Issue Date: NABET/EIA/1518/RA012

Contents
DRAFT ENVIRONMENT IMPACT ASSESSMENT REPORT
Amendment in EC for Change in Fuel for 9.9 MW Captive Power Generation
Contents
P a g e | 1
Contents
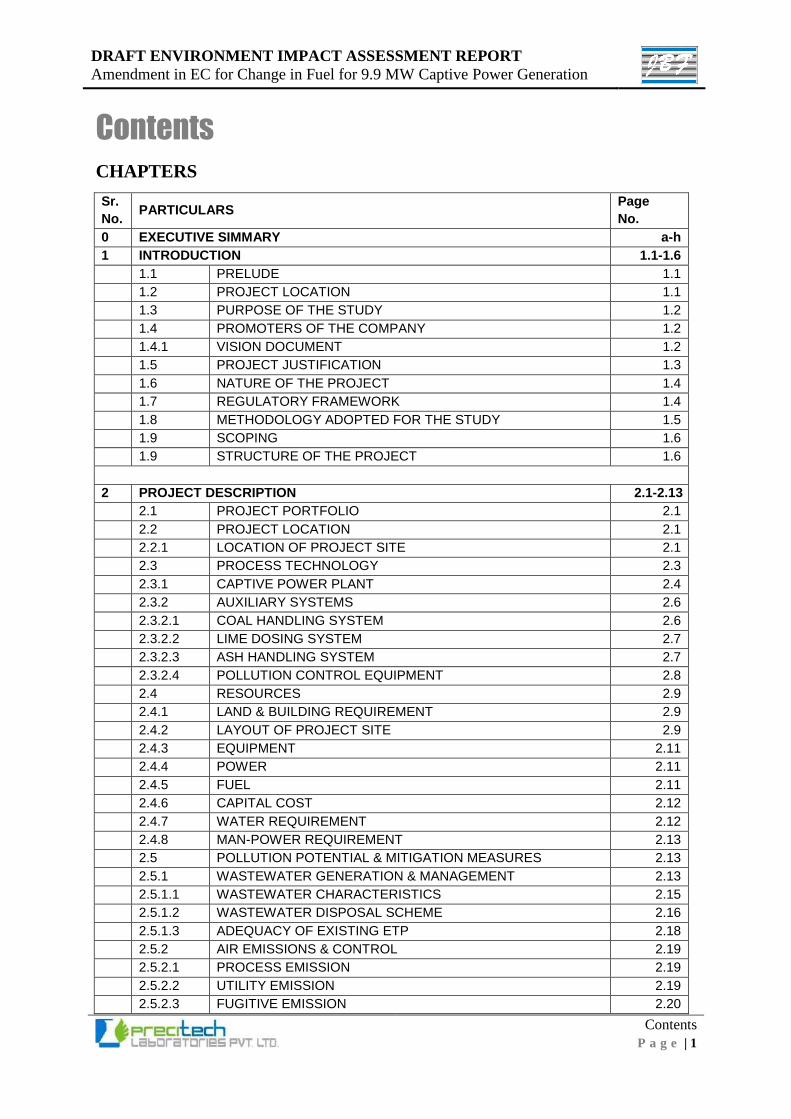
CHAPTERS
Sr.
No. PARTICULARS
Page
No.
0 EXECUTIVE SIMMARY a-h
1 INTRODUCTION 1.1-1.6
1.1 PRELUDE 1.1
1.2 PROJECT LOCATION 1.1
1.3 PURPOSE OF THE STUDY 1.2
1.4 PROMOTERS OF THE COMPANY 1.2
1.4.1 VISION DOCUMENT 1.2
1.5 PROJECT JUSTIFICATION 1.3
1.6 NATURE OF THE PROJECT 1.4
1.7 REGULATORY FRAMEWORK 1.4
1.8 METHODOLOGY ADOPTED FOR THE STUDY 1.5
1.9 SCOPING 1.6
1.9 STRUCTURE OF THE PROJECT 1.6
2 PROJECT DESCRIPTION 2.1-2.13
2.1 PROJECT PORTFOLIO 2.1
2.2 PROJECT LOCATION 2.1
2.2.1 LOCATION OF PROJECT SITE 2.1
2.3 PROCESS TECHNOLOGY 2.3
2.3.1 CAPTIVE POWER PLANT 2.4
2.3.2 AUXILIARY SYSTEMS 2.6
2.3.2.1 COAL HANDLING SYSTEM 2.6
2.3.2.2 LIME DOSING SYSTEM 2.7
2.3.2.3 ASH HANDLING SYSTEM 2.7
2.3.2.4 POLLUTION CONTROL EQUIPMENT 2.8
2.4 RESOURCES 2.9
2.4.1 LAND & BUILDING REQUIREMENT 2.9
2.4.2 LAYOUT OF PROJECT SITE 2.9
2.4.3 EQUIPMENT 2.11
2.4.4 POWER 2.11
2.4.5 FUEL 2.11
2.4.6 CAPITAL COST 2.12
2.4.7 WATER REQUIREMENT 2.12
2.4.8 MAN-POWER REQUIREMENT 2.13
2.5 POLLUTION POTENTIAL & MITIGATION MEASURES 2.13
2.5.1 WASTEWATER GENERATION & MANAGEMENT 2.13
2.5.1.1 WASTEWATER CHARACTERISTICS 2.15
2.5.1.2 WASTEWATER DISPOSAL SCHEME 2.16
2.5.1.3 ADEQUACY OF EXISTING ETP 2.18
2.5.2 AIR EMISSIONS & CONTROL 2.19
2.5.2.1 PROCESS EMISSION 2.19
2.5.2.2 UTILITY EMISSION 2.19
2.5.2.3 FUGITIVE EMISSION 2.20
DRAFT ENVIRONMENT IMPACT ASSESSMENT REPORT
Amendment in EC for Change in Fuel for 9.9 MW Captive Power Generation
Contents
P a g e | 2
Sr.
No. PARTICULARS
Page
No.
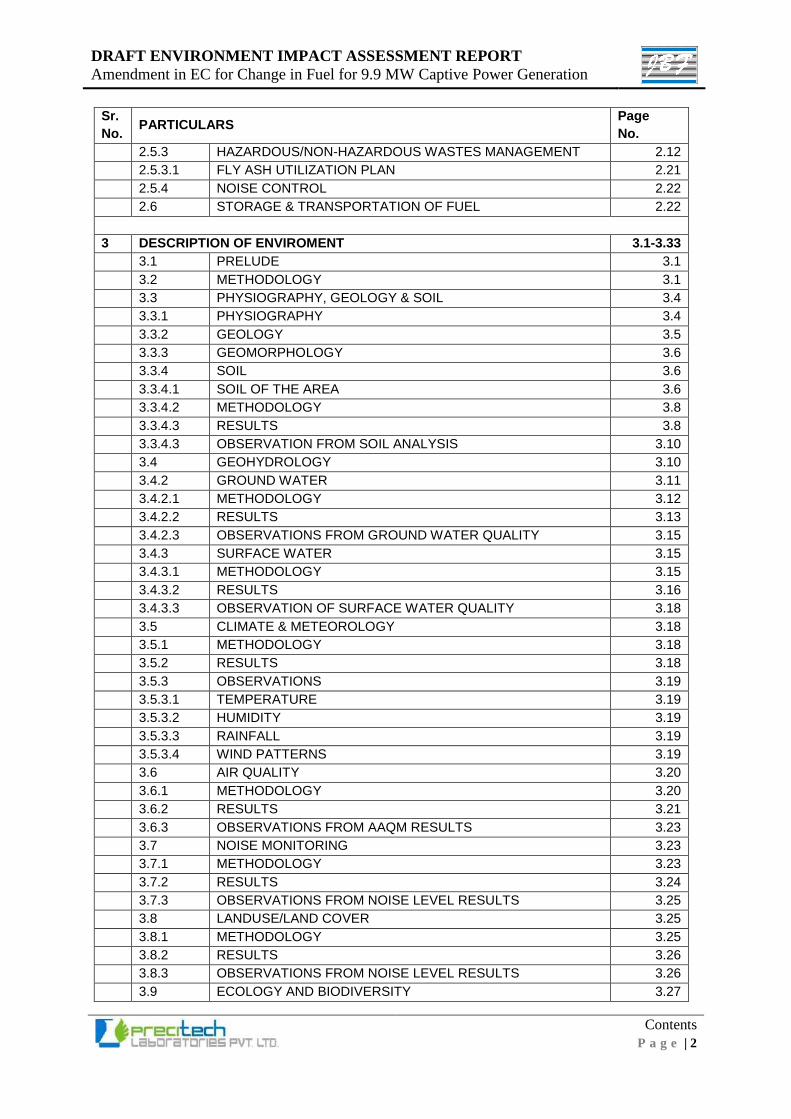
2.5.3 HAZARDOUS/NON-HAZARDOUS WASTES MANAGEMENT 2.12
2.5.3.1 FLY ASH UTILIZATION PLAN 2.21
2.5.4 NOISE CONTROL 2.22
2.6 STORAGE & TRANSPORTATION OF FUEL 2.22
3 DESCRIPTION OF ENVIROMENT 3.1-3.33
3.1 PRELUDE 3.1
3.2 METHODOLOGY 3.1
3.3 PHYSIOGRAPHY, GEOLOGY & SOIL 3.4
3.3.1 PHYSIOGRAPHY 3.4
3.3.2 GEOLOGY 3.5
3.3.3 GEOMORPHOLOGY 3.6
3.3.4 SOIL 3.6
3.3.4.1 SOIL OF THE AREA 3.6
3.3.4.2 METHODOLOGY 3.8
3.3.4.3 RESULTS 3.8
3.3.4.3 OBSERVATION FROM SOIL ANALYSIS 3.10
3.4 GEOHYDROLOGY 3.10
3.4.2 GROUND WATER 3.11
3.4.2.1 METHODOLOGY 3.12
3.4.2.2 RESULTS 3.13
3.4.2.3 OBSERVATIONS FROM GROUND WATER QUALITY 3.15
3.4.3 SURFACE WATER 3.15
3.4.3.1 METHODOLOGY 3.15
3.4.3.2 RESULTS 3.16
3.4.3.3 OBSERVATION OF SURFACE WATER QUALITY 3.18
3.5 CLIMATE & METEOROLOGY 3.18
3.5.1 METHODOLOGY 3.18
3.5.2 RESULTS 3.18
3.5.3 OBSERVATIONS 3.19
3.5.3.1 TEMPERATURE 3.19
3.5.3.2 HUMIDITY 3.19
3.5.3.3 RAINFALL 3.19
3.5.3.4 WIND PATTERNS 3.19
3.6 AIR QUALITY 3.20
3.6.1 METHODOLOGY 3.20
3.6.2 RESULTS 3.21
3.6.3 OBSERVATIONS FROM AAQM RESULTS 3.23
3.7 NOISE MONITORING 3.23
3.7.1 METHODOLOGY 3.23
3.7.2 RESULTS 3.24
3.7.3 OBSERVATIONS FROM NOISE LEVEL RESULTS 3.25
3.8 LANDUSE/LAND COVER 3.25
3.8.1 METHODOLOGY 3.25
3.8.2 RESULTS 3.26
3.8.3 OBSERVATIONS FROM NOISE LEVEL RESULTS 3.26
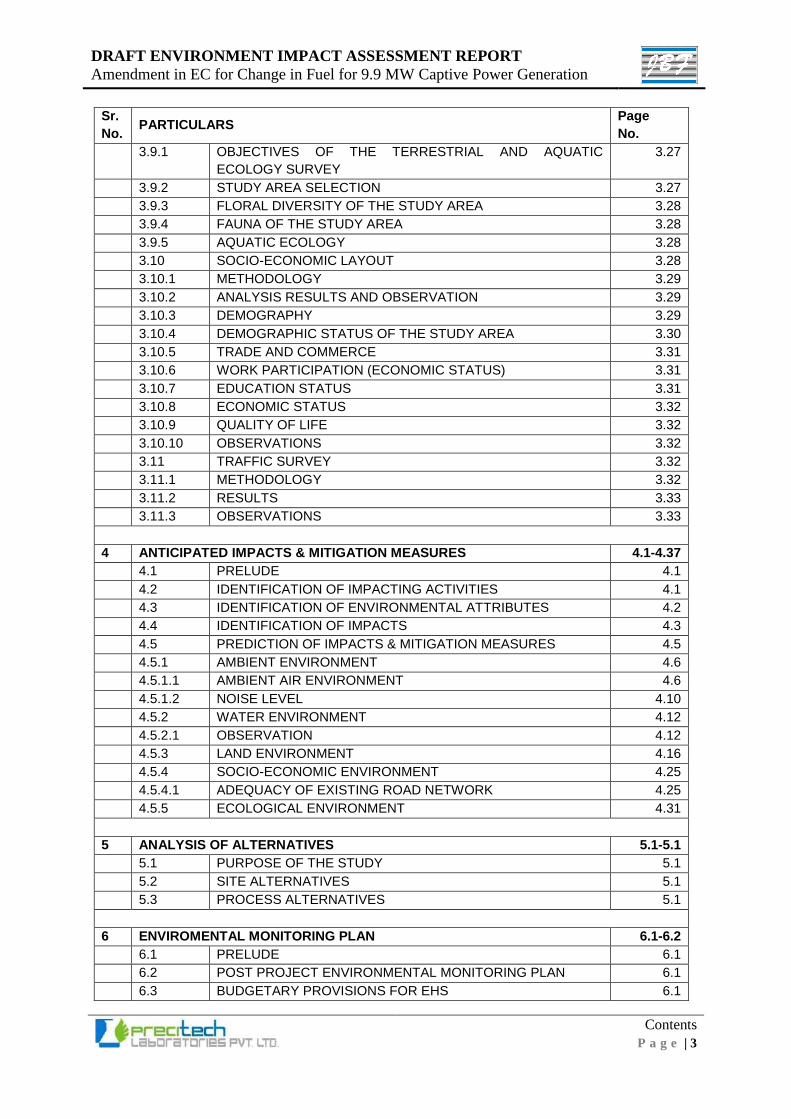
3.9 ECOLOGY AND BIODIVERSITY 3.27
DRAFT ENVIRONMENT IMPACT ASSESSMENT REPORT
Amendment in EC for Change in Fuel for 9.9 MW Captive Power Generation
Contents
P a g e | 3
Sr.
No. PARTICULARS
Page
No.
3.9.1 OBJECTIVES OF THE TERRESTRIAL AND AQUATIC
ECOLOGY SURVEY
3.27
3.9.2 STUDY AREA SELECTION 3.27
3.9.3 FLORAL DIVERSITY OF THE STUDY AREA 3.28
3.9.4 FAUNA OF THE STUDY AREA 3.28
3.9.5 AQUATIC ECOLOGY 3.28
3.10 SOCIO-ECONOMIC LAYOUT 3.28
3.10.1 METHODOLOGY 3.29
3.10.2 ANALYSIS RESULTS AND OBSERVATION 3.29
3.10.3 DEMOGRAPHY 3.29
3.10.4 DEMOGRAPHIC STATUS OF THE STUDY AREA 3.30
3.10.5 TRADE AND COMMERCE 3.31
3.10.6 WORK PARTICIPATION (ECONOMIC STATUS) 3.31
3.10.7 EDUCATION STATUS 3.31
3.10.8 ECONOMIC STATUS 3.32
3.10.9 QUALITY OF LIFE 3.32
3.10.10 OBSERVATIONS 3.32
3.11 TRAFFIC SURVEY 3.32
3.11.1 METHODOLOGY 3.32
3.11.2 RESULTS 3.33
3.11.3 OBSERVATIONS 3.33
4 ANTICIPATED IMPACTS & MITIGATION MEASURES 4.1-4.37
4.1 PRELUDE 4.1
4.2 IDENTIFICATION OF IMPACTING ACTIVITIES 4.1
4.3 IDENTIFICATION OF ENVIRONMENTAL ATTRIBUTES 4.2
4.4 IDENTIFICATION OF IMPACTS 4.3
4.5 PREDICTION OF IMPACTS & MITIGATION MEASURES 4.5
4.5.1 AMBIENT ENVIRONMENT 4.6
4.5.1.1 AMBIENT AIR ENVIRONMENT 4.6
4.5.1.2 NOISE LEVEL 4.10
4.5.2 WATER ENVIRONMENT 4.12
4.5.2.1 OBSERVATION 4.12
4.5.3 LAND ENVIRONMENT 4.16
4.5.4 SOCIO-ECONOMIC ENVIRONMENT 4.25
4.5.4.1 ADEQUACY OF EXISTING ROAD NETWORK 4.25
4.5.5 ECOLOGICAL ENVIRONMENT 4.31
5 ANALYSIS OF ALTERNATIVES 5.1-5.1
5.1 PURPOSE OF THE STUDY 5.1
5.2 SITE ALTERNATIVES 5.1
5.3 PROCESS ALTERNATIVES 5.1
6 ENVIROMENTAL MONITORING PLAN 6.1-6.2
6.1 PRELUDE 6.1
6.2 POST PROJECT ENVIRONMENTAL MONITORING PLAN 6.1
6.3 BUDGETARY PROVISIONS FOR EHS 6.1
DRAFT ENVIRONMENT IMPACT ASSESSMENT REPORT
Amendment in EC for Change in Fuel for 9.9 MW Captive Power Generation
Contents
P a g e | 4
Sr.
No. PARTICULARS
Page
No.
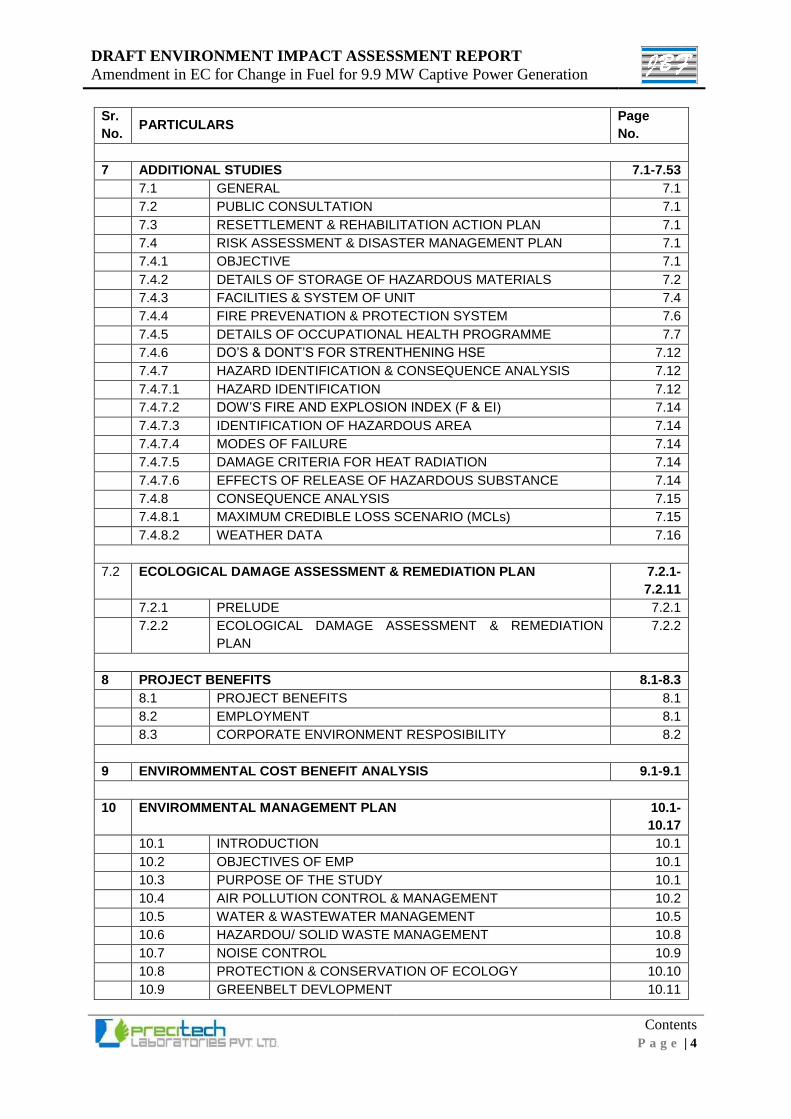
7 ADDITIONAL STUDIES 7.1-7.53
7.1 GENERAL 7.1
7.2 PUBLIC CONSULTATION 7.1
7.3 RESETTLEMENT & REHABILITATION ACTION PLAN 7.1
7.4 RISK ASSESSMENT & DISASTER MANAGEMENT PLAN 7.1
7.4.1 OBJECTIVE 7.1
7.4.2 DETAILS OF STORAGE OF HAZARDOUS MATERIALS 7.2
7.4.3 FACILITIES & SYSTEM OF UNIT 7.4
7.4.4 FIRE PREVENATION & PROTECTION SYSTEM 7.6
7.4.5 DETAILS OF OCCUPATIONAL HEALTH PROGRAMME 7.7
7.4.6 DO’S & DONT’S FOR STRENTHENING HSE 7.12
7.4.7 HAZARD IDENTIFICATION & CONSEQUENCE ANALYSIS 7.12
7.4.7.1 HAZARD IDENTIFICATION 7.12
7.4.7.2 DOW’S FIRE AND EXPLOSION INDEX (F & EI) 7.14
7.4.7.3 IDENTIFICATION OF HAZARDOUS AREA 7.14
7.4.7.4 MODES OF FAILURE 7.14
7.4.7.5 DAMAGE CRITERIA FOR HEAT RADIATION 7.14
7.4.7.6 EFFECTS OF RELEASE OF HAZARDOUS SUBSTANCE 7.14
7.4.8 CONSEQUENCE ANALYSIS 7.15
7.4.8.1 MAXIMUM CREDIBLE LOSS SCENARIO (MCLs) 7.15
7.4.8.2 WEATHER DATA 7.16
7.2 ECOLOGICAL DAMAGE ASSESSMENT & REMEDIATION PLAN 7.2.1-
7.2.11
7.2.1 PRELUDE 7.2.1
7.2.2 ECOLOGICAL DAMAGE ASSESSMENT & REMEDIATION
PLAN
7.2.2
8 PROJECT BENEFITS 8.1-8.3
8.1 PROJECT BENEFITS 8.1
8.2 EMPLOYMENT 8.1
8.3 CORPORATE ENVIRONMENT RESPOSIBILITY 8.2
9 ENVIROMMENTAL COST BENEFIT ANALYSIS 9.1-9.1
10 ENVIROMMENTAL MANAGEMENT PLAN 10.1-
10.17
10.1 INTRODUCTION 10.1
10.2 OBJECTIVES OF EMP 10.1
10.3 PURPOSE OF THE STUDY 10.1
10.4 AIR POLLUTION CONTROL & MANAGEMENT 10.2
10.5 WATER & WASTEWATER MANAGEMENT 10.5
10.6 HAZARDOU/ SOLID WASTE MANAGEMENT 10.8
10.7 NOISE CONTROL 10.9
10.8 PROTECTION & CONSERVATION OF ECOLOGY 10.10
10.9 GREENBELT DEVLOPMENT 10.11
DRAFT ENVIRONMENT IMPACT ASSESSMENT REPORT
Amendment in EC for Change in Fuel for 9.9 MW Captive Power Generation
Contents
P a g e | 5
Sr.
No. PARTICULARS
Page
No.
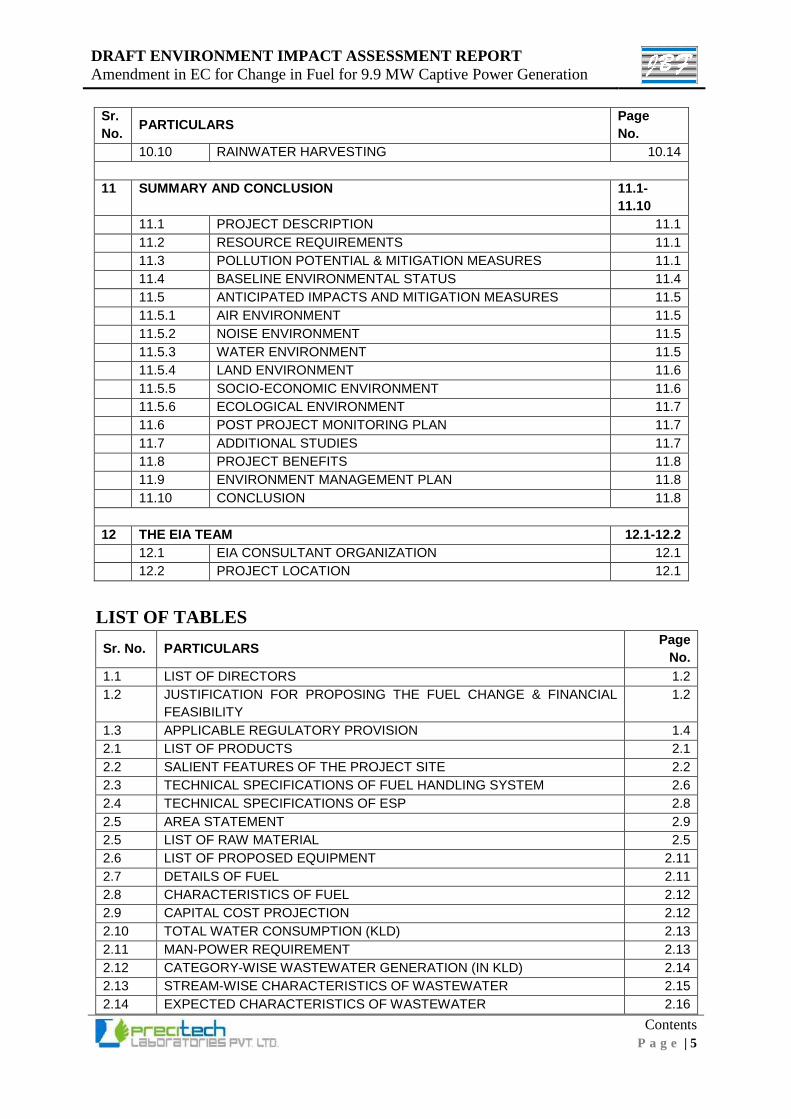
10.10 RAINWATER HARVESTING 10.14
11 SUMMARY AND CONCLUSION 11.1-
11.10
11.1 PROJECT DESCRIPTION 11.1
11.2 RESOURCE REQUIREMENTS 11.1
11.3 POLLUTION POTENTIAL & MITIGATION MEASURES 11.1
11.4 BASELINE ENVIRONMENTAL STATUS 11.4
11.5 ANTICIPATED IMPACTS AND MITIGATION MEASURES 11.5
11.5.1 AIR ENVIRONMENT 11.5
11.5.2 NOISE ENVIRONMENT 11.5
11.5.3 WATER ENVIRONMENT 11.5
11.5.4 LAND ENVIRONMENT 11.6
11.5.5 SOCIO-ECONOMIC ENVIRONMENT 11.6
11.5.6 ECOLOGICAL ENVIRONMENT 11.7
11.6 POST PROJECT MONITORING PLAN 11.7
11.7 ADDITIONAL STUDIES 11.7
11.8 PROJECT BENEFITS 11.8
11.9 ENVIRONMENT MANAGEMENT PLAN 11.8
11.10 CONCLUSION 11.8
12 THE EIA TEAM 12.1-12.2
12.1 EIA CONSULTANT ORGANIZATION 12.1
12.2 PROJECT LOCATION 12.1
LIST OF TABLES
Sr. No. PARTICULARS Page
No.
1.1 LIST OF DIRECTORS 1.2
1.2 JUSTIFICATION FOR PROPOSING THE FUEL CHANGE & FINANCIAL
FEASIBILITY
1.2
1.3 APPLICABLE REGULATORY PROVISION 1.4
2.1 LIST OF PRODUCTS 2.1
2.2 SALIENT FEATURES OF THE PROJECT SITE 2.2
2.3 TECHNICAL SPECIFICATIONS OF FUEL HANDLING SYSTEM 2.6
2.4 TECHNICAL SPECIFICATIONS OF ESP 2.8
2.5 AREA STATEMENT 2.9
2.5 LIST OF RAW MATERIAL 2.5
2.6 LIST OF PROPOSED EQUIPMENT 2.11
2.7 DETAILS OF FUEL 2.11
2.8 CHARACTERISTICS OF FUEL 2.12
2.9 CAPITAL COST PROJECTION 2.12
2.10 TOTAL WATER CONSUMPTION (KLD) 2.13
2.11 MAN-POWER REQUIREMENT 2.13
2.12 CATEGORY-WISE WASTEWATER GENERATION (IN KLD) 2.14
2.13 STREAM-WISE CHARACTERISTICS OF WASTEWATER 2.15
2.14 EXPECTED CHARACTERISTICS OF WASTEWATER 2.16
DRAFT ENVIRONMENT IMPACT ASSESSMENT REPORT
Amendment in EC for Change in Fuel for 9.9 MW Captive Power Generation
Contents
P a g e | 6
Sr. No. PARTICULARS Page
No.
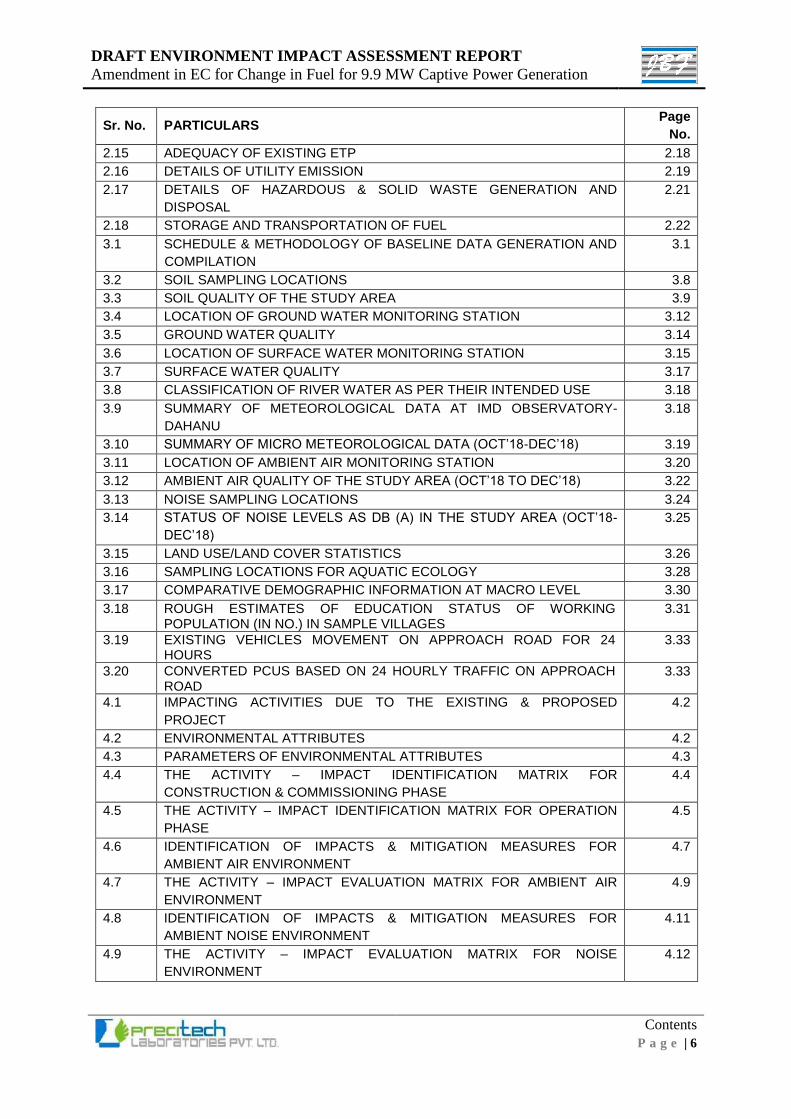
2.15 ADEQUACY OF EXISTING ETP 2.18
2.16 DETAILS OF UTILITY EMISSION 2.19
2.17 DETAILS OF HAZARDOUS & SOLID WASTE GENERATION AND
DISPOSAL
2.21
2.18 STORAGE AND TRANSPORTATION OF FUEL 2.22
3.1 SCHEDULE & METHODOLOGY OF BASELINE DATA GENERATION AND
COMPILATION
3.1
3.2 SOIL SAMPLING LOCATIONS 3.8
3.3 SOIL QUALITY OF THE STUDY AREA 3.9
3.4 LOCATION OF GROUND WATER MONITORING STATION 3.12
3.5 GROUND WATER QUALITY 3.14
3.6 LOCATION OF SURFACE WATER MONITORING STATION 3.15
3.7 SURFACE WATER QUALITY 3.17
3.8 CLASSIFICATION OF RIVER WATER AS PER THEIR INTENDED USE 3.18
3.9 SUMMARY OF METEOROLOGICAL DATA AT IMD OBSERVATORY-
DAHANU
3.18
3.10 SUMMARY OF MICRO METEOROLOGICAL DATA (OCT’18-DEC’18) 3.19
3.11 LOCATION OF AMBIENT AIR MONITORING STATION 3.20
3.12 AMBIENT AIR QUALITY OF THE STUDY AREA (OCT’18 TO DEC’18) 3.22
3.13 NOISE SAMPLING LOCATIONS 3.24
3.14 STATUS OF NOISE LEVELS AS DB (A) IN THE STUDY AREA (OCT’18-
DEC’18)
3.25
3.15 LAND USE/LAND COVER STATISTICS 3.26
3.16 SAMPLING LOCATIONS FOR AQUATIC ECOLOGY 3.28
3.17 COMPARATIVE DEMOGRAPHIC INFORMATION AT MACRO LEVEL 3.30
3.18 ROUGH ESTIMATES OF EDUCATION STATUS OF WORKING POPULATION (IN NO.) IN SAMPLE VILLAGES
3.31
3.19 EXISTING VEHICLES MOVEMENT ON APPROACH ROAD FOR 24 HOURS
3.33
3.20 CONVERTED PCUS BASED ON 24 HOURLY TRAFFIC ON APPROACH ROAD
3.33
4.1 IMPACTING ACTIVITIES DUE TO THE EXISTING & PROPOSED
PROJECT
4.2
4.2 ENVIRONMENTAL ATTRIBUTES 4.2
4.3 PARAMETERS OF ENVIRONMENTAL ATTRIBUTES 4.3
4.4 THE ACTIVITY – IMPACT IDENTIFICATION MATRIX FOR
CONSTRUCTION & COMMISSIONING PHASE
4.4
4.5 THE ACTIVITY – IMPACT IDENTIFICATION MATRIX FOR OPERATION
PHASE
4.5
4.6 IDENTIFICATION OF IMPACTS & MITIGATION MEASURES FOR
AMBIENT AIR ENVIRONMENT
4.7
4.7 THE ACTIVITY – IMPACT EVALUATION MATRIX FOR AMBIENT AIR
ENVIRONMENT
4.9
4.8 IDENTIFICATION OF IMPACTS & MITIGATION MEASURES FOR
AMBIENT NOISE ENVIRONMENT
4.11
4.9 THE ACTIVITY – IMPACT EVALUATION MATRIX FOR NOISE
ENVIRONMENT
4.12
DRAFT ENVIRONMENT IMPACT ASSESSMENT REPORT
Amendment in EC for Change in Fuel for 9.9 MW Captive Power Generation
Contents
P a g e | 7
Sr. No. PARTICULARS Page
No.
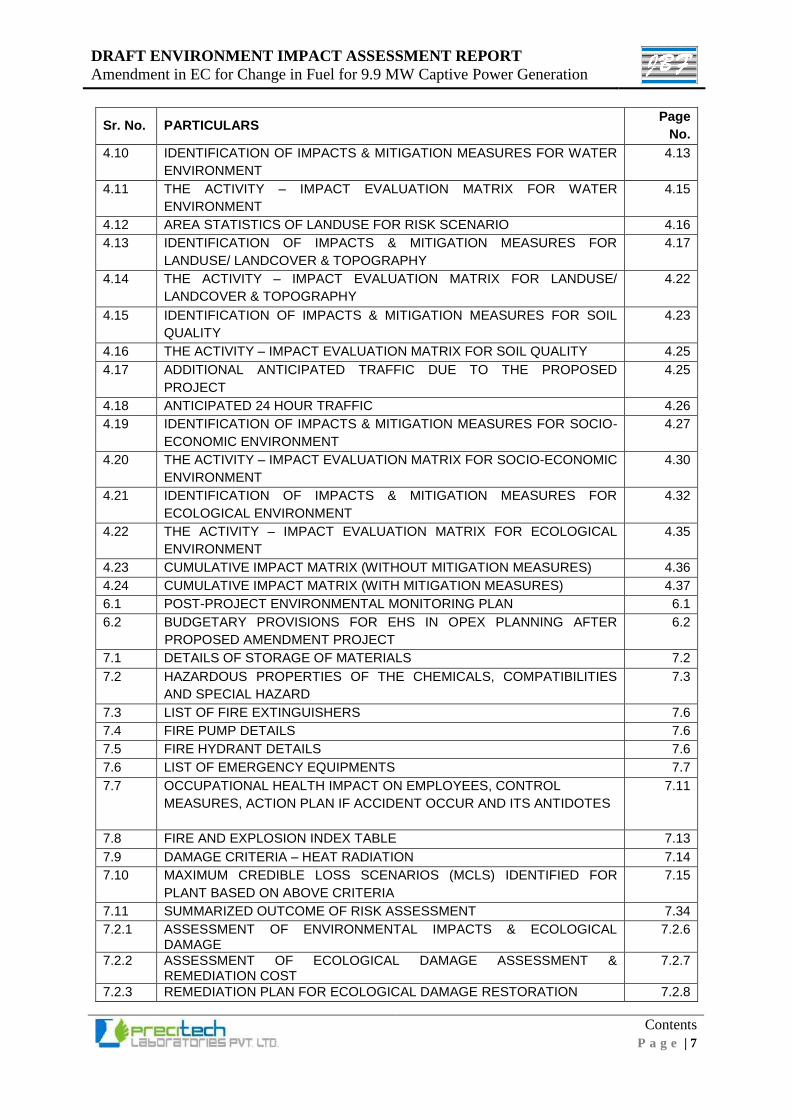
4.10 IDENTIFICATION OF IMPACTS & MITIGATION MEASURES FOR WATER
ENVIRONMENT
4.13
4.11 THE ACTIVITY – IMPACT EVALUATION MATRIX FOR WATER
ENVIRONMENT
4.15
4.12 AREA STATISTICS OF LANDUSE FOR RISK SCENARIO 4.16
4.13 IDENTIFICATION OF IMPACTS & MITIGATION MEASURES FOR
LANDUSE/ LANDCOVER & TOPOGRAPHY
4.17
4.14 THE ACTIVITY – IMPACT EVALUATION MATRIX FOR LANDUSE/
LANDCOVER & TOPOGRAPHY
4.22
4.15 IDENTIFICATION OF IMPACTS & MITIGATION MEASURES FOR SOIL
QUALITY
4.23
4.16 THE ACTIVITY – IMPACT EVALUATION MATRIX FOR SOIL QUALITY 4.25
4.17 ADDITIONAL ANTICIPATED TRAFFIC DUE TO THE PROPOSED
PROJECT
4.25
4.18 ANTICIPATED 24 HOUR TRAFFIC 4.26
4.19 IDENTIFICATION OF IMPACTS & MITIGATION MEASURES FOR SOCIO-
ECONOMIC ENVIRONMENT
4.27
4.20 THE ACTIVITY – IMPACT EVALUATION MATRIX FOR SOCIO-ECONOMIC
ENVIRONMENT
4.30
4.21 IDENTIFICATION OF IMPACTS & MITIGATION MEASURES FOR
ECOLOGICAL ENVIRONMENT
4.32
4.22 THE ACTIVITY – IMPACT EVALUATION MATRIX FOR ECOLOGICAL
ENVIRONMENT
4.35
4.23 CUMULATIVE IMPACT MATRIX (WITHOUT MITIGATION MEASURES) 4.36
4.24 CUMULATIVE IMPACT MATRIX (WITH MITIGATION MEASURES) 4.37
6.1 POST-PROJECT ENVIRONMENTAL MONITORING PLAN 6.1
6.2 BUDGETARY PROVISIONS FOR EHS IN OPEX PLANNING AFTER
PROPOSED AMENDMENT PROJECT
6.2
7.1 DETAILS OF STORAGE OF MATERIALS 7.2
7.2 HAZARDOUS PROPERTIES OF THE CHEMICALS, COMPATIBILITIES
AND SPECIAL HAZARD
7.3
7.3 LIST OF FIRE EXTINGUISHERS 7.6
7.4 FIRE PUMP DETAILS 7.6
7.5 FIRE HYDRANT DETAILS 7.6
7.6 LIST OF EMERGENCY EQUIPMENTS 7.7
7.7 OCCUPATIONAL HEALTH IMPACT ON EMPLOYEES, CONTROL
MEASURES, ACTION PLAN IF ACCIDENT OCCUR AND ITS ANTIDOTES
7.11
7.8 FIRE AND EXPLOSION INDEX TABLE 7.13
7.9 DAMAGE CRITERIA – HEAT RADIATION 7.14
7.10 MAXIMUM CREDIBLE LOSS SCENARIOS (MCLS) IDENTIFIED FOR
PLANT BASED ON ABOVE CRITERIA
7.15
7.11 SUMMARIZED OUTCOME OF RISK ASSESSMENT 7.34
7.2.1 ASSESSMENT OF ENVIRONMENTAL IMPACTS & ECOLOGICAL DAMAGE
7.2.6
7.2.2 ASSESSMENT OF ECOLOGICAL DAMAGE ASSESSMENT & REMEDIATION COST
7.2.7
7.2.3 REMEDIATION PLAN FOR ECOLOGICAL DAMAGE RESTORATION 7.2.8
DRAFT ENVIRONMENT IMPACT ASSESSMENT REPORT
Amendment in EC for Change in Fuel for 9.9 MW Captive Power Generation
Contents
P a g e | 8
Sr. No. PARTICULARS Page
No.
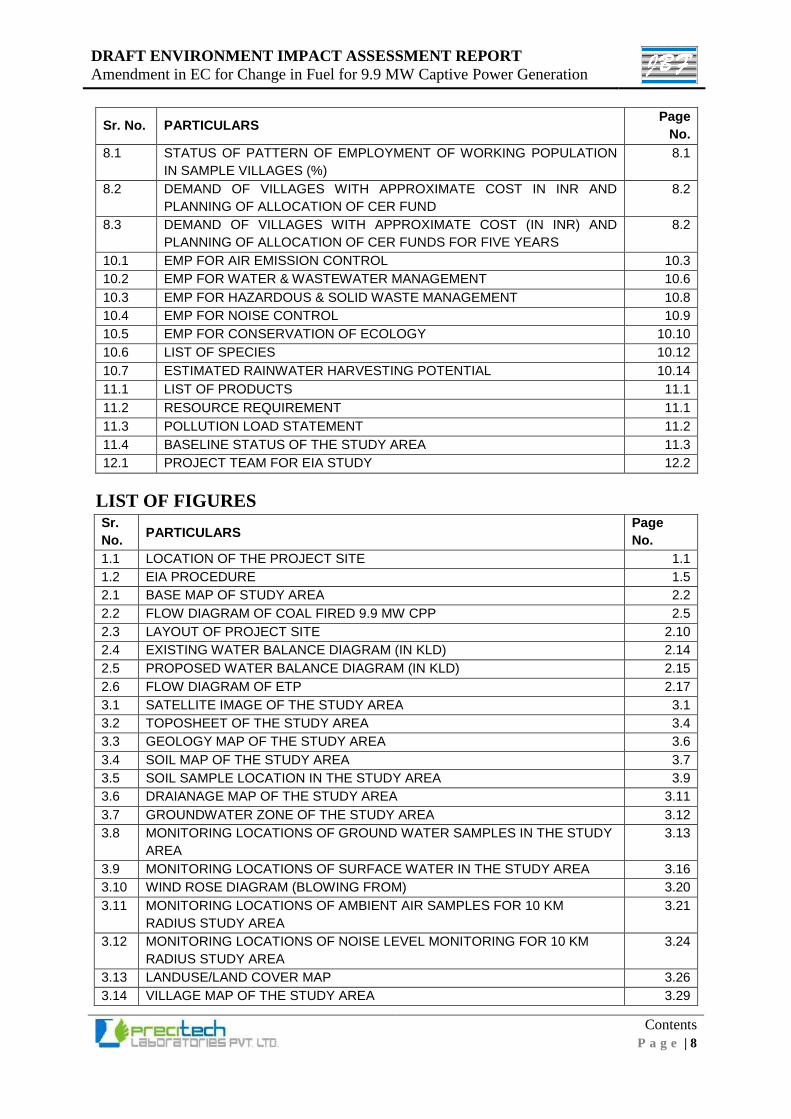
8.1 STATUS OF PATTERN OF EMPLOYMENT OF WORKING POPULATION
IN SAMPLE VILLAGES (%)
8.1
8.2 DEMAND OF VILLAGES WITH APPROXIMATE COST IN INR AND
PLANNING OF ALLOCATION OF CER FUND
8.2
8.3 DEMAND OF VILLAGES WITH APPROXIMATE COST (IN INR) AND
PLANNING OF ALLOCATION OF CER FUNDS FOR FIVE YEARS
8.2
10.1 EMP FOR AIR EMISSION CONTROL 10.3
10.2 EMP FOR WATER & WASTEWATER MANAGEMENT 10.6
10.3 EMP FOR HAZARDOUS & SOLID WASTE MANAGEMENT 10.8
10.4 EMP FOR NOISE CONTROL 10.9
10.5 EMP FOR CONSERVATION OF ECOLOGY 10.10
10.6 LIST OF SPECIES 10.12
10.7 ESTIMATED RAINWATER HARVESTING POTENTIAL 10.14
11.1 LIST OF PRODUCTS 11.1
11.2 RESOURCE REQUIREMENT 11.1
11.3 POLLUTION LOAD STATEMENT 11.2
11.4 BASELINE STATUS OF THE STUDY AREA 11.3
12.1 PROJECT TEAM FOR EIA STUDY 12.2
LIST OF FIGURES Sr.
No. PARTICULARS
Page
No.
1.1 LOCATION OF THE PROJECT SITE 1.1
1.2 EIA PROCEDURE 1.5
2.1 BASE MAP OF STUDY AREA 2.2
2.2 FLOW DIAGRAM OF COAL FIRED 9.9 MW CPP 2.5
2.3 LAYOUT OF PROJECT SITE 2.10
2.4 EXISTING WATER BALANCE DIAGRAM (IN KLD) 2.14
2.5 PROPOSED WATER BALANCE DIAGRAM (IN KLD) 2.15
2.6 FLOW DIAGRAM OF ETP 2.17
3.1 SATELLITE IMAGE OF THE STUDY AREA 3.1
3.2 TOPOSHEET OF THE STUDY AREA 3.4
3.3 GEOLOGY MAP OF THE STUDY AREA 3.6
3.4 SOIL MAP OF THE STUDY AREA 3.7
3.5 SOIL SAMPLE LOCATION IN THE STUDY AREA 3.9
3.6 DRAIANAGE MAP OF THE STUDY AREA 3.11
3.7 GROUNDWATER ZONE OF THE STUDY AREA 3.12
3.8 MONITORING LOCATIONS OF GROUND WATER SAMPLES IN THE STUDY
AREA
3.13
3.9 MONITORING LOCATIONS OF SURFACE WATER IN THE STUDY AREA 3.16
3.10 WIND ROSE DIAGRAM (BLOWING FROM) 3.20
3.11 MONITORING LOCATIONS OF AMBIENT AIR SAMPLES FOR 10 KM
RADIUS STUDY AREA
3.21
3.12 MONITORING LOCATIONS OF NOISE LEVEL MONITORING FOR 10 KM
RADIUS STUDY AREA
3.24
3.13 LANDUSE/LAND COVER MAP 3.26
3.14 VILLAGE MAP OF THE STUDY AREA 3.29
DRAFT ENVIRONMENT IMPACT ASSESSMENT REPORT
Amendment in EC for Change in Fuel for 9.9 MW Captive Power Generation
Contents
P a g e | 9
Sr.
No. PARTICULARS
Page
No.
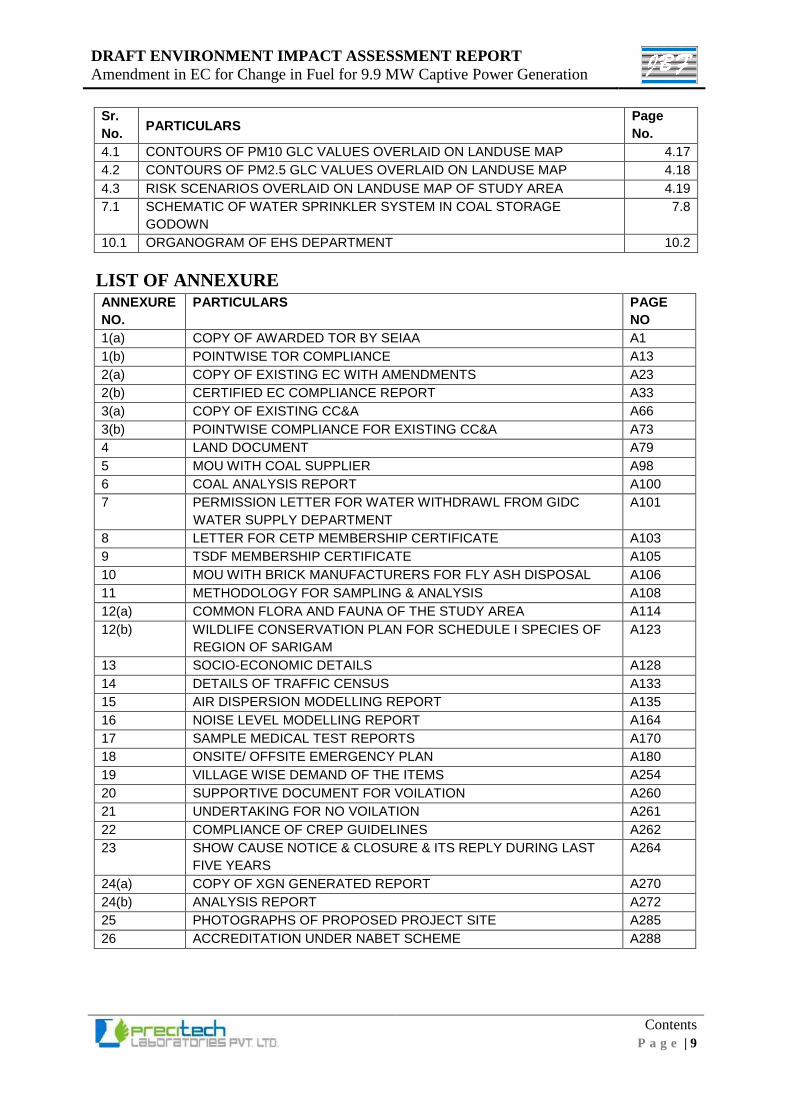
4.1 CONTOURS OF PM10 GLC VALUES OVERLAID ON LANDUSE MAP 4.17
4.2 CONTOURS OF PM2.5 GLC VALUES OVERLAID ON LANDUSE MAP 4.18
4.3 RISK SCENARIOS OVERLAID ON LANDUSE MAP OF STUDY AREA 4.19
7.1 SCHEMATIC OF WATER SPRINKLER SYSTEM IN COAL STORAGE
GODOWN
7.8
10.1 ORGANOGRAM OF EHS DEPARTMENT 10.2
LIST OF ANNEXURE ANNEXURE
NO.
PARTICULARS PAGE
NO
1(a) COPY OF AWARDED TOR BY SEIAA A1
1(b) POINTWISE TOR COMPLIANCE A13
2(a) COPY OF EXISTING EC WITH AMENDMENTS A23 2(b) CERTIFIED EC COMPLIANCE REPORT A33 3(a) COPY OF EXISTING CC&A A66 3(b) POINTWISE COMPLIANCE FOR EXISTING CC&A A73 4 LAND DOCUMENT A79 5 MOU WITH COAL SUPPLIER A98 6 COAL ANALYSIS REPORT A100 7 PERMISSION LETTER FOR WATER WITHDRAWL FROM GIDC
WATER SUPPLY DEPARTMENT
A101
8 LETTER FOR CETP MEMBERSHIP CERTIFICATE A103 9 TSDF MEMBERSHIP CERTIFICATE A105
10 MOU WITH BRICK MANUFACTURERS FOR FLY ASH DISPOSAL A106 11 METHODOLOGY FOR SAMPLING & ANALYSIS A108 12(a) COMMON FLORA AND FAUNA OF THE STUDY AREA A114 12(b) WILDLIFE CONSERVATION PLAN FOR SCHEDULE I SPECIES OF
REGION OF SARIGAM
A123
13 SOCIO-ECONOMIC DETAILS A128 14 DETAILS OF TRAFFIC CENSUS A133 15 AIR DISPERSION MODELLING REPORT A135 16 NOISE LEVEL MODELLING REPORT A164
17 SAMPLE MEDICAL TEST REPORTS A170 18 ONSITE/ OFFSITE EMERGENCY PLAN A180 19 VILLAGE WISE DEMAND OF THE ITEMS A254 20 SUPPORTIVE DOCUMENT FOR VOILATION A260 21 UNDERTAKING FOR NO VOILATION A261 22 COMPLIANCE OF CREP GUIDELINES A262 23 SHOW CAUSE NOTICE & CLOSURE & ITS REPLY DURING LAST
FIVE YEARS
A264
24(a) COPY OF XGN GENERATED REPORT A270 24(b) ANALYSIS REPORT A272
25 PHOTOGRAPHS OF PROPOSED PROJECT SITE A285
26 ACCREDITATION UNDER NABET SCHEME A288

Abbreviations
DRAFT ENVIRONMENT IMPACT ASSESSMENT REPORT
Amendment in EC for Change in Fuel for 9.9 MW Captive Power Generation
Abbreviations
Page. i
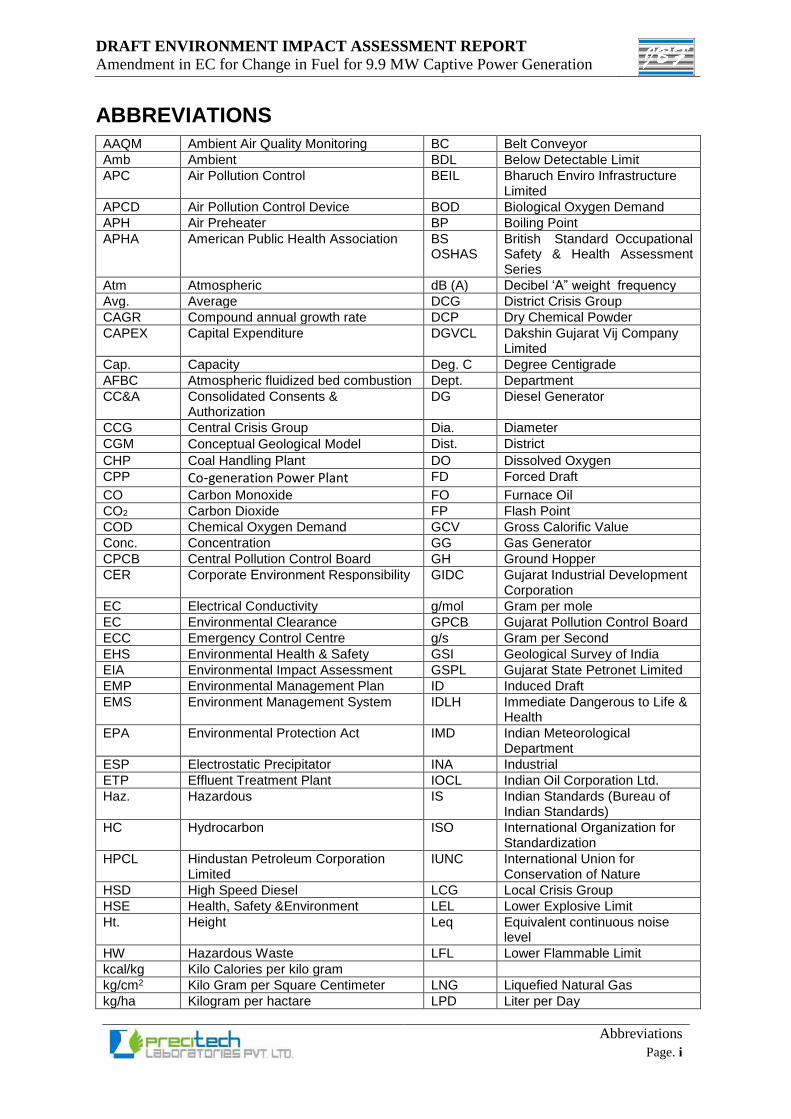
ABBREVIATIONS
AAQM Ambient Air Quality Monitoring BC Belt Conveyor
Amb Ambient BDL Below Detectable Limit
APC Air Pollution Control BEIL Bharuch Enviro Infrastructure Limited
APCD Air Pollution Control Device BOD Biological Oxygen Demand
APH Air Preheater BP Boiling Point
APHA American Public Health Association BS OSHAS
British Standard Occupational Safety & Health Assessment Series
Atm Atmospheric dB (A) Decibel ‘A” weight frequency
Avg. Average DCG District Crisis Group
CAGR Compound annual growth rate DCP Dry Chemical Powder
CAPEX Capital Expenditure DGVCL Dakshin Gujarat Vij Company Limited
Cap. Capacity Deg. C Degree Centigrade
AFBC Atmospheric fluidized bed combustion Dept. Department
CC&A Consolidated Consents & Authorization
DG Diesel Generator
CCG Central Crisis Group Dia. Diameter
CGM Conceptual Geological Model Dist. District
CHP Coal Handling Plant DO Dissolved Oxygen
CPP Co‐generation Power Plant FD Forced Draft
CO Carbon Monoxide FO Furnace Oil
CO2 Carbon Dioxide FP Flash Point
COD Chemical Oxygen Demand GCV Gross Calorific Value
Conc. Concentration GG Gas Generator
CPCB Central Pollution Control Board GH Ground Hopper
CER Corporate Environment Responsibility GIDC Gujarat Industrial Development Corporation
EC Electrical Conductivity g/mol Gram per mole
EC Environmental Clearance GPCB Gujarat Pollution Control Board
ECC Emergency Control Centre g/s Gram per Second
EHS Environmental Health & Safety GSI Geological Survey of India
EIA Environmental Impact Assessment GSPL Gujarat State Petronet Limited
EMP Environmental Management Plan ID Induced Draft
EMS Environment Management System IDLH Immediate Dangerous to Life & Health
EPA Environmental Protection Act IMD Indian Meteorological Department
ESP Electrostatic Precipitator INA Industrial
ETP Effluent Treatment Plant IOCL Indian Oil Corporation Ltd.
Haz. Hazardous IS Indian Standards (Bureau of Indian Standards)
HC Hydrocarbon ISO International Organization for Standardization
HPCL Hindustan Petroleum Corporation Limited
IUNC International Union for Conservation of Nature
HSD High Speed Diesel LCG Local Crisis Group
HSE Health, Safety &Environment LEL Lower Explosive Limit
Ht. Height Leq Equivalent continuous noise level
HW Hazardous Waste LFL Lower Flammable Limit
kcal/kg Kilo Calories per kilo gram
kg/cm2 Kilo Gram per Square Centimeter LNG Liquefied Natural Gas
kg/ha Kilogram per hactare LPD Liter per Day
DRAFT ENVIRONMENT IMPACT ASSESSMENT REPORT
Amendment in EC for Change in Fuel for 9.9 MW Captive Power Generation
Abbreviations
Page. ii
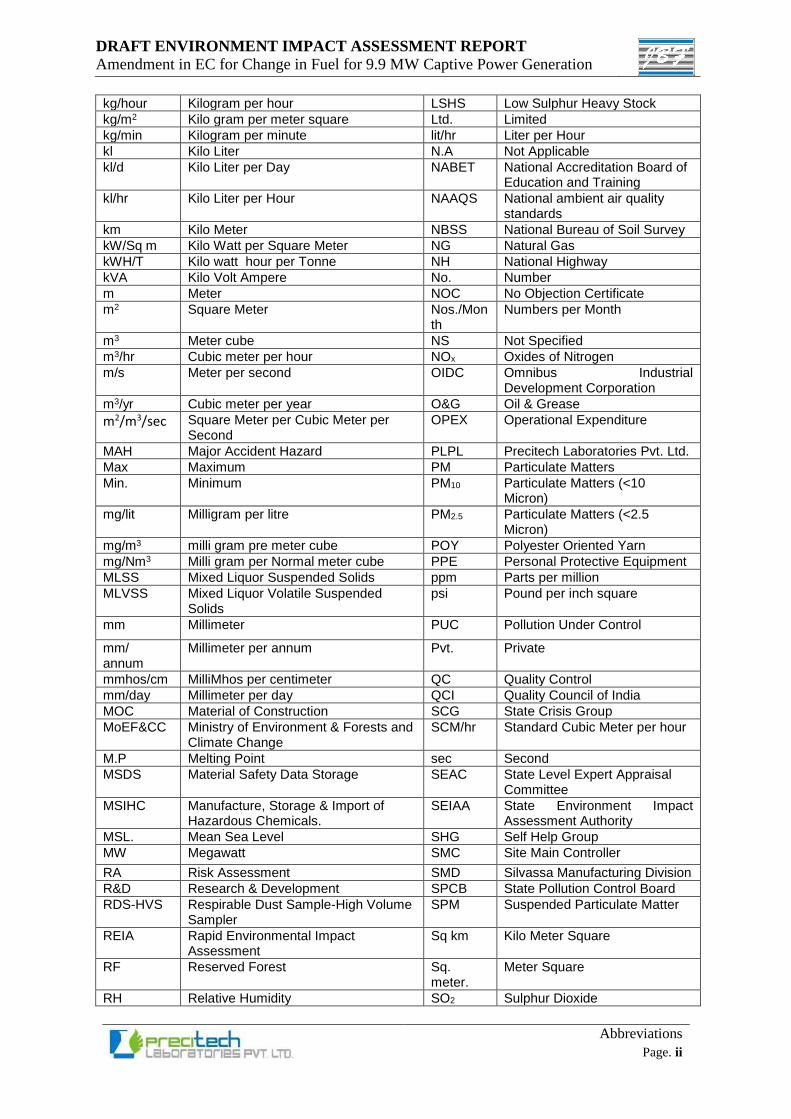
kg/hour Kilogram per hour LSHS Low Sulphur Heavy Stock
kg/m2 Kilo gram per meter square Ltd. Limited
kg/min Kilogram per minute lit/hr Liter per Hour
kl Kilo Liter N.A Not Applicable
kl/d Kilo Liter per Day NABET National Accreditation Board of Education and Training
kl/hr Kilo Liter per Hour NAAQS National ambient air quality standards
km Kilo Meter NBSS National Bureau of Soil Survey
kW/Sq m Kilo Watt per Square Meter NG Natural Gas
kWH/T Kilo watt hour per Tonne NH National Highway
kVA Kilo Volt Ampere No. Number
m Meter NOC No Objection Certificate
m2 Square Meter Nos./Month
Numbers per Month
m3 Meter cube NS Not Specified
m3/hr Cubic meter per hour NOx Oxides of Nitrogen
m/s Meter per second OIDC Omnibus Industrial Development Corporation
m3/yr Cubic meter per year O&G Oil & Grease
m2/m3/sec Square Meter per Cubic Meter per Second
OPEX Operational Expenditure
MAH Major Accident Hazard PLPL Precitech Laboratories Pvt. Ltd.
Max Maximum PM Particulate Matters
Min. Minimum PM10 Particulate Matters (<10 Micron)
mg/lit Milligram per litre PM2.5 Particulate Matters (<2.5 Micron)
mg/m3 milli gram pre meter cube POY Polyester Oriented Yarn
mg/Nm3 Milli gram per Normal meter cube PPE Personal Protective Equipment
MLSS Mixed Liquor Suspended Solids ppm Parts per million
MLVSS Mixed Liquor Volatile Suspended Solids
psi Pound per inch square
mm Millimeter PUC Pollution Under Control
mm/ annum
Millimeter per annum Pvt. Private
mmhos/cm MilliMhos per centimeter QC Quality Control
mm/day Millimeter per day QCI Quality Council of India
MOC Material of Construction SCG State Crisis Group
MoEF&CC Ministry of Environment & Forests and Climate Change
SCM/hr Standard Cubic Meter per hour
M.P Melting Point sec Second
MSDS Material Safety Data Storage SEAC State Level Expert Appraisal Committee
MSIHC Manufacture, Storage & Import of Hazardous Chemicals.
SEIAA State Environment Impact Assessment Authority
MSL. Mean Sea Level SHG Self Help Group
MW Megawatt SMC Site Main Controller
RA Risk Assessment SMD Silvassa Manufacturing Division
R&D Research & Development SPCB State Pollution Control Board
RDS-HVS Respirable Dust Sample-High Volume Sampler
SPM Suspended Particulate Matter
REIA Rapid Environmental Impact Assessment
Sq km Kilo Meter Square
RF Reserved Forest Sq. meter.
Meter Square
RH Relative Humidity SO2 Sulphur Dioxide
DRAFT ENVIRONMENT IMPACT ASSESSMENT REPORT
Amendment in EC for Change in Fuel for 9.9 MW Captive Power Generation
Abbreviations
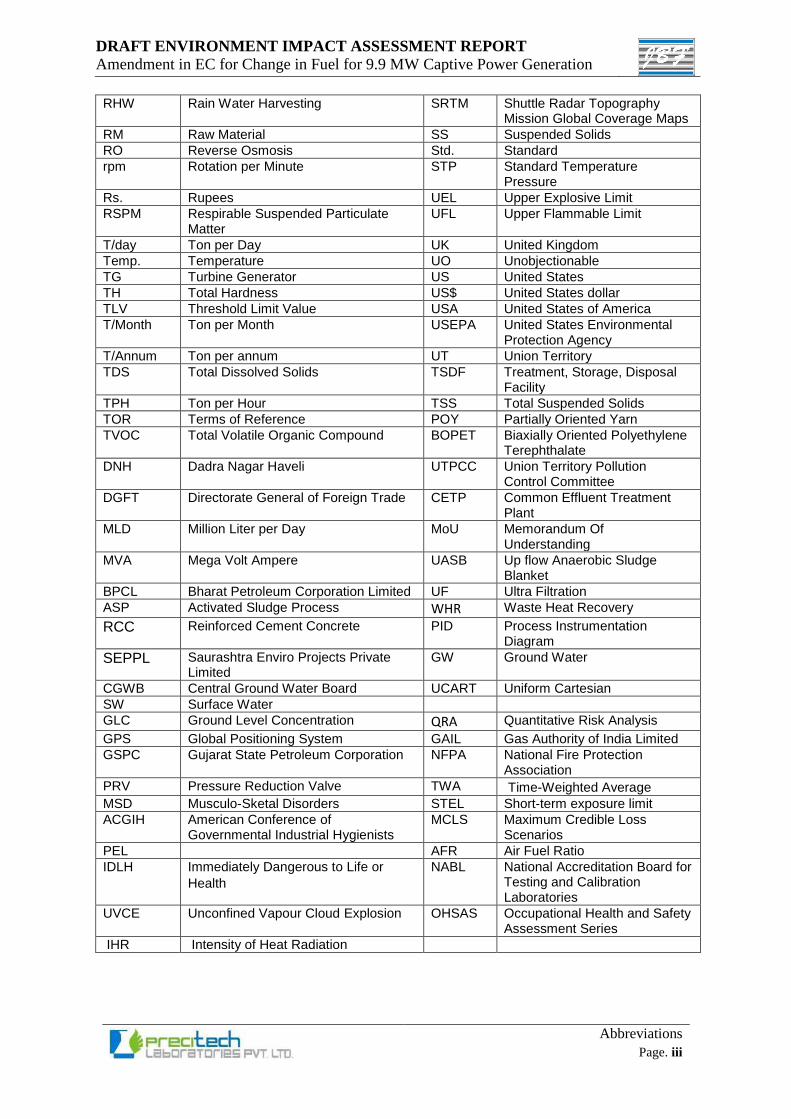
Page. iii
RHW Rain Water Harvesting SRTM Shuttle Radar Topography Mission Global Coverage Maps
RM Raw Material SS Suspended Solids
RO Reverse Osmosis Std. Standard
rpm Rotation per Minute STP Standard Temperature Pressure
Rs. Rupees UEL Upper Explosive Limit
RSPM Respirable Suspended Particulate Matter
UFL Upper Flammable Limit
T/day Ton per Day UK United Kingdom
Temp. Temperature UO Unobjectionable
TG Turbine Generator US United States
TH Total Hardness US$ United States dollar
TLV Threshold Limit Value USA United States of America
T/Month Ton per Month USEPA United States Environmental Protection Agency
T/Annum Ton per annum UT Union Territory
TDS Total Dissolved Solids TSDF Treatment, Storage, Disposal Facility
TPH Ton per Hour TSS Total Suspended Solids
TOR Terms of Reference POY Partially Oriented Yarn
TVOC Total Volatile Organic Compound BOPET Biaxially Oriented Polyethylene Terephthalate
DNH Dadra Nagar Haveli UTPCC Union Territory Pollution Control Committee
DGFT Directorate General of Foreign Trade CETP Common Effluent Treatment Plant
MLD Million Liter per Day MoU Memorandum Of Understanding
MVA Mega Volt Ampere UASB Up flow Anaerobic Sludge Blanket
BPCL Bharat Petroleum Corporation Limited UF Ultra Filtration
ASP Activated Sludge Process WHR Waste Heat Recovery
RCC Reinforced Cement Concrete PID Process Instrumentation Diagram
SEPPL Saurashtra Enviro Projects Private Limited
GW Ground Water
CGWB Central Ground Water Board UCART Uniform Cartesian
SW Surface Water
GLC Ground Level Concentration QRA Quantitative Risk Analysis
GPS Global Positioning System GAIL Gas Authority of India Limited
GSPC Gujarat State Petroleum Corporation NFPA National Fire Protection Association
PRV Pressure Reduction Valve TWA Time-Weighted Average
MSD Musculo-Sketal Disorders STEL Short-term exposure limit
ACGIH American Conference of Governmental Industrial Hygienists
MCLS Maximum Credible Loss Scenarios
PEL AFR Air Fuel Ratio
IDLH Immediately Dangerous to Life or
Health NABL National Accreditation Board for
Testing and Calibration Laboratories
UVCE Unconfined Vapour Cloud Explosion OHSAS Occupational Health and Safety Assessment Series
IHR Intensity of Heat Radiation

Chapters
DRAFT ENVIRONMENT IMPACT ASSESSMENT REPORT
Amendment in EC for Change in Fuel for 9.9 MW Captive Power Generation
Chapter-1: Introduction
Page | 1.1
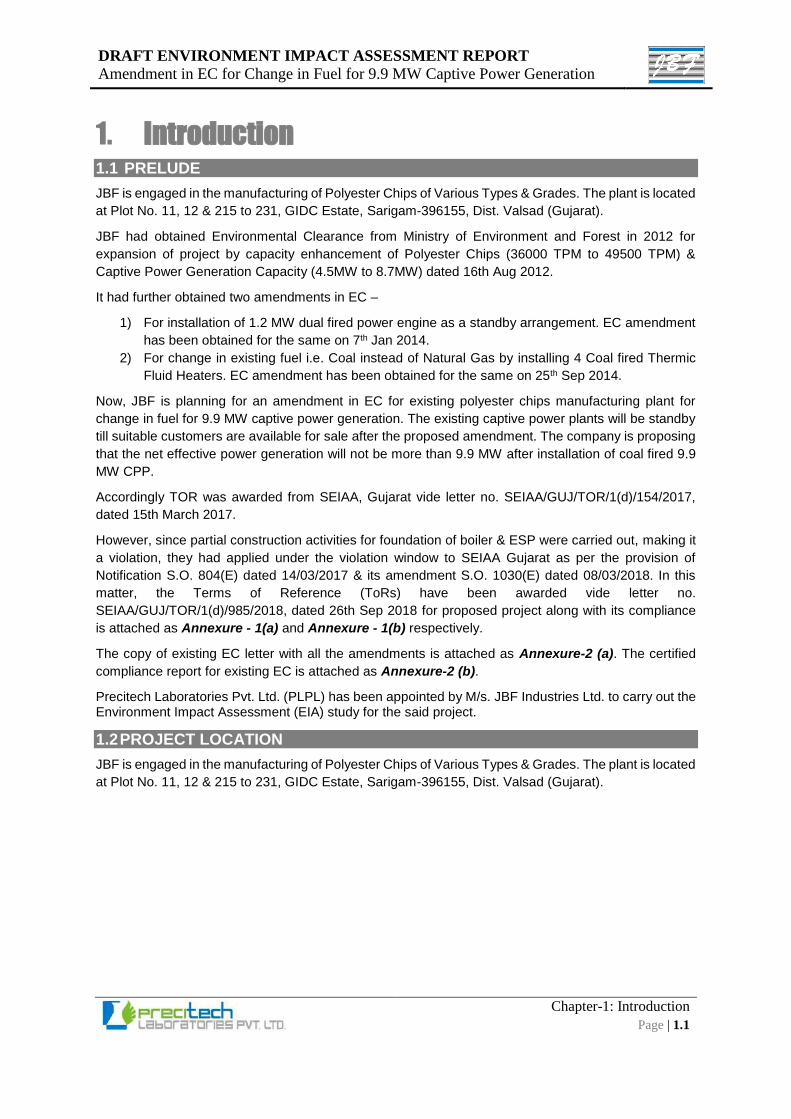
1. Introduction 1.1 PRELUDE
JBF is engaged in the manufacturing of Polyester Chips of Various Types & Grades. The plant is located
at Plot No. 11, 12 & 215 to 231, GIDC Estate, Sarigam-396155, Dist. Valsad (Gujarat).
JBF had obtained Environmental Clearance from Ministry of Environment and Forest in 2012 for
expansion of project by capacity enhancement of Polyester Chips (36000 TPM to 49500 TPM) &
Captive Power Generation Capacity (4.5MW to 8.7MW) dated 16th Aug 2012.
It had further obtained two amendments in EC –
1) For installation of 1.2 MW dual fired power engine as a standby arrangement. EC amendment
has been obtained for the same on 7th Jan 2014.
2) For change in existing fuel i.e. Coal instead of Natural Gas by installing 4 Coal fired Thermic
Fluid Heaters. EC amendment has been obtained for the same on 25th Sep 2014.
Now, JBF is planning for an amendment in EC for existing polyester chips manufacturing plant for
change in fuel for 9.9 MW captive power generation. The existing captive power plants will be standby
till suitable customers are available for sale after the proposed amendment. The company is proposing
that the net effective power generation will not be more than 9.9 MW after installation of coal fired 9.9
MW CPP.
Accordingly TOR was awarded from SEIAA, Gujarat vide letter no. SEIAA/GUJ/TOR/1(d)/154/2017,
dated 15th March 2017.
However, since partial construction activities for foundation of boiler & ESP were carried out, making it
a violation, they had applied under the violation window to SEIAA Gujarat as per the provision of
Notification S.O. 804(E) dated 14/03/2017 & its amendment S.O. 1030(E) dated 08/03/2018. In this
matter, the Terms of Reference (ToRs) have been awarded vide letter no.
SEIAA/GUJ/TOR/1(d)/985/2018, dated 26th Sep 2018 for proposed project along with its compliance
is attached as Annexure - 1(a) and Annexure - 1(b) respectively.
The copy of existing EC letter with all the amendments is attached as Annexure-2 (a). The certified
compliance report for existing EC is attached as Annexure-2 (b).
Precitech Laboratories Pvt. Ltd. (PLPL) has been appointed by M/s. JBF Industries Ltd. to carry out the Environment Impact Assessment (EIA) study for the said project.
1.2 PROJECT LOCATION
JBF is engaged in the manufacturing of Polyester Chips of Various Types & Grades. The plant is located
at Plot No. 11, 12 & 215 to 231, GIDC Estate, Sarigam-396155, Dist. Valsad (Gujarat).
DRAFT ENVIRONMENT IMPACT ASSESSMENT REPORT
Amendment in EC for Change in Fuel for 9.9 MW Captive Power Generation
Chapter-1: Introduction
Page | 1.2
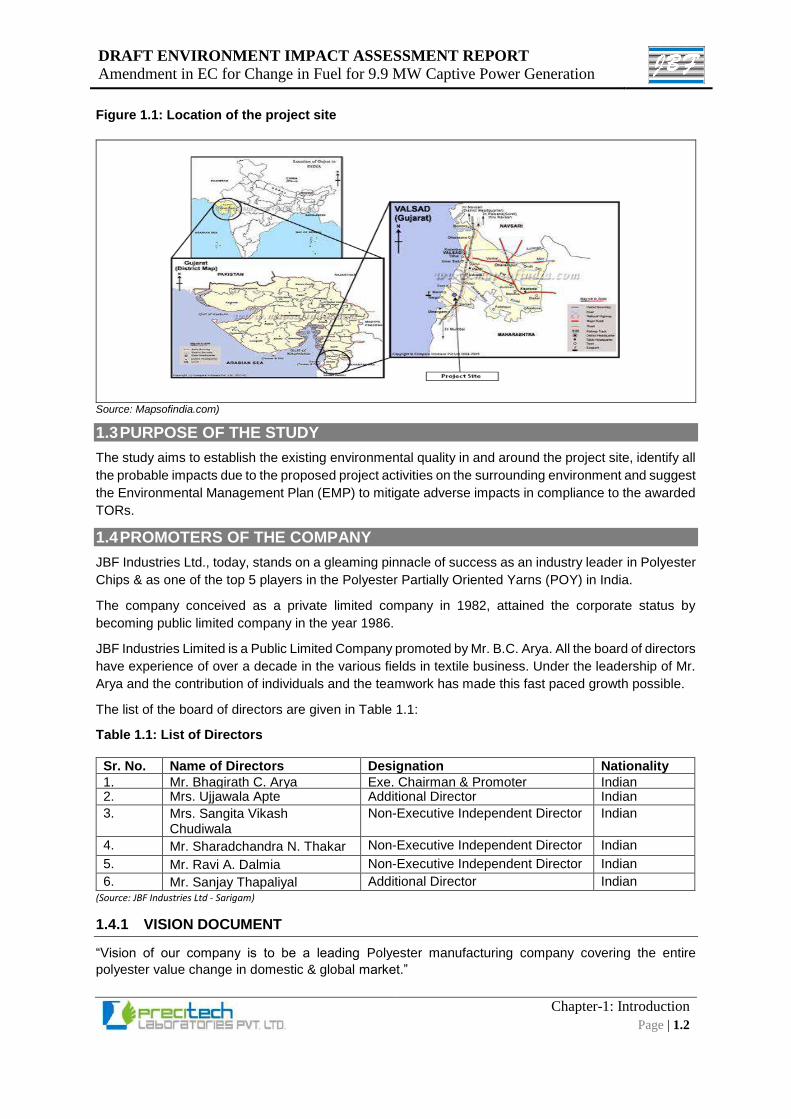
Figure 1.1: Location of the project site
Source: Mapsofindia.com)
1.3 PURPOSE OF THE STUDY
The study aims to establish the existing environmental quality in and around the project site, identify all
the probable impacts due to the proposed project activities on the surrounding environment and suggest
the Environmental Management Plan (EMP) to mitigate adverse impacts in compliance to the awarded
TORs.
1.4 PROMOTERS OF THE COMPANY
JBF Industries Ltd., today, stands on a gleaming pinnacle of success as an industry leader in Polyester
Chips & as one of the top 5 players in the Polyester Partially Oriented Yarns (POY) in India.
The company conceived as a private limited company in 1982, attained the corporate status by
becoming public limited company in the year 1986.
JBF Industries Limited is a Public Limited Company promoted by Mr. B.C. Arya. All the board of directors
have experience of over a decade in the various fields in textile business. Under the leadership of Mr.
Arya and the contribution of individuals and the teamwork has made this fast paced growth possible.
The list of the board of directors are given in Table 1.1:
Table 1.1: List of Directors
Sr. No. Name of Directors Designation Nationality
1. Mr. Bhagirath C. Arya Exe. Chairman & Promoter Indian 2. Mrs. Ujjawala Apte
Additional Director Indian
3. Mrs. Sangita Vikash Chudiwala
Non-Executive Independent Director Indian
4. Mr. Sharadchandra N. Thakar Non-Executive Independent Director Indian
5. Mr. Ravi A. Dalmia Non-Executive Independent Director Indian
6. Mr. Sanjay Thapaliyal Additional Director Indian (Source: JBF Industries Ltd - Sarigam)
1.4.1 VISION DOCUMENT
“Vision of our company is to be a leading Polyester manufacturing company covering the entire
polyester value change in domestic & global market.”
DRAFT ENVIRONMENT IMPACT ASSESSMENT REPORT
Amendment in EC for Change in Fuel for 9.9 MW Captive Power Generation
Chapter-1: Introduction
Page | 1.3
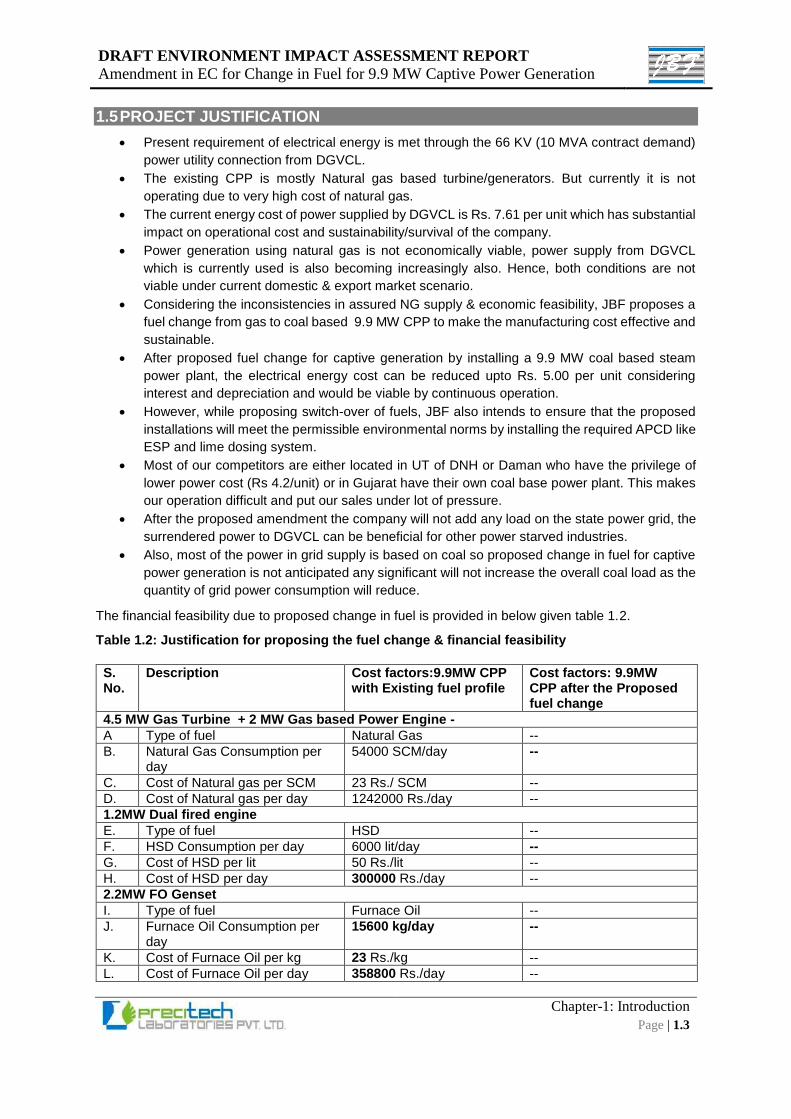
1.5 PROJECT JUSTIFICATION
Present requirement of electrical energy is met through the 66 KV (10 MVA contract demand)
power utility connection from DGVCL.
The existing CPP is mostly Natural gas based turbine/generators. But currently it is not
operating due to very high cost of natural gas.
The current energy cost of power supplied by DGVCL is Rs. 7.61 per unit which has substantial
impact on operational cost and sustainability/survival of the company.
Power generation using natural gas is not economically viable, power supply from DGVCL
which is currently used is also becoming increasingly also. Hence, both conditions are not
viable under current domestic & export market scenario.
Considering the inconsistencies in assured NG supply & economic feasibility, JBF proposes a
fuel change from gas to coal based 9.9 MW CPP to make the manufacturing cost effective and
sustainable.
After proposed fuel change for captive generation by installing a 9.9 MW coal based steam
power plant, the electrical energy cost can be reduced upto Rs. 5.00 per unit considering
interest and depreciation and would be viable by continuous operation.
However, while proposing switch-over of fuels, JBF also intends to ensure that the proposed
installations will meet the permissible environmental norms by installing the required APCD like
ESP and lime dosing system.
Most of our competitors are either located in UT of DNH or Daman who have the privilege of
lower power cost (Rs 4.2/unit) or in Gujarat have their own coal base power plant. This makes
our operation difficult and put our sales under lot of pressure.
After the proposed amendment the company will not add any load on the state power grid, the
surrendered power to DGVCL can be beneficial for other power starved industries.
Also, most of the power in grid supply is based on coal so proposed change in fuel for captive
power generation is not anticipated any significant will not increase the overall coal load as the
quantity of grid power consumption will reduce.
The financial feasibility due to proposed change in fuel is provided in below given table 1.2.
Table 1.2: Justification for proposing the fuel change & financial feasibility
S. No.
Description Cost factors:9.9MW CPP with Existing fuel profile
Cost factors: 9.9MW CPP after the Proposed fuel change
4.5 MW Gas Turbine + 2 MW Gas based Power Engine -
A Type of fuel Natural Gas --
B. Natural Gas Consumption per day
54000 SCM/day --
C. Cost of Natural gas per SCM 23 Rs./ SCM --
D. Cost of Natural gas per day 1242000 Rs./day --
1.2MW Dual fired engine
E. Type of fuel HSD --
F. HSD Consumption per day 6000 lit/day --
G. Cost of HSD per lit 50 Rs./lit --
H. Cost of HSD per day 300000 Rs./day --
2.2MW FO Genset
I. Type of fuel Furnace Oil --
J. Furnace Oil Consumption per day
15600 kg/day --
K. Cost of Furnace Oil per kg 23 Rs./kg --
L. Cost of Furnace Oil per day 358800 Rs./day --
DRAFT ENVIRONMENT IMPACT ASSESSMENT REPORT
Amendment in EC for Change in Fuel for 9.9 MW Captive Power Generation
Chapter-1: Introduction
Page | 1.4
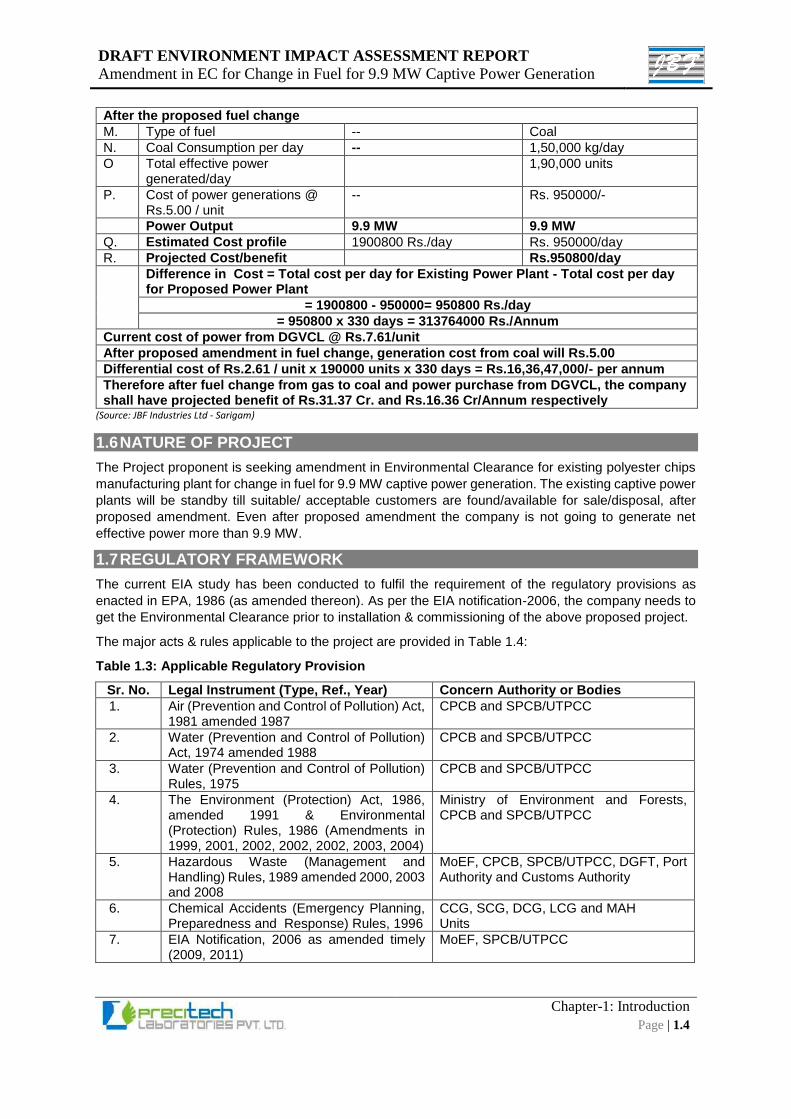
After the proposed fuel change
M. Type of fuel -- Coal
N. Coal Consumption per day -- 1,50,000 kg/day
O Total effective power generated/day
1,90,000 units
P. Cost of power generations @ Rs.5.00 / unit
-- Rs. 950000/-
Power Output 9.9 MW 9.9 MW
Q. Estimated Cost profile 1900800 Rs./day Rs. 950000/day
R. Projected Cost/benefit Rs.950800/day
Difference in Cost = Total cost per day for Existing Power Plant - Total cost per day for Proposed Power Plant
= 1900800 - 950000= 950800 Rs./day
= 950800 x 330 days = 313764000 Rs./Annum
Current cost of power from DGVCL @ Rs.7.61/unit
After proposed amendment in fuel change, generation cost from coal will Rs.5.00
Differential cost of Rs.2.61 / unit x 190000 units x 330 days = Rs.16,36,47,000/- per annum
Therefore after fuel change from gas to coal and power purchase from DGVCL, the company shall have projected benefit of Rs.31.37 Cr. and Rs.16.36 Cr/Annum respectively
(Source: JBF Industries Ltd - Sarigam)
1.6 NATURE OF PROJECT
The Project proponent is seeking amendment in Environmental Clearance for existing polyester chips
manufacturing plant for change in fuel for 9.9 MW captive power generation. The existing captive power
plants will be standby till suitable/ acceptable customers are found/available for sale/disposal, after
proposed amendment. Even after proposed amendment the company is not going to generate net
effective power more than 9.9 MW.
1.7 REGULATORY FRAMEWORK
The current EIA study has been conducted to fulfil the requirement of the regulatory provisions as
enacted in EPA, 1986 (as amended thereon). As per the EIA notification-2006, the company needs to
get the Environmental Clearance prior to installation & commissioning of the above proposed project.
The major acts & rules applicable to the project are provided in Table 1.4:
Table 1.3: Applicable Regulatory Provision
Sr. No. Legal Instrument (Type, Ref., Year) Concern Authority or Bodies
1. Air (Prevention and Control of Pollution) Act, 1981 amended 1987
CPCB and SPCB/UTPCC
2. Water (Prevention and Control of Pollution) Act, 1974 amended 1988
CPCB and SPCB/UTPCC
3. Water (Prevention and Control of Pollution) Rules, 1975
CPCB and SPCB/UTPCC
4. The Environment (Protection) Act, 1986, amended 1991 & Environmental (Protection) Rules, 1986 (Amendments in 1999, 2001, 2002, 2002, 2002, 2003, 2004)
Ministry of Environment and Forests, CPCB and SPCB/UTPCC
5. Hazardous Waste (Management and Handling) Rules, 1989 amended 2000, 2003 and 2008
MoEF, CPCB, SPCB/UTPCC, DGFT, Port Authority and Customs Authority
6. Chemical Accidents (Emergency Planning, Preparedness and Response) Rules, 1996
CCG, SCG, DCG, LCG and MAH Units
7. EIA Notification, 2006 as amended timely (2009, 2011)
MoEF, SPCB/UTPCC
DRAFT ENVIRONMENT IMPACT ASSESSMENT REPORT
Amendment in EC for Change in Fuel for 9.9 MW Captive Power Generation
Chapter-1: Introduction
Page | 1.5
Sr. No. Legal Instrument (Type, Ref., Year) Concern Authority or Bodies
8. Public Liability Insurance Act, 1991 amended 1992 & Public Liability Insurance Rules, 1991 amended 1993
Ministry of Environment & Forests, District Collector
9. Factories Act, 1948 Ministry of Labour, DGFASLI and Directorate of Industrial Safety and Health/Factories Inspectorate
Note: *the rules are not directly applicable to the proposed project but during operation it may be applicable
timly depending upon allied operations like handling, storage & transportation of raw materials & products etc..
The copy of existing CC&A is attached as Annexure – 3 (a) & its point wise compliance is attached as
Annexure – 3 (b).
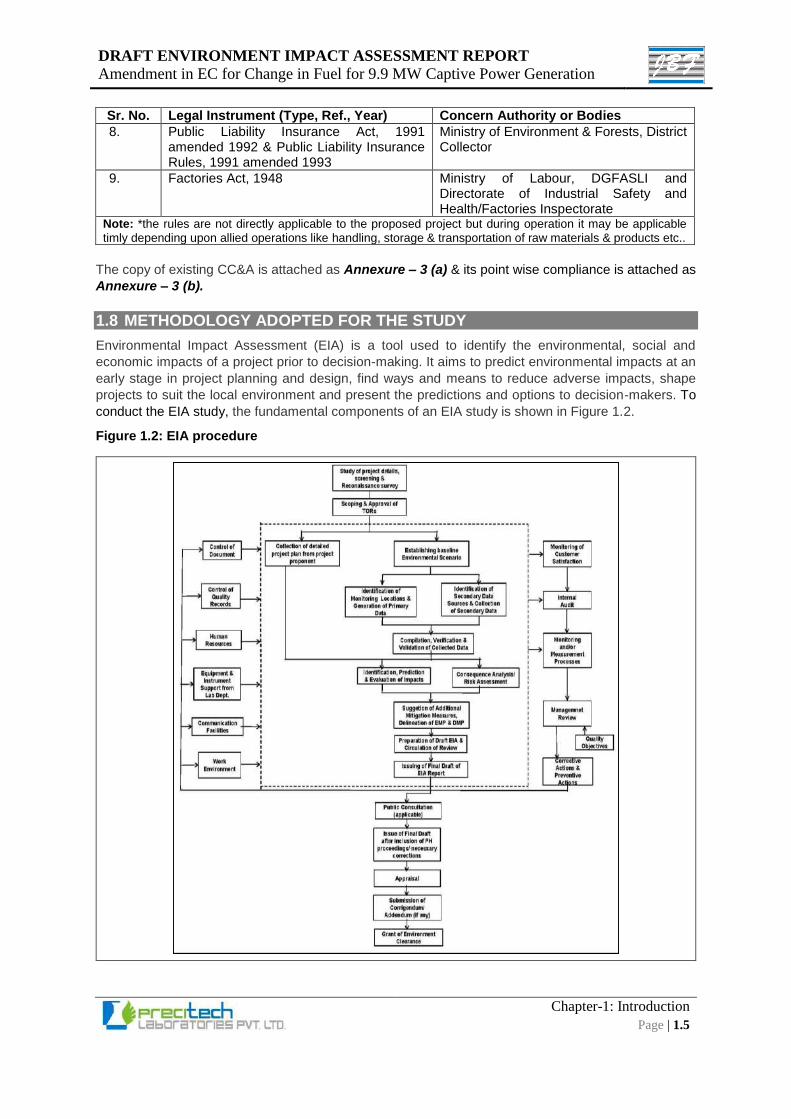
1.8 METHODOLOGY ADOPTED FOR THE STUDY
Environmental Impact Assessment (EIA) is a tool used to identify the environmental, social and
economic impacts of a project prior to decision-making. It aims to predict environmental impacts at an
early stage in project planning and design, find ways and means to reduce adverse impacts, shape
projects to suit the local environment and present the predictions and options to decision-makers. To
conduct the EIA study, the fundamental components of an EIA study is shown in Figure 1.2.
Figure 1.2: EIA procedure
DRAFT ENVIRONMENT IMPACT ASSESSMENT REPORT
Amendment in EC for Change in Fuel for 9.9 MW Captive Power Generation
Chapter-1: Introduction
Page | 1.6
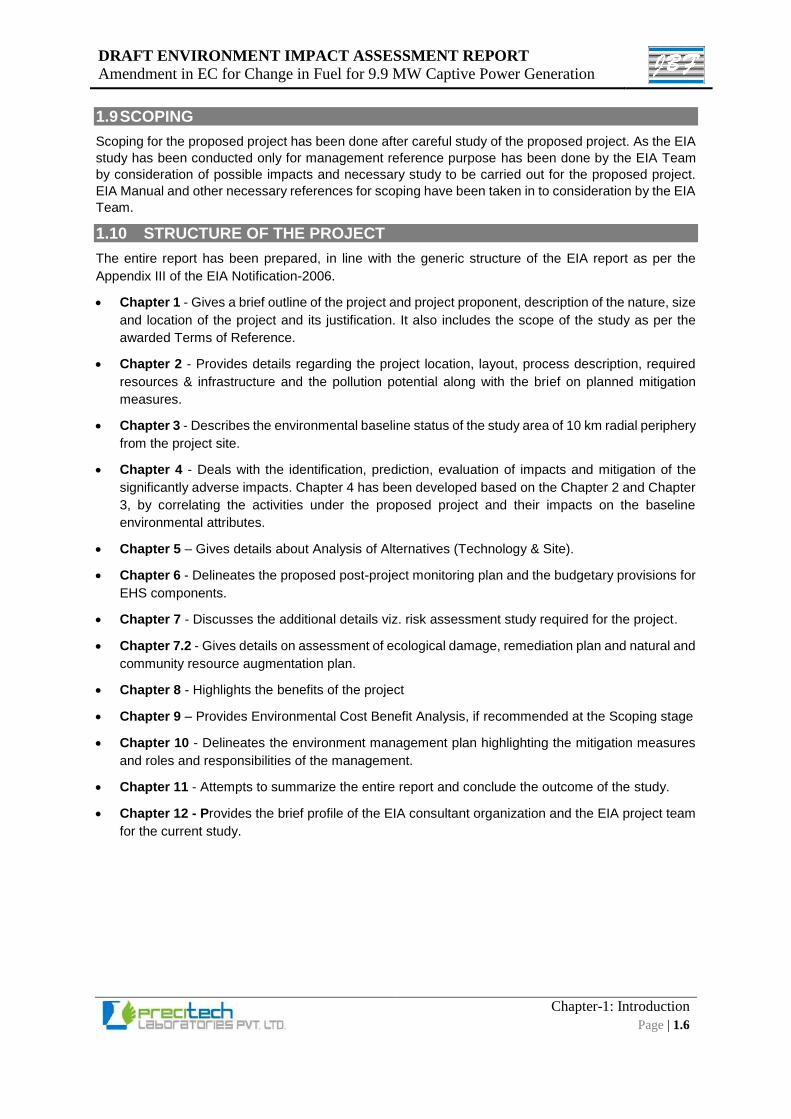
1.9 SCOPING
Scoping for the proposed project has been done after careful study of the proposed project. As the EIA
study has been conducted only for management reference purpose has been done by the EIA Team
by consideration of possible impacts and necessary study to be carried out for the proposed project.
EIA Manual and other necessary references for scoping have been taken in to consideration by the EIA
Team.
1.10 STRUCTURE OF THE PROJECT
The entire report has been prepared, in line with the generic structure of the EIA report as per the
Appendix III of the EIA Notification-2006.
Chapter 1 - Gives a brief outline of the project and project proponent, description of the nature, size
and location of the project and its justification. It also includes the scope of the study as per the
awarded Terms of Reference.
Chapter 2 - Provides details regarding the project location, layout, process description, required
resources & infrastructure and the pollution potential along with the brief on planned mitigation
measures.
Chapter 3 - Describes the environmental baseline status of the study area of 10 km radial periphery
from the project site.
Chapter 4 - Deals with the identification, prediction, evaluation of impacts and mitigation of the
significantly adverse impacts. Chapter 4 has been developed based on the Chapter 2 and Chapter
3, by correlating the activities under the proposed project and their impacts on the baseline
environmental attributes.
Chapter 5 – Gives details about Analysis of Alternatives (Technology & Site).
Chapter 6 - Delineates the proposed post-project monitoring plan and the budgetary provisions for
EHS components.
Chapter 7 - Discusses the additional details viz. risk assessment study required for the project.
Chapter 7.2 - Gives details on assessment of ecological damage, remediation plan and natural and
community resource augmentation plan.
Chapter 8 - Highlights the benefits of the project
Chapter 9 – Provides Environmental Cost Benefit Analysis, if recommended at the Scoping stage
Chapter 10 - Delineates the environment management plan highlighting the mitigation measures
and roles and responsibilities of the management.
Chapter 11 - Attempts to summarize the entire report and conclude the outcome of the study.
Chapter 12 - Provides the brief profile of the EIA consultant organization and the EIA project team
for the current study.
DRAFT ENVIRONMENT IMPACT ASSESSMENT REPORT
Amendment in EC for Change in Fuel for 9.9 MW Captive Power Generation
Chapter-2: Project Description
Page | 2.1
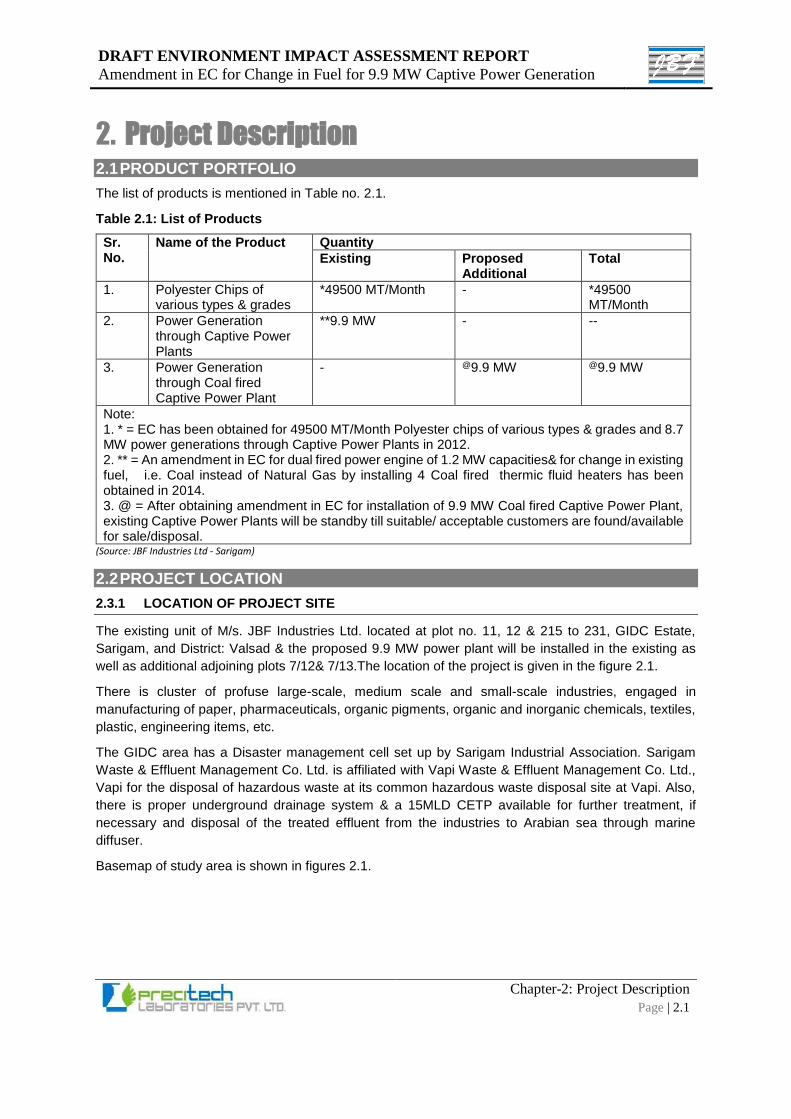
2. Project Description 2.1 PRODUCT PORTFOLIO
The list of products is mentioned in Table no. 2.1.
Table 2.1: List of Products
Sr. No.
Name of the Product Quantity
Existing Proposed Additional
Total
1. Polyester Chips of various types & grades
*49500 MT/Month - *49500 MT/Month
2. Power Generation through Captive Power Plants
**9.9 MW - --
3. Power Generation through Coal fired Captive Power Plant
- @9.9 MW @9.9 MW
Note: 1. * = EC has been obtained for 49500 MT/Month Polyester chips of various types & grades and 8.7 MW power generations through Captive Power Plants in 2012. 2. ** = An amendment in EC for dual fired power engine of 1.2 MW capacities& for change in existing fuel, i.e. Coal instead of Natural Gas by installing 4 Coal fired thermic fluid heaters has been obtained in 2014. 3. @ = After obtaining amendment in EC for installation of 9.9 MW Coal fired Captive Power Plant, existing Captive Power Plants will be standby till suitable/ acceptable customers are found/available for sale/disposal.
(Source: JBF Industries Ltd - Sarigam)
2.2 PROJECT LOCATION
2.3.1 LOCATION OF PROJECT SITE
The existing unit of M/s. JBF Industries Ltd. located at plot no. 11, 12 & 215 to 231, GIDC Estate,
Sarigam, and District: Valsad & the proposed 9.9 MW power plant will be installed in the existing as
well as additional adjoining plots 7/12& 7/13.The location of the project is given in the figure 2.1.
There is cluster of profuse large-scale, medium scale and small-scale industries, engaged in
manufacturing of paper, pharmaceuticals, organic pigments, organic and inorganic chemicals, textiles,
plastic, engineering items, etc.
The GIDC area has a Disaster management cell set up by Sarigam Industrial Association. Sarigam
Waste & Effluent Management Co. Ltd. is affiliated with Vapi Waste & Effluent Management Co. Ltd.,
Vapi for the disposal of hazardous waste at its common hazardous waste disposal site at Vapi. Also,
there is proper underground drainage system & a 15MLD CETP available for further treatment, if
necessary and disposal of the treated effluent from the industries to Arabian sea through marine
diffuser.
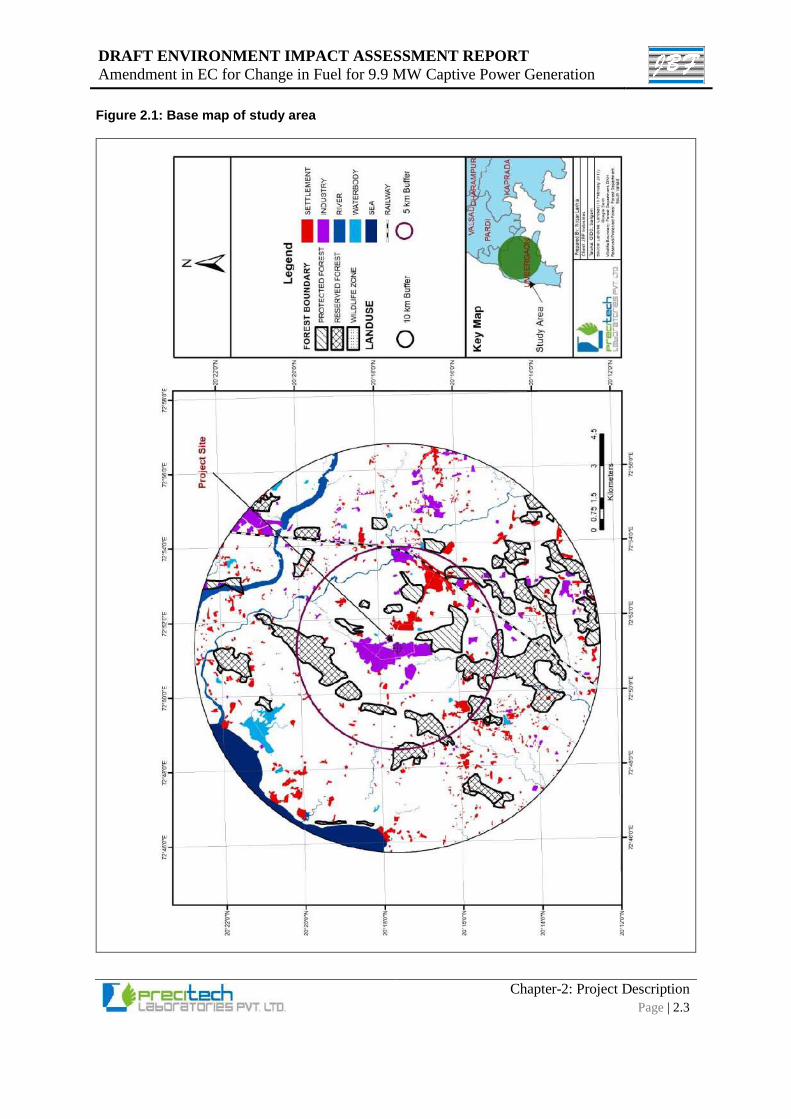
Basemap of study area is shown in figures 2.1.
DRAFT ENVIRONMENT IMPACT ASSESSMENT REPORT
Amendment in EC for Change in Fuel for 9.9 MW Captive Power Generation
Chapter-2: Project Description
Page | 2.2
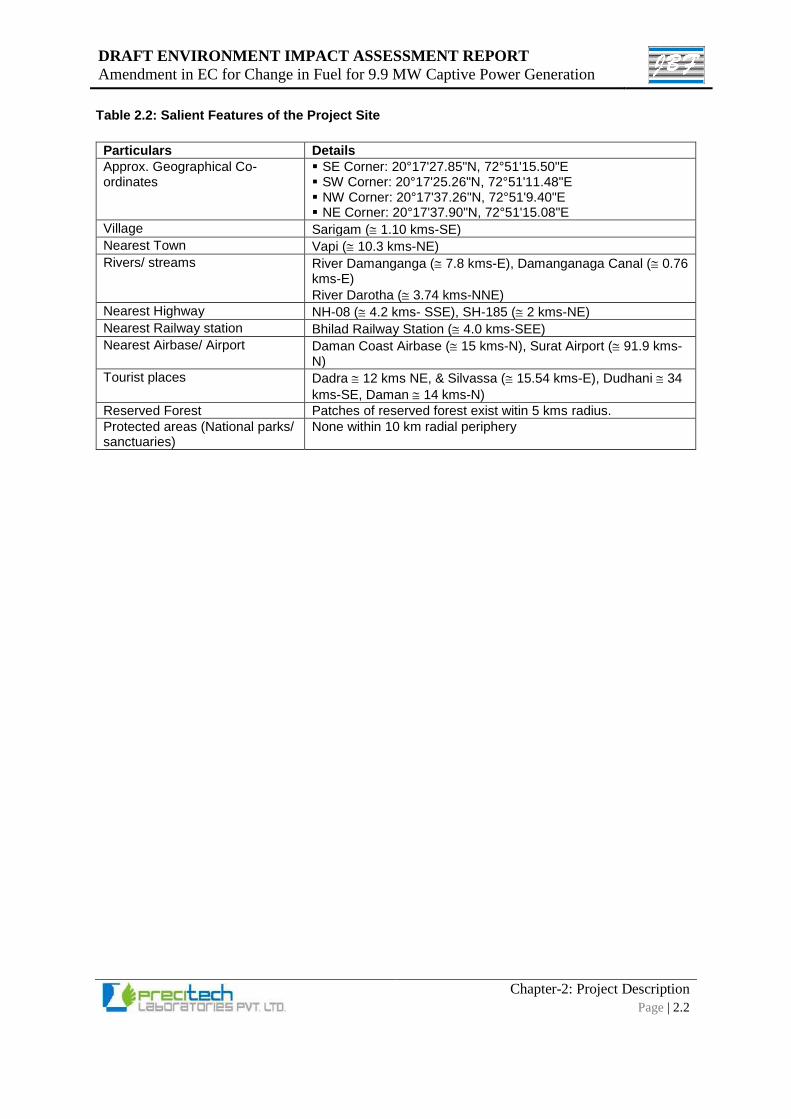
Table 2.2: Salient Features of the Project Site
Particulars Details
Approx. Geographical Co-ordinates
▪ SE Corner: 20°17'27.85"N, 72°51'15.50"E ▪ SW Corner: 20°17'25.26"N, 72°51'11.48"E ▪ NW Corner: 20°17'37.26"N, 72°51'9.40"E ▪ NE Corner: 20°17'37.90"N, 72°51'15.08"E
Village Sarigam ( 1.10 kms-SE)
Nearest Town Vapi ( 10.3 kms-NE)
Rivers/ streams River Damanganga ( 7.8 kms-E), Damanganaga Canal ( 0.76 kms-E)
River Darotha ( 3.74 kms-NNE)
Nearest Highway NH-08 ( 4.2 kms- SSE), SH-185 ( 2 kms-NE)
Nearest Railway station Bhilad Railway Station ( 4.0 kms-SEE)
Nearest Airbase/ Airport Daman Coast Airbase ( 15 kms-N), Surat Airport ( 91.9 kms-N)
Tourist places Dadra 12 kms NE, & Silvassa ( 15.54 kms-E), Dudhani 34
kms-SE, Daman 14 kms-N)
Reserved Forest Patches of reserved forest exist witin 5 kms radius.
Protected areas (National parks/ sanctuaries)
None within 10 km radial periphery
DRAFT ENVIRONMENT IMPACT ASSESSMENT REPORT
Amendment in EC for Change in Fuel for 9.9 MW Captive Power Generation
Chapter-2: Project Description
Page | 2.3
Figure 2.1: Base map of study area
DRAFT ENVIRONMENT IMPACT ASSESSMENT REPORT
Amendment in EC for Change in Fuel for 9.9 MW Captive Power Generation
Chapter-2: Project Description
Page | 2.4
2.3 PROCESS TECHNOLOGY
2.3.1 CAPTIVE POWER PLANT
The process comprises, the generation of steam in the boiler and utilization of energy content of steam
in the steam turbine for doing the work on turbine blades to generate mechanical energy. The
mechanical energy is converted to electrical energy by the generator coupled to the steam turbine.
The steam is generated in a 45 Ton capacity AFBC boiler at a working pressure of 87 bar and 515 OC
temp.
The major system and components of boiler includes feed water system, coal feeding system with
combustion control, FD & ID fan, air pre-heater, ESP, chimney, ash collection &handling system.
The steam generated in the boiler is piped to the inlet of steam turbine and pass through the nozzles
where pressure energy of steam is converted to kinetic energy and directed towards a series of moving
and stationary blades to do the work on the turbine wheel and expands to a lower pressure and finally
to vacuum in the range of 0.186 (abs) bar. The outlet steam from the turbine is passed to air cooled
condenser, where it is condensed back to water in the range of 54OC and water is further re-utilized for
continuous feed supply to boiler and cycle is repeated.
Main plant equipment is supported by auxiliaries and systems such as fuel handling system, cooling
water circulation system/ cooling towers, softener plant, electrical equipment, ash disposal and handling
system, emission monitoring and control system etc. Tentative technical features and operating
parameters of the major equipment and systems are provided in subsequent sections.
Air Cooled Condenser
The exhaust steam from the steam turbine need to be condensed back in to water for recycling the
working media. In case of an air cooled condenser, the steam is passed through large panel of cooling
coil having fins. The steam is passed through the tubes and the atmospheric air is circulated over the
fins by means of a fan, so that the steam is cooled and condensed back to liquid by giving up its latent
heat of vaporizations to air. Primary purpose of incorporating the air cooled condenser to drastically
reduce the water consumption.
There are various advantages of air cooled condenser over water cooled condenser like it will eliminate
cooling tower usage and also use of water and apart from this it is easy to install and maintain. JBF will
install air cooled condensers.
DRAFT ENVIRONMENT IMPACT ASSESSMENT REPORT
Amendment in EC for Change in Fuel for 9.9 MW Captive Power Generation
Chapter-2: Project Description
Page | 2.5
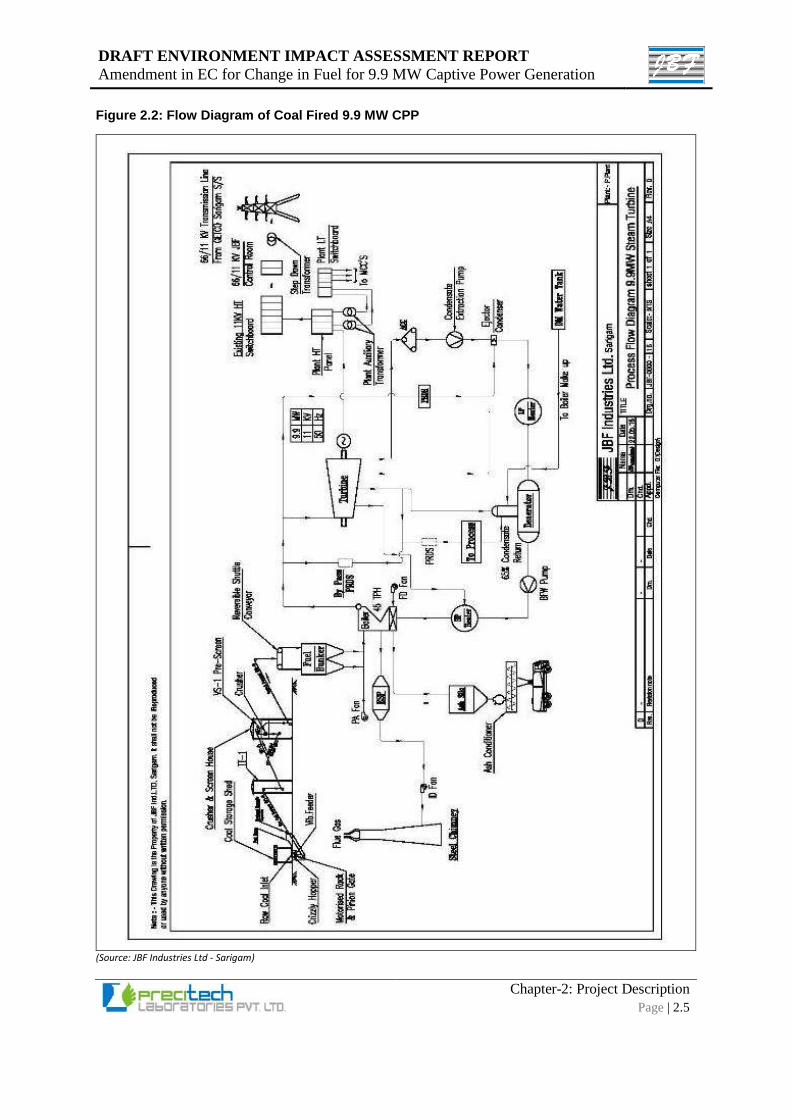
Figure 2.2: Flow Diagram of Coal Fired 9.9 MW CPP
(Source: JBF Industries Ltd - Sarigam)
DRAFT ENVIRONMENT IMPACT ASSESSMENT REPORT
Amendment in EC for Change in Fuel for 9.9 MW Captive Power Generation
Chapter-2: Project Description
Page | 2.6
2.3.2 AUXILIARY SYSTEMS
Auxiliary system contains of coal handling system and Ash handling system.
2.3.2.1 COAL HANDLING SYSTEM
The transportation of imported coal/ Indian Coal will be done by covered trucks. The coal will be
delivered in fully covered coal yard and stacked by the stackers. The stacker loader, load the coal in
coal hopper. From hopper, coal is fed through vibratory feeder to the belt conveyor, crusher and sieving
screen and particles of less than 10 mm size is fed through a series of belt conveyors to the coal
bunkers.
Conveyer belts will be as per the Indian Standards IS: 1891 (Part I) – 1994, Nylon – nylon type with
suitable top & bottom cover. The number of plies will be suitably selected with due regard to load/
flexibility of toughing & shall be not less than operating tension of the belt at specified full load & shall
not exceed 90% of the rated strength. However, the number of plies shall not be less than 3 & the
grading shall be suitable for heavy duty application. All belts shall be joined by vulcanized splicing. The
clearance between the return side of the belt & the conveyor floor shall be adequate to avoid fouling of
the return belt with the spilled coal. The technical specifications for belt conveyors are as below –
All belt conveyors shall be designed, manufactured and supplied in accordance with the Code IS
11592.The maximum inclination of conveyor belt shall be restricted to 18° and the maximum
declination shall not exceed 12°. Inclination of conveyor on the loading zone shall be restricted
to a maximum of 18° to horizontal unless agreed otherwise. The linear speed of belt conveyors shall
not exceed 1m/sec. adequate number of locating pins and match marking shall be provided for
easy assembly and dismantling. The coal conveyors (Belt Conveyor) shall be designed for the
following condition:
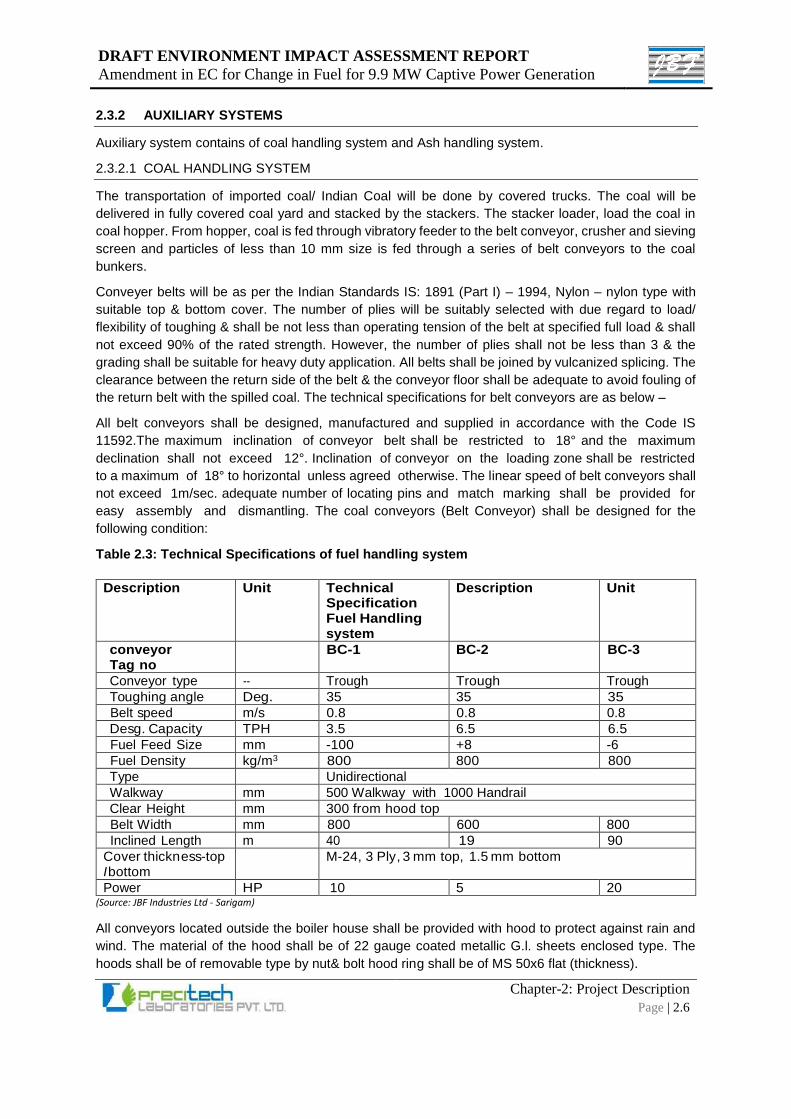
Table 2.3: Technical Specifications of fuel handling system
Description Unit Technical Specification Fuel Handling system
Description Unit
conveyor Tag no
BC-1 BC-2 BC-3
Conveyor type -- Trough Trough Trough
Toughing angle Deg. 35 35 35
Belt speed m/s 0.8 0.8 0.8
Desg. Capacity TPH 3.5 6.5 6.5
Fuel Feed Size mm -100 +8 -6
Fuel Density kg/m3 800 800 800
Type Unidirectional
Walkway mm 500 Walkway with 1000 Handrail
Clear Height mm 300 from hood top
Belt Width mm 800 600 800
Inclined Length m 40 19 90
Cover thickness-top I bottom
M-24, 3 Ply, 3 mm top, 1.5 mm bottom
Power HP 10 5 20 (Source: JBF Industries Ltd - Sarigam)
All conveyors located outside the boiler house shall be provided with hood to protect against rain and
wind. The material of the hood shall be of 22 gauge coated metallic G.l. sheets enclosed type. The
hoods shall be of removable type by nut& bolt hood ring shall be of MS 50x6 flat (thickness).
DRAFT ENVIRONMENT IMPACT ASSESSMENT REPORT
Amendment in EC for Change in Fuel for 9.9 MW Captive Power Generation
Chapter-2: Project Description
Page | 2.7
Suitable and adequate water sprinkler system will be provided over dust generation points, to contain
and minimise possible dusting during to coal handling. It is proposed to utilize treated effluent for water
sprinklers.
GPCB guidelines for Coal handling will be followed.
2.3.2.2 LIME DOSING SYSTEM
Every feed zone in boiler shall be provided with lime feeding system to contain and control the probable
SO2 emission from coal burning and to minimise it to meet the stipulated standards. There will be
provision for online dosing of quality lime stone in the AFBC boiler for control and containment of
Sulphur dioxide emissions into atmosphere.
2.3.2.3 ASH HANDLING SYSTEM
The flue gas will pass through economizers, air pre heaters, and electrostatic precipitators and ID fan
to the chimney. The collection vessels will be provided at the bottom of the economizers, air pre heater
and the electrostatic precipitator hoppers. The dry ash collected in vessels will be conveyed to ash silos
by the application of compressed air/dense phase pneumatic conveyance system. The ash
accumulated in ash silos will be loaded in to tankers/covered trucks given to the manufacturer of Bricks
and ready mix concretes for promoting fly ash utilization, in compliance with the Fly Ash Rules. Ash
handling will be done by dense phase pneumatic conveying.
Dense Phase Conveying System
One major concern for operating a Coal based Thermal power plant is the proper management of Ash
generated after combustion of Coal, which is generally generated in the furnace itself and is trapped by
the ESP. If proper system is installed for handling this ash, major hurdle of ash management can be
overcome.
The Dense Phase Conveying System is the most reliable; efficient to minimize particularly the problems
for handling the wide and adequate range of dry bulk solids up to 200 TPH capacities at the exceeding
terminal distances - 1,200 meter. This system includes weighing, batching, blending, lump breaking,
storage, master control equipment etc. through Dense Phase Conveying System for bulk material
handling in the plant.
Dense Phase System is applicable to push the highly dense concentration of bulk solids effectively at
a low constant speed inside the conveying pipe lines. Any type of material (heavy, abrasive or, fragile,
crystalline or granular) can be conveyed without causing the degradation due to low velocity and less
wear to the system components. This type of conveying is reliable, flexible and maintenance free due
to less number of moving parts and it can be easily installed at places where space availability is very
less specially for installing conventional conveying systems.
The limited volume of air is utilized at the transporting vessel to move the material into the line at
maximum density while the balance air quantity is added along the conveying line through coupling unit
provided at starting on the pipeline to overcome the pipeline frictional losses; thus pumping material at
the highest obtainable efficiency. The Coupling Unit ensures a uniform gradient and helps to maintain
the material at maximum density. It also helps in maintaining the desired velocity and overcoming the
pipeline / bend's friction and helps to restart the flow of blocked material if any along the conveying line
regardless of length. This Coupling Unit also helps in minimizing the compressed air consumption and
pipe abrasion.
The plugging problem is prevented by improving the ratio of the material to air throughout the system
to convey the material at the highest obtainable efficiency and degree of reliability. The highly abrasive
materials can be conveniently conveyed at lowest possible velocities consuming nominal quantity of air
DRAFT ENVIRONMENT IMPACT ASSESSMENT REPORT
Amendment in EC for Change in Fuel for 9.9 MW Captive Power Generation
Chapter-2: Project Description
Page | 2.8
with the help of these systems. The highly flexible check valve provided with Coupling Unit fittings are
very responsive to any back feeding due to changes in conveying line pressure thereby allowing
throttling of the air supply pressure and volume automatically. The designing of the system depends
upon the properties of the material like convey ability, moisture contents, product degradation, bulk
densities etc.
2.3.2.4 POLLUTION CONTROL EQUIPMENT
Proposed Steam boiler of 45 TPH will be run on imported coal & emits flue gases which contain the
following constituents:
• Particulate matter (PM)
• Gaseous constituent’s viz. SO2 and NOx
To mitigate the effects of the air emissions are summarized as below:
A. Particulate Matter
Particulate matters generated from the plant are in the form of fly ash and bed ash. Bed ash is collected
in the hoppers located below the combustor and there is no emissions due to collection through
hoppers. In order to limit the concentration in the form of fine particulate matter as fly ash in the exit flue
gas to within the stipulated standards, Electrostatic Precipitator (ESP) is installed.
Electrostatic precipitator is provided with four fields (working – 3 + standby - 1) & typically six activities
viz. Ionization, Migration, Collection, Charge Dissipation, Particle Dislodging & Particle Removal take
place inside an electro static precipitator to remove the particulate matter from exhaust gas.
System for online monitoring of the pollutants shall be installed for monitoring the pollution levels.
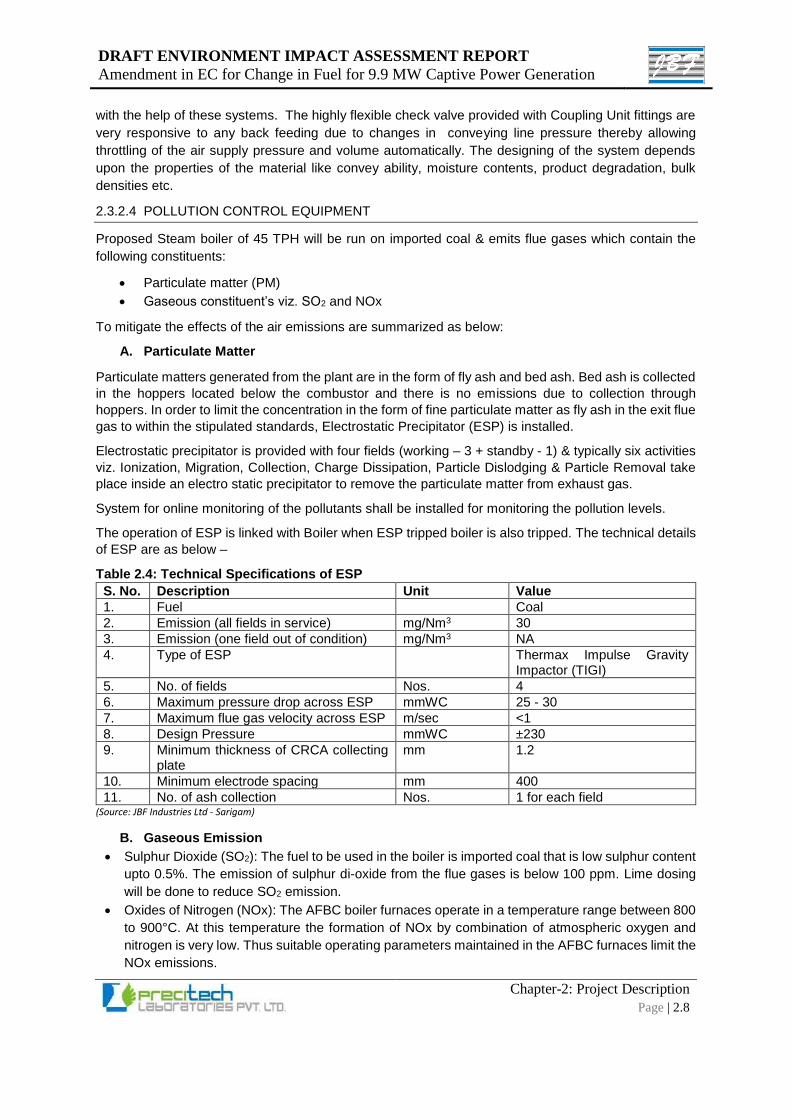
The operation of ESP is linked with Boiler when ESP tripped boiler is also tripped. The technical details
of ESP are as below –
Table 2.4: Technical Specifications of ESP
S. No. Description Unit Value
1. Fuel Coal
2. Emission (all fields in service) mg/Nm3 30
3. Emission (one field out of condition) mg/Nm3 NA
4. Type of ESP Thermax Impulse Gravity Impactor (TIGI)
5. No. of fields Nos. 4
6. Maximum pressure drop across ESP mmWC 25 - 30
7. Maximum flue gas velocity across ESP m/sec <1
8. Design Pressure mmWC ±230
9. Minimum thickness of CRCA collecting plate
mm 1.2
10. Minimum electrode spacing mm 400
11. No. of ash collection Nos. 1 for each field (Source: JBF Industries Ltd - Sarigam)
B. Gaseous Emission
• Sulphur Dioxide (SO2): The fuel to be used in the boiler is imported coal that is low sulphur content
upto 0.5%. The emission of sulphur di-oxide from the flue gases is below 100 ppm. Lime dosing
will be done to reduce SO2 emission.
• Oxides of Nitrogen (NOx): The AFBC boiler furnaces operate in a temperature range between 800
to 900°C. At this temperature the formation of NOx by combination of atmospheric oxygen and
nitrogen is very low. Thus suitable operating parameters maintained in the AFBC furnaces limit the
NOx emissions.
DRAFT ENVIRONMENT IMPACT ASSESSMENT REPORT
Amendment in EC for Change in Fuel for 9.9 MW Captive Power Generation
Chapter-2: Project Description
Page | 2.9
2.4 RESOURCES
The main resources required for construction and operation of the proposed project will be land,
construction materials, raw-materials, power, fuel, water and man-power.
2.4.1 LAND & BUILDING REQUIREMENT
The proposed installation will be accommodated in the existing land & some part of proposed installation
will be done on additionally adjoining plots 7/12 & 7/13.The existing plots and additional land are taken
on lease from the GIDC. Land possession documents are attached as Annexure – 4.
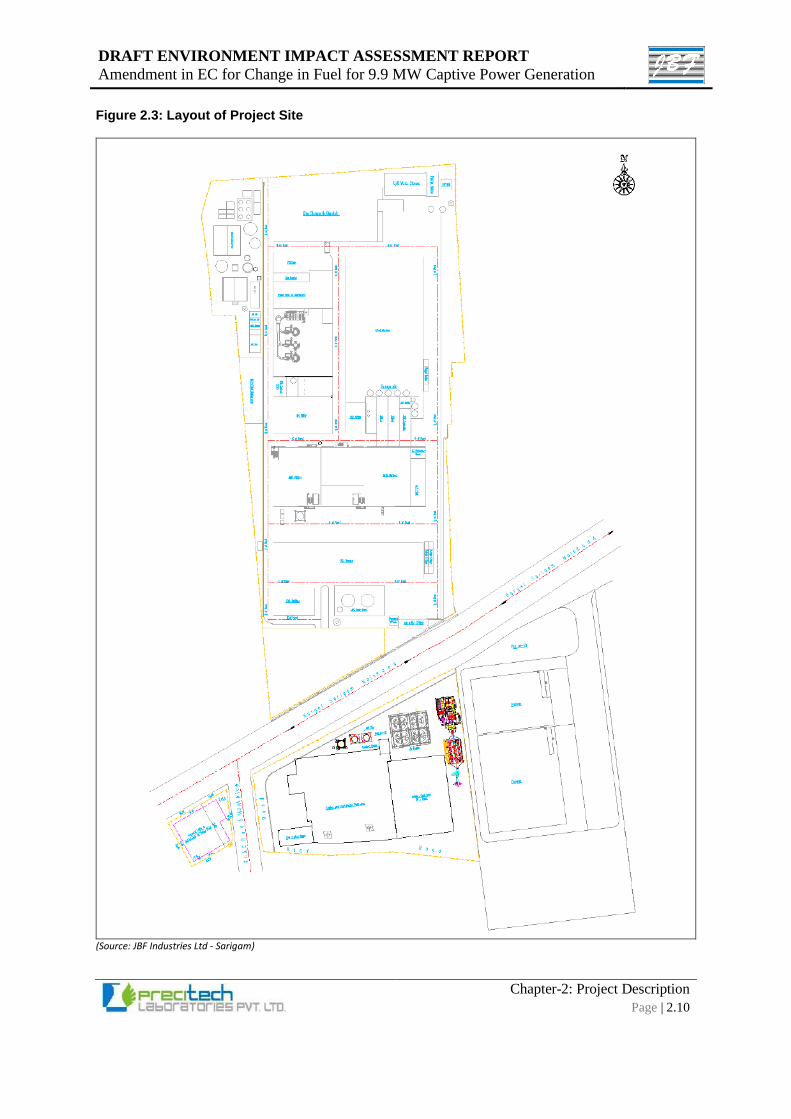
2.4.2 LAYOUT OF PROJECT SITE
The proposed installation will be accommodated in the existing open area of 1712 m2 as well as
additionally acquired land of 1350 m2. The total area of the plot is 59907 m2 & the new acquired area
will be 1350 m2. Hence, the total area after proposed installation will be 61257 m2. out of which Green
belt area of the plant is 6562.74m2 which is 10.95%.
The proposed site is located under seismic Zone-III as per IS:1893. Analysis and design of structures
to resist the seismic forces are carried out as per the provisions of IS:1893 - 2002. All seismic design
aspects like seismic zone factor (Z = 0.16) & Importance Factor (I = 1.75) are considered for project.
Therefore, adherence to standards and accepted practices is recommended.
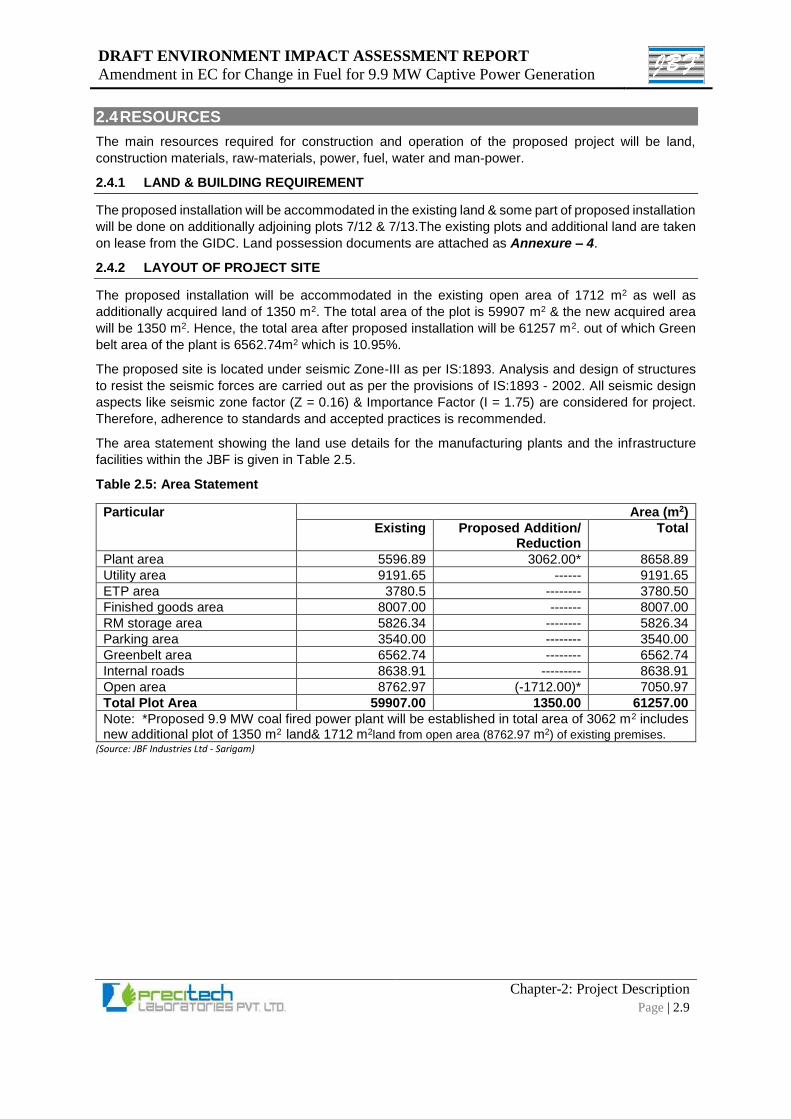
The area statement showing the land use details for the manufacturing plants and the infrastructure
facilities within the JBF is given in Table 2.5.
Table 2.5: Area Statement
Particular Area (m2)
Existing Proposed Addition/ Reduction
Total
Plant area 5596.89 3062.00* 8658.89
Utility area 9191.65 ------ 9191.65
ETP area 3780.5 -------- 3780.50
Finished goods area 8007.00 ------- 8007.00
RM storage area 5826.34 -------- 5826.34
Parking area 3540.00 -------- 3540.00
Greenbelt area 6562.74 -------- 6562.74
Internal roads 8638.91 --------- 8638.91
Open area 8762.97 (-1712.00)* 7050.97
Total Plot Area 59907.00 1350.00 61257.00
Note: *Proposed 9.9 MW coal fired power plant will be established in total area of 3062 m2 includes new additional plot of 1350 m2 land& 1712 m2land from open area (8762.97 m2) of existing premises.
(Source: JBF Industries Ltd - Sarigam)
DRAFT ENVIRONMENT IMPACT ASSESSMENT REPORT
Amendment in EC for Change in Fuel for 9.9 MW Captive Power Generation
Chapter-2: Project Description
Page | 2.10
Figure 2.3: Layout of Project Site
(Source: JBF Industries Ltd - Sarigam)
DRAFT ENVIRONMENT IMPACT ASSESSMENT REPORT
Amendment in EC for Change in Fuel for 9.9 MW Captive Power Generation
Chapter-2: Project Description
Page | 2.11
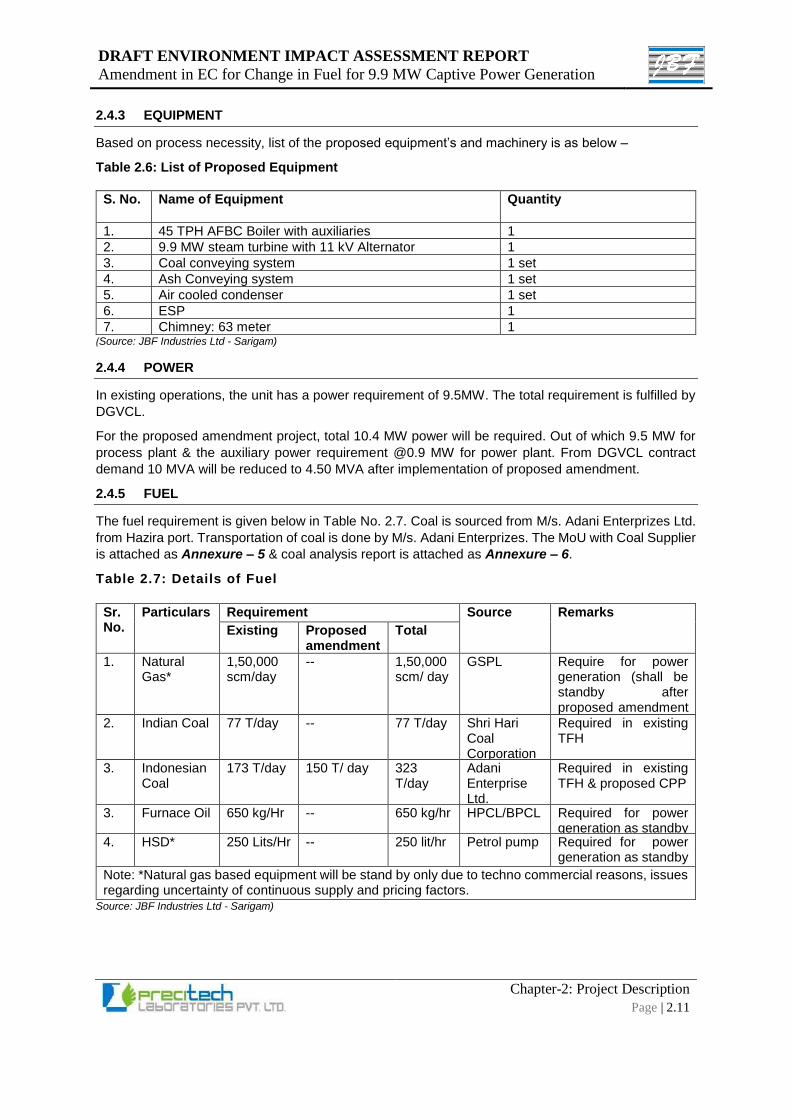
2.4.3 EQUIPMENT
Based on process necessity, list of the proposed equipment’s and machinery is as below –
Table 2.6: List of Proposed Equipment
S. No. Name of Equipment Quantity
1. 45 TPH AFBC Boiler with auxiliaries 1
2. 9.9 MW steam turbine with 11 kV Alternator 1
3. Coal conveying system 1 set
4. Ash Conveying system 1 set
5. Air cooled condenser 1 set
6. ESP 1
7. Chimney: 63 meter 1 (Source: JBF Industries Ltd - Sarigam)
2.4.4 POWER
In existing operations, the unit has a power requirement of 9.5MW. The total requirement is fulfilled by
DGVCL.
For the proposed amendment project, total 10.4 MW power will be required. Out of which 9.5 MW for
process plant & the auxiliary power requirement @0.9 MW for power plant. From DGVCL contract
demand 10 MVA will be reduced to 4.50 MVA after implementation of proposed amendment.
2.4.5 FUEL
The fuel requirement is given below in Table No. 2.7. Coal is sourced from M/s. Adani Enterprizes Ltd.
from Hazira port. Transportation of coal is done by M/s. Adani Enterprizes. The MoU with Coal Supplier
is attached as Annexure – 5 & coal analysis report is attached as Annexure – 6.
Table 2.7: Details of Fuel
Sr. No.
Particulars Requirement Source Remarks
Existing Proposed amendment
Total
1. Natural Gas*
1,50,000 scm/day
-- 1,50,000 scm/ day
GSPL
Require for power generation (shall be standby after proposed amendment of 9.9 MW coal fired CPP).
2. Indian Coal 77 T/day -- 77 T/day Shri Hari Coal Corporation
Required in existing TFH
3. Indonesian Coal
173 T/day 150 T/ day 323 T/day
Adani Enterprise Ltd.
Required in existing TFH & proposed CPP
3. Furnace Oil 650 kg/Hr -- 650 kg/hr HPCL/BPCL Required for power generation as standby
4. HSD* 250 Lits/Hr -- 250 lit/hr Petrol pump Required for power generation as standby
Note: *Natural gas based equipment will be stand by only due to techno commercial reasons, issues regarding uncertainty of continuous supply and pricing factors.
Source: JBF Industries Ltd - Sarigam)
DRAFT ENVIRONMENT IMPACT ASSESSMENT REPORT
Amendment in EC for Change in Fuel for 9.9 MW Captive Power Generation
Chapter-2: Project Description
Page | 2.12
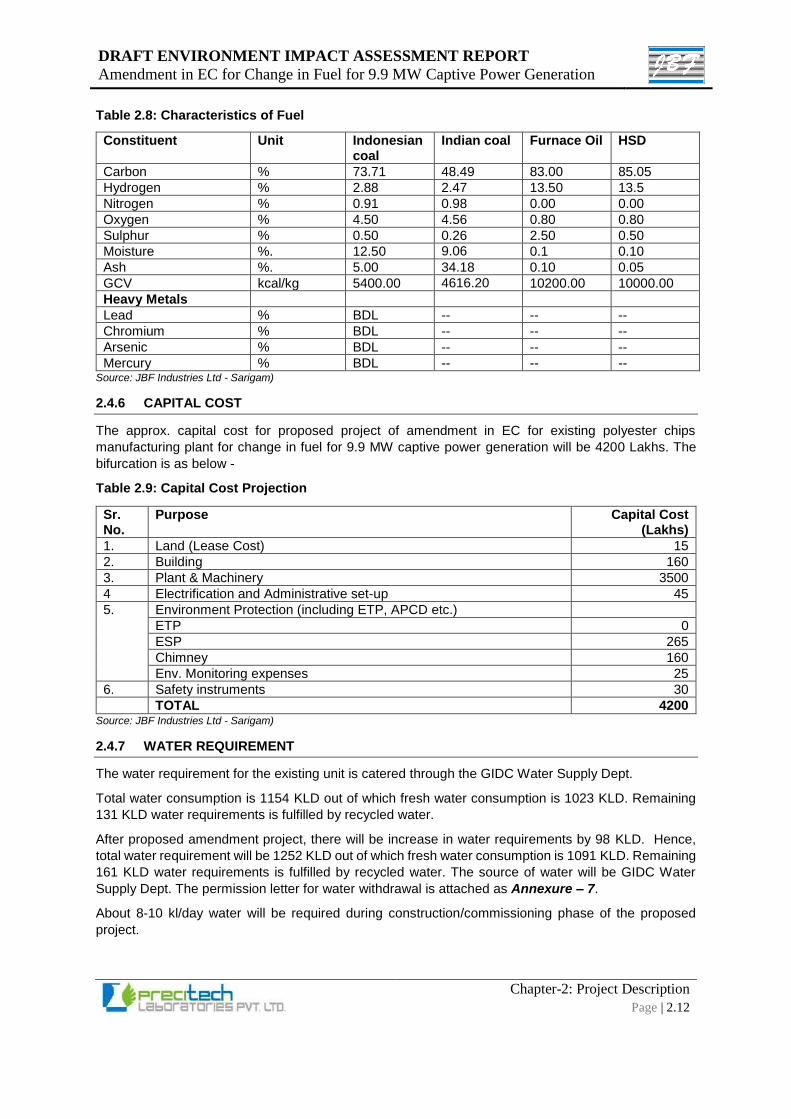
Table 2.8: Characteristics of Fuel
Constituent Unit Indonesian coal
Indian coal Furnace Oil HSD
Carbon % 73.71 48.49 83.00 85.05
Hydrogen % 2.88 2.47 13.50 13.5
Nitrogen % 0.91 0.98 0.00 0.00
Oxygen % 4.50 4.56 0.80 0.80
Sulphur % 0.50 0.26 2.50 0.50
Moisture %. 12.50 9.06 0.1 0.10
Ash %. 5.00 34.18 0.10 0.05
GCV kcal/kg 5400.00 4616.20 10200.00 10000.00
Heavy Metals
Lead % BDL -- -- --
Chromium % BDL -- -- --
Arsenic % BDL -- -- --
Mercury % BDL -- -- -- Source: JBF Industries Ltd - Sarigam)
2.4.6 CAPITAL COST
The approx. capital cost for proposed project of amendment in EC for existing polyester chips
manufacturing plant for change in fuel for 9.9 MW captive power generation will be 4200 Lakhs. The
bifurcation is as below -
Table 2.9: Capital Cost Projection
Sr. No.
Purpose Capital Cost (Lakhs)
1. Land (Lease Cost) 15
2. Building 160
3. Plant & Machinery 3500
4 Electrification and Administrative set-up 45
5. Environment Protection (including ETP, APCD etc.)
ETP 0
ESP 265
Chimney 160
Env. Monitoring expenses 25
6. Safety instruments 30
TOTAL 4200 Source: JBF Industries Ltd - Sarigam)
2.4.7 WATER REQUIREMENT
The water requirement for the existing unit is catered through the GIDC Water Supply Dept.
Total water consumption is 1154 KLD out of which fresh water consumption is 1023 KLD. Remaining
131 KLD water requirements is fulfilled by recycled water.
After proposed amendment project, there will be increase in water requirements by 98 KLD. Hence,
total water requirement will be 1252 KLD out of which fresh water consumption is 1091 KLD. Remaining
161 KLD water requirements is fulfilled by recycled water. The source of water will be GIDC Water
Supply Dept. The permission letter for water withdrawal is attached as Annexure – 7.
About 8-10 kl/day water will be required during construction/commissioning phase of the proposed
project.
DRAFT ENVIRONMENT IMPACT ASSESSMENT REPORT
Amendment in EC for Change in Fuel for 9.9 MW Captive Power Generation
Chapter-2: Project Description
Page | 2.13
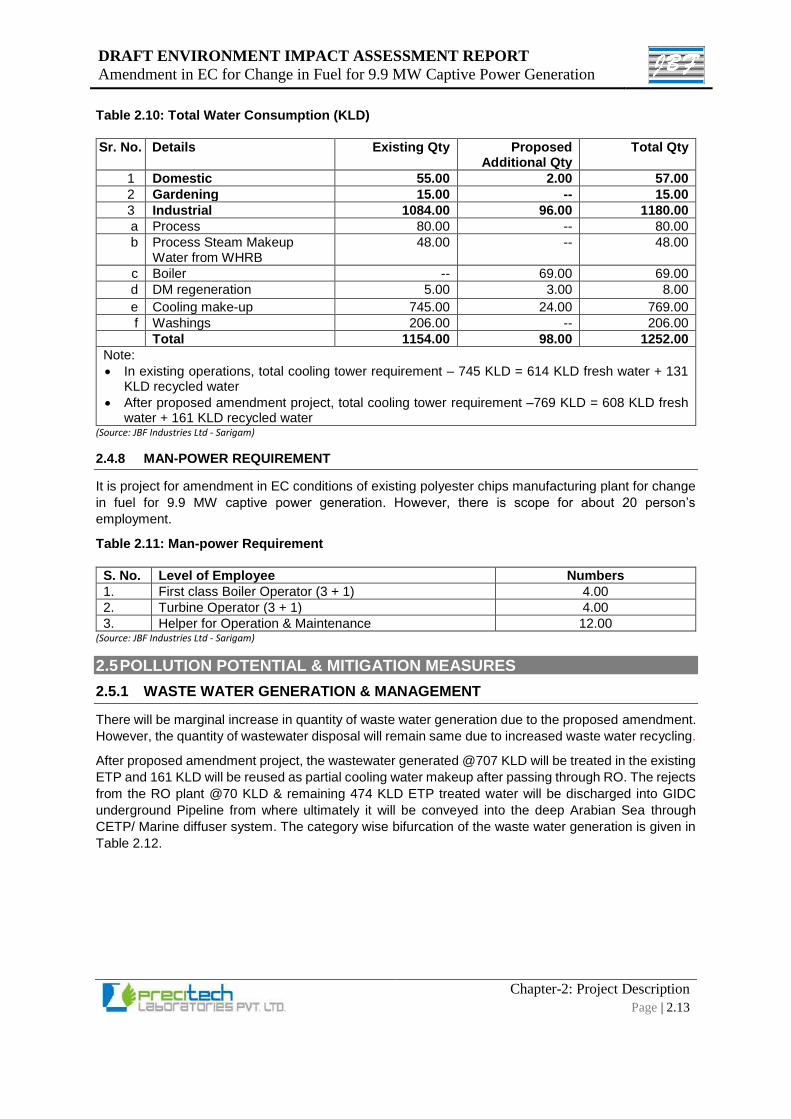
Table 2.10: Total Water Consumption (KLD)
Sr. No. Details Existing Qty Proposed Additional Qty
Total Qty
1 Domestic 55.00 2.00 57.00
2 Gardening 15.00 -- 15.00
3 Industrial 1084.00 96.00 1180.00
a Process 80.00 -- 80.00
b Process Steam Makeup Water from WHRB
48.00 -- 48.00
c Boiler -- 69.00 69.00
d DM regeneration 5.00 3.00 8.00
e Cooling make-up 745.00 24.00 769.00
f Washings 206.00 -- 206.00
Total 1154.00 98.00 1252.00
Note:
• In existing operations, total cooling tower requirement – 745 KLD = 614 KLD fresh water + 131 KLD recycled water
• After proposed amendment project, total cooling tower requirement –769 KLD = 608 KLD fresh water + 161 KLD recycled water
(Source: JBF Industries Ltd - Sarigam)
2.4.8 MAN-POWER REQUIREMENT
It is project for amendment in EC conditions of existing polyester chips manufacturing plant for change
in fuel for 9.9 MW captive power generation. However, there is scope for about 20 person’s
employment.
Table 2.11: Man-power Requirement
S. No. Level of Employee Numbers
1. First class Boiler Operator (3 + 1) 4.00
2. Turbine Operator (3 + 1) 4.00
3. Helper for Operation & Maintenance 12.00 (Source: JBF Industries Ltd - Sarigam)
2.5 POLLUTION POTENTIAL & MITIGATION MEASURES
2.5.1 WASTE WATER GENERATION & MANAGEMENT
There will be marginal increase in quantity of waste water generation due to the proposed amendment.
However, the quantity of wastewater disposal will remain same due to increased waste water recycling.
After proposed amendment project, the wastewater generated @707 KLD will be treated in the existing
ETP and 161 KLD will be reused as partial cooling water makeup after passing through RO. The rejects
from the RO plant @70 KLD & remaining 474 KLD ETP treated water will be discharged into GIDC
underground Pipeline from where ultimately it will be conveyed into the deep Arabian Sea through
CETP/ Marine diffuser system. The category wise bifurcation of the waste water generation is given in
Table 2.12.
DRAFT ENVIRONMENT IMPACT ASSESSMENT REPORT
Amendment in EC for Change in Fuel for 9.9 MW Captive Power Generation
Chapter-2: Project Description
Page | 2.14
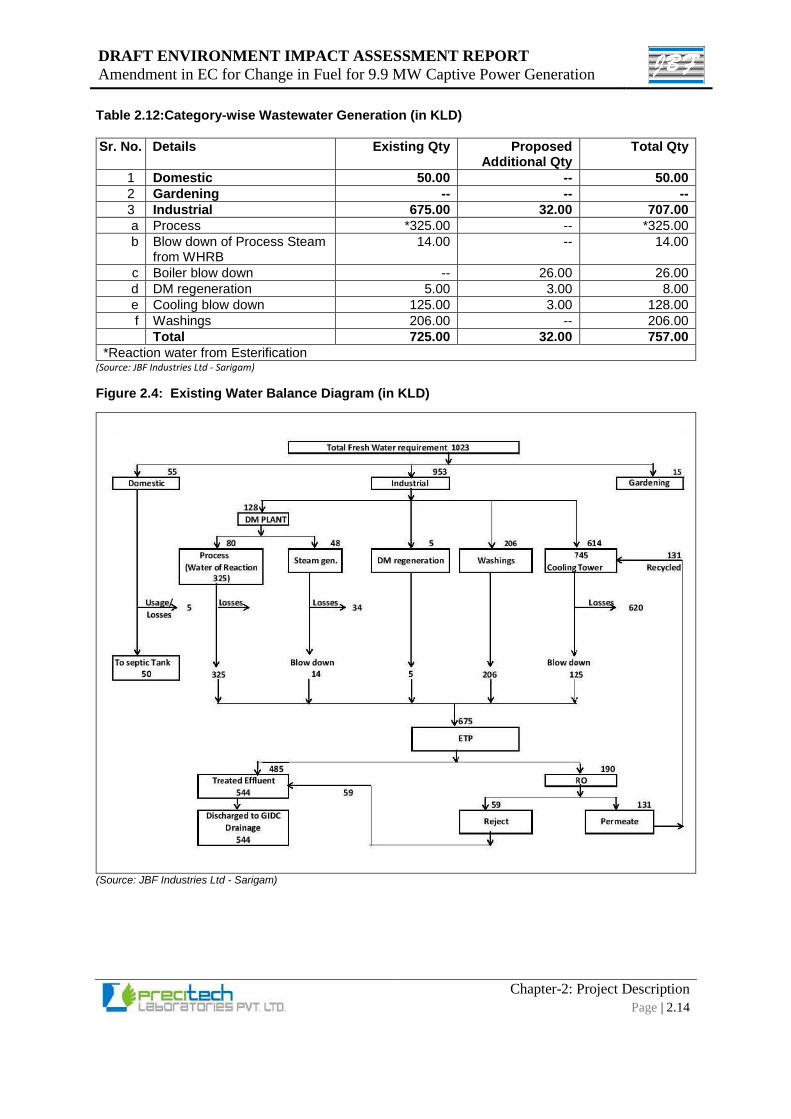
Table 2.12:Category-wise Wastewater Generation (in KLD)
Sr. No. Details Existing Qty Proposed Additional Qty
Total Qty
1 Domestic 50.00 -- 50.00
2 Gardening -- -- --
3 Industrial 675.00 32.00 707.00
a Process *325.00 -- *325.00
b Blow down of Process Steam from WHRB
14.00 -- 14.00
c Boiler blow down -- 26.00 26.00
d DM regeneration 5.00 3.00 8.00
e Cooling blow down 125.00 3.00 128.00
f Washings 206.00 -- 206.00
Total 725.00 32.00 757.00
*Reaction water from Esterification (Source: JBF Industries Ltd - Sarigam)
Figure 2.4: Existing Water Balance Diagram (in KLD)
(Source: JBF Industries Ltd - Sarigam)
DRAFT ENVIRONMENT IMPACT ASSESSMENT REPORT
Amendment in EC for Change in Fuel for 9.9 MW Captive Power Generation
Chapter-2: Project Description
Page | 2.15
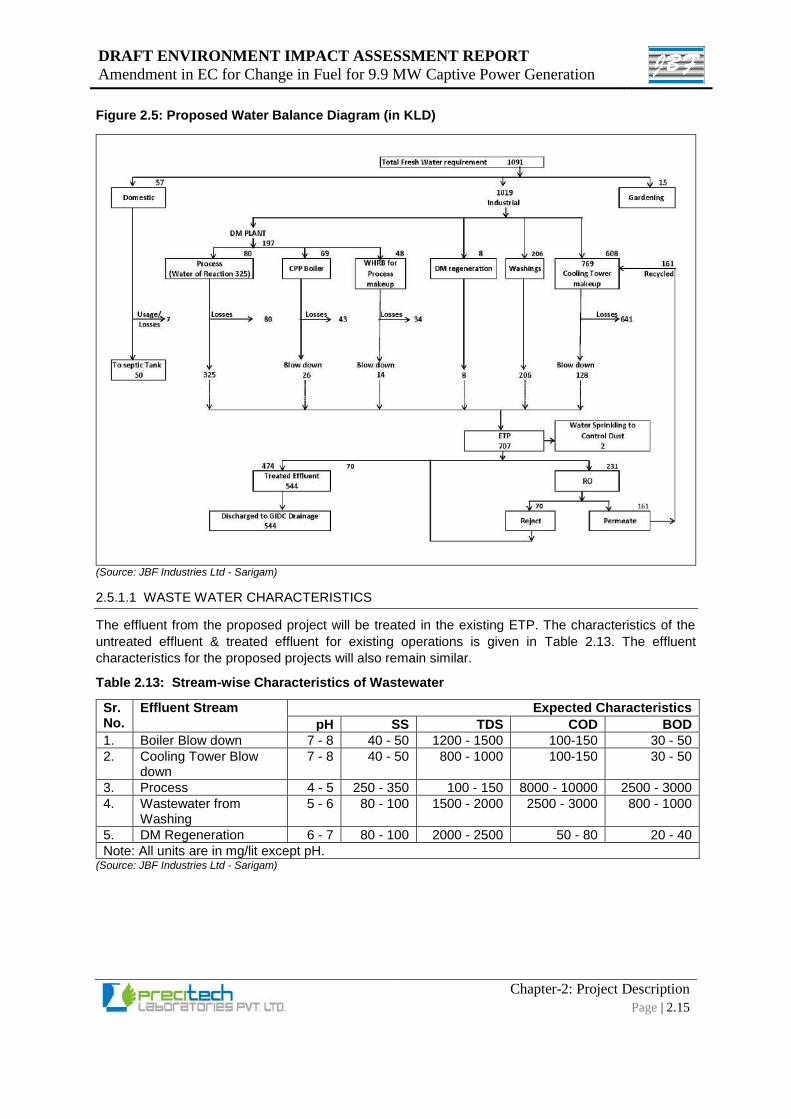
Figure 2.5: Proposed Water Balance Diagram (in KLD)
(Source: JBF Industries Ltd - Sarigam)
2.5.1.1 WASTE WATER CHARACTERISTICS
The effluent from the proposed project will be treated in the existing ETP. The characteristics of the
untreated effluent & treated effluent for existing operations is given in Table 2.13. The effluent
characteristics for the proposed projects will also remain similar.
Table 2.13: Stream-wise Characteristics of Wastewater
Sr. No.
Effluent Stream
Expected Characteristics
pH SS TDS COD BOD
1. Boiler Blow down 7 - 8 40 - 50 1200 - 1500 100-150 30 - 50
2. Cooling Tower Blow down
7 - 8 40 - 50 800 - 1000 100-150 30 - 50
3. Process 4 - 5 250 - 350 100 - 150 8000 - 10000 2500 - 3000
4. Wastewater from Washing
5 - 6 80 - 100 1500 - 2000 2500 - 3000 800 - 1000
5. DM Regeneration 6 - 7 80 - 100 2000 - 2500 50 - 80 20 - 40
Note: All units are in mg/lit except pH. (Source: JBF Industries Ltd - Sarigam)
DRAFT ENVIRONMENT IMPACT ASSESSMENT REPORT
Amendment in EC for Change in Fuel for 9.9 MW Captive Power Generation
Chapter-2: Project Description
Page | 2.16
Table 2.14: Expected Characteristics of Wastewater
Sr. No.
Parameter
Characteristics
Untreated Treated Permissible Limits (Discharge to CETP)
1. pH 4.5 to 6 7 to 8.5 6.5 to 8.5
2. SS 50 to 200 10 to 50 <300
3 TDS 500 to 1000 700 to 1600 <2100
4. COD 5000 to 8000 100 to 200 < 750
5. BOD 1500 to 2500 20 to 60 < 300
Note: All above values in mg/ lit except pH or where specified (Source: JBF Industries Ltd - Sarigam)
2.5.1.2 WASTE WATER DISPOSAL SCHEME
• In existing operations, the total domestic wastewater generated @50 KLD and is treated along
with the industrial effluent and discharged in to GIDC underground pipeline.
• Wastewater generated from industrial activities @675 KLD is treated in ETP. Out of which 190
KLD is treated in RO.
• Permeate from RO @131 KLD is recycled to cooling tower makeup.
• Remaining treated effluent @485 KLD & RO reject @59 KLD is discharged through GIDC
underground drainage from where ultimately it is conveyed into the deep Arabian Sea.
• After proposed amendment project, there will be no increase in domestic waste water.
• Whereas, wastewater generated from industrial activities @707 KLD waste water will be treated
in ETP. Out of which 231 KLD will be treated in RO.
• Permeate from RO @161 KLD will be recycled to cooling tower makeup.
• Remaining treated effluent @474 KLD & RO reject @70KLD will be discharged through GIDC
underground pipeline from where ultimately it will be conveyed into the deep Arabian Sea
through CETP.
Effluent Treatment Scheme
The existing effluent treatment plant consists of pre-treatment, primary, secondary and tertiary
treatment units.
The existing operation have adequate ETP infrastructure to meet all the consent standards. The ETP
has, Oil & grease traps, 2 collection/equalization & neutralization tanks, primary clarifier, 2 UASBs,
settling tank, 2 ASP based aeration tanks, secondary clarifier, over flow collection tank, tertiary clarifier,
tertiary clarifier over flow tank, Sand beds, Activated beds, UF & RO unit, treated effluent tank-Guard
pond, sludge drying beds, sludge decanters and ETP waste storage shed etc. The treated effluent with
due quality assurance is metered through magnetic flow meter and discharged into the GIDC drain.
The quality of the discharged effluent is assured through daily checks and analysis of critical
parameters. The company has installed continuous online monitoring system for flow, pH, COD, BOD
and TSS and is up liked to CPCB & GPCB. The discharged effluent is further processed through 15
MLD CETP Sarigam and finally discharged into the deep Arabian Sea through CETP/Marine diffuser
system.
The proposed amendment does not have any potential to generate any additional organic load. Hence,
the existing ETP is capable to take the load of the additional effluent. Acknowledgement copy for
obtaining CETP membership certificate is attached as Annexure – 8.
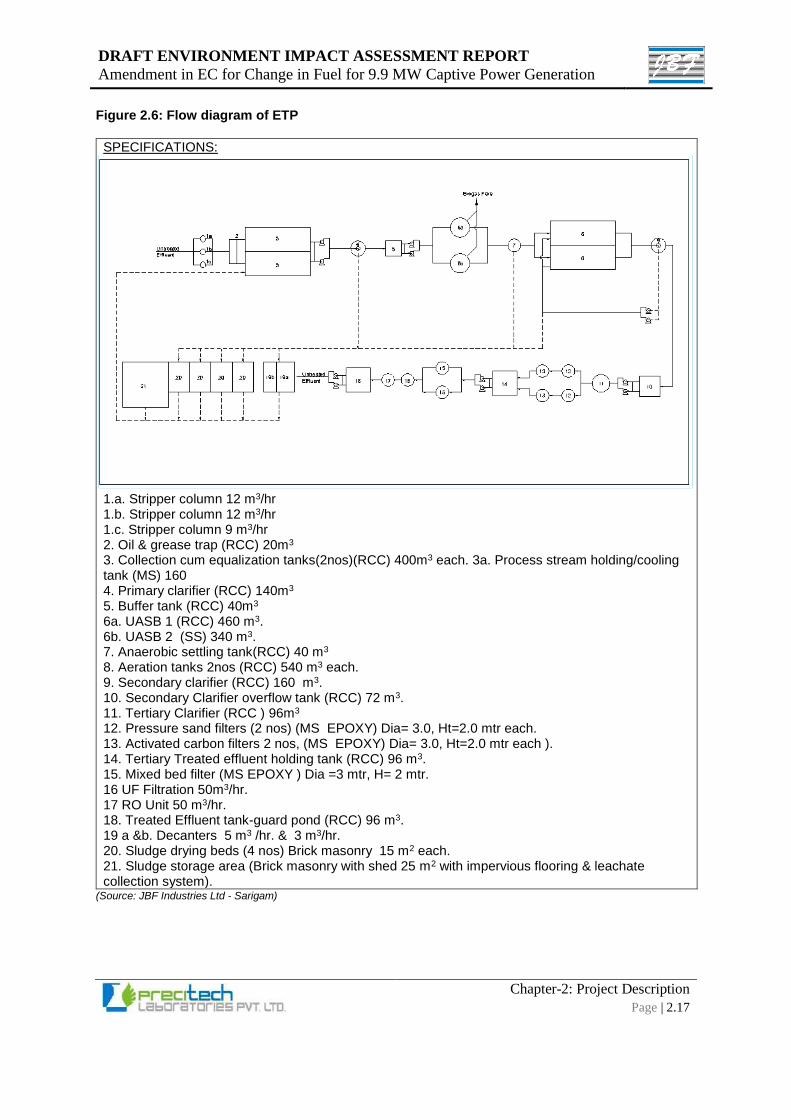
DRAFT ENVIRONMENT IMPACT ASSESSMENT REPORT
Amendment in EC for Change in Fuel for 9.9 MW Captive Power Generation
Chapter-2: Project Description
Page | 2.17
Figure 2.6: Flow diagram of ETP
SPECIFICATIONS:
1.a. Stripper column 12 m3/hr 1.b. Stripper column 12 m3/hr 1.c. Stripper column 9 m3/hr 2. Oil & grease trap (RCC) 20m3 3. Collection cum equalization tanks(2nos)(RCC) 400m3 each. 3a. Process stream holding/cooling tank (MS) 160 4. Primary clarifier (RCC) 140m3 5. Buffer tank (RCC) 40m3 6a. UASB 1 (RCC) 460 m3. 6b. UASB 2 (SS) 340 m3. 7. Anaerobic settling tank(RCC) 40 m3 8. Aeration tanks 2nos (RCC) 540 m3 each. 9. Secondary clarifier (RCC) 160 m3. 10. Secondary Clarifier overflow tank (RCC) 72 m3. 11. Tertiary Clarifier (RCC ) 96m3 12. Pressure sand filters (2 nos) (MS EPOXY) Dia= 3.0, Ht=2.0 mtr each. 13. Activated carbon filters 2 nos, (MS EPOXY) Dia= 3.0, Ht=2.0 mtr each ). 14. Tertiary Treated effluent holding tank (RCC) 96 m3. 15. Mixed bed filter (MS EPOXY ) Dia =3 mtr, H= 2 mtr. 16 UF Filtration 50m3/hr. 17 RO Unit 50 m3/hr. 18. Treated Effluent tank-guard pond (RCC) 96 m3. 19 a &b. Decanters 5 m3 /hr. & 3 m3/hr. 20. Sludge drying beds (4 nos) Brick masonry 15 m2 each. 21. Sludge storage area (Brick masonry with shed 25 m2 with impervious flooring & leachate collection system).
(Source: JBF Industries Ltd - Sarigam)
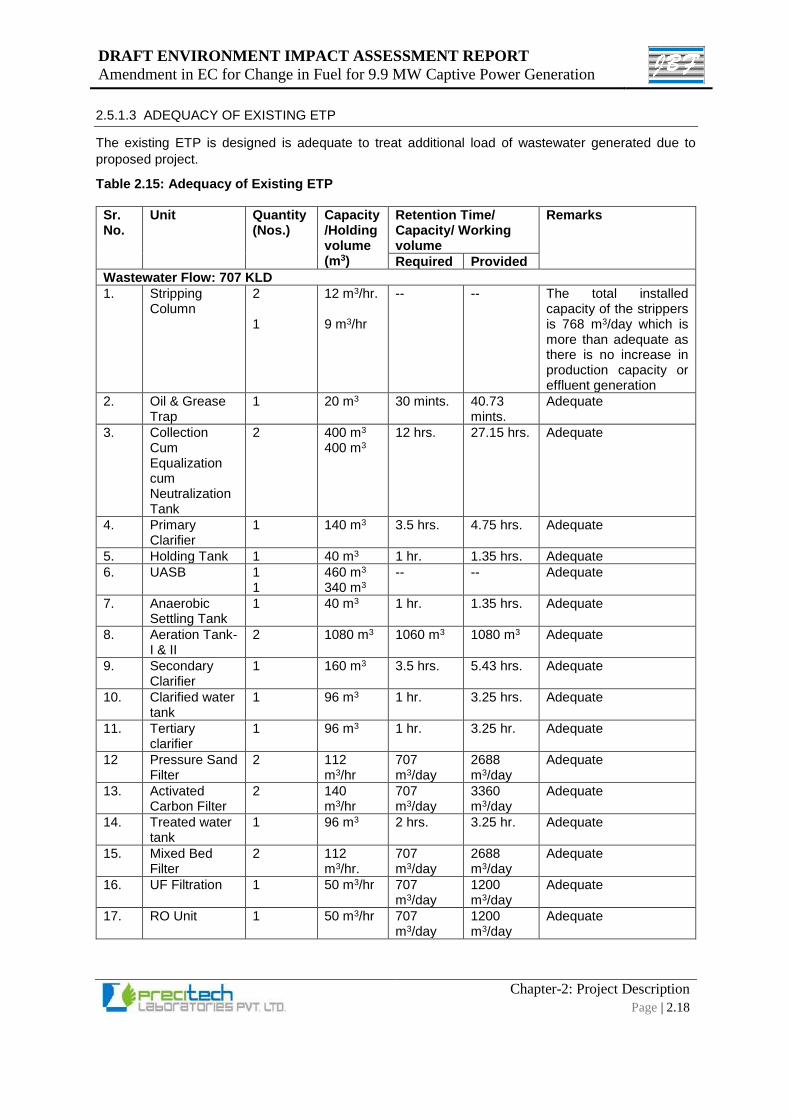
DRAFT ENVIRONMENT IMPACT ASSESSMENT REPORT
Amendment in EC for Change in Fuel for 9.9 MW Captive Power Generation
Chapter-2: Project Description
Page | 2.18
2.5.1.3 ADEQUACY OF EXISTING ETP
The existing ETP is designed is adequate to treat additional load of wastewater generated due to
proposed project.
Table 2.15: Adequacy of Existing ETP
Sr. No.
Unit Quantity (Nos.)
Capacity/Holding volume (m3)
Retention Time/ Capacity/ Working volume
Remarks
Required Provided
Wastewater Flow: 707 KLD
1.
Stripping Column
2 1
12 m3/hr. 9 m3/hr
-- -- The total installed capacity of the strippers is 768 m3/day which is more than adequate as there is no increase in production capacity or effluent generation
2. Oil & Grease Trap
1 20 m3 30 mints. 40.73 mints.
Adequate
3. Collection Cum Equalization cum Neutralization Tank
2 400 m3
400 m3
12 hrs. 27.15 hrs. Adequate
4. Primary Clarifier
1 140 m3 3.5 hrs. 4.75 hrs. Adequate
5. Holding Tank 1 40 m3 1 hr. 1.35 hrs. Adequate
6. UASB 1 1
460 m3
340 m3
-- -- Adequate
7. Anaerobic Settling Tank
1 40 m3 1 hr. 1.35 hrs. Adequate
8. Aeration Tank-I & II
2 1080 m3 1060 m3 1080 m3 Adequate
9. Secondary Clarifier
1 160 m3 3.5 hrs. 5.43 hrs. Adequate
10. Clarified water tank
1 96 m3 1 hr. 3.25 hrs. Adequate
11. Tertiary clarifier
1 96 m3 1 hr. 3.25 hr. Adequate
12 Pressure Sand Filter
2 112 m3/hr
707 m3/day
2688 m3/day
Adequate
13. Activated Carbon Filter
2 140 m3/hr
707 m3/day
3360 m3/day
Adequate
14. Treated water tank
1 96 m3 2 hrs. 3.25 hr. Adequate
15. Mixed Bed Filter
2 112 m3/hr.
707 m3/day
2688 m3/day
Adequate
16. UF Filtration 1 50 m3/hr 707 m3/day
1200 m3/day
Adequate
17. RO Unit 1 50 m3/hr 707 m3/day
1200 m3/day
Adequate
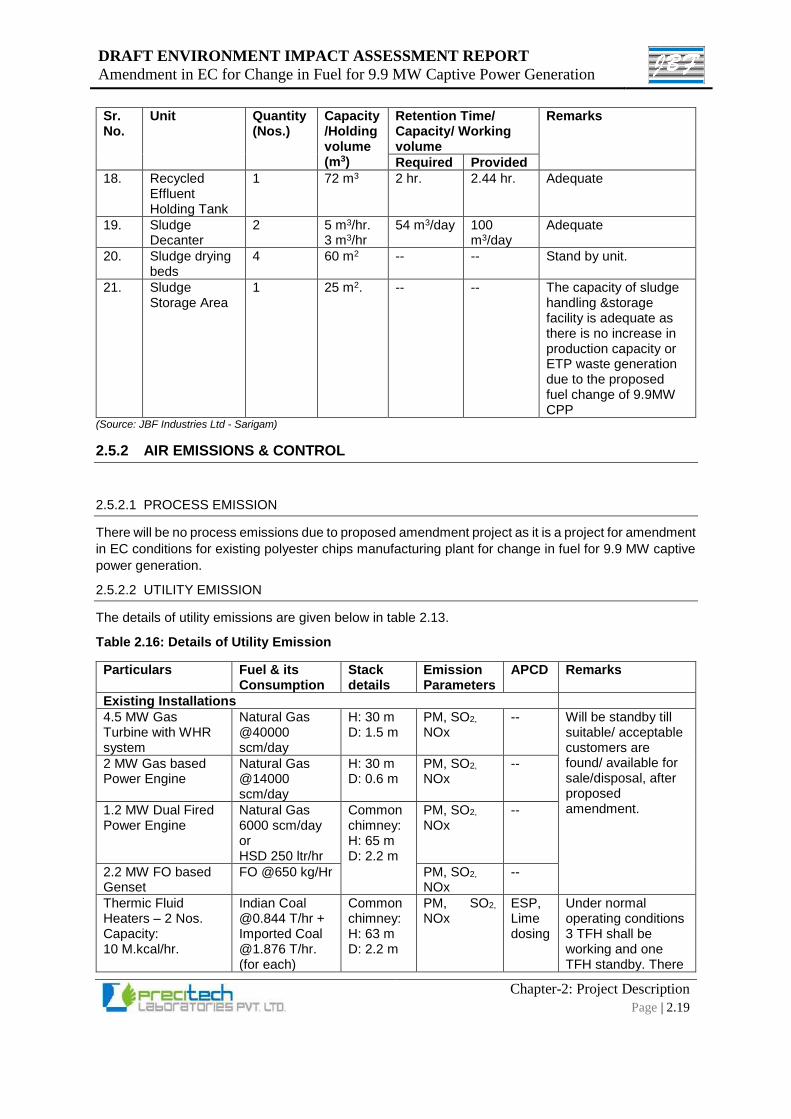
DRAFT ENVIRONMENT IMPACT ASSESSMENT REPORT
Amendment in EC for Change in Fuel for 9.9 MW Captive Power Generation
Chapter-2: Project Description
Page | 2.19
Sr. No.
Unit Quantity (Nos.)
Capacity/Holding volume (m3)
Retention Time/ Capacity/ Working volume
Remarks
Required Provided
18. Recycled Effluent Holding Tank
1 72 m3 2 hr. 2.44 hr. Adequate
19. Sludge Decanter
2 5 m3/hr. 3 m3/hr
54 m3/day 100 m3/day
Adequate
20. Sludge drying beds
4 60 m2 -- -- Stand by unit.
21. Sludge Storage Area
1 25 m2. -- -- The capacity of sludge handling &storage facility is adequate as there is no increase in production capacity or ETP waste generation due to the proposed fuel change of 9.9MW CPP
(Source: JBF Industries Ltd - Sarigam)
2.5.2 AIR EMISSIONS & CONTROL
2.5.2.1 PROCESS EMISSION
There will be no process emissions due to proposed amendment project as it is a project for amendment
in EC conditions for existing polyester chips manufacturing plant for change in fuel for 9.9 MW captive
power generation.
2.5.2.2 UTILITY EMISSION
The details of utility emissions are given below in table 2.13.
Table 2.16: Details of Utility Emission
Particulars Fuel & its Consumption
Stack details
Emission Parameters
APCD Remarks
Existing Installations
4.5 MW Gas Turbine with WHR system
Natural Gas @40000 scm/day
H: 30 m D: 1.5 m
PM, SO2, NOx
-- Will be standby till suitable/ acceptable customers are found/ available for sale/disposal, after proposed amendment.
2 MW Gas based Power Engine
Natural Gas @14000 scm/day
H: 30 m D: 0.6 m
PM, SO2, NOx
--
1.2 MW Dual Fired Power Engine
Natural Gas 6000 scm/day or HSD 250 ltr/hr
Common chimney: H: 65 m D: 2.2 m
PM, SO2, NOx
--
2.2 MW FO based Genset
FO @650 kg/Hr PM, SO2, NOx
--
Thermic Fluid Heaters – 2 Nos. Capacity: 10 M.kcal/hr.
Indian Coal @0.844 T/hr + Imported Coal @1.876 T/hr. (for each)
Common chimney: H: 63 m D: 2.2 m
PM, SO2, NOx
ESP, Lime dosing
Under normal operating conditions 3 TFH shall be working and one TFH standby. There
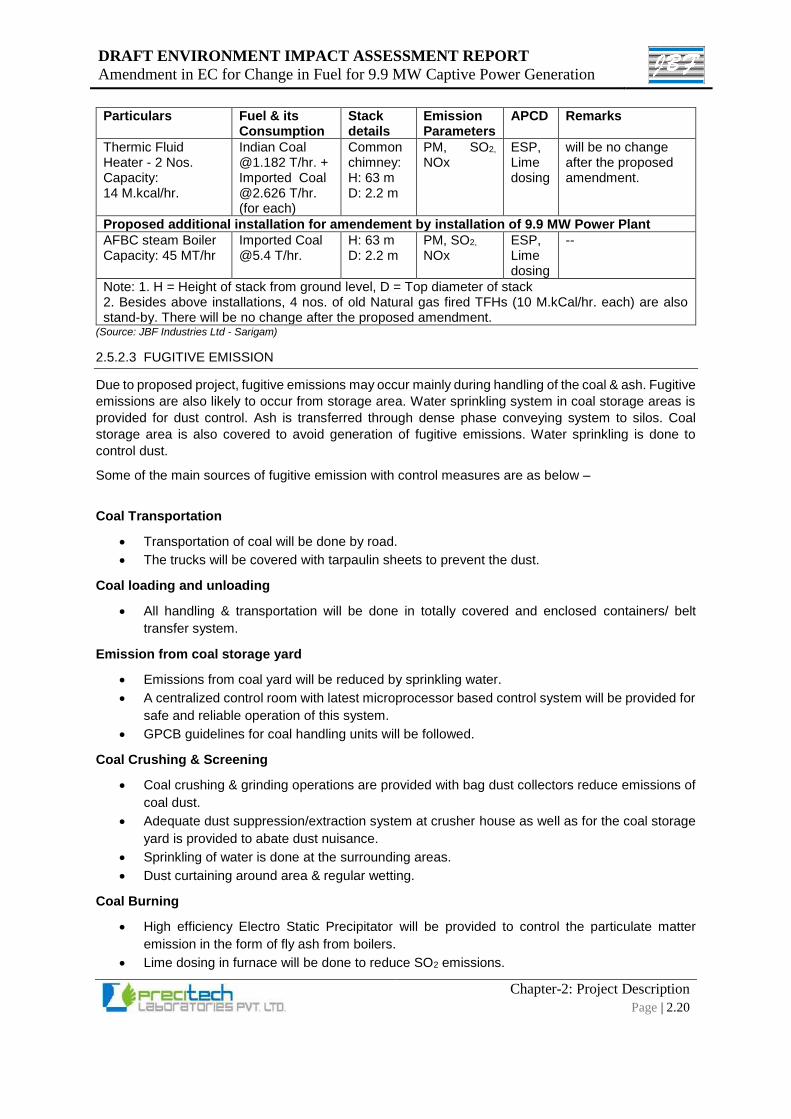
DRAFT ENVIRONMENT IMPACT ASSESSMENT REPORT
Amendment in EC for Change in Fuel for 9.9 MW Captive Power Generation
Chapter-2: Project Description
Page | 2.20
Particulars Fuel & its Consumption
Stack details
Emission Parameters
APCD Remarks
Thermic Fluid Heater - 2 Nos. Capacity: 14 M.kcal/hr.
Indian Coal @1.182 T/hr. + Imported Coal @2.626 T/hr. (for each)
Common chimney: H: 63 m D: 2.2 m
PM, SO2, NOx
ESP, Lime dosing
will be no change after the proposed amendment.
Proposed additional installation for amendement by installation of 9.9 MW Power Plant
AFBC steam Boiler Capacity: 45 MT/hr
Imported Coal @5.4 T/hr.
H: 63 m D: 2.2 m
PM, SO2, NOx
ESP, Lime dosing
--
Note: 1. H = Height of stack from ground level, D = Top diameter of stack 2. Besides above installations, 4 nos. of old Natural gas fired TFHs (10 M.kCal/hr. each) are also stand-by. There will be no change after the proposed amendment.
(Source: JBF Industries Ltd - Sarigam)
2.5.2.3 FUGITIVE EMISSION
Due to proposed project, fugitive emissions may occur mainly during handling of the coal & ash. Fugitive
emissions are also likely to occur from storage area. Water sprinkling system in coal storage areas is
provided for dust control. Ash is transferred through dense phase conveying system to silos. Coal
storage area is also covered to avoid generation of fugitive emissions. Water sprinkling is done to
control dust.
Some of the main sources of fugitive emission with control measures are as below –
Coal Transportation
• Transportation of coal will be done by road.
• The trucks will be covered with tarpaulin sheets to prevent the dust.
Coal loading and unloading
• All handling & transportation will be done in totally covered and enclosed containers/ belt
transfer system.
Emission from coal storage yard
• Emissions from coal yard will be reduced by sprinkling water.
• A centralized control room with latest microprocessor based control system will be provided for
safe and reliable operation of this system.
• GPCB guidelines for coal handling units will be followed.
Coal Crushing & Screening
• Coal crushing & grinding operations are provided with bag dust collectors reduce emissions of
coal dust.
• Adequate dust suppression/extraction system at crusher house as well as for the coal storage
yard is provided to abate dust nuisance.
• Sprinkling of water is done at the surrounding areas.
• Dust curtaining around area & regular wetting.
Coal Burning
• High efficiency Electro Static Precipitator will be provided to control the particulate matter
emission in the form of fly ash from boilers.
• Lime dosing in furnace will be done to reduce SO2 emissions.
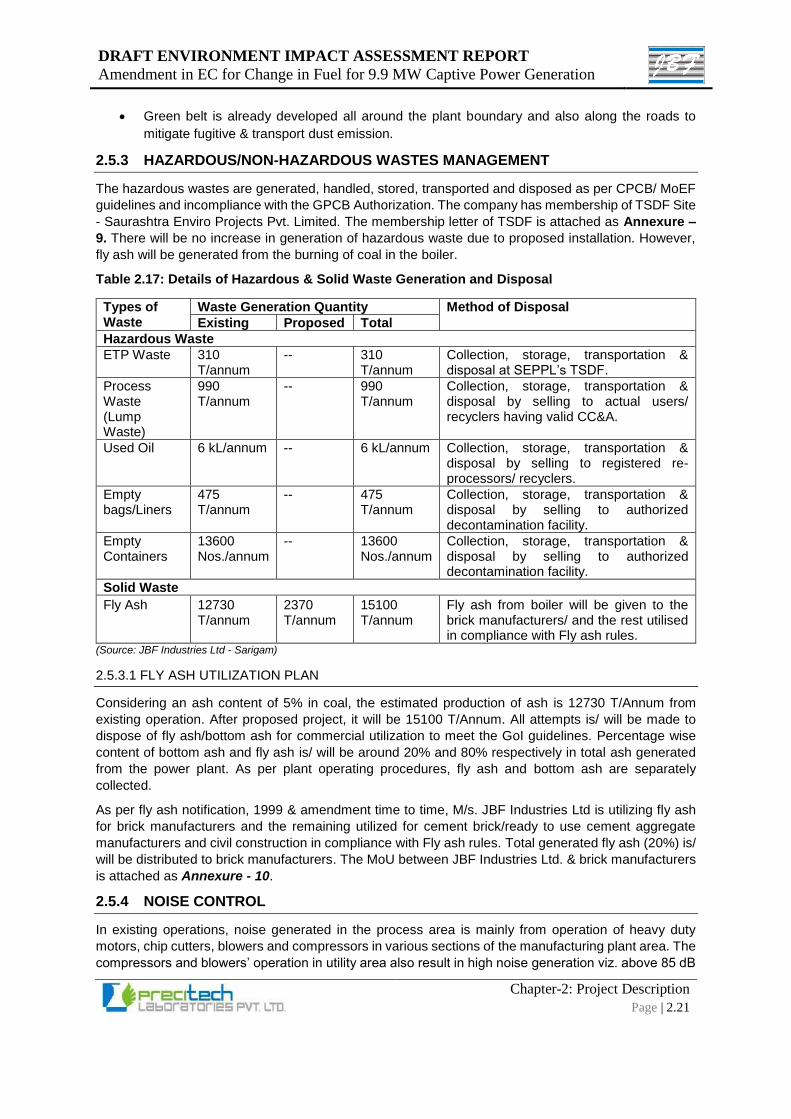
DRAFT ENVIRONMENT IMPACT ASSESSMENT REPORT
Amendment in EC for Change in Fuel for 9.9 MW Captive Power Generation
Chapter-2: Project Description
Page | 2.21
• Green belt is already developed all around the plant boundary and also along the roads to
mitigate fugitive & transport dust emission.
2.5.3 HAZARDOUS/NON-HAZARDOUS WASTES MANAGEMENT
The hazardous wastes are generated, handled, stored, transported and disposed as per CPCB/ MoEF
guidelines and incompliance with the GPCB Authorization. The company has membership of TSDF Site
- Saurashtra Enviro Projects Pvt. Limited. The membership letter of TSDF is attached as Annexure –
9. There will be no increase in generation of hazardous waste due to proposed installation. However,
fly ash will be generated from the burning of coal in the boiler.
Table 2.17: Details of Hazardous & Solid Waste Generation and Disposal
Types of Waste
Waste Generation Quantity Method of Disposal
Existing Proposed Total
Hazardous Waste
ETP Waste 310 T/annum
-- 310 T/annum
Collection, storage, transportation & disposal at SEPPL’s TSDF.
Process Waste (Lump Waste)
990 T/annum
-- 990 T/annum
Collection, storage, transportation & disposal by selling to actual users/ recyclers having valid CC&A.
Used Oil 6 kL/annum -- 6 kL/annum Collection, storage, transportation & disposal by selling to registered re-processors/ recyclers.
Empty bags/Liners
475 T/annum
-- 475 T/annum
Collection, storage, transportation & disposal by selling to authorized decontamination facility.
Empty Containers
13600 Nos./annum
-- 13600 Nos./annum
Collection, storage, transportation & disposal by selling to authorized decontamination facility.
Solid Waste
Fly Ash 12730 T/annum
2370 T/annum
15100 T/annum
Fly ash from boiler will be given to the brick manufacturers/ and the rest utilised in compliance with Fly ash rules.
(Source: JBF Industries Ltd - Sarigam)
2.5.3.1 FLY ASH UTILIZATION PLAN
Considering an ash content of 5% in coal, the estimated production of ash is 12730 T/Annum from
existing operation. After proposed project, it will be 15100 T/Annum. All attempts is/ will be made to
dispose of fly ash/bottom ash for commercial utilization to meet the GoI guidelines. Percentage wise
content of bottom ash and fly ash is/ will be around 20% and 80% respectively in total ash generated
from the power plant. As per plant operating procedures, fly ash and bottom ash are separately
collected.
As per fly ash notification, 1999 & amendment time to time, M/s. JBF Industries Ltd is utilizing fly ash
for brick manufacturers and the remaining utilized for cement brick/ready to use cement aggregate
manufacturers and civil construction in compliance with Fly ash rules. Total generated fly ash (20%) is/
will be distributed to brick manufacturers. The MoU between JBF Industries Ltd. & brick manufacturers
is attached as Annexure - 10.
2.5.4 NOISE CONTROL
In existing operations, noise generated in the process area is mainly from operation of heavy duty
motors, chip cutters, blowers and compressors in various sections of the manufacturing plant area. The
compressors and blowers’ operation in utility area also result in high noise generation viz. above 85 dB
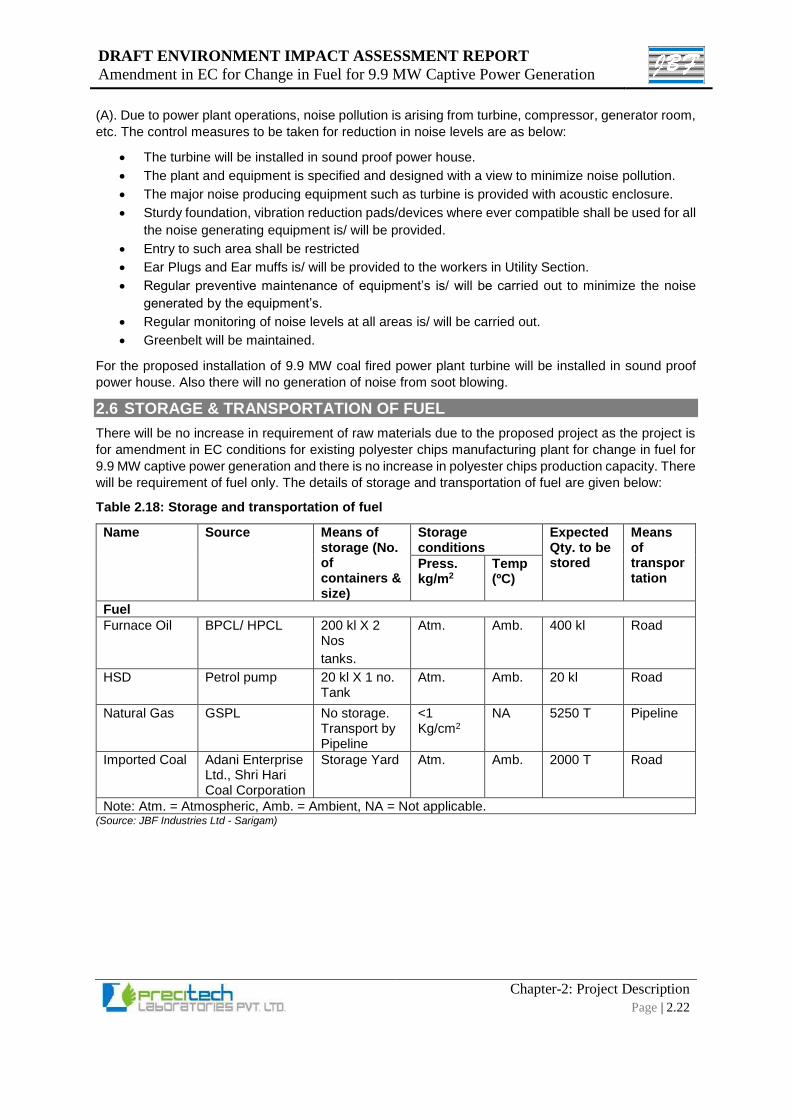
DRAFT ENVIRONMENT IMPACT ASSESSMENT REPORT
Amendment in EC for Change in Fuel for 9.9 MW Captive Power Generation
Chapter-2: Project Description
Page | 2.22
(A). Due to power plant operations, noise pollution is arising from turbine, compressor, generator room,
etc. The control measures to be taken for reduction in noise levels are as below:
• The turbine will be installed in sound proof power house.
• The plant and equipment is specified and designed with a view to minimize noise pollution.
• The major noise producing equipment such as turbine is provided with acoustic enclosure.
• Sturdy foundation, vibration reduction pads/devices where ever compatible shall be used for all
the noise generating equipment is/ will be provided.
• Entry to such area shall be restricted
• Ear Plugs and Ear muffs is/ will be provided to the workers in Utility Section.
• Regular preventive maintenance of equipment’s is/ will be carried out to minimize the noise
generated by the equipment’s.
• Regular monitoring of noise levels at all areas is/ will be carried out.
• Greenbelt will be maintained.
For the proposed installation of 9.9 MW coal fired power plant turbine will be installed in sound proof
power house. Also there will no generation of noise from soot blowing.
2.6 STORAGE & TRANSPORTATION OF FUEL
There will be no increase in requirement of raw materials due to the proposed project as the project is
for amendment in EC conditions for existing polyester chips manufacturing plant for change in fuel for
9.9 MW captive power generation and there is no increase in polyester chips production capacity. There
will be requirement of fuel only. The details of storage and transportation of fuel are given below:
Table 2.18: Storage and transportation of fuel
Name
Source Means of storage (No. of containers & size)
Storage conditions
Expected Qty. to be stored
Means of transportation
Press. kg/m2
Temp (ºC)
Fuel
Furnace Oil BPCL/ HPCL 200 kl X 2 Nos
tanks.
Atm. Amb. 400 kl Road
HSD Petrol pump 20 kl X 1 no. Tank
Atm. Amb. 20 kl Road
Natural Gas GSPL
No storage. Transport by Pipeline
<1 Kg/cm2
NA 5250 T Pipeline
Imported Coal Adani Enterprise Ltd., Shri Hari Coal Corporation
Storage Yard Atm. Amb. 2000 T Road
Note: Atm. = Atmospheric, Amb. = Ambient, NA = Not applicable. (Source: JBF Industries Ltd - Sarigam)
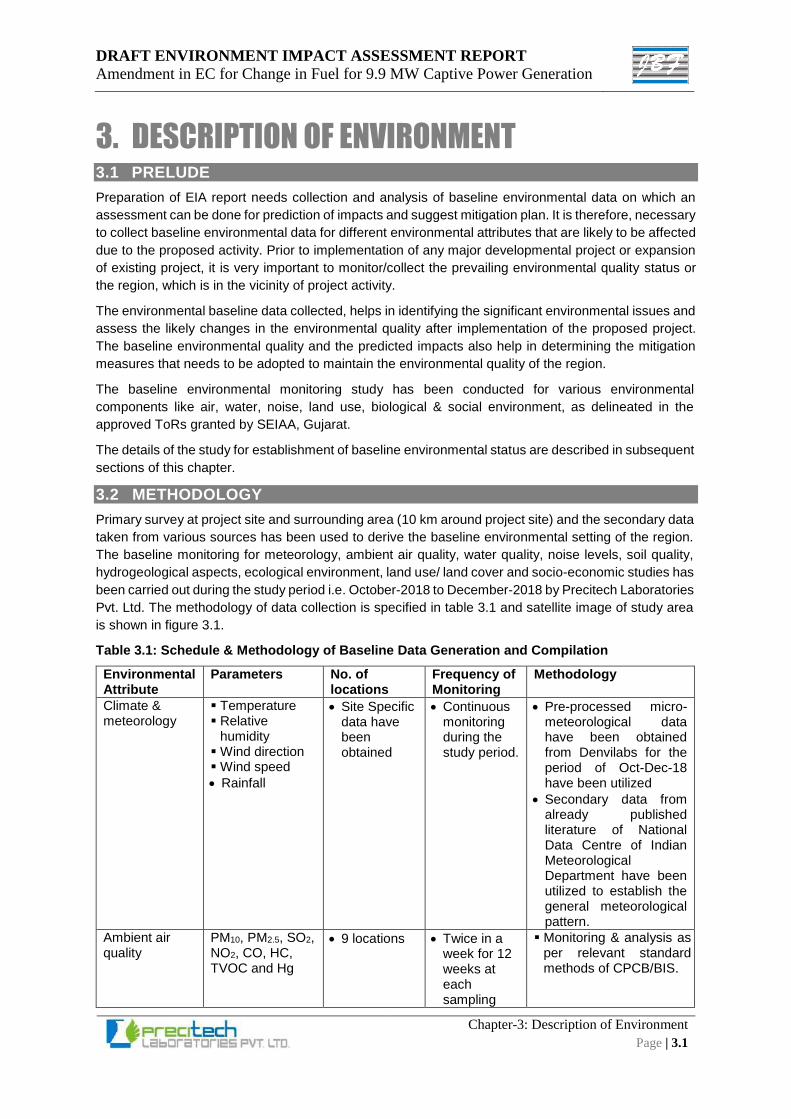
DRAFT ENVIRONMENT IMPACT ASSESSMENT REPORT
Amendment in EC for Change in Fuel for 9.9 MW Captive Power Generation
Chapter-3: Description of Environment
Page | 3.1
3. DESCRIPTION OF ENVIRONMENT 3.1 PRELUDE
Preparation of EIA report needs collection and analysis of baseline environmental data on which an
assessment can be done for prediction of impacts and suggest mitigation plan. It is therefore, necessary
to collect baseline environmental data for different environmental attributes that are likely to be affected
due to the proposed activity. Prior to implementation of any major developmental project or expansion
of existing project, it is very important to monitor/collect the prevailing environmental quality status or
the region, which is in the vicinity of project activity.
The environmental baseline data collected, helps in identifying the significant environmental issues and
assess the likely changes in the environmental quality after implementation of the proposed project.
The baseline environmental quality and the predicted impacts also help in determining the mitigation
measures that needs to be adopted to maintain the environmental quality of the region.
The baseline environmental monitoring study has been conducted for various environmental
components like air, water, noise, land use, biological & social environment, as delineated in the
approved ToRs granted by SEIAA, Gujarat.
The details of the study for establishment of baseline environmental status are described in subsequent
sections of this chapter.
3.2 METHODOLOGY
Primary survey at project site and surrounding area (10 km around project site) and the secondary data
taken from various sources has been used to derive the baseline environmental setting of the region.
The baseline monitoring for meteorology, ambient air quality, water quality, noise levels, soil quality,
hydrogeological aspects, ecological environment, land use/ land cover and socio-economic studies has
been carried out during the study period i.e. October-2018 to December-2018 by Precitech Laboratories
Pvt. Ltd. The methodology of data collection is specified in table 3.1 and satellite image of study area
is shown in figure 3.1.
Table 3.1: Schedule & Methodology of Baseline Data Generation and Compilation
Environmental Attribute
Parameters No. of locations
Frequency of Monitoring
Methodology
Climate & meteorology
Temperature Relative
humidity Wind direction Wind speed
Rainfall
Site Specific data have been obtained
Continuous monitoring during the study period.
Pre-processed micro-meteorological data have been obtained from Denvilabs for the period of Oct-Dec-18 have been utilized
Secondary data from already published literature of National Data Centre of Indian Meteorological Department have been utilized to establish the general meteorological pattern.
Ambient air quality
PM10, PM2.5, SO2, NO2, CO, HC, TVOC and Hg
9 locations Twice in a week for 12 weeks at each sampling
Monitoring & analysis as per relevant standard methods of CPCB/BIS.
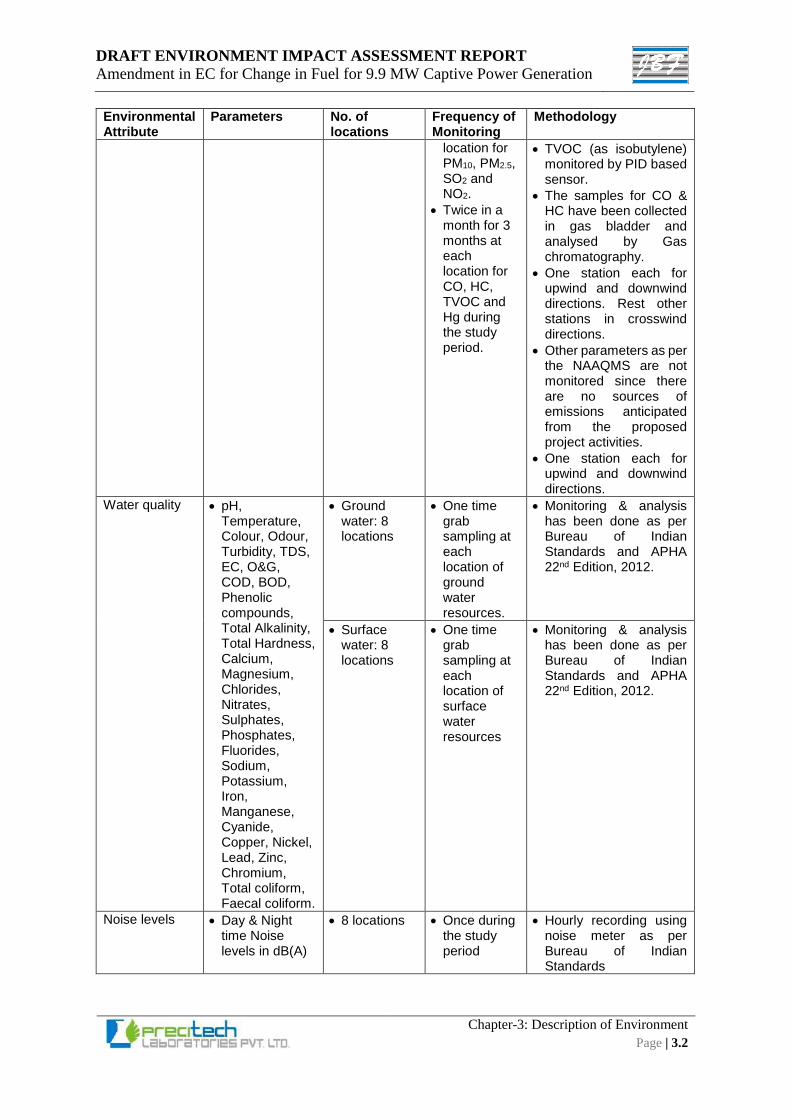
DRAFT ENVIRONMENT IMPACT ASSESSMENT REPORT
Amendment in EC for Change in Fuel for 9.9 MW Captive Power Generation
Chapter-3: Description of Environment
Page | 3.2
Environmental Attribute
Parameters No. of locations
Frequency of Monitoring
Methodology
location for PM10, PM2.5, SO2 and NO2.
Twice in a month for 3 months at each location for CO, HC, TVOC and Hg during the study period.
TVOC (as isobutylene) monitored by PID based sensor.
The samples for CO & HC have been collected in gas bladder and analysed by Gas chromatography.
One station each for upwind and downwind directions. Rest other stations in crosswind directions.
Other parameters as per the NAAQMS are not monitored since there are no sources of emissions anticipated from the proposed project activities.
One station each for upwind and downwind directions.
Water quality pH, Temperature, Colour, Odour, Turbidity, TDS, EC, O&G, COD, BOD, Phenolic compounds, Total Alkalinity, Total Hardness, Calcium, Magnesium, Chlorides, Nitrates, Sulphates, Phosphates, Fluorides, Sodium, Potassium, Iron, Manganese, Cyanide, Copper, Nickel, Lead, Zinc, Chromium, Total coliform, Faecal coliform.
Ground water: 8 locations
One time grab sampling at each location of ground water resources.
Monitoring & analysis has been done as per Bureau of Indian Standards and APHA 22nd Edition, 2012.
Surface water: 8 locations
One time grab sampling at each location of surface water resources
Monitoring & analysis has been done as per Bureau of Indian Standards and APHA 22nd Edition, 2012.
Noise levels Day & Night time Noise levels in dB(A)
8 locations Once during the study period
Hourly recording using noise meter as per Bureau of Indian Standards
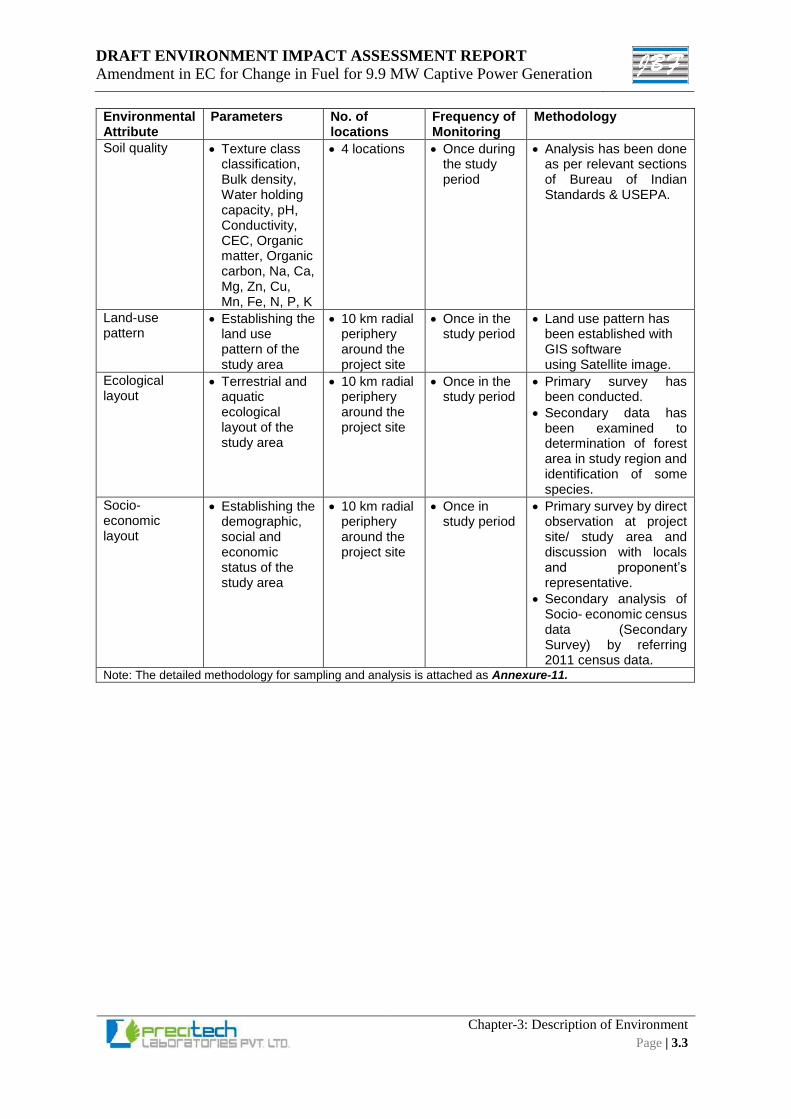
DRAFT ENVIRONMENT IMPACT ASSESSMENT REPORT
Amendment in EC for Change in Fuel for 9.9 MW Captive Power Generation
Chapter-3: Description of Environment
Page | 3.3
Environmental Attribute
Parameters No. of locations
Frequency of Monitoring
Methodology
Soil quality Texture class classification, Bulk density, Water holding capacity, pH, Conductivity, CEC, Organic matter, Organic carbon, Na, Ca, Mg, Zn, Cu, Mn, Fe, N, P, K
4 locations Once during the study period
Analysis has been done as per relevant sections of Bureau of Indian Standards & USEPA.
Land-use pattern
Establishing the land use pattern of the study area
10 km radial periphery around the project site
Once in the study period
Land use pattern has been established with GIS software using Satellite image.
Ecological layout
Terrestrial and aquatic ecological layout of the study area
10 km radial periphery around the project site
Once in the study period
Primary survey has been conducted.
Secondary data has been examined to determination of forest area in study region and identification of some species.
Socio-economic layout
Establishing the demographic, social and economic status of the study area
10 km radial periphery around the project site
Once in study period
Primary survey by direct observation at project site/ study area and discussion with locals and proponent’s representative.
Secondary analysis of Socio- economic census data (Secondary Survey) by referring 2011 census data.
Note: The detailed methodology for sampling and analysis is attached as Annexure-11.
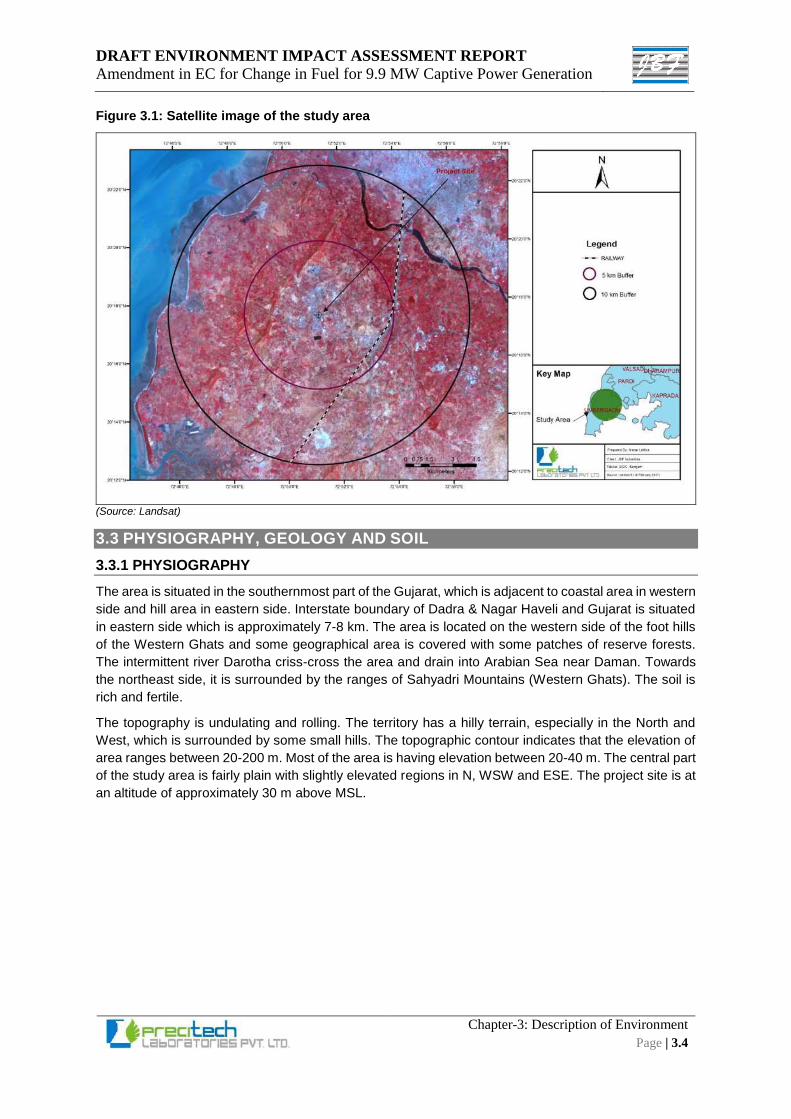
DRAFT ENVIRONMENT IMPACT ASSESSMENT REPORT
Amendment in EC for Change in Fuel for 9.9 MW Captive Power Generation
Chapter-3: Description of Environment
Page | 3.4
Figure 3.1: Satellite image of the study area
(Source: Landsat)
3.3 PHYSIOGRAPHY, GEOLOGY AND SOIL
3.3.1 PHYSIOGRAPHY
The area is situated in the southernmost part of the Gujarat, which is adjacent to coastal area in western
side and hill area in eastern side. Interstate boundary of Dadra & Nagar Haveli and Gujarat is situated
in eastern side which is approximately 7-8 km. The area is located on the western side of the foot hills
of the Western Ghats and some geographical area is covered with some patches of reserve forests.
The intermittent river Darotha criss-cross the area and drain into Arabian Sea near Daman. Towards
the northeast side, it is surrounded by the ranges of Sahyadri Mountains (Western Ghats). The soil is
rich and fertile.
The topography is undulating and rolling. The territory has a hilly terrain, especially in the North and
West, which is surrounded by some small hills. The topographic contour indicates that the elevation of
area ranges between 20-200 m. Most of the area is having elevation between 20-40 m. The central part
of the study area is fairly plain with slightly elevated regions in N, WSW and ESE. The project site is at
an altitude of approximately 30 m above MSL.
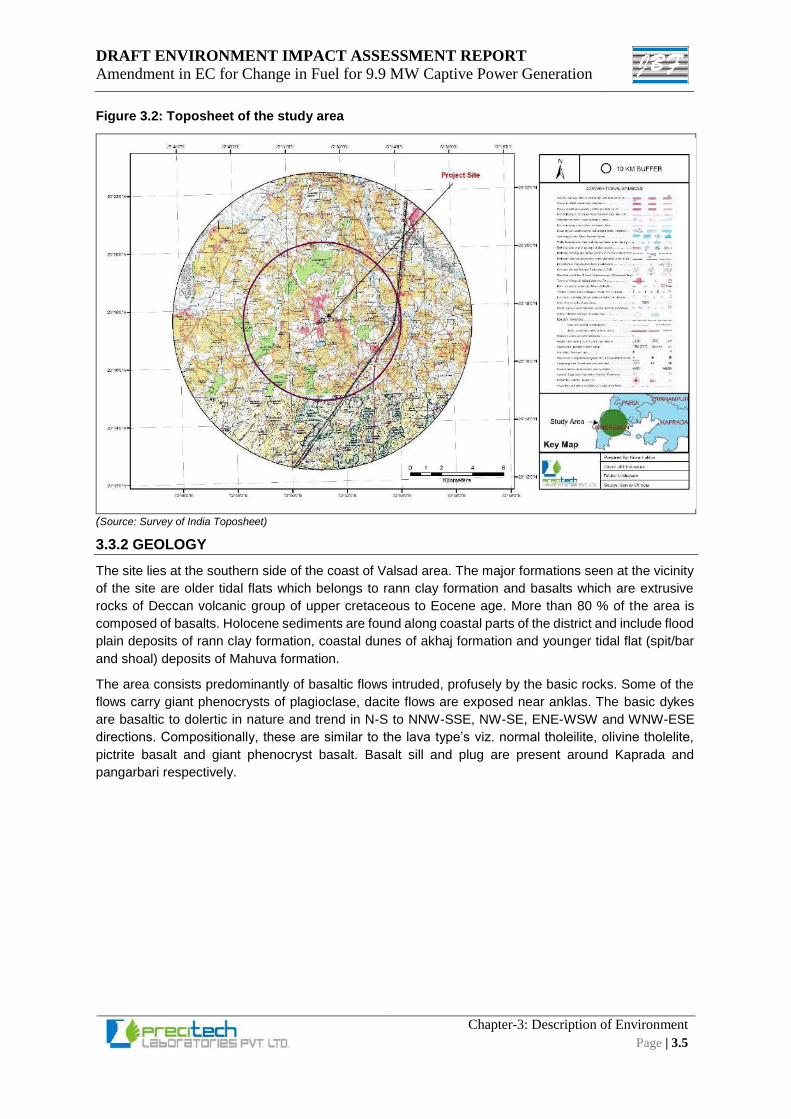
DRAFT ENVIRONMENT IMPACT ASSESSMENT REPORT
Amendment in EC for Change in Fuel for 9.9 MW Captive Power Generation
Chapter-3: Description of Environment
Page | 3.5
Figure 3.2: Toposheet of the study area
(Source: Survey of India Toposheet)
3.3.2 GEOLOGY
The site lies at the southern side of the coast of Valsad area. The major formations seen at the vicinity
of the site are older tidal flats which belongs to rann clay formation and basalts which are extrusive
rocks of Deccan volcanic group of upper cretaceous to Eocene age. More than 80 % of the area is
composed of basalts. Holocene sediments are found along coastal parts of the district and include flood
plain deposits of rann clay formation, coastal dunes of akhaj formation and younger tidal flat (spit/bar
and shoal) deposits of Mahuva formation.
The area consists predominantly of basaltic flows intruded, profusely by the basic rocks. Some of the
flows carry giant phenocrysts of plagioclase, dacite flows are exposed near anklas. The basic dykes
are basaltic to dolertic in nature and trend in N-S to NNW-SSE, NW-SE, ENE-WSW and WNW-ESE
directions. Compositionally, these are similar to the lava type’s viz. normal tholeilite, olivine tholelite,
pictrite basalt and giant phenocryst basalt. Basalt sill and plug are present around Kaprada and
pangarbari respectively.
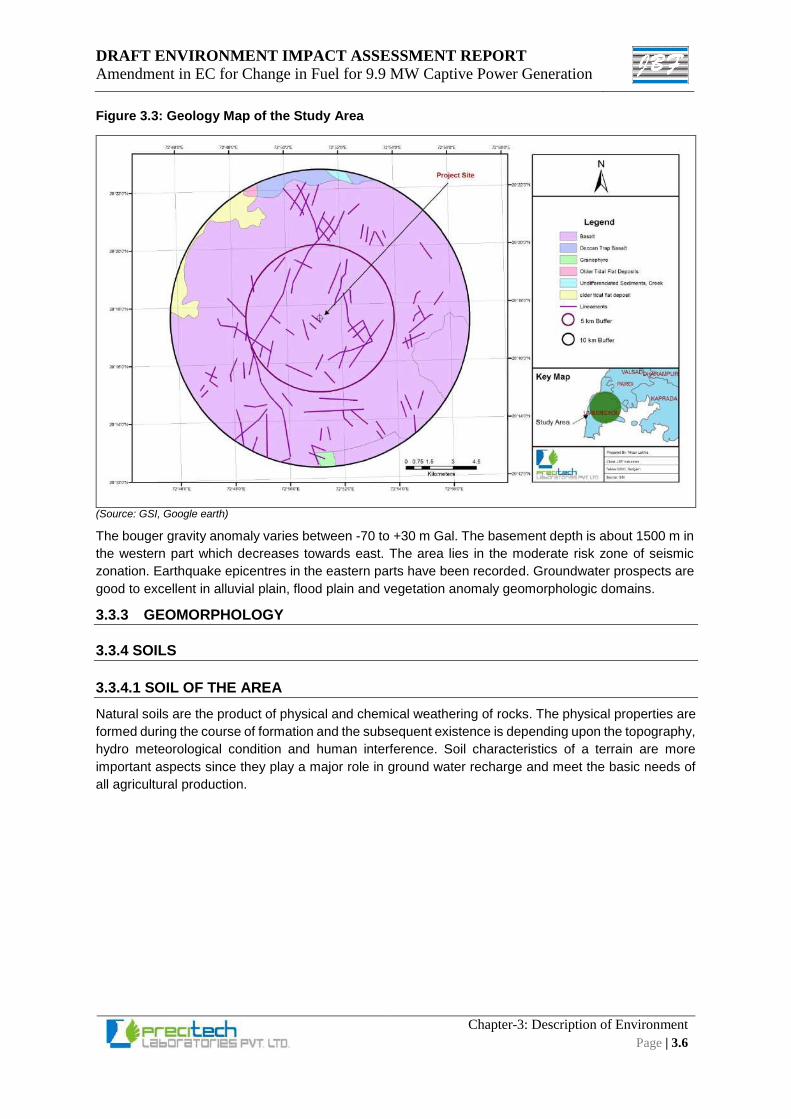
DRAFT ENVIRONMENT IMPACT ASSESSMENT REPORT
Amendment in EC for Change in Fuel for 9.9 MW Captive Power Generation
Chapter-3: Description of Environment
Page | 3.6
Figure 3.3: Geology Map of the Study Area
(Source: GSI, Google earth)
The bouger gravity anomaly varies between -70 to +30 m Gal. The basement depth is about 1500 m in
the western part which decreases towards east. The area lies in the moderate risk zone of seismic
zonation. Earthquake epicentres in the eastern parts have been recorded. Groundwater prospects are
good to excellent in alluvial plain, flood plain and vegetation anomaly geomorphologic domains.
3.3.3 GEOMORPHOLOGY
3.3.4 SOILS
3.3.4.1 SOIL OF THE AREA
Natural soils are the product of physical and chemical weathering of rocks. The physical properties are
formed during the course of formation and the subsequent existence is depending upon the topography,
hydro meteorological condition and human interference. Soil characteristics of a terrain are more
important aspects since they play a major role in ground water recharge and meet the basic needs of
all agricultural production.
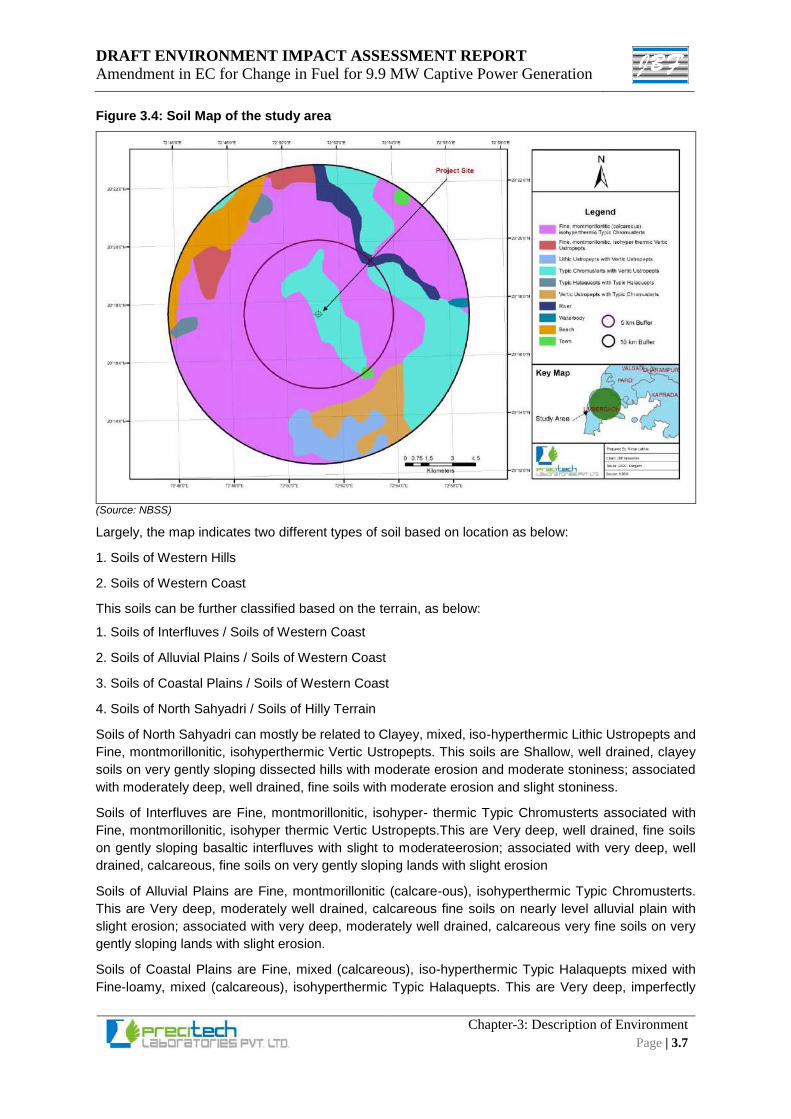
DRAFT ENVIRONMENT IMPACT ASSESSMENT REPORT
Amendment in EC for Change in Fuel for 9.9 MW Captive Power Generation
Chapter-3: Description of Environment
Page | 3.7
Figure 3.4: Soil Map of the study area
(Source: NBSS)
Largely, the map indicates two different types of soil based on location as below:
1. Soils of Western Hills
2. Soils of Western Coast
This soils can be further classified based on the terrain, as below:
1. Soils of Interfluves / Soils of Western Coast
2. Soils of Alluvial Plains / Soils of Western Coast
3. Soils of Coastal Plains / Soils of Western Coast
4. Soils of North Sahyadri / Soils of Hilly Terrain
Soils of North Sahyadri can mostly be related to Clayey, mixed, iso-hyperthermic Lithic Ustropepts and
Fine, montmorillonitic, isohyperthermic Vertic Ustropepts. This soils are Shallow, well drained, clayey
soils on very gently sloping dissected hills with moderate erosion and moderate stoniness; associated
with moderately deep, well drained, fine soils with moderate erosion and slight stoniness.
Soils of Interfluves are Fine, montmorillonitic, isohyper- thermic Typic Chromusterts associated with
Fine, montmorillonitic, isohyper thermic Vertic Ustropepts.This are Very deep, well drained, fine soils
on gently sloping basaltic interfluves with slight to moderateerosion; associated with very deep, well
drained, calcareous, fine soils on very gently sloping lands with slight erosion
Soils of Alluvial Plains are Fine, montmorillonitic (calcare-ous), isohyperthermic Typic Chromusterts.
This are Very deep, moderately well drained, calcareous fine soils on nearly level alluvial plain with
slight erosion; associated with very deep, moderately well drained, calcareous very fine soils on very
gently sloping lands with slight erosion.
Soils of Coastal Plains are Fine, mixed (calcareous), iso-hyperthermic Typic Halaquepts mixed with
Fine-loamy, mixed (calcareous), isohyperthermic Typic Halaquepts. This are Very deep, imperfectly
DRAFT ENVIRONMENT IMPACT ASSESSMENT REPORT
Amendment in EC for Change in Fuel for 9.9 MW Captive Power Generation
Chapter-3: Description of Environment
Page | 3.8
drained, calcareous fine soils on very gently sloping coastal plain with slight erosion and strong salinity;
associated with deep imperfectly drained, fine loamy soils with slight erosion and strong salinity.
About 60 per cent of the Umbergaon Taluka is covered by Ustropepts, of which Calcareous Typic
Ustropepts soil is predominant which is also seen in the highlands. This soil type is also present in Pardi
taluka. Typic Chromusterts with small amount of Vertic Ustropepts are the other soil types found in
Umbergaon taluka along with Dadra and Nagar Haveli. Talasari Taluka is largely covered by Lithic
Ustropepts mixed with little amount of Vertic Ustropepts.
3.3.4.2 METHODOLOGY
Physico-chemical parameters have been analysed to ascertain the baseline status of soil in the study
area. Four (4) nos. of soil samples were collected from selected locations during the study period and
analysed.
3.3.4.3 RESULTS
The soil sampling locations are provided in below Table 3.2. The results of the soil sample analysis are
given in table 3.3.
Table 3.2: Soil sampling locations
Stn. Code Location Approx. aerial distance & direction from the site (km)
SS1 Daheli ≈ 4.3 km (S)
SS2 Punat ≈ 3.2 km (N)
SS3 Maroli ≈ 3.4 km (W)
SS4 Bhilad ≈ 3.9 km (E)
(Source: Precitech Laboratories Pvt. Ltd. & Google earth)
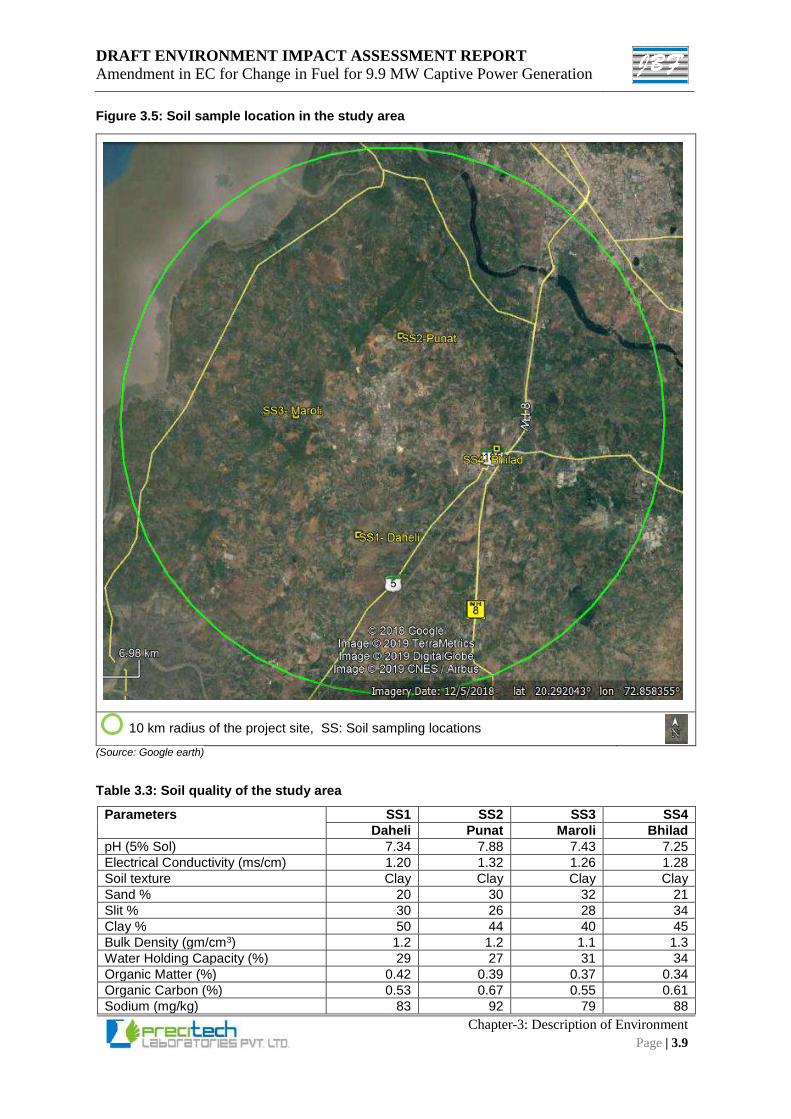
DRAFT ENVIRONMENT IMPACT ASSESSMENT REPORT
Amendment in EC for Change in Fuel for 9.9 MW Captive Power Generation
Chapter-3: Description of Environment
Page | 3.9
Figure 3.5: Soil sample location in the study area
10 km radius of the project site, SS: Soil sampling locations
(Source: Google earth)
Table 3.3: Soil quality of the study area
Parameters SS1 SS2 SS3 SS4
Daheli Punat Maroli Bhilad
pH (5% Sol) 7.34 7.88 7.43 7.25
Electrical Conductivity (ms/cm) 1.20 1.32 1.26 1.28
Soil texture Clay Clay Clay Clay
Sand % 20 30 32 21
Slit % 30 26 28 34
Clay % 50 44 40 45
Bulk Density (gm/cm3) 1.2 1.2 1.1 1.3
Water Holding Capacity (%) 29 27 31 34
Organic Matter (%) 0.42 0.39 0.37 0.34
Organic Carbon (%) 0.53 0.67 0.55 0.61
Sodium (mg/kg) 83 92 79 88
F
i
g
u
r
e
3
.
6
:
S
o
i
l
s
a
m
p
l
e
DRAFT ENVIRONMENT IMPACT ASSESSMENT REPORT
Amendment in EC for Change in Fuel for 9.9 MW Captive Power Generation
Chapter-3: Description of Environment
Page | 3.10
Parameters SS1 SS2 SS3 SS4
Daheli Punat Maroli Bhilad
Zinc (mg/kg) <5 <5 <5 <5
Copper (mg/kg) <5 <5 <5 <5
Manganese (mg/kg) 14 9 18 8
Iron (As Fe) (mg/kg) 11 15 9 14
Nitrogen as N (mg/kg) 128 130 127 129
Phosphorus as P (mg/kg) 28 26 22 24
Potassium as K (mg/kg) 103 90 91 99
Nitrogen as N (kg/ha) 230.4 234 209.55 251.55
Phosphorus as P (kg/ha) 50.4 46.8 36.3 46.8
Potassium as K (kg/ha) 185.4 162 150.15 193.05 (Source: Primary sampling carried out by Precitech Laboratories Pvt. Ltd. October’18 to December’18)
3.3.4.4 OBSERVATIONS FROM SOIL ANALYSIS
The following observation are made based on the comparison of test results of soil samples with
standard soil classification of Hand Book of Agriculture, Indian Council of Agricultural Research, New
Delhi.
The pH of soil was found to be varying in the range of 7.25 to 7.88 which indicates that pH of soil in
the area are “Normal”
Organic Carbon content ranged was found in the range 0.53 to 0.67 which indicates that organic
carbon in soil were “Medium” in range.
Total Nitrogen was found in the range of 209.55 kg/ha to 251.55 kg/ha which indicates that nitrogen
content of soil in the study area is “better” in range.
Total Phosphorous content was found in the range 36.3 kg/ha to 50.4 kg/ha which indicates that
phosphorus content of soil in the study area is “low” to “medium” in range.
Potassium content ranged was found in the range 150.15 kg/ha to 193.05kg/ha which indicates that
potash content of soil in the study area is “medium”.in range.
Based on the above analysis, it can be concluded that the soil in the study area is suitable for
agricultural purposes, however the soil needs to be enriched with some potassium & phosphorous
enriched fertilizers to upgrade its quality.
3.4 GEOHYDROLOGY AND WATER RESOURCES
3.4.1 GEOHYDROLOGY
Different types of drainage and stream order are very important for understanding the infiltration and
runoff of the water, especially in Perennial River like Damanganga observed near proposed area. These
different types of drainage pattern mainly depend on the local geography, geology, structures and
tectonics and also it depends on the slope of the area. The perennial river Damanganga is flowing in
the northern part of study area. The area is under the influence of the river Damanganga being the main
recharging source & controlling the drainage pattern. The study area lies neat the basin of this river.
Overall the drainage pattern of the area is dendritic. The Geohydrological investigation work carried out
in & around the study area reveals that the area is covered with thick layer of alluvial. These alluvial
deposits formed by river Damanganga are composed of argillaceous & arenaceous material in the form
of alternate bands of sand & clay. These aquifers are Silt in texture with grain size of fine to medium
grained. The site falls in a safe zone according to CGWB report 2013
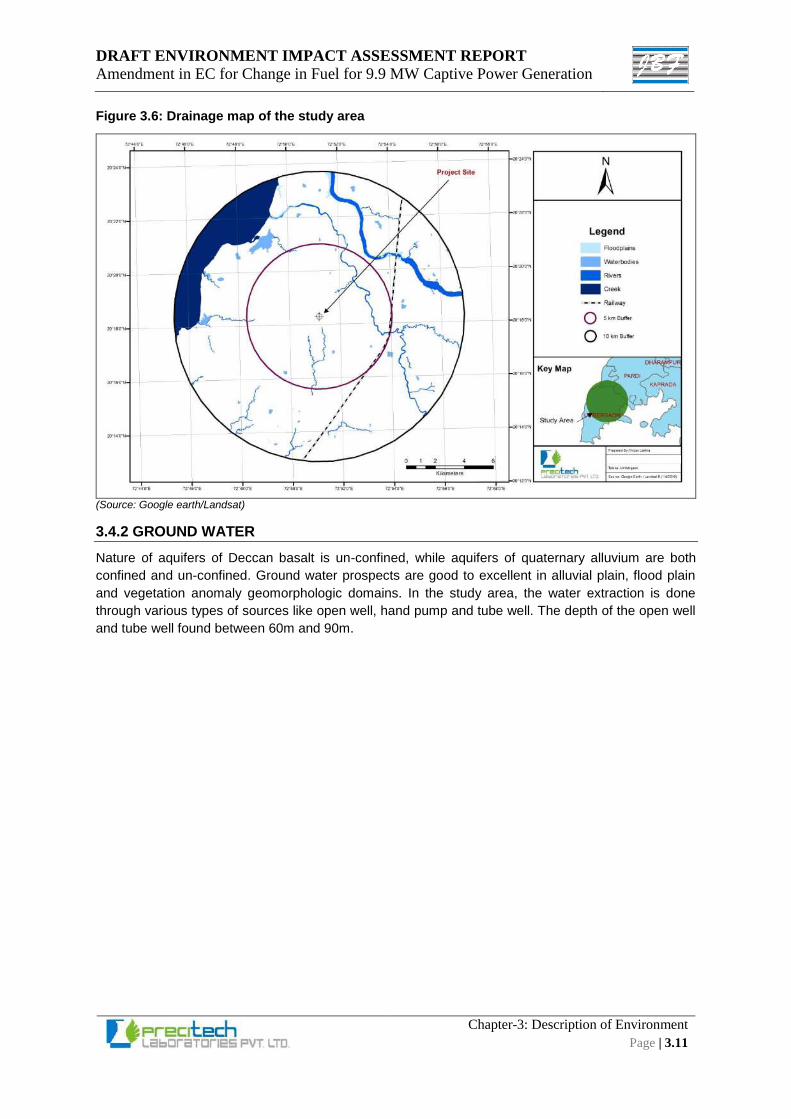
DRAFT ENVIRONMENT IMPACT ASSESSMENT REPORT
Amendment in EC for Change in Fuel for 9.9 MW Captive Power Generation
Chapter-3: Description of Environment
Page | 3.11
Figure 3.6: Drainage map of the study area
(Source: Google earth/Landsat)
3.4.2 GROUND WATER
Nature of aquifers of Deccan basalt is un-confined, while aquifers of quaternary alluvium are both
confined and un-confined. Ground water prospects are good to excellent in alluvial plain, flood plain
and vegetation anomaly geomorphologic domains. In the study area, the water extraction is done
through various types of sources like open well, hand pump and tube well. The depth of the open well
and tube well found between 60m and 90m.
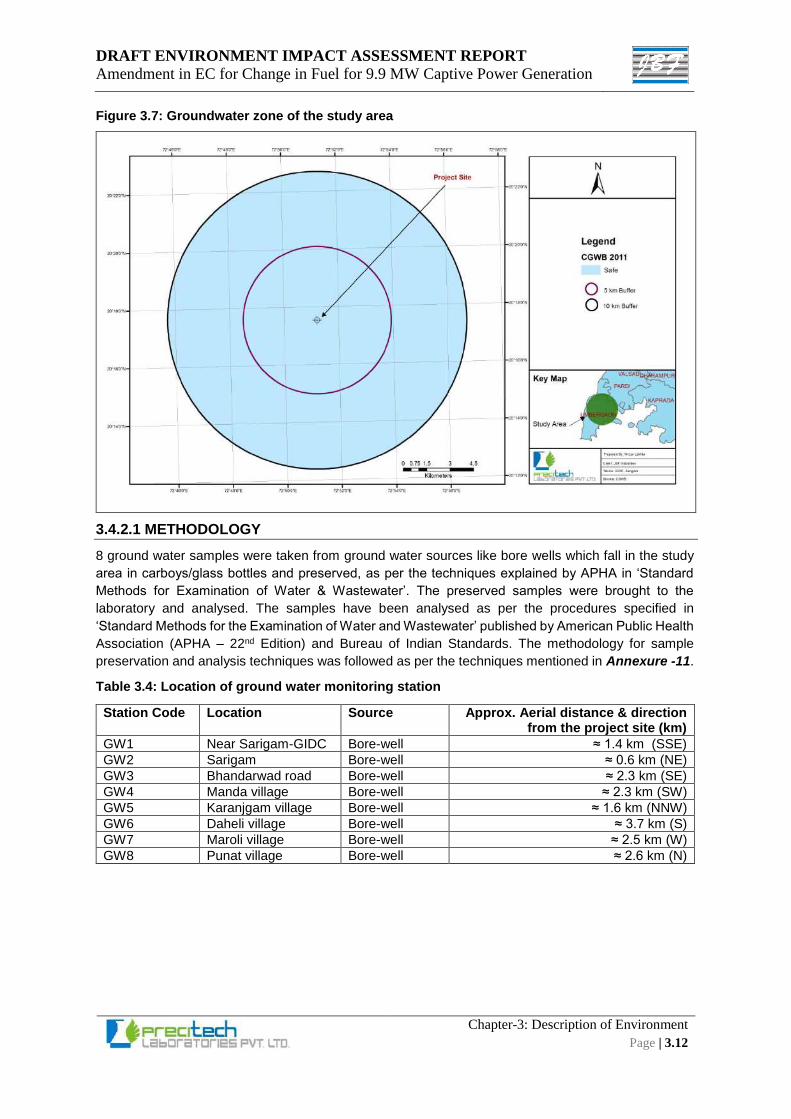
DRAFT ENVIRONMENT IMPACT ASSESSMENT REPORT
Amendment in EC for Change in Fuel for 9.9 MW Captive Power Generation
Chapter-3: Description of Environment
Page | 3.12
Figure 3.7: Groundwater zone of the study area
3.4.2.1 METHODOLOGY
8 ground water samples were taken from ground water sources like bore wells which fall in the study
area in carboys/glass bottles and preserved, as per the techniques explained by APHA in ‘Standard
Methods for Examination of Water & Wastewater’. The preserved samples were brought to the
laboratory and analysed. The samples have been analysed as per the procedures specified in
‘Standard Methods for the Examination of Water and Wastewater’ published by American Public Health
Association (APHA – 22nd Edition) and Bureau of Indian Standards. The methodology for sample
preservation and analysis techniques was followed as per the techniques mentioned in Annexure -11.
Table 3.4: Location of ground water monitoring station
Station Code Location Source Approx. Aerial distance & direction from the project site (km)
GW1 Near Sarigam-GIDC Bore-well ≈ 1.4 km (SSE)
GW2 Sarigam Bore-well ≈ 0.6 km (NE)
GW3 Bhandarwad road Bore-well ≈ 2.3 km (SE)
GW4 Manda village Bore-well ≈ 2.3 km (SW)
GW5 Karanjgam village Bore-well ≈ 1.6 km (NNW)
GW6 Daheli village Bore-well ≈ 3.7 km (S)
GW7 Maroli village Bore-well ≈ 2.5 km (W)
GW8 Punat village Bore-well ≈ 2.6 km (N)
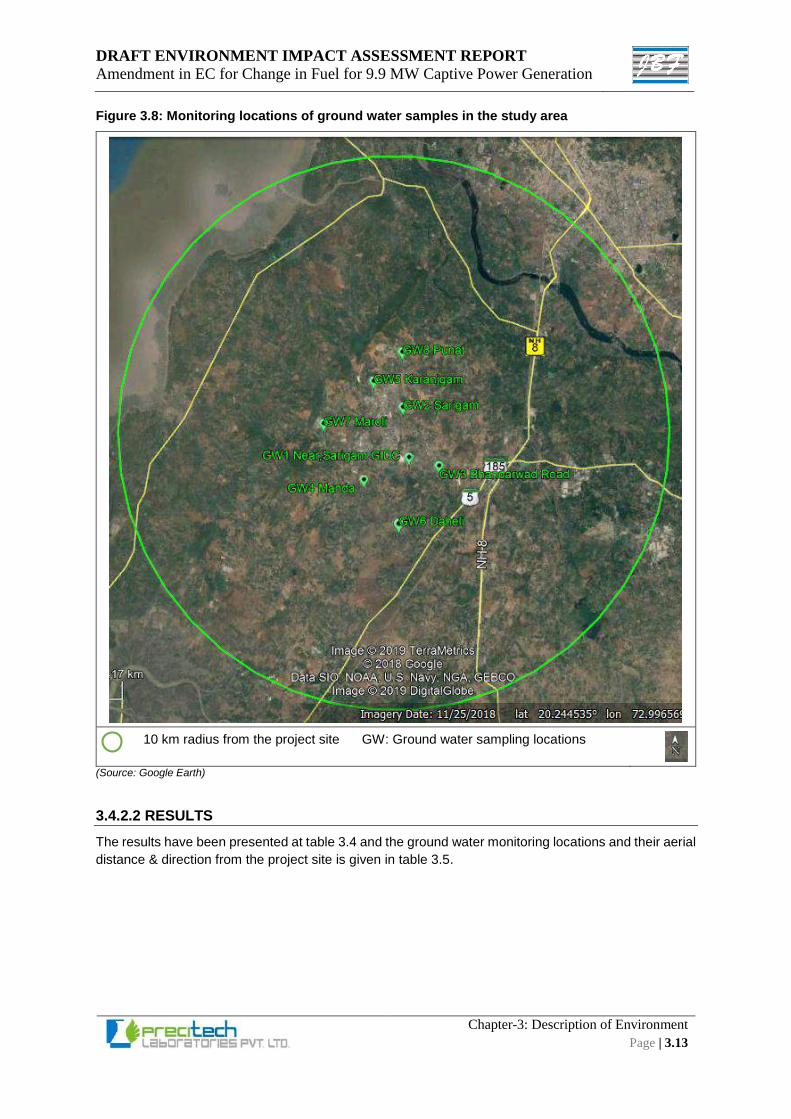
DRAFT ENVIRONMENT IMPACT ASSESSMENT REPORT
Amendment in EC for Change in Fuel for 9.9 MW Captive Power Generation
Chapter-3: Description of Environment
Page | 3.13
Figure 3.8: Monitoring locations of ground water samples in the study area
10 km radius from the project site GW: Ground water sampling locations
(Source: Google Earth)
3.4.2.2 RESULTS
The results have been presented at table 3.4 and the ground water monitoring locations and their aerial
distance & direction from the project site is given in table 3.5.
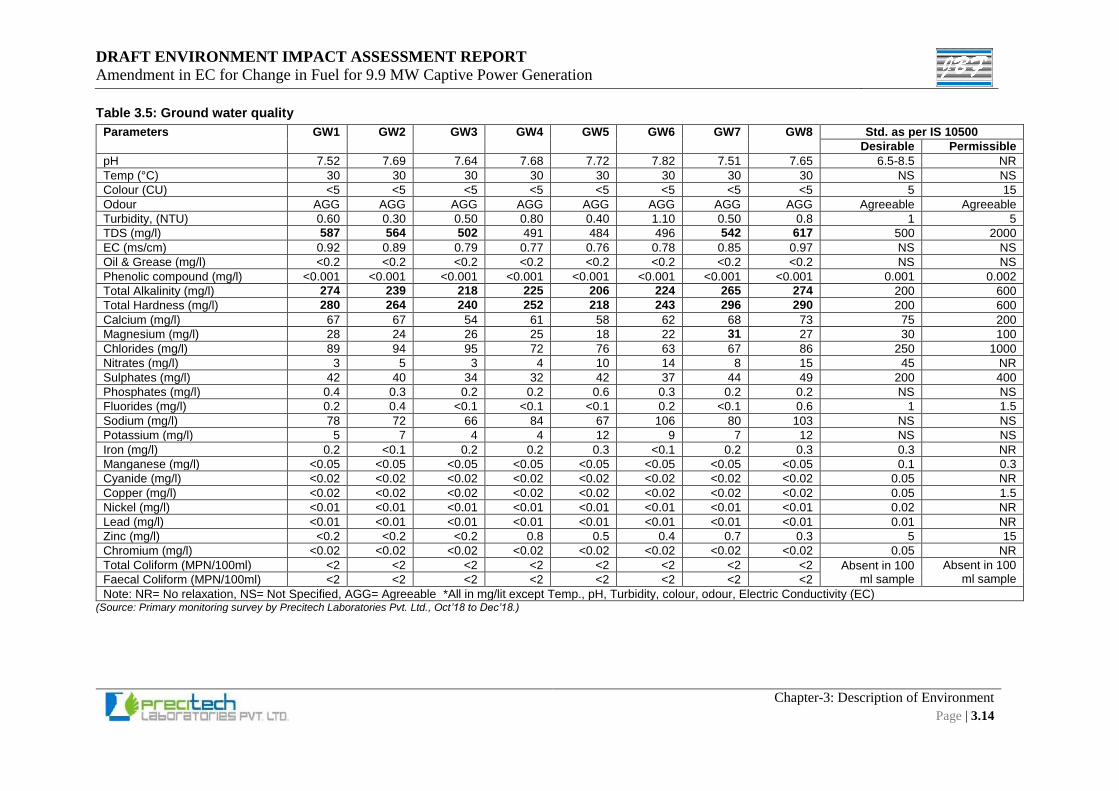
DRAFT ENVIRONMENT IMPACT ASSESSMENT REPORT
Amendment in EC for Change in Fuel for 9.9 MW Captive Power Generation
Chapter-3: Description of Environment
Page | 3.14
Table 3.5: Ground water quality
Parameters GW1 GW2 GW3 GW4 GW5 GW6 GW7 GW8 Std. as per IS 10500
Desirable Permissible
pH 7.52 7.69 7.64 7.68 7.72 7.82 7.51 7.65 6.5-8.5 NR
Temp (°C) 30 30 30 30 30 30 30 30 NS NS
Colour (CU) <5 <5 <5 <5 <5 <5 <5 <5 5 15
Odour AGG AGG AGG AGG AGG AGG AGG AGG Agreeable Agreeable
Turbidity, (NTU) 0.60 0.30 0.50 0.80 0.40 1.10 0.50 0.8 1 5
TDS (mg/l) 587 564 502 491 484 496 542 617 500 2000
EC (ms/cm) 0.92 0.89 0.79 0.77 0.76 0.78 0.85 0.97 NS NS
Oil & Grease (mg/l) <0.2 <0.2 <0.2 <0.2 <0.2 <0.2 <0.2 <0.2 NS NS
Phenolic compound (mg/l) <0.001 <0.001 <0.001 <0.001 <0.001 <0.001 <0.001 <0.001 0.001 0.002
Total Alkalinity (mg/l) 274 239 218 225 206 224 265 274 200 600
Total Hardness (mg/l) 280 264 240 252 218 243 296 290 200 600
Calcium (mg/l) 67 67 54 61 58 62 68 73 75 200
Magnesium (mg/l) 28 24 26 25 18 22 31 27 30 100
Chlorides (mg/l) 89 94 95 72 76 63 67 86 250 1000
Nitrates (mg/l) 3 5 3 4 10 14 8 15 45 NR
Sulphates (mg/l) 42 40 34 32 42 37 44 49 200 400
Phosphates (mg/l) 0.4 0.3 0.2 0.2 0.6 0.3 0.2 0.2 NS NS
Fluorides (mg/l) 0.2 0.4 <0.1 <0.1 <0.1 0.2 <0.1 0.6 1 1.5
Sodium (mg/l) 78 72 66 84 67 106 80 103 NS NS
Potassium (mg/l) 5 7 4 4 12 9 7 12 NS NS
Iron (mg/l) 0.2 <0.1 0.2 0.2 0.3 <0.1 0.2 0.3 0.3 NR
Manganese (mg/l) <0.05 <0.05 <0.05 <0.05 <0.05 <0.05 <0.05 <0.05 0.1 0.3
Cyanide (mg/l) <0.02 <0.02 <0.02 <0.02 <0.02 <0.02 <0.02 <0.02 0.05 NR
Copper (mg/l) <0.02 <0.02 <0.02 <0.02 <0.02 <0.02 <0.02 <0.02 0.05 1.5
Nickel (mg/l) <0.01 <0.01 <0.01 <0.01 <0.01 <0.01 <0.01 <0.01 0.02 NR
Lead (mg/l) <0.01 <0.01 <0.01 <0.01 <0.01 <0.01 <0.01 <0.01 0.01 NR
Zinc (mg/l) <0.2 <0.2 <0.2 0.8 0.5 0.4 0.7 0.3 5 15
Chromium (mg/l) <0.02 <0.02 <0.02 <0.02 <0.02 <0.02 <0.02 <0.02 0.05 NR
Total Coliform (MPN/100ml) <2 <2 <2 <2 <2 <2 <2 <2 Absent in 100 ml sample
Absent in 100 ml sample Faecal Coliform (MPN/100ml) <2 <2 <2 <2 <2 <2 <2 <2
Note: NR= No relaxation, NS= Not Specified, AGG= Agreeable *All in mg/lit except Temp., pH, Turbidity, colour, odour, Electric Conductivity (EC) (Source: Primary monitoring survey by Precitech Laboratories Pvt. Ltd., Oct’18 to Dec’18.)
DRAFT ENVIRONMENT IMPACT ASSESSMENT REPORT
Amendment in EC for Change in Fuel for 9.9 MW Captive Power Generation
Chapter-3: Description of Environment
Page| 3.15
3.4.2.3 OBSERVATIONS FROM GROUND WATER ANALYSIS
The following observation is based on the analysis of the samples:
pH of the samples has been found ranging from 7.51 to 7.82.
From the above results, it can be observed that in the majority of the study area, TDS level, total
hardness, and total alkalinity are above the desirable limits. However, the levels are well within the
permissible limits as per IS: 10500:2012 Drinking Water Standards. Maroli village sample
magnesium is slight higher than the desirable limits. Other parameters has been found within the
desirable limits.
Also the Total Coliform and Faecal Coliform in all the ground water samples have been found to
be absent.
3.4.3 SURFACE WATER
Darotha River passes through the study region before discharging in the Arabian Sea. It is a seasonal
river but swells during the monsoon period. After the construction of Madhuban Dam on Damanganga
River, flow of the river is controlled and that has helped in increasing the irrigation potential of the
Region. Surface water is also supplied for industrial and domestic purposes in the region from the
Damanganga Canal Distributary, in some villages of the study area open ponds are exists, which helps
to harvests rain water during monsoon season.
3.4.3.1 METHODOLOGY
8 surface water samples have been taken from river falling in the study area in carboys/ glass bottles
and preserved, as per the techniques explained by APHA in ‘Standard Methods for Examination of
Water & Wastewater’. The preserved samples were brought to the laboratory and analysed. The
samples have been analysed as per the procedures specified in ‘Standard Methods for the Examination
of Water and Wastewater’ published by American Public Health Association (APHA – 21st Edition) and
Bureau of Indian Standards. The methodology for analysis techniques was followed as per the
techniques mentioned in Annexure-11.
Table 3.6: Location of surface water monitoring station
Station Code
Location Approx. Aerial distance & direction from the project site (km)
SW1 Damanganga Canal ≈ 1.3 km (N)
SW2 Darotha River ≈ 4.6 km (NNE)
SW3 Karanjgam Pond ≈ 2.2 km (WNW)
SW4 Manda Pond ≈ 3.45 km (SW)
SW5 Sarigam Pond ≈ 1.40 km (SE)
SW6 Damanganga river near NH. 8 ≈ 8.0 km (NE)
SW7 Damanganga river near Zari causeway ≈ 9.5 km (N)
SW8 Valvada pond ≈ 4.7 km (E)
(Source: Precitech Laboratories Pvt. Ltd. & Google earth)
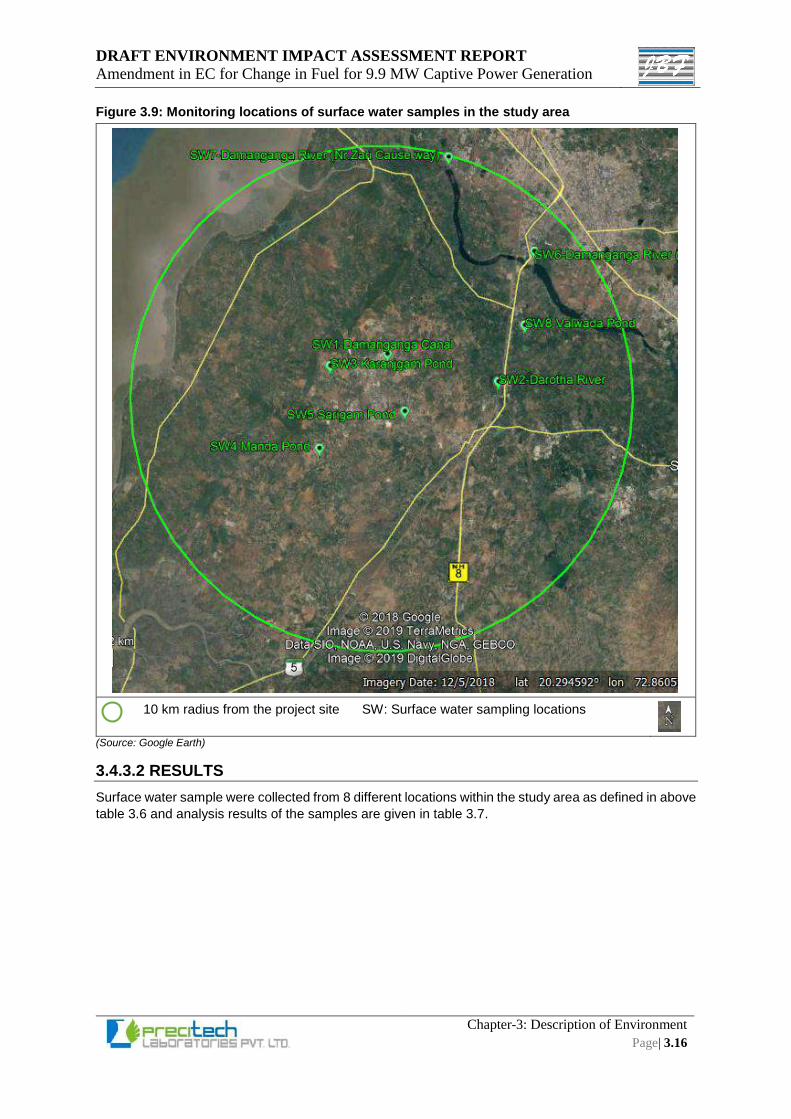
DRAFT ENVIRONMENT IMPACT ASSESSMENT REPORT
Amendment in EC for Change in Fuel for 9.9 MW Captive Power Generation
Chapter-3: Description of Environment
Page| 3.16
Figure 3.9: Monitoring locations of surface water samples in the study area
10 km radius from the project site SW: Surface water sampling locations
(Source: Google Earth)
3.4.3.2 RESULTS
Surface water sample were collected from 8 different locations within the study area as defined in above
table 3.6 and analysis results of the samples are given in table 3.7.
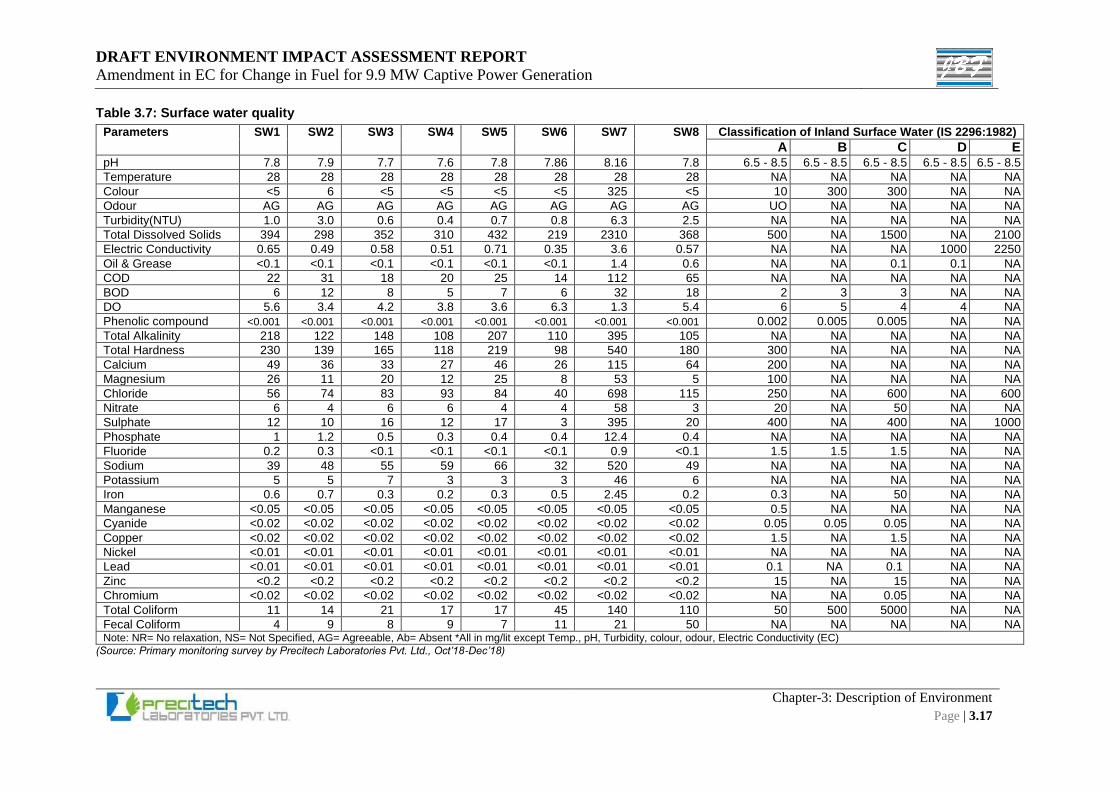
DRAFT ENVIRONMENT IMPACT ASSESSMENT REPORT
Amendment in EC for Change in Fuel for 9.9 MW Captive Power Generation
Chapter-3: Description of Environment
Page | 3.17
Table 3.7: Surface water quality
Parameters SW1 SW2 SW3 SW4 SW5 SW6 SW7 SW8 Classification of Inland Surface Water (IS 2296:1982)
A B C D E pH 7.8 7.9 7.7 7.6 7.8 7.86 8.16 7.8 6.5 - 8.5 6.5 - 8.5 6.5 - 8.5 6.5 - 8.5 6.5 - 8.5
Temperature 28 28 28 28 28 28 28 28 NA NA NA NA NA
Colour <5 6 <5 <5 <5 <5 325 <5 10 300 300 NA NA
Odour AG AG AG AG AG AG AG AG UO NA NA NA NA
Turbidity(NTU) 1.0 3.0 0.6 0.4 0.7 0.8 6.3 2.5 NA NA NA NA NA
Total Dissolved Solids 394 298 352 310 432 219 2310 368 500 NA 1500 NA 2100
Electric Conductivity 0.65 0.49 0.58 0.51 0.71 0.35 3.6 0.57 NA NA NA 1000 2250
Oil & Grease <0.1 <0.1 <0.1 <0.1 <0.1 <0.1 1.4 0.6 NA NA 0.1 0.1 NA
COD 22 31 18 20 25 14 112 65 NA NA NA NA NA
BOD 6 12 8 5 7 6 32 18 2 3 3 NA NA
DO 5.6 3.4 4.2 3.8 3.6 6.3 1.3 5.4 6 5 4 4 NA
Phenolic compound <0.001 <0.001 <0.001 <0.001 <0.001 <0.001 <0.001 <0.001 0.002 0.005 0.005 NA NA
Total Alkalinity 218 122 148 108 207 110 395 105 NA NA NA NA NA
Total Hardness 230 139 165 118 219 98 540 180 300 NA NA NA NA
Calcium 49 36 33 27 46 26 115 64 200 NA NA NA NA
Magnesium 26 11 20 12 25 8 53 5 100 NA NA NA NA
Chloride 56 74 83 93 84 40 698 115 250 NA 600 NA 600
Nitrate 6 4 6 6 4 4 58 3 20 NA 50 NA NA
Sulphate 12 10 16 12 17 3 395 20 400 NA 400 NA 1000
Phosphate 1 1.2 0.5 0.3 0.4 0.4 12.4 0.4 NA NA NA NA NA
Fluoride 0.2 0.3 <0.1 <0.1 <0.1 <0.1 0.9 <0.1 1.5 1.5 1.5 NA NA
Sodium 39 48 55 59 66 32 520 49 NA NA NA NA NA
Potassium 5 5 7 3 3 3 46 6 NA NA NA NA NA
Iron 0.6 0.7 0.3 0.2 0.3 0.5 2.45 0.2 0.3 NA 50 NA NA
Manganese <0.05 <0.05 <0.05 <0.05 <0.05 <0.05 <0.05 <0.05 0.5 NA NA NA NA
Cyanide <0.02 <0.02 <0.02 <0.02 <0.02 <0.02 <0.02 <0.02 0.05 0.05 0.05 NA NA
Copper <0.02 <0.02 <0.02 <0.02 <0.02 <0.02 <0.02 <0.02 1.5 NA 1.5 NA NA
Nickel <0.01 <0.01 <0.01 <0.01 <0.01 <0.01 <0.01 <0.01 NA NA NA NA NA
Lead <0.01 <0.01 <0.01 <0.01 <0.01 <0.01 <0.01 <0.01 0.1 NA 0.1 NA NA
Zinc <0.2 <0.2 <0.2 <0.2 <0.2 <0.2 <0.2 <0.2 15 NA 15 NA NA
Chromium <0.02 <0.02 <0.02 <0.02 <0.02 <0.02 <0.02 <0.02 NA NA 0.05 NA NA
Total Coliform 11 14 21 17 17 45 140 110 50 500 5000 NA NA
Fecal Coliform 4 9 8 9 7 11 21 50 NA NA NA NA NA Note: NR= No relaxation, NS= Not Specified, AG= Agreeable, Ab= Absent *All in mg/lit except Temp., pH, Turbidity, colour, odour, Electric Conductivity (EC)
(Source: Primary monitoring survey by Precitech Laboratories Pvt. Ltd., Oct’18-Dec’18)
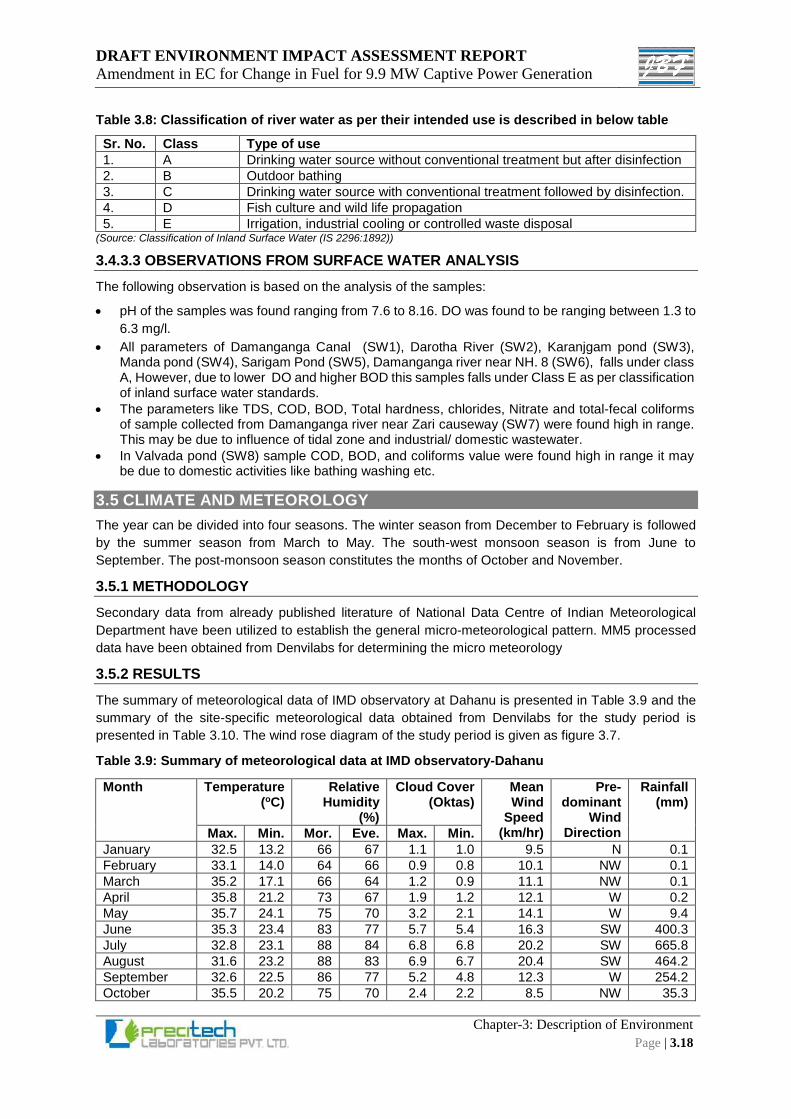
DRAFT ENVIRONMENT IMPACT ASSESSMENT REPORT
Amendment in EC for Change in Fuel for 9.9 MW Captive Power Generation
Chapter-3: Description of Environment
Page | 3.18
Table 3.8: Classification of river water as per their intended use is described in below table
Sr. No. Class Type of use
1. A Drinking water source without conventional treatment but after disinfection
2. B Outdoor bathing
3. C Drinking water source with conventional treatment followed by disinfection.
4. D Fish culture and wild life propagation
5. E Irrigation, industrial cooling or controlled waste disposal (Source: Classification of Inland Surface Water (IS 2296:1892))
3.4.3.3 OBSERVATIONS FROM SURFACE WATER ANALYSIS
The following observation is based on the analysis of the samples:
pH of the samples was found ranging from 7.6 to 8.16. DO was found to be ranging between 1.3 to
6.3 mg/l.
All parameters of Damanganga Canal (SW1), Darotha River (SW2), Karanjgam pond (SW3), Manda pond (SW4), Sarigam Pond (SW5), Damanganga river near NH. 8 (SW6), falls under class A, However, due to lower DO and higher BOD this samples falls under Class E as per classification of inland surface water standards.
The parameters like TDS, COD, BOD, Total hardness, chlorides, Nitrate and total-fecal coliforms of sample collected from Damanganga river near Zari causeway (SW7) were found high in range. This may be due to influence of tidal zone and industrial/ domestic wastewater.
In Valvada pond (SW8) sample COD, BOD, and coliforms value were found high in range it may be due to domestic activities like bathing washing etc.
3.5 CLIMATE AND METEOROLOGY
The year can be divided into four seasons. The winter season from December to February is followed
by the summer season from March to May. The south-west monsoon season is from June to
September. The post-monsoon season constitutes the months of October and November.
3.5.1 METHODOLOGY
Secondary data from already published literature of National Data Centre of Indian Meteorological
Department have been utilized to establish the general micro-meteorological pattern. MM5 processed
data have been obtained from Denvilabs for determining the micro meteorology
3.5.2 RESULTS
The summary of meteorological data of IMD observatory at Dahanu is presented in Table 3.9 and the
summary of the site-specific meteorological data obtained from Denvilabs for the study period is
presented in Table 3.10. The wind rose diagram of the study period is given as figure 3.7.
Table 3.9: Summary of meteorological data at IMD observatory-Dahanu
Month Temperature (oC)
Relative Humidity
(%)
Cloud Cover (Oktas)
Mean Wind
Speed (km/hr)
Pre-dominant
Wind Direction
Rainfall (mm)
Max. Min. Mor. Eve. Max. Min.
January 32.5 13.2 66 67 1.1 1.0 9.5 N 0.1
February 33.1 14.0 64 66 0.9 0.8 10.1 NW 0.1
March 35.2 17.1 66 64 1.2 0.9 11.1 NW 0.1
April 35.8 21.2 73 67 1.9 1.2 12.1 W 0.2
May 35.7 24.1 75 70 3.2 2.1 14.1 W 9.4
June 35.3 23.4 83 77 5.7 5.4 16.3 SW 400.3
July 32.8 23.1 88 84 6.8 6.8 20.2 SW 665.8
August 31.6 23.2 88 83 6.9 6.7 20.4 SW 464.2
September 32.6 22.5 86 77 5.2 4.8 12.3 W 254.2
October 35.5 20.2 75 70 2.4 2.2 8.5 NW 35.3
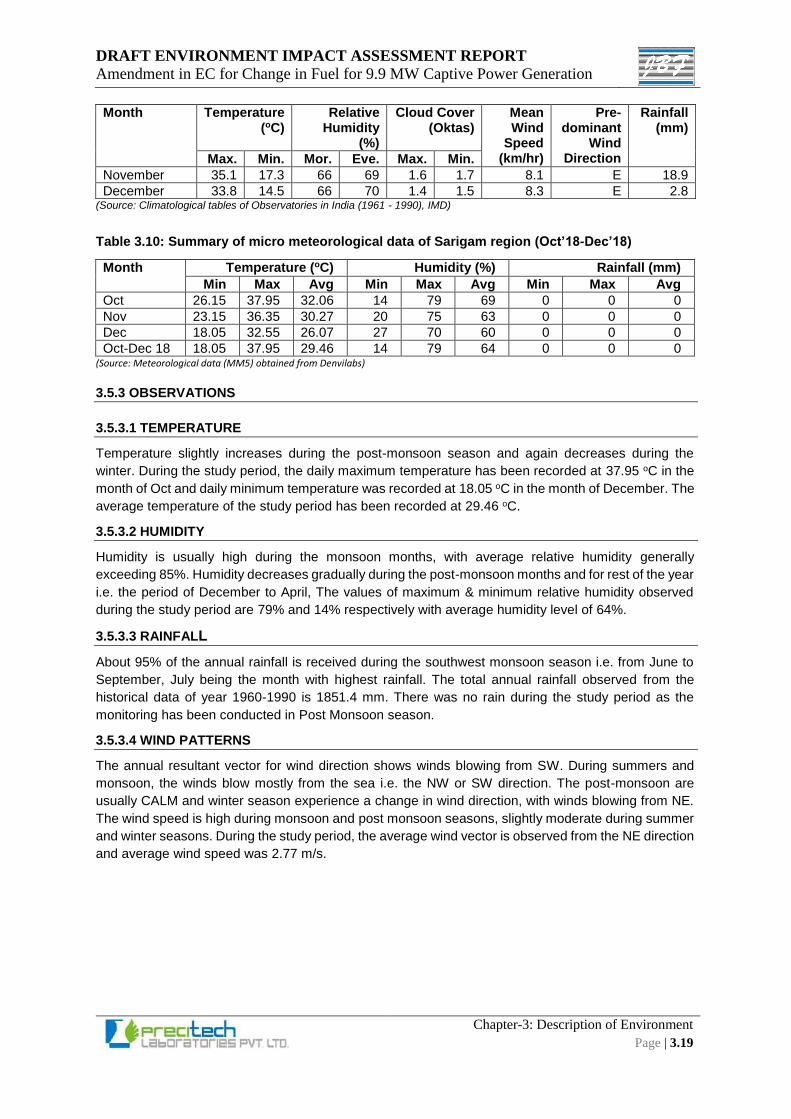
DRAFT ENVIRONMENT IMPACT ASSESSMENT REPORT
Amendment in EC for Change in Fuel for 9.9 MW Captive Power Generation
Chapter-3: Description of Environment
Page | 3.19
Month Temperature (oC)
Relative Humidity
(%)
Cloud Cover (Oktas)
Mean Wind
Speed (km/hr)
Pre-dominant
Wind Direction
Rainfall (mm)
Max. Min. Mor. Eve. Max. Min.
November 35.1 17.3 66 69 1.6 1.7 8.1 E 18.9
December 33.8 14.5 66 70 1.4 1.5 8.3 E 2.8 (Source: Climatological tables of Observatories in India (1961 - 1990), IMD)
Table 3.10: Summary of micro meteorological data of Sarigam region (Oct’18-Dec’18)
Month Temperature (oC) Humidity (%) Rainfall (mm)
Min Max Avg Min Max Avg Min Max Avg
Oct 26.15 37.95 32.06 14 79 69 0 0 0
Nov 23.15 36.35 30.27 20 75 63 0 0 0
Dec 18.05 32.55 26.07 27 70 60 0 0 0
Oct-Dec 18 18.05 37.95 29.46 14 79 64 0 0 0 (Source: Meteorological data (MM5) obtained from Denvilabs)
3.5.3 OBSERVATIONS
3.5.3.1 TEMPERATURE
Temperature slightly increases during the post-monsoon season and again decreases during the
winter. During the study period, the daily maximum temperature has been recorded at 37.95 oC in the
month of Oct and daily minimum temperature was recorded at 18.05 oC in the month of December. The
average temperature of the study period has been recorded at 29.46 oC.
3.5.3.2 HUMIDITY
Humidity is usually high during the monsoon months, with average relative humidity generally
exceeding 85%. Humidity decreases gradually during the post-monsoon months and for rest of the year
i.e. the period of December to April, The values of maximum & minimum relative humidity observed
during the study period are 79% and 14% respectively with average humidity level of 64%.
3.5.3.3 RAINFALL
About 95% of the annual rainfall is received during the southwest monsoon season i.e. from June to
September, July being the month with highest rainfall. The total annual rainfall observed from the
historical data of year 1960-1990 is 1851.4 mm. There was no rain during the study period as the
monitoring has been conducted in Post Monsoon season.
3.5.3.4 WIND PATTERNS
The annual resultant vector for wind direction shows winds blowing from SW. During summers and
monsoon, the winds blow mostly from the sea i.e. the NW or SW direction. The post-monsoon are
usually CALM and winter season experience a change in wind direction, with winds blowing from NE.
The wind speed is high during monsoon and post monsoon seasons, slightly moderate during summer
and winter seasons. During the study period, the average wind vector is observed from the NE direction
and average wind speed was 2.77 m/s.
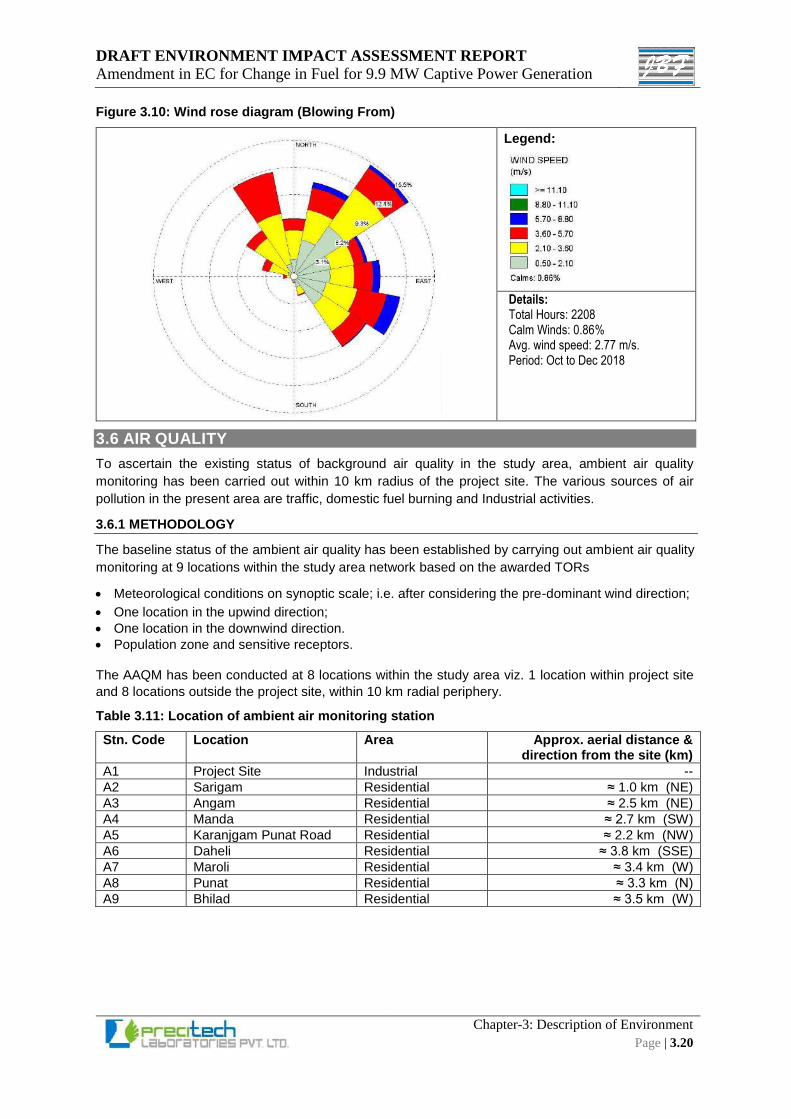
DRAFT ENVIRONMENT IMPACT ASSESSMENT REPORT
Amendment in EC for Change in Fuel for 9.9 MW Captive Power Generation
Chapter-3: Description of Environment
Page | 3.20
Figure 3.10: Wind rose diagram (Blowing From)
Legend:
Details: Total Hours: 2208 Calm Winds: 0.86% Avg. wind speed: 2.77 m/s. Period: Oct to Dec 2018
3.6 AIR QUALITY
To ascertain the existing status of background air quality in the study area, ambient air quality
monitoring has been carried out within 10 km radius of the project site. The various sources of air
pollution in the present area are traffic, domestic fuel burning and Industrial activities.
3.6.1 METHODOLOGY
The baseline status of the ambient air quality has been established by carrying out ambient air quality
monitoring at 9 locations within the study area network based on the awarded TORs
Meteorological conditions on synoptic scale; i.e. after considering the pre-dominant wind direction;
One location in the upwind direction;
One location in the downwind direction.
Population zone and sensitive receptors.
The AAQM has been conducted at 8 locations within the study area viz. 1 location within project site
and 8 locations outside the project site, within 10 km radial periphery.
Table 3.11: Location of ambient air monitoring station
Stn. Code Location Area Approx. aerial distance & direction from the site (km)
A1 Project Site Industrial --
A2 Sarigam Residential ≈ 1.0 km (NE)
A3 Angam Residential ≈ 2.5 km (NE)
A4 Manda Residential ≈ 2.7 km (SW)
A5 Karanjgam Punat Road Residential ≈ 2.2 km (NW)
A6 Daheli Residential ≈ 3.8 km (SSE)
A7 Maroli Residential ≈ 3.4 km (W)
A8 Punat Residential ≈ 3.3 km (N)
A9 Bhilad Residential ≈ 3.5 km (W)
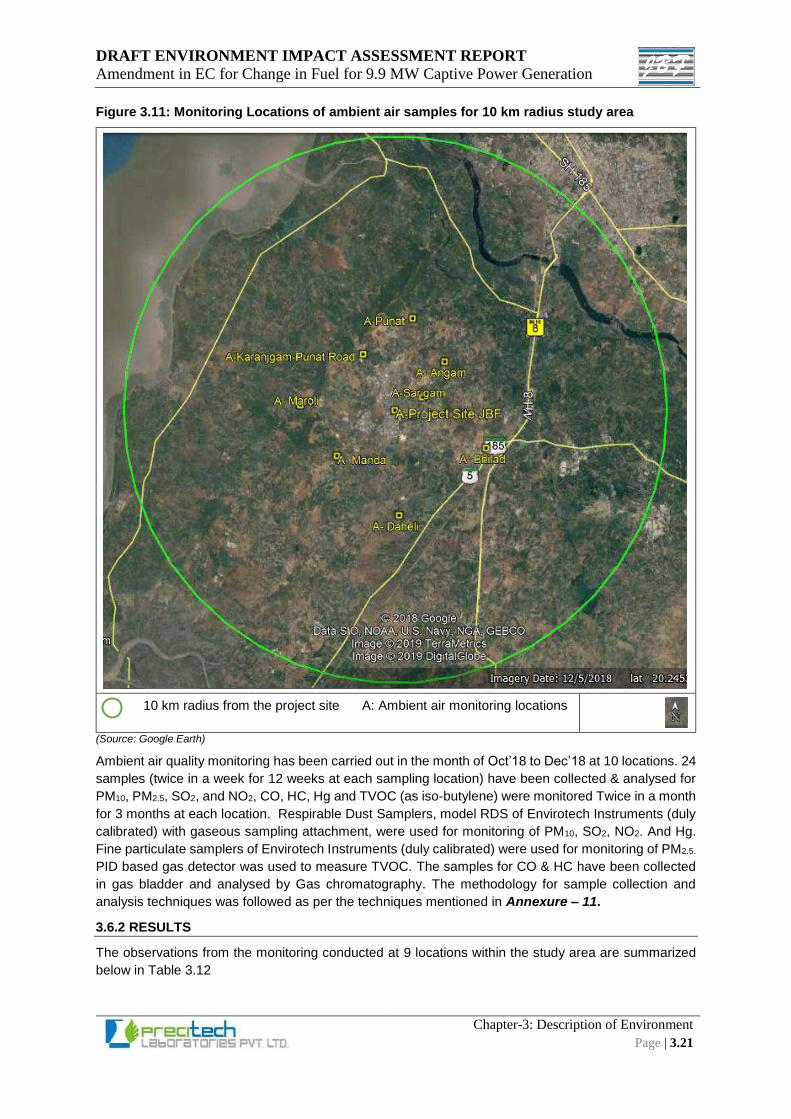
DRAFT ENVIRONMENT IMPACT ASSESSMENT REPORT
Amendment in EC for Change in Fuel for 9.9 MW Captive Power Generation
Chapter-3: Description of Environment
Page | 3.21
Figure 3.11: Monitoring Locations of ambient air samples for 10 km radius study area
10 km radius from the project site A: Ambient air monitoring locations
(Source: Google Earth)
Ambient air quality monitoring has been carried out in the month of Oct’18 to Dec’18 at 10 locations. 24
samples (twice in a week for 12 weeks at each sampling location) have been collected & analysed for
PM10, PM2.5, SO2, and NO2, CO, HC, Hg and TVOC (as iso-butylene) were monitored Twice in a month
for 3 months at each location. Respirable Dust Samplers, model RDS of Envirotech Instruments (duly
calibrated) with gaseous sampling attachment, were used for monitoring of PM10, SO2, NO2. And Hg.
Fine particulate samplers of Envirotech Instruments (duly calibrated) were used for monitoring of PM2.5.
PID based gas detector was used to measure TVOC. The samples for CO & HC have been collected
in gas bladder and analysed by Gas chromatography. The methodology for sample collection and
analysis techniques was followed as per the techniques mentioned in Annexure – 11.
3.6.2 RESULTS
The observations from the monitoring conducted at 9 locations within the study area are summarized
below in Table 3.12
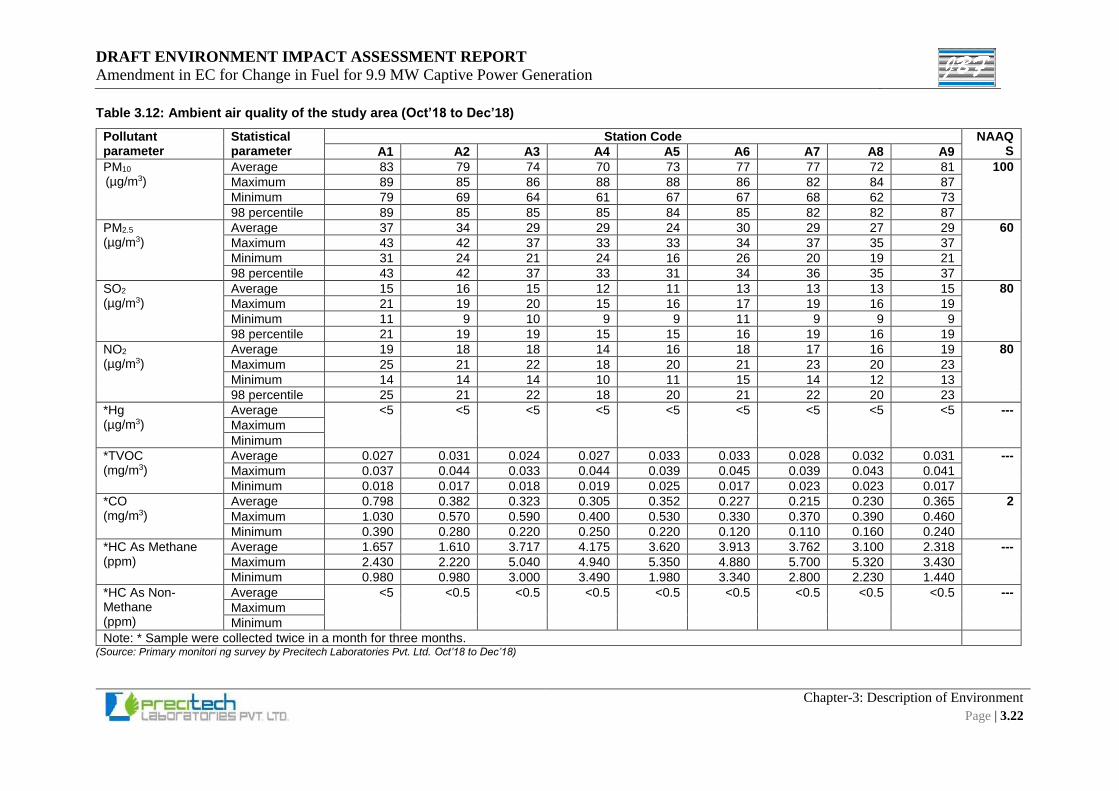
DRAFT ENVIRONMENT IMPACT ASSESSMENT REPORT
Amendment in EC for Change in Fuel for 9.9 MW Captive Power Generation
Chapter-3: Description of Environment
Page | 3.22
Table 3.12: Ambient air quality of the study area (Oct’18 to Dec’18)
Pollutant parameter
Statistical parameter
Station Code NAAQS A1 A2 A3 A4 A5 A6 A7 A8 A9
PM10
(µg/m3) Average 83 79 74 70 73 77 77 72 81 100
Maximum 89 85 86 88 88 86 82 84 87
Minimum 79 69 64 61 67 67 68 62 73
98 percentile 89 85 85 85 84 85 82 82 87
PM2.5
(µg/m3) Average 37 34 29 29 24 30 29 27 29 60
Maximum 43 42 37 33 33 34 37 35 37
Minimum 31 24 21 24 16 26 20 19 21
98 percentile 43 42 37 33 31 34 36 35 37
SO2
(µg/m3) Average 15 16 15 12 11 13 13 13 15 80
Maximum 21 19 20 15 16 17 19 16 19
Minimum 11 9 10 9 9 11 9 9 9
98 percentile 21 19 19 15 15 16 19 16 19
NO2
(µg/m3) Average 19 18 18 14 16 18 17 16 19 80
Maximum 25 21 22 18 20 21 23 20 23
Minimum 14 14 14 10 11 15 14 12 13
98 percentile 25 21 22 18 20 21 22 20 23
*Hg (µg/m3)
Average <5 <5 <5 <5 <5 <5 <5 <5 <5 ---
Maximum
Minimum
*TVOC (mg/m3)
Average 0.027 0.031 0.024 0.027 0.033 0.033 0.028 0.032 0.031 ---
Maximum 0.037 0.044 0.033 0.044 0.039 0.045 0.039 0.043 0.041
Minimum 0.018 0.017 0.018 0.019 0.025 0.017 0.023 0.023 0.017
*CO (mg/m3)
Average 0.798 0.382 0.323 0.305 0.352 0.227 0.215 0.230 0.365 2
Maximum 1.030 0.570 0.590 0.400 0.530 0.330 0.370 0.390 0.460
Minimum 0.390 0.280 0.220 0.250 0.220 0.120 0.110 0.160 0.240
*HC As Methane (ppm)
Average 1.657 1.610 3.717 4.175 3.620 3.913 3.762 3.100 2.318 ---
Maximum 2.430 2.220 5.040 4.940 5.350 4.880 5.700 5.320 3.430
Minimum 0.980 0.980 3.000 3.490 1.980 3.340 2.800 2.230 1.440
*HC As Non-Methane (ppm)
Average <5 <0.5 <0.5 <0.5 <0.5 <0.5 <0.5 <0.5 <0.5 ---
Maximum
Minimum
Note: * Sample were collected twice in a month for three months. (Source: Primary monitori ng survey by Precitech Laboratories Pvt. Ltd. Oct’18 to Dec’18)
DRAFT ENVIRONMENT IMPACT ASSESSMENT REPORT
Amendment in EC for Change in Fuel for 9.9 MW Captive Power Generation
Chapter-3: Description of Environment
Page | 3.23
3.6.3 OBSERVATION FROM AAQM RESULTS
The following observation is made based on the test results found during the study period.
Concentration of PM10 ranged from 61 µg/m3 to 89 µg/m3.
Concentration of PM2.5 ranged between 16 µg/m3 to 43 µg/m3.
Concentration of SO2 ranged between 9 µg/m3 to 21 µg/m3.
Concentration of NO2 ranged between 10 µg/m3 to 25 µg/m3.
Concentration of Hg was below detectable range. i.e. <5 µg/m3.
Concentration of TVOC ranged from 0.017 mg/m3 to 0.037 mg/m3.
Concentration of CO ranged from 0.110 mg/m3 to 1.030 mg/m3.
Concentration of HC as Methane ranged from 0.98 ppm to 5.70 ppm.
Concentration of HC as Non-Methane was below detectable range. i.e. <0.5 ppm.
The results indicates that the ambient air quality for all the parameters at all the locations in the study area are below the National Ambient Air Quality Standards (NAAQS).
3.7 NOISE MONITORING
The most common and universally accepted scale of measuring noise levels is the ‘A’ weighted scale
which is measured as dB (A). The scale has been designed to weigh various components of noise
according to the response of a human ear.
3.7.1 METHODOLOGY
Noise level monitoring was carried out once at each location for 24 hours at hourly intervals, during the
study period. The day time limit is between 6 AM to 10 PM and night time limit is 10 PM to 6 AM. The
area with high noise potential in the existing plant have been monitored moreover, also nearby
residential area from the project site have been monitored.SCM100 Sound Level Meter from Envirotech
(type II) was used for noise level monitoring.
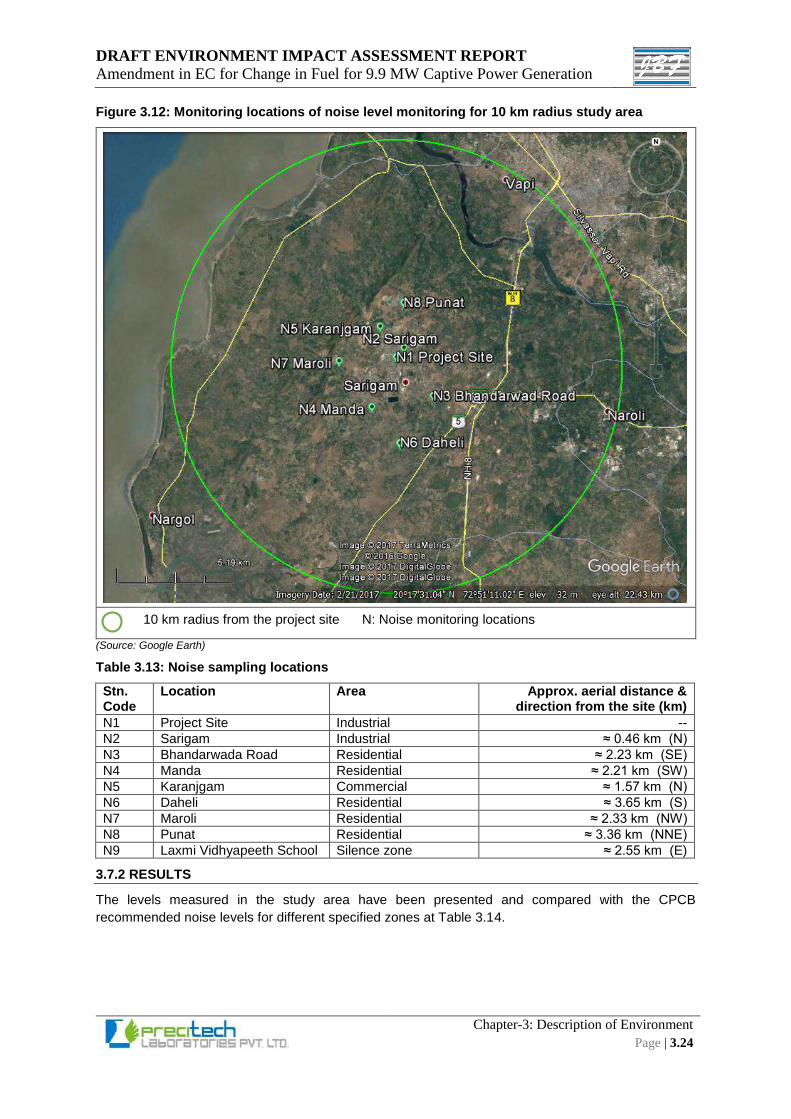
DRAFT ENVIRONMENT IMPACT ASSESSMENT REPORT
Amendment in EC for Change in Fuel for 9.9 MW Captive Power Generation
Chapter-3: Description of Environment
Page | 3.24
Figure 3.12: Monitoring locations of noise level monitoring for 10 km radius study area
10 km radius from the project site N: Noise monitoring locations
(Source: Google Earth)
Table 3.13: Noise sampling locations
Stn. Code
Location Area Approx. aerial distance & direction from the site (km)
N1 Project Site Industrial --
N2 Sarigam Industrial ≈ 0.46 km (N)
N3 Bhandarwada Road Residential ≈ 2.23 km (SE)
N4 Manda Residential ≈ 2.21 km (SW)
N5 Karanjgam Commercial ≈ 1.57 km (N)
N6 Daheli Residential ≈ 3.65 km (S)
N7 Maroli Residential ≈ 2.33 km (NW)
N8 Punat Residential ≈ 3.36 km (NNE)
N9 Laxmi Vidhyapeeth School Silence zone ≈ 2.55 km (E)
3.7.2 RESULTS
The levels measured in the study area have been presented and compared with the CPCB
recommended noise levels for different specified zones at Table 3.14.
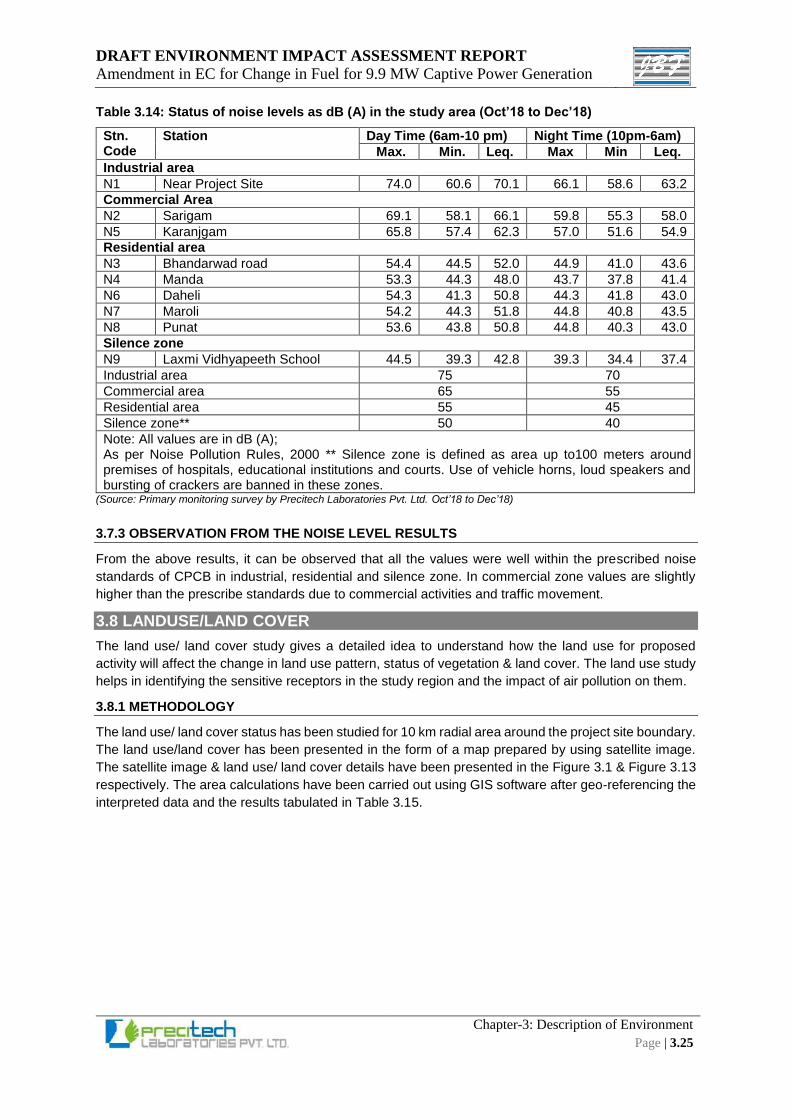
DRAFT ENVIRONMENT IMPACT ASSESSMENT REPORT
Amendment in EC for Change in Fuel for 9.9 MW Captive Power Generation
Chapter-3: Description of Environment
Page | 3.25
Table 3.14: Status of noise levels as dB (A) in the study area (Oct’18 to Dec’18)
Stn. Code
Station Day Time (6am-10 pm) Night Time (10pm-6am)
Max. Min. Leq. Max Min Leq.
Industrial area
N1 Near Project Site 74.0 60.6 70.1 66.1 58.6 63.2
Commercial Area
N2 Sarigam 69.1 58.1 66.1 59.8 55.3 58.0
N5 Karanjgam 65.8 57.4 62.3 57.0 51.6 54.9
Residential area
N3 Bhandarwad road 54.4 44.5 52.0 44.9 41.0 43.6
N4 Manda 53.3 44.3 48.0 43.7 37.8 41.4
N6 Daheli 54.3 41.3 50.8 44.3 41.8 43.0
N7 Maroli 54.2 44.3 51.8 44.8 40.8 43.5
N8 Punat 53.6 43.8 50.8 44.8 40.3 43.0
Silence zone
N9 Laxmi Vidhyapeeth School 44.5 39.3 42.8 39.3 34.4 37.4
Industrial area 75 70
Commercial area 65 55
Residential area 55 45
Silence zone** 50 40
Note: All values are in dB (A); As per Noise Pollution Rules, 2000 ** Silence zone is defined as area up to100 meters around premises of hospitals, educational institutions and courts. Use of vehicle horns, loud speakers and bursting of crackers are banned in these zones.
(Source: Primary monitoring survey by Precitech Laboratories Pvt. Ltd. Oct’18 to Dec’18)
3.7.3 OBSERVATION FROM THE NOISE LEVEL RESULTS
From the above results, it can be observed that all the values were well within the prescribed noise
standards of CPCB in industrial, residential and silence zone. In commercial zone values are slightly
higher than the prescribe standards due to commercial activities and traffic movement.
3.8 LANDUSE/LAND COVER
The land use/ land cover study gives a detailed idea to understand how the land use for proposed
activity will affect the change in land use pattern, status of vegetation & land cover. The land use study
helps in identifying the sensitive receptors in the study region and the impact of air pollution on them.
3.8.1 METHODOLOGY
The land use/ land cover status has been studied for 10 km radial area around the project site boundary.
The land use/land cover has been presented in the form of a map prepared by using satellite image.
The satellite image & land use/ land cover details have been presented in the Figure 3.1 & Figure 3.13
respectively. The area calculations have been carried out using GIS software after geo-referencing the
interpreted data and the results tabulated in Table 3.15.
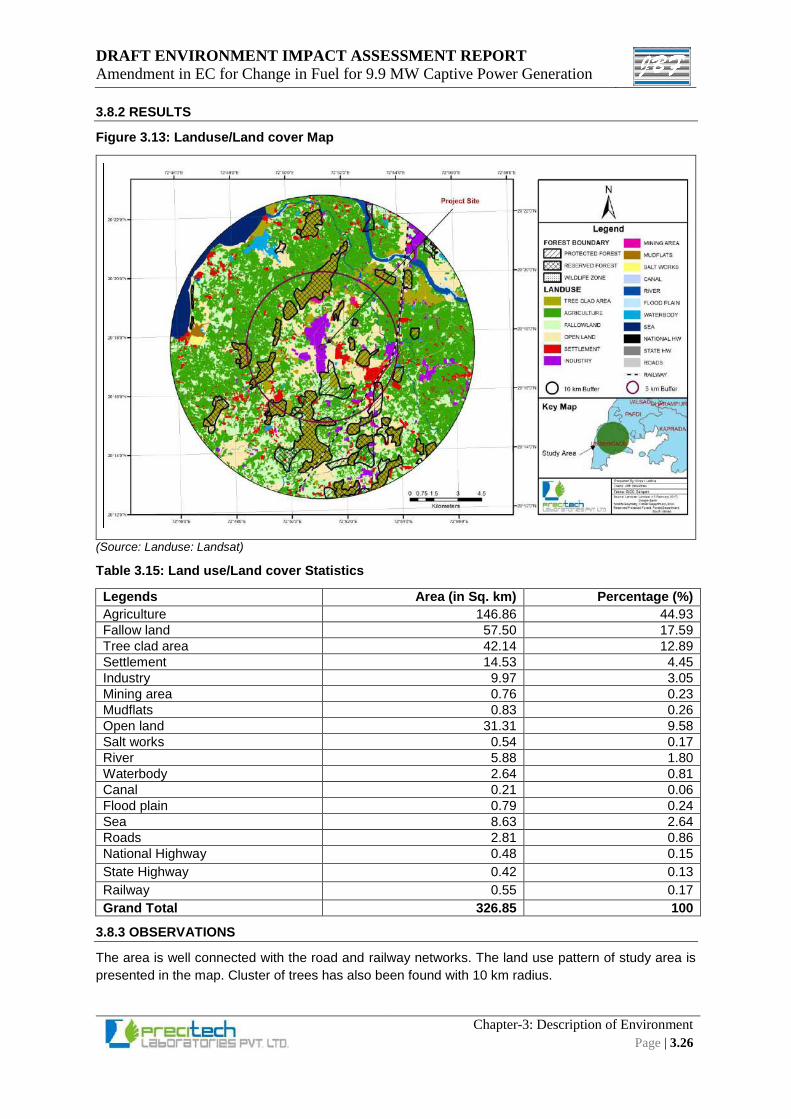
DRAFT ENVIRONMENT IMPACT ASSESSMENT REPORT
Amendment in EC for Change in Fuel for 9.9 MW Captive Power Generation
Chapter-3: Description of Environment
Page | 3.26
3.8.2 RESULTS
Figure 3.13: Landuse/Land cover Map
(Source: Landuse: Landsat)
Table 3.15: Land use/Land cover Statistics
Legends Area (in Sq. km) Percentage (%)
Agriculture 146.86 44.93
Fallow land 57.50 17.59
Tree clad area 42.14 12.89
Settlement 14.53 4.45
Industry 9.97 3.05
Mining area 0.76 0.23
Mudflats 0.83 0.26
Open land 31.31 9.58
Salt works 0.54 0.17
River 5.88 1.80
Waterbody 2.64 0.81
Canal 0.21 0.06
Flood plain 0.79 0.24
Sea 8.63 2.64
Roads 2.81 0.86
National Highway 0.48 0.15
State Highway 0.42 0.13
Railway 0.55 0.17
Grand Total 326.85 100
3.8.3 OBSERVATIONS
The area is well connected with the road and railway networks. The land use pattern of study area is
presented in the map. Cluster of trees has also been found with 10 km radius.
DRAFT ENVIRONMENT IMPACT ASSESSMENT REPORT
Amendment in EC for Change in Fuel for 9.9 MW Captive Power Generation
Chapter-3: Description of Environment
Page | 3.27
River Damanganga flows around 7.5 km and River Darotha flows around 3.6 km in the northeast
direction of the site. There are few ponds/lakes present within 10 km radius of the industry however the
water resources of district will not be affected with the expansion of the industry as the area fall under
the notified GIDC area. But in the coming years due to declining trend in the forest area with the variation
of monsoonal rainfall and ground water table the cultivable land area may tend to decline because of
the urbanization, encroachment and development of the buildings and roads in the surrounding lands.
The cultivable or agricultural land at present is 45 % while the fallow land is around 17.6 % both together
covering more than 60 % of the total area under study. The uncultivated/fallow lands are the lands,
which is left free without cultivation currently for various reasons such as replenishment of nutrient,
water scarcity, etc. Alongside other major industries there is also the presence of Salt work activities at
the coastal belts of the district which covers around 0.17% of the total study area. Built-up area covers
around 7.5% of total study area out of which industrial area is around 4.5 % and rest is other settlements.
There is presence of part of sea, river, waterbodies, canals and flood plains which occupies remaining
part of the study area.
3.9 ECOLOGY AND BIODIVERSITY
The term biodiversity is used to refer to life in all its forms and the natural processes that support and
connect all life forms. Biodiversity is not easily defined because it is more than just the sum of its parts,
as all its elements, regardless of whether to understand their roles or know their status, are integral to
maintaining functioning, evolving, resilient ecosystems. Complex concepts such as biodiversity are
often easier to grasp if reduced to their component pieces. While this approach does not give a
complete picture of how these species interact and combine to create biodiversity, it helps us
understand different aspects of biodiversity.
Species are a complete, self-generating, unique ensemble of genetic variation, capable of interbreeding
and producing fertile offspring. They (and their subspecies and populations) are generally considered
to be the only self-replicating units of genetic diversity that can function independently.
Thus, Biodiversity is the foundation of a vast array of ecosystem services essential for human well-
being. Since the exhaustive study would certainly require of one year with one overlapping season.
However, this report attempts to comprise the possible macro-biodiversity and the present data
produced in the report consist of reconnaissance survey and the database of the areas available in the
literatures that have been compared and mentioned.
In addition to the area identified for industrial development, major area in the study region has mango
orchards. The central, northern and western parts of the region are suitable for agricultural activities.
The main staple crops are paddy, ragi, small millets and pulses. Sugarcane is also cultivated in recent
years. The biotic composition in the study region indicates richness in species diversity. The details of
the ecological layout of the study area are presented in following sections.
3.9.1 OBJECTIVES OF THE TERRESTRIAL AND AQUATIC ECOLOGY SURVEY
Detailed, qualitative biodiversity survey for plants, four vertebrates line transect-during period of Oct
’18 to Dec’18 (Post-Monsoon season)
Identification of endemic & endangered species as per Indian Wild Life (Protection) Act, 1972 and
IUCN Red list 2016-2 (vide- IUCN Red List Categories and Criteria, version 2.3)
3.9.2 STUDY AREA SELECTION
Field survey area is selected based on the ecologically diverse and dense vegetation identified from
Google map and land use patter map.
The field survey was conducted at identified survey area, during the study period (Oct ’18 to Dec’18)
within the study area of 10 Km radial distance from the project site.
Observations were made on line transect and qualitative analysis of the vegetation and fauna is
done.
DRAFT ENVIRONMENT IMPACT ASSESSMENT REPORT
Amendment in EC for Change in Fuel for 9.9 MW Captive Power Generation
Chapter-3: Description of Environment
Page | 3.28
The ICUCN status of the enlisted species is established as per Indian Wild Life (Protection) Act,
1972 and IUCN Red list 2016-2 (vide- IUCN Red List Categories and Criteria, version 2.3).
3.9.3 FLORAL DIVERSITY OF THE STUDY AREA
The zone of Umbergaon Taluka shows fairly rich in plant biodiversity having more of annual and
perennial herbaceous vegetation. The small hillocks existing in the perimeter of the proposed project
site are already degraded forest patches and mainly comprised of planted trees and shrubs. Among the
plant biodiversity none of the species belongs to IUCN red list as well as schedule species as per wildlife
list. Common flora of the region is given as Annexure-12 (a). The vulnerable species (Bombax ceiba
and Dalbergia latifolia) as per IUCN Red list 2016-2 are found in the region. In addition to these
important species of plantation area of the region, many other wild species of flora are observed in the
forest and open unused area of the region. These wild species are given as Annexure-12 (a).
3.9.4 FAUNA OF THE STUDY AREA
During observations, the sighting of wild animals was lesser in the entire study area. The assessment
of wild life fauna has been carried out on the basis of information collected from personal interviews
with local peoples as well as sighting of some animals. During field survey common garden lizard was
observed frequently in the study area and occasionally some snakes belonging to both poisonous and
non-poisonous category. Observations for birds were made during a walk through in the chosen line
transects for sighting the birds. Dominant birds in the study area are Common peafowl, Common Myna,
House sparrow, House crow, Black drongo, Small green Bee eater, Spotted dove, Rose ring parakeet,
Blue rock pigeon, House swift, common babbler and the other birds are Indian robin, Black ibis, Indian
roller, white wagtail, Pond heron, cattle egret. The list of all observed & reported fauna is given as
Annexure-12 (a). There are two Schedule-I species viz. Pavo cristatus- Common Peafowl (Least
Concern /Sch-I) and Varnus bengalensis- Common Indian monitor (Least Concern /Sch-I) as per Wild
Life Protection Act (WLPA) in the study area. The conservation plan of these species is given as
Annexure-12 (b).
3.9.5 AQUATIC ECOLOGY
For the purpose of the aquatic ecology study, qualitative survey of some water bodies for identification
of Phytoplankton, Zooplankton, Bacteria and Fishes have been carried out. The study was conducted
once in the study period (Post Monsoon 2018). Only qualitative assessment for identification of the
aquatic flora & fauna has been conducted. The study for determination of aquatic ecological layout of
the area was conducted for locations as given in Table 3.16 & Figure 3.14. The samples for plankton
study were conducted following the method suggested by NIO & APHA. The samples for phytoplankton
were collected using plankton net of 25-micron net size using measured bucket. The samples of
zooplankton were collected using plankton net of 200-micron size. For each sample, 30 litres of
samples were passed/filtered through the plankton net to collect 100 ml concentrated sample. Studies
of fishes was conducted for identification of fishes in the fish catch done by local fishermen.
Table 3.16: Sampling locations for Aquatic Ecology
Stn. Code
Location Arial Distance Sampling Details
AE1 Darotha River ≈ 5.9 km (E) Phytoplankton /Zooplankton
AE2 Damanganga river near NH. 8 ≈ 8.4 km (NE) Phytoplankton /Zooplankton (Source: Google earth)
A composite sample of the collected three samples was studied for identification of the phytoplankton after concentrating the samples by filtering technique. The details are given as Annexure-12 (a).
3.10 SOCIO-ECONOMIC LAYOUT
The main objective of the study is to conduct demographic analysis for villages/towns coming in the
radial distance of 10 km using available census data to describe inference related to demographic,
social and economic conditions of the region and to conduct the social impact assessment in context
to upcoming said project of M/s JBF Industries Ltd. Further it also narrate the social development
program identified and would be undertaken by the company under CER.
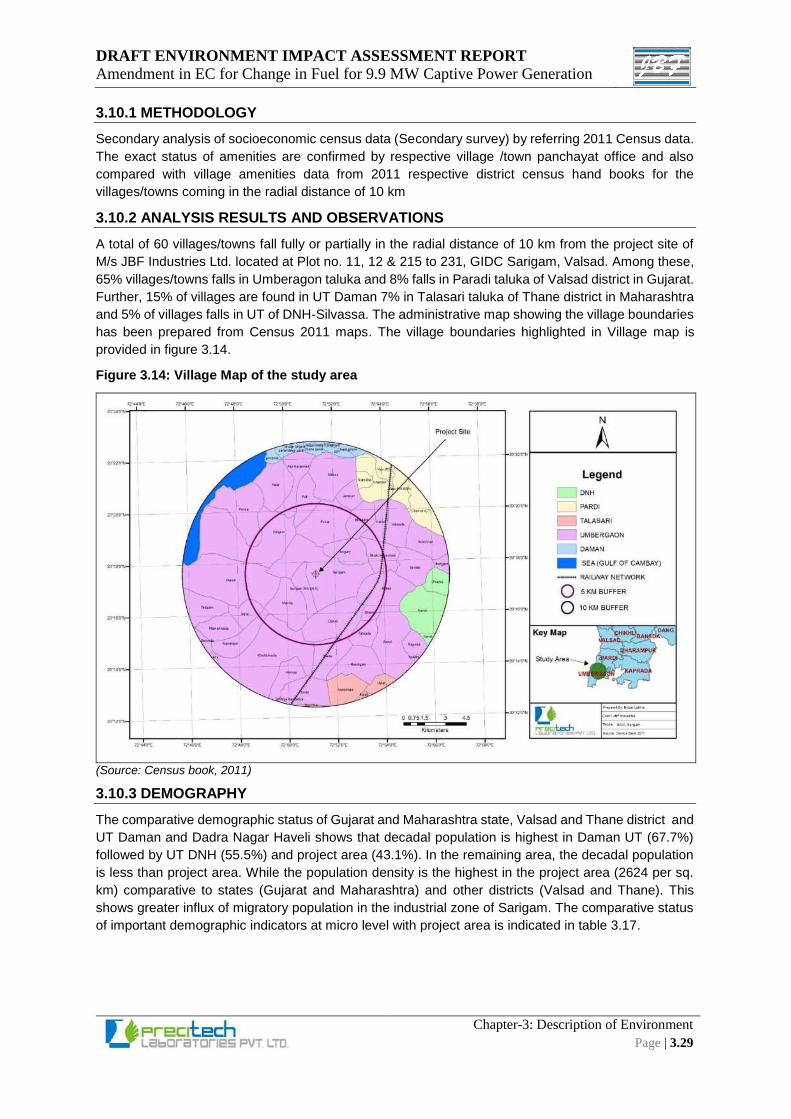
DRAFT ENVIRONMENT IMPACT ASSESSMENT REPORT
Amendment in EC for Change in Fuel for 9.9 MW Captive Power Generation
Chapter-3: Description of Environment
Page | 3.29
3.10.1 METHODOLOGY
Secondary analysis of socioeconomic census data (Secondary survey) by referring 2011 Census data.
The exact status of amenities are confirmed by respective village /town panchayat office and also
compared with village amenities data from 2011 respective district census hand books for the
villages/towns coming in the radial distance of 10 km
3.10.2 ANALYSIS RESULTS AND OBSERVATIONS
A total of 60 villages/towns fall fully or partially in the radial distance of 10 km from the project site of
M/s JBF Industries Ltd. located at Plot no. 11, 12 & 215 to 231, GIDC Sarigam, Valsad. Among these,
65% villages/towns falls in Umberagon taluka and 8% falls in Paradi taluka of Valsad district in Gujarat.
Further, 15% of villages are found in UT Daman 7% in Talasari taluka of Thane district in Maharashtra
and 5% of villages falls in UT of DNH-Silvassa. The administrative map showing the village boundaries
has been prepared from Census 2011 maps. The village boundaries highlighted in Village map is
provided in figure 3.14.
Figure 3.14: Village Map of the study area
(Source: Census book, 2011)
3.10.3 DEMOGRAPHY
The comparative demographic status of Gujarat and Maharashtra state, Valsad and Thane district and
UT Daman and Dadra Nagar Haveli shows that decadal population is highest in Daman UT (67.7%)
followed by UT DNH (55.5%) and project area (43.1%). In the remaining area, the decadal population
is less than project area. While the population density is the highest in the project area (2624 per sq.
km) comparative to states (Gujarat and Maharashtra) and other districts (Valsad and Thane). This
shows greater influx of migratory population in the industrial zone of Sarigam. The comparative status
of important demographic indicators at micro level with project area is indicated in table 3.17.
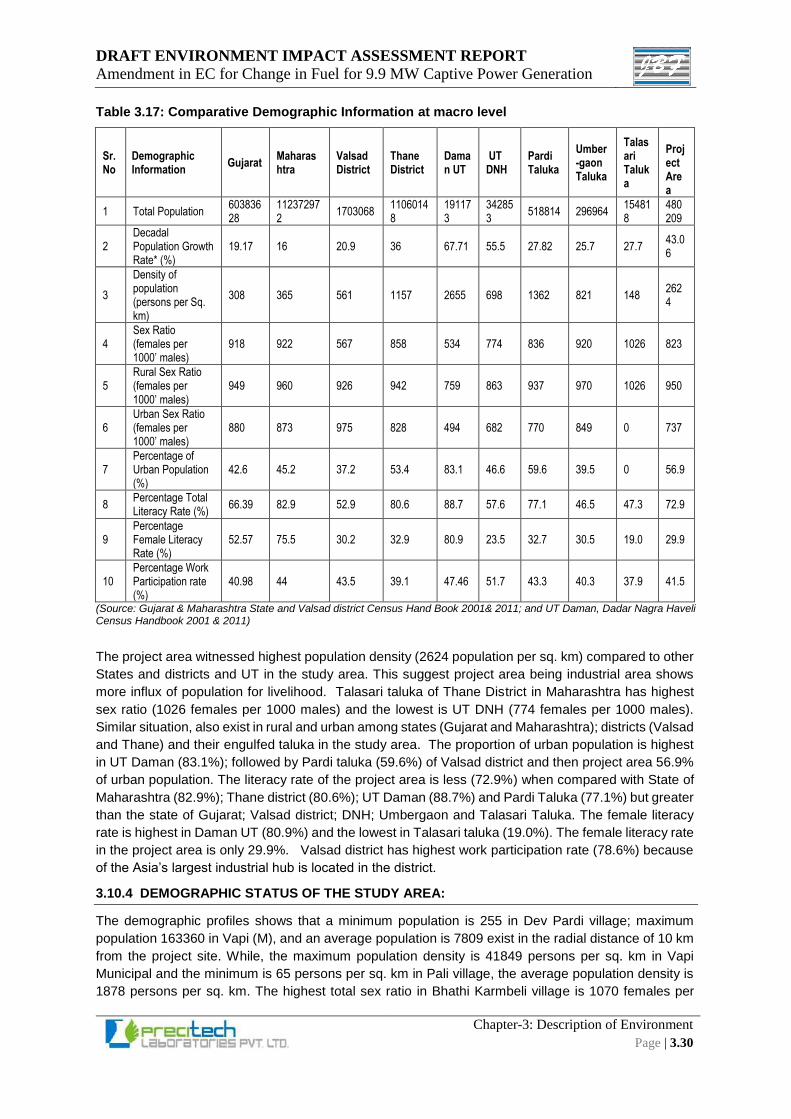
DRAFT ENVIRONMENT IMPACT ASSESSMENT REPORT
Amendment in EC for Change in Fuel for 9.9 MW Captive Power Generation
Chapter-3: Description of Environment
Page | 3.30
Table 3.17: Comparative Demographic Information at macro level
Sr. No
Demographic Information
Gujarat Maharashtra
Valsad District
Thane District
Daman UT
UT DNH
Pardi Taluka
Umber-gaon Taluka
Talasari Taluka
Project Area
1 Total Population 60383628
112372972
1703068 11060148
191173
342853
518814 296964 154818
480209
2 Decadal Population Growth Rate* (%)
19.17 16 20.9 36 67.71 55.5 27.82 25.7 27.7 43.06
3
Density of population (persons per Sq. km)
308 365 561 1157 2655 698 1362 821 148 2624
4 Sex Ratio (females per 1000’ males)
918 922 567 858 534 774 836 920 1026 823
5 Rural Sex Ratio (females per 1000’ males)
949 960 926 942 759 863 937 970 1026 950
6 Urban Sex Ratio (females per 1000’ males)
880 873 975 828 494 682 770 849 0 737
7 Percentage of Urban Population (%)
42.6 45.2 37.2 53.4 83.1 46.6 59.6 39.5 0 56.9
8 Percentage Total Literacy Rate (%)
66.39 82.9 52.9 80.6 88.7 57.6 77.1 46.5 47.3 72.9
9 Percentage Female Literacy Rate (%)
52.57 75.5 30.2 32.9 80.9 23.5 32.7 30.5 19.0 29.9
10 Percentage Work Participation rate (%)
40.98 44 43.5 39.1 47.46 51.7 43.3 40.3 37.9 41.5
(Source: Gujarat & Maharashtra State and Valsad district Census Hand Book 2001& 2011; and UT Daman, Dadar Nagra Haveli Census Handbook 2001 & 2011)
The project area witnessed highest population density (2624 population per sq. km) compared to other
States and districts and UT in the study area. This suggest project area being industrial area shows
more influx of population for livelihood. Talasari taluka of Thane District in Maharashtra has highest
sex ratio (1026 females per 1000 males) and the lowest is UT DNH (774 females per 1000 males).
Similar situation, also exist in rural and urban among states (Gujarat and Maharashtra); districts (Valsad
and Thane) and their engulfed taluka in the study area. The proportion of urban population is highest
in UT Daman (83.1%); followed by Pardi taluka (59.6%) of Valsad district and then project area 56.9%
of urban population. The literacy rate of the project area is less (72.9%) when compared with State of
Maharashtra (82.9%); Thane district (80.6%); UT Daman (88.7%) and Pardi Taluka (77.1%) but greater
than the state of Gujarat; Valsad district; DNH; Umbergaon and Talasari Taluka. The female literacy
rate is highest in Daman UT (80.9%) and the lowest in Talasari taluka (19.0%). The female literacy rate
in the project area is only 29.9%. Valsad district has highest work participation rate (78.6%) because
of the Asia’s largest industrial hub is located in the district.
3.10.4 DEMOGRAPHIC STATUS OF THE STUDY AREA:
The demographic profiles shows that a minimum population is 255 in Dev Pardi village; maximum
population 163360 in Vapi (M), and an average population is 7809 exist in the radial distance of 10 km
from the project site. While, the maximum population density is 41849 persons per sq. km in Vapi
Municipal and the minimum is 65 persons per sq. km in Pali village, the average population density is
1878 persons per sq. km. The highest total sex ratio in Bhathi Karmbeli village is 1070 females per
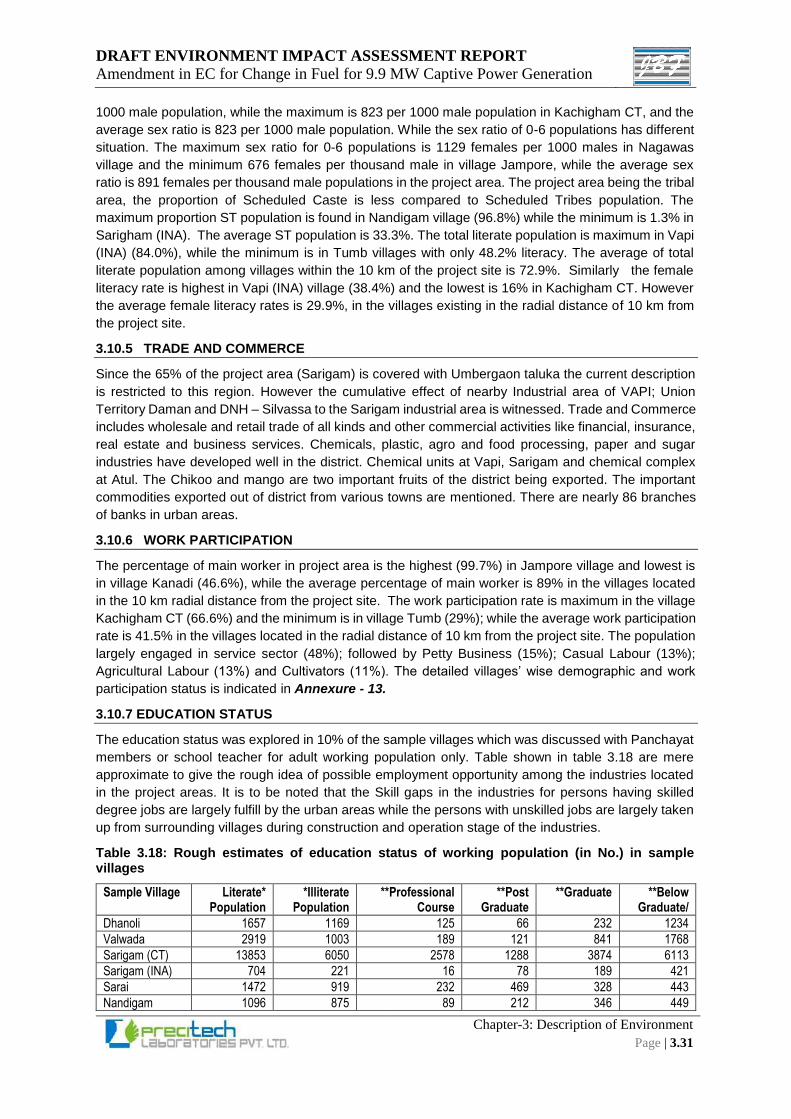
DRAFT ENVIRONMENT IMPACT ASSESSMENT REPORT
Amendment in EC for Change in Fuel for 9.9 MW Captive Power Generation
Chapter-3: Description of Environment
Page | 3.31
1000 male population, while the maximum is 823 per 1000 male population in Kachigham CT, and the
average sex ratio is 823 per 1000 male population. While the sex ratio of 0-6 populations has different
situation. The maximum sex ratio for 0-6 populations is 1129 females per 1000 males in Nagawas
village and the minimum 676 females per thousand male in village Jampore, while the average sex
ratio is 891 females per thousand male populations in the project area. The project area being the tribal
area, the proportion of Scheduled Caste is less compared to Scheduled Tribes population. The
maximum proportion ST population is found in Nandigam village (96.8%) while the minimum is 1.3% in
Sarigham (INA). The average ST population is 33.3%. The total literate population is maximum in Vapi
(INA) (84.0%), while the minimum is in Tumb villages with only 48.2% literacy. The average of total
literate population among villages within the 10 km of the project site is 72.9%. Similarly the female
literacy rate is highest in Vapi (INA) village (38.4%) and the lowest is 16% in Kachigham CT. However
the average female literacy rates is 29.9%, in the villages existing in the radial distance of 10 km from
the project site.
3.10.5 TRADE AND COMMERCE
Since the 65% of the project area (Sarigam) is covered with Umbergaon taluka the current description
is restricted to this region. However the cumulative effect of nearby Industrial area of VAPI; Union
Territory Daman and DNH – Silvassa to the Sarigam industrial area is witnessed. Trade and Commerce
includes wholesale and retail trade of all kinds and other commercial activities like financial, insurance,
real estate and business services. Chemicals, plastic, agro and food processing, paper and sugar
industries have developed well in the district. Chemical units at Vapi, Sarigam and chemical complex
at Atul. The Chikoo and mango are two important fruits of the district being exported. The important
commodities exported out of district from various towns are mentioned. There are nearly 86 branches
of banks in urban areas.
3.10.6 WORK PARTICIPATION
The percentage of main worker in project area is the highest (99.7%) in Jampore village and lowest is
in village Kanadi (46.6%), while the average percentage of main worker is 89% in the villages located
in the 10 km radial distance from the project site. The work participation rate is maximum in the village
Kachigham CT (66.6%) and the minimum is in village Tumb (29%); while the average work participation
rate is 41.5% in the villages located in the radial distance of 10 km from the project site. The population
largely engaged in service sector (48%); followed by Petty Business (15%); Casual Labour (13%);
Agricultural Labour (13%) and Cultivators (11%). The detailed villages’ wise demographic and work
participation status is indicated in Annexure - 13.
3.10.7 EDUCATION STATUS
The education status was explored in 10% of the sample villages which was discussed with Panchayat
members or school teacher for adult working population only. Table shown in table 3.18 are mere
approximate to give the rough idea of possible employment opportunity among the industries located
in the project areas. It is to be noted that the Skill gaps in the industries for persons having skilled
degree jobs are largely fulfill by the urban areas while the persons with unskilled jobs are largely taken
up from surrounding villages during construction and operation stage of the industries.
Table 3.18: Rough estimates of education status of working population (in No.) in sample villages
Sample Village Literate* Population
*Illiterate Population
**Professional Course
**Post Graduate
**Graduate **Below Graduate/
Dhanoli 1657 1169 125 66 232 1234
Valwada 2919 1003 189 121 841 1768
Sarigam (CT) 13853 6050 2578 1288 3874 6113
Sarigam (INA) 704 221 16 78 189 421
Sarai 1472 919 232 469 328 443
Nandigam 1096 875 89 212 346 449
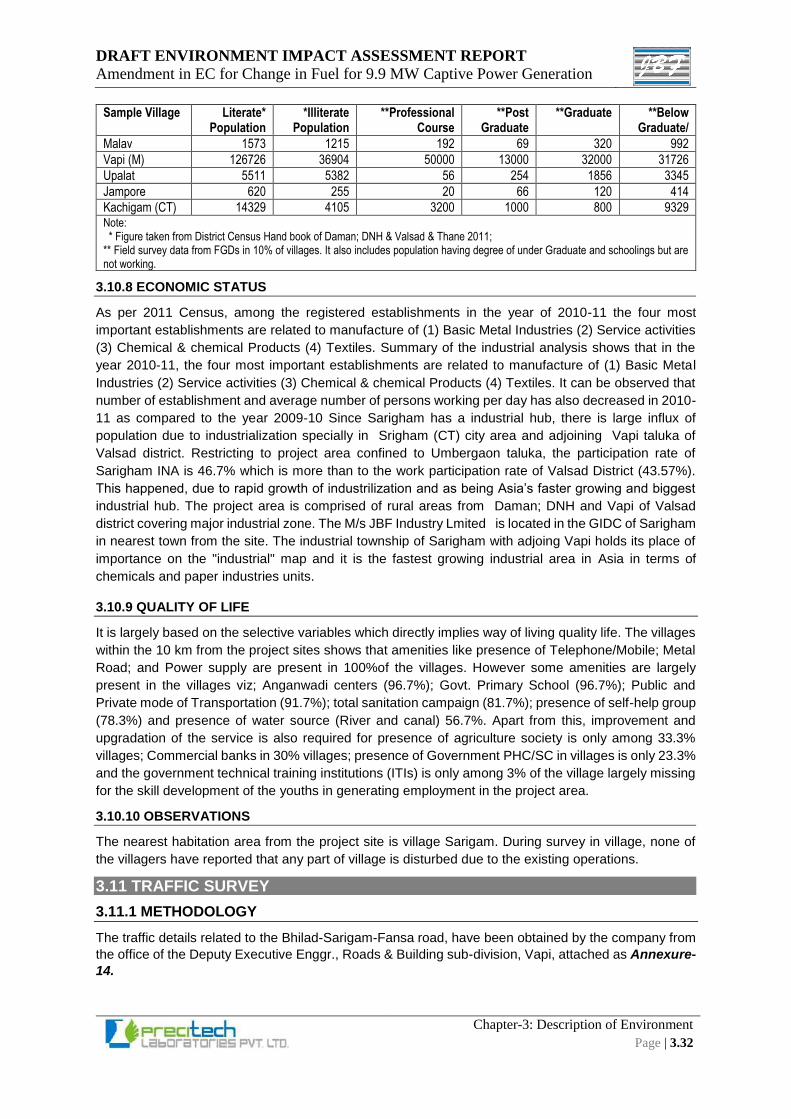
DRAFT ENVIRONMENT IMPACT ASSESSMENT REPORT
Amendment in EC for Change in Fuel for 9.9 MW Captive Power Generation
Chapter-3: Description of Environment
Page | 3.32
Sample Village Literate* Population
*Illiterate Population
**Professional Course
**Post Graduate
**Graduate **Below Graduate/
Malav 1573 1215 192 69 320 992
Vapi (M) 126726 36904 50000 13000 32000 31726
Upalat 5511 5382 56 254 1856 3345
Jampore 620 255 20 66 120 414
Kachigam (CT) 14329 4105 3200 1000 800 9329 Note: * Figure taken from District Census Hand book of Daman; DNH & Valsad & Thane 2011; ** Field survey data from FGDs in 10% of villages. It also includes population having degree of under Graduate and schoolings but are not working.
3.10.8 ECONOMIC STATUS
As per 2011 Census, among the registered establishments in the year of 2010-11 the four most
important establishments are related to manufacture of (1) Basic Metal Industries (2) Service activities
(3) Chemical & chemical Products (4) Textiles. Summary of the industrial analysis shows that in the
year 2010-11, the four most important establishments are related to manufacture of (1) Basic Metal
Industries (2) Service activities (3) Chemical & chemical Products (4) Textiles. It can be observed that
number of establishment and average number of persons working per day has also decreased in 2010-
11 as compared to the year 2009-10 Since Sarigham has a industrial hub, there is large influx of
population due to industrialization specially in Srigham (CT) city area and adjoining Vapi taluka of
Valsad district. Restricting to project area confined to Umbergaon taluka, the participation rate of
Sarigham INA is 46.7% which is more than to the work participation rate of Valsad District (43.57%).
This happened, due to rapid growth of industrilization and as being Asia’s faster growing and biggest
industrial hub. The project area is comprised of rural areas from Daman; DNH and Vapi of Valsad
district covering major industrial zone. The M/s JBF Industry Lmited is located in the GIDC of Sarigham
in nearest town from the site. The industrial township of Sarigham with adjoing Vapi holds its place of
importance on the "industrial" map and it is the fastest growing industrial area in Asia in terms of
chemicals and paper industries units.
3.10.9 QUALITY OF LIFE
It is largely based on the selective variables which directly implies way of living quality life. The villages
within the 10 km from the project sites shows that amenities like presence of Telephone/Mobile; Metal
Road; and Power supply are present in 100%of the villages. However some amenities are largely
present in the villages viz; Anganwadi centers (96.7%); Govt. Primary School (96.7%); Public and
Private mode of Transportation (91.7%); total sanitation campaign (81.7%); presence of self-help group
(78.3%) and presence of water source (River and canal) 56.7%. Apart from this, improvement and
upgradation of the service is also required for presence of agriculture society is only among 33.3%
villages; Commercial banks in 30% villages; presence of Government PHC/SC in villages is only 23.3%
and the government technical training institutions (ITIs) is only among 3% of the village largely missing
for the skill development of the youths in generating employment in the project area.
3.10.10 OBSERVATIONS
The nearest habitation area from the project site is village Sarigam. During survey in village, none of
the villagers have reported that any part of village is disturbed due to the existing operations.
3.11 TRAFFIC SURVEY
3.11.1 METHODOLOGY
The traffic details related to the Bhilad-Sarigam-Fansa road, have been obtained by the company from
the office of the Deputy Executive Enggr., Roads & Building sub-division, Vapi, attached as Annexure-
14.
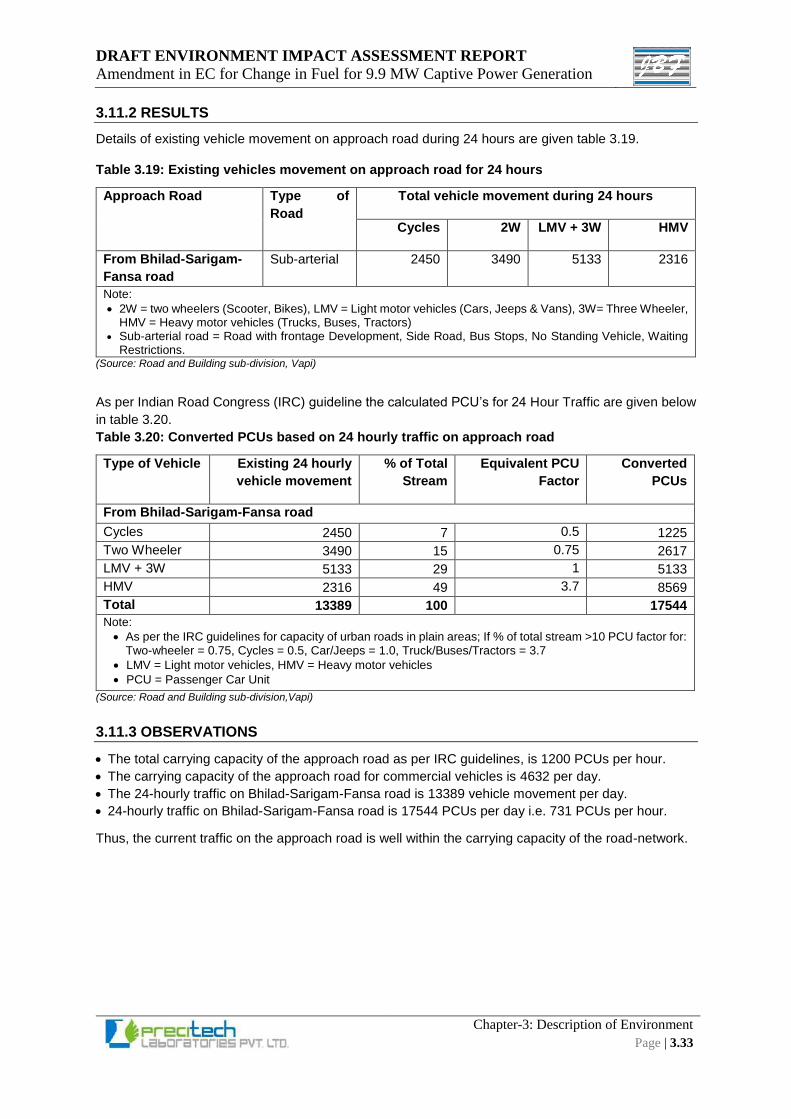
DRAFT ENVIRONMENT IMPACT ASSESSMENT REPORT
Amendment in EC for Change in Fuel for 9.9 MW Captive Power Generation
Chapter-3: Description of Environment
Page | 3.33
3.11.2 RESULTS
Details of existing vehicle movement on approach road during 24 hours are given table 3.19.
Table 3.19: Existing vehicles movement on approach road for 24 hours
Approach Road Type of
Road
Total vehicle movement during 24 hours
Cycles 2W LMV + 3W HMV
From Bhilad-Sarigam-
Fansa road
Sub-arterial 2450 3490 5133 2316
Note:
2W = two wheelers (Scooter, Bikes), LMV = Light motor vehicles (Cars, Jeeps & Vans), 3W= Three Wheeler, HMV = Heavy motor vehicles (Trucks, Buses, Tractors)
Sub-arterial road = Road with frontage Development, Side Road, Bus Stops, No Standing Vehicle, Waiting Restrictions.
(Source: Road and Building sub-division, Vapi)
As per Indian Road Congress (IRC) guideline the calculated PCU’s for 24 Hour Traffic are given below
in table 3.20.
Table 3.20: Converted PCUs based on 24 hourly traffic on approach road
Type of Vehicle Existing 24 hourly
vehicle movement
% of Total
Stream
Equivalent PCU
Factor
Converted
PCUs
From Bhilad-Sarigam-Fansa road
Cycles 2450 7 0.5 1225
Two Wheeler 3490 15 0.75 2617
LMV + 3W 5133 29 1 5133
HMV 2316 49 3.7 8569
Total 13389 100 17544
Note:
As per the IRC guidelines for capacity of urban roads in plain areas; If % of total stream >10 PCU factor for: Two-wheeler = 0.75, Cycles = 0.5, Car/Jeeps = 1.0, Truck/Buses/Tractors = 3.7
LMV = Light motor vehicles, HMV = Heavy motor vehicles
PCU = Passenger Car Unit
(Source: Road and Building sub-division,Vapi)
3.11.3 OBSERVATIONS
The total carrying capacity of the approach road as per IRC guidelines, is 1200 PCUs per hour.
The carrying capacity of the approach road for commercial vehicles is 4632 per day.
The 24-hourly traffic on Bhilad-Sarigam-Fansa road is 13389 vehicle movement per day.
24-hourly traffic on Bhilad-Sarigam-Fansa road is 17544 PCUs per day i.e. 731 PCUs per hour.
Thus, the current traffic on the approach road is well within the carrying capacity of the road-network.
DRAFT ENVIRONMENT IMPACT ASSESSMENT REPORT
Amendment in EC for Change in Fuel for 9.9 MW Captive Power Generation
Chapter-4: Anticipated Impacts & Mitigation
Measures
Page | 4.1
4. Anticipated Environmental Impacts & Mitigation
Measures 4.1 PRELUDE
The Environmental Impact Assessment task starts with identification, prediction and evaluation of
impacts on the environment due to the proposed project. These involve objective and subjective
assessment of the project components, environmental attributes and their interrelationships. The
main aim of conducting impact assessment is to establish sustainability of project by ensuring
efficient mitigation measures for identified & predicted impacts. The objective is to include these
mitigation measures in the design engineering phase of the proposed project in order to minimise or
eliminate the impacts on the environment.
The main procedural steps can be summarized as follows:
Identification
This involves identification of the major activities, the environmental attributes, the impacts of
the proposed activities on the environmental attributes and formulation of ‘cause & effect’
matrix.
Prediction
This involves prediction of the nature, magnitude and significance of the impacts.
Evaluation
This involves assessment and designation of the significance to the impacts, which helps
deriving decision on implementation of the mitigation measures for the anticipated impacts
due to the project.
Communication
This allows for the communication of activities under the proposed project, their impacts, nature,
significance, & magnitude of impacts and proposed/ suggested alleviating measures for all
probable/ possible negative impacts among:
a) The project proponent;
b) The regulatory agencies;
c) All stakeholders and interest groups through public consultation, if applicable.
During the present study, the overall impacts of the project on various environmental attributes has
been identified, predicted and evaluated, in line with the MoEF&CC guidelines on EIA study and the
same has been presented in the successive discussions.
4.2 IDENTIFICATION OF IMPACTING ACTIVITIES
In the inception of impact assessment stage of present study, proposed activities & components
which can have probable impacts, have been identified from the project description. For ease of
study, the activities have been distributed in four main phases of the proposed project viz.
Construction & commissioning phase, Operation phase, Decommissioning phase and Natural
calamities. The activities are then categorised under the relevant phase. It is noted that proposed
plant site is in seismic zone-3 (moderate zone) & flood zone. Tsunami & cyclones are not observed in
study area. The details of the identified impacting activities & components of the construction &
commissioning and operation phases are tabulated in table 4.1.
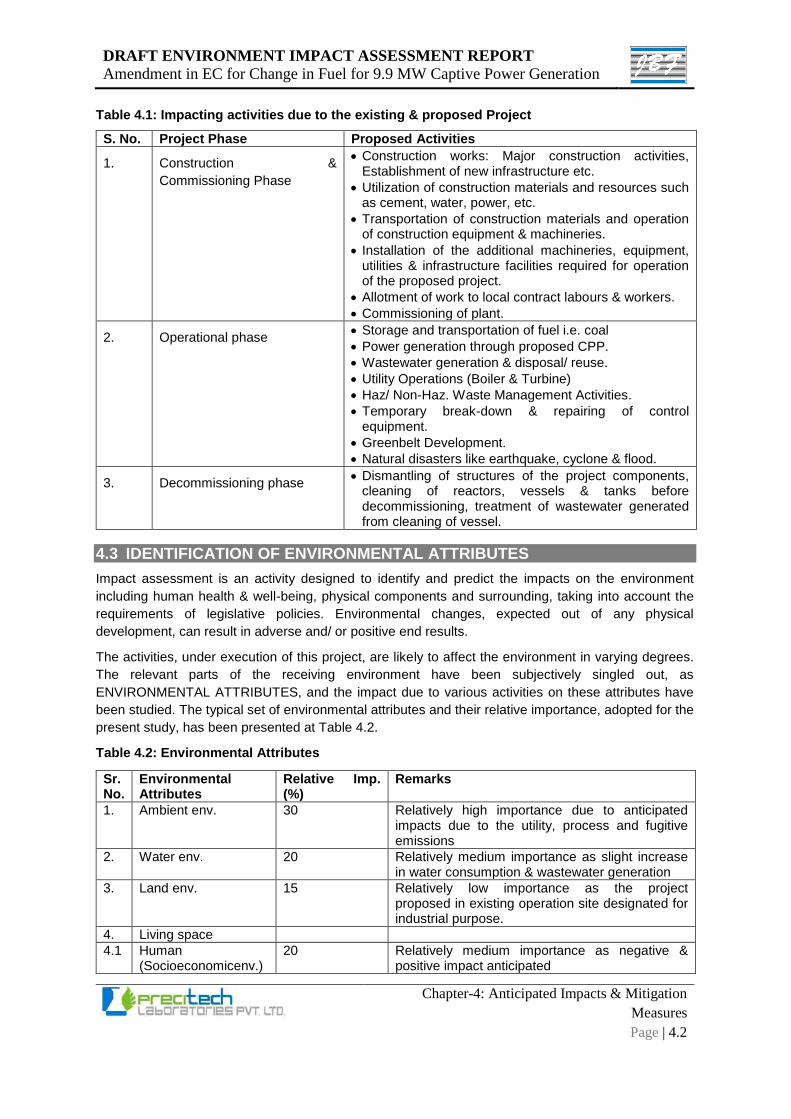
DRAFT ENVIRONMENT IMPACT ASSESSMENT REPORT
Amendment in EC for Change in Fuel for 9.9 MW Captive Power Generation
Chapter-4: Anticipated Impacts & Mitigation
Measures
Page | 4.2
Table 4.1: Impacting activities due to the existing & proposed Project
S. No. Project Phase Proposed Activities
1. Construction &
Commissioning Phase
Construction works: Major construction activities, Establishment of new infrastructure etc.
Utilization of construction materials and resources such as cement, water, power, etc.
Transportation of construction materials and operation of construction equipment & machineries.
Installation of the additional machineries, equipment, utilities & infrastructure facilities required for operation of the proposed project.
Allotment of work to local contract labours & workers.
Commissioning of plant.
2. Operational phase Storage and transportation of fuel i.e. coal
Power generation through proposed CPP.
Wastewater generation & disposal/ reuse.
Utility Operations (Boiler & Turbine)
Haz/ Non-Haz. Waste Management Activities.
Temporary break-down & repairing of control equipment.
Greenbelt Development.
Natural disasters like earthquake, cyclone & flood.
3. Decommissioning phase Dismantling of structures of the project components,
cleaning of reactors, vessels & tanks before decommissioning, treatment of wastewater generated from cleaning of vessel.
4.3 IDENTIFICATION OF ENVIRONMENTAL ATTRIBUTES
Impact assessment is an activity designed to identify and predict the impacts on the environment
including human health & well-being, physical components and surrounding, taking into account the
requirements of legislative policies. Environmental changes, expected out of any physical
development, can result in adverse and/ or positive end results.
The activities, under execution of this project, are likely to affect the environment in varying degrees.
The relevant parts of the receiving environment have been subjectively singled out, as
ENVIRONMENTAL ATTRIBUTES, and the impact due to various activities on these attributes have
been studied. The typical set of environmental attributes and their relative importance, adopted for the
present study, has been presented at Table 4.2.
Table 4.2: Environmental Attributes
Sr. No.
Environmental Attributes
Relative Imp. (%)
Remarks
1. Ambient env. 30 Relatively high importance due to anticipated impacts due to the utility, process and fugitive emissions
2. Water env. 20 Relatively medium importance as slight increase in water consumption & wastewater generation
3. Land env. 15 Relatively low importance as the project proposed in existing operation site designated for industrial purpose.
4. Living space
4.1 Human (Socioeconomicenv.)
20 Relatively medium importance as negative & positive impact anticipated
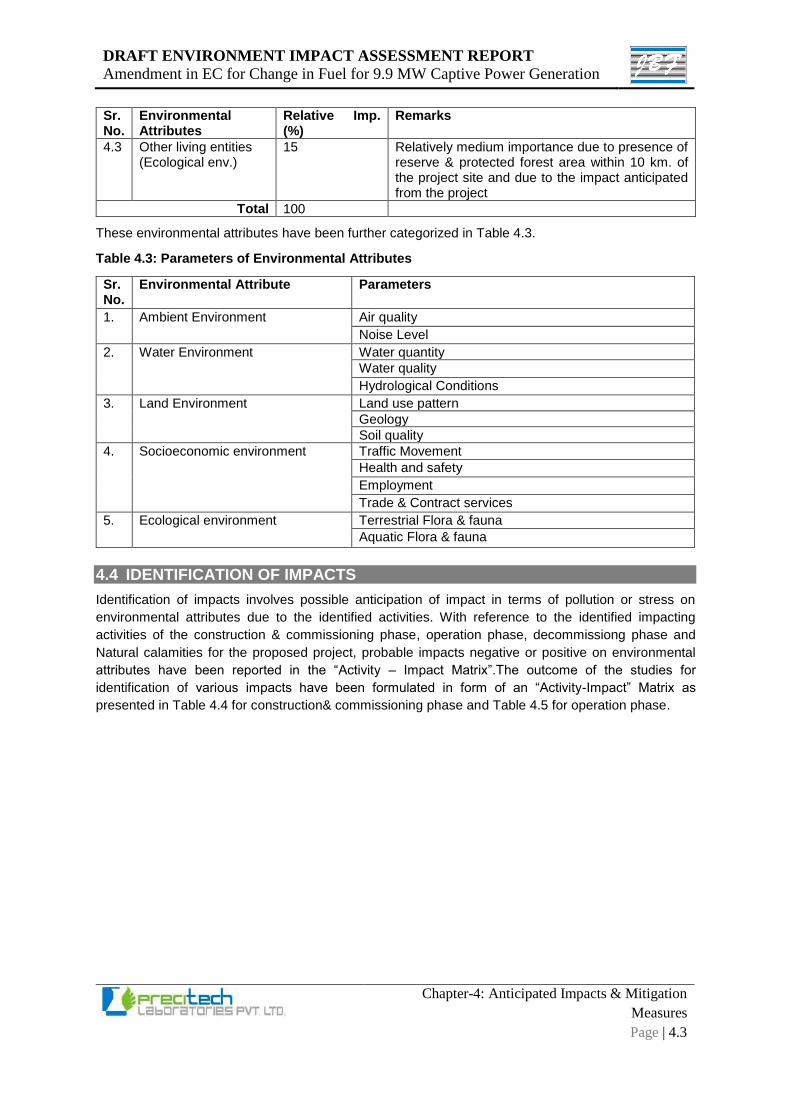
DRAFT ENVIRONMENT IMPACT ASSESSMENT REPORT
Amendment in EC for Change in Fuel for 9.9 MW Captive Power Generation
Chapter-4: Anticipated Impacts & Mitigation
Measures
Page | 4.3
Sr. No.
Environmental Attributes
Relative Imp. (%)
Remarks
4.3 Other living entities (Ecological env.)
15 Relatively medium importance due to presence of reserve & protected forest area within 10 km. of the project site and due to the impact anticipated from the project
Total 100
These environmental attributes have been further categorized in Table 4.3.
Table 4.3: Parameters of Environmental Attributes
Sr. No.
Environmental Attribute
Parameters
1. Ambient Environment Air quality
Noise Level
2. Water Environment Water quantity
Water quality
Hydrological Conditions
3. Land Environment Land use pattern
Geology
Soil quality
4. Socioeconomic environment Traffic Movement
Health and safety
Employment
Trade & Contract services
5. Ecological environment Terrestrial Flora & fauna
Aquatic Flora & fauna
4.4 IDENTIFICATION OF IMPACTS
Identification of impacts involves possible anticipation of impact in terms of pollution or stress on
environmental attributes due to the identified activities. With reference to the identified impacting
activities of the construction & commissioning phase, operation phase, decommissiong phase and
Natural calamities for the proposed project, probable impacts negative or positive on environmental
attributes have been reported in the “Activity – Impact Matrix”.The outcome of the studies for
identification of various impacts have been formulated in form of an “Activity-Impact” Matrix as
presented in Table 4.4 for construction& commissioning phase and Table 4.5 for operation phase.
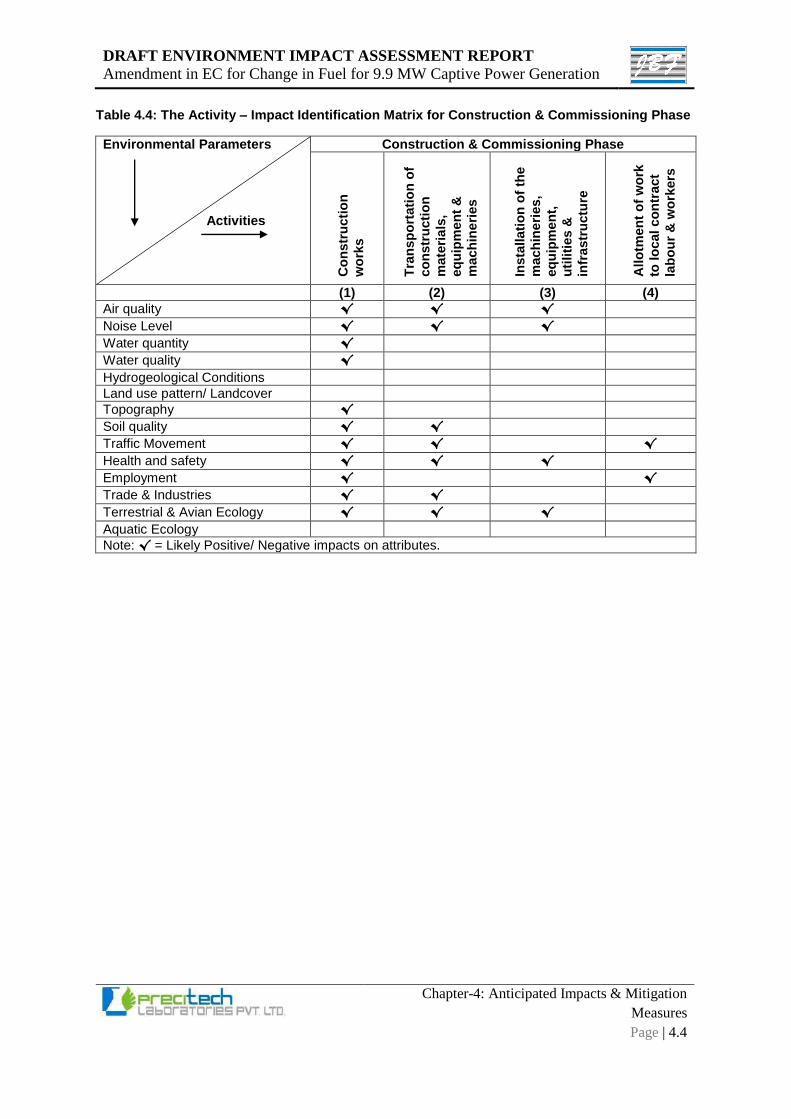
DRAFT ENVIRONMENT IMPACT ASSESSMENT REPORT
Amendment in EC for Change in Fuel for 9.9 MW Captive Power Generation
Chapter-4: Anticipated Impacts & Mitigation
Measures
Page | 4.4
Table 4.4: The Activity – Impact Identification Matrix for Construction & Commissioning Phase
Environmental Parameters Activities
Construction & Commissioning Phase
Co
nstr
ucti
on
wo
rks
Tra
nsp
ort
ati
on
of
co
nstr
ucti
on
mate
ria
ls,
eq
uip
men
t &
mach
ine
ries
Insta
llati
on
of
the
mach
ine
ries
,
eq
uip
men
t,
uti
liti
es &
infr
astr
uctu
re
Allo
tmen
t o
f w
ork
to lo
cal co
ntr
act
lab
ou
r &
wo
rkers
(1) (2) (3) (4)
Air quality √ √ √
Noise Level √ √ √
Water quantity √
Water quality √
Hydrogeological Conditions
Land use pattern/ Landcover
Topography √
Soil quality √ √
Traffic Movement √ √ √
Health and safety √ √ √
Employment √ √
Trade & Industries √ √
Terrestrial & Avian Ecology √ √ √
Aquatic Ecology
Note: √ = Likely Positive/ Negative impacts on attributes.
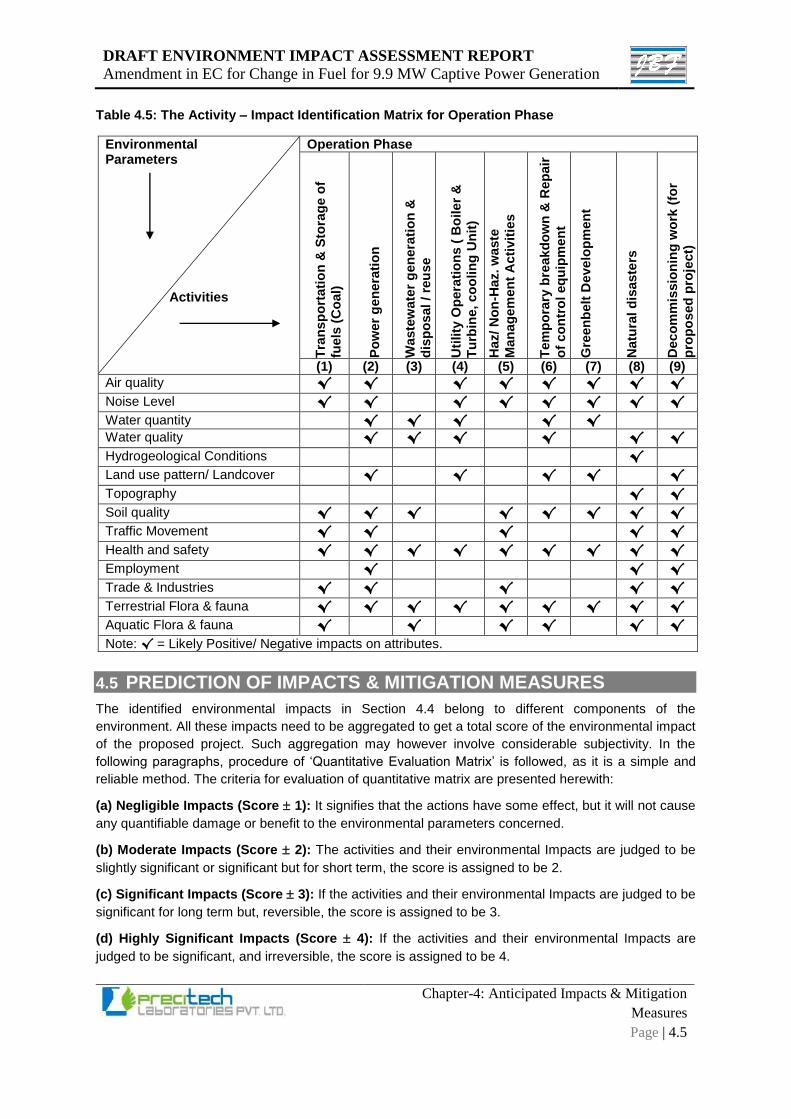
DRAFT ENVIRONMENT IMPACT ASSESSMENT REPORT
Amendment in EC for Change in Fuel for 9.9 MW Captive Power Generation
Chapter-4: Anticipated Impacts & Mitigation
Measures
Page | 4.5
Table 4.5: The Activity – Impact Identification Matrix for Operation Phase
Environmental Parameters
Activities
Operation Phase
Tra
nsp
ort
ati
on
& S
tora
ge
of
fuels
(C
oal)
Po
wer
gen
era
tio
n
Waste
wate
r g
en
era
tio
n &
dis
po
sal /
reu
se
Uti
lity
Op
era
tio
ns (
Bo
ile
r &
Tu
rbin
e, co
olin
g U
nit
)
Haz/ N
on
-Haz. w
aste
Man
ag
em
en
t A
cti
vit
ies
Tem
po
rary
bre
akd
ow
n &
Rep
air
of
co
ntr
ol eq
uip
men
t
Gre
en
belt
Deve
lop
men
t
Natu
ral d
isaste
rs
Deco
mm
issio
nin
g w
ork
(fo
r
pro
po
sed
pro
ject)
(1) (2) (3) (4) (5) (6) (7) (8) (9)
Air quality √ √ √ √ √ √ √ √ Noise Level √ √ √ √ √ √ √ √ Water quantity √ √ √ √ √
Water quality √ √ √ √ √ √
Hydrogeological Conditions √
Land use pattern/ Landcover √ √ √ √ √
Topography √ √
Soil quality √ √ √ √ √ √ √ √ Traffic Movement √ √ √ √ √ Health and safety √ √ √ √ √ √ √ √ √ Employment √ √ √
Trade & Industries √ √ √ √ √ Terrestrial Flora & fauna √ √ √ √ √ √ √ √ √ Aquatic Flora & fauna √ √ √ √ √ √ Note: √ = Likely Positive/ Negative impacts on attributes.
4.5 PREDICTION OF IMPACTS & MITIGATION MEASURES
The identified environmental impacts in Section 4.4 belong to different components of the
environment. All these impacts need to be aggregated to get a total score of the environmental impact
of the proposed project. Such aggregation may however involve considerable subjectivity. In the
following paragraphs, procedure of ‘Quantitative Evaluation Matrix’ is followed, as it is a simple and
reliable method. The criteria for evaluation of quantitative matrix are presented herewith:
(a) Negligible Impacts (Score 1): It signifies that the actions have some effect, but it will not cause
any quantifiable damage or benefit to the environmental parameters concerned.
(b) Moderate Impacts (Score 2): The activities and their environmental Impacts are judged to be
slightly significant or significant but for short term, the score is assigned to be 2.
(c) Significant Impacts (Score 3): If the activities and their environmental Impacts are judged to be
significant for long term but, reversible, the score is assigned to be 3.
(d) Highly Significant Impacts (Score 4): If the activities and their environmental Impacts are
judged to be significant, and irreversible, the score is assigned to be 4.
DRAFT ENVIRONMENT IMPACT ASSESSMENT REPORT
Amendment in EC for Change in Fuel for 9.9 MW Captive Power Generation
Chapter-4: Anticipated Impacts & Mitigation
Measures
Page | 4.6
The (+) sign signifies positive impact and (-) sign signifies negative impact on the concerned
environmental attributes. The environmental impact evaluation matrix, for the proposed project,
without any mitigation measures and with the proposed mitigation measure for all the adverse
impacts, have been formulated in subsequent sections. Their respective cumulative impact matrices
are presented at Table 4.23 & Table 4.24.
An attempt has been made to predict the significance and magnitude of the identified impacts using
logical reasoning and available scientific knowledge. Use of mathematical tools/ models has also
been made wherever possible.
The attribute wise details of the task of prediction of the significance and magnitude of the identified
impacts are presented in subsequent sections.
4.5.1 AMBIENT ENVIRONMENT
Air quality & noise are attributes of ambient environment.
4.5.1.1 Ambient Air Environment
There will be no process emissions due to proposed amendment project as it is a project for
amendment in EC conditions for existing polyester chips manufacturing plant for change in fuel for 9.9
MW captive power generation.
There will be no process emission from the proposed project, hence impacts due to process
emission is not anticipated from proposed project.
Fugitive emissions are likely to occur mainly during transportation, handling and storage of the
Coal, limestone & fly ash.
Stacks connected to steam boilers would emit PM, SO2 and NOx emissions (single point
sources) due to burning of Coal as fuel.
To evaluate the probable impacts of emission on air quality, modelling was conducted using the
ISCST3 model for stack emissions from the plant and separately for emissions due to transportation
of raw materials, products & fuel. The air dispersion modelling is attaches as Annexure-15.
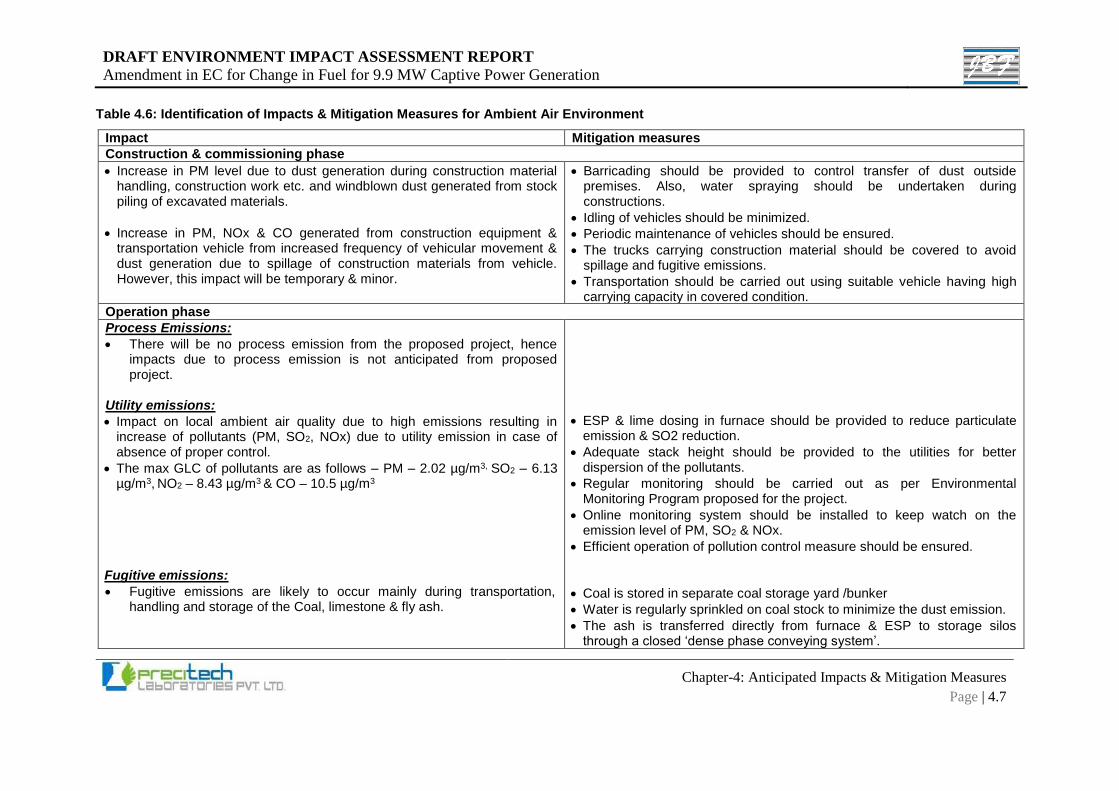
DRAFT ENVIRONMENT IMPACT ASSESSMENT REPORT
Amendment in EC for Change in Fuel for 9.9 MW Captive Power Generation
Chapter-4: Anticipated Impacts & Mitigation Measures
Page | 4.7
Table 4.6: Identification of Impacts & Mitigation Measures for Ambient Air Environment
Impact Mitigation measures
Construction & commissioning phase
Increase in PM level due to dust generation during construction material handling, construction work etc. and windblown dust generated from stock piling of excavated materials.
Increase in PM, NOx & CO generated from construction equipment & transportation vehicle from increased frequency of vehicular movement & dust generation due to spillage of construction materials from vehicle. However, this impact will be temporary & minor.
Barricading should be provided to control transfer of dust outside premises. Also, water spraying should be undertaken during constructions.
Idling of vehicles should be minimized.
Periodic maintenance of vehicles should be ensured.
The trucks carrying construction material should be covered to avoid spillage and fugitive emissions.
Transportation should be carried out using suitable vehicle having high carrying capacity in covered condition.
Operation phase
Process Emissions:
There will be no process emission from the proposed project, hence impacts due to process emission is not anticipated from proposed project.
Utility emissions:
Impact on local ambient air quality due to high emissions resulting in increase of pollutants (PM, SO2, NOx) due to utility emission in case of absence of proper control.
The max GLC of pollutants are as follows – PM – 2.02 µg/m3, SO2 – 6.13 µg/m3, NO2 – 8.43 µg/m3 & CO – 10.5 µg/m3
Fugitive emissions:
Fugitive emissions are likely to occur mainly during transportation, handling and storage of the Coal, limestone & fly ash.
ESP & lime dosing in furnace should be provided to reduce particulate emission & SO2 reduction.
Adequate stack height should be provided to the utilities for better dispersion of the pollutants.
Regular monitoring should be carried out as per Environmental Monitoring Program proposed for the project.
Online monitoring system should be installed to keep watch on the emission level of PM, SO2 & NOx.
Efficient operation of pollution control measure should be ensured.
Coal is stored in separate coal storage yard /bunker
Water is regularly sprinkled on coal stock to minimize the dust emission.
The ash is transferred directly from furnace & ESP to storage silos through a closed ‘dense phase conveying system’.
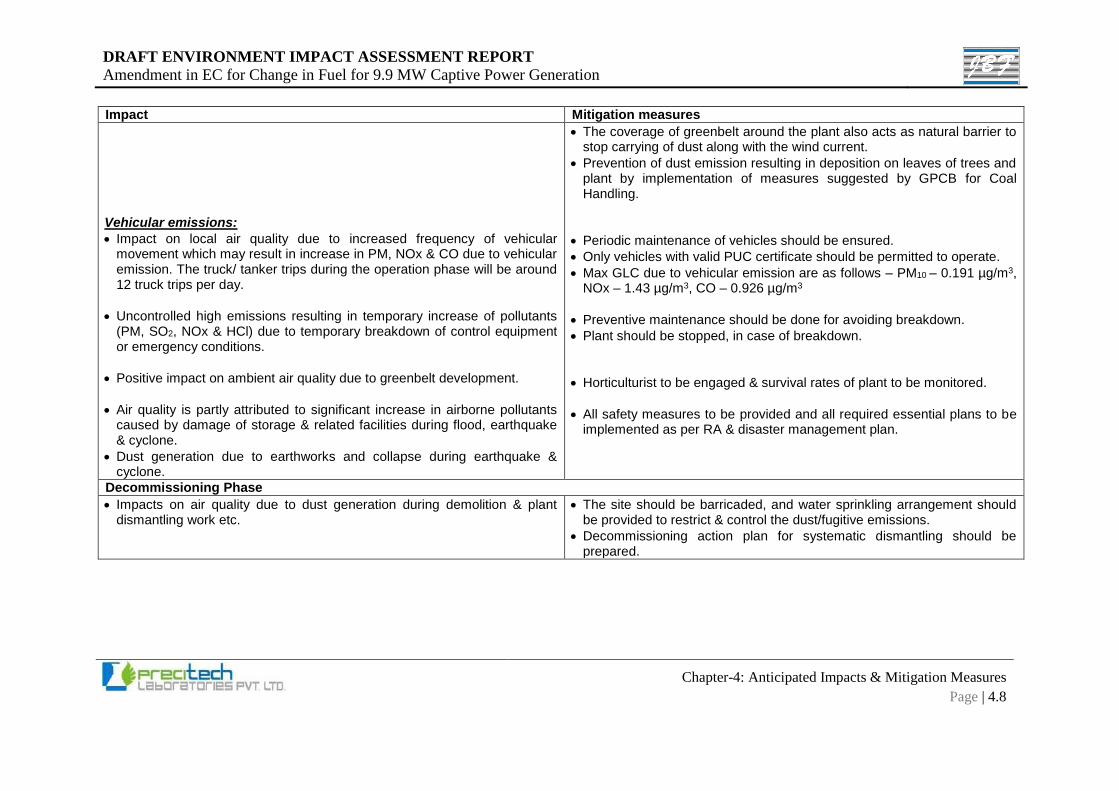
DRAFT ENVIRONMENT IMPACT ASSESSMENT REPORT
Amendment in EC for Change in Fuel for 9.9 MW Captive Power Generation
Chapter-4: Anticipated Impacts & Mitigation Measures
Page | 4.8
Impact Mitigation measures
Vehicular emissions:
Impact on local air quality due to increased frequency of vehicular movement which may result in increase in PM, NOx & CO due to vehicular emission. The truck/ tanker trips during the operation phase will be around 12 truck trips per day.
Uncontrolled high emissions resulting in temporary increase of pollutants (PM, SO2, NOx & HCl) due to temporary breakdown of control equipment or emergency conditions.
Positive impact on ambient air quality due to greenbelt development.
Air quality is partly attributed to significant increase in airborne pollutants caused by damage of storage & related facilities during flood, earthquake & cyclone.
Dust generation due to earthworks and collapse during earthquake & cyclone.
The coverage of greenbelt around the plant also acts as natural barrier to stop carrying of dust along with the wind current.
Prevention of dust emission resulting in deposition on leaves of trees and plant by implementation of measures suggested by GPCB for Coal Handling.
Periodic maintenance of vehicles should be ensured.
Only vehicles with valid PUC certificate should be permitted to operate.
Max GLC due to vehicular emission are as follows – PM10 – 0.191 µg/m3, NOx – 1.43 µg/m3, CO – 0.926 µg/m3
Preventive maintenance should be done for avoiding breakdown.
Plant should be stopped, in case of breakdown.
Horticulturist to be engaged & survival rates of plant to be monitored.
All safety measures to be provided and all required essential plans to be implemented as per RA & disaster management plan.
Decommissioning Phase
Impacts on air quality due to dust generation during demolition & plant dismantling work etc.
The site should be barricaded, and water sprinkling arrangement should be provided to restrict & control the dust/fugitive emissions.
Decommissioning action plan for systematic dismantling should be prepared.
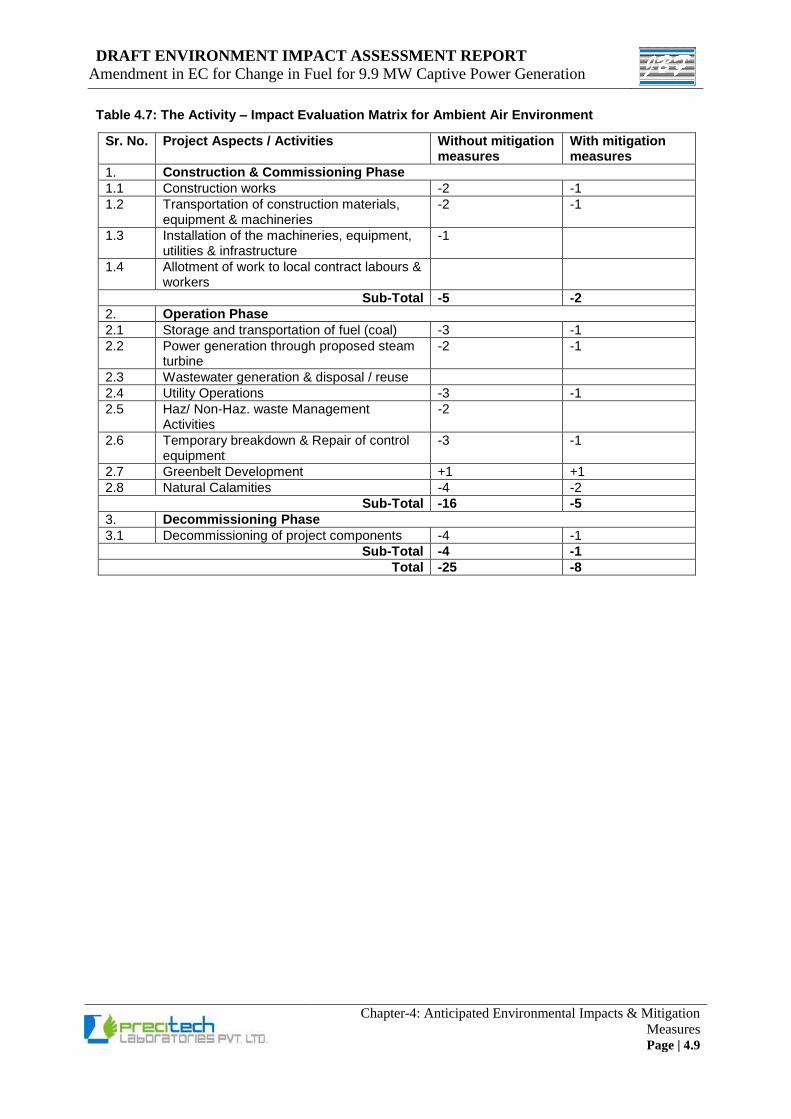
DRAFT ENVIRONMENT IMPACT ASSESSMENT REPORT
Amendment in EC for Change in Fuel for 9.9 MW Captive Power Generation
Chapter-4: Anticipated Environmental Impacts & Mitigation
Measures Page | 4.9
Table 4.7: The Activity – Impact Evaluation Matrix for Ambient Air Environment
Sr. No. Project Aspects / Activities Without mitigation measures
With mitigation measures
1. Construction & Commissioning Phase
1.1 Construction works -2 -1
1.2 Transportation of construction materials, equipment & machineries
-2 -1
1.3 Installation of the machineries, equipment, utilities & infrastructure
-1
1.4 Allotment of work to local contract labours & workers
Sub-Total -5 -2
2. Operation Phase
2.1 Storage and transportation of fuel (coal) -3 -1
2.2 Power generation through proposed steam turbine
-2 -1
2.3 Wastewater generation & disposal / reuse
2.4 Utility Operations -3 -1
2.5 Haz/ Non-Haz. waste Management Activities
-2
2.6 Temporary breakdown & Repair of control equipment
-3 -1
2.7 Greenbelt Development +1 +1
2.8 Natural Calamities -4 -2
Sub-Total -16 -5
3. Decommissioning Phase
3.1 Decommissioning of project components -4 -1
Sub-Total -4 -1
Total -25 -8
DRAFT ENVIRONMENT IMPACT ASSESSMENT REPORT
Amendment in EC for Change in Fuel for 9.9 MW Captive Power Generation
Chapter-4: Anticipated Environmental Impacts & Mitigation
Measures Page | 4.10
4.5.1.2 NOISE LEVEL
The proposed project involves high noise generation source which are Boiler, ID fan, Steam turbine,
air compressor, Transformer& cooling towers. Noise level generation would be limited to 85 dB(A)
within plant.
Noise modelling study has been done using the software tool dhwaniPRO®. It is a computer program
developed to undertake industrial and traffic noise propagation studies for which an environmental
noise assessment may be required.
It predicts the noise levels at various receptor points due to the sources present at the project site.
Various sources of noise have been added with their Sound Pressure Levels (SPLs) and the ‘receptor
points’ have been added at various locations where noise monitoring was conducted.
An attempt has been made to model the likely impacts of noise generating sources on the noise
environment in the modelling report attached as Annexure-16.
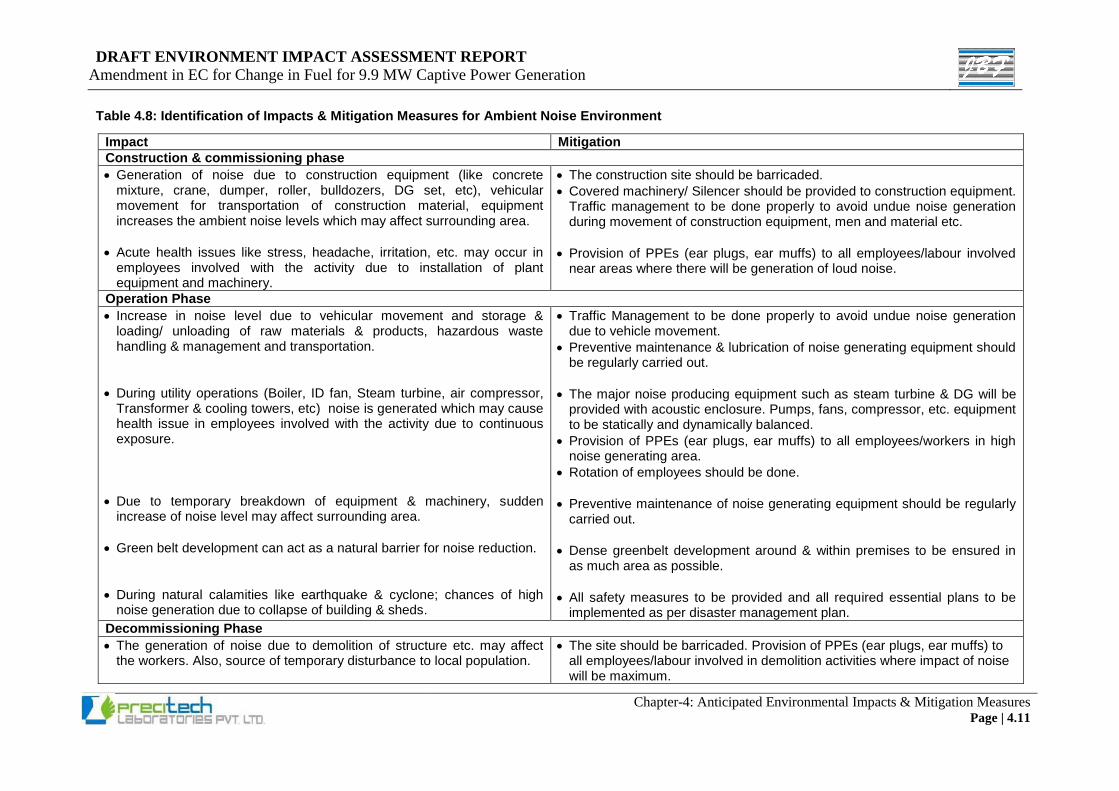
DRAFT ENVIRONMENT IMPACT ASSESSMENT REPORT
Amendment in EC for Change in Fuel for 9.9 MW Captive Power Generation
Chapter-4: Anticipated Environmental Impacts & Mitigation Measures Page | 4.11
Table 4.8: Identification of Impacts & Mitigation Measures for Ambient Noise Environment
Impact Mitigation
Construction & commissioning phase
Generation of noise due to construction equipment (like concrete mixture, crane, dumper, roller, bulldozers, DG set, etc), vehicular movement for transportation of construction material, equipment increases the ambient noise levels which may affect surrounding area.
Acute health issues like stress, headache, irritation, etc. may occur in employees involved with the activity due to installation of plant equipment and machinery.
The construction site should be barricaded.
Covered machinery/ Silencer should be provided to construction equipment. Traffic management to be done properly to avoid undue noise generation during movement of construction equipment, men and material etc.
Provision of PPEs (ear plugs, ear muffs) to all employees/labour involved near areas where there will be generation of loud noise.
Operation Phase
Increase in noise level due to vehicular movement and storage & loading/ unloading of raw materials & products, hazardous waste handling & management and transportation.
During utility operations (Boiler, ID fan, Steam turbine, air compressor, Transformer & cooling towers, etc) noise is generated which may cause health issue in employees involved with the activity due to continuous exposure.
Due to temporary breakdown of equipment & machinery, sudden increase of noise level may affect surrounding area.
Green belt development can act as a natural barrier for noise reduction.
During natural calamities like earthquake & cyclone; chances of high noise generation due to collapse of building & sheds.
Traffic Management to be done properly to avoid undue noise generation due to vehicle movement.
Preventive maintenance & lubrication of noise generating equipment should be regularly carried out.
The major noise producing equipment such as steam turbine & DG will be provided with acoustic enclosure. Pumps, fans, compressor, etc. equipment to be statically and dynamically balanced.
Provision of PPEs (ear plugs, ear muffs) to all employees/workers in high noise generating area.
Rotation of employees should be done.
Preventive maintenance of noise generating equipment should be regularly carried out.
Dense greenbelt development around & within premises to be ensured in as much area as possible.
All safety measures to be provided and all required essential plans to be implemented as per disaster management plan.
Decommissioning Phase
The generation of noise due to demolition of structure etc. may affect the workers. Also, source of temporary disturbance to local population.
The site should be barricaded. Provision of PPEs (ear plugs, ear muffs) to all employees/labour involved in demolition activities where impact of noise will be maximum.
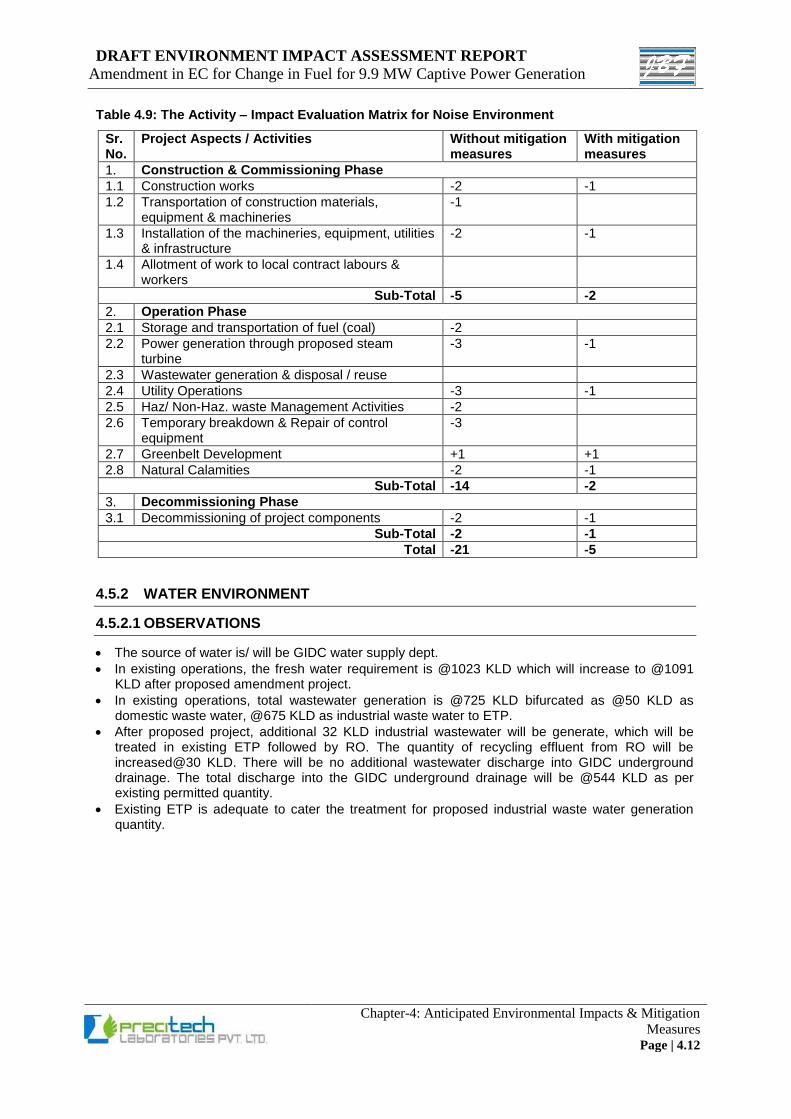
DRAFT ENVIRONMENT IMPACT ASSESSMENT REPORT
Amendment in EC for Change in Fuel for 9.9 MW Captive Power Generation
Chapter-4: Anticipated Environmental Impacts & Mitigation
Measures Page | 4.12
Table 4.9: The Activity – Impact Evaluation Matrix for Noise Environment
Sr. No.
Project Aspects / Activities Without mitigation measures
With mitigation measures
1. Construction & Commissioning Phase
1.1 Construction works -2 -1
1.2 Transportation of construction materials, equipment & machineries
-1
1.3 Installation of the machineries, equipment, utilities & infrastructure
-2 -1
1.4 Allotment of work to local contract labours & workers
Sub-Total -5 -2
2. Operation Phase
2.1 Storage and transportation of fuel (coal) -2
2.2 Power generation through proposed steam turbine
-3 -1
2.3 Wastewater generation & disposal / reuse
2.4 Utility Operations -3 -1
2.5 Haz/ Non-Haz. waste Management Activities -2
2.6 Temporary breakdown & Repair of control equipment
-3
2.7 Greenbelt Development +1 +1
2.8 Natural Calamities -2 -1
Sub-Total -14 -2
3. Decommissioning Phase
3.1 Decommissioning of project components -2 -1
Sub-Total -2 -1
Total -21 -5
4.5.2 WATER ENVIRONMENT
4.5.2.1 OBSERVATIONS
The source of water is/ will be GIDC water supply dept.
In existing operations, the fresh water requirement is @1023 KLD which will increase to @1091 KLD after proposed amendment project.
In existing operations, total wastewater generation is @725 KLD bifurcated as @50 KLD as domestic waste water, @675 KLD as industrial waste water to ETP.
After proposed project, additional 32 KLD industrial wastewater will be generate, which will be treated in existing ETP followed by RO. The quantity of recycling effluent from RO will be increased@30 KLD. There will be no additional wastewater discharge into GIDC underground drainage. The total discharge into the GIDC underground drainage will be @544 KLD as per existing permitted quantity.
Existing ETP is adequate to cater the treatment for proposed industrial waste water generation quantity.
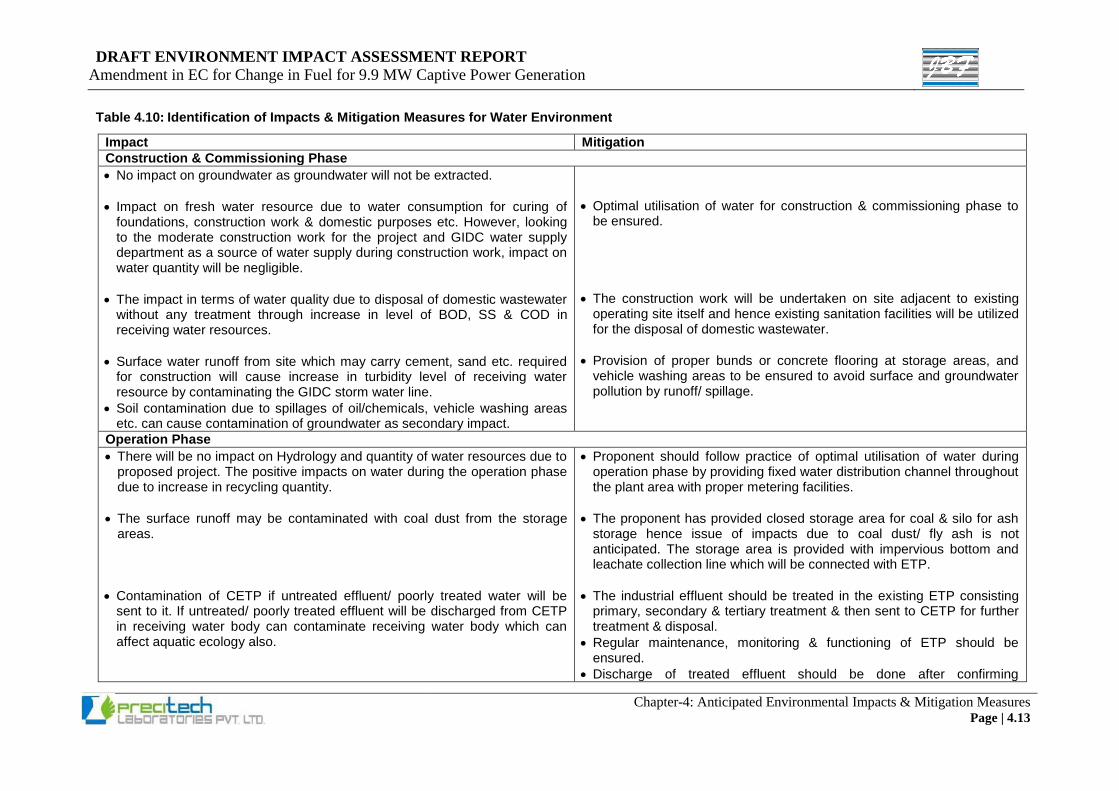
DRAFT ENVIRONMENT IMPACT ASSESSMENT REPORT
Amendment in EC for Change in Fuel for 9.9 MW Captive Power Generation
Chapter-4: Anticipated Environmental Impacts & Mitigation Measures Page | 4.13
Table 4.10: Identification of Impacts & Mitigation Measures for Water Environment
Impact Mitigation
Construction & Commissioning Phase
No impact on groundwater as groundwater will not be extracted.
Impact on fresh water resource due to water consumption for curing of foundations, construction work & domestic purposes etc. However, looking to the moderate construction work for the project and GIDC water supply department as a source of water supply during construction work, impact on water quantity will be negligible.
The impact in terms of water quality due to disposal of domestic wastewater without any treatment through increase in level of BOD, SS & COD in receiving water resources.
Surface water runoff from site which may carry cement, sand etc. required for construction will cause increase in turbidity level of receiving water resource by contaminating the GIDC storm water line.
Soil contamination due to spillages of oil/chemicals, vehicle washing areas etc. can cause contamination of groundwater as secondary impact.
Optimal utilisation of water for construction & commissioning phase to be ensured.
The construction work will be undertaken on site adjacent to existing operating site itself and hence existing sanitation facilities will be utilized for the disposal of domestic wastewater.
Provision of proper bunds or concrete flooring at storage areas, and vehicle washing areas to be ensured to avoid surface and groundwater pollution by runoff/ spillage.
Operation Phase
There will be no impact on Hydrology and quantity of water resources due to proposed project. The positive impacts on water during the operation phase due to increase in recycling quantity.
The surface runoff may be contaminated with coal dust from the storage areas.
Contamination of CETP if untreated effluent/ poorly treated water will be sent to it. If untreated/ poorly treated effluent will be discharged from CETP in receiving water body can contaminate receiving water body which can affect aquatic ecology also.
Proponent should follow practice of optimal utilisation of water during operation phase by providing fixed water distribution channel throughout the plant area with proper metering facilities.
The proponent has provided closed storage area for coal & silo for ash storage hence issue of impacts due to coal dust/ fly ash is not anticipated. The storage area is provided with impervious bottom and leachate collection line which will be connected with ETP.
The industrial effluent should be treated in the existing ETP consisting primary, secondary & tertiary treatment & then sent to CETP for further treatment & disposal.
Regular maintenance, monitoring & functioning of ETP should be ensured.
Discharge of treated effluent should be done after confirming
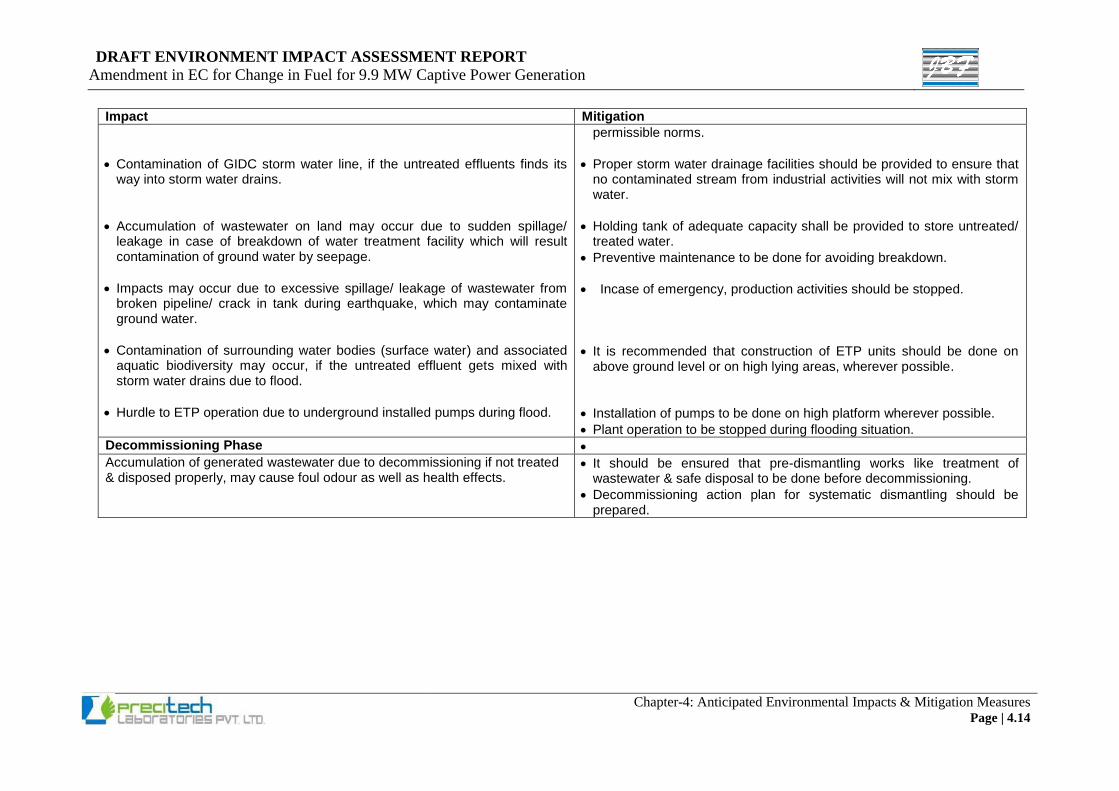
DRAFT ENVIRONMENT IMPACT ASSESSMENT REPORT
Amendment in EC for Change in Fuel for 9.9 MW Captive Power Generation
Chapter-4: Anticipated Environmental Impacts & Mitigation Measures Page | 4.14
Impact Mitigation
Contamination of GIDC storm water line, if the untreated effluents finds its way into storm water drains.
Accumulation of wastewater on land may occur due to sudden spillage/ leakage in case of breakdown of water treatment facility which will result contamination of ground water by seepage.
Impacts may occur due to excessive spillage/ leakage of wastewater from broken pipeline/ crack in tank during earthquake, which may contaminate ground water.
Contamination of surrounding water bodies (surface water) and associated aquatic biodiversity may occur, if the untreated effluent gets mixed with storm water drains due to flood.
Hurdle to ETP operation due to underground installed pumps during flood.
permissible norms.
Proper storm water drainage facilities should be provided to ensure that no contaminated stream from industrial activities will not mix with storm water.
Holding tank of adequate capacity shall be provided to store untreated/ treated water.
Preventive maintenance to be done for avoiding breakdown.
Incase of emergency, production activities should be stopped.
It is recommended that construction of ETP units should be done on above ground level or on high lying areas, wherever possible.
Installation of pumps to be done on high platform wherever possible.
Plant operation to be stopped during flooding situation.
Decommissioning Phase
Accumulation of generated wastewater due to decommissioning if not treated & disposed properly, may cause foul odour as well as health effects.
It should be ensured that pre-dismantling works like treatment of wastewater & safe disposal to be done before decommissioning.
Decommissioning action plan for systematic dismantling should be prepared.
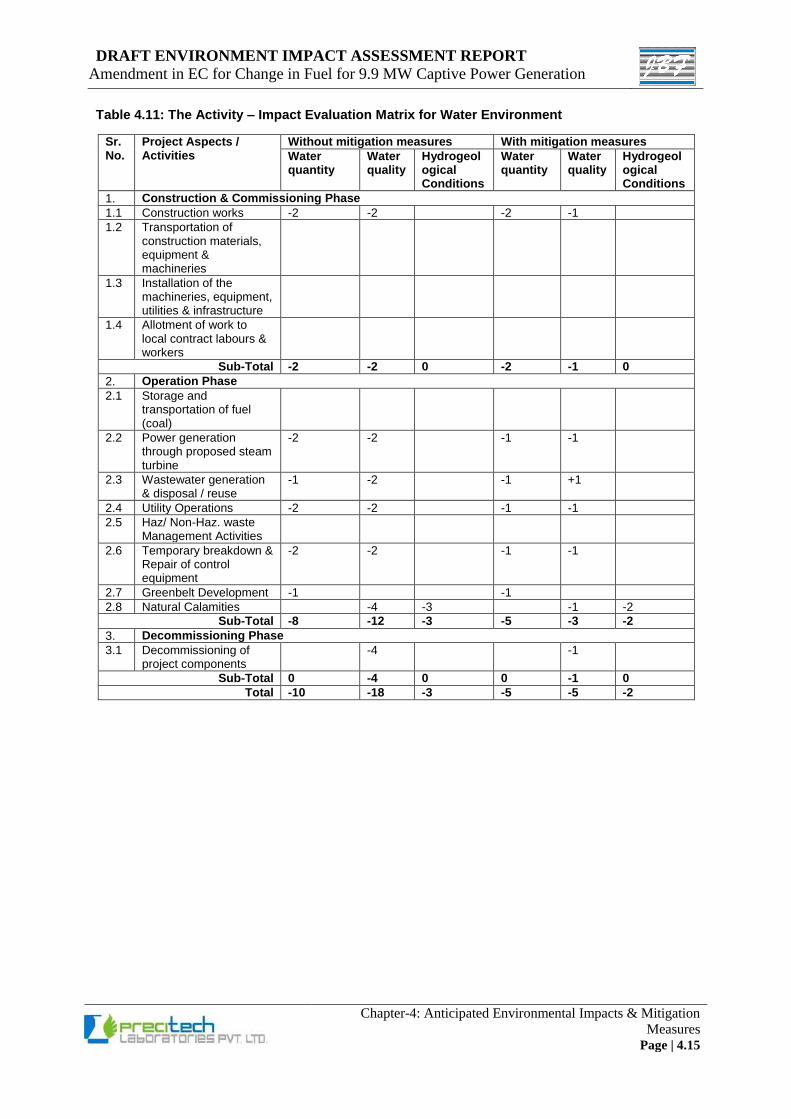
DRAFT ENVIRONMENT IMPACT ASSESSMENT REPORT
Amendment in EC for Change in Fuel for 9.9 MW Captive Power Generation
Chapter-4: Anticipated Environmental Impacts & Mitigation
Measures Page | 4.15
Table 4.11: The Activity – Impact Evaluation Matrix for Water Environment
Sr. No.
Project Aspects / Activities
Without mitigation measures With mitigation measures
Water quantity
Water quality
Hydrogeological Conditions
Water quantity
Water quality
Hydrogeological Conditions
1. Construction & Commissioning Phase
1.1 Construction works -2 -2 -2 -1
1.2 Transportation of construction materials, equipment & machineries
1.3 Installation of the machineries, equipment, utilities & infrastructure
1.4 Allotment of work to local contract labours & workers
Sub-Total -2 -2 0 -2 -1 0
2. Operation Phase
2.1 Storage and transportation of fuel (coal)
2.2 Power generation through proposed steam turbine
-2 -2 -1 -1
2.3 Wastewater generation & disposal / reuse
-1 -2 -1 +1
2.4 Utility Operations -2 -2 -1 -1
2.5 Haz/ Non-Haz. waste Management Activities
2.6 Temporary breakdown & Repair of control equipment
-2 -2 -1 -1
2.7 Greenbelt Development -1 -1
2.8 Natural Calamities -4 -3 -1 -2
Sub-Total -8 -12 -3 -5 -3 -2
3. Decommissioning Phase
3.1 Decommissioning of project components
-4 -1
Sub-Total 0 -4 0 0 -1 0
Total -10 -18 -3 -5 -5 -2
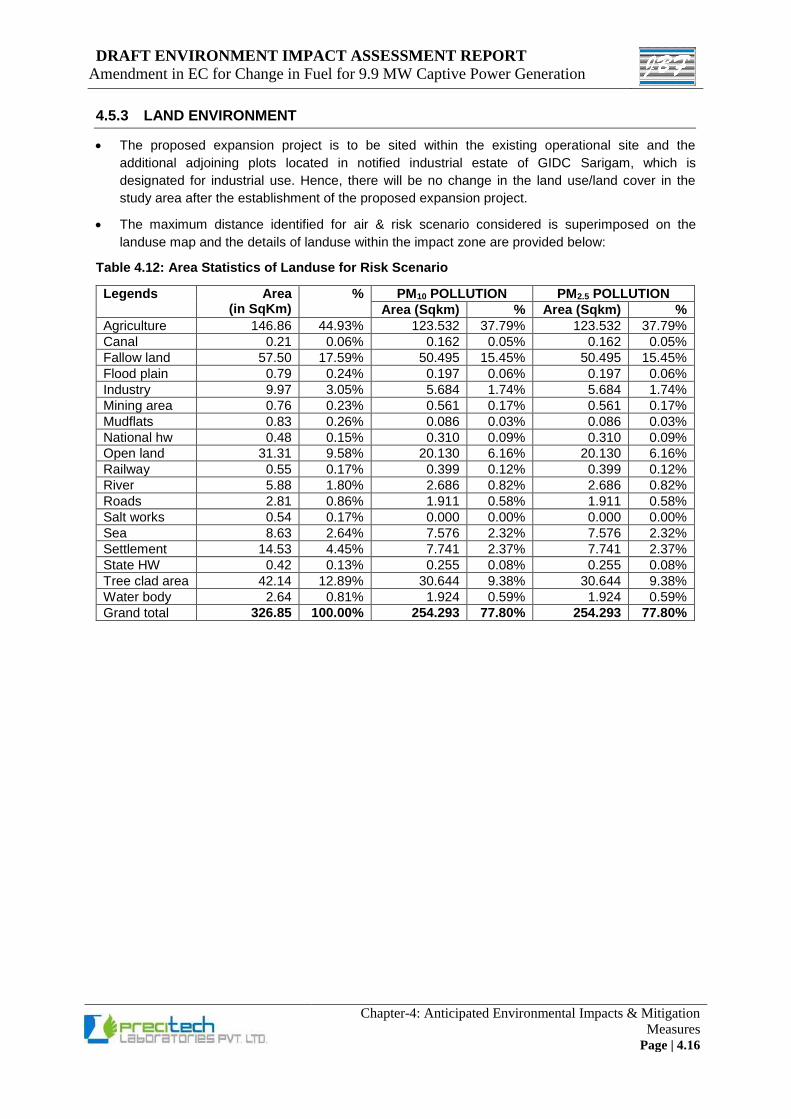
DRAFT ENVIRONMENT IMPACT ASSESSMENT REPORT
Amendment in EC for Change in Fuel for 9.9 MW Captive Power Generation
Chapter-4: Anticipated Environmental Impacts & Mitigation
Measures Page | 4.16
4.5.3 LAND ENVIRONMENT
The proposed expansion project is to be sited within the existing operational site and the
additional adjoining plots located in notified industrial estate of GIDC Sarigam, which is
designated for industrial use. Hence, there will be no change in the land use/land cover in the
study area after the establishment of the proposed expansion project.
The maximum distance identified for air & risk scenario considered is superimposed on the
landuse map and the details of landuse within the impact zone are provided below:
Table 4.12: Area Statistics of Landuse for Risk Scenario
Legends Area (in SqKm)
% PM10 POLLUTION PM2.5 POLLUTION
Area (Sqkm) % Area (Sqkm) %
Agriculture 146.86 44.93% 123.532 37.79% 123.532 37.79%
Canal 0.21 0.06% 0.162 0.05% 0.162 0.05%
Fallow land 57.50 17.59% 50.495 15.45% 50.495 15.45%
Flood plain 0.79 0.24% 0.197 0.06% 0.197 0.06%
Industry 9.97 3.05% 5.684 1.74% 5.684 1.74%
Mining area 0.76 0.23% 0.561 0.17% 0.561 0.17%
Mudflats 0.83 0.26% 0.086 0.03% 0.086 0.03%
National hw 0.48 0.15% 0.310 0.09% 0.310 0.09%
Open land 31.31 9.58% 20.130 6.16% 20.130 6.16%
Railway 0.55 0.17% 0.399 0.12% 0.399 0.12%
River 5.88 1.80% 2.686 0.82% 2.686 0.82%
Roads 2.81 0.86% 1.911 0.58% 1.911 0.58%
Salt works 0.54 0.17% 0.000 0.00% 0.000 0.00%
Sea 8.63 2.64% 7.576 2.32% 7.576 2.32%
Settlement 14.53 4.45% 7.741 2.37% 7.741 2.37%
State HW 0.42 0.13% 0.255 0.08% 0.255 0.08%
Tree clad area 42.14 12.89% 30.644 9.38% 30.644 9.38%
Water body 2.64 0.81% 1.924 0.59% 1.924 0.59%
Grand total 326.85 100.00% 254.293 77.80% 254.293 77.80%
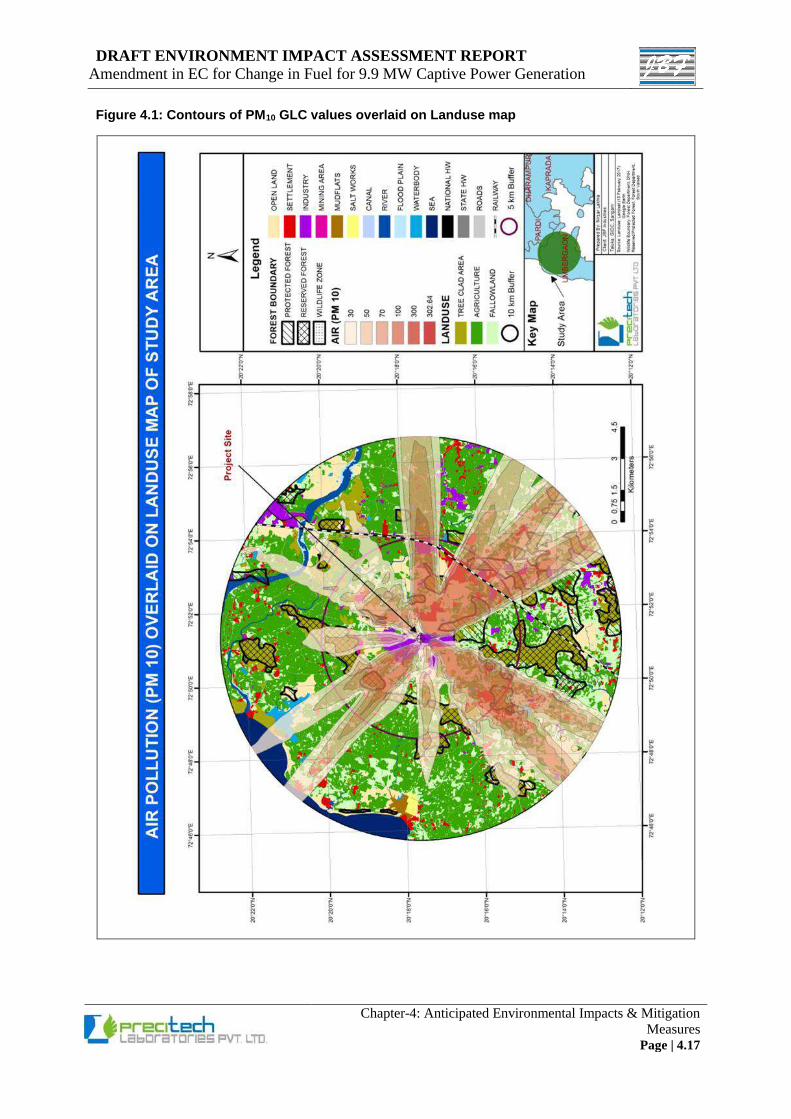
DRAFT ENVIRONMENT IMPACT ASSESSMENT REPORT
Amendment in EC for Change in Fuel for 9.9 MW Captive Power Generation
Chapter-4: Anticipated Environmental Impacts & Mitigation
Measures Page | 4.17
Figure 4.1: Contours of PM10 GLC values overlaid on Landuse map
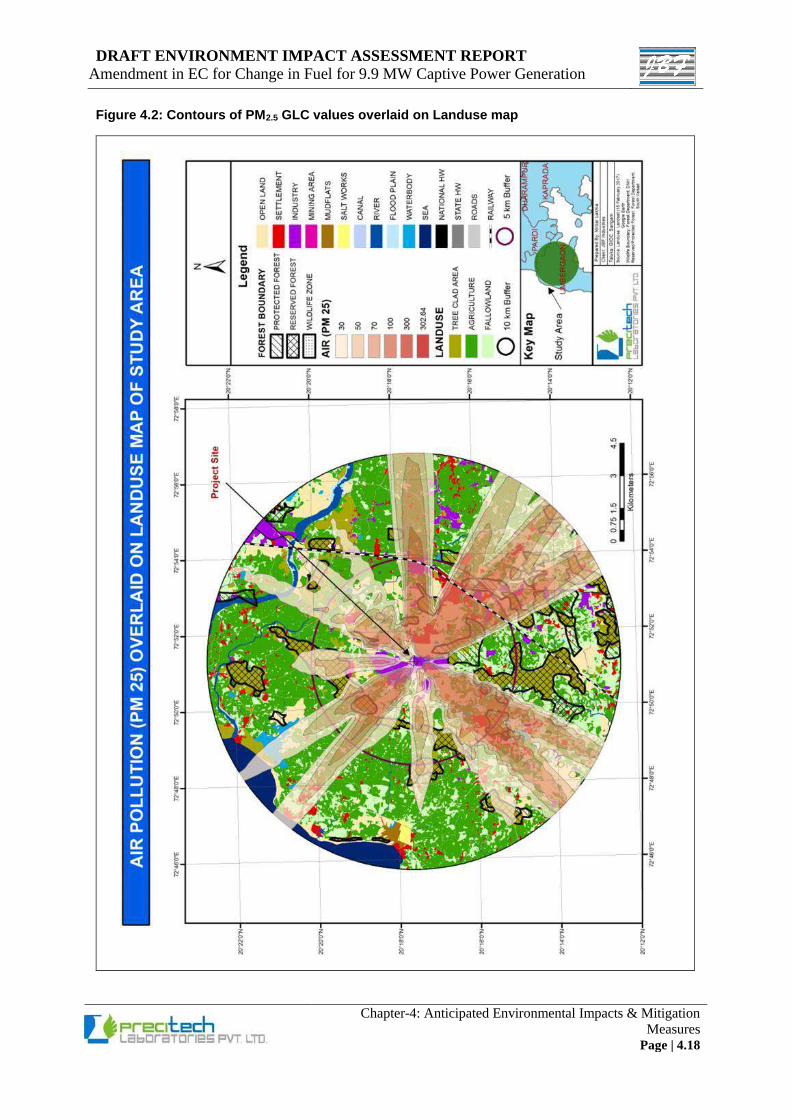
DRAFT ENVIRONMENT IMPACT ASSESSMENT REPORT
Amendment in EC for Change in Fuel for 9.9 MW Captive Power Generation
Chapter-4: Anticipated Environmental Impacts & Mitigation
Measures Page | 4.18
Figure 4.2: Contours of PM2.5 GLC values overlaid on Landuse map
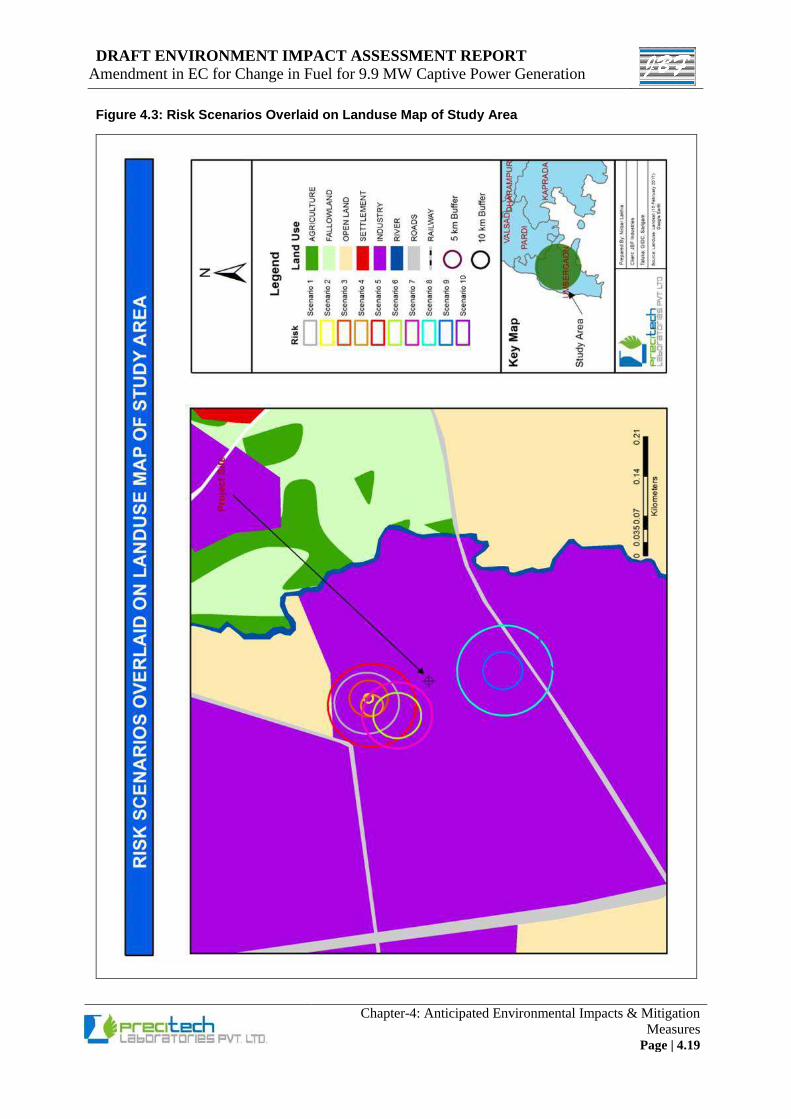
DRAFT ENVIRONMENT IMPACT ASSESSMENT REPORT
Amendment in EC for Change in Fuel for 9.9 MW Captive Power Generation
Chapter-4: Anticipated Environmental Impacts & Mitigation
Measures Page | 4.19
Figure 4.3: Risk Scenarios Overlaid on Landuse Map of Study Area
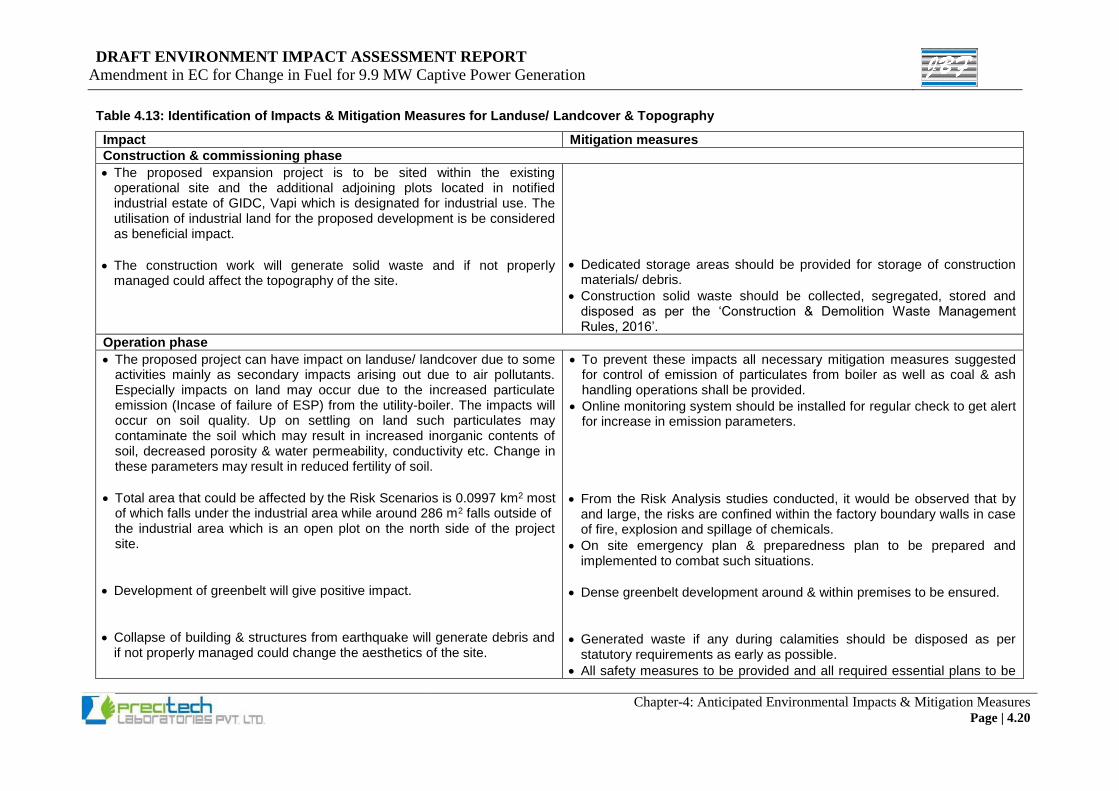
DRAFT ENVIRONMENT IMPACT ASSESSMENT REPORT
Amendment in EC for Change in Fuel for 9.9 MW Captive Power Generation
Chapter-4: Anticipated Environmental Impacts & Mitigation Measures Page | 4.20
Table 4.13: Identification of Impacts & Mitigation Measures for Landuse/ Landcover & Topography
Impact Mitigation measures
Construction & commissioning phase
The proposed expansion project is to be sited within the existing operational site and the additional adjoining plots located in notified industrial estate of GIDC, Vapi which is designated for industrial use. The utilisation of industrial land for the proposed development is be considered as beneficial impact.
The construction work will generate solid waste and if not properly managed could affect the topography of the site.
Dedicated storage areas should be provided for storage of construction materials/ debris.
Construction solid waste should be collected, segregated, stored and disposed as per the ‘Construction & Demolition Waste Management Rules, 2016’.
Operation phase
The proposed project can have impact on landuse/ landcover due to some activities mainly as secondary impacts arising out due to air pollutants. Especially impacts on land may occur due to the increased particulate emission (Incase of failure of ESP) from the utility-boiler. The impacts will occur on soil quality. Up on settling on land such particulates may contaminate the soil which may result in increased inorganic contents of soil, decreased porosity & water permeability, conductivity etc. Change in these parameters may result in reduced fertility of soil.
Total area that could be affected by the Risk Scenarios is 0.0997 km2 most of which falls under the industrial area while around 286 m2 falls outside of the industrial area which is an open plot on the north side of the project site.
Development of greenbelt will give positive impact.
Collapse of building & structures from earthquake will generate debris and if not properly managed could change the aesthetics of the site.
To prevent these impacts all necessary mitigation measures suggested for control of emission of particulates from boiler as well as coal & ash handling operations shall be provided.
Online monitoring system should be installed for regular check to get alert for increase in emission parameters.
From the Risk Analysis studies conducted, it would be observed that by and large, the risks are confined within the factory boundary walls in case of fire, explosion and spillage of chemicals.
On site emergency plan & preparedness plan to be prepared and implemented to combat such situations.
Dense greenbelt development around & within premises to be ensured.
Generated waste if any during calamities should be disposed as per statutory requirements as early as possible.
All safety measures to be provided and all required essential plans to be
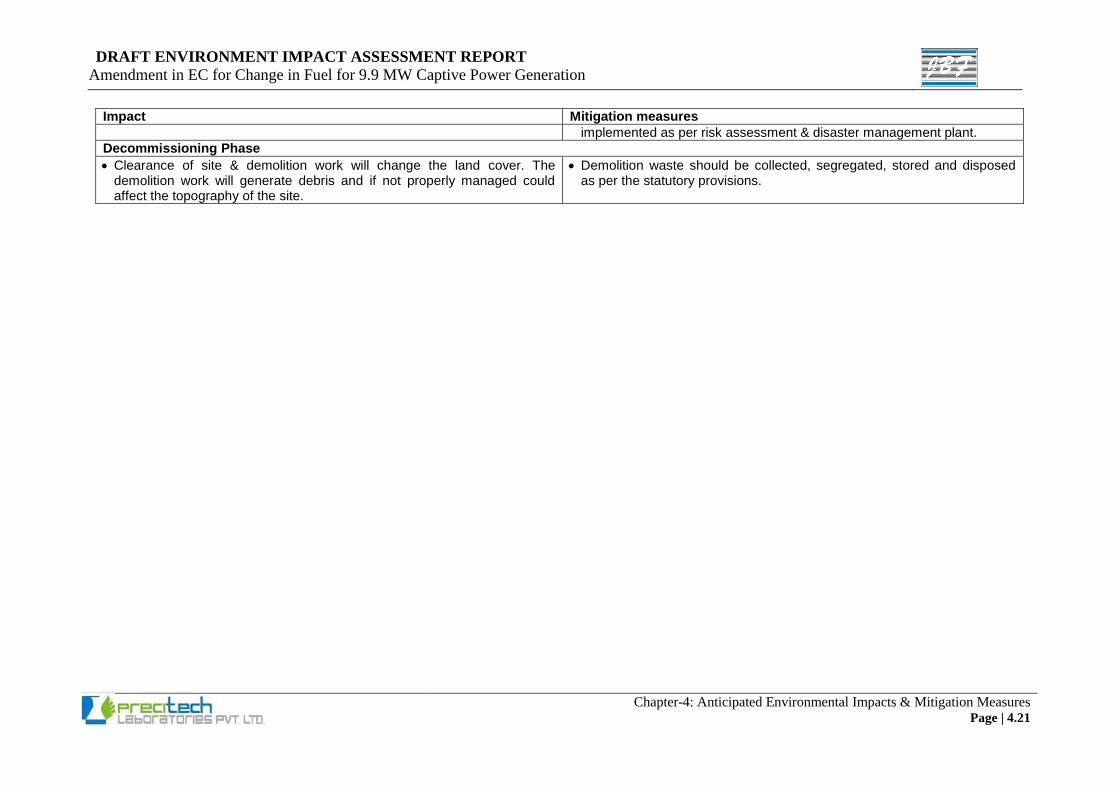
DRAFT ENVIRONMENT IMPACT ASSESSMENT REPORT
Amendment in EC for Change in Fuel for 9.9 MW Captive Power Generation
Chapter-4: Anticipated Environmental Impacts & Mitigation Measures Page | 4.21
Impact Mitigation measures
implemented as per risk assessment & disaster management plant.
Decommissioning Phase
Clearance of site & demolition work will change the land cover. The demolition work will generate debris and if not properly managed could affect the topography of the site.
Demolition waste should be collected, segregated, stored and disposed as per the statutory provisions.
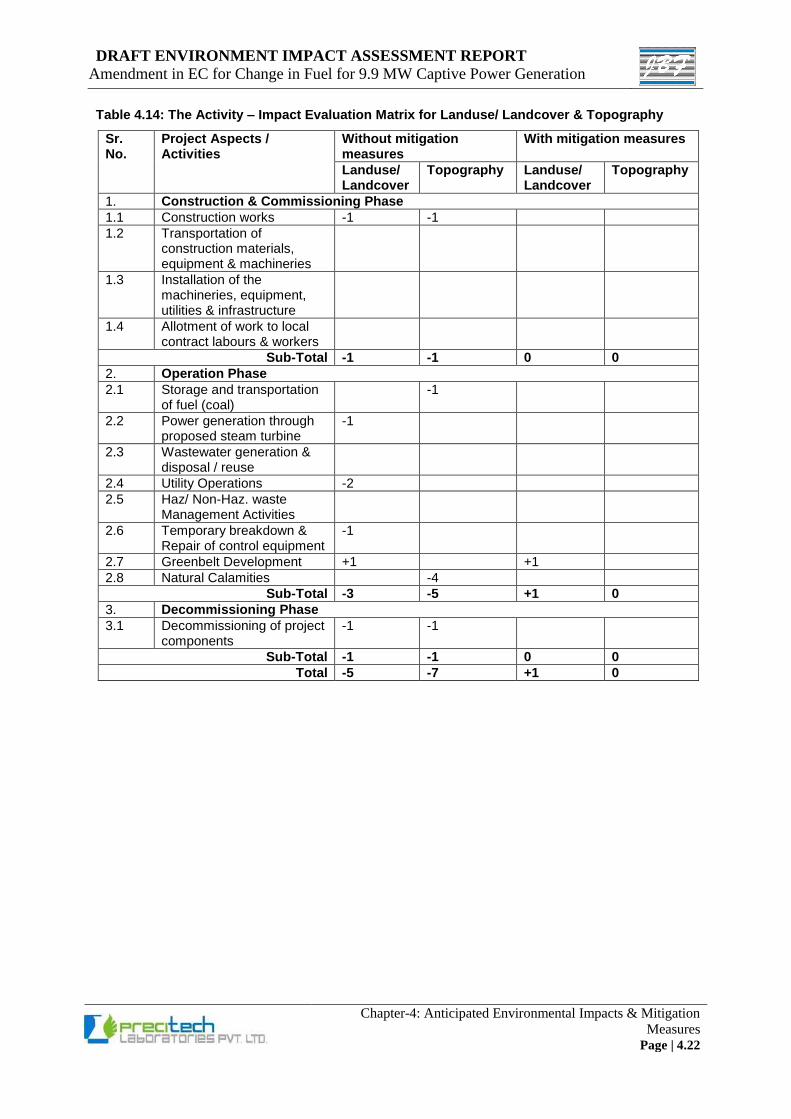
DRAFT ENVIRONMENT IMPACT ASSESSMENT REPORT
Amendment in EC for Change in Fuel for 9.9 MW Captive Power Generation
Chapter-4: Anticipated Environmental Impacts & Mitigation
Measures Page | 4.22
Table 4.14: The Activity – Impact Evaluation Matrix for Landuse/ Landcover & Topography
Sr. No.
Project Aspects / Activities
Without mitigation measures
With mitigation measures
Landuse/ Landcover
Topography Landuse/ Landcover
Topography
1. Construction & Commissioning Phase
1.1 Construction works -1 -1
1.2 Transportation of construction materials, equipment & machineries
1.3 Installation of the machineries, equipment, utilities & infrastructure
1.4 Allotment of work to local contract labours & workers
Sub-Total -1 -1 0 0
2. Operation Phase
2.1 Storage and transportation of fuel (coal)
-1
2.2 Power generation through proposed steam turbine
-1
2.3 Wastewater generation & disposal / reuse
2.4 Utility Operations -2
2.5 Haz/ Non-Haz. waste Management Activities
2.6 Temporary breakdown & Repair of control equipment
-1
2.7 Greenbelt Development +1 +1
2.8 Natural Calamities -4
Sub-Total -3 -5 +1 0
3. Decommissioning Phase
3.1 Decommissioning of project components
-1 -1
Sub-Total -1 -1 0 0
Total -5 -7 +1 0
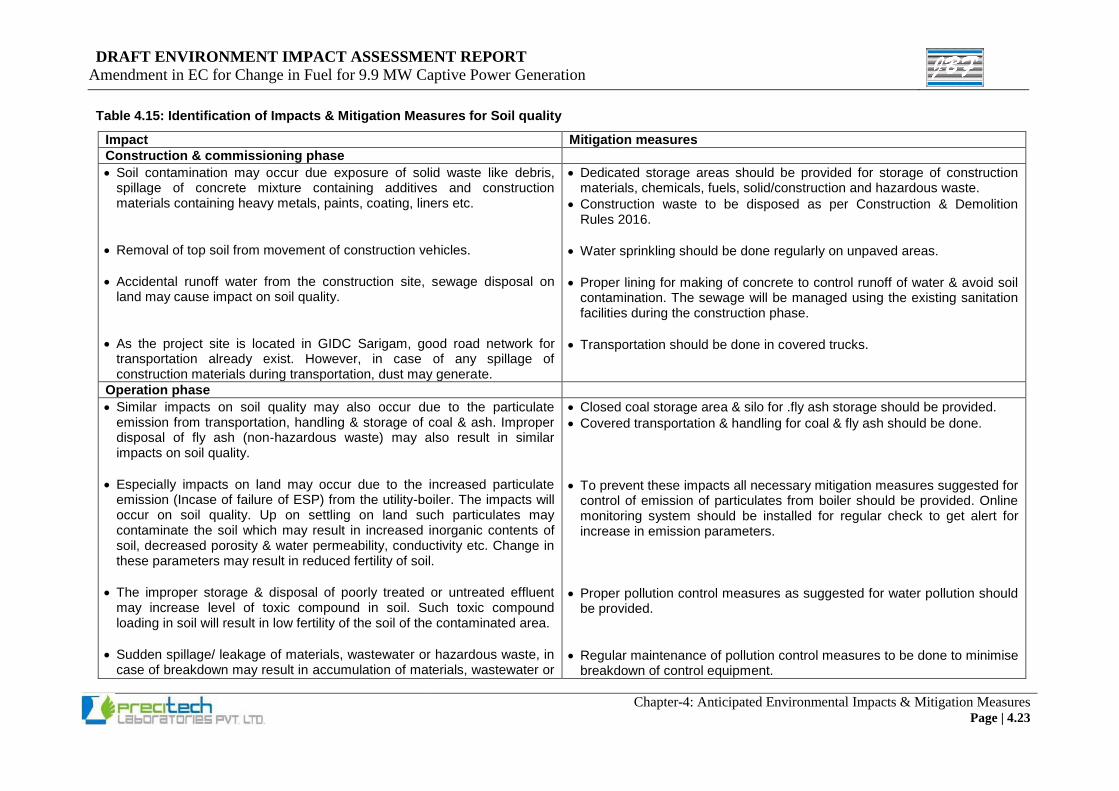
DRAFT ENVIRONMENT IMPACT ASSESSMENT REPORT
Amendment in EC for Change in Fuel for 9.9 MW Captive Power Generation
Chapter-4: Anticipated Environmental Impacts & Mitigation Measures Page | 4.23
Table 4.15: Identification of Impacts & Mitigation Measures for Soil quality
Impact Mitigation measures
Construction & commissioning phase
Soil contamination may occur due exposure of solid waste like debris, spillage of concrete mixture containing additives and construction materials containing heavy metals, paints, coating, liners etc.
Removal of top soil from movement of construction vehicles.
Accidental runoff water from the construction site, sewage disposal on land may cause impact on soil quality.
As the project site is located in GIDC Sarigam, good road network for transportation already exist. However, in case of any spillage of construction materials during transportation, dust may generate.
Dedicated storage areas should be provided for storage of construction materials, chemicals, fuels, solid/construction and hazardous waste.
Construction waste to be disposed as per Construction & Demolition Rules 2016.
Water sprinkling should be done regularly on unpaved areas.
Proper lining for making of concrete to control runoff of water & avoid soil contamination. The sewage will be managed using the existing sanitation facilities during the construction phase.
Transportation should be done in covered trucks.
Operation phase
Similar impacts on soil quality may also occur due to the particulate emission from transportation, handling & storage of coal & ash. Improper disposal of fly ash (non-hazardous waste) may also result in similar impacts on soil quality.
Especially impacts on land may occur due to the increased particulate emission (Incase of failure of ESP) from the utility-boiler. The impacts will occur on soil quality. Up on settling on land such particulates may contaminate the soil which may result in increased inorganic contents of soil, decreased porosity & water permeability, conductivity etc. Change in these parameters may result in reduced fertility of soil.
The improper storage & disposal of poorly treated or untreated effluent may increase level of toxic compound in soil. Such toxic compound loading in soil will result in low fertility of the soil of the contaminated area.
Sudden spillage/ leakage of materials, wastewater or hazardous waste, in case of breakdown may result in accumulation of materials, wastewater or
Closed coal storage area & silo for .fly ash storage should be provided.
Covered transportation & handling for coal & fly ash should be done.
To prevent these impacts all necessary mitigation measures suggested for control of emission of particulates from boiler should be provided. Online monitoring system should be installed for regular check to get alert for increase in emission parameters.
Proper pollution control measures as suggested for water pollution should be provided.
Regular maintenance of pollution control measures to be done to minimise breakdown of control equipment.
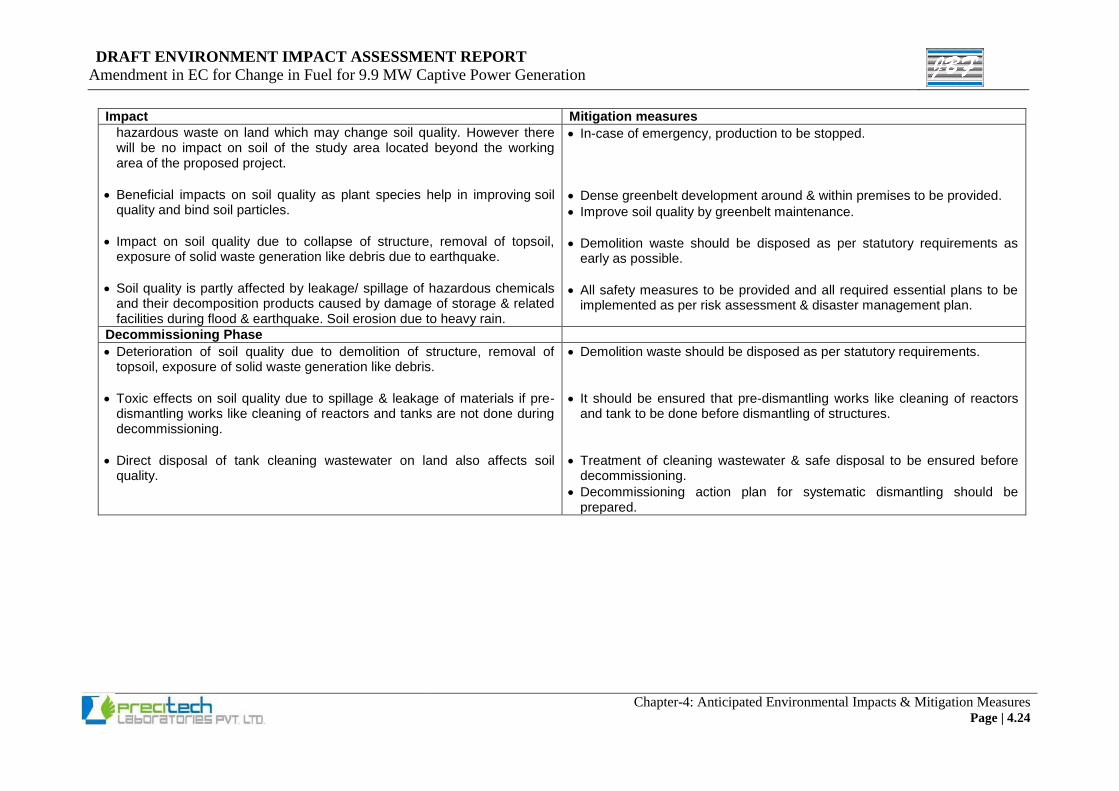
DRAFT ENVIRONMENT IMPACT ASSESSMENT REPORT
Amendment in EC for Change in Fuel for 9.9 MW Captive Power Generation
Chapter-4: Anticipated Environmental Impacts & Mitigation Measures Page | 4.24
Impact Mitigation measures
hazardous waste on land which may change soil quality. However there will be no impact on soil of the study area located beyond the working area of the proposed project.
Beneficial impacts on soil quality as plant species help in improving soil quality and bind soil particles.
Impact on soil quality due to collapse of structure, removal of topsoil, exposure of solid waste generation like debris due to earthquake.
Soil quality is partly affected by leakage/ spillage of hazardous chemicals and their decomposition products caused by damage of storage & related facilities during flood & earthquake. Soil erosion due to heavy rain.
In-case of emergency, production to be stopped.
Dense greenbelt development around & within premises to be provided.
Improve soil quality by greenbelt maintenance.
Demolition waste should be disposed as per statutory requirements as early as possible.
All safety measures to be provided and all required essential plans to be implemented as per risk assessment & disaster management plan.
Decommissioning Phase
Deterioration of soil quality due to demolition of structure, removal of topsoil, exposure of solid waste generation like debris.
Toxic effects on soil quality due to spillage & leakage of materials if pre-dismantling works like cleaning of reactors and tanks are not done during decommissioning.
Direct disposal of tank cleaning wastewater on land also affects soil quality.
Demolition waste should be disposed as per statutory requirements.
It should be ensured that pre-dismantling works like cleaning of reactors and tank to be done before dismantling of structures.
Treatment of cleaning wastewater & safe disposal to be ensured before decommissioning.
Decommissioning action plan for systematic dismantling should be prepared.
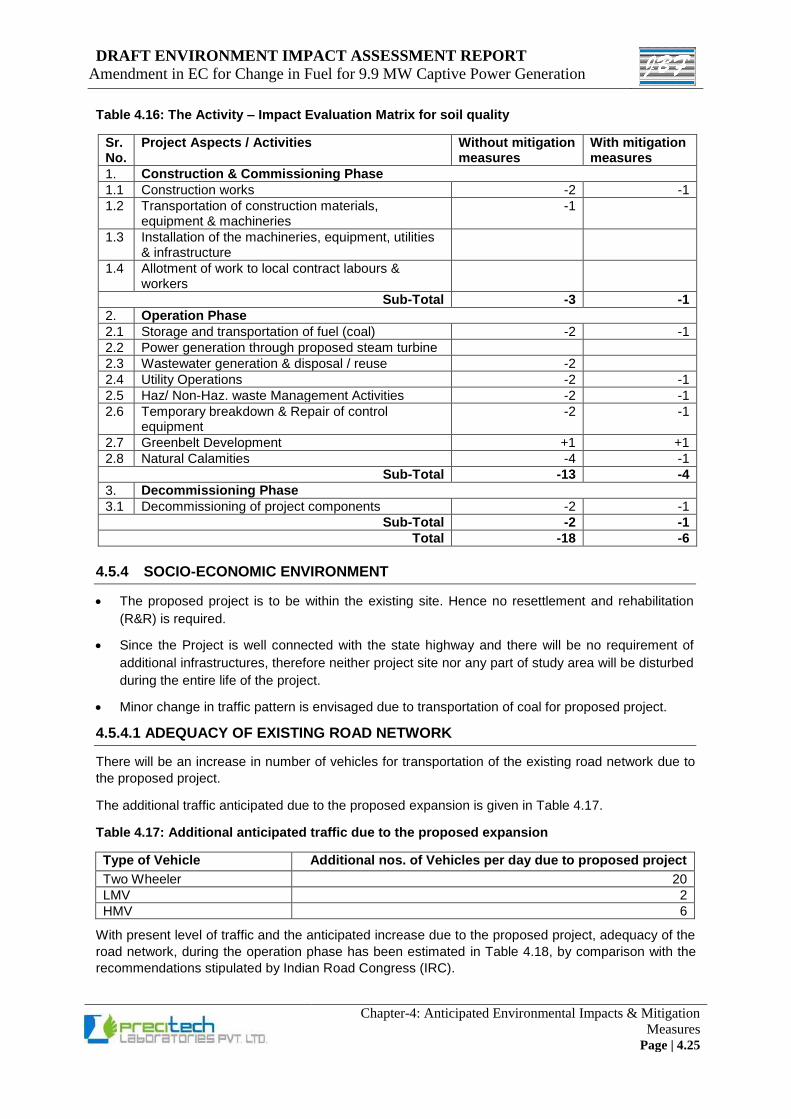
DRAFT ENVIRONMENT IMPACT ASSESSMENT REPORT
Amendment in EC for Change in Fuel for 9.9 MW Captive Power Generation
Chapter-4: Anticipated Environmental Impacts & Mitigation
Measures Page | 4.25
Table 4.16: The Activity – Impact Evaluation Matrix for soil quality
Sr. No.
Project Aspects / Activities Without mitigation measures
With mitigation measures
1. Construction & Commissioning Phase
1.1 Construction works -2 -1
1.2 Transportation of construction materials, equipment & machineries
-1
1.3 Installation of the machineries, equipment, utilities & infrastructure
1.4 Allotment of work to local contract labours & workers
Sub-Total -3 -1
2. Operation Phase
2.1 Storage and transportation of fuel (coal) -2 -1
2.2 Power generation through proposed steam turbine
2.3 Wastewater generation & disposal / reuse -2
2.4 Utility Operations -2 -1
2.5 Haz/ Non-Haz. waste Management Activities -2 -1
2.6 Temporary breakdown & Repair of control equipment
-2 -1
2.7 Greenbelt Development +1 +1
2.8 Natural Calamities -4 -1
Sub-Total -13 -4
3. Decommissioning Phase
3.1 Decommissioning of project components -2 -1
Sub-Total -2 -1
Total -18 -6
4.5.4 SOCIO-ECONOMIC ENVIRONMENT
The proposed project is to be within the existing site. Hence no resettlement and rehabilitation
(R&R) is required.
Since the Project is well connected with the state highway and there will be no requirement of
additional infrastructures, therefore neither project site nor any part of study area will be disturbed
during the entire life of the project.
Minor change in traffic pattern is envisaged due to transportation of coal for proposed project.
4.5.4.1 ADEQUACY OF EXISTING ROAD NETWORK
There will be an increase in number of vehicles for transportation of the existing road network due to
the proposed project.
The additional traffic anticipated due to the proposed expansion is given in Table 4.17.
Table 4.17: Additional anticipated traffic due to the proposed expansion
Type of Vehicle Additional nos. of Vehicles per day due to proposed project
Two Wheeler 20
LMV 2
HMV 6
With present level of traffic and the anticipated increase due to the proposed project, adequacy of the
road network, during the operation phase has been estimated in Table 4.18, by comparison with the
recommendations stipulated by Indian Road Congress (IRC).
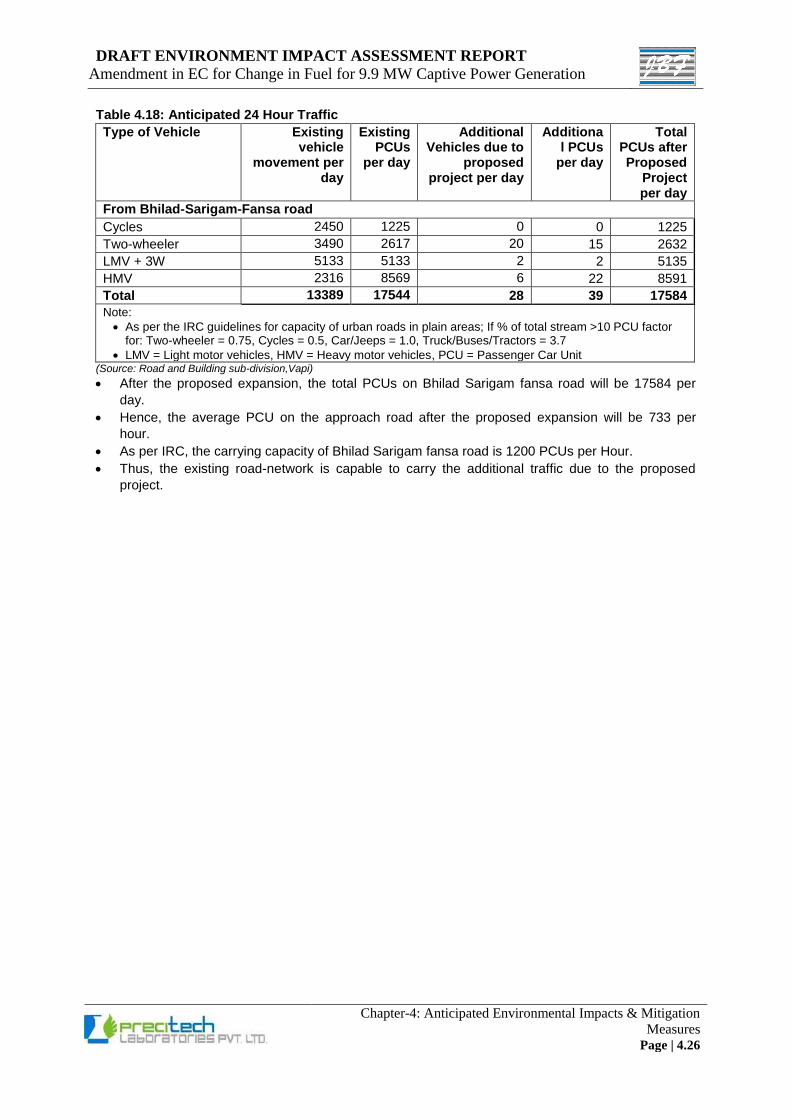
DRAFT ENVIRONMENT IMPACT ASSESSMENT REPORT
Amendment in EC for Change in Fuel for 9.9 MW Captive Power Generation
Chapter-4: Anticipated Environmental Impacts & Mitigation
Measures Page | 4.26
Table 4.18: Anticipated 24 Hour Traffic
Type of Vehicle Existing vehicle
movement per day
Existing PCUs
per day
Additional Vehicles due to
proposed project per day
Additional PCUs
per day
Total PCUs after Proposed
Project per day
From Bhilad-Sarigam-Fansa road
Cycles 2450 1225 0 0 1225
Two-wheeler 3490 2617 20 15 2632
LMV + 3W 5133 5133 2 2 5135
HMV 2316 8569 6 22 8591
Total 13389 17544 28 39 17584
Note:
As per the IRC guidelines for capacity of urban roads in plain areas; If % of total stream >10 PCU factor for: Two-wheeler = 0.75, Cycles = 0.5, Car/Jeeps = 1.0, Truck/Buses/Tractors = 3.7
LMV = Light motor vehicles, HMV = Heavy motor vehicles, PCU = Passenger Car Unit (Source: Road and Building sub-division,Vapi)
After the proposed expansion, the total PCUs on Bhilad Sarigam fansa road will be 17584 per
day.
Hence, the average PCU on the approach road after the proposed expansion will be 733 per
hour.
As per IRC, the carrying capacity of Bhilad Sarigam fansa road is 1200 PCUs per Hour.
Thus, the existing road-network is capable to carry the additional traffic due to the proposed
project.
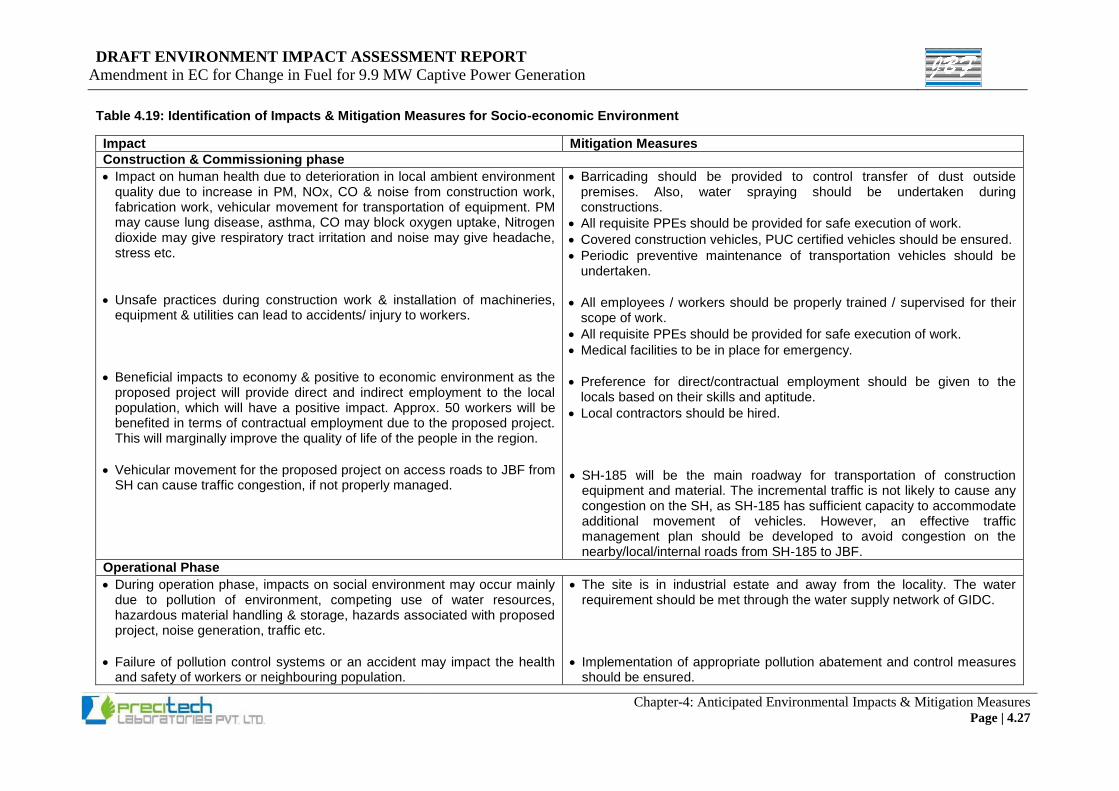
DRAFT ENVIRONMENT IMPACT ASSESSMENT REPORT
Amendment in EC for Change in Fuel for 9.9 MW Captive Power Generation
Chapter-4: Anticipated Environmental Impacts & Mitigation Measures Page | 4.27
Table 4.19: Identification of Impacts & Mitigation Measures for Socio-economic Environment
Impact Mitigation Measures
Construction & Commissioning phase
Impact on human health due to deterioration in local ambient environment quality due to increase in PM, NOx, CO & noise from construction work, fabrication work, vehicular movement for transportation of equipment. PM may cause lung disease, asthma, CO may block oxygen uptake, Nitrogen dioxide may give respiratory tract irritation and noise may give headache, stress etc.
Unsafe practices during construction work & installation of machineries, equipment & utilities can lead to accidents/ injury to workers.
Beneficial impacts to economy & positive to economic environment as the proposed project will provide direct and indirect employment to the local population, which will have a positive impact. Approx. 50 workers will be benefited in terms of contractual employment due to the proposed project. This will marginally improve the quality of life of the people in the region.
Vehicular movement for the proposed project on access roads to JBF from SH can cause traffic congestion, if not properly managed.
Barricading should be provided to control transfer of dust outside premises. Also, water spraying should be undertaken during constructions.
All requisite PPEs should be provided for safe execution of work.
Covered construction vehicles, PUC certified vehicles should be ensured.
Periodic preventive maintenance of transportation vehicles should be undertaken.
All employees / workers should be properly trained / supervised for their scope of work.
All requisite PPEs should be provided for safe execution of work.
Medical facilities to be in place for emergency.
Preference for direct/contractual employment should be given to the locals based on their skills and aptitude.
Local contractors should be hired.
SH-185 will be the main roadway for transportation of construction equipment and material. The incremental traffic is not likely to cause any congestion on the SH, as SH-185 has sufficient capacity to accommodate additional movement of vehicles. However, an effective traffic management plan should be developed to avoid congestion on the nearby/local/internal roads from SH-185 to JBF.
Operational Phase
During operation phase, impacts on social environment may occur mainly due to pollution of environment, competing use of water resources, hazardous material handling & storage, hazards associated with proposed project, noise generation, traffic etc.
Failure of pollution control systems or an accident may impact the health and safety of workers or neighbouring population.
The site is in industrial estate and away from the locality. The water requirement should be met through the water supply network of GIDC.
Implementation of appropriate pollution abatement and control measures should be ensured.
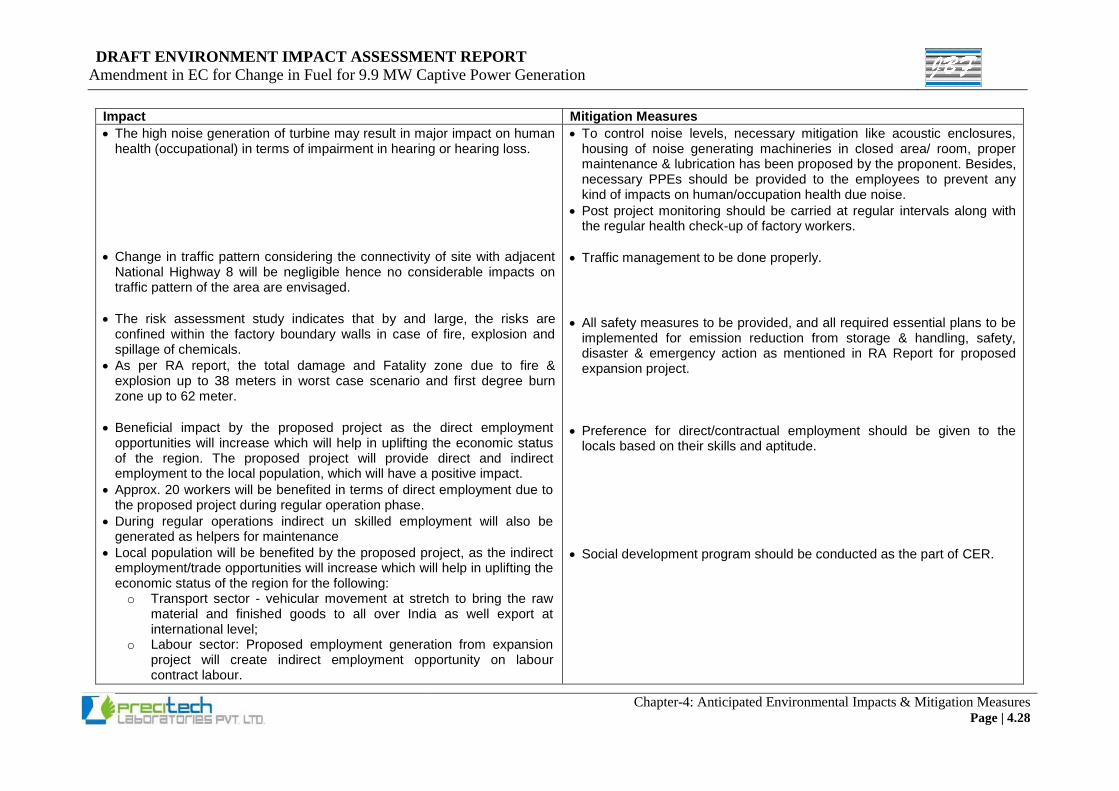
DRAFT ENVIRONMENT IMPACT ASSESSMENT REPORT
Amendment in EC for Change in Fuel for 9.9 MW Captive Power Generation
Chapter-4: Anticipated Environmental Impacts & Mitigation Measures Page | 4.28
Impact Mitigation Measures
The high noise generation of turbine may result in major impact on human health (occupational) in terms of impairment in hearing or hearing loss.
Change in traffic pattern considering the connectivity of site with adjacent National Highway 8 will be negligible hence no considerable impacts on traffic pattern of the area are envisaged.
The risk assessment study indicates that by and large, the risks are confined within the factory boundary walls in case of fire, explosion and spillage of chemicals.
As per RA report, the total damage and Fatality zone due to fire & explosion up to 38 meters in worst case scenario and first degree burn zone up to 62 meter.
Beneficial impact by the proposed project as the direct employment opportunities will increase which will help in uplifting the economic status of the region. The proposed project will provide direct and indirect employment to the local population, which will have a positive impact.
Approx. 20 workers will be benefited in terms of direct employment due to the proposed project during regular operation phase.
During regular operations indirect un skilled employment will also be generated as helpers for maintenance
Local population will be benefited by the proposed project, as the indirect employment/trade opportunities will increase which will help in uplifting the economic status of the region for the following: o Transport sector - vehicular movement at stretch to bring the raw
material and finished goods to all over India as well export at international level;
o Labour sector: Proposed employment generation from expansion project will create indirect employment opportunity on labour contract labour.
To control noise levels, necessary mitigation like acoustic enclosures, housing of noise generating machineries in closed area/ room, proper maintenance & lubrication has been proposed by the proponent. Besides, necessary PPEs should be provided to the employees to prevent any kind of impacts on human/occupation health due noise.
Post project monitoring should be carried at regular intervals along with the regular health check-up of factory workers.
Traffic management to be done properly.
All safety measures to be provided, and all required essential plans to be implemented for emission reduction from storage & handling, safety, disaster & emergency action as mentioned in RA Report for proposed expansion project.
Preference for direct/contractual employment should be given to the locals based on their skills and aptitude.
Social development program should be conducted as the part of CER.
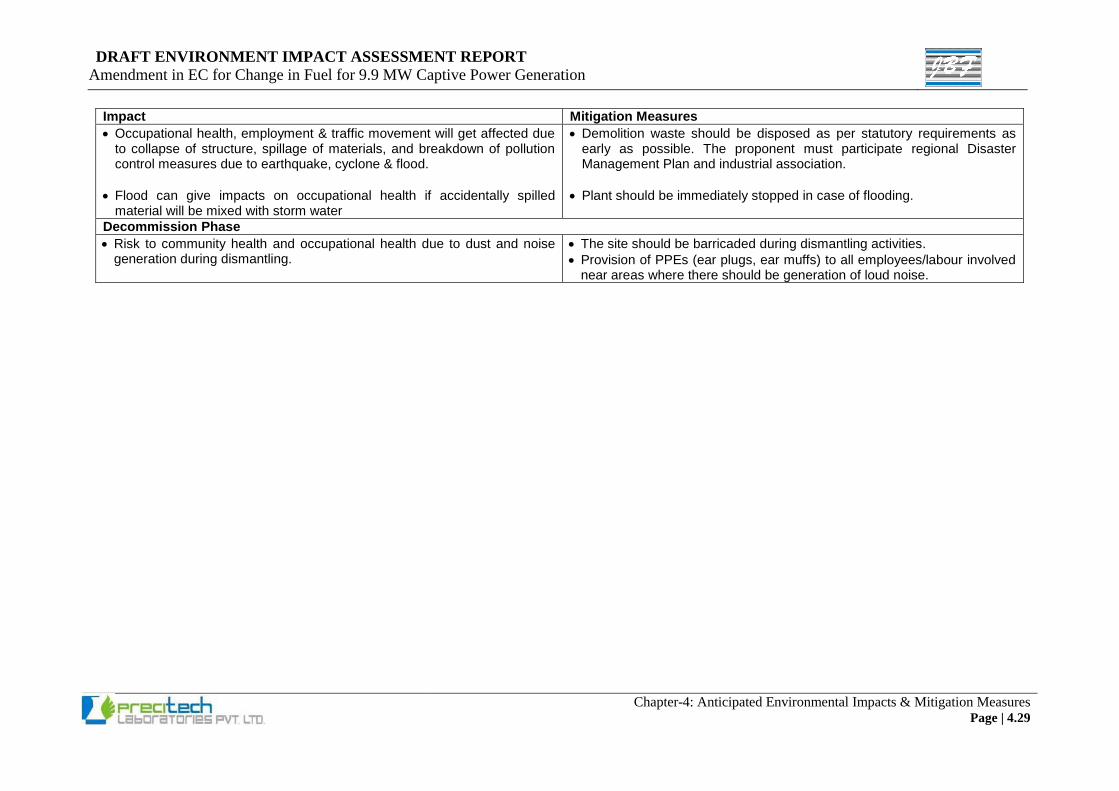
DRAFT ENVIRONMENT IMPACT ASSESSMENT REPORT
Amendment in EC for Change in Fuel for 9.9 MW Captive Power Generation
Chapter-4: Anticipated Environmental Impacts & Mitigation Measures Page | 4.29
Impact Mitigation Measures
Occupational health, employment & traffic movement will get affected due to collapse of structure, spillage of materials, and breakdown of pollution control measures due to earthquake, cyclone & flood.
Flood can give impacts on occupational health if accidentally spilled material will be mixed with storm water
Demolition waste should be disposed as per statutory requirements as early as possible. The proponent must participate regional Disaster Management Plan and industrial association.
Plant should be immediately stopped in case of flooding.
Decommission Phase
Risk to community health and occupational health due to dust and noise generation during dismantling.
The site should be barricaded during dismantling activities.
Provision of PPEs (ear plugs, ear muffs) to all employees/labour involved near areas where there should be generation of loud noise.
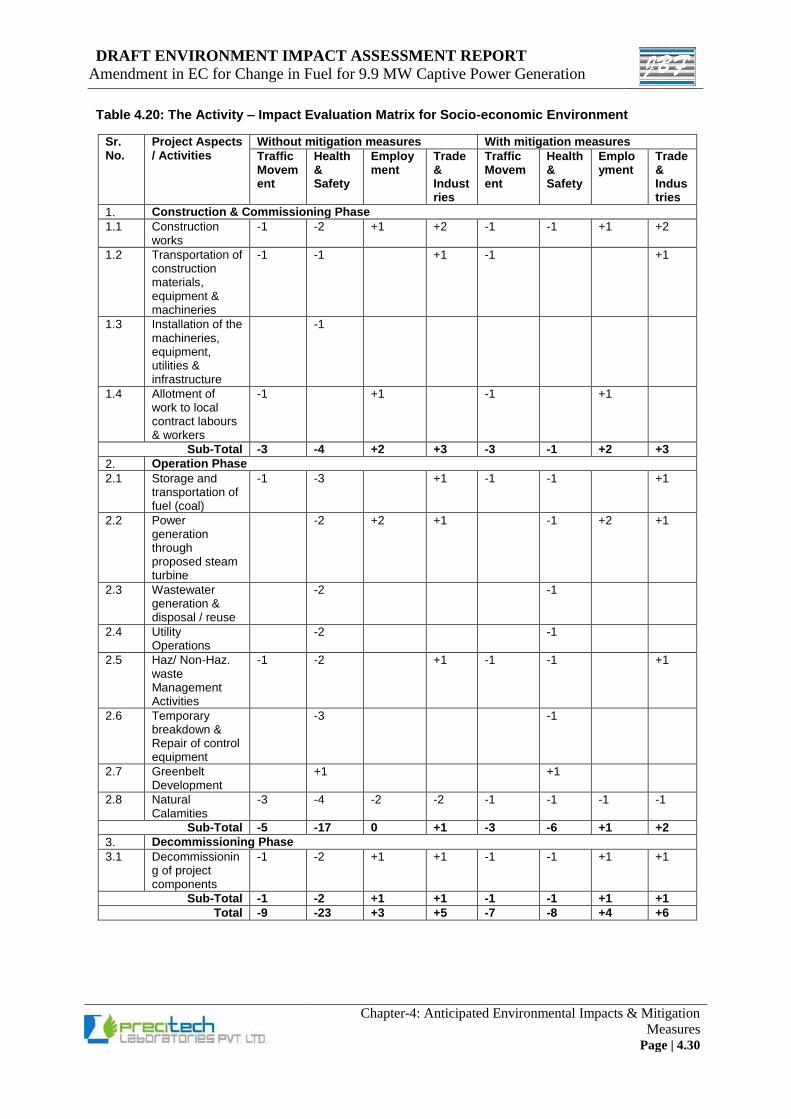
DRAFT ENVIRONMENT IMPACT ASSESSMENT REPORT
Amendment in EC for Change in Fuel for 9.9 MW Captive Power Generation
Chapter-4: Anticipated Environmental Impacts & Mitigation
Measures Page | 4.30
Table 4.20: The Activity – Impact Evaluation Matrix for Socio-economic Environment
Sr. No.
Project Aspects / Activities
Without mitigation measures With mitigation measures
Traffic Movement
Health & Safety
Employment
Trade & Industries
Traffic Movement
Health & Safety
Employment
Trade & Industries
1. Construction & Commissioning Phase
1.1 Construction works
-1 -2 +1 +2 -1 -1 +1 +2
1.2 Transportation of construction materials, equipment & machineries
-1 -1 +1 -1 +1
1.3 Installation of the machineries, equipment, utilities & infrastructure
-1
1.4 Allotment of work to local contract labours & workers
-1 +1 -1 +1
Sub-Total -3 -4 +2 +3 -3 -1 +2 +3
2. Operation Phase
2.1 Storage and transportation of fuel (coal)
-1 -3 +1 -1 -1 +1
2.2 Power generation through proposed steam turbine
-2 +2 +1 -1 +2 +1
2.3 Wastewater generation & disposal / reuse
-2 -1
2.4 Utility Operations
-2 -1
2.5 Haz/ Non-Haz. waste Management Activities
-1 -2 +1 -1 -1 +1
2.6 Temporary breakdown & Repair of control equipment
-3 -1
2.7 Greenbelt Development
+1 +1
2.8 Natural Calamities
-3 -4 -2 -2 -1 -1 -1 -1
Sub-Total -5 -17 0 +1 -3 -6 +1 +2
3. Decommissioning Phase
3.1 Decommissioning of project components
-1 -2 +1 +1 -1 -1 +1 +1
Sub-Total -1 -2 +1 +1 -1 -1 +1 +1
Total -9 -23 +3 +5 -7 -8 +4 +6
DRAFT ENVIRONMENT IMPACT ASSESSMENT REPORT
Amendment in EC for Change in Fuel for 9.9 MW Captive Power Generation
Chapter-4: Anticipated Environmental Impacts & Mitigation
Measures Page | 4.31
4.5.5 ECOLOGICAL ENVIRONMENT
The proposed installation will be accommodated in the existing land & additionally adjoining plots.
The land is designated for industrial purpose. Hence, issue of impacts on ecology due to siting of
proposed expansion project is not envisaged.
There is no ecologically important area within the buffer area of 10 km. except the considerable
cultivated land and water bodies.
No major considerable impacts on water & land environments are noticed by the proposed
expansion project. All impacts studied are found minor & acceptable range.
Impacts are anticipated mainly due to the coal to be used which can have hazardous impacts.
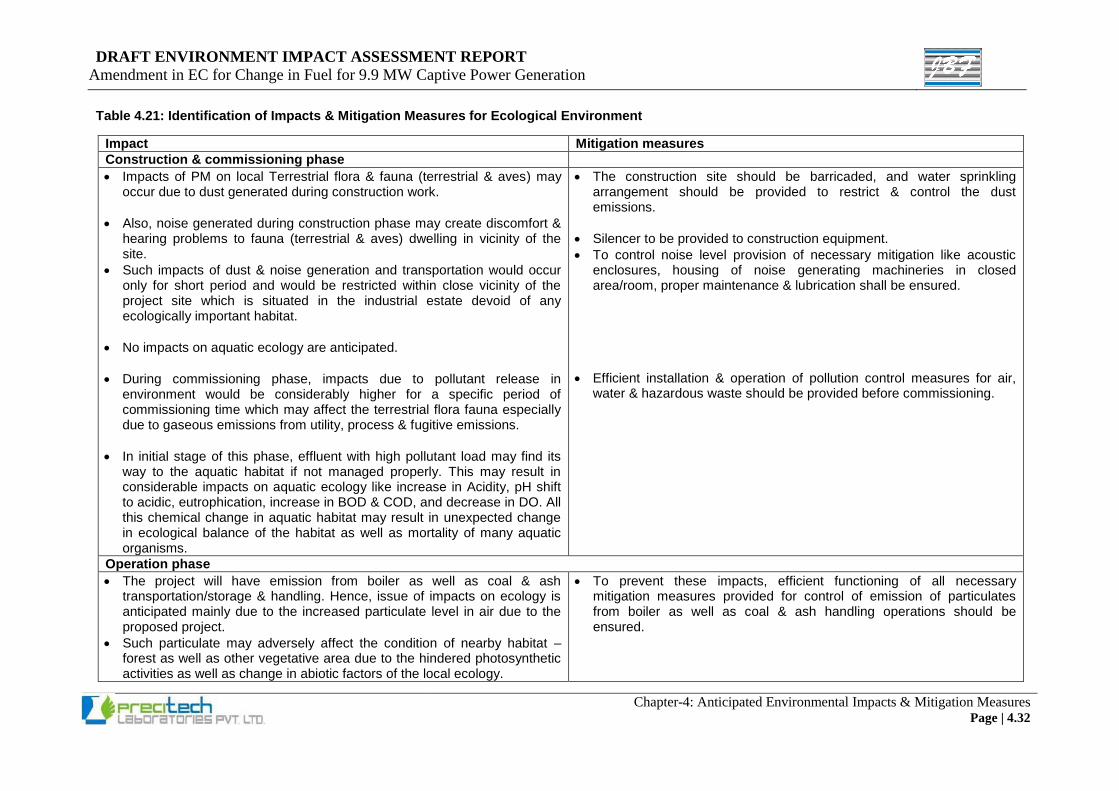
DRAFT ENVIRONMENT IMPACT ASSESSMENT REPORT
Amendment in EC for Change in Fuel for 9.9 MW Captive Power Generation
Chapter-4: Anticipated Environmental Impacts & Mitigation Measures Page | 4.32
Table 4.21: Identification of Impacts & Mitigation Measures for Ecological Environment
Impact Mitigation measures
Construction & commissioning phase
Impacts of PM on local Terrestrial flora & fauna (terrestrial & aves) may occur due to dust generated during construction work.
Also, noise generated during construction phase may create discomfort & hearing problems to fauna (terrestrial & aves) dwelling in vicinity of the site.
Such impacts of dust & noise generation and transportation would occur only for short period and would be restricted within close vicinity of the project site which is situated in the industrial estate devoid of any ecologically important habitat.
No impacts on aquatic ecology are anticipated.
During commissioning phase, impacts due to pollutant release in environment would be considerably higher for a specific period of commissioning time which may affect the terrestrial flora fauna especially due to gaseous emissions from utility, process & fugitive emissions.
In initial stage of this phase, effluent with high pollutant load may find its way to the aquatic habitat if not managed properly. This may result in considerable impacts on aquatic ecology like increase in Acidity, pH shift to acidic, eutrophication, increase in BOD & COD, and decrease in DO. All this chemical change in aquatic habitat may result in unexpected change in ecological balance of the habitat as well as mortality of many aquatic organisms.
The construction site should be barricaded, and water sprinkling arrangement should be provided to restrict & control the dust emissions.
Silencer to be provided to construction equipment.
To control noise level provision of necessary mitigation like acoustic enclosures, housing of noise generating machineries in closed area/room, proper maintenance & lubrication shall be ensured.
Efficient installation & operation of pollution control measures for air, water & hazardous waste should be provided before commissioning.
Operation phase
The project will have emission from boiler as well as coal & ash transportation/storage & handling. Hence, issue of impacts on ecology is anticipated mainly due to the increased particulate level in air due to the proposed project.
Such particulate may adversely affect the condition of nearby habitat – forest as well as other vegetative area due to the hindered photosynthetic activities as well as change in abiotic factors of the local ecology.
To prevent these impacts, efficient functioning of all necessary mitigation measures provided for control of emission of particulates from boiler as well as coal & ash handling operations should be ensured.
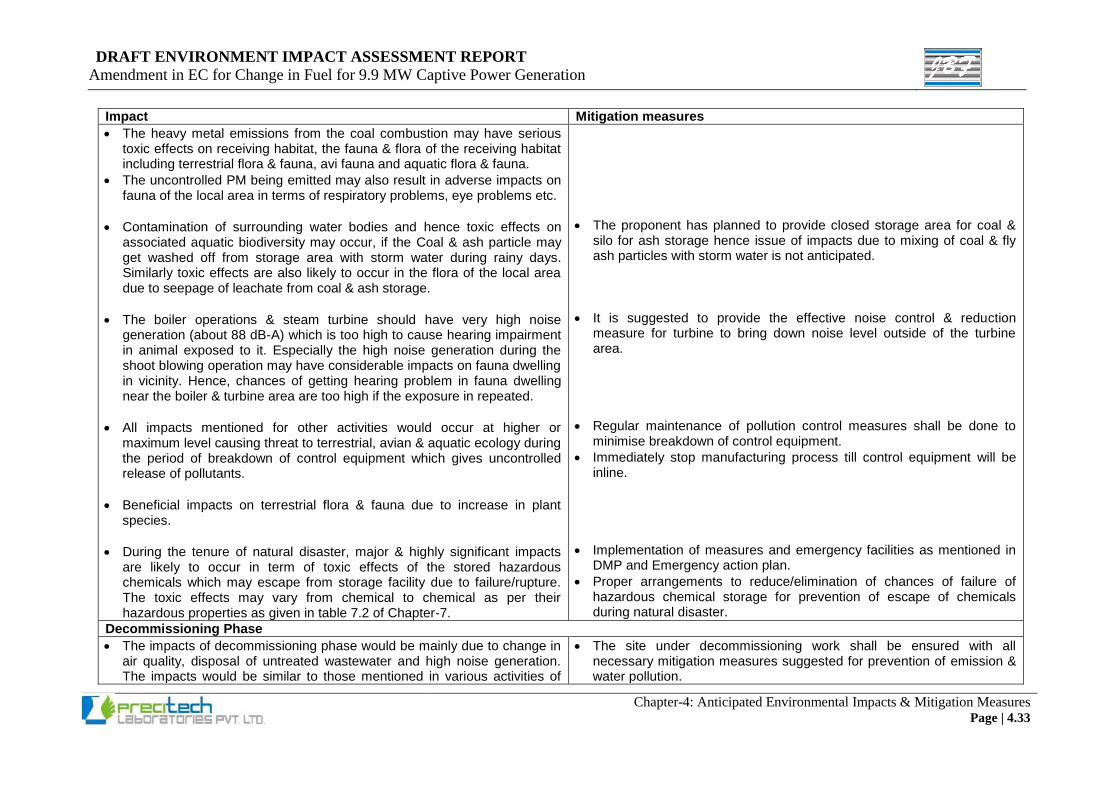
DRAFT ENVIRONMENT IMPACT ASSESSMENT REPORT
Amendment in EC for Change in Fuel for 9.9 MW Captive Power Generation
Chapter-4: Anticipated Environmental Impacts & Mitigation Measures Page | 4.33
Impact Mitigation measures
The heavy metal emissions from the coal combustion may have serious toxic effects on receiving habitat, the fauna & flora of the receiving habitat including terrestrial flora & fauna, avi fauna and aquatic flora & fauna.
The uncontrolled PM being emitted may also result in adverse impacts on fauna of the local area in terms of respiratory problems, eye problems etc.
Contamination of surrounding water bodies and hence toxic effects on associated aquatic biodiversity may occur, if the Coal & ash particle may get washed off from storage area with storm water during rainy days. Similarly toxic effects are also likely to occur in the flora of the local area due to seepage of leachate from coal & ash storage.
The boiler operations & steam turbine should have very high noise generation (about 88 dB-A) which is too high to cause hearing impairment in animal exposed to it. Especially the high noise generation during the shoot blowing operation may have considerable impacts on fauna dwelling in vicinity. Hence, chances of getting hearing problem in fauna dwelling near the boiler & turbine area are too high if the exposure in repeated.
All impacts mentioned for other activities would occur at higher or maximum level causing threat to terrestrial, avian & aquatic ecology during the period of breakdown of control equipment which gives uncontrolled release of pollutants.
Beneficial impacts on terrestrial flora & fauna due to increase in plant species.
During the tenure of natural disaster, major & highly significant impacts are likely to occur in term of toxic effects of the stored hazardous chemicals which may escape from storage facility due to failure/rupture. The toxic effects may vary from chemical to chemical as per their hazardous properties as given in table 7.2 of Chapter-7.
The proponent has planned to provide closed storage area for coal & silo for ash storage hence issue of impacts due to mixing of coal & fly ash particles with storm water is not anticipated.
It is suggested to provide the effective noise control & reduction measure for turbine to bring down noise level outside of the turbine area.
Regular maintenance of pollution control measures shall be done to minimise breakdown of control equipment.
Immediately stop manufacturing process till control equipment will be inline.
Implementation of measures and emergency facilities as mentioned in DMP and Emergency action plan.
Proper arrangements to reduce/elimination of chances of failure of hazardous chemical storage for prevention of escape of chemicals during natural disaster.
Decommissioning Phase
The impacts of decommissioning phase would be mainly due to change in air quality, disposal of untreated wastewater and high noise generation. The impacts would be similar to those mentioned in various activities of
The site under decommissioning work shall be ensured with all necessary mitigation measures suggested for prevention of emission & water pollution.
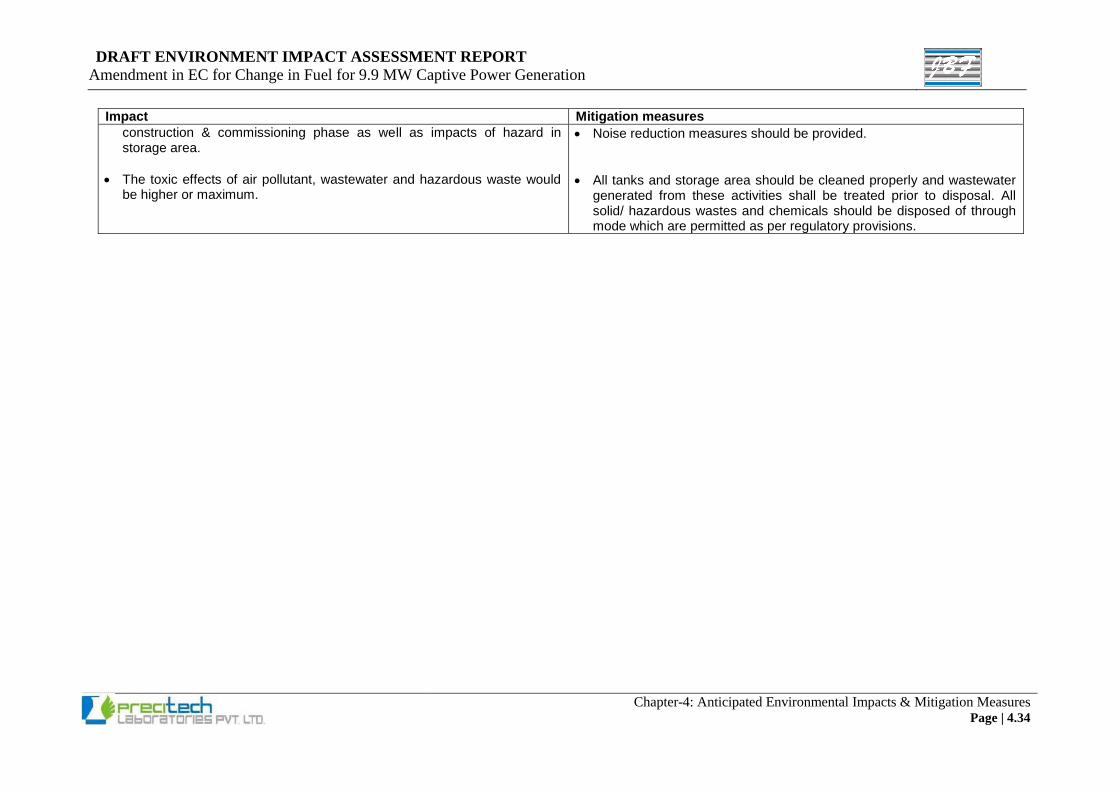
DRAFT ENVIRONMENT IMPACT ASSESSMENT REPORT
Amendment in EC for Change in Fuel for 9.9 MW Captive Power Generation
Chapter-4: Anticipated Environmental Impacts & Mitigation Measures Page | 4.34
Impact Mitigation measures
construction & commissioning phase as well as impacts of hazard in storage area.
The toxic effects of air pollutant, wastewater and hazardous waste would be higher or maximum.
Noise reduction measures should be provided.
All tanks and storage area should be cleaned properly and wastewater generated from these activities shall be treated prior to disposal. All solid/ hazardous wastes and chemicals should be disposed of through mode which are permitted as per regulatory provisions.
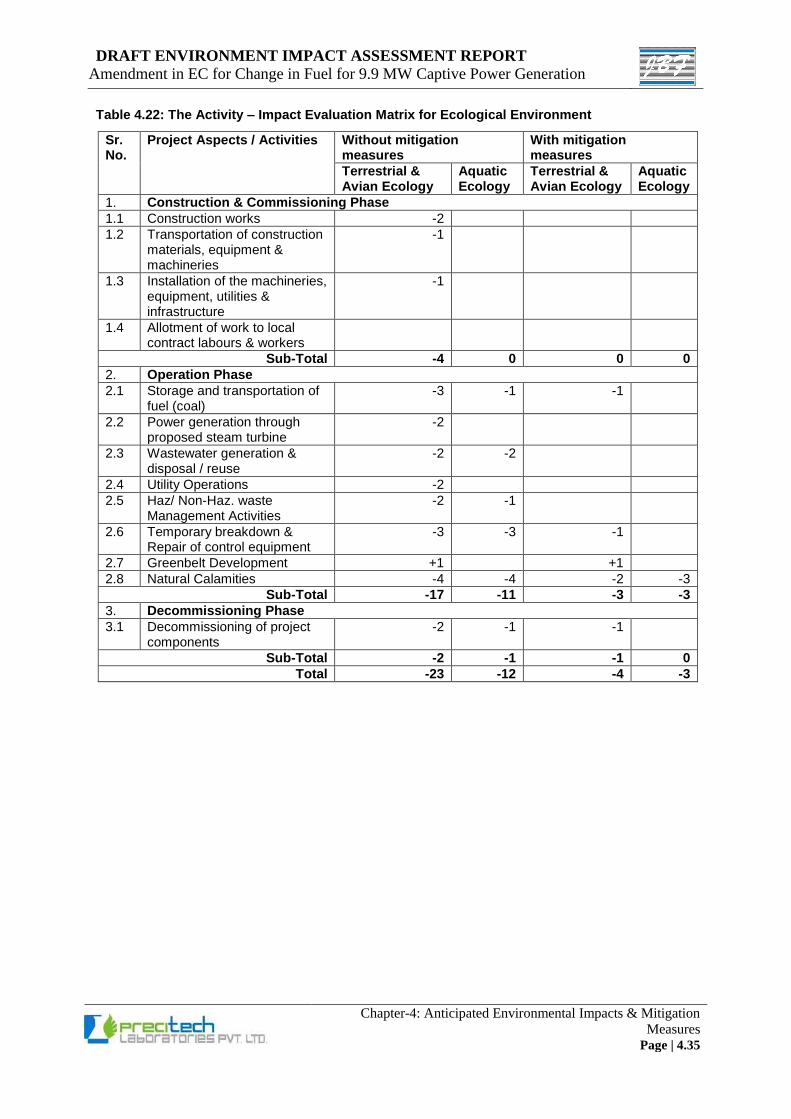
DRAFT ENVIRONMENT IMPACT ASSESSMENT REPORT
Amendment in EC for Change in Fuel for 9.9 MW Captive Power Generation
Chapter-4: Anticipated Environmental Impacts & Mitigation
Measures Page | 4.35
Table 4.22: The Activity – Impact Evaluation Matrix for Ecological Environment
Sr. No.
Project Aspects / Activities Without mitigation measures
With mitigation measures
Terrestrial & Avian Ecology
Aquatic Ecology
Terrestrial & Avian Ecology
Aquatic Ecology
1. Construction & Commissioning Phase
1.1 Construction works -2
1.2 Transportation of construction materials, equipment & machineries
-1
1.3 Installation of the machineries, equipment, utilities & infrastructure
-1
1.4 Allotment of work to local contract labours & workers
Sub-Total -4 0 0 0
2. Operation Phase
2.1 Storage and transportation of fuel (coal)
-3 -1 -1
2.2 Power generation through proposed steam turbine
-2
2.3 Wastewater generation & disposal / reuse
-2 -2
2.4 Utility Operations -2
2.5 Haz/ Non-Haz. waste Management Activities
-2 -1
2.6 Temporary breakdown & Repair of control equipment
-3 -3 -1
2.7 Greenbelt Development +1 +1
2.8 Natural Calamities -4 -4 -2 -3
Sub-Total -17 -11 -3 -3
3. Decommissioning Phase
3.1 Decommissioning of project components
-2 -1 -1
Sub-Total -2 -1 -1 0
Total -23 -12 -4 -3
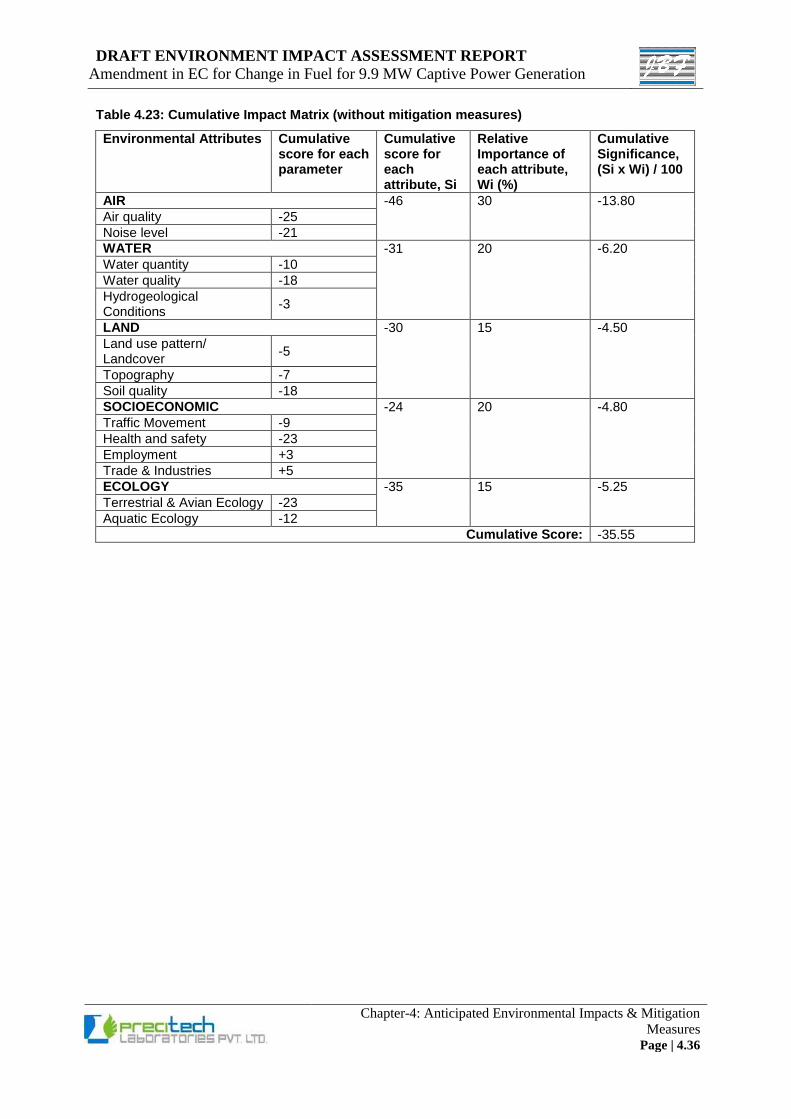
DRAFT ENVIRONMENT IMPACT ASSESSMENT REPORT
Amendment in EC for Change in Fuel for 9.9 MW Captive Power Generation
Chapter-4: Anticipated Environmental Impacts & Mitigation
Measures Page | 4.36
Table 4.23: Cumulative Impact Matrix (without mitigation measures)
Environmental Attributes Cumulative score for each parameter
Cumulative score for each attribute, Si
Relative Importance of each attribute, Wi (%)
Cumulative Significance, (Si x Wi) / 100
AIR -46
30 -13.80 Air quality -25
Noise level -21
WATER -31 20 -6.20 Water quantity -10
Water quality -18
Hydrogeological Conditions
-3
LAND -30 15 -4.50 Land use pattern/
Landcover -5
Topography -7
Soil quality -18
SOCIOECONOMIC -24 20 -4.80 Traffic Movement -9
Health and safety -23
Employment +3
Trade & Industries +5
ECOLOGY -35 15 -5.25 Terrestrial & Avian Ecology -23
Aquatic Ecology -12
Cumulative Score: -35.55
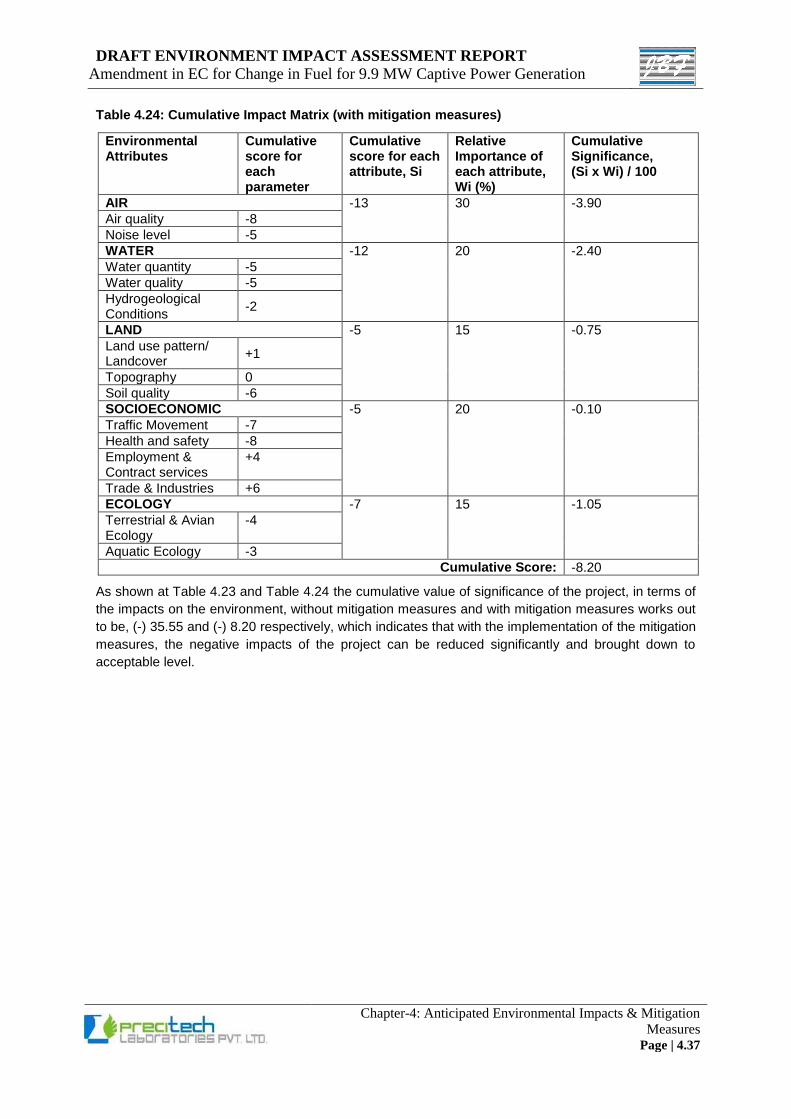
DRAFT ENVIRONMENT IMPACT ASSESSMENT REPORT
Amendment in EC for Change in Fuel for 9.9 MW Captive Power Generation
Chapter-4: Anticipated Environmental Impacts & Mitigation
Measures Page | 4.37
Table 4.24: Cumulative Impact Matrix (with mitigation measures)
Environmental Attributes
Cumulative score for each parameter
Cumulative score for each attribute, Si
Relative Importance of each attribute, Wi (%)
Cumulative Significance, (Si x Wi) / 100
AIR -13 30 -3.90 Air quality -8
Noise level -5
WATER -12 20 -2.40 Water quantity -5
Water quality -5
Hydrogeological Conditions
-2
LAND -5 15 -0.75 Land use pattern/
Landcover +1
Topography 0
Soil quality -6
SOCIOECONOMIC -5 20 -0.10 Traffic Movement -7
Health and safety -8
Employment & Contract services
+4
Trade & Industries +6
ECOLOGY -7 15 -1.05 Terrestrial & Avian
Ecology -4
Aquatic Ecology -3
Cumulative Score: -8.20
As shown at Table 4.23 and Table 4.24 the cumulative value of significance of the project, in terms of
the impacts on the environment, without mitigation measures and with mitigation measures works out
to be, (-) 35.55 and (-) 8.20 respectively, which indicates that with the implementation of the mitigation
measures, the negative impacts of the project can be reduced significantly and brought down to
acceptable level.
DRAFT ENVIRONMENT IMPACT ASSESSMENT REPORT
Amendment in EC for Change in Fuel for 9.9 MW Captive Power Generation
Chapter-5: Analysis of Alternatives
Page | 5.1
5. Analysis of Alternatives 5.1 PURPOSE OF THE STUDY
The details with respect to alternatives for site selection & process for the proposed project has been
summarized & provided in subsequent sections given below.
5.2 SITE ALTERNATIVES
As the proposed project is project for amendment in EC for existing polyester chips manufacturing plant
for change in fuel for 9.9 MW captive power generation. Which is to be carried out within the existing
site as well as plot adjacent to existing site designated for industrial use. Hence, no site alternative is
considered.
5.3 PROCESS ALTERNATIVES
The proposed project is for amendment in EC for existing polyester chips manufacturing plant for
change in fuel for 9.9 MW captive power generation. The existing CPP is mostly Natural gas based
turbine/generators. But currently it is not operating due to very high cost of natural gas. Also, power
generation using natural gas is not economically viable, power supply from DGVCL which is currently
used is also becoming increasingly also. Hence, both conditions are not viable under current domestic
& export market scenario.
After proposed fuel change for captive generation by installing a 9.9 MW coal based steam power plant,
the electrical energy cost can be reduced upto Rs. 5.00 per unit considering interest and depreciation
and would be viable by continuous operation. However, while proposing switch-over of fuels, JBF also
intends to ensure that the proposed installations will meet the permissible norms by installing the
required APCD like ESP and lime dosing system.
After the proposed amendment the company will not add any load on the state power grid, the
surrendered power to DGVCL can be beneficial for other power starved industries. Also, most of the
power in grid supply is based on coal so proposed change in fuel for captive power generation will not
increase the overall coal load as the quantity of grid power consumption will reduce.
Some technology alternatives are as below -
1. Boiler Alternatives:
The thermal power plant requires a boiler and there are several boiler choices available including
pulverized fuel as well as fluidized beds (circulating as well as atmospheric. At a boiler size of 45 tonnes,
the best current option is the Atmospheric Fluidized Bed Combustion (AFBC) boiler. The advantages
of such a boiler are that it allows for changes in fuel S% (since it has the capacity of fluidized boilers to
use limestone for sulphur-di-oxide reduction). A pulverized fuel boiler simply cannot handle fuels with
varying sulphur content owing to the fact that it is not amenable to limestone dosing. A CFBC boiler
allows for limestone dosing and is slightly more efficient compared to AFBC boilers but is not commonly
available at the size required (it is usually available in larger sizes).
2. Cooling System Alternatives:
In normal circumstance cooling media would have been water circulated through cooling towers for
conversion of steam to condensate and its reuse in boiler; however, considering the availability of water
in the Region in general and the necessity of saving water as given in the awarded ToR issued to the
project, the project proponents have decided to use air cooled condensers instead of water cooled
system for the boiler. This saves substantial amounts of water.
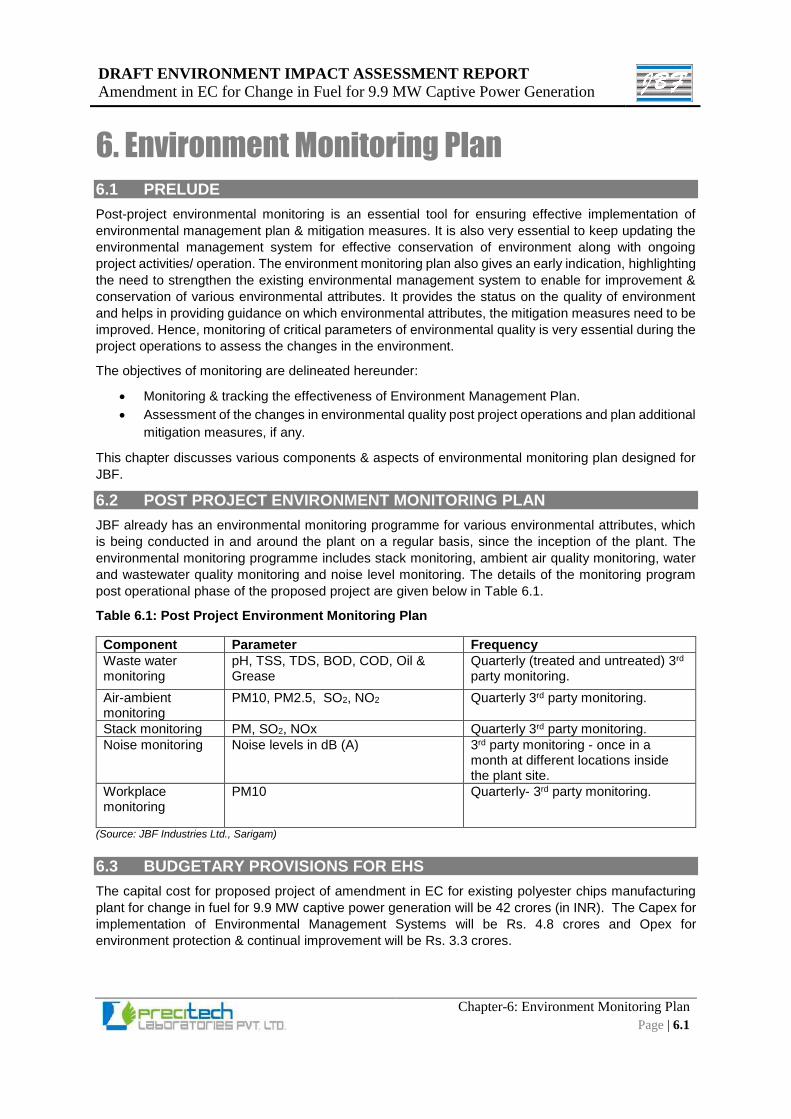
DRAFT ENVIRONMENT IMPACT ASSESSMENT REPORT
Amendment in EC for Change in Fuel for 9.9 MW Captive Power Generation
Chapter-6: Environment Monitoring Plan
Page | 6.1
6. Environment Monitoring Plan
6.1 PRELUDE
Post-project environmental monitoring is an essential tool for ensuring effective implementation of
environmental management plan & mitigation measures. It is also very essential to keep updating the
environmental management system for effective conservation of environment along with ongoing
project activities/ operation. The environment monitoring plan also gives an early indication, highlighting
the need to strengthen the existing environmental management system to enable for improvement &
conservation of various environmental attributes. It provides the status on the quality of environment
and helps in providing guidance on which environmental attributes, the mitigation measures need to be
improved. Hence, monitoring of critical parameters of environmental quality is very essential during the
project operations to assess the changes in the environment.
The objectives of monitoring are delineated hereunder:
Monitoring & tracking the effectiveness of Environment Management Plan.
Assessment of the changes in environmental quality post project operations and plan additional
mitigation measures, if any.
This chapter discusses various components & aspects of environmental monitoring plan designed for
JBF.
6.2 POST PROJECT ENVIRONMENT MONITORING PLAN
JBF already has an environmental monitoring programme for various environmental attributes, which
is being conducted in and around the plant on a regular basis, since the inception of the plant. The
environmental monitoring programme includes stack monitoring, ambient air quality monitoring, water
and wastewater quality monitoring and noise level monitoring. The details of the monitoring program
post operational phase of the proposed project are given below in Table 6.1.
Table 6.1: Post Project Environment Monitoring Plan
Component Parameter Frequency
Waste water monitoring
pH, TSS, TDS, BOD, COD, Oil & Grease
Quarterly (treated and untreated) 3rd party monitoring.
Air-ambient monitoring
PM10, PM2.5, SO2, NO2 Quarterly 3rd party monitoring.
Stack monitoring PM, SO2, NOx Quarterly 3rd party monitoring.
Noise monitoring Noise levels in dB (A) 3rd party monitoring - once in a month at different locations inside the plant site.
Workplace monitoring
PM10 Quarterly- 3rd party monitoring.
(Source: JBF Industries Ltd., Sarigam)
6.3 BUDGETARY PROVISIONS FOR EHS
The capital cost for proposed project of amendment in EC for existing polyester chips manufacturing
plant for change in fuel for 9.9 MW captive power generation will be 42 crores (in INR). The Capex for
implementation of Environmental Management Systems will be Rs. 4.8 crores and Opex for
environment protection & continual improvement will be Rs. 3.3 crores.
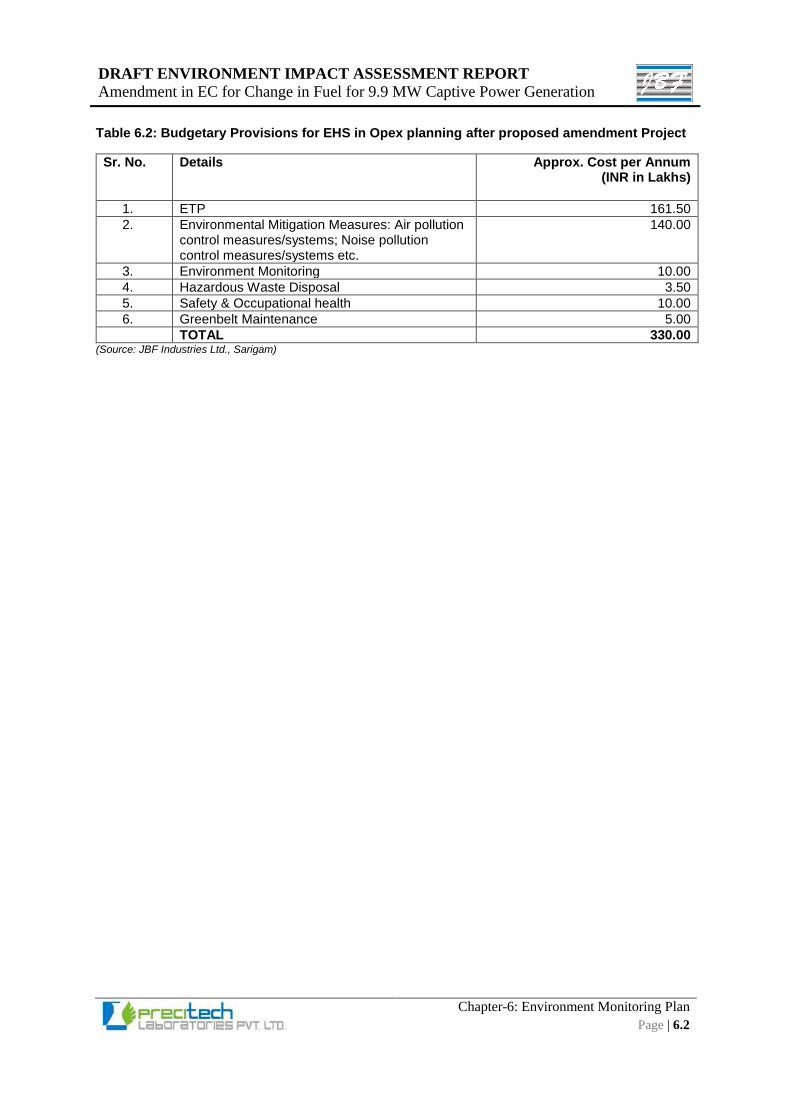
DRAFT ENVIRONMENT IMPACT ASSESSMENT REPORT
Amendment in EC for Change in Fuel for 9.9 MW Captive Power Generation
Chapter-6: Environment Monitoring Plan
Page | 6.2
Table 6.2: Budgetary Provisions for EHS in Opex planning after proposed amendment Project
Sr. No.
Details Approx. Cost per Annum (INR in Lakhs)
1. ETP 161.50
2. Environmental Mitigation Measures: Air pollution control measures/systems; Noise pollution control measures/systems etc.
140.00
3. Environment Monitoring 10.00
4. Hazardous Waste Disposal 3.50
5. Safety & Occupational health 10.00
6. Greenbelt Maintenance 5.00
TOTAL 330.00 (Source: JBF Industries Ltd., Sarigam)
DRAFT ENVIRONMENT IMPACT ASSESSMENT REPORT
Amendment in EC for Change in Fuel for 9.9 MW Captive Power Generation
Chapter-7: Additional Studies
Page | 7.1
7. Additional Studies 7.1 GENERAL
The additional studies as per the generic structure of the EIA report provided in the Appendix III of the
EIA Notification 2006 and it subsequent amendments include the following:
Public Consultation.
Social Impact Assessment. Resettlement & Rehabilitation (R&R) Action Plans.
Risk assessment.
The requirements of the above for the current proposed project are discussed in the subsequent sub-
sections under respective heading.
7.2 PUBLIC CONSULTATION
Public consultation is applicable to the proposed project as per the TOR granted by SEIAA Gujarat.
Hence, Environment Public hearing will be conducted as per the schedule of state pollution control board
and necessary action to address the issues raised in Environment Public hearing will be initiated
immediately after public hearing.
The present report is the “Draft EIA Report” prepared for the Public Hearing procedures. Up on
completion of Public hearing as required, details of public hearing and necessary justification for query
cited in PH will be incorporated for preparation of Final EIA report.
The final EIA report thus prepared will be used for further proceeding for environmental clearance and
other necessary clearances/ certification / licenses.
7.3 RESETTLEMENT & REHABILITATION ACTION PLAN
As described in earlier chapters, the proposed project being an amendment in existing environment
clearance conditions for existing Polyester chips manufacturing plant for change in fuel for 9.9 MW
captive power generation. The proposed installation will be accommodated in the existing land & some
part of proposed installation will be done on additionally adjoining plots. The existing plots and additional
land are/will be taken on lease from the GIDC. Hence, there will not be any resettlement & rehabilitation
due to the proposed project. Therefore, R&R study is not applicable for the proposed project.
7.4 RISK ASSESSMENT & DISASTER MANAGEMENT PLAN
7.4.1 OBECTIVE
The main objectives of the Risk Assessment (RA) study is to determine damage due to major hazards
having damage potential to life & property and provide a scientific basis to assess safety level of the
facility.
The principle objective of this study is to identify major risks in the storage of hazardous fuels at site and
to evaluate on-site & off-site consequences of identified hazard scenarios. Suggestions are given for
effective mitigation of hazards for effective disaster management, suggesting preventive and protective
measures & change of practices to ensure safety.
Relevant information about the existing and proposed storage facilities, process safety and emergency
preparedness of the plant was collated:
1. Based on the existing and proposed storage facilities, certain hazards have been identified and their
consequences modelled mathematically, using HAMS-GPS software. HAMS-GPS, constitutes one
of the most comprehensive Windows based software package that conforms to the
relevant International Standards to study EHS management and advanced consequence modelling
and Quantitative Risk Analysis / Assessment - QRA Study Softwares .
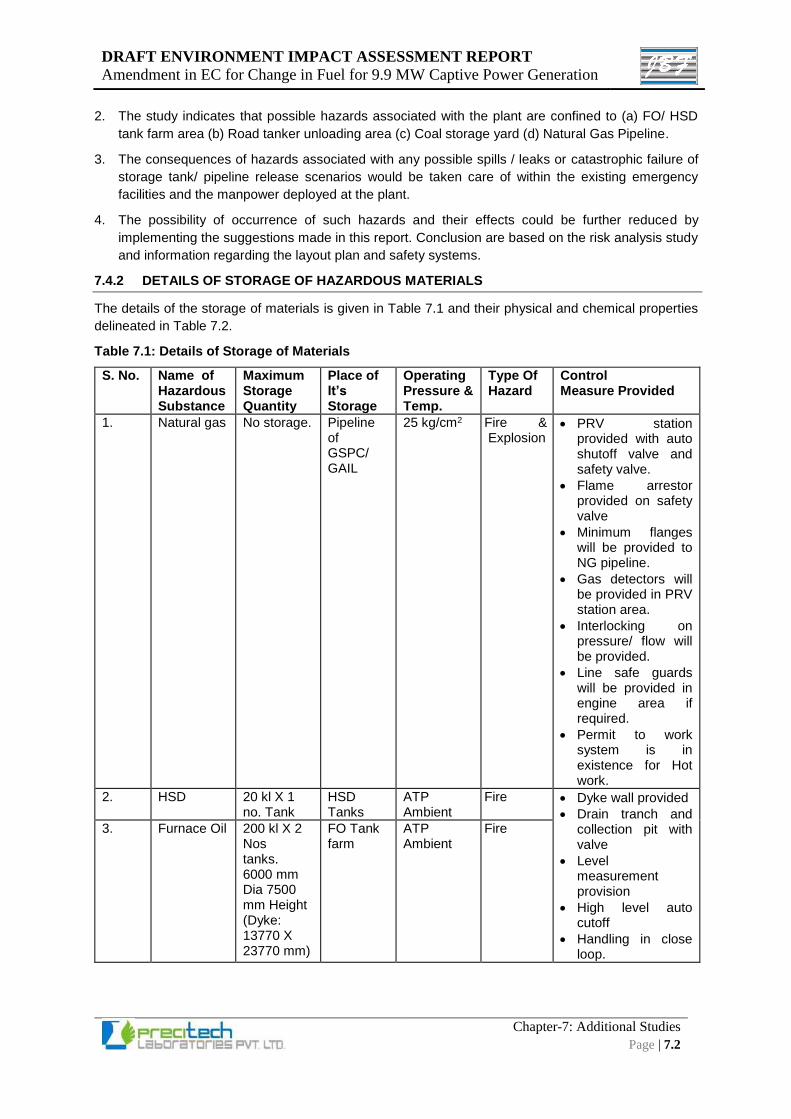
DRAFT ENVIRONMENT IMPACT ASSESSMENT REPORT
Amendment in EC for Change in Fuel for 9.9 MW Captive Power Generation
Chapter-7: Additional Studies
Page | 7.2
2. The study indicates that possible hazards associated with the plant are confined to (a) FO/ HSD
tank farm area (b) Road tanker unloading area (c) Coal storage yard (d) Natural Gas Pipeline.
3. The consequences of hazards associated with any possible spills / leaks or catastrophic failure of
storage tank/ pipeline release scenarios would be taken care of within the existing emergency
facilities and the manpower deployed at the plant.
4. The possibility of occurrence of such hazards and their effects could be further reduced by
implementing the suggestions made in this report. Conclusion are based on the risk analysis study
and information regarding the layout plan and safety systems.
7.4.2 DETAILS OF STORAGE OF HAZARDOUS MATERIALS
The details of the storage of materials is given in Table 7.1 and their physical and chemical properties
delineated in Table 7.2.
Table 7.1: Details of Storage of Materials
S. No. Name of Hazardous Substance
Maximum Storage Quantity
Place of It’s Storage
Operating Pressure & Temp.
Type Of Hazard
Control Measure Provided
1. Natural gas No storage. Pipeline of GSPC/ GAIL
25 kg/cm2 Fire & Explosion
PRV station provided with auto shutoff valve and safety valve.
Flame arrestor provided on safety valve
Minimum flanges will be provided to NG pipeline.
Gas detectors will be provided in PRV station area.
Interlocking on pressure/ flow will be provided.
Line safe guards will be provided in engine area if required.
Permit to work system is in existence for Hot work.
2. HSD 20 kl X 1 no. Tank
HSD Tanks
ATP Ambient
Fire Dyke wall provided
Drain tranch and collection pit with valve
Level measurement provision
High level auto cutoff
Handling in close loop.
3. Furnace Oil 200 kl X 2 Nos tanks. 6000 mm Dia 7500 mm Height (Dyke: 13770 X 23770 mm)
FO Tank farm
ATP Ambient
Fire

DRAFT ENVIRONMENT IMPACT ASSESSMENT REPORT
Amendment in EC for Change in Fuel for 9.9 MW Captive Power Generation
Chapter-7: Additional Studies
Page 7.3
Table 7.2: Hazardous Properties of the Chemicals, Compatibilities and Special Hazard
Sr Name of chemical
Hazard F.P.0 C
BP 0 C
LEL %
UEL %
SP. GR.
20 0 C
VD Solubility with water
at 20 0 c
NFPA H F R
Hazardous combustion
product
TLV / TWA ppm
IDLH ppm
LC50
Target organs
Carcinogenic characteris-
tics
Antidote
1 Natural Gas F/E 221 -162 4 15 0.6 0.6 3.5 % 1 4 0 CO, CO2 1000 N.L. N.L. Respiratory No No specific Antidote
2 Furnace Oil Fire 66 210-215
6.0 13.5 0.82-0.88
N.L Insoluble 0 2 0 N.L. N.L. N.L. N.L. Skin No No specific Antidote
3 HSD Fire 32 0C
215 -376
0.6 6.0 0.86- 0.9
3.0 Insoluble 1 2 0 CO, NO 800 ACGIH
Not listed
5 g/m3 skin No No specific Antidote
4 MEG Fire 111 197.6
3.2 15.3 1.108 2.14 Soluble 1 1 0 NL 100 mg/m3
200 mg/ m3 for 4
Hr.
200 mg/ m3
for 4 Hr.
No No No specific Antidote
FP = FLASH POINT LEL = LOWER EXPLOSIVE LIMIT
UEL = UPPER EXPLOSIVE LIMIT SP.GR = SPECIFIC GRAVITY
VD = VAPOUR DENSITY IDLH = IMMEDIATELY DANGEROUS TO LIFE OR HEALTH
H = HEALTH HAZARD CLASS F = FIRE HAZARD CLASS
R = REACTIVE HAZARD BP = BOILING POINT
TLV = THRESHOLD LIMIT VALUE PPM = PARTS PER MILLION
TWA =TIME WEIGHTED AVERAGE NFPA = NATIONAL FIRE PROTECTION ASSOCIATION-USA LC50 = LETHAL CONCENTRATION N.L. = NOT LISTED
DRAFT ENVIRONMENT IMPACT ASSESSMENT REPORT
Amendment in EC for Change in Fuel for 9.9 MW Captive Power Generation
Chapter-7: Additional Studies
Page 7.4
7.4.3 FACILITIES & SYSTEM OF UNIT
1. Specific safety measures provided for storage and handling of Chemicals.
A. Tank Farm Safety
FO is stored as per petroleum rule requirements. Valid licence is available.
Tank farm location is away from the all hot areas, process area, boiler house and other movement area.
This tank farm area is fenced area with restriction on entry of unauthorized person.
Provision for flexible tanker earthing is provided.
Appropriate Copper Flange Jumpers are provided to prevent any accumulation of Static Electricity during pumping or draining. All electrical, Mechanical equipments along with its accessories are earthed.
Dyke wall is provided to all above ground storage tanks.
Level gauge and level measurement instruments are installed on all storage tanks.
Caution notes and hazard identification boards are displayed.
Safety permit for hazardous material loading & unloading are prepared and implemented.
TREM CARD are provided to all transporters and trained for transportation emergency of hazardous chemicals.
Fire hydrant system is installed throughout the plant.
B. Natural Gas pipeline & PRV station Safety
PRV station is provided with auto shutoff valve and safety valve.
Flame arrestor is provided on safety valve.
Minimum flanges are provided to NG pipeline.
Gas detectors are provided in PRV station area.
Interlocking on pressure/ flow is provided.
Permit to work system is in exists for Hot work.
C. Safety in Coal storage yard
Air circulating within a coal pile should be restricted as it contributes to heating; compacting helps seal air out.
Coal having high moisture content should be segregated and used as quickly as possible. Efforts should be made to keep stored coal from being exposed to moisture.
Dry coal shall be kept dry and should be not exposed to any rain during storage period. This concerns what is known as the heat-of-wetting;
Drying coal is an endothermic process [heat is absorbed] and lowers the temperature of the coal. Wetting (or gaining moisture) is an exothermic process and the liberated heat can accelerate the spontaneous heating of the coal.
Following the "first in, first out" rule of using stock reduces the chance for hot spots by helping preclude heat buildup for portions of stock which remain undisturbed for a long term. The design of coal storage bins is important in this regard.
A high ambient temperature aids the spontaneous heating process.
Use coal as quickly as practicable. The longer large coal piles should allowed to sit, the more time the spontaneous process has to work.
The shape and composition of open stockpiles can help prevent fires. Dumping coal into a big pile with a trestle or grab bucket can lead to problems. Rather, coal should be packed in horizontal layers, which are then leveled by scraping and compacted by rolling. This method helps distribute the coal evenly and thus avoids breakage and segregation of fine coal. Segregation of coal particles by size should be strenuously avoided, as it may allow more air to enter the pile and subsequent heating of finer sizes.
Properly inspect, test and maintain installed fire protection equipment.
Maintain an update pre-fire plan and encourage regular visits to coal facilities by the site or local emergency response force.
Premedical examination, periodical medical examination should be carried out and record needs to be maintained in form No-32 & 33
DRAFT ENVIRONMENT IMPACT ASSESSMENT REPORT
Amendment in EC for Change in Fuel for 9.9 MW Captive Power Generation
Chapter-7: Additional Studies
Page 7.5
Work place monitoring and health and hygiene surveillance should be conducted and regularly work place monitoring needs to be carried out and record to be maintained in Form No-37
Coal conveyer system should be installed with built in safe technology. Pull cord provision should be provided on throughout length of the conveyer belt.
D. Safety in HTM Heaters:
Temperature controller is provided and digitally displayed on control panel.
Pressure gauge are provided in outlet /inlet line.
Safety valves are provided on line and outlet extended to main header.
Temperature & pressure inter locking and cut-off provision is made for safe operation between set parameters.
Emergency OFF button is provided on control panel.
Circulation oil lines is insulated and aluminium cladding is provided on it.
Operation is carried out by skilled and experience operators.
Preventive maintenance is carried out as per SOPs.
Thermic Fluid Heater (TFH) testing is done by competent person once in a year and oil testing is done once in a three months.
TFH coils thickness and hydraulic testing is carried out by competent person once in a year.
E. Safety in Steam boiler (Proposed):
All the necessary licences should be obtained as per IBR for steam boiler.
SOP’s should be prepared for safe operation of steam boiler.
Qualified boiler attendant should be employed for boiler operation in all shifts.
Interlocking and safety valve testing should be done as per statutory requirements.
Preventive maintenance schedule should be prepared as per manufacturing guidelines and as per boiler act.
2. HSE Management System
The company is concerned about the occupational health and safety among its work force as the man
power is the biggest asset to the industry. “Safety of person overrides all production targets” is the
Health, Safety and Environment policy of the company.
The company shall strive to be a leader in the field of management of Health Safety and Environment
as it is the Vision of our Chairman.
To maintain high standard in Health, Safety and Environment, various activities are going on at the site.
A. Health, Safety, Environment & Fire Activities
HSE Policy is formulated with Vision, Commitment and Objectives, for Health, Safety and Environment, and it is signed by our Chairman.
HSE Policy is displayed at various locations of the site and given to all employees in regional languages.
HSE objectives & targets are sets by Top Management and reviewed from time to time.
Safety Plan is being prepared every year with adding of safety initiatives, HSE improvement projects, new developments and based on the result of Risk Assessment and Safety Audits.
Trained safety auditors are carrying safety Audit and Safety Inspection on defined frequency.
Individual Need based Safety Training, Seminars and Work Shops are being conducted for all level of employees by expert faculties.
HSE communication to all employees by various way like safety meeting, daily rack up meeting, e-mail, safety leaflets, notice boards, posters.
Following Safe Work Permit system for all non-routine jobs based on risk assessment.
Well equipped Fire Station with fire crew and maintaining fire-fighting equipments like fire tender, fire hydrant system, fire extinguishers etc.
Investigating all accidents, incidents, near misses by group of team and implementing corrective and preventive measures.
DRAFT ENVIRONMENT IMPACT ASSESSMENT REPORT
Amendment in EC for Change in Fuel for 9.9 MW Captive Power Generation
Chapter-7: Additional Studies
Page 7.6
B. Health Activities
Well equipped Medical and Occupational Health Centre with 24 hours Medical Officer and staff.
Regular health checkups of all employees
Computerization Medical data of employees.
Pre-employment and periodical medical check up of all employees including contractor’s employees.
Organising health promotional programs for employees.
C. Environment Activities
Regular monitoring of Ambient Air in production hall.
Regular Noise monitoring in High Noise areas.
Developed Green Belt in site.
Tree Plantation every year inside the site.
Training programme for employees on EHS.
HSE audit is carried out regularly by internal and external agencies.
7.4.4 FIRE PREVENATION & PROTECTION SYSTEM
A. Fire Extinguishers
Table 7.3: List of Fire Extinguishers
S. No. Type Existing Quantity
1. ABC Extinguisher (5 Kg) 40
2. DCP Extinguisher (5 Kg) 146
3. DCP Extinguisher (10 Kg) 27
4. CO2 type fire extinguishers (4.5 Kg) 132
5. CO2 type fire extinguishers (6.5 Kg) 58
6. CO2 type fire extinguishers (22.5 Kg) 16
7. Foam type Extinguishers 9 (Lits.) 52
8. Water type Fire extinguishers(50 Lits.) 06
B. Fire Water Reservoir :- 1700 m3 storage tank
C. Fire Pump
Table 7.4: Fire Pump Details
Pump Detail Number of
Pump Head
Capacity (Flow)
KW/HP
Jockey Pump 01 70 m 11 m3/hr 11/15
Electrical Pump 01 70 m 273 m3/hr 55/75
Diesel Pump 01 70 m 273 m3/hr 66.2/90
Total 03
D. Fire hydrant
Table 7.5: Fire Hydrant Details
Area / Plant Nos. of Hydrant with Hose Box Nos. of Monitors
All over plant Total no of Single Hydrant. – 50 Nos Double Hydrant - 01 No Fire Escape Hydrant -19 Nos
NA
DRAFT ENVIRONMENT IMPACT ASSESSMENT REPORT
Amendment in EC for Change in Fuel for 9.9 MW Captive Power Generation
Chapter-7: Additional Studies
Page 7.7
E. Emergency Equipments
Table 7.6: List of Emergency Equipments
S. No. Wheeled Equipment Existing
1 Sand scoops 152
2 Safety helmets 179
3 Water curtain nozzles 100
4 Stretchers 02
5 First aid box with antisnake serum 10
6 Rubber hand gloves 183
7 Explosive meter 1
8 Fire entry suit without breathing apparatus 01
9 Resuscitator 1
10 Electric siren with 1 km range 15
11 Hand operated siren
12 Water gel blandest 06
13 Red/green flags for fire drill 03
14 Pressure type self-contained breathing apparatus with spare cylinder (45 minutes)
03 Nos. & 02 Nos. spare
cylinder.
15 Safety Shower 08
F. Emergency Mitigation Measures and Emergency Control Facilities.
Fire Hydrant system is installed as per NFPA norms and will be extended for proposed plant.
Fire extinguishers are installed as per Fire load requirements and additional will be installed in proposed project.
Full fledge fire and EHS department available with adequate resources round the clock.
Fire tender is available at site round the clock.
Emergency team is well prepared to combat or tackle any emergency.
On site emergency plan (Emergency preparedness plan is prepared and regular Mock- drill conducted.
Proposed hazards and control measures will be incorporated in updated on site Emergency Plan.
G. Sprinkler System
The detailed layout plan incorporating number of sprinklers installed, pipe diameter and nozzle diameter
of sprinklers, quantity of water to be consumed by sprinklers are prepared in the detailed engineering
stage and submitted to the GPCB at the time of application of Consolidated Consent and Authorization.
Number of sprinklers to be installed – 234 Nos.
Pipe diameter of the sprinklers - 50 mm, 40 mm & 25 mm
Nozzle diameter of the sprinklers – 12.7 mm
Layout of sprinkler system is given in Figure No. 7.1.
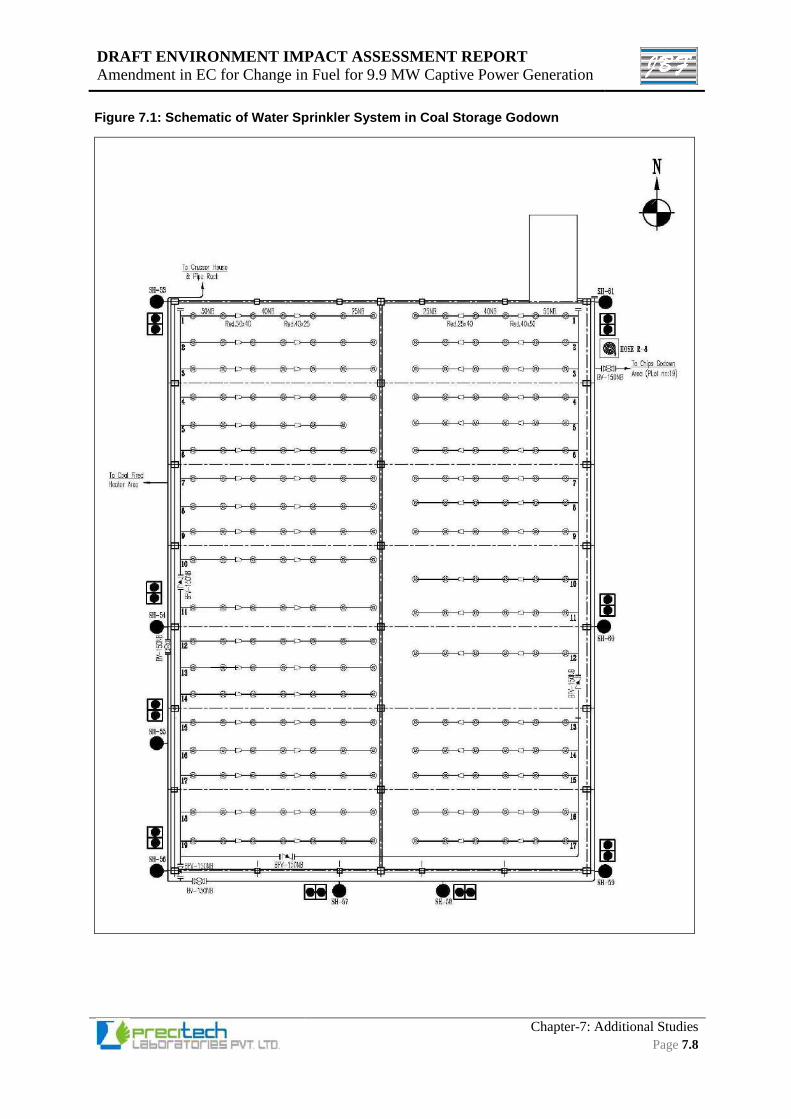
DRAFT ENVIRONMENT IMPACT ASSESSMENT REPORT
Amendment in EC for Change in Fuel for 9.9 MW Captive Power Generation
Chapter-7: Additional Studies
Page 7.8
Figure 7.1: Schematic of Water Sprinkler System in Coal Storage Godown
DRAFT ENVIRONMENT IMPACT ASSESSMENT REPORT
Amendment in EC for Change in Fuel for 9.9 MW Captive Power Generation
Chapter-7: Additional Studies
Page 7.9
7.4.5 DETAILS OF OCCUPATIONAL HEALTH PROGRAMME
Details of occupational health surveillance programme.
In process there is no any high noise, high heat stress and low level illumination exposure to
workers.
Manual material handling only the causes of musculo-sketal disorders (MSD), backache, pain
in minor and major joints, fatigue etc. following measure have been taken to avoid above
mentioned ill health effect to workers.
Below 25 kgs weight will be handling by a worker if required to do so.
Material handling lorry-cart, drum handling trolley, fork lift, stacker, etc. will be used for material
handling.
Training will be carried out for Manual material handling.
Ergonomics study will be carried out before commissioning of the plant and correct material
flow, Process flow of work place will be designed.
Following activities will be carried out for Occupational health of the workers.
Treatment part (OPD) for both company and contractor employees.
Occupational related problems will be studded like ergonomic issues and control measures
Prevention part- Pre medical examination and periodical medical examination for operators,
helpers, chemists.
Profile active (Health Awareness programme)
Due to use of Coal as fuel in proposed project, Coal dust hazard may occur. Coal dust is hazardous to
respiratory exposure by a worker.
TWA limit: 0.9 mg/m3 - measured according to American Conference of Governmental Industrial
Hygienists ( ACGIH) criteria.
Occupational effect to worker: pneumoconiosis due to long exposure of Coal dust.
Measurement of exposure level of Coal dust in work place:
As per Factories Act, it is mandatory to carry out work place monitoring in such areas where exposure
of Coal dust is possible and record should be maintained. If the exposure level found is above TWA
limit, company has to provide engineering controls to control exposure level at any time below TWA
limit.
Control measures to be adopted by company to control Coal dust exposure in work place.
Separate Coal storage yard is provided, sufficiently away from the manufacturing plants.
Coal receiving, handling and storage facility is designed in such a way that Coal dust exposure
level should remain below TWA limit at all times.
The handling and storage facilities is automated as far as possible to minimize manual handling.
Sprinkling facilities are provided during transportation and handling of Coal through conveyor
belt to avoid wind blown dust.
Optimum inventory level is/ should be maintained in Coal yard.
Personal protective equipments is/ should be provided and its use should be made compulsory
for all employees working in this area.
Fire protection system like hydrant system and sprinkler system are installed in Coal yard.
Periodical medical examination is/ should be carried out for all workers including contractor labor
perticularly for Coal dust exposure test and record to be maintaned.
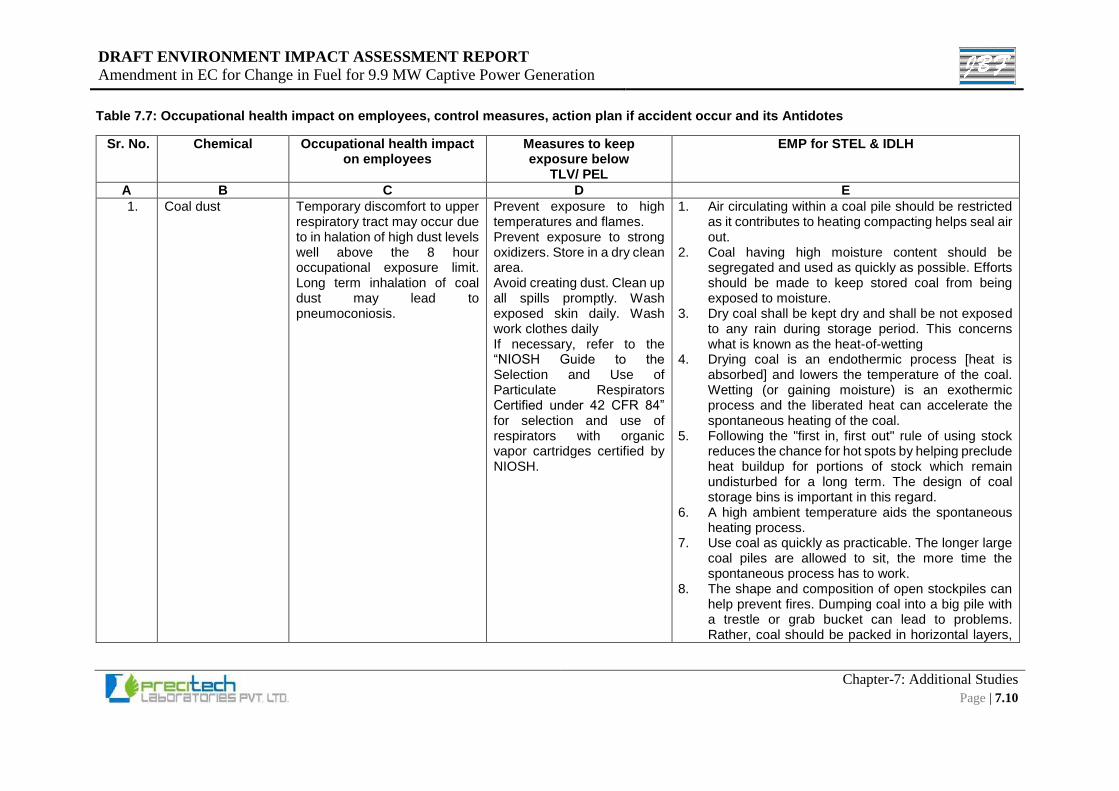
DRAFT ENVIRONMENT IMPACT ASSESSMENT REPORT
Amendment in EC for Change in Fuel for 9.9 MW Captive Power Generation
Chapter-7: Additional Studies
Page | 7.10
Table 7.7: Occupational health impact on employees, control measures, action plan if accident occur and its Antidotes
Sr. No. Chemical Occupational health impact on employees
Measures to keep exposure below
TLV/ PEL
EMP for STEL & IDLH
A B C D E
1. Coal dust Temporary discomfort to upper respiratory tract may occur due to in halation of high dust levels well above the 8 hour occupational exposure limit. Long term inhalation of coal dust may lead to pneumoconiosis.
Prevent exposure to high temperatures and flames. Prevent exposure to strong oxidizers. Store in a dry clean area. Avoid creating dust. Clean up all spills promptly. Wash exposed skin daily. Wash work clothes daily If necessary, refer to the “NIOSH Guide to the Selection and Use of Particulate Respirators Certified under 42 CFR 84” for selection and use of respirators with organic vapor cartridges certified by NIOSH.
1. Air circulating within a coal pile should be restricted as it contributes to heating compacting helps seal air out.
2. Coal having high moisture content should be segregated and used as quickly as possible. Efforts should be made to keep stored coal from being exposed to moisture.
3. Dry coal shall be kept dry and shall be not exposed to any rain during storage period. This concerns what is known as the heat-of-wetting
4. Drying coal is an endothermic process [heat is absorbed] and lowers the temperature of the coal. Wetting (or gaining moisture) is an exothermic process and the liberated heat can accelerate the spontaneous heating of the coal.
5. Following the "first in, first out" rule of using stock reduces the chance for hot spots by helping preclude heat buildup for portions of stock which remain undisturbed for a long term. The design of coal storage bins is important in this regard.
6. A high ambient temperature aids the spontaneous heating process.
7. Use coal as quickly as practicable. The longer large coal piles are allowed to sit, the more time the spontaneous process has to work.
8. The shape and composition of open stockpiles can help prevent fires. Dumping coal into a big pile with a trestle or grab bucket can lead to problems. Rather, coal should be packed in horizontal layers,
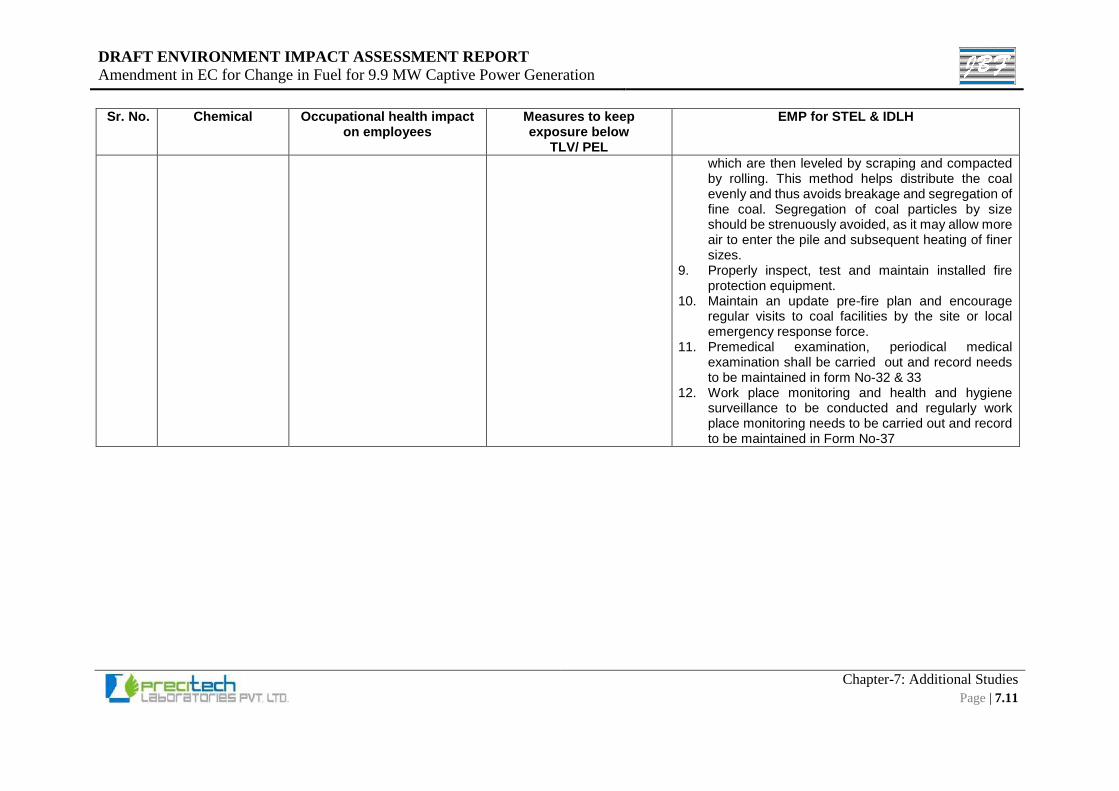
DRAFT ENVIRONMENT IMPACT ASSESSMENT REPORT
Amendment in EC for Change in Fuel for 9.9 MW Captive Power Generation
Chapter-7: Additional Studies
Page | 7.11
Sr. No. Chemical Occupational health impact on employees
Measures to keep exposure below
TLV/ PEL
EMP for STEL & IDLH
which are then leveled by scraping and compacted by rolling. This method helps distribute the coal evenly and thus avoids breakage and segregation of fine coal. Segregation of coal particles by size should be strenuously avoided, as it may allow more air to enter the pile and subsequent heating of finer sizes.
9. Properly inspect, test and maintain installed fire protection equipment.
10. Maintain an update pre-fire plan and encourage regular visits to coal facilities by the site or local emergency response force.
11. Premedical examination, periodical medical examination shall be carried out and record needs to be maintained in form No-32 & 33
12. Work place monitoring and health and hygiene surveillance to be conducted and regularly work place monitoring needs to be carried out and record to be maintained in Form No-37
DRAFT ENVIRONMENT IMPACT ASSESSMENT REPORT
Amendment in EC for Change in Fuel for 9.9 MW Captive Power Generation
Chapter-7: Additional Studies
Page | 7.12
7.4.6 DO’S & DONT’S FOR STRENTHENING HSE
DO’s: Wash affected part immediately with plenty of water.
Take the patients affected by toxic vapour to well ventilated area.
In case of vapor inhalation/gas poisoning, immediately render first aid to the patient and then
move the patient to First Aid Centre.
In case of emergency everyone should try to reach at Assembly point. Move in direction
perpendicular to direction of gas leakage.
In case of emergency all (except emergency staff) should reach at nearest assembly point.
In case of vapour inhalation/gas poisoning, immediately render first aid to the patient and then
move to First Aid Centre.
Use ear plug/muff in high noise area.
Work permit system to be followed before starting any hot work, vessel entry or working at
height.
Barricade and mark hazardous/unsafe area
Ensure use of safety belt while working at height.
Electrical cables should be protected from water and from attack by corrosive substances.
Maintain good housing keeping, it will eliminate many unnecessary hazards.
Protruding nail should be pulled out or bent over.
All aisles, passage ways and stairways should be maintained, clean and unobstructed.
Employees must know the locations of fire extinguisher and fire exists.
During emergency be calm and do not get panicky.
DON’T’s:
Smoking or carry cigarettes/ bidis, match box, lighter, mobile phone or any instruments etc. in
the plant/battery limit area. It is prohibited.
Unauthorized entry into battery limits of every plant is prohibited.
Moving in the plant area without wearing safety helmet and safety shoes is not permitted.
Wearing of loose garments, ornaments etc. in the plant area.
Cotton waste, paper, oil etc. should not be left in plant area.
Do not follow shortcuts, use proper roads, pathways, wherever provided.
Do not wear chappals or slippers in the plant.
No automobile vehicle should be allowed to enter in the plant area without muffler or exhaust.
Chewing of tobacco, betel nut, chewing gum and other such items are not allowed in any of
process utility area.
7.4.7 HAZARD IDENTIFICATION & CONSEQUENCE ANALYSIS
The details of probable hazards and consequences analysis for the probable hazards associated with
the hazardous materials of the proposed project are described below.
7.4.7.1 HAZARD IDENTIFICATION
Risk assessment process rests on identification of specific hazards, hazardous areas and areas
vulnerable to effects of hazardous situations in facilities involved in processing and storage of
chemicals.
Hazards posed by particular installation or a particular activity can be broadly classified into fire/
explosion hazards and toxicity hazards. Whether a particular activity is fire/explosion hazardous or
toxicity hazardous, it primarily depends on the materials handled and their properties.
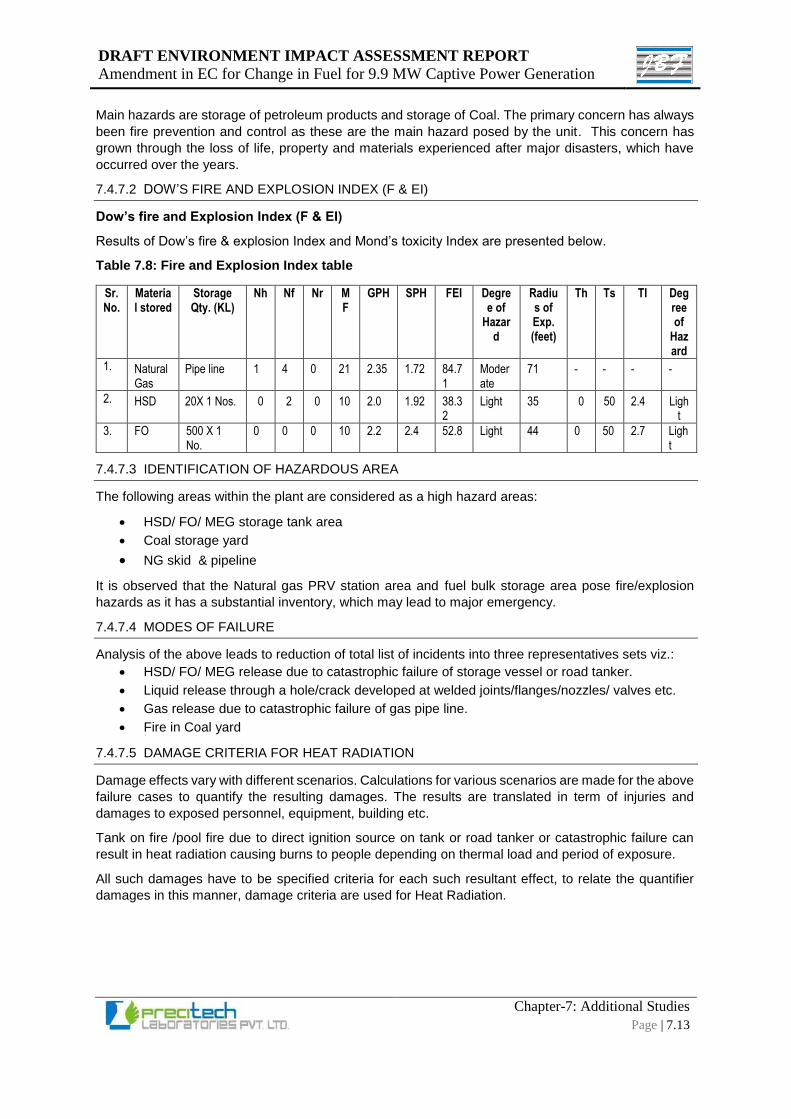
DRAFT ENVIRONMENT IMPACT ASSESSMENT REPORT
Amendment in EC for Change in Fuel for 9.9 MW Captive Power Generation
Chapter-7: Additional Studies
Page | 7.13
Main hazards are storage of petroleum products and storage of Coal. The primary concern has always
been fire prevention and control as these are the main hazard posed by the unit. This concern has
grown through the loss of life, property and materials experienced after major disasters, which have
occurred over the years.
7.4.7.2 DOW’S FIRE AND EXPLOSION INDEX (F & EI)
Dow’s fire and Explosion Index (F & EI)
Results of Dow’s fire & explosion Index and Mond’s toxicity Index are presented below.
Table 7.8: Fire and Explosion Index table
Sr. No.
Material stored
Storage Qty. (KL)
Nh Nf Nr MF
GPH SPH FEI Degree of
Hazard
Radius of Exp. (feet)
Th Ts TI Degree of
Hazard
1. Natural Gas
Pipe line 1 4 0 21 2.35 1.72 84.71
Moderate
71 - - - -
2. HSD 20X 1 Nos. 0 2 0 10 2.0 1.92 38.32
Light 35 0 50 2.4 Light
3. FO 500 X 1 No.
0 0 0 10 2.2 2.4 52.8 Light 44 0 50 2.7 Light
7.4.7.3 IDENTIFICATION OF HAZARDOUS AREA
The following areas within the plant are considered as a high hazard areas:
HSD/ FO/ MEG storage tank area
Coal storage yard
NG skid & pipeline
It is observed that the Natural gas PRV station area and fuel bulk storage area pose fire/explosion
hazards as it has a substantial inventory, which may lead to major emergency.
7.4.7.4 MODES OF FAILURE
Analysis of the above leads to reduction of total list of incidents into three representatives sets viz.:
HSD/ FO/ MEG release due to catastrophic failure of storage vessel or road tanker.
Liquid release through a hole/crack developed at welded joints/flanges/nozzles/ valves etc.
Gas release due to catastrophic failure of gas pipe line.
Fire in Coal yard
7.4.7.5 DAMAGE CRITERIA FOR HEAT RADIATION
Damage effects vary with different scenarios. Calculations for various scenarios are made for the above
failure cases to quantify the resulting damages. The results are translated in term of injuries and
damages to exposed personnel, equipment, building etc.
Tank on fire /pool fire due to direct ignition source on tank or road tanker or catastrophic failure can
result in heat radiation causing burns to people depending on thermal load and period of exposure.
All such damages have to be specified criteria for each such resultant effect, to relate the quantifier
damages in this manner, damage criteria are used for Heat Radiation.
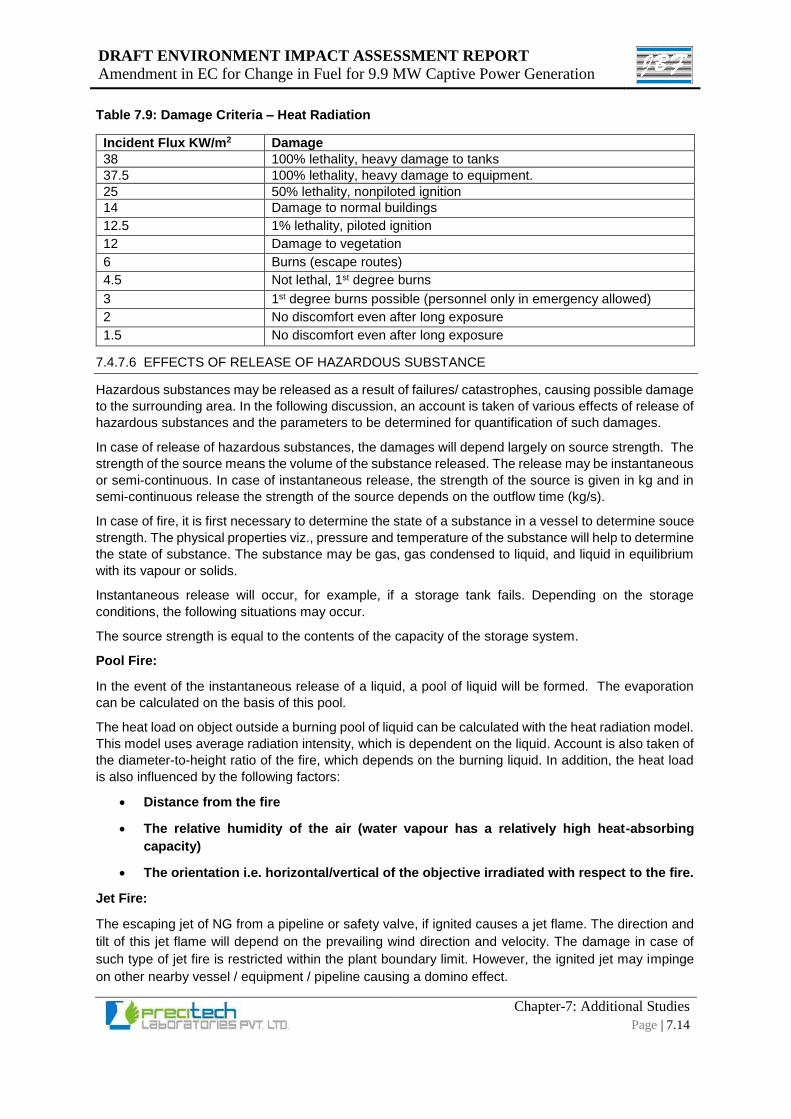
DRAFT ENVIRONMENT IMPACT ASSESSMENT REPORT
Amendment in EC for Change in Fuel for 9.9 MW Captive Power Generation
Chapter-7: Additional Studies
Page | 7.14
Table 7.9: Damage Criteria – Heat Radiation
Incident Flux KW/m2 Damage
38 100% lethality, heavy damage to tanks
37.5 100% lethality, heavy damage to equipment.
25 50% lethality, nonpiloted ignition
14 Damage to normal buildings
12.5 1% lethality, piloted ignition
12 Damage to vegetation
6 Burns (escape routes)
4.5 Not lethal, 1st degree burns
3 1st degree burns possible (personnel only in emergency allowed)
2 No discomfort even after long exposure
1.5 No discomfort even after long exposure
7.4.7.6 EFFECTS OF RELEASE OF HAZARDOUS SUBSTANCE
Hazardous substances may be released as a result of failures/ catastrophes, causing possible damage
to the surrounding area. In the following discussion, an account is taken of various effects of release of
hazardous substances and the parameters to be determined for quantification of such damages.
In case of release of hazardous substances, the damages will depend largely on source strength. The
strength of the source means the volume of the substance released. The release may be instantaneous
or semi-continuous. In case of instantaneous release, the strength of the source is given in kg and in
semi-continuous release the strength of the source depends on the outflow time (kg/s).
In case of fire, it is first necessary to determine the state of a substance in a vessel to determine souce
strength. The physical properties viz., pressure and temperature of the substance will help to determine
the state of substance. The substance may be gas, gas condensed to liquid, and liquid in equilibrium
with its vapour or solids.
Instantaneous release will occur, for example, if a storage tank fails. Depending on the storage
conditions, the following situations may occur.
The source strength is equal to the contents of the capacity of the storage system.
Pool Fire:
In the event of the instantaneous release of a liquid, a pool of liquid will be formed. The evaporation
can be calculated on the basis of this pool.
The heat load on object outside a burning pool of liquid can be calculated with the heat radiation model.
This model uses average radiation intensity, which is dependent on the liquid. Account is also taken of
the diameter-to-height ratio of the fire, which depends on the burning liquid. In addition, the heat load
is also influenced by the following factors:
Distance from the fire
The relative humidity of the air (water vapour has a relatively high heat-absorbing
capacity)
The orientation i.e. horizontal/vertical of the objective irradiated with respect to the fire.
Jet Fire:
The escaping jet of NG from a pipeline or safety valve, if ignited causes a jet flame. The direction and
tilt of this jet flame will depend on the prevailing wind direction and velocity. The damage in case of
such type of jet fire is restricted within the plant boundary limit. However, the ignited jet may impinge
on other nearby vessel / equipment / pipeline causing a domino effect.
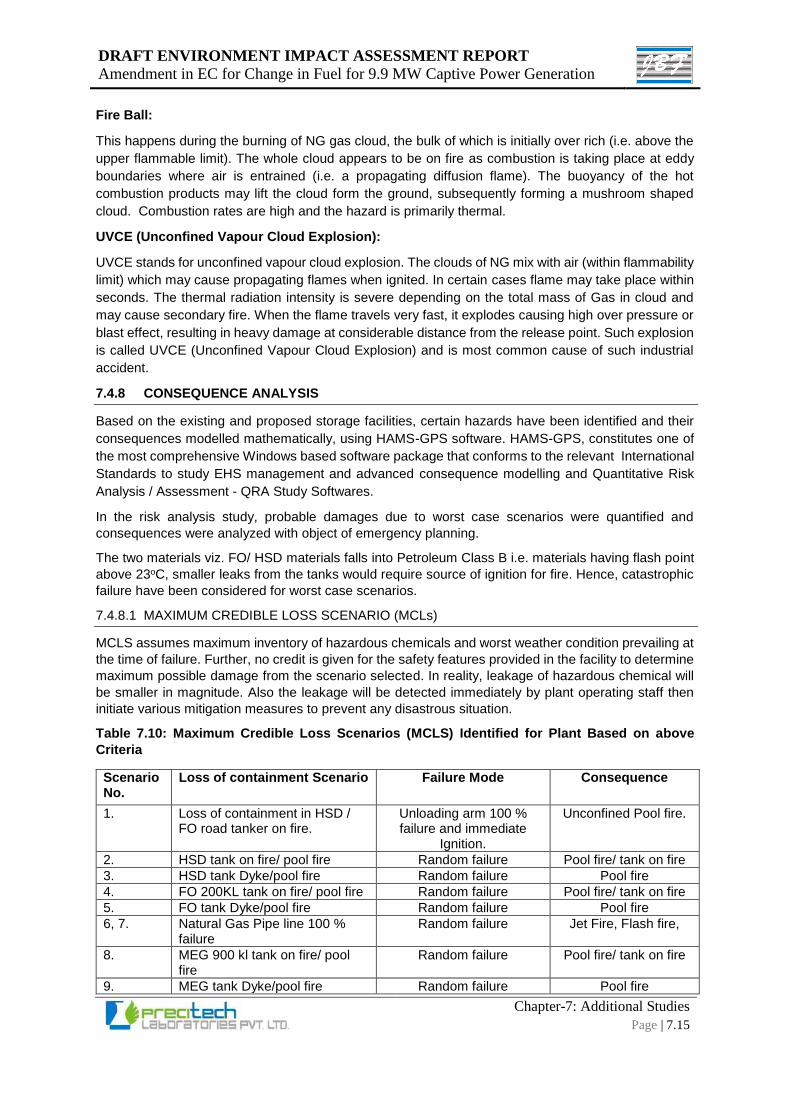
DRAFT ENVIRONMENT IMPACT ASSESSMENT REPORT
Amendment in EC for Change in Fuel for 9.9 MW Captive Power Generation
Chapter-7: Additional Studies
Page | 7.15
Fire Ball:
This happens during the burning of NG gas cloud, the bulk of which is initially over rich (i.e. above the
upper flammable limit). The whole cloud appears to be on fire as combustion is taking place at eddy
boundaries where air is entrained (i.e. a propagating diffusion flame). The buoyancy of the hot
combustion products may lift the cloud form the ground, subsequently forming a mushroom shaped
cloud. Combustion rates are high and the hazard is primarily thermal.
UVCE (Unconfined Vapour Cloud Explosion):
UVCE stands for unconfined vapour cloud explosion. The clouds of NG mix with air (within flammability
limit) which may cause propagating flames when ignited. In certain cases flame may take place within
seconds. The thermal radiation intensity is severe depending on the total mass of Gas in cloud and
may cause secondary fire. When the flame travels very fast, it explodes causing high over pressure or
blast effect, resulting in heavy damage at considerable distance from the release point. Such explosion
is called UVCE (Unconfined Vapour Cloud Explosion) and is most common cause of such industrial
accident.
7.4.8 CONSEQUENCE ANALYSIS
Based on the existing and proposed storage facilities, certain hazards have been identified and their
consequences modelled mathematically, using HAMS-GPS software. HAMS-GPS, constitutes one of
the most comprehensive Windows based software package that conforms to the relevant International
Standards to study EHS management and advanced consequence modelling and Quantitative Risk
Analysis / Assessment - QRA Study Softwares.
In the risk analysis study, probable damages due to worst case scenarios were quantified and
consequences were analyzed with object of emergency planning.
The two materials viz. FO/ HSD materials falls into Petroleum Class B i.e. materials having flash point
above 23oC, smaller leaks from the tanks would require source of ignition for fire. Hence, catastrophic
failure have been considered for worst case scenarios.
7.4.8.1 MAXIMUM CREDIBLE LOSS SCENARIO (MCLs)
MCLS assumes maximum inventory of hazardous chemicals and worst weather condition prevailing at
the time of failure. Further, no credit is given for the safety features provided in the facility to determine
maximum possible damage from the scenario selected. In reality, leakage of hazardous chemical will
be smaller in magnitude. Also the leakage will be detected immediately by plant operating staff then
initiate various mitigation measures to prevent any disastrous situation.
Table 7.10: Maximum Credible Loss Scenarios (MCLS) Identified for Plant Based on above
Criteria
Scenario No.
Loss of containment Scenario Failure Mode Consequence
1. Loss of containment in HSD / FO road tanker on fire.
Unloading arm 100 % failure and immediate
Ignition.
Unconfined Pool fire.
2. HSD tank on fire/ pool fire Random failure Pool fire/ tank on fire
3. HSD tank Dyke/pool fire Random failure Pool fire
4. FO 200KL tank on fire/ pool fire Random failure Pool fire/ tank on fire
5. FO tank Dyke/pool fire Random failure Pool fire
6, 7. Natural Gas Pipe line 100 % failure
Random failure Jet Fire, Flash fire,
8. MEG 900 kl tank on fire/ pool fire
Random failure Pool fire/ tank on fire
9. MEG tank Dyke/pool fire Random failure Pool fire
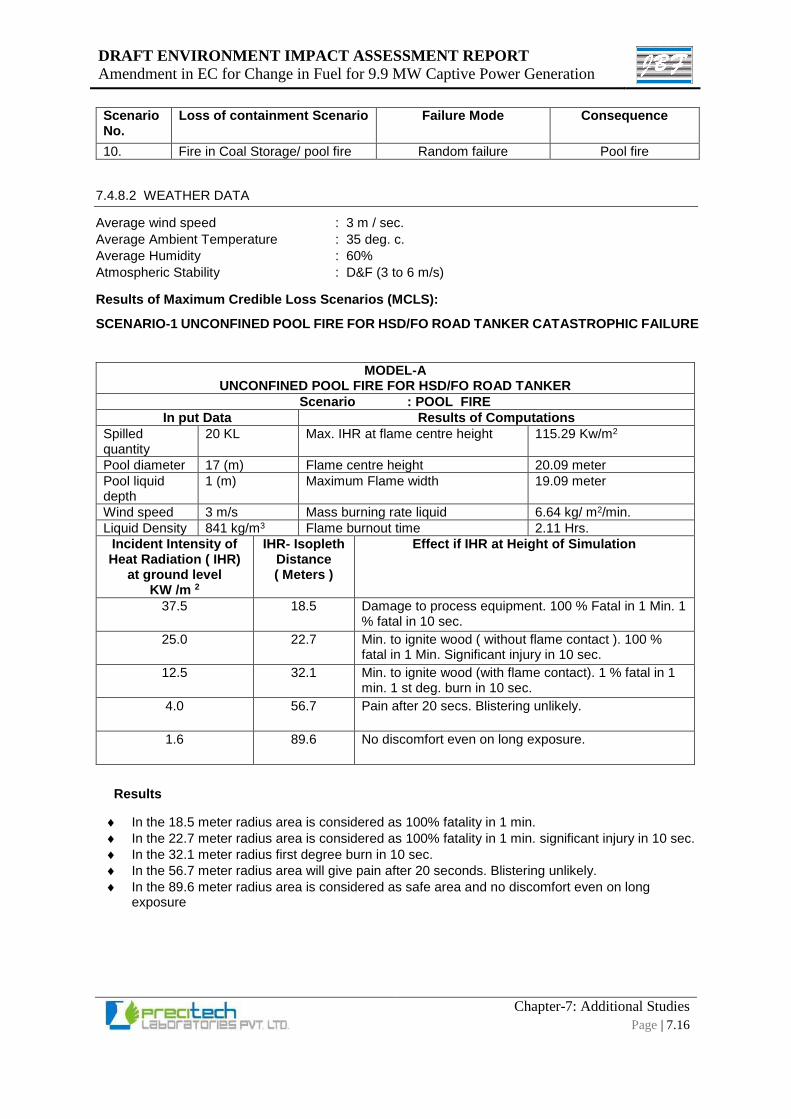
DRAFT ENVIRONMENT IMPACT ASSESSMENT REPORT
Amendment in EC for Change in Fuel for 9.9 MW Captive Power Generation
Chapter-7: Additional Studies
Page | 7.16
Scenario No.
Loss of containment Scenario Failure Mode Consequence
10. Fire in Coal Storage/ pool fire Random failure Pool fire
7.4.8.2 WEATHER DATA
Average wind speed : 3 m / sec.
Average Ambient Temperature : 35 deg. c.
Average Humidity : 60%
Atmospheric Stability : D&F (3 to 6 m/s)
Results of Maximum Credible Loss Scenarios (MCLS):
SCENARIO-1 UNCONFINED POOL FIRE FOR HSD/FO ROAD TANKER CATASTROPHIC FAILURE
MODEL-A UNCONFINED POOL FIRE FOR HSD/FO ROAD TANKER
Scenario : POOL FIRE
In put Data Results of Computations
Spilled quantity
20 KL Max. IHR at flame centre height 115.29 Kw/m2
Pool diameter 17 (m) Flame centre height 20.09 meter
Pool liquid depth
1 (m) Maximum Flame width 19.09 meter
Wind speed 3 m/s Mass burning rate liquid 6.64 kg/ m2/min.
Liquid Density 841 kg/m3 Flame burnout time 2.11 Hrs.
Incident Intensity of Heat Radiation ( IHR)
at ground level KW /m 2
IHR- Isopleth Distance ( Meters )
Effect if IHR at Height of Simulation
37.5 18.5 Damage to process equipment. 100 % Fatal in 1 Min. 1 % fatal in 10 sec.
25.0 22.7 Min. to ignite wood ( without flame contact ). 100 % fatal in 1 Min. Significant injury in 10 sec.
12.5 32.1 Min. to ignite wood (with flame contact). 1 % fatal in 1 min. 1 st deg. burn in 10 sec.
4.0 56.7 Pain after 20 secs. Blistering unlikely.
1.6 89.6 No discomfort even on long exposure.
Results
In the 18.5 meter radius area is considered as 100% fatality in 1 min.
In the 22.7 meter radius area is considered as 100% fatality in 1 min. significant injury in 10 sec.
In the 32.1 meter radius first degree burn in 10 sec.
In the 56.7 meter radius area will give pain after 20 seconds. Blistering unlikely.
In the 89.6 meter radius area is considered as safe area and no discomfort even on long exposure
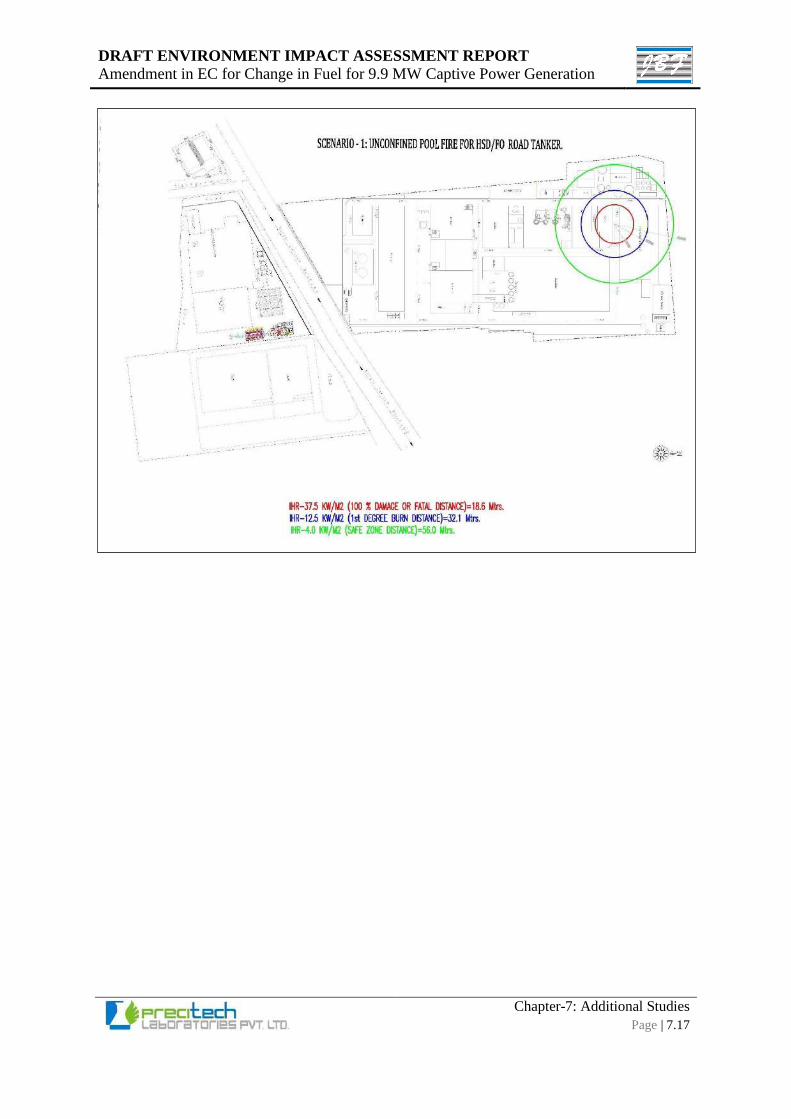
DRAFT ENVIRONMENT IMPACT ASSESSMENT REPORT
Amendment in EC for Change in Fuel for 9.9 MW Captive Power Generation
Chapter-7: Additional Studies
Page | 7.17
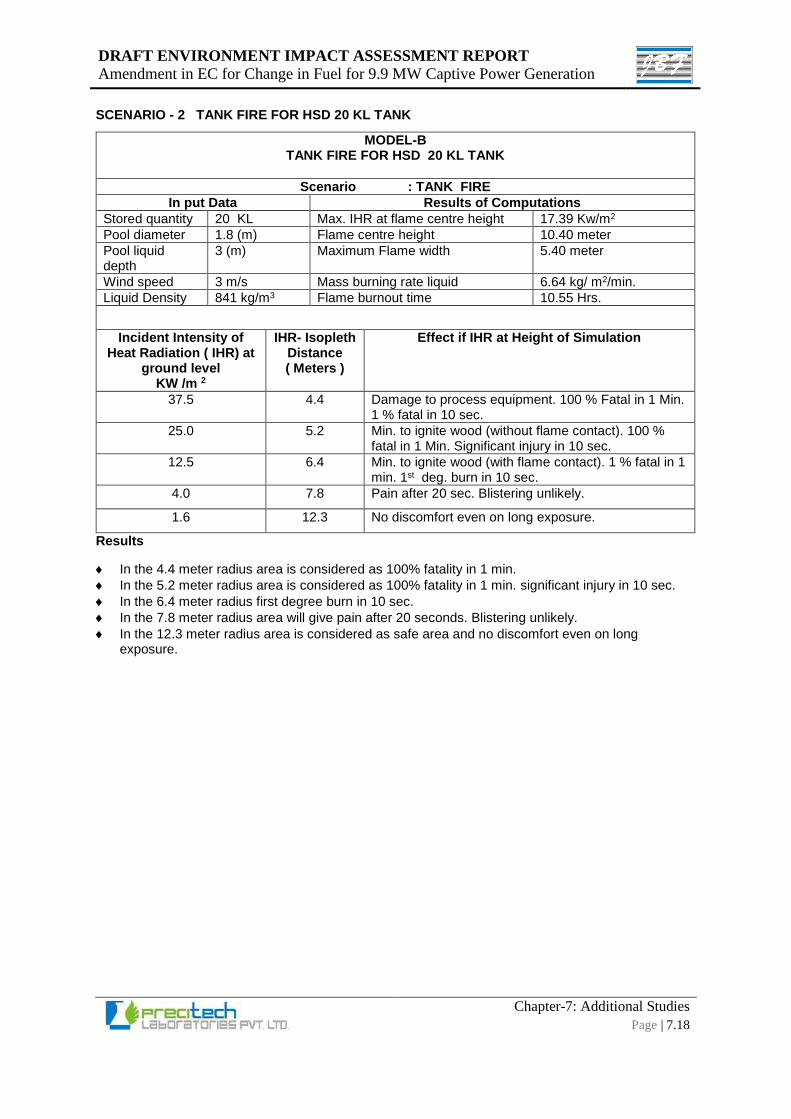
DRAFT ENVIRONMENT IMPACT ASSESSMENT REPORT
Amendment in EC for Change in Fuel for 9.9 MW Captive Power Generation
Chapter-7: Additional Studies
Page | 7.18
SCENARIO - 2 TANK FIRE FOR HSD 20 KL TANK
MODEL-B TANK FIRE FOR HSD 20 KL TANK
Scenario : TANK FIRE
In put Data Results of Computations
Stored quantity 20 KL Max. IHR at flame centre height 17.39 Kw/m2
Pool diameter 1.8 (m) Flame centre height 10.40 meter
Pool liquid depth
3 (m) Maximum Flame width 5.40 meter
Wind speed 3 m/s Mass burning rate liquid 6.64 kg/ m2/min.
Liquid Density 841 kg/m3 Flame burnout time 10.55 Hrs.
Incident Intensity of Heat Radiation ( IHR) at
ground level KW /m 2
IHR- Isopleth Distance ( Meters )
Effect if IHR at Height of Simulation
37.5 4.4 Damage to process equipment. 100 % Fatal in 1 Min. 1 % fatal in 10 sec.
25.0 5.2 Min. to ignite wood (without flame contact). 100 % fatal in 1 Min. Significant injury in 10 sec.
12.5 6.4 Min. to ignite wood (with flame contact). 1 % fatal in 1 min. 1st deg. burn in 10 sec.
4.0 7.8 Pain after 20 sec. Blistering unlikely.
1.6 12.3 No discomfort even on long exposure.
Results
In the 4.4 meter radius area is considered as 100% fatality in 1 min.
In the 5.2 meter radius area is considered as 100% fatality in 1 min. significant injury in 10 sec.
In the 6.4 meter radius first degree burn in 10 sec.
In the 7.8 meter radius area will give pain after 20 seconds. Blistering unlikely.
In the 12.3 meter radius area is considered as safe area and no discomfort even on long exposure.
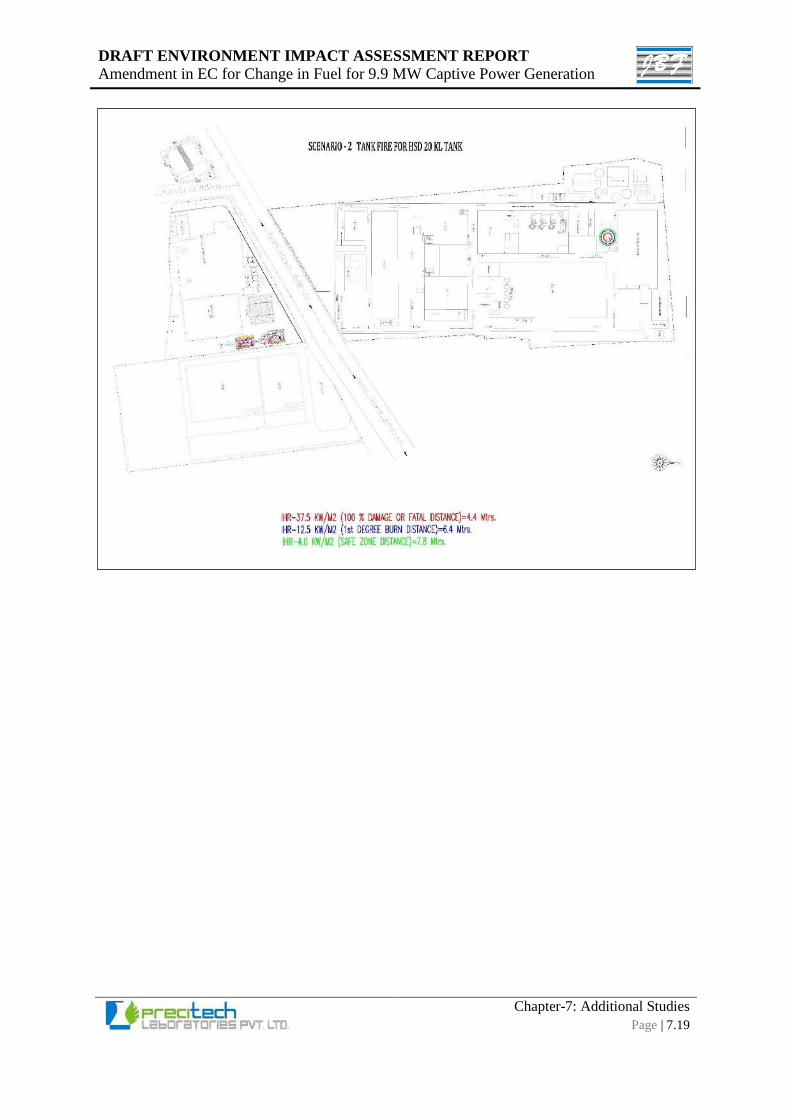
DRAFT ENVIRONMENT IMPACT ASSESSMENT REPORT
Amendment in EC for Change in Fuel for 9.9 MW Captive Power Generation
Chapter-7: Additional Studies
Page | 7.19
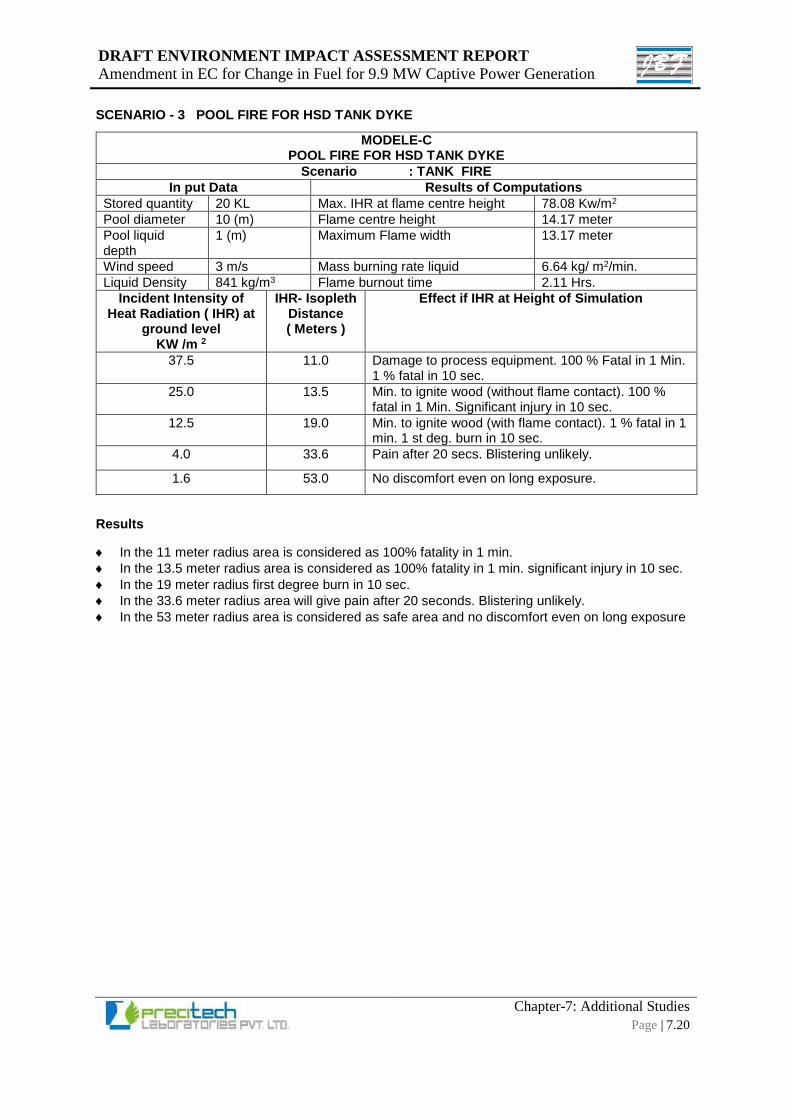
DRAFT ENVIRONMENT IMPACT ASSESSMENT REPORT
Amendment in EC for Change in Fuel for 9.9 MW Captive Power Generation
Chapter-7: Additional Studies
Page | 7.20
SCENARIO - 3 POOL FIRE FOR HSD TANK DYKE
MODELE-C POOL FIRE FOR HSD TANK DYKE
Scenario : TANK FIRE
In put Data Results of Computations
Stored quantity 20 KL Max. IHR at flame centre height 78.08 Kw/m2
Pool diameter 10 (m) Flame centre height 14.17 meter
Pool liquid depth
1 (m) Maximum Flame width 13.17 meter
Wind speed 3 m/s Mass burning rate liquid 6.64 kg/ m2/min.
Liquid Density 841 kg/m3 Flame burnout time 2.11 Hrs.
Incident Intensity of Heat Radiation ( IHR) at
ground level KW /m 2
IHR- Isopleth Distance ( Meters )
Effect if IHR at Height of Simulation
37.5 11.0 Damage to process equipment. 100 % Fatal in 1 Min. 1 % fatal in 10 sec.
25.0 13.5 Min. to ignite wood (without flame contact). 100 % fatal in 1 Min. Significant injury in 10 sec.
12.5 19.0 Min. to ignite wood (with flame contact). 1 % fatal in 1 min. 1 st deg. burn in 10 sec.
4.0 33.6 Pain after 20 secs. Blistering unlikely.
1.6 53.0 No discomfort even on long exposure.
Results
In the 11 meter radius area is considered as 100% fatality in 1 min.
In the 13.5 meter radius area is considered as 100% fatality in 1 min. significant injury in 10 sec.
In the 19 meter radius first degree burn in 10 sec.
In the 33.6 meter radius area will give pain after 20 seconds. Blistering unlikely.
In the 53 meter radius area is considered as safe area and no discomfort even on long exposure
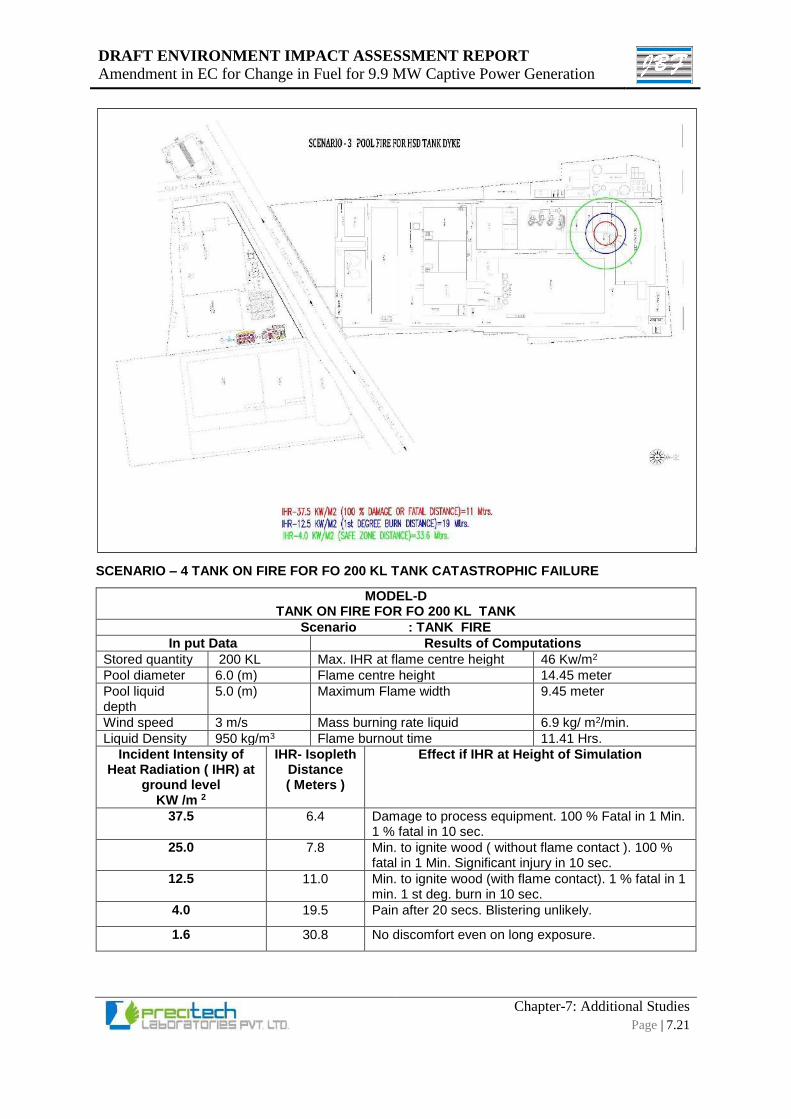
DRAFT ENVIRONMENT IMPACT ASSESSMENT REPORT
Amendment in EC for Change in Fuel for 9.9 MW Captive Power Generation
Chapter-7: Additional Studies
Page | 7.21
SCENARIO – 4 TANK ON FIRE FOR FO 200 KL TANK CATASTROPHIC FAILURE
MODEL-D TANK ON FIRE FOR FO 200 KL TANK
Scenario : TANK FIRE
In put Data Results of Computations
Stored quantity 200 KL Max. IHR at flame centre height 46 Kw/m2
Pool diameter 6.0 (m) Flame centre height 14.45 meter
Pool liquid depth
5.0 (m) Maximum Flame width 9.45 meter
Wind speed 3 m/s Mass burning rate liquid 6.9 kg/ m2/min.
Liquid Density 950 kg/m3 Flame burnout time 11.41 Hrs.
Incident Intensity of Heat Radiation ( IHR) at
ground level KW /m 2
IHR- Isopleth Distance ( Meters )
Effect if IHR at Height of Simulation
37.5 6.4 Damage to process equipment. 100 % Fatal in 1 Min. 1 % fatal in 10 sec.
25.0 7.8 Min. to ignite wood ( without flame contact ). 100 % fatal in 1 Min. Significant injury in 10 sec.
12.5 11.0 Min. to ignite wood (with flame contact). 1 % fatal in 1 min. 1 st deg. burn in 10 sec.
4.0 19.5 Pain after 20 secs. Blistering unlikely.
1.6 30.8 No discomfort even on long exposure.
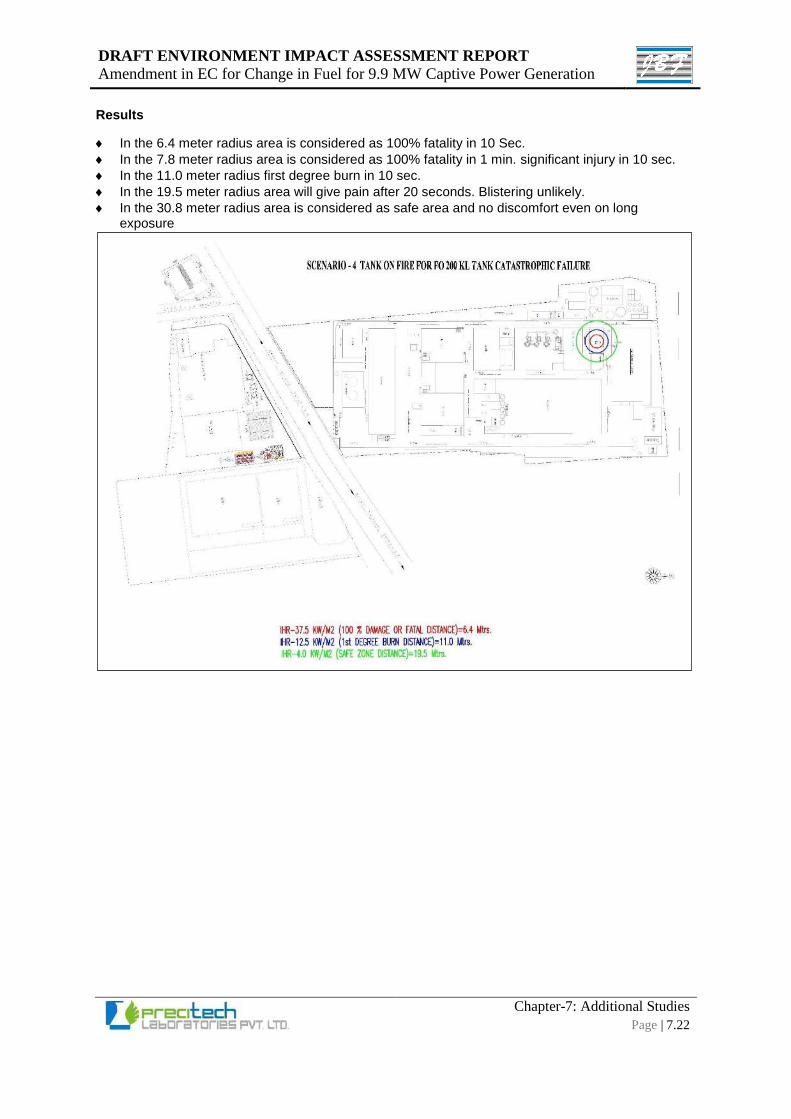
DRAFT ENVIRONMENT IMPACT ASSESSMENT REPORT
Amendment in EC for Change in Fuel for 9.9 MW Captive Power Generation
Chapter-7: Additional Studies
Page | 7.22
Results
In the 6.4 meter radius area is considered as 100% fatality in 10 Sec.
In the 7.8 meter radius area is considered as 100% fatality in 1 min. significant injury in 10 sec.
In the 11.0 meter radius first degree burn in 10 sec.
In the 19.5 meter radius area will give pain after 20 seconds. Blistering unlikely.
In the 30.8 meter radius area is considered as safe area and no discomfort even on long exposure
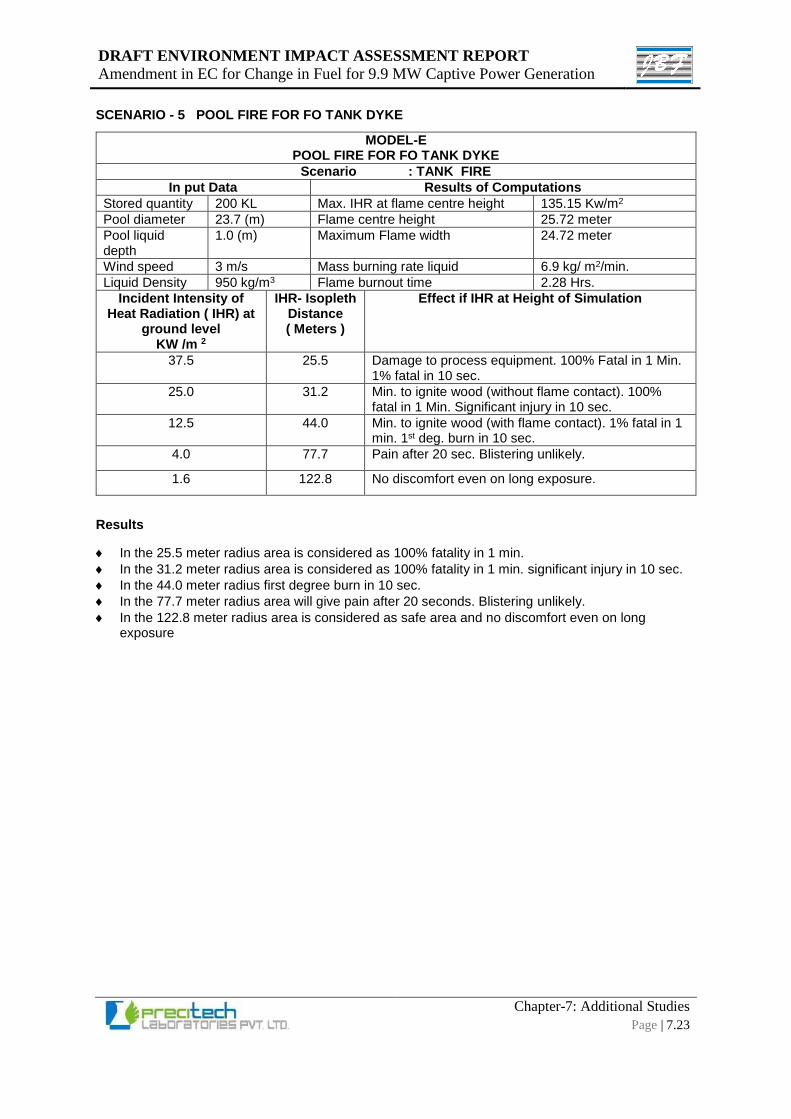
DRAFT ENVIRONMENT IMPACT ASSESSMENT REPORT
Amendment in EC for Change in Fuel for 9.9 MW Captive Power Generation
Chapter-7: Additional Studies
Page | 7.23
SCENARIO - 5 POOL FIRE FOR FO TANK DYKE
MODEL-E POOL FIRE FOR FO TANK DYKE
Scenario : TANK FIRE
In put Data Results of Computations
Stored quantity 200 KL Max. IHR at flame centre height 135.15 Kw/m2
Pool diameter 23.7 (m) Flame centre height 25.72 meter
Pool liquid depth
1.0 (m) Maximum Flame width 24.72 meter
Wind speed 3 m/s Mass burning rate liquid 6.9 kg/ m2/min.
Liquid Density 950 kg/m3 Flame burnout time 2.28 Hrs.
Incident Intensity of Heat Radiation ( IHR) at
ground level KW /m 2
IHR- Isopleth Distance ( Meters )
Effect if IHR at Height of Simulation
37.5 25.5 Damage to process equipment. 100% Fatal in 1 Min. 1% fatal in 10 sec.
25.0 31.2 Min. to ignite wood (without flame contact). 100% fatal in 1 Min. Significant injury in 10 sec.
12.5 44.0 Min. to ignite wood (with flame contact). 1% fatal in 1 min. 1st deg. burn in 10 sec.
4.0 77.7 Pain after 20 sec. Blistering unlikely.
1.6 122.8 No discomfort even on long exposure.
Results
In the 25.5 meter radius area is considered as 100% fatality in 1 min.
In the 31.2 meter radius area is considered as 100% fatality in 1 min. significant injury in 10 sec.
In the 44.0 meter radius first degree burn in 10 sec.
In the 77.7 meter radius area will give pain after 20 seconds. Blistering unlikely.
In the 122.8 meter radius area is considered as safe area and no discomfort even on long exposure
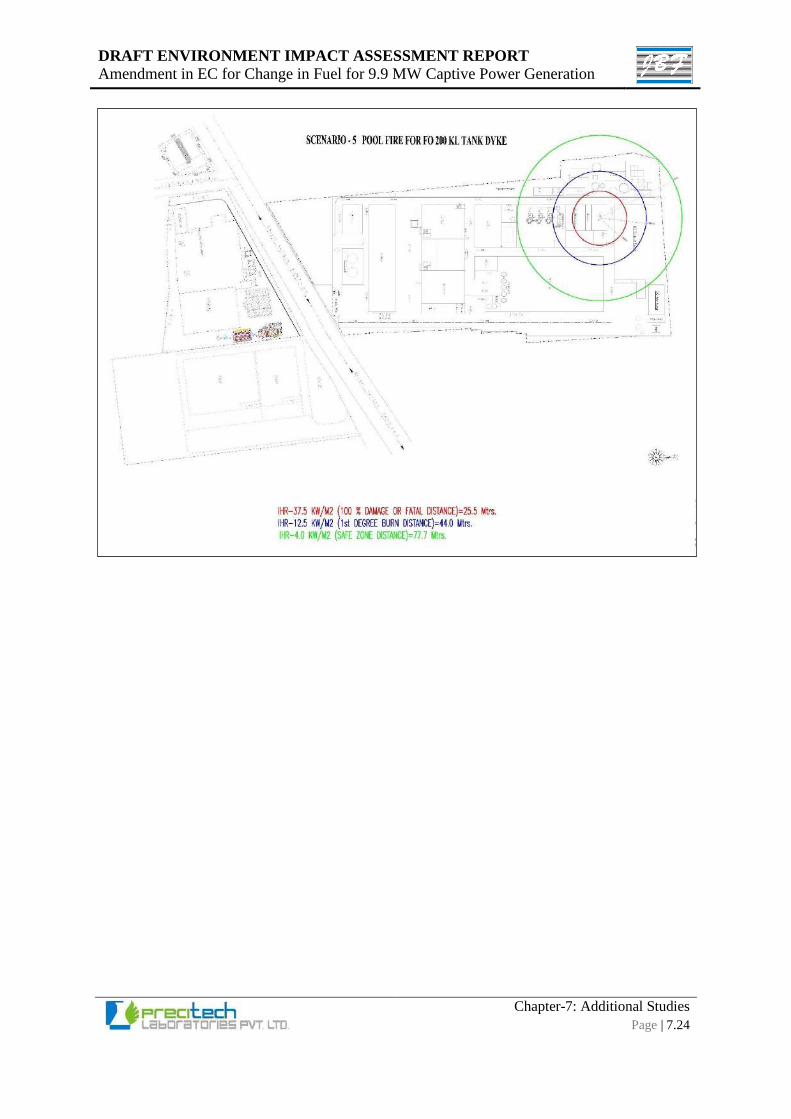
DRAFT ENVIRONMENT IMPACT ASSESSMENT REPORT
Amendment in EC for Change in Fuel for 9.9 MW Captive Power Generation
Chapter-7: Additional Studies
Page | 7.24
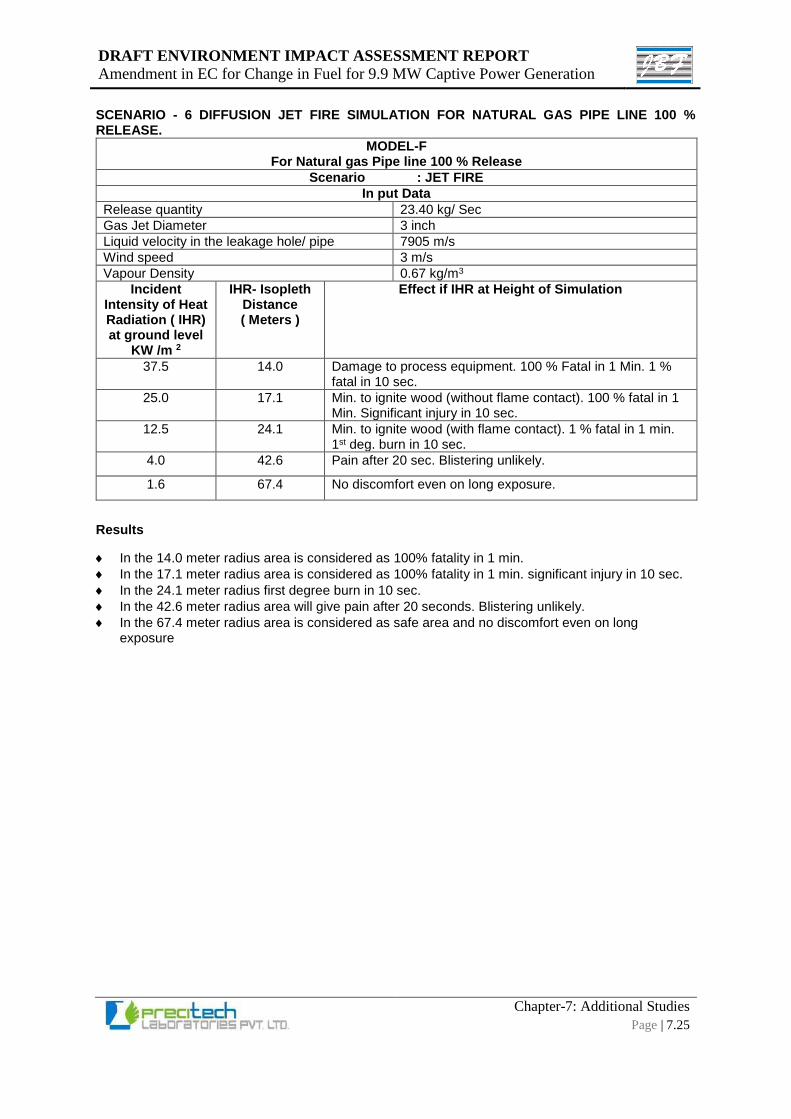
DRAFT ENVIRONMENT IMPACT ASSESSMENT REPORT
Amendment in EC for Change in Fuel for 9.9 MW Captive Power Generation
Chapter-7: Additional Studies
Page | 7.25
SCENARIO - 6 DIFFUSION JET FIRE SIMULATION FOR NATURAL GAS PIPE LINE 100 % RELEASE.
MODEL-F For Natural gas Pipe line 100 % Release
Scenario : JET FIRE
In put Data
Release quantity 23.40 kg/ Sec
Gas Jet Diameter 3 inch
Liquid velocity in the leakage hole/ pipe 7905 m/s
Wind speed 3 m/s
Vapour Density 0.67 kg/m3
Incident Intensity of Heat Radiation ( IHR) at ground level
KW /m 2
IHR- Isopleth Distance ( Meters )
Effect if IHR at Height of Simulation
37.5 14.0 Damage to process equipment. 100 % Fatal in 1 Min. 1 % fatal in 10 sec.
25.0 17.1 Min. to ignite wood (without flame contact). 100 % fatal in 1 Min. Significant injury in 10 sec.
12.5 24.1 Min. to ignite wood (with flame contact). 1 % fatal in 1 min. 1st deg. burn in 10 sec.
4.0 42.6 Pain after 20 sec. Blistering unlikely.
1.6 67.4 No discomfort even on long exposure.
Results
In the 14.0 meter radius area is considered as 100% fatality in 1 min.
In the 17.1 meter radius area is considered as 100% fatality in 1 min. significant injury in 10 sec.
In the 24.1 meter radius first degree burn in 10 sec.
In the 42.6 meter radius area will give pain after 20 seconds. Blistering unlikely.
In the 67.4 meter radius area is considered as safe area and no discomfort even on long exposure
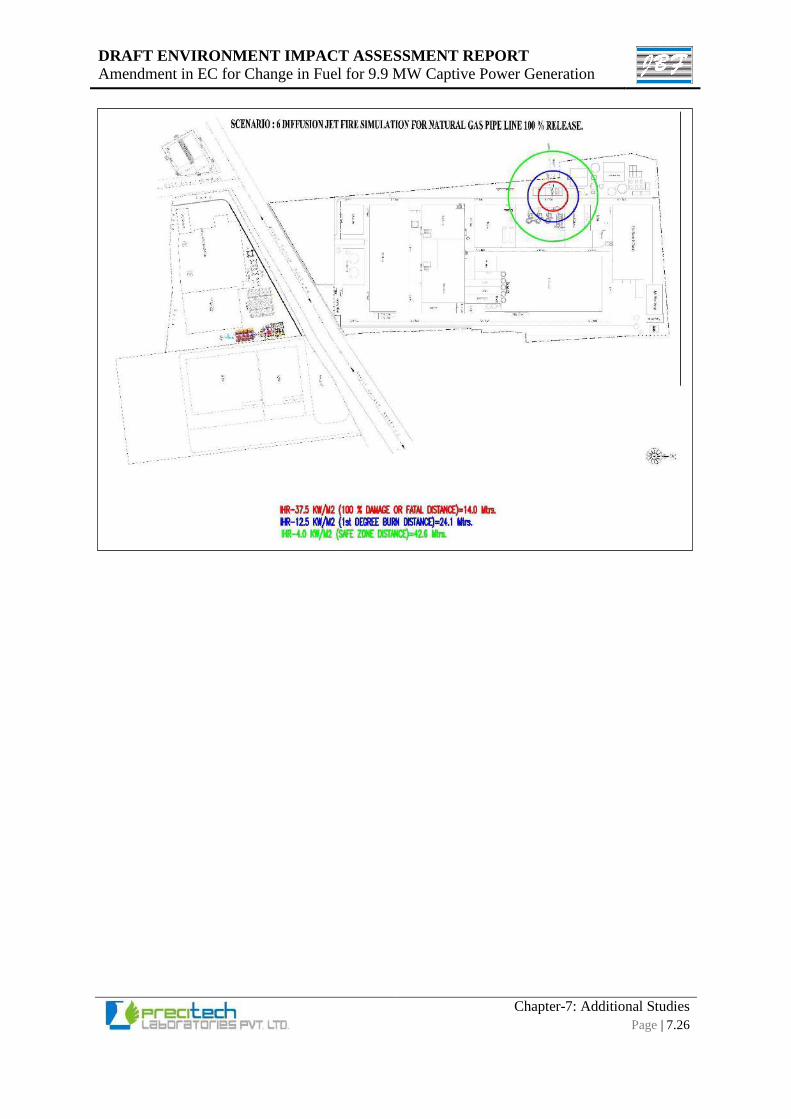
DRAFT ENVIRONMENT IMPACT ASSESSMENT REPORT
Amendment in EC for Change in Fuel for 9.9 MW Captive Power Generation
Chapter-7: Additional Studies
Page | 7.26
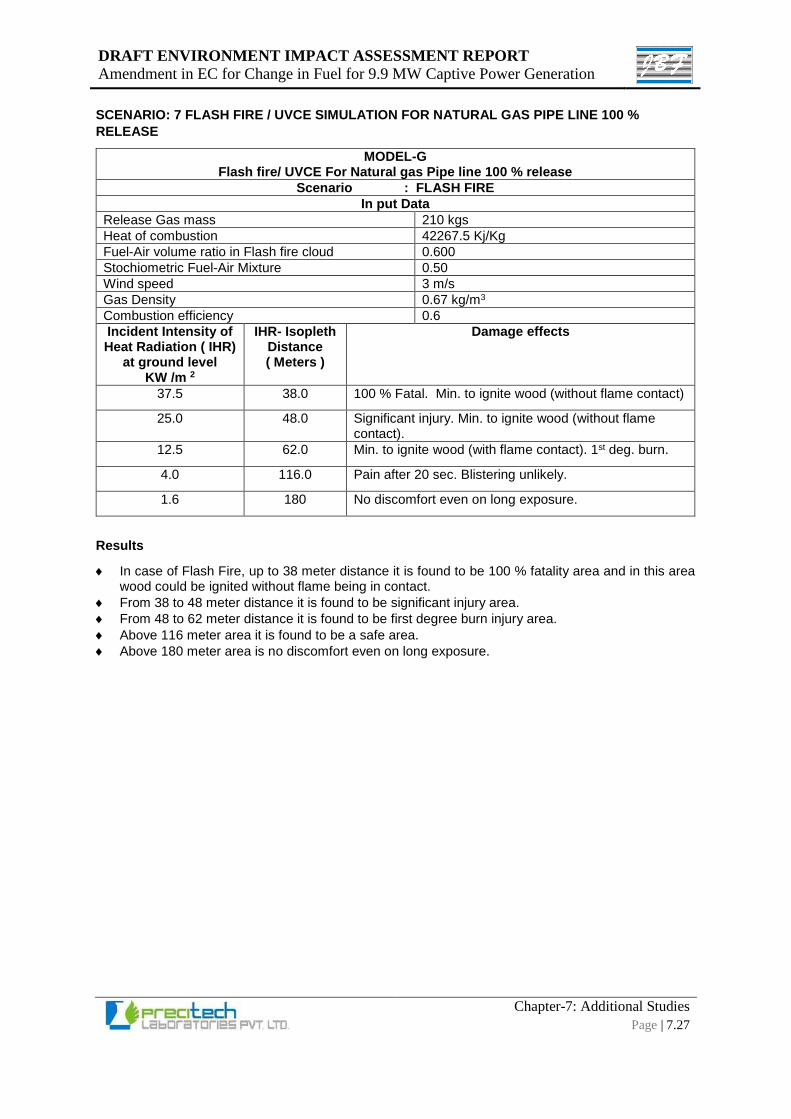
DRAFT ENVIRONMENT IMPACT ASSESSMENT REPORT
Amendment in EC for Change in Fuel for 9.9 MW Captive Power Generation
Chapter-7: Additional Studies
Page | 7.27
SCENARIO: 7 FLASH FIRE / UVCE SIMULATION FOR NATURAL GAS PIPE LINE 100 %
RELEASE
MODEL-G Flash fire/ UVCE For Natural gas Pipe line 100 % release
Scenario : FLASH FIRE
In put Data
Release Gas mass 210 kgs
Heat of combustion 42267.5 Kj/Kg
Fuel-Air volume ratio in Flash fire cloud 0.600
Stochiometric Fuel-Air Mixture 0.50
Wind speed 3 m/s
Gas Density 0.67 kg/m3
Combustion efficiency 0.6
Incident Intensity of Heat Radiation ( IHR)
at ground level KW /m 2
IHR- Isopleth Distance ( Meters )
Damage effects
37.5 38.0 100 % Fatal. Min. to ignite wood (without flame contact)
25.0 48.0 Significant injury. Min. to ignite wood (without flame contact).
12.5 62.0 Min. to ignite wood (with flame contact). 1st deg. burn.
4.0 116.0 Pain after 20 sec. Blistering unlikely.
1.6 180 No discomfort even on long exposure.
Results
In case of Flash Fire, up to 38 meter distance it is found to be 100 % fatality area and in this area wood could be ignited without flame being in contact.
From 38 to 48 meter distance it is found to be significant injury area.
From 48 to 62 meter distance it is found to be first degree burn injury area.
Above 116 meter area it is found to be a safe area.
Above 180 meter area is no discomfort even on long exposure.
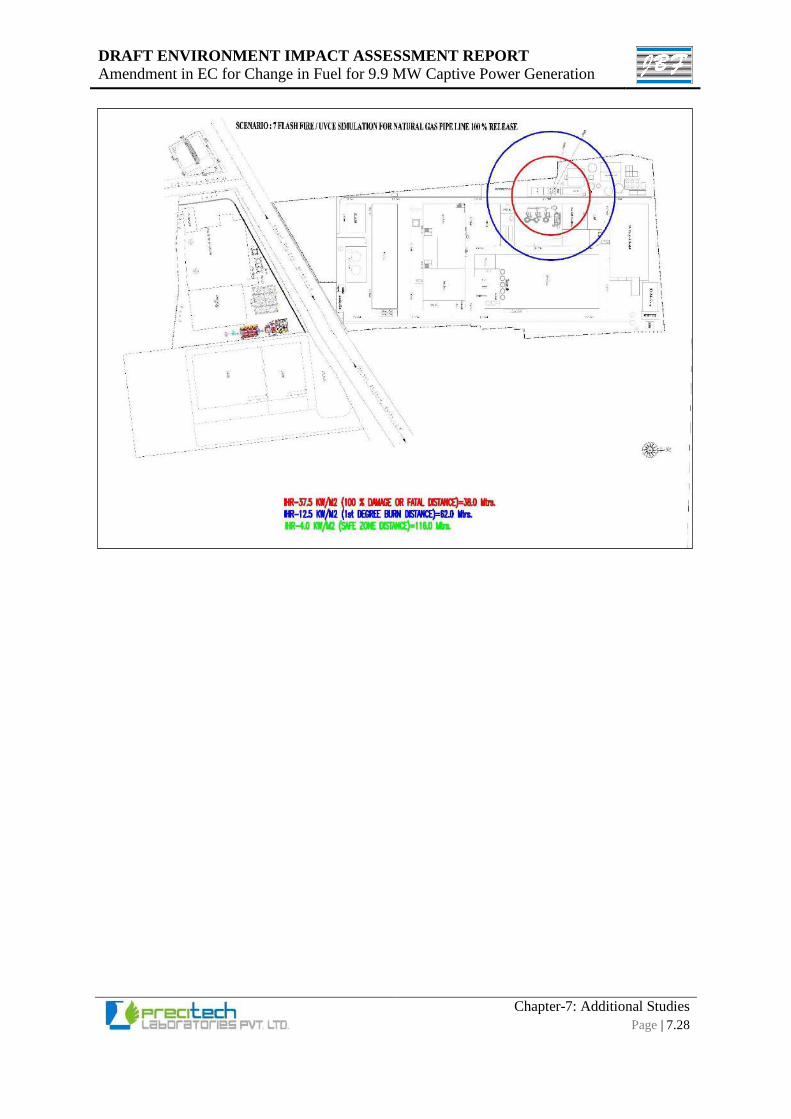
DRAFT ENVIRONMENT IMPACT ASSESSMENT REPORT
Amendment in EC for Change in Fuel for 9.9 MW Captive Power Generation
Chapter-7: Additional Studies
Page | 7.28
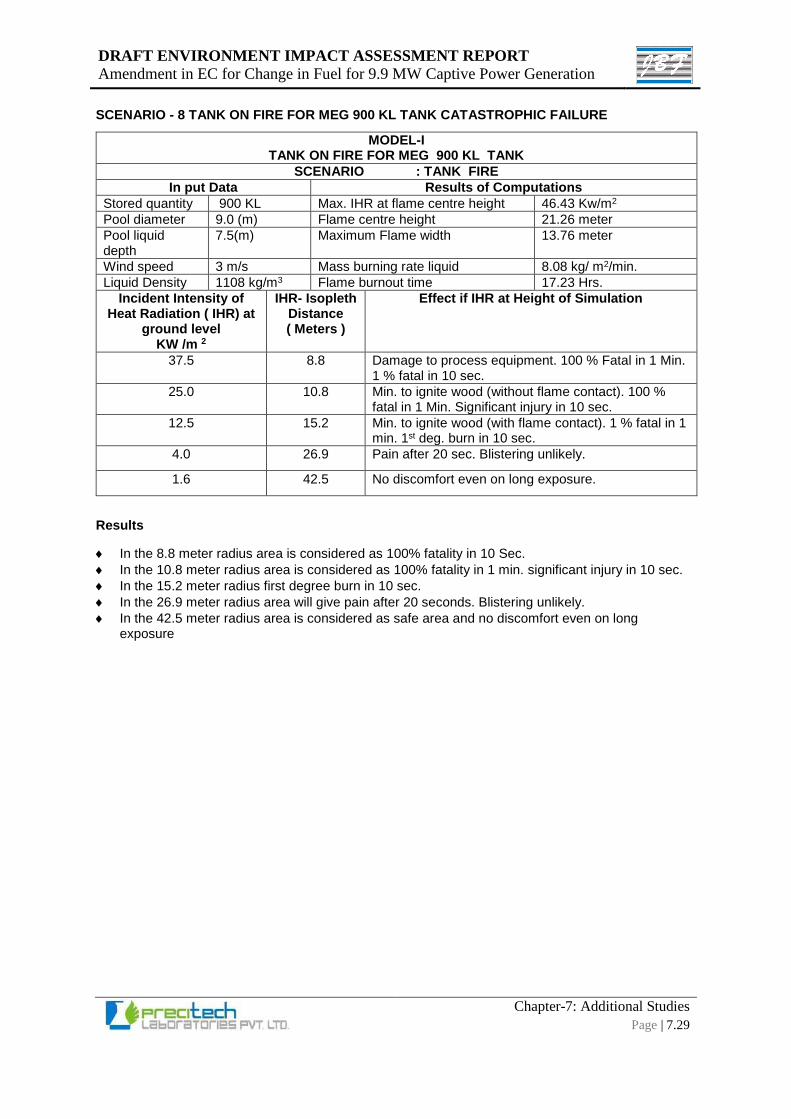
DRAFT ENVIRONMENT IMPACT ASSESSMENT REPORT
Amendment in EC for Change in Fuel for 9.9 MW Captive Power Generation
Chapter-7: Additional Studies
Page | 7.29
SCENARIO - 8 TANK ON FIRE FOR MEG 900 KL TANK CATASTROPHIC FAILURE
MODEL-I TANK ON FIRE FOR MEG 900 KL TANK
SCENARIO : TANK FIRE
In put Data Results of Computations
Stored quantity 900 KL Max. IHR at flame centre height 46.43 Kw/m2
Pool diameter 9.0 (m) Flame centre height 21.26 meter
Pool liquid depth
7.5(m) Maximum Flame width 13.76 meter
Wind speed 3 m/s Mass burning rate liquid 8.08 kg/ m2/min.
Liquid Density 1108 kg/m3 Flame burnout time 17.23 Hrs.
Incident Intensity of Heat Radiation ( IHR) at
ground level KW /m 2
IHR- Isopleth Distance ( Meters )
Effect if IHR at Height of Simulation
37.5 8.8 Damage to process equipment. 100 % Fatal in 1 Min. 1 % fatal in 10 sec.
25.0 10.8 Min. to ignite wood (without flame contact). 100 % fatal in 1 Min. Significant injury in 10 sec.
12.5 15.2 Min. to ignite wood (with flame contact). 1 % fatal in 1 min. 1st deg. burn in 10 sec.
4.0 26.9 Pain after 20 sec. Blistering unlikely.
1.6 42.5 No discomfort even on long exposure.
Results
In the 8.8 meter radius area is considered as 100% fatality in 10 Sec.
In the 10.8 meter radius area is considered as 100% fatality in 1 min. significant injury in 10 sec.
In the 15.2 meter radius first degree burn in 10 sec.
In the 26.9 meter radius area will give pain after 20 seconds. Blistering unlikely.
In the 42.5 meter radius area is considered as safe area and no discomfort even on long exposure
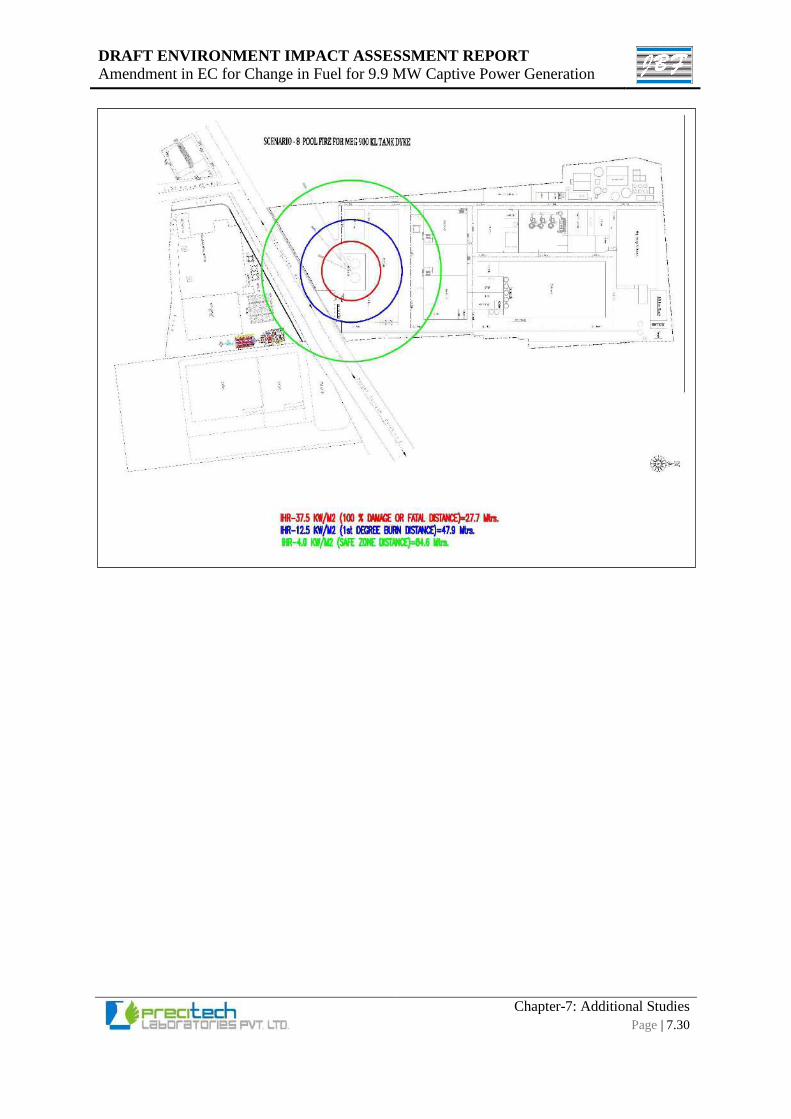
DRAFT ENVIRONMENT IMPACT ASSESSMENT REPORT
Amendment in EC for Change in Fuel for 9.9 MW Captive Power Generation
Chapter-7: Additional Studies
Page | 7.30
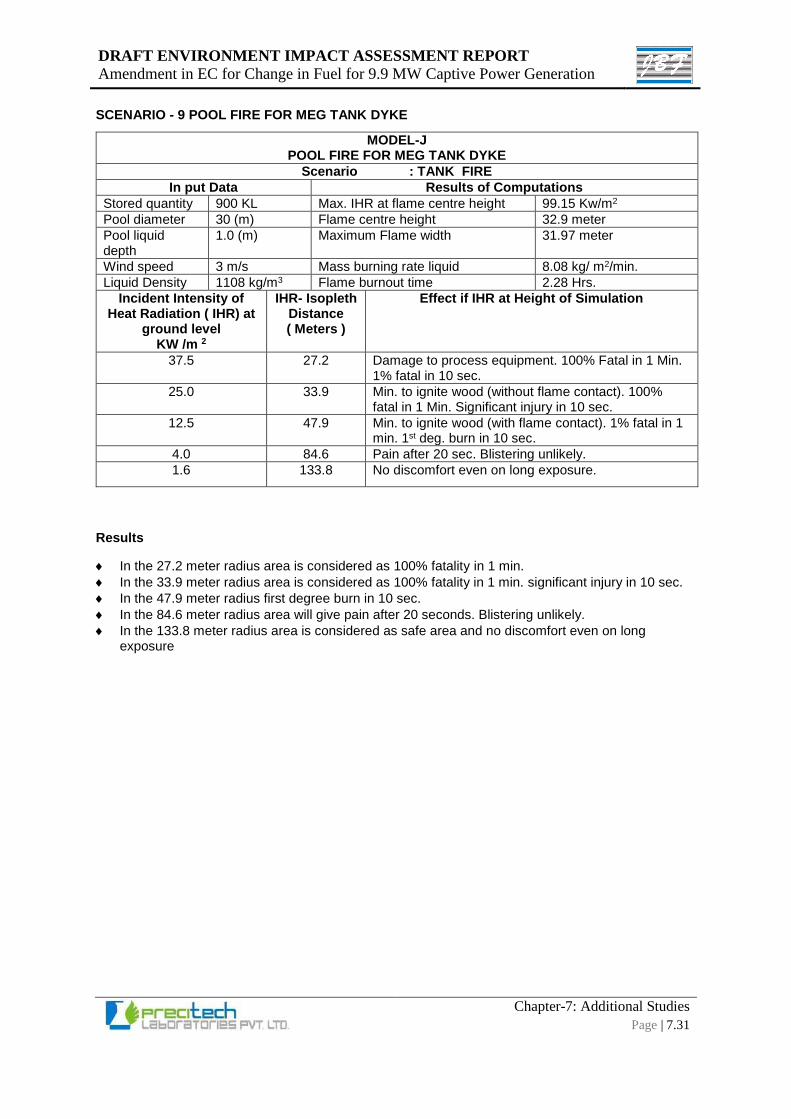
DRAFT ENVIRONMENT IMPACT ASSESSMENT REPORT
Amendment in EC for Change in Fuel for 9.9 MW Captive Power Generation
Chapter-7: Additional Studies
Page | 7.31
SCENARIO - 9 POOL FIRE FOR MEG TANK DYKE
MODEL-J POOL FIRE FOR MEG TANK DYKE
Scenario : TANK FIRE
In put Data Results of Computations
Stored quantity 900 KL Max. IHR at flame centre height 99.15 Kw/m2
Pool diameter 30 (m) Flame centre height 32.9 meter
Pool liquid depth
1.0 (m) Maximum Flame width 31.97 meter
Wind speed 3 m/s Mass burning rate liquid 8.08 kg/ m2/min.
Liquid Density 1108 kg/m3 Flame burnout time 2.28 Hrs.
Incident Intensity of Heat Radiation ( IHR) at
ground level KW /m 2
IHR- Isopleth Distance ( Meters )
Effect if IHR at Height of Simulation
37.5 27.2 Damage to process equipment. 100% Fatal in 1 Min. 1% fatal in 10 sec.
25.0 33.9 Min. to ignite wood (without flame contact). 100% fatal in 1 Min. Significant injury in 10 sec.
12.5 47.9 Min. to ignite wood (with flame contact). 1% fatal in 1 min. 1st deg. burn in 10 sec.
4.0 84.6 Pain after 20 sec. Blistering unlikely.
1.6 133.8 No discomfort even on long exposure.
Results
In the 27.2 meter radius area is considered as 100% fatality in 1 min.
In the 33.9 meter radius area is considered as 100% fatality in 1 min. significant injury in 10 sec.
In the 47.9 meter radius first degree burn in 10 sec.
In the 84.6 meter radius area will give pain after 20 seconds. Blistering unlikely.
In the 133.8 meter radius area is considered as safe area and no discomfort even on long exposure
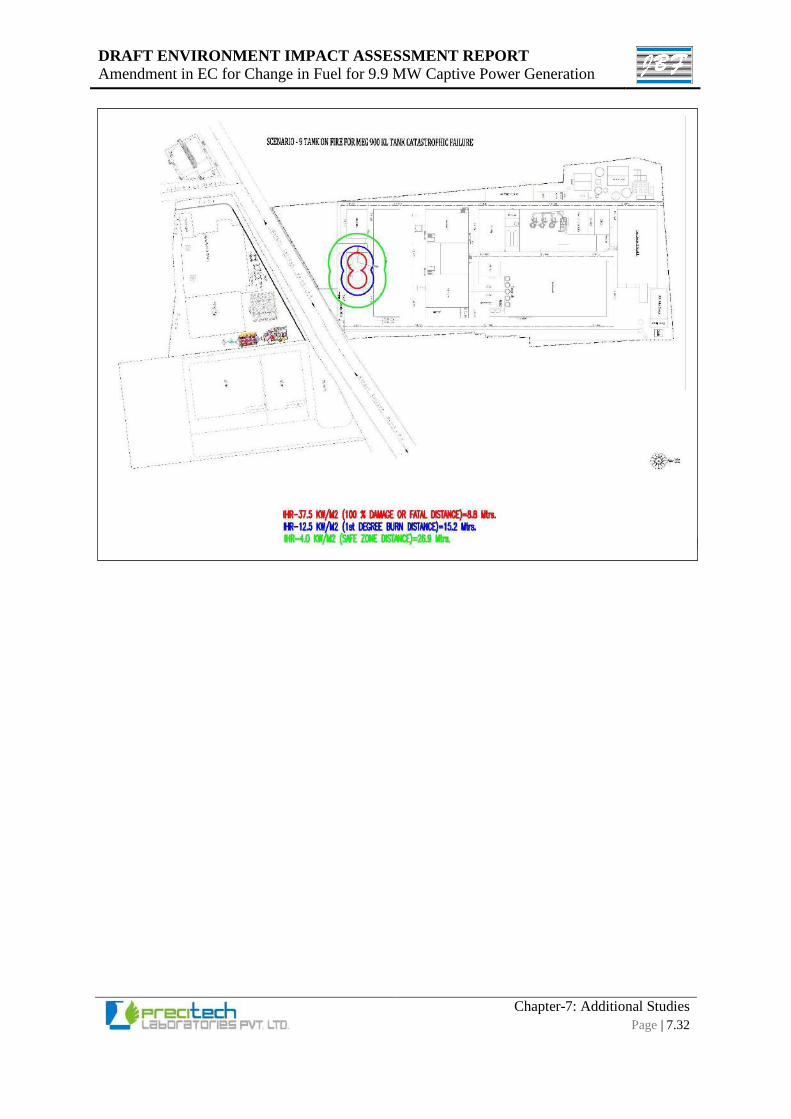
DRAFT ENVIRONMENT IMPACT ASSESSMENT REPORT
Amendment in EC for Change in Fuel for 9.9 MW Captive Power Generation
Chapter-7: Additional Studies
Page | 7.32
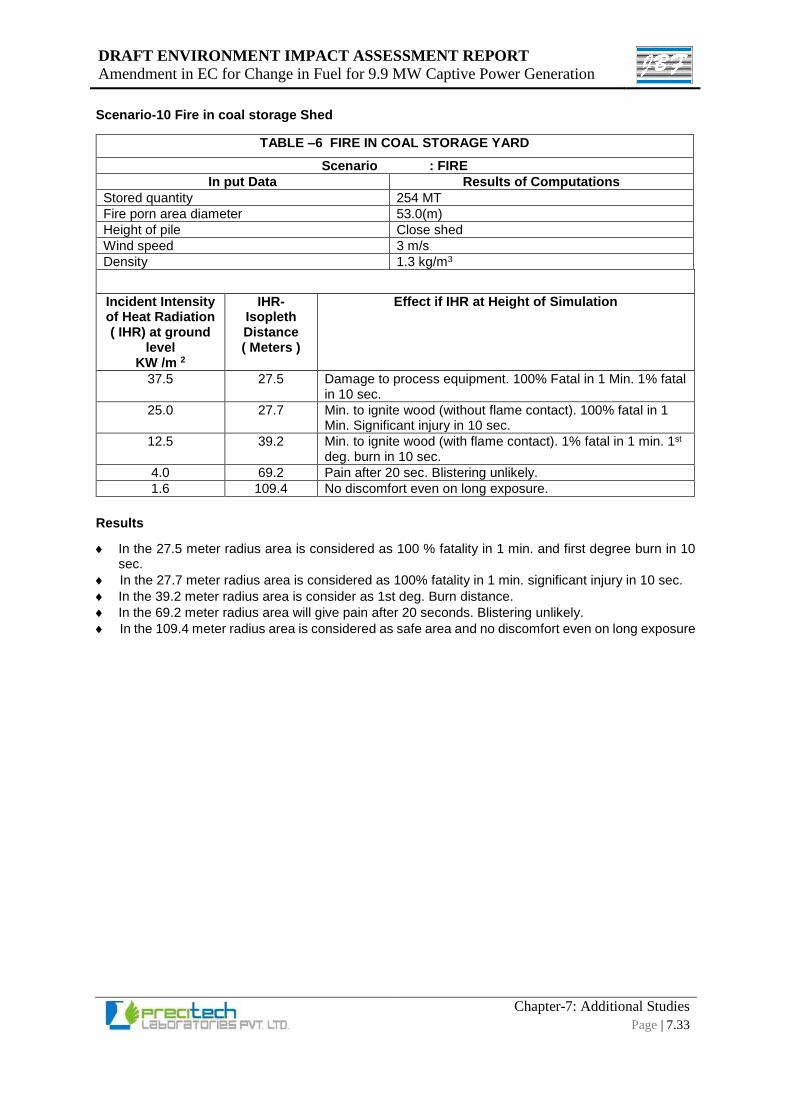
DRAFT ENVIRONMENT IMPACT ASSESSMENT REPORT
Amendment in EC for Change in Fuel for 9.9 MW Captive Power Generation
Chapter-7: Additional Studies
Page | 7.33
Scenario-10 Fire in coal storage Shed
TABLE –6 FIRE IN COAL STORAGE YARD
Scenario : FIRE
In put Data Results of Computations
Stored quantity 254 MT
Fire porn area diameter 53.0(m)
Height of pile Close shed
Wind speed 3 m/s
Density 1.3 kg/m3
Incident Intensity of Heat Radiation ( IHR) at ground
level KW /m 2
IHR- Isopleth Distance ( Meters )
Effect if IHR at Height of Simulation
37.5 27.5 Damage to process equipment. 100% Fatal in 1 Min. 1% fatal in 10 sec.
25.0 27.7 Min. to ignite wood (without flame contact). 100% fatal in 1 Min. Significant injury in 10 sec.
12.5 39.2 Min. to ignite wood (with flame contact). 1% fatal in 1 min. 1st deg. burn in 10 sec.
4.0 69.2 Pain after 20 sec. Blistering unlikely.
1.6 109.4 No discomfort even on long exposure.
Results
In the 27.5 meter radius area is considered as 100 % fatality in 1 min. and first degree burn in 10 sec.
In the 27.7 meter radius area is considered as 100% fatality in 1 min. significant injury in 10 sec.
In the 39.2 meter radius area is consider as 1st deg. Burn distance.
In the 69.2 meter radius area will give pain after 20 seconds. Blistering unlikely.
In the 109.4 meter radius area is considered as safe area and no discomfort even on long exposure
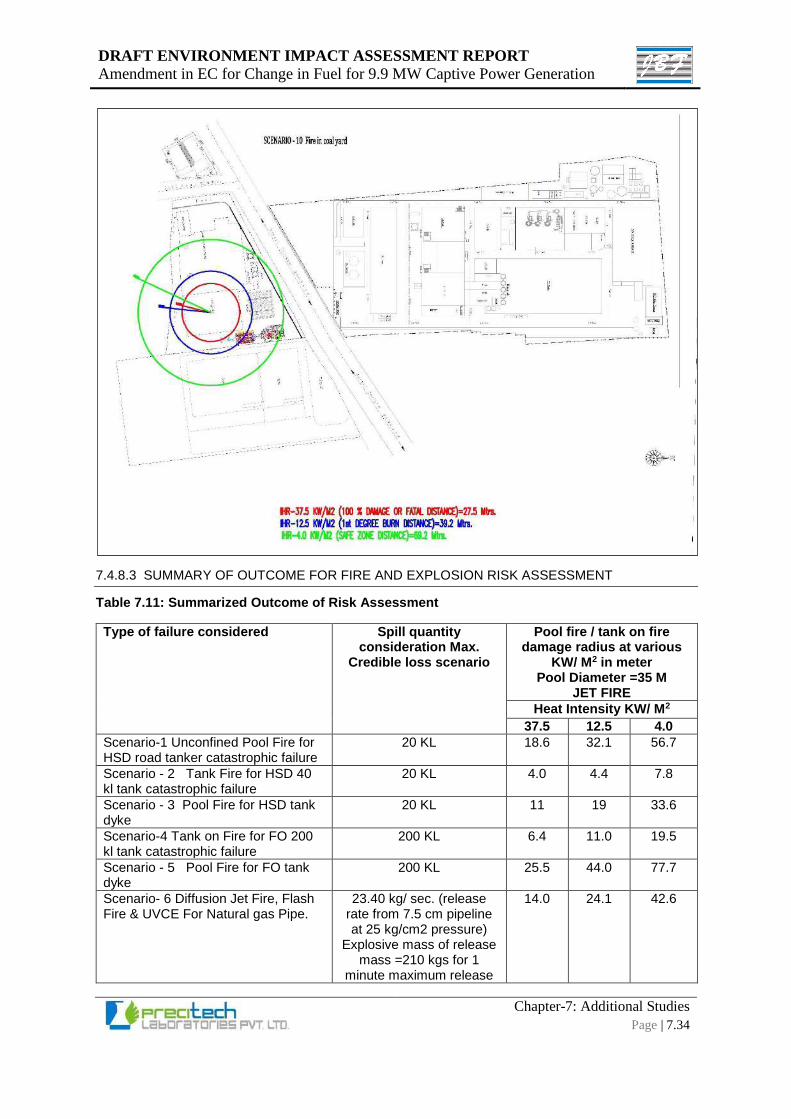
DRAFT ENVIRONMENT IMPACT ASSESSMENT REPORT
Amendment in EC for Change in Fuel for 9.9 MW Captive Power Generation
Chapter-7: Additional Studies
Page | 7.34
7.4.8.3 SUMMARY OF OUTCOME FOR FIRE AND EXPLOSION RISK ASSESSMENT
Table 7.11: Summarized Outcome of Risk Assessment
Type of failure considered Spill quantity consideration Max.
Credible loss scenario
Pool fire / tank on fire damage radius at various
KW/ M2 in meter Pool Diameter =35 M
JET FIRE
Heat Intensity KW/ M2
37.5 12.5 4.0
Scenario-1 Unconfined Pool Fire for HSD road tanker catastrophic failure
20 KL 18.6 32.1 56.7
Scenario - 2 Tank Fire for HSD 40 kl tank catastrophic failure
20 KL 4.0 4.4 7.8
Scenario - 3 Pool Fire for HSD tank dyke
20 KL 11 19 33.6
Scenario-4 Tank on Fire for FO 200 kl tank catastrophic failure
200 KL 6.4 11.0 19.5
Scenario - 5 Pool Fire for FO tank dyke
200 KL 25.5 44.0 77.7
Scenario- 6 Diffusion Jet Fire, Flash Fire & UVCE For Natural gas Pipe.
23.40 kg/ sec. (release rate from 7.5 cm pipeline at 25 kg/cm2 pressure)
Explosive mass of release mass =210 kgs for 1
minute maximum release
14.0 24.1 42.6
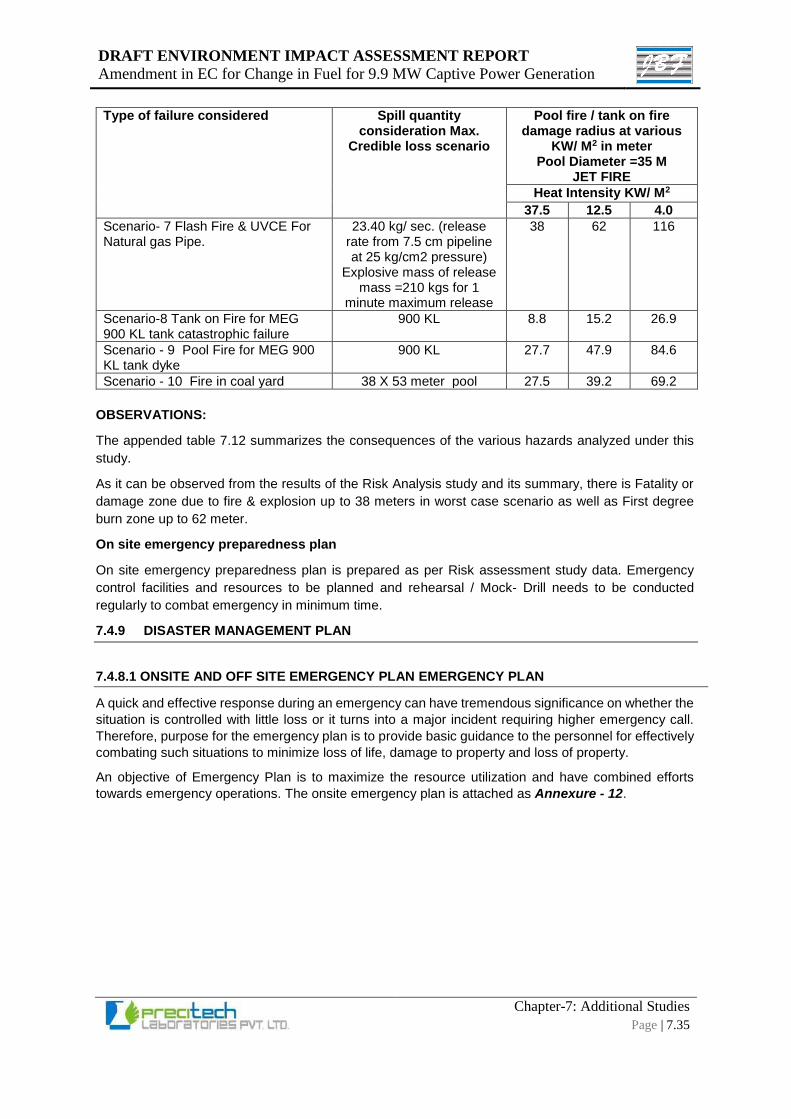
DRAFT ENVIRONMENT IMPACT ASSESSMENT REPORT
Amendment in EC for Change in Fuel for 9.9 MW Captive Power Generation
Chapter-7: Additional Studies
Page | 7.35
Type of failure considered Spill quantity consideration Max.
Credible loss scenario
Pool fire / tank on fire damage radius at various
KW/ M2 in meter Pool Diameter =35 M
JET FIRE
Heat Intensity KW/ M2
37.5 12.5 4.0
Scenario- 7 Flash Fire & UVCE For Natural gas Pipe.
23.40 kg/ sec. (release rate from 7.5 cm pipeline at 25 kg/cm2 pressure)
Explosive mass of release mass =210 kgs for 1
minute maximum release
38 62 116
Scenario-8 Tank on Fire for MEG 900 KL tank catastrophic failure
900 KL 8.8 15.2 26.9
Scenario - 9 Pool Fire for MEG 900 KL tank dyke
900 KL 27.7 47.9 84.6
Scenario - 10 Fire in coal yard 38 X 53 meter pool 27.5 39.2 69.2
OBSERVATIONS:
The appended table 7.12 summarizes the consequences of the various hazards analyzed under this
study.
As it can be observed from the results of the Risk Analysis study and its summary, there is Fatality or
damage zone due to fire & explosion up to 38 meters in worst case scenario as well as First degree
burn zone up to 62 meter.
On site emergency preparedness plan
On site emergency preparedness plan is prepared as per Risk assessment study data. Emergency
control facilities and resources to be planned and rehearsal / Mock- Drill needs to be conducted
regularly to combat emergency in minimum time.
7.4.9 DISASTER MANAGEMENT PLAN
7.4.8.1 ONSITE AND OFF SITE EMERGENCY PLAN EMERGENCY PLAN
A quick and effective response during an emergency can have tremendous significance on whether the
situation is controlled with little loss or it turns into a major incident requiring higher emergency call.
Therefore, purpose for the emergency plan is to provide basic guidance to the personnel for effectively
combating such situations to minimize loss of life, damage to property and loss of property.
An objective of Emergency Plan is to maximize the resource utilization and have combined efforts
towards emergency operations. The onsite emergency plan is attached as Annexure - 12.
DRAFT ENVIRONMENT IMPACT ASSESSMENT REPORT
Amendment in EC for Change in Fuel for 9.9 MW Captive Power Generation
Chapter-7.2: Ecological Damage Assessment &
Remediation Plan
Page | 7.2.1
7.2 ECOLOGICAL DAMAGE ASSESSMENT &
REMEDIATION PLAN
7.2.1 PRELUDE
The primary concern of remediation plan is to evaluate the extent of environmental damage done due
to project operation in the absence of environmental protection measures. The traditional knowledge of
the project is being utilized to derive the extent of damage and plan remediation with time bound action
plan and budgetary provision.
The partial construction activities for foundation of boiler & ESP were carried out, making it a violation,
they had applied under the violation window to SEIAA Gujarat as per the provision of Notification S.O.
804(E) dated 14/03/2017 & its amendment S.O. 1030(E) dated 08/03/2018. In this matter, the Terms
of Reference (ToRs) have been awarded vide letter no. SEIAA/GUJ/TOR/1(d)/985/2018, dated 26th
Sep 2018.
Status of project
• The cost of civil construction/ erection so far incurred is approx.1.1 crore. The cost of structural
construction and part of equipment so far installed is approx. 6.9 crore. Thus total cost of the
activity completed is approx. 8 crore. The cost of pending activity and equipment is approx. 34
crore.
Partially completed construction work:
o The levelling and marking of the area for the boiler is carried out and followed by digging and
excavation of the soil for foundation.
o The concrete foundation for boiler & ESP has been raised up to 400 mm above ground level
and there after steel structure fabrication for boiler & ESP has been started.
o The steel fabrication has been brought to the site in pre-fabricated condition and assembled at
the site.
o The steam turbine generator building foundation has been completed. Structures like beam and
column, at the level of 5 meter and 7.4 meter level elevation has been carried out and there
after work was stopped.
o The boiler & ESP have been installed on foundation & necessary steel structure work has been
done as above.
o Construction activity has only been partially completed. So operation is yet not started.
DRAFT ENVIRONMENT IMPACT ASSESSMENT REPORT
Amendment in EC for Change in Fuel for 9.9 MW Captive Power Generation
Chapter-7.2: Ecological Damage Assessment &
Remediation Plan
Page | 7.2.2
7.2.2 ECOLOGICAL DAMAGE ASSESSMENT & REMEDIATION PLAN
(1) Scope of the work:
The study reveals the extent of environmental damage caused by the project operation without formal
statutory approval. The impact due to unscientific measures and the absence of EMP undertaken if any
will be elaborated. The measurable impacts will be ascertained with the extent of damage done with
the financial liabilities to bridge gap of stipulated environmental norms will be undertaken.
(2) Introduction:
There are various parameters which may degrade environment of the surrounding area due to project
activity. Environment damage & assessment has been studied in comparison to the earlier
environmental status before the start of the activity considering the following parameters:
1. Air Pollution
2. Water Pollution
3. Solid Hazardous Waste
4. Noise & Vibration
5. Greenbelt
6. Hydrogeology
7. Risk Hazards/ Occupational Health & Safety
8. Soil Conservation
(3) Deviation from regulatory frame work:
Project proponent has started construction work before getting Environmental Clearance under EIA
Notification, 2006.
(4) Baseline Environmental Status:
Baseline Environmental Status has been established by following necessary Guidelines and Methods
for Monitoring, Sampling & Testing of Environmental Samples. The details of Baseline Studies are
presented in Chapter 3 of EIA report.
(5) Environmental Impacts for Ecological Damage Assessment
Air Pollution
The construction quantum is significantly high, resulting in considerably high fugitive emissions,
Exhaust of construction equipment & machineries and vehicles movement within site. The main fugitive
emissions from the construction site are identified to be particulate matters (Dust & Cement Particles
and particles of other construction materials like sand & grit etc.). The particulate settled on vegetation
may lead to hindrance in photosynthetic activity of affected flora. Similarly, particulate inhaled by human
& other fauna may lead to serious pulmonary health effects.
However, the overall impact due to partial construction work will be marginal, reversible, localised and
is not expected to contribute significantly to ambient air quality.
Water Pollution
The construction work of the project needed 8 KLD freshwater which was met from GIDC Water Supply.
The ultimate source of the water is surface water and the same is adequate to cater the demand of all
users in the project region. The area is considered safe in terms of availability of water.
Further, total wastewater generation from the project is estimated to be around 1.62 KLD which is
basically domestic sewage from domestic activities.
DRAFT ENVIRONMENT IMPACT ASSESSMENT REPORT
Amendment in EC for Change in Fuel for 9.9 MW Captive Power Generation
Chapter-7.2: Ecological Damage Assessment &
Remediation Plan
Page | 7.2.3
The domestic sewage had been disposed off through septic tank & soak pit system which has resulted
in loss of usable water @ 1.62 KLD. It could be appreciable efforts & action if the project would have
utilized the sewage (1.62 KLD) after treatment in ETP which may have reduced the freshwater
requirement upto 20.25%.
Hence, there is no major impact envisaged on water resources and on water environment during the
partial construction work.
Solid Hazardous Waste
It has been estimated that during construction, generation of excavated soil was about 17500 m3. The
excavated soil has been utilized for landscaping. The construction waste has been reused as filler up
to plinth level. The municipal waste generation during construction was about 8-10 kg/day which has
been segregated into biodegradable and non-biodegradable wastes and collected in separate bins and
disposed through approved mode along with the domestic wastes from existing unit.
Hence, any major impact due to waste disposal during waste from the projects is not noticed. However
some minor impacts due to negligible contamination of air & soil have been considered which would
not have caused any significant impacts on ecology.
Noise & Vibration
Noise generation during construction works has been noticed to be significant due to operation of heavy
equipment/machineries, mechanical works like metal cutting & grinding etc. as well as due to increased
traffic. This generated noise may have resulted in considerable impacts on the fauna dwelling is on the
vicinity of the site. The noise level in the project site has not been monitored during the completed works
but it is assumed that the noise level in site would have reached the level of 75-80 dB(A) during
construction works. However, the incremental noise generated will be marginal, localised & temporary.
Greenbelt
The greenbelt is already created by the company in premises in about 6562.74 m2 area (about 10%
area of total land). No additional Greenbelt is done for proposed project. Hence, the beneficial impact
of greenbelt has been considered for further study of ecological damage assessment but exempted
from estimation of cost of damage & remediation.
Hydrogeology
Groundwater has not been tapped for the partial construction activities. Hence there will be no impact
on ground water. Also, borewell recharging is not permitted in GIDC. However, rain water harvesting
is recommended.
Presently at project Site, rainwater is collected from chips godown in the open pond. The rooftop area
is approx. 1150 m2. The rainwater harvesting potential indicates that company has harvesting potential
of about 1703 m3/annum of rainwater.
Risk Hazards/ Occupational Health & Safety
During the partially completed construction work, no any incident of adverse impacts on occupation &
public health & safety has been noticed. Hence the impacts on occupational & public health & safety
have been exempted for further study of ecological damage assessment & estimation of cost of damage
& remediation.
Approximately 36 workers have been engaged in construction work. Considering, cost for health
checkup per worker is Rs. 500 & cost of PPE per worker Rs.500. The total cost under this head was Rs
37800. Hence, cost of OHS per day was Rs.165.79.
DRAFT ENVIRONMENT IMPACT ASSESSMENT REPORT
Amendment in EC for Change in Fuel for 9.9 MW Captive Power Generation
Chapter-7.2: Ecological Damage Assessment &
Remediation Plan
Page | 7.2.4
Soil Conservation
Excavation for foundation of the project must have resulted in the loss of top soil. Major impact on land
environment from excavated material during excavation for building foundation.
The other construction waste generated would include debris, concrete, steel and other metals, bricks,
pallets, packaging and paper products, railings, door and window casings, fixtures, tiles, furnishings
etc.
The project proponent has adopted the following measures to prevent contamination of soil or damage
to the land environment.
Construction wastes stored in dedicated temporary storage facilities and utilised for PCC, Filling
etc.
Stock piling of excavated soil and water sprinkling on stock pile to stabilised the dust. The
excavated soil has been used for landscaping and other filling requirement.
An amount of Rs. 12.25 lakhs as recurring was spent by the project proponent for stabilisation and
reuse of excavated soil.
The overall impact on soil quality due to partial construction work will be marginal & localised.
Land
The proposed installation will be accommodated in the existing land & some part of proposed
installation will be done on additionally adjoining land. The existing plots and additional land are situated
in Notified industrial area of Sarigam.
Further, it is verified that there were no vegetation clearance needed for development of project
because the project site used was open land. Hence, impact on ecology due to clearance of vegetation
is not observed. The project proponent has utilized area admeasuring about 6562.74 m2 for healthy
greenbelt by planting trees, herbs & shrubs, which is found beneficial to the ecological layout and
environmental health of the area. Hence, there will be no impact on land.
Socioeconomic Layout
About 36 persons have been appointed for partial construction of the project. Proponent had provided
this employment through contractors and all temporary construction staff were from local area. Hence
no construction camp had been provided. Therefore no major issue of disturbance to the local social
structure has been occurred. Also all necessary facilities had been provided to labours in premises
during the construction operations by the proponent. Hence issue of social conflict due to use of local
public facilities by the labour has not been observed. Beside these, no other issue of local
socioeconomic layout has been observed. In furtherance to the above, it has been noticed that the
employment of local people has resulted in considerable moderate economic benefit to the local people.
Thus the overall impact of completed work of project on socioeconomic layout has been found to be
beneficial.
Manpower & Recruitment
About 36 persons have been employed as contractual appointment by the contractor for the partial
construction of the project. This has led to moderate temporary beneficial impacts due to the
improvement in employment status of the area. Also appreciable moderate economic benefit is also
noticed due to the indirect employment which has benefited the local people. However, the recruitment
of these human resources has led to generation of considerable quantity of domestic sewage & waste.
DRAFT ENVIRONMENT IMPACT ASSESSMENT REPORT
Amendment in EC for Change in Fuel for 9.9 MW Captive Power Generation
Chapter-7.2: Ecological Damage Assessment &
Remediation Plan
Page | 7.2.5
Loads on Public Amenities
The load on public amenities due to the completed work has been noticed due to the use of freshwater
for the project and the increased traffic on the road. Especially the load on road network due to
increased traffic of the project has been identified as considerable but the change in level of service
category of local road has not been downgraded. The proponent has taken good care for traffic
management but the residual impacts were considerable. Such increase traffic might have resulted in
some minor impacts on ecological layout of the route of transportation for the project.
Transport
Transportation activities of the project have been done through the local road network which has led to
considerably increase traffic on the road network utilized. This has resulted in increase in rate of
exhaust from vehicles on the roads. This increased exhaust emission might have caused some non-
measurable adverse effects on ecological layout.
(6) Assessment of Environmental Impacts, Ecological Damage & Remediation Cost:
After identification & determination of environmental impacts of the project responsible for ecological
damage, numerical assessment of identified/determined impacts has been done. Based on this impact
assessment numerical analysis of information has been done to determine the cost of ecological
damage & remediation. The details are presented in subsequent sections.
Criteria for Assessment of Environmental Impacts causing Ecological Damage: The following
criteria and formula has been used for assessment of environmental impacts to determine level of
Ecological Damage.
Baseline Score (BS): 1=Critical, 2=Poor, 3= Moderate, 4=Good, 5=Excellent
Impact Frequency (IF) : 1=Rare, 2= Occasional, 3=Frequent, 4=Continuous
Impact Period (IP) : 1=1-2 Day, 2= 3-7Days, 3=8-15 Days, 4=>15 Days
Impact Distance (ID) : 1=<100 Mt, 2= 100-200 Mt, 3=201-500 Mt, 4=>500 Mt
Impact Sensitivity of Receptor (IS) : 1=Tolerant, 2= Slightly Sensitive, 3=Moderately
Sensitive, 4=Very Sensitive
Overall Impact Significance Score (OIS)=(IFx IP x ID x IS) /EoM
Criteria for Estimation of Impact Penalty & Damage: The following criteria and formula has been
used for estimation of Impact Penalty and Ecological Damage to determine the negative deviation in
baseline environmental status of the project.
Efficiency of Mitigation Provided (EoM): 0= Not Efficient, 0.25= 25% Efficient, 0.5= 50%
Efficient, 0.75=75% Efficient, 1=100% Efficient.
Penalty Factor for Impact (PI)=OIS/BS
Damage Potential (DP),%=OIS+PI
Environmental Status Score after Damage (PDES): Same as Baseline Score (BS)
Change in Baseline Score (CBS): 0=None,0.5= Minor, 0.5= Moderate, 0.75= High, 1= Critical
(- Sign Indicates adverse change in Environmental Status)
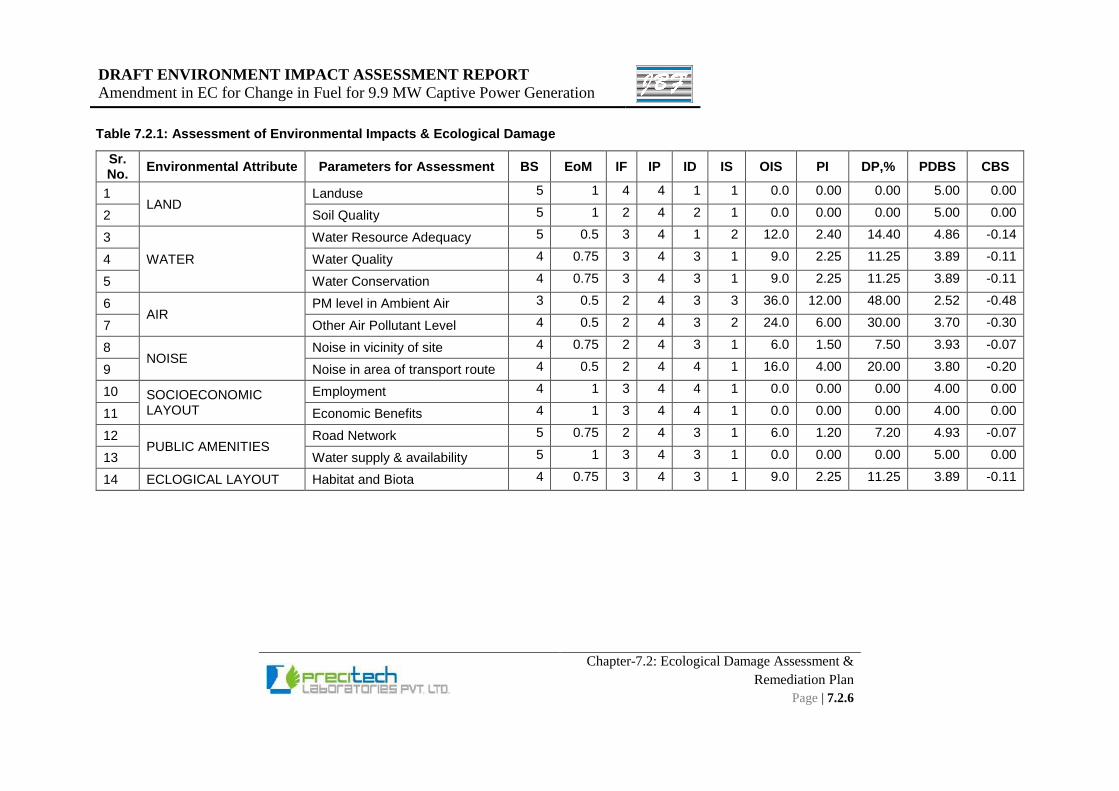
DRAFT ENVIRONMENT IMPACT ASSESSMENT REPORT
Amendment in EC for Change in Fuel for 9.9 MW Captive Power Generation
Chapter-7.2: Ecological Damage Assessment &
Remediation Plan
Page | 7.2.6
Table 7.2.1: Assessment of Environmental Impacts & Ecological Damage
Sr. No.
Environmental Attribute Parameters for Assessment BS EoM IF IP ID IS OIS PI DP,% PDBS CBS
1 LAND
Landuse 5 1 4 4 1 1 0.0 0.00 0.00 5.00 0.00
2 Soil Quality 5 1 2 4 2 1 0.0 0.00 0.00 5.00 0.00
3
WATER
Water Resource Adequacy 5 0.5 3 4 1 2 12.0 2.40 14.40 4.86 -0.14
4 Water Quality 4 0.75 3 4 3 1 9.0 2.25 11.25 3.89 -0.11
5 Water Conservation 4 0.75 3 4 3 1 9.0 2.25 11.25 3.89 -0.11
6 AIR
PM level in Ambient Air 3 0.5 2 4 3 3 36.0 12.00 48.00 2.52 -0.48
7 Other Air Pollutant Level 4 0.5 2 4 3 2 24.0 6.00 30.00 3.70 -0.30
8 NOISE
Noise in vicinity of site 4 0.75 2 4 3 1 6.0 1.50 7.50 3.93 -0.07
9 Noise in area of transport route 4 0.5 2 4 4 1 16.0 4.00 20.00 3.80 -0.20
10 SOCIOECONOMIC LAYOUT
Employment 4 1 3 4 4 1 0.0 0.00 0.00 4.00 0.00
11 Economic Benefits 4 1 3 4 4 1 0.0 0.00 0.00 4.00 0.00
12 PUBLIC AMENITIES
Road Network 5 0.75 2 4 3 1 6.0 1.20 7.20 4.93 -0.07
13 Water supply & availability 5 1 3 4 3 1 0.0 0.00 0.00 5.00 0.00
14 ECLOGICAL LAYOUT Habitat and Biota 4 0.75 3 4 3 1 9.0 2.25 11.25 3.89 -0.11
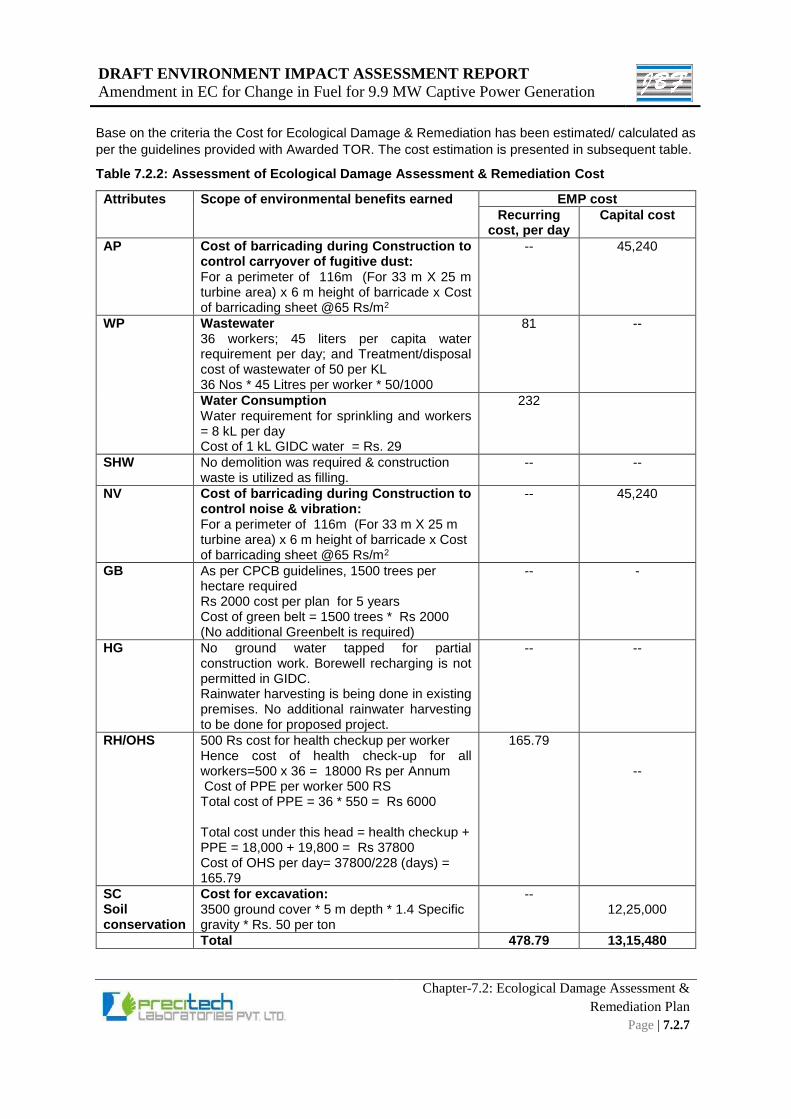
DRAFT ENVIRONMENT IMPACT ASSESSMENT REPORT
Amendment in EC for Change in Fuel for 9.9 MW Captive Power Generation
Chapter-7.2: Ecological Damage Assessment &
Remediation Plan
Page | 7.2.7
Base on the criteria the Cost for Ecological Damage & Remediation has been estimated/ calculated as
per the guidelines provided with Awarded TOR. The cost estimation is presented in subsequent table.
Table 7.2.2: Assessment of Ecological Damage Assessment & Remediation Cost
Attributes Scope of environmental benefits earned EMP cost
Recurring cost, per day
Capital cost
AP Cost of barricading during Construction to control carryover of fugitive dust: For a perimeter of 116m (For 33 m X 25 m turbine area) x 6 m height of barricade x Cost of barricading sheet @65 Rs/m2
-- 45,240
WP Wastewater 36 workers; 45 liters per capita water requirement per day; and Treatment/disposal cost of wastewater of 50 per KL 36 Nos * 45 Litres per worker * 50/1000
81 --
Water Consumption Water requirement for sprinkling and workers = 8 kL per day Cost of 1 kL GIDC water = Rs. 29
232
SHW No demolition was required & construction waste is utilized as filling.
-- --
NV Cost of barricading during Construction to control noise & vibration: For a perimeter of 116m (For 33 m X 25 m turbine area) x 6 m height of barricade x Cost of barricading sheet @65 Rs/m2
-- 45,240
GB As per CPCB guidelines, 1500 trees per hectare required Rs 2000 cost per plan for 5 years Cost of green belt = 1500 trees * Rs 2000 (No additional Greenbelt is required)
-- -
HG No ground water tapped for partial construction work. Borewell recharging is not permitted in GIDC. Rainwater harvesting is being done in existing premises. No additional rainwater harvesting to be done for proposed project.
-- --
RH/OHS 500 Rs cost for health checkup per worker Hence cost of health check-up for all workers=500 x 36 = 18000 Rs per Annum Cost of PPE per worker 500 RS Total cost of PPE = 36 * 550 = Rs 6000 Total cost under this head = health checkup + PPE = 18,000 + 19,800 = Rs 37800 Cost of OHS per day= 37800/228 (days) = 165.79
165.79
--
SC Soil conservation
Cost for excavation: 3500 ground cover * 5 m depth * 1.4 Specific gravity * Rs. 50 per ton
-- 12,25,000
Total 478.79 13,15,480
DRAFT ENVIRONMENT IMPACT ASSESSMENT REPORT
Amendment in EC for Change in Fuel for 9.9 MW Captive Power Generation
Chapter-7.2: Ecological Damage Assessment &
Remediation Plan
Page | 7.2.8
(A) Cost of Remediation Plan and natural & resource community augmentation plan
Total EMP cost = Rs 478.79 per day x 228 days of construction
=Rs. 1,09,164
(I) Total EMP cost = Annual Recurring + Capital Cost
= 13,15,480 + 1,06,164
= Rs. 14,24,644
(II) Profit earned due to the activity = 0.00
(III) Cost of Remediation Plan and natural & community resource augmentation plan = Cost of EMP (I)
+ 10 % of Profit earned (II)
= 14,24,644 + 0.10 * 0.00
= Rs. 1424644
(B) Cost of CER
Total capital cost = Rs. 4,20,000,000
Percentage of CER as per OM No. 22-65/2017–IA.III dated 1st May 2018 = 1% of capital cost
Cost of CER for the project = 1% x Rs. 4,20,000,000 = Rs. 42,00,000
(7) Remediation Action for Ecological Damage Assessment and Natural & Community
Augmentation Plan:
Considering the above description & assessment, it has been found that most of the impacts were
reversible & short term except the long term impacts on water environment. The damage caused to the
environment has also been found restored in almost all cases except land, water, air & biological
environment. Considering this, measures & action required for remediation for restoration of ecological
damage has been planned and the details of same are tabulated below.
Table 7.2.3: Remediation Plan for Ecological Damage Restoration
Sr. No.
Environmental Attribute
Mitigation Measures Implemented/ Planned
Measures & Action Required for Remediation for restoration of ecological damage
1 LAND Unused land within existing premises & adjoining plots (industrial land) with Greenbelt.
Waste management by reuse and disposal through approved mode
To restore the minor effects caused by project additional voluntary Greenbelt Development shall be done which is also needed for restoration of damage of other environmental attributes.
2 WATER Use of Water supplied from GIDC, No direct use of surface water or groundwater, RWH System
Soak Pit (during construction) and Reuse of construction wastewater
In addition to this, it has also been noticed that high water consumption activities of construction work has already been completed which has resulted in significant loss of ultimate water supply resource. This impact is reversible naturally but with significant uncertainty.
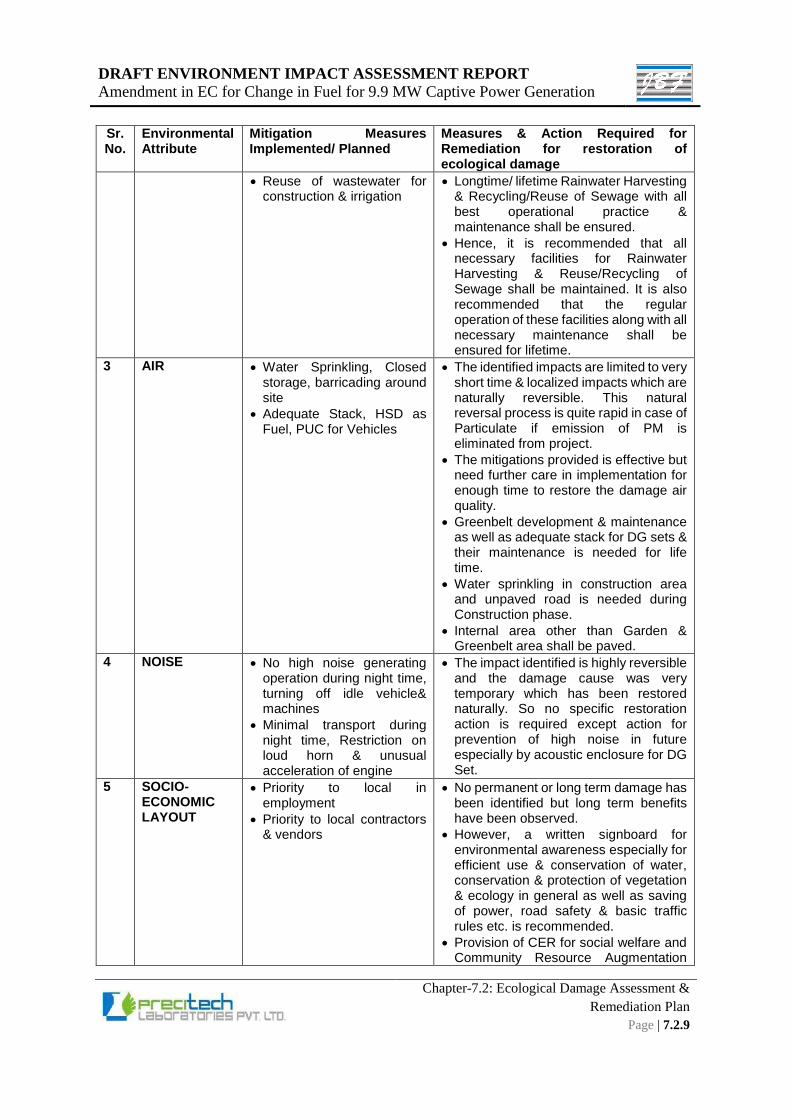
DRAFT ENVIRONMENT IMPACT ASSESSMENT REPORT
Amendment in EC for Change in Fuel for 9.9 MW Captive Power Generation
Chapter-7.2: Ecological Damage Assessment &
Remediation Plan
Page | 7.2.9
Sr. No.
Environmental Attribute
Mitigation Measures Implemented/ Planned
Measures & Action Required for Remediation for restoration of ecological damage
Reuse of wastewater for construction & irrigation
Longtime/ lifetime Rainwater Harvesting & Recycling/Reuse of Sewage with all best operational practice & maintenance shall be ensured.
Hence, it is recommended that all necessary facilities for Rainwater Harvesting & Reuse/Recycling of Sewage shall be maintained. It is also recommended that the regular operation of these facilities along with all necessary maintenance shall be ensured for lifetime.
3 AIR Water Sprinkling, Closed storage, barricading around site
Adequate Stack, HSD as Fuel, PUC for Vehicles
The identified impacts are limited to very short time & localized impacts which are naturally reversible. This natural reversal process is quite rapid in case of Particulate if emission of PM is eliminated from project.
The mitigations provided is effective but need further care in implementation for enough time to restore the damage air quality.
Greenbelt development & maintenance as well as adequate stack for DG sets & their maintenance is needed for life time.
Water sprinkling in construction area and unpaved road is needed during Construction phase.
Internal area other than Garden & Greenbelt area shall be paved.
4 NOISE No high noise generating operation during night time, turning off idle vehicle& machines
Minimal transport during night time, Restriction on loud horn & unusual acceleration of engine
The impact identified is highly reversible and the damage cause was very temporary which has been restored naturally. So no specific restoration action is required except action for prevention of high noise in future especially by acoustic enclosure for DG Set.
5 SOCIO-ECONOMIC LAYOUT
Priority to local in employment
Priority to local contractors & vendors
No permanent or long term damage has been identified but long term benefits have been observed.
However, a written signboard for environmental awareness especially for efficient use & conservation of water, conservation & protection of vegetation & ecology in general as well as saving of power, road safety & basic traffic rules etc. is recommended.
Provision of CER for social welfare and Community Resource Augmentation
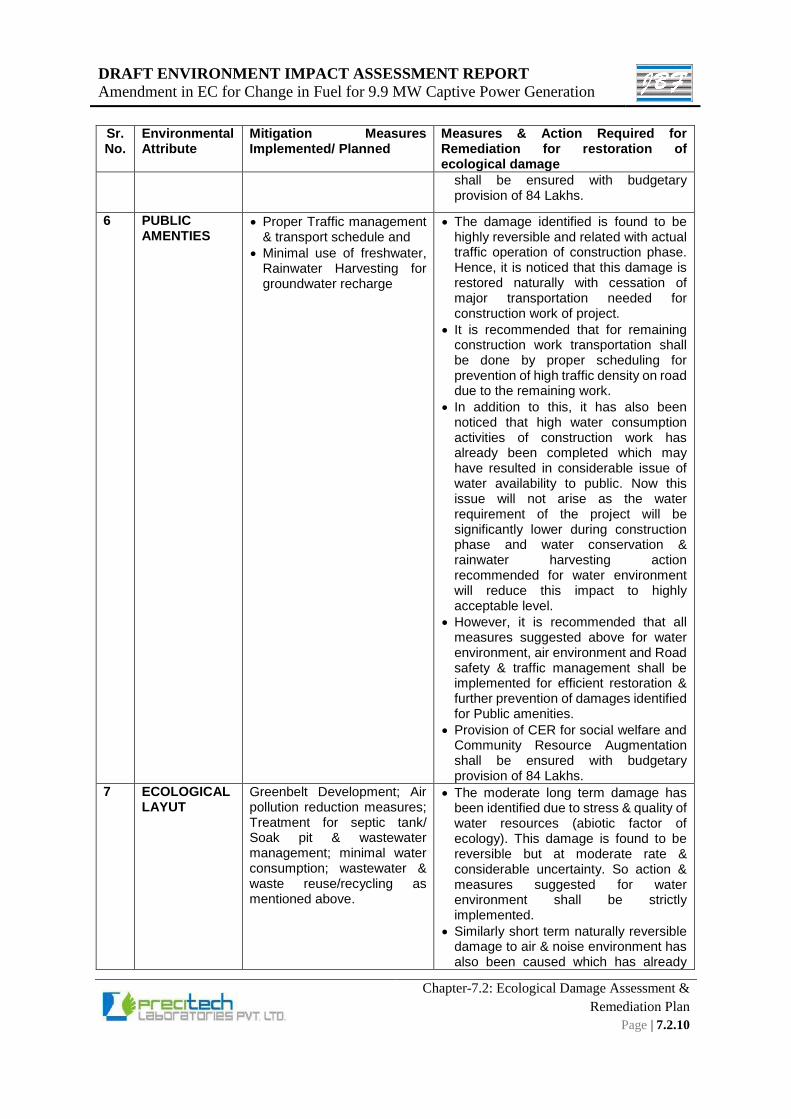
DRAFT ENVIRONMENT IMPACT ASSESSMENT REPORT
Amendment in EC for Change in Fuel for 9.9 MW Captive Power Generation
Chapter-7.2: Ecological Damage Assessment &
Remediation Plan
Page | 7.2.10
Sr. No.
Environmental Attribute
Mitigation Measures Implemented/ Planned
Measures & Action Required for Remediation for restoration of ecological damage
shall be ensured with budgetary provision of 84 Lakhs.
6 PUBLIC AMENTIES
Proper Traffic management & transport schedule and
Minimal use of freshwater, Rainwater Harvesting for groundwater recharge
The damage identified is found to be highly reversible and related with actual traffic operation of construction phase. Hence, it is noticed that this damage is restored naturally with cessation of major transportation needed for construction work of project.
It is recommended that for remaining construction work transportation shall be done by proper scheduling for prevention of high traffic density on road due to the remaining work.
In addition to this, it has also been noticed that high water consumption activities of construction work has already been completed which may have resulted in considerable issue of water availability to public. Now this issue will not arise as the water requirement of the project will be significantly lower during construction phase and water conservation & rainwater harvesting action recommended for water environment will reduce this impact to highly acceptable level.
However, it is recommended that all measures suggested above for water environment, air environment and Road safety & traffic management shall be implemented for efficient restoration & further prevention of damages identified for Public amenities.
Provision of CER for social welfare and Community Resource Augmentation shall be ensured with budgetary provision of 84 Lakhs.
7 ECOLOGICAL LAYUT
Greenbelt Development; Air pollution reduction measures; Treatment for septic tank/ Soak pit & wastewater management; minimal water consumption; wastewater & waste reuse/recycling as mentioned above.
The moderate long term damage has been identified due to stress & quality of water resources (abiotic factor of ecology). This damage is found to be reversible but at moderate rate & considerable uncertainty. So action & measures suggested for water environment shall be strictly implemented.
Similarly short term naturally reversible damage to air & noise environment has also been caused which has already
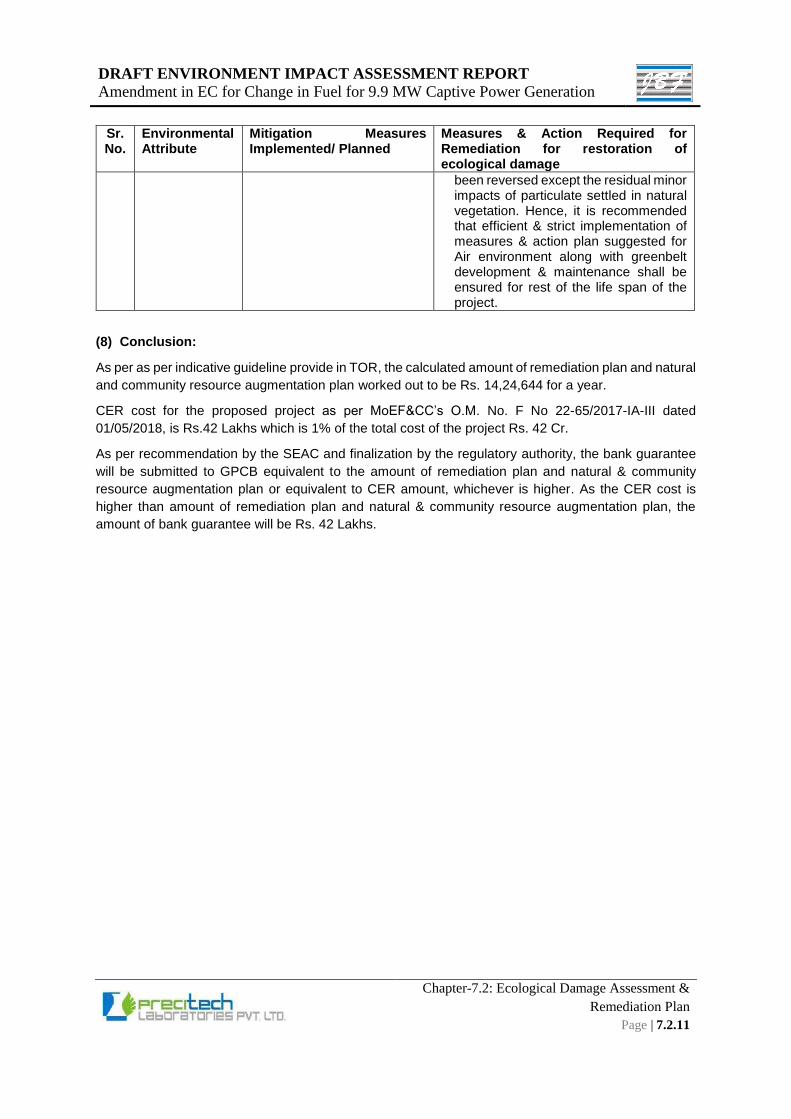
DRAFT ENVIRONMENT IMPACT ASSESSMENT REPORT
Amendment in EC for Change in Fuel for 9.9 MW Captive Power Generation
Chapter-7.2: Ecological Damage Assessment &
Remediation Plan
Page | 7.2.11
Sr. No.
Environmental Attribute
Mitigation Measures Implemented/ Planned
Measures & Action Required for Remediation for restoration of ecological damage
been reversed except the residual minor impacts of particulate settled in natural vegetation. Hence, it is recommended that efficient & strict implementation of measures & action plan suggested for Air environment along with greenbelt development & maintenance shall be ensured for rest of the life span of the project.
(8) Conclusion:
As per as per indicative guideline provide in TOR, the calculated amount of remediation plan and natural
and community resource augmentation plan worked out to be Rs. 14,24,644 for a year.
CER cost for the proposed project as per MoEF&CC’s O.M. No. F No 22-65/2017-IA-III dated
01/05/2018, is Rs.42 Lakhs which is 1% of the total cost of the project Rs. 42 Cr.
As per recommendation by the SEAC and finalization by the regulatory authority, the bank guarantee
will be submitted to GPCB equivalent to the amount of remediation plan and natural & community
resource augmentation plan or equivalent to CER amount, whichever is higher. As the CER cost is
higher than amount of remediation plan and natural & community resource augmentation plan, the
amount of bank guarantee will be Rs. 42 Lakhs.
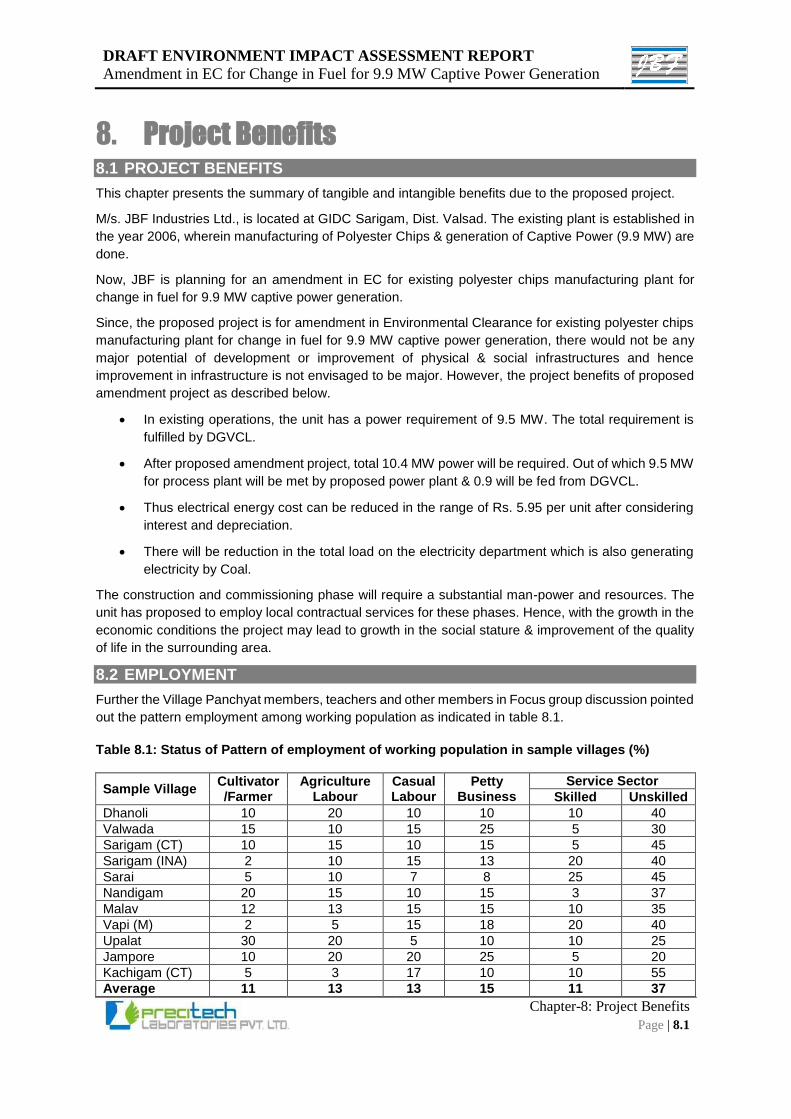
DRAFT ENVIRONMENT IMPACT ASSESSMENT REPORT
Amendment in EC for Change in Fuel for 9.9 MW Captive Power Generation
Chapter-8: Project Benefits
Page | 8.1
8. Project Benefits 8.1 PROJECT BENEFITS
This chapter presents the summary of tangible and intangible benefits due to the proposed project.
M/s. JBF Industries Ltd., is located at GIDC Sarigam, Dist. Valsad. The existing plant is established in
the year 2006, wherein manufacturing of Polyester Chips & generation of Captive Power (9.9 MW) are
done.
Now, JBF is planning for an amendment in EC for existing polyester chips manufacturing plant for
change in fuel for 9.9 MW captive power generation.
Since, the proposed project is for amendment in Environmental Clearance for existing polyester chips
manufacturing plant for change in fuel for 9.9 MW captive power generation, there would not be any
major potential of development or improvement of physical & social infrastructures and hence
improvement in infrastructure is not envisaged to be major. However, the project benefits of proposed
amendment project as described below.
In existing operations, the unit has a power requirement of 9.5 MW. The total requirement is
fulfilled by DGVCL.
After proposed amendment project, total 10.4 MW power will be required. Out of which 9.5 MW
for process plant will be met by proposed power plant & 0.9 will be fed from DGVCL.
Thus electrical energy cost can be reduced in the range of Rs. 5.95 per unit after considering
interest and depreciation.
There will be reduction in the total load on the electricity department which is also generating
electricity by Coal.
The construction and commissioning phase will require a substantial man-power and resources. The
unit has proposed to employ local contractual services for these phases. Hence, with the growth in the
economic conditions the project may lead to growth in the social stature & improvement of the quality
of life in the surrounding area.
8.2 EMPLOYMENT
Further the Village Panchyat members, teachers and other members in Focus group discussion pointed
out the pattern employment among working population as indicated in table 8.1.
Table 8.1: Status of Pattern of employment of working population in sample villages (%)
Sample Village Cultivator /Farmer
Agriculture Labour
Casual Labour
Petty Business
Service Sector
Skilled Unskilled
Dhanoli 10 20 10 10 10 40
Valwada 15 10 15 25 5 30
Sarigam (CT) 10 15 10 15 5 45
Sarigam (INA) 2 10 15 13 20 40
Sarai 5 10 7 8 25 45
Nandigam 20 15 10 15 3 37
Malav 12 13 15 15 10 35
Vapi (M) 2 5 15 18 20 40
Upalat 30 20 5 10 10 25
Jampore 10 20 20 25 5 20
Kachigam (CT) 5 3 17 10 10 55
Average 11 13 13 15 11 37
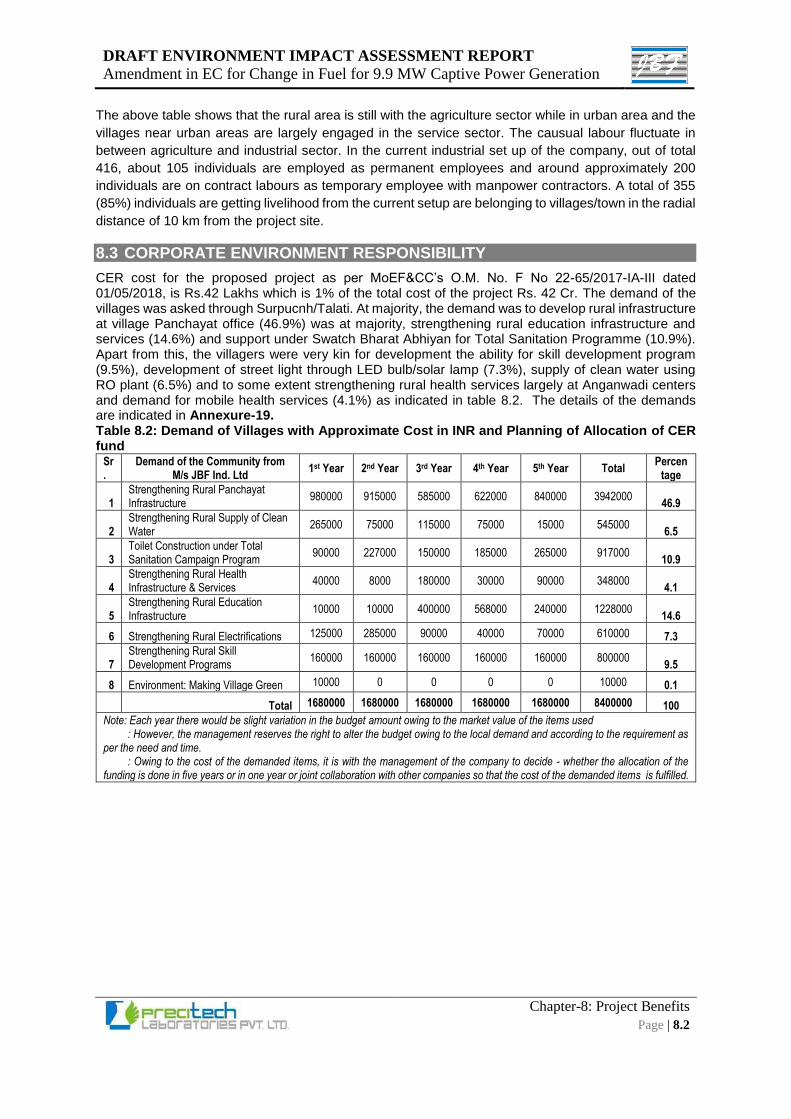
DRAFT ENVIRONMENT IMPACT ASSESSMENT REPORT
Amendment in EC for Change in Fuel for 9.9 MW Captive Power Generation
Chapter-8: Project Benefits
Page | 8.2
The above table shows that the rural area is still with the agriculture sector while in urban area and the
villages near urban areas are largely engaged in the service sector. The causual labour fluctuate in
between agriculture and industrial sector. In the current industrial set up of the company, out of total
416, about 105 individuals are employed as permanent employees and around approximately 200
individuals are on contract labours as temporary employee with manpower contractors. A total of 355
(85%) individuals are getting livelihood from the current setup are belonging to villages/town in the radial
distance of 10 km from the project site.
8.3 CORPORATE ENVIRONMENT RESPONSIBILITY
CER cost for the proposed project as per MoEF&CC’s O.M. No. F No 22-65/2017-IA-III dated 01/05/2018, is Rs.42 Lakhs which is 1% of the total cost of the project Rs. 42 Cr. The demand of the villages was asked through Surpucnh/Talati. At majority, the demand was to develop rural infrastructure at village Panchayat office (46.9%) was at majority, strengthening rural education infrastructure and services (14.6%) and support under Swatch Bharat Abhiyan for Total Sanitation Programme (10.9%). Apart from this, the villagers were very kin for development the ability for skill development program (9.5%), development of street light through LED bulb/solar lamp (7.3%), supply of clean water using RO plant (6.5%) and to some extent strengthening rural health services largely at Anganwadi centers and demand for mobile health services (4.1%) as indicated in table 8.2. The details of the demands are indicated in Annexure-19. Table 8.2: Demand of Villages with Approximate Cost in INR and Planning of Allocation of CER fund
Sr.
Demand of the Community from M/s JBF Ind. Ltd
1st Year 2nd Year 3rd Year 4th Year 5th Year Total Percen
tage
1 Strengthening Rural Panchayat Infrastructure
980000 915000 585000 622000 840000 3942000 46.9
2 Strengthening Rural Supply of Clean Water
265000 75000 115000 75000 15000 545000 6.5
3 Toilet Construction under Total Sanitation Campaign Program
90000 227000 150000 185000 265000 917000 10.9
4 Strengthening Rural Health Infrastructure & Services
40000 8000 180000 30000 90000 348000 4.1
5 Strengthening Rural Education Infrastructure
10000 10000 400000 568000 240000 1228000 14.6
6 Strengthening Rural Electrifications 125000 285000 90000 40000 70000 610000 7.3
7 Strengthening Rural Skill Development Programs
160000 160000 160000 160000 160000 800000 9.5
8 Environment: Making Village Green 10000 0 0 0 0 10000 0.1
Total 1680000 1680000 1680000 1680000 1680000 8400000 100
Note: Each year there would be slight variation in the budget amount owing to the market value of the items used : However, the management reserves the right to alter the budget owing to the local demand and according to the requirement as per the need and time. : Owing to the cost of the demanded items, it is with the management of the company to decide - whether the allocation of the funding is done in five years or in one year or joint collaboration with other companies so that the cost of the demanded items is fulfilled.

DRAFT ENVIRONMENT IMPACT ASSESSMENT REPORT
Amendment in EC for Change in Fuel for 9.9 MW Captive Power Generation
Chapter-9: Environmental Cost Benefit Analysis
Page | 9.1
9. Environmental Cost Benefit Analysis Environmental cost benefit analysis has not been recommended at the scoping stage, and has
therefore not been carried out.
DRAFT ENVIRONMENT IMPACT ASSESSMENT REPORT
Amendment in EC for Change in Fuel for 9.9 MW Captive Power Generation
Chapter-10: Environment Management Plan
Page | 10.1
10. Environment Management Plan 10.1 INTRODUCTION
The Environmental Management Plan (EMP) is an important part of an EIA study. The primary purpose
of an EMP is to delineate suitable mitigation measures and serves as an essential tool & guidelines to
minimize the potential environmental impacts from the proposed project. EMP also represents the
commitment & efforts of the project proponent to protect & improve the environment as well as the life
of neighbouring population. It’s also a step towards sustainable industrial development concept. EMP
must ensure effective implementation of mitigation measures planned / recommended to reduce or
eliminate the adverse impacts likely or predicted to occur from various activities of the proposed project. www.cbse.nic.in,Andhra Pradesh AP SSC R esult 2015,CBSE 10th Result s 2015,K erala Plus Two Result 2015 + 2
10.2 OBJECTIVES OF EMP
The major objectives of this EMP are:
To comply with all the conditions of the regulations / applicable laws stipulated by MoEF,
Central Pollution Control Board and State Pollution Control Board.
To control and remediate wastewater, emission & solid/hazardous waste posing adverse
impacts on environment by adopting / installing appropriate pollution control measures /
equipment.
To plan & implement environmental conservation & protection measures for achieving the
stipulated environmental standards and to improve the environment management practices.
To improve workplace conditions for employees and neighbouring environment.
To eliminate / reduce the possibility of potential hazard due to operations.
To make budgetary provision and allocation of funds for effective implementation of
environment management system.
To encourage and inspire employees & contractor to plan, act and contribute towards
environmental conservation, protection & improvement in the daily operations.
To contribute significantly towards sustainable development by resource conservation and
waste minimization practices.
JBF Industries Ltd., Sarigam has well designed & adequately implemented environmental management
plan for its existing plant for environmental protection, conservation & improvement. In context with
proposed projects, the potential for environmental pollution during construction phase is temporary,
localised, reversible and insignificant. The impact during the operational phase of the project could be
mitigated by adopting pollution control/abatement measures and installation of adequate pollution
control equipment.
The Environmental Management Plan for the proposed projects has been presented in the subsequent
sections of this Chapter with necessary discussions.
10.3 PURPOSE OF THE STUDY
Apart from having an EMP, it is also necessary to have a permanent organizational set-up (such as an
Environmental, Health and Safety [EHS] Department to ensure effective implementation of EMP.
JBF, Sarigam has an EHS Department to monitor the performance of environmental, safety and health
attributes of the Company. The setup of the EHS Department is given in Figure 10.1. The EHS
Department will also be responsible to plan, implement and monitor the environmental performance of
the proposed project.
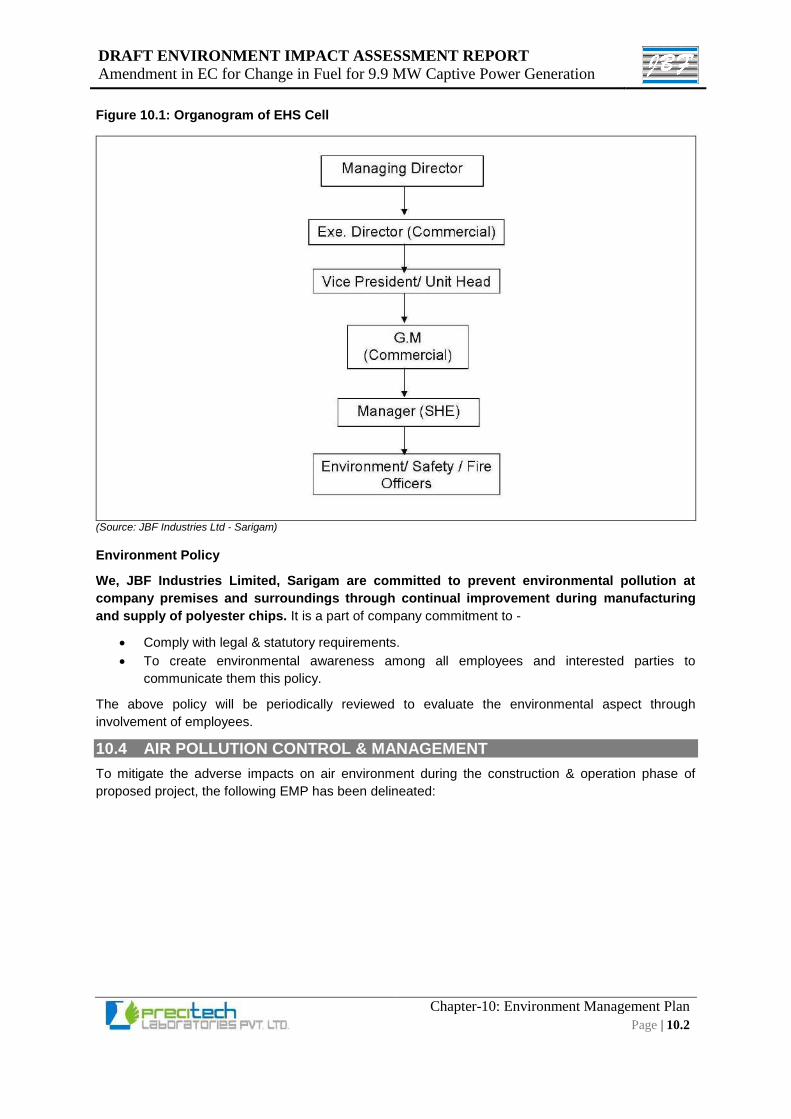
DRAFT ENVIRONMENT IMPACT ASSESSMENT REPORT
Amendment in EC for Change in Fuel for 9.9 MW Captive Power Generation
Chapter-10: Environment Management Plan
Page | 10.2
Figure 10.1: Organogram of EHS Cell
(Source: JBF Industries Ltd - Sarigam)
Environment Policy
We, JBF Industries Limited, Sarigam are committed to prevent environmental pollution at
company premises and surroundings through continual improvement during manufacturing
and supply of polyester chips. It is a part of company commitment to -
Comply with legal & statutory requirements.
To create environmental awareness among all employees and interested parties to
communicate them this policy.
The above policy will be periodically reviewed to evaluate the environmental aspect through
involvement of employees.
10.4 AIR POLLUTION CONTROL & MANAGEMENT
To mitigate the adverse impacts on air environment during the construction & operation phase of
proposed project, the following EMP has been delineated:
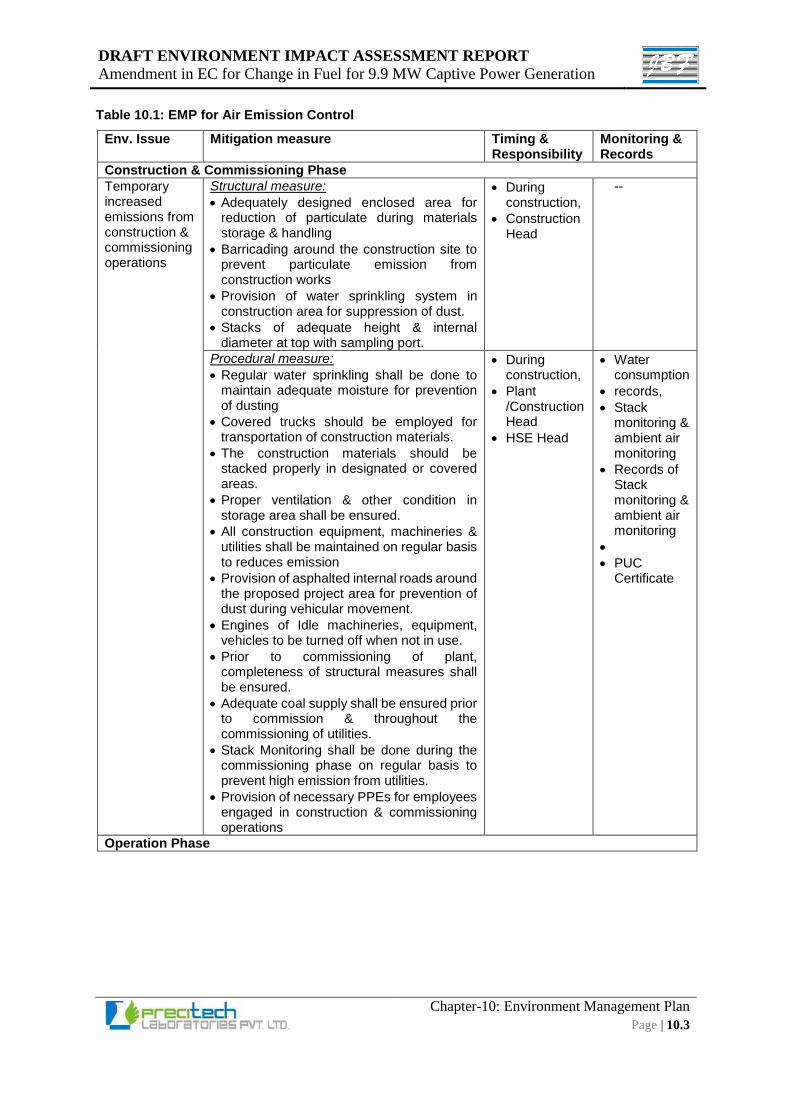
DRAFT ENVIRONMENT IMPACT ASSESSMENT REPORT
Amendment in EC for Change in Fuel for 9.9 MW Captive Power Generation
Chapter-10: Environment Management Plan
Page | 10.3
Table 10.1: EMP for Air Emission Control
Env. Issue Mitigation measure Timing & Responsibility
Monitoring & Records
Construction & Commissioning Phase
Temporary increased emissions from construction & commissioning operations
Structural measure:
Adequately designed enclosed area for reduction of particulate during materials storage & handling
Barricading around the construction site to prevent particulate emission from construction works
Provision of water sprinkling system in construction area for suppression of dust.
Stacks of adequate height & internal diameter at top with sampling port.
During construction,
Construction Head
--
Procedural measure:
Regular water sprinkling shall be done to maintain adequate moisture for prevention of dusting
Covered trucks should be employed for transportation of construction materials.
The construction materials should be stacked properly in designated or covered areas.
Proper ventilation & other condition in storage area shall be ensured.
All construction equipment, machineries & utilities shall be maintained on regular basis to reduces emission
Provision of asphalted internal roads around the proposed project area for prevention of dust during vehicular movement.
Engines of Idle machineries, equipment, vehicles to be turned off when not in use.
Prior to commissioning of plant, completeness of structural measures shall be ensured.
Adequate coal supply shall be ensured prior to commission & throughout the commissioning of utilities.
Stack Monitoring shall be done during the commissioning phase on regular basis to prevent high emission from utilities.
Provision of necessary PPEs for employees engaged in construction & commissioning operations
During construction,
Plant /Construction Head
HSE Head
Water consumption
records,
Stack monitoring & ambient air monitoring
Records of Stack monitoring & ambient air monitoring
PUC Certificate
Operation Phase
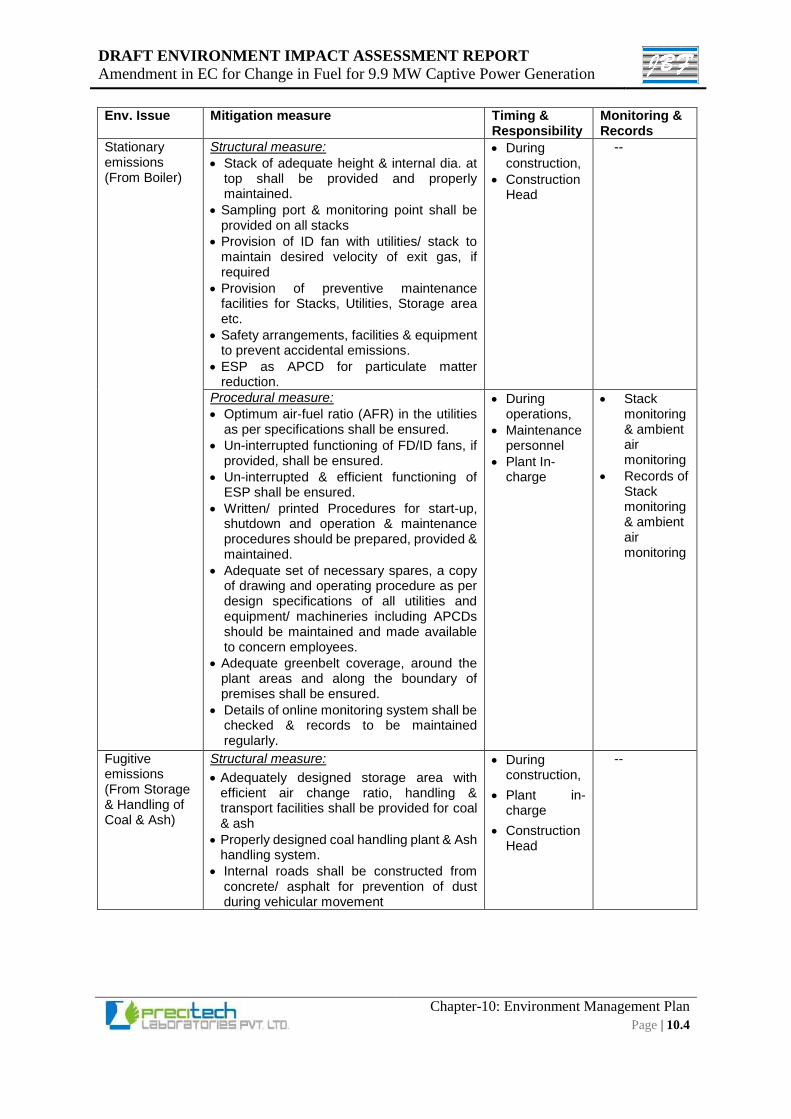
DRAFT ENVIRONMENT IMPACT ASSESSMENT REPORT
Amendment in EC for Change in Fuel for 9.9 MW Captive Power Generation
Chapter-10: Environment Management Plan
Page | 10.4
Env. Issue Mitigation measure Timing & Responsibility
Monitoring & Records
Stationary emissions (From Boiler)
Structural measure:
Stack of adequate height & internal dia. at top shall be provided and properly maintained.
Sampling port & monitoring point shall be provided on all stacks
Provision of ID fan with utilities/ stack to maintain desired velocity of exit gas, if required
Provision of preventive maintenance facilities for Stacks, Utilities, Storage area etc.
Safety arrangements, facilities & equipment to prevent accidental emissions.
ESP as APCD for particulate matter reduction.
During construction,
Construction Head
--
Procedural measure:
Optimum air-fuel ratio (AFR) in the utilities as per specifications shall be ensured.
Un-interrupted functioning of FD/ID fans, if provided, shall be ensured.
Un-interrupted & efficient functioning of ESP shall be ensured.
Written/ printed Procedures for start-up, shutdown and operation & maintenance procedures should be prepared, provided & maintained.
Adequate set of necessary spares, a copy of drawing and operating procedure as per design specifications of all utilities and equipment/ machineries including APCDs should be maintained and made available to concern employees.
Adequate greenbelt coverage, around the plant areas and along the boundary of premises shall be ensured.
Details of online monitoring system shall be checked & records to be maintained regularly.
During operations,
Maintenance personnel
Plant In-charge
Stack monitoring & ambient air monitoring
Records of Stack monitoring & ambient air monitoring
Fugitive emissions (From Storage & Handling of Coal & Ash)
Structural measure:
Adequately designed storage area with efficient air change ratio, handling & transport facilities shall be provided for coal & ash
Properly designed coal handling plant & Ash handling system.
Internal roads shall be constructed from concrete/ asphalt for prevention of dust during vehicular movement
During construction,
Plant in-charge
Construction Head
--
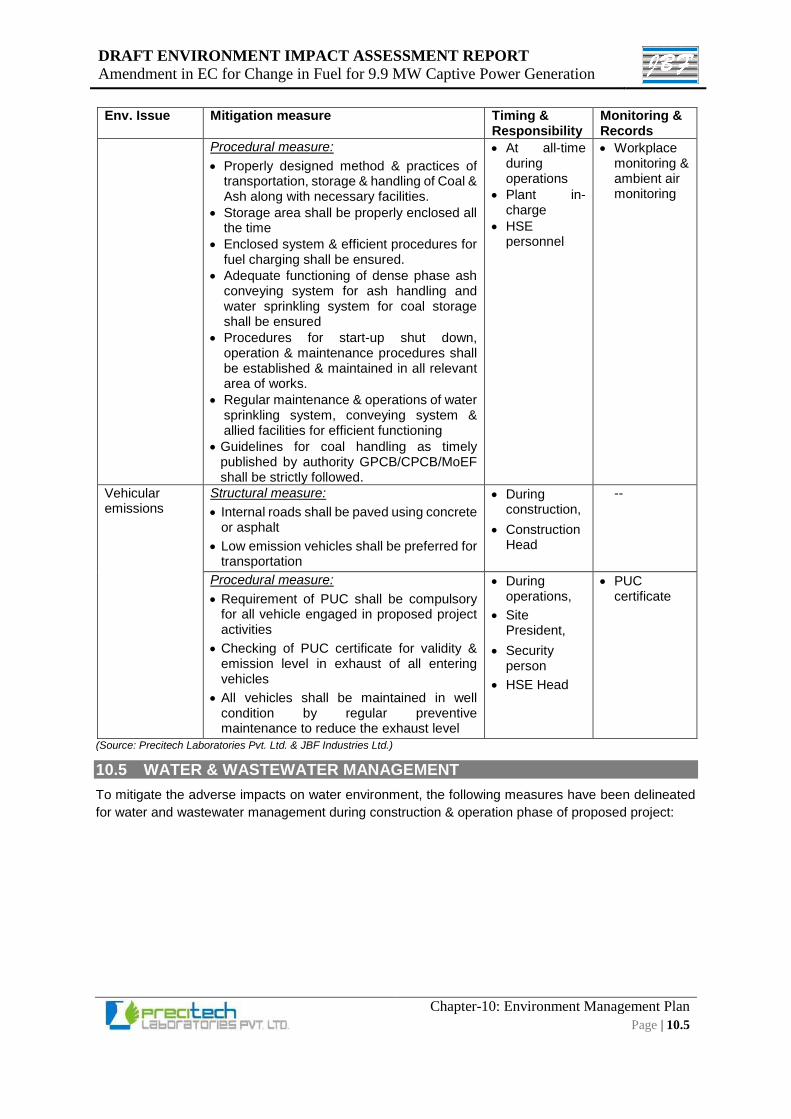
DRAFT ENVIRONMENT IMPACT ASSESSMENT REPORT
Amendment in EC for Change in Fuel for 9.9 MW Captive Power Generation
Chapter-10: Environment Management Plan
Page | 10.5
Env. Issue Mitigation measure Timing & Responsibility
Monitoring & Records
Procedural measure:
Properly designed method & practices of transportation, storage & handling of Coal & Ash along with necessary facilities.
Storage area shall be properly enclosed all the time
Enclosed system & efficient procedures for fuel charging shall be ensured.
Adequate functioning of dense phase ash conveying system for ash handling and water sprinkling system for coal storage shall be ensured
Procedures for start-up shut down, operation & maintenance procedures shall be established & maintained in all relevant area of works.
Regular maintenance & operations of water sprinkling system, conveying system & allied facilities for efficient functioning
Guidelines for coal handling as timely published by authority GPCB/CPCB/MoEF shall be strictly followed.
At all-time during operations
Plant in-charge
HSE personnel
Workplace monitoring & ambient air monitoring
Vehicular emissions
Structural measure:
Internal roads shall be paved using concrete or asphalt
Low emission vehicles shall be preferred for transportation
During construction,
Construction Head
--
Procedural measure:
Requirement of PUC shall be compulsory for all vehicle engaged in proposed project activities
Checking of PUC certificate for validity & emission level in exhaust of all entering vehicles
All vehicles shall be maintained in well condition by regular preventive maintenance to reduce the exhaust level
During operations,
Site President,
Security person
HSE Head
PUC certificate
(Source: Precitech Laboratories Pvt. Ltd. & JBF Industries Ltd.)
10.5 WATER & WASTEWATER MANAGEMENT
To mitigate the adverse impacts on water environment, the following measures have been delineated
for water and wastewater management during construction & operation phase of proposed project:
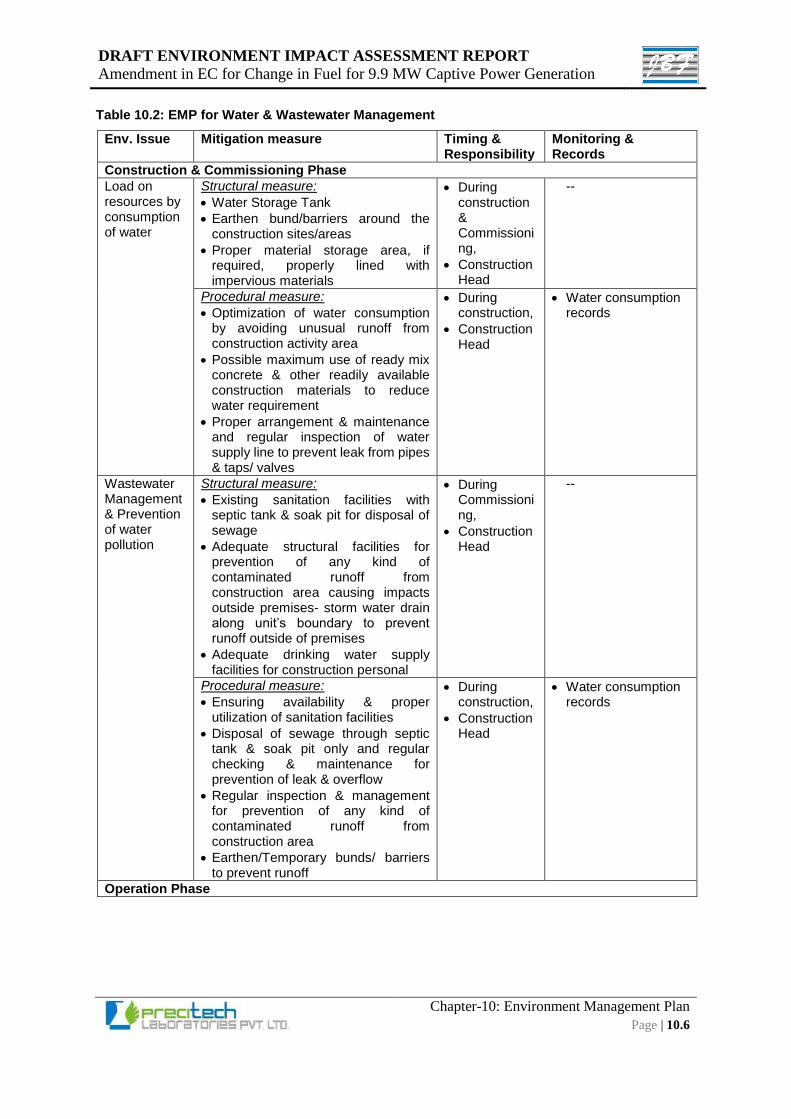
DRAFT ENVIRONMENT IMPACT ASSESSMENT REPORT
Amendment in EC for Change in Fuel for 9.9 MW Captive Power Generation
Chapter-10: Environment Management Plan
Page | 10.6
Table 10.2: EMP for Water & Wastewater Management
Env. Issue Mitigation measure Timing & Responsibility
Monitoring & Records
Construction & Commissioning Phase
Load on resources by consumption of water
Structural measure:
Water Storage Tank
Earthen bund/barriers around the construction sites/areas
Proper material storage area, if required, properly lined with impervious materials
During construction & Commissioning,
Construction Head
--
Procedural measure:
Optimization of water consumption by avoiding unusual runoff from construction activity area
Possible maximum use of ready mix concrete & other readily available construction materials to reduce water requirement
Proper arrangement & maintenance and regular inspection of water supply line to prevent leak from pipes & taps/ valves
During construction,
Construction Head
Water consumption records
Wastewater Management & Prevention of water pollution
Structural measure:
Existing sanitation facilities with septic tank & soak pit for disposal of sewage
Adequate structural facilities for prevention of any kind of contaminated runoff from construction area causing impacts outside premises- storm water drain along unit’s boundary to prevent runoff outside of premises
Adequate drinking water supply facilities for construction personal
During Commissioning,
Construction Head
--
Procedural measure:
Ensuring availability & proper utilization of sanitation facilities
Disposal of sewage through septic tank & soak pit only and regular checking & maintenance for prevention of leak & overflow
Regular inspection & management for prevention of any kind of contaminated runoff from construction area
Earthen/Temporary bunds/ barriers to prevent runoff
During construction,
Construction Head
Water consumption records
Operation Phase
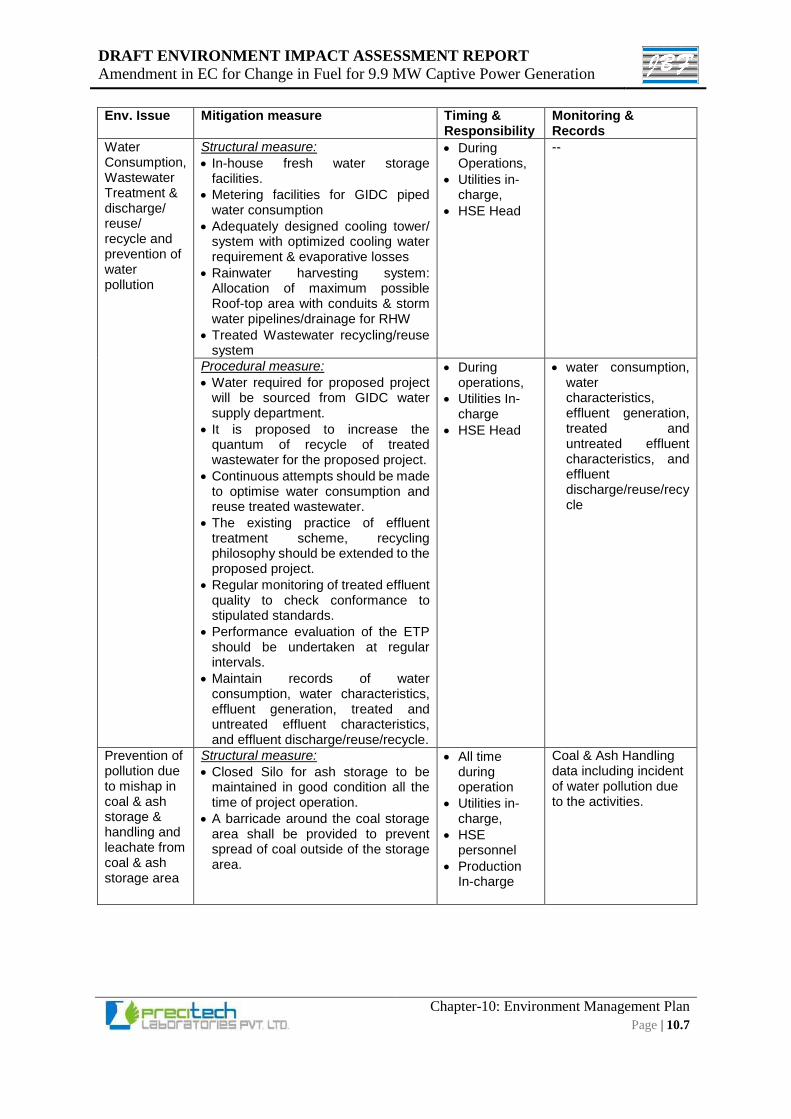
DRAFT ENVIRONMENT IMPACT ASSESSMENT REPORT
Amendment in EC for Change in Fuel for 9.9 MW Captive Power Generation
Chapter-10: Environment Management Plan
Page | 10.7
Env. Issue Mitigation measure Timing & Responsibility
Monitoring & Records
Water Consumption, Wastewater Treatment & discharge/ reuse/ recycle and prevention of water pollution
Structural measure:
In-house fresh water storage facilities.
Metering facilities for GIDC piped water consumption
Adequately designed cooling tower/ system with optimized cooling water requirement & evaporative losses
Rainwater harvesting system: Allocation of maximum possible Roof-top area with conduits & storm water pipelines/drainage for RHW
Treated Wastewater recycling/reuse system
During Operations,
Utilities in-charge,
HSE Head
--
Procedural measure:
Water required for proposed project will be sourced from GIDC water supply department.
It is proposed to increase the quantum of recycle of treated wastewater for the proposed project.
Continuous attempts should be made to optimise water consumption and reuse treated wastewater.
The existing practice of effluent treatment scheme, recycling philosophy should be extended to the proposed project.
Regular monitoring of treated effluent quality to check conformance to stipulated standards.
Performance evaluation of the ETP should be undertaken at regular intervals.
Maintain records of water consumption, water characteristics, effluent generation, treated and untreated effluent characteristics, and effluent discharge/reuse/recycle.
During operations,
Utilities In-charge
HSE Head
water consumption, water characteristics, effluent generation, treated and untreated effluent characteristics, and effluent discharge/reuse/recycle
Prevention of pollution due to mishap in coal & ash storage & handling and leachate from coal & ash storage area
Structural measure:
Closed Silo for ash storage to be maintained in good condition all the time of project operation.
A barricade around the coal storage area shall be provided to prevent spread of coal outside of the storage area.
All time during operation
Utilities in-charge,
HSE personnel
Production In-charge
Coal & Ash Handling data including incident of water pollution due to the activities.
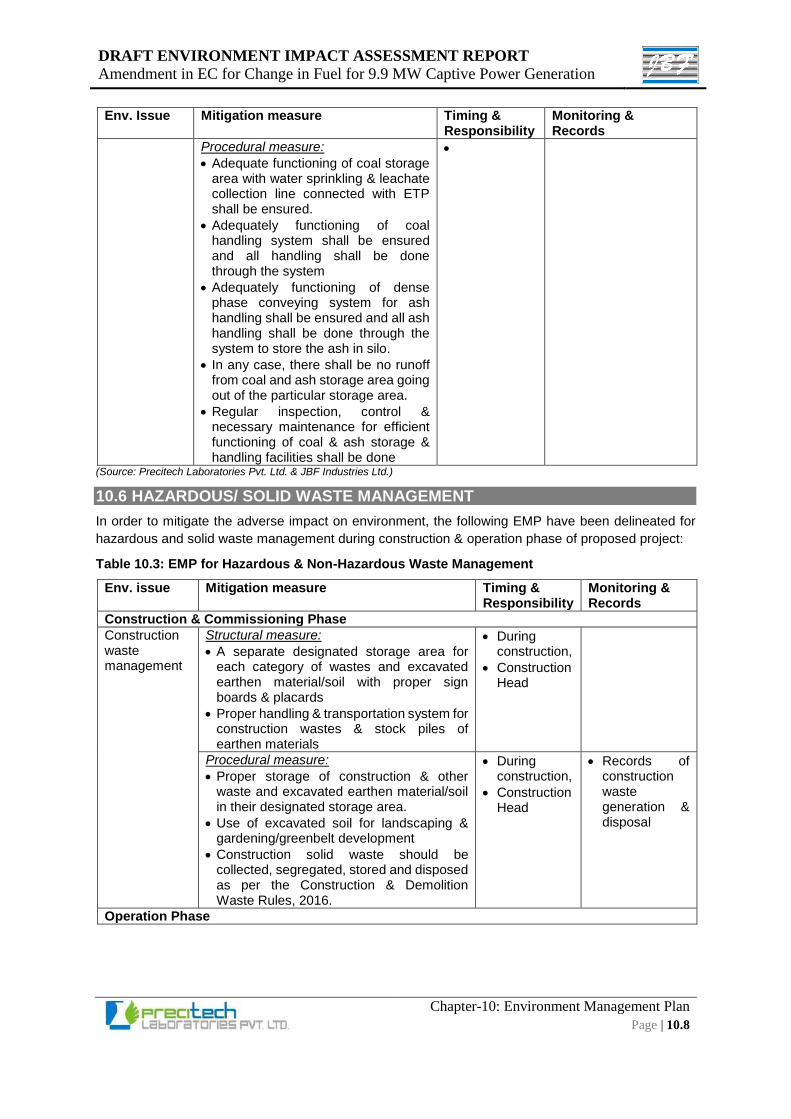
DRAFT ENVIRONMENT IMPACT ASSESSMENT REPORT
Amendment in EC for Change in Fuel for 9.9 MW Captive Power Generation
Chapter-10: Environment Management Plan
Page | 10.8
Env. Issue Mitigation measure Timing & Responsibility
Monitoring & Records
Procedural measure:
Adequate functioning of coal storage area with water sprinkling & leachate collection line connected with ETP shall be ensured.
Adequately functioning of coal handling system shall be ensured and all handling shall be done through the system
Adequately functioning of dense phase conveying system for ash handling shall be ensured and all ash handling shall be done through the system to store the ash in silo.
In any case, there shall be no runoff from coal and ash storage area going out of the particular storage area.
Regular inspection, control & necessary maintenance for efficient functioning of coal & ash storage & handling facilities shall be done
(Source: Precitech Laboratories Pvt. Ltd. & JBF Industries Ltd.)
10.6 HAZARDOUS/ SOLID WASTE MANAGEMENT
In order to mitigate the adverse impact on environment, the following EMP have been delineated for
hazardous and solid waste management during construction & operation phase of proposed project:
Table 10.3: EMP for Hazardous & Non-Hazardous Waste Management
Env. issue Mitigation measure Timing & Responsibility
Monitoring & Records
Construction & Commissioning Phase
Construction waste management
Structural measure:
A separate designated storage area for each category of wastes and excavated earthen material/soil with proper sign boards & placards
Proper handling & transportation system for construction wastes & stock piles of earthen materials
During construction,
Construction Head
Procedural measure:
Proper storage of construction & other waste and excavated earthen material/soil in their designated storage area.
Use of excavated soil for landscaping & gardening/greenbelt development
Construction solid waste should be collected, segregated, stored and disposed as per the Construction & Demolition Waste Rules, 2016.
During construction,
Construction Head
Records of construction waste generation & disposal
Operation Phase
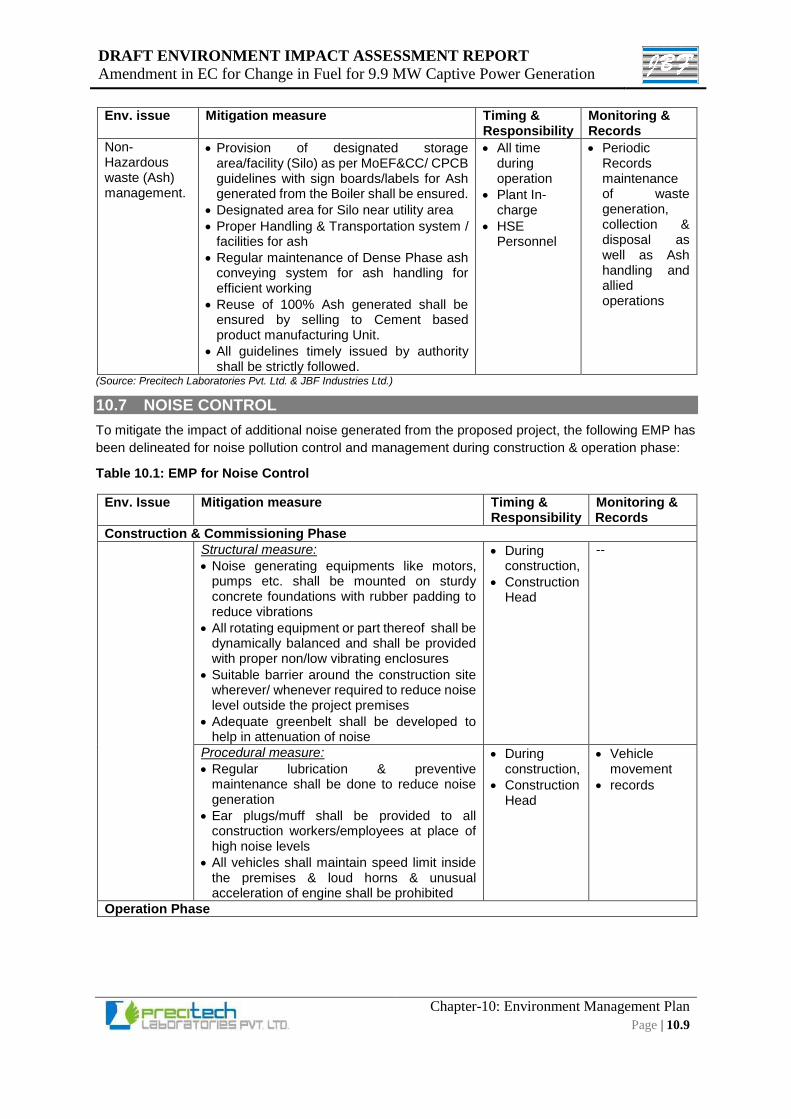
DRAFT ENVIRONMENT IMPACT ASSESSMENT REPORT
Amendment in EC for Change in Fuel for 9.9 MW Captive Power Generation
Chapter-10: Environment Management Plan
Page | 10.9
Env. issue Mitigation measure Timing & Responsibility
Monitoring & Records
Non-Hazardous waste (Ash) management.
Provision of designated storage area/facility (Silo) as per MoEF&CC/ CPCB guidelines with sign boards/labels for Ash generated from the Boiler shall be ensured.
Designated area for Silo near utility area
Proper Handling & Transportation system / facilities for ash
Regular maintenance of Dense Phase ash conveying system for ash handling for efficient working
Reuse of 100% Ash generated shall be ensured by selling to Cement based product manufacturing Unit.
All guidelines timely issued by authority shall be strictly followed.
All time during operation
Plant In-charge
HSE Personnel
Periodic Records maintenance of waste generation, collection & disposal as well as Ash handling and allied operations
(Source: Precitech Laboratories Pvt. Ltd. & JBF Industries Ltd.)
10.7 NOISE CONTROL
To mitigate the impact of additional noise generated from the proposed project, the following EMP has
been delineated for noise pollution control and management during construction & operation phase:
Table 10.1: EMP for Noise Control
Env. Issue Mitigation measure Timing & Responsibility
Monitoring & Records
Construction & Commissioning Phase
Structural measure:
Noise generating equipments like motors, pumps etc. shall be mounted on sturdy concrete foundations with rubber padding to reduce vibrations
All rotating equipment or part thereof shall be dynamically balanced and shall be provided with proper non/low vibrating enclosures
Suitable barrier around the construction site wherever/ whenever required to reduce noise level outside the project premises
Adequate greenbelt shall be developed to help in attenuation of noise
During construction,
Construction Head
--
Procedural measure:
Regular lubrication & preventive maintenance shall be done to reduce noise generation
Ear plugs/muff shall be provided to all construction workers/employees at place of high noise levels
All vehicles shall maintain speed limit inside the premises & loud horns & unusual acceleration of engine shall be prohibited
During construction,
Construction Head
Vehicle movement
records
Operation Phase
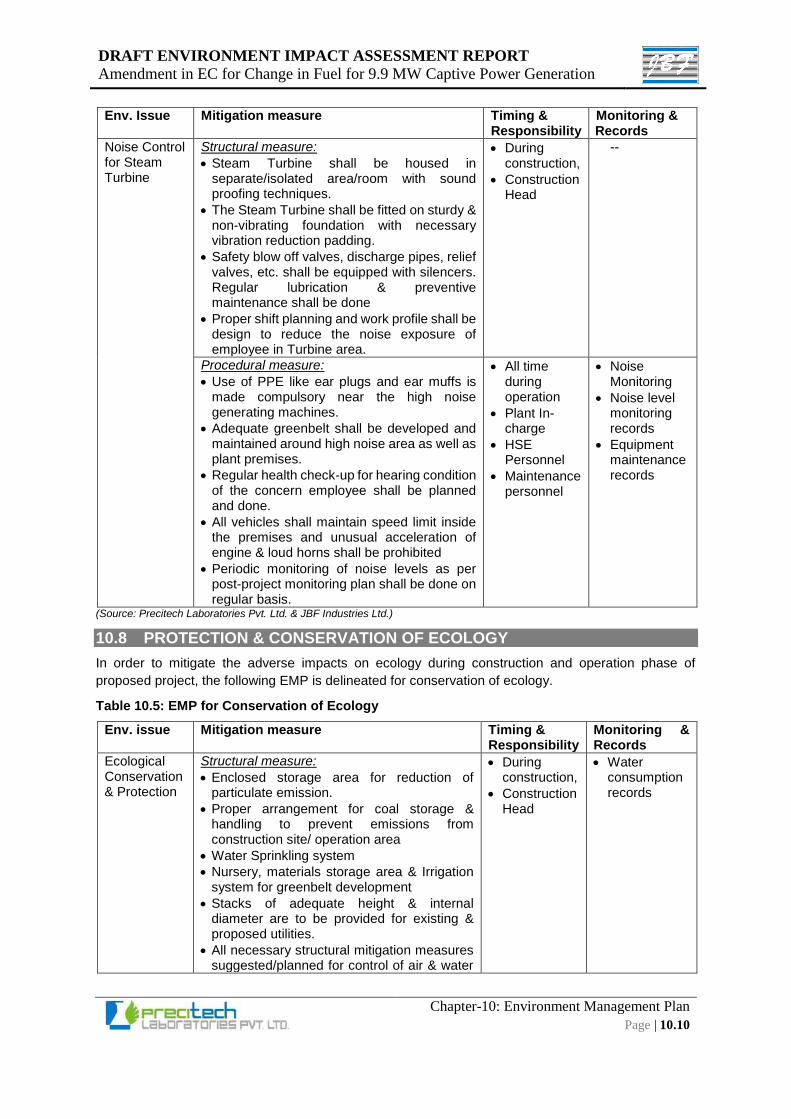
DRAFT ENVIRONMENT IMPACT ASSESSMENT REPORT
Amendment in EC for Change in Fuel for 9.9 MW Captive Power Generation
Chapter-10: Environment Management Plan
Page | 10.10
Env. Issue Mitigation measure Timing & Responsibility
Monitoring & Records
Noise Control for Steam Turbine
Structural measure:
Steam Turbine shall be housed in separate/isolated area/room with sound proofing techniques.
The Steam Turbine shall be fitted on sturdy & non-vibrating foundation with necessary vibration reduction padding.
Safety blow off valves, discharge pipes, relief valves, etc. shall be equipped with silencers. Regular lubrication & preventive maintenance shall be done
Proper shift planning and work profile shall be design to reduce the noise exposure of employee in Turbine area.
During construction,
Construction Head
--
Procedural measure:
Use of PPE like ear plugs and ear muffs is made compulsory near the high noise generating machines.
Adequate greenbelt shall be developed and maintained around high noise area as well as plant premises.
Regular health check-up for hearing condition of the concern employee shall be planned and done.
All vehicles shall maintain speed limit inside the premises and unusual acceleration of engine & loud horns shall be prohibited
Periodic monitoring of noise levels as per post-project monitoring plan shall be done on regular basis.
All time during operation
Plant In-charge
HSE Personnel
Maintenance personnel
Noise Monitoring
Noise level monitoring records
Equipment maintenance records
(Source: Precitech Laboratories Pvt. Ltd. & JBF Industries Ltd.)
10.8 PROTECTION & CONSERVATION OF ECOLOGY
In order to mitigate the adverse impacts on ecology during construction and operation phase of
proposed project, the following EMP is delineated for conservation of ecology.
Table 10.5: EMP for Conservation of Ecology
Env. issue Mitigation measure Timing & Responsibility
Monitoring & Records
Ecological Conservation & Protection
Structural measure:
Enclosed storage area for reduction of particulate emission.
Proper arrangement for coal storage & handling to prevent emissions from construction site/ operation area
Water Sprinkling system
Nursery, materials storage area & Irrigation system for greenbelt development
Stacks of adequate height & internal diameter are to be provided for existing & proposed utilities.
All necessary structural mitigation measures suggested/planned for control of air & water
During construction,
Construction Head
Water consumption records
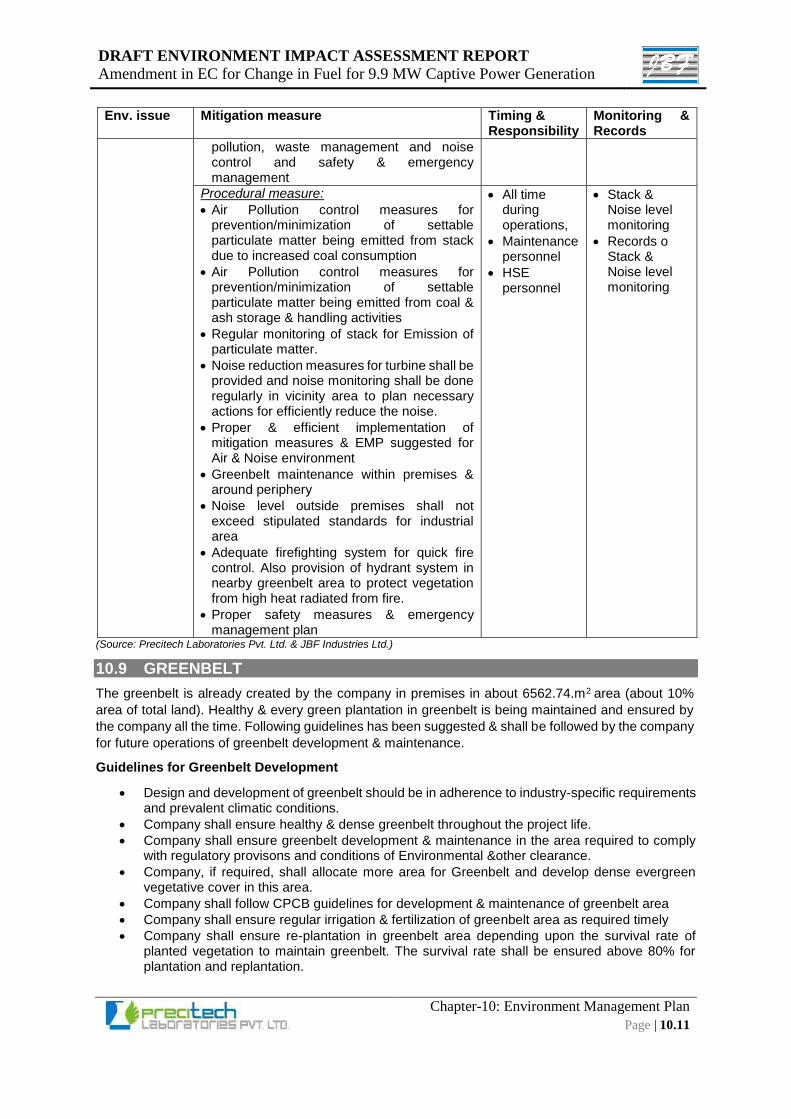
DRAFT ENVIRONMENT IMPACT ASSESSMENT REPORT
Amendment in EC for Change in Fuel for 9.9 MW Captive Power Generation
Chapter-10: Environment Management Plan
Page | 10.11
Env. issue Mitigation measure Timing & Responsibility
Monitoring & Records
pollution, waste management and noise control and safety & emergency management
Procedural measure:
Air Pollution control measures for prevention/minimization of settable particulate matter being emitted from stack due to increased coal consumption
Air Pollution control measures for prevention/minimization of settable particulate matter being emitted from coal & ash storage & handling activities
Regular monitoring of stack for Emission of particulate matter.
Noise reduction measures for turbine shall be provided and noise monitoring shall be done regularly in vicinity area to plan necessary actions for efficiently reduce the noise.
Proper & efficient implementation of mitigation measures & EMP suggested for Air & Noise environment
Greenbelt maintenance within premises & around periphery
Noise level outside premises shall not exceed stipulated standards for industrial area
Adequate firefighting system for quick fire control. Also provision of hydrant system in nearby greenbelt area to protect vegetation from high heat radiated from fire.
Proper safety measures & emergency management plan
All time during operations,
Maintenance personnel
HSE personnel
Stack & Noise level monitoring
Records o Stack & Noise level monitoring
(Source: Precitech Laboratories Pvt. Ltd. & JBF Industries Ltd.)
10.9 GREENBELT
The greenbelt is already created by the company in premises in about 6562.74.m2 area (about 10%
area of total land). Healthy & every green plantation in greenbelt is being maintained and ensured by
the company all the time. Following guidelines has been suggested & shall be followed by the company
for future operations of greenbelt development & maintenance.
Guidelines for Greenbelt Development
Design and development of greenbelt should be in adherence to industry-specific requirements and prevalent climatic conditions.
Company shall ensure healthy & dense greenbelt throughout the project life.
Company shall ensure greenbelt development & maintenance in the area required to comply with regulatory provisons and conditions of Environmental &other clearance.
Company, if required, shall allocate more area for Greenbelt and develop dense evergreen vegetative cover in this area.
Company shall follow CPCB guidelines for development & maintenance of greenbelt area
Company shall ensure regular irrigation & fertilization of greenbelt area as required timely
Company shall ensure re-plantation in greenbelt area depending upon the survival rate of planted vegetation to maintain greenbelt. The survival rate shall be ensured above 80% for plantation and replantation.
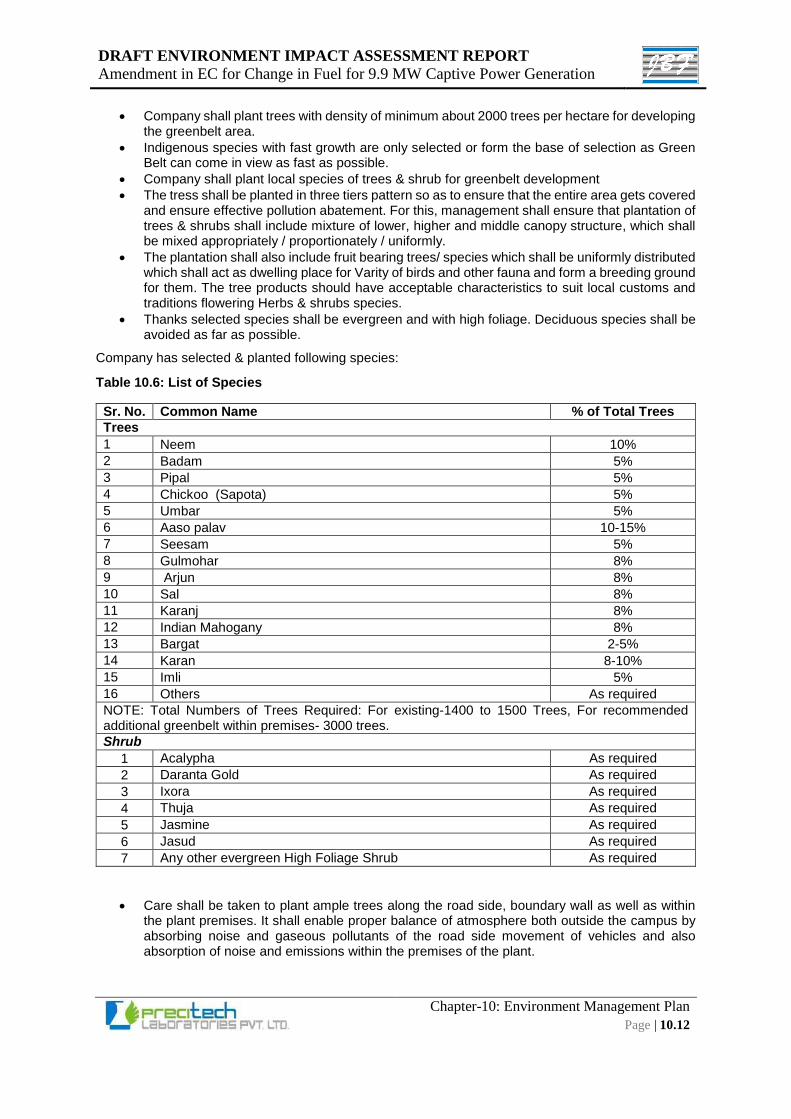
DRAFT ENVIRONMENT IMPACT ASSESSMENT REPORT
Amendment in EC for Change in Fuel for 9.9 MW Captive Power Generation
Chapter-10: Environment Management Plan
Page | 10.12
Company shall plant trees with density of minimum about 2000 trees per hectare for developing the greenbelt area.
Indigenous species with fast growth are only selected or form the base of selection as Green Belt can come in view as fast as possible.
Company shall plant local species of trees & shrub for greenbelt development
The tress shall be planted in three tiers pattern so as to ensure that the entire area gets covered and ensure effective pollution abatement. For this, management shall ensure that plantation of trees & shrubs shall include mixture of lower, higher and middle canopy structure, which shall be mixed appropriately / proportionately / uniformly.
The plantation shall also include fruit bearing trees/ species which shall be uniformly distributed which shall act as dwelling place for Varity of birds and other fauna and form a breeding ground for them. The tree products should have acceptable characteristics to suit local customs and traditions flowering Herbs & shrubs species.
Thanks selected species shall be evergreen and with high foliage. Deciduous species shall be avoided as far as possible.
Company has selected & planted following species:
Table 10.6: List of Species
Sr. No. Common Name % of Total Trees
Trees
1 Neem 10%
2 Badam 5%
3 Pipal 5%
4 Chickoo (Sapota) 5%
5 Umbar 5%
6 Aaso palav 10-15%
7 Seesam 5%
8 Gulmohar 8%
9 Arjun 8%
10 Sal 8%
11 Karanj 8%
12 Indian Mahogany 8%
13 Bargat 2-5%
14 Karan 8-10%
15 Imli 5%
16 Others As required
NOTE: Total Numbers of Trees Required: For existing-1400 to 1500 Trees, For recommended additional greenbelt within premises- 3000 trees.
Shrub
1 Acalypha As required
2 Daranta Gold As required
3 Ixora As required
4 Thuja As required
5 Jasmine As required
6 Jasud As required
7 Any other evergreen High Foliage Shrub As required
Care shall be taken to plant ample trees along the road side, boundary wall as well as within the plant premises. It shall enable proper balance of atmosphere both outside the campus by absorbing noise and gaseous pollutants of the road side movement of vehicles and also absorption of noise and emissions within the premises of the plant.
DRAFT ENVIRONMENT IMPACT ASSESSMENT REPORT
Amendment in EC for Change in Fuel for 9.9 MW Captive Power Generation
Chapter-10: Environment Management Plan
Page | 10.13
Company shall follow the following five year comprehensive greenbelt development program after that the company shall keep following the prevailing practices of greenbelt management.
1st Year Plan
Company shall provide all necessary facilities for irrigation of greenbelt in good condition and necessary maintenance of irrigation facilities shall be done regularly.
If required company shall develop one in-house nursery and saplings storage area within its premises.
Company shall also analyse the internal landuse of existing & proposed unit for allocation of additional 20% greenbelt within premises. While planning this, company shall also focus on plantation in boundary area with maximum possible width.
Company shall regularly assess survival rate of planted trees & shrub and if required necessary re-plantation shall be done to ensure healthy & dense greenbelt area in its premises..
For plantation and re-plantation, if required, company shall acquire saplings from local private/government (Forest & Other) nursery
Company shall do fertilization as required for healthy & dense greenbelt development.
Company shall also execute greenbelt development and plantation in forest and non-forest area outside it's premises in consultation with forest Department and other local authority as per the plan described below.
2nd to 5th Year Plan
Company shall maintain all necessary facilities for irrigation of greenbelt in good condition and necessary maintenance of irrigation facilities shall be done regularly
Company shall regularly assess survival rate of planted trees & shrub and if required necessary re-plantation shall be done to ensure healthy & dense greenbelt area in within premises.
Company shall ensure survival rate above 80% to ensure adequate greenbelt and canopy cover in 35% of its total area at any time.
For re-plantation, if required, company shall acquire saplings from local private/government (Forest & Other) nursery
Company shall do fertilization as required for healthy & dense greenbelt development
Plan for Forest Development
The company is situated in Sarigam Region which exhibits some degraded "Scrub Type" forest with canopy cover less than 10%. Hence it is recommended that Company shall play active role in development of the forest area in consultation with local forest Department.
The degraded forest area is mostly covered by Deciduous Trees and seasonal Shrub and other vegetation. So company shall plan to select evergreen flora species for the plantation in this forest area.
If required, professional with high qualifications and experience shall be hired to develop the dense forest in the area.
In addition to this, company shall also contact local panchayat for plantation in local rural area beside of the forest area.
Also the company shall make efforts to provide all necessary facilities for plantation and irrigation of area allotted by forest dept. for plantation.
Company shall hire contractual labour for this work and shall ensure good condition of the plantation made in forest area.
Necessary maintenance of irrigation facilities shall be done regularly to ensure uninterrupted irrigation required for the plantation area.
Company shall regularly assess survival rate of planted trees & shrub and if required necessary re-plantation shall be done to ensure healthy & dense area having canopy cover more than 40% after five year.
For plantation & re-plantation, company shall acquire saplings from local government (Forest & Other) nursery.
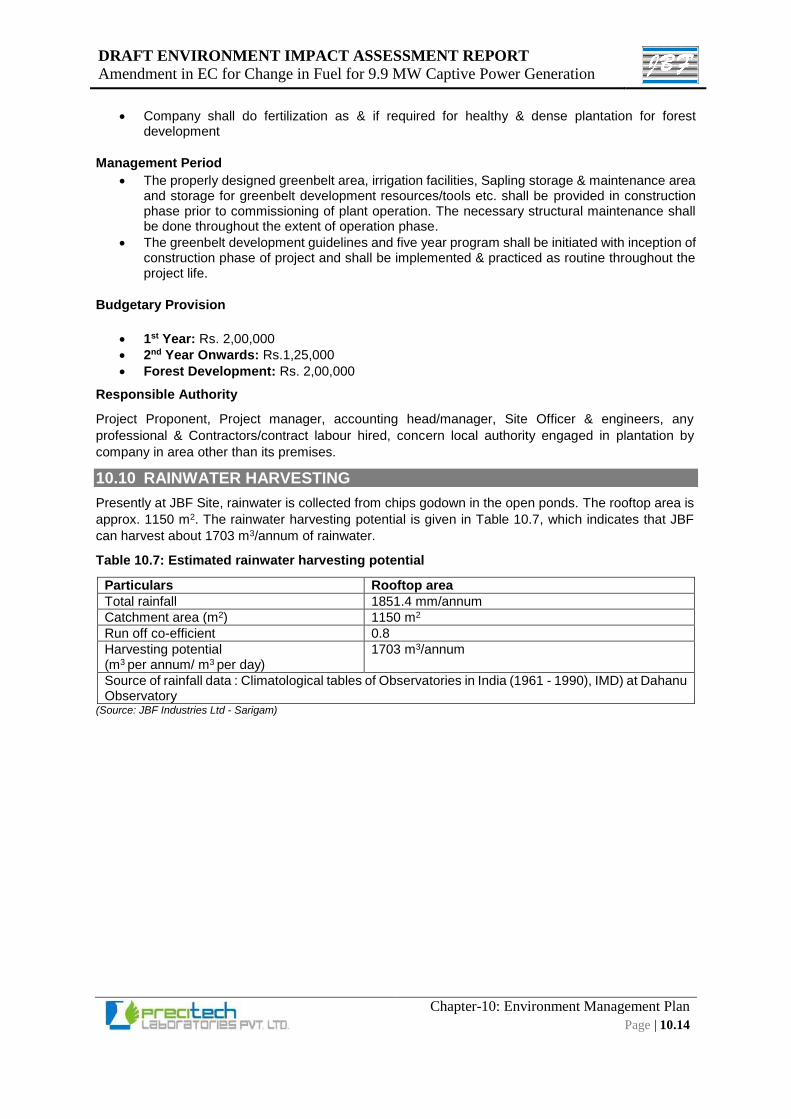
DRAFT ENVIRONMENT IMPACT ASSESSMENT REPORT
Amendment in EC for Change in Fuel for 9.9 MW Captive Power Generation
Chapter-10: Environment Management Plan
Page | 10.14
Company shall do fertilization as & if required for healthy & dense plantation for forest development
Management Period
The properly designed greenbelt area, irrigation facilities, Sapling storage & maintenance area and storage for greenbelt development resources/tools etc. shall be provided in construction phase prior to commissioning of plant operation. The necessary structural maintenance shall be done throughout the extent of operation phase.
The greenbelt development guidelines and five year program shall be initiated with inception of construction phase of project and shall be implemented & practiced as routine throughout the project life.
Budgetary Provision
1st Year: Rs. 2,00,000
2nd Year Onwards: Rs.1,25,000
Forest Development: Rs. 2,00,000
Responsible Authority
Project Proponent, Project manager, accounting head/manager, Site Officer & engineers, any
professional & Contractors/contract labour hired, concern local authority engaged in plantation by
company in area other than its premises.
10.10 RAINWATER HARVESTING
Presently at JBF Site, rainwater is collected from chips godown in the open ponds. The rooftop area is
approx. 1150 m2. The rainwater harvesting potential is given in Table 10.7, which indicates that JBF
can harvest about 1703 m3/annum of rainwater.
Table 10.7: Estimated rainwater harvesting potential
Particulars Rooftop area
Total rainfall 1851.4 mm/annum
Catchment area (m2) 1150 m2
Run off co-efficient 0.8
Harvesting potential (m3 per annum/ m3 per day)
1703 m3/annum
Source of rainfall data : Climatological tables of Observatories in India (1961 - 1990), IMD) at Dahanu Observatory
(Source: JBF Industries Ltd - Sarigam)
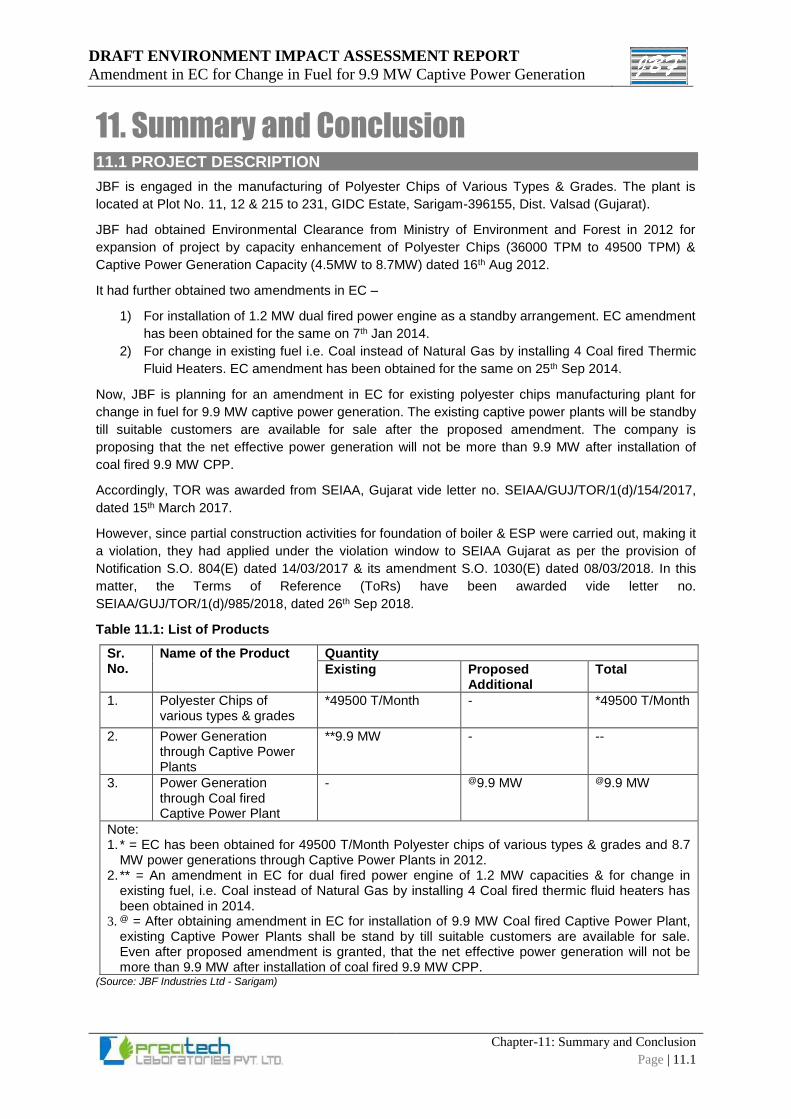
DRAFT ENVIRONMENT IMPACT ASSESSMENT REPORT
Amendment in EC for Change in Fuel for 9.9 MW Captive Power Generation
Chapter-11: Summary and Conclusion
Page | 11.1
11. Summary and Conclusion 11.1 PROJECT DESCRIPTION
JBF is engaged in the manufacturing of Polyester Chips of Various Types & Grades. The plant is
located at Plot No. 11, 12 & 215 to 231, GIDC Estate, Sarigam-396155, Dist. Valsad (Gujarat).
JBF had obtained Environmental Clearance from Ministry of Environment and Forest in 2012 for
expansion of project by capacity enhancement of Polyester Chips (36000 TPM to 49500 TPM) &
Captive Power Generation Capacity (4.5MW to 8.7MW) dated 16th Aug 2012.
It had further obtained two amendments in EC –
1) For installation of 1.2 MW dual fired power engine as a standby arrangement. EC amendment
has been obtained for the same on 7th Jan 2014.
2) For change in existing fuel i.e. Coal instead of Natural Gas by installing 4 Coal fired Thermic
Fluid Heaters. EC amendment has been obtained for the same on 25th Sep 2014.
Now, JBF is planning for an amendment in EC for existing polyester chips manufacturing plant for
change in fuel for 9.9 MW captive power generation. The existing captive power plants will be standby
till suitable customers are available for sale after the proposed amendment. The company is
proposing that the net effective power generation will not be more than 9.9 MW after installation of
coal fired 9.9 MW CPP.
Accordingly, TOR was awarded from SEIAA, Gujarat vide letter no. SEIAA/GUJ/TOR/1(d)/154/2017,
dated 15th March 2017.
However, since partial construction activities for foundation of boiler & ESP were carried out, making it
a violation, they had applied under the violation window to SEIAA Gujarat as per the provision of
Notification S.O. 804(E) dated 14/03/2017 & its amendment S.O. 1030(E) dated 08/03/2018. In this
matter, the Terms of Reference (ToRs) have been awarded vide letter no.
SEIAA/GUJ/TOR/1(d)/985/2018, dated 26th Sep 2018.
Table 11.1: List of Products
Sr. No.
Name of the Product Quantity
Existing Proposed Additional
Total
1. Polyester Chips of various types & grades
*49500 T/Month - *49500 T/Month
2. Power Generation through Captive Power Plants
**9.9 MW - --
3. Power Generation through Coal fired Captive Power Plant
- @9.9 MW @9.9 MW
Note: 1. * = EC has been obtained for 49500 T/Month Polyester chips of various types & grades and 8.7
MW power generations through Captive Power Plants in 2012. 2. ** = An amendment in EC for dual fired power engine of 1.2 MW capacities & for change in
existing fuel, i.e. Coal instead of Natural Gas by installing 4 Coal fired thermic fluid heaters has been obtained in 2014.
3. @ = After obtaining amendment in EC for installation of 9.9 MW Coal fired Captive Power Plant, existing Captive Power Plants shall be stand by till suitable customers are available for sale. Even after proposed amendment is granted, that the net effective power generation will not be more than 9.9 MW after installation of coal fired 9.9 MW CPP.
(Source: JBF Industries Ltd - Sarigam)
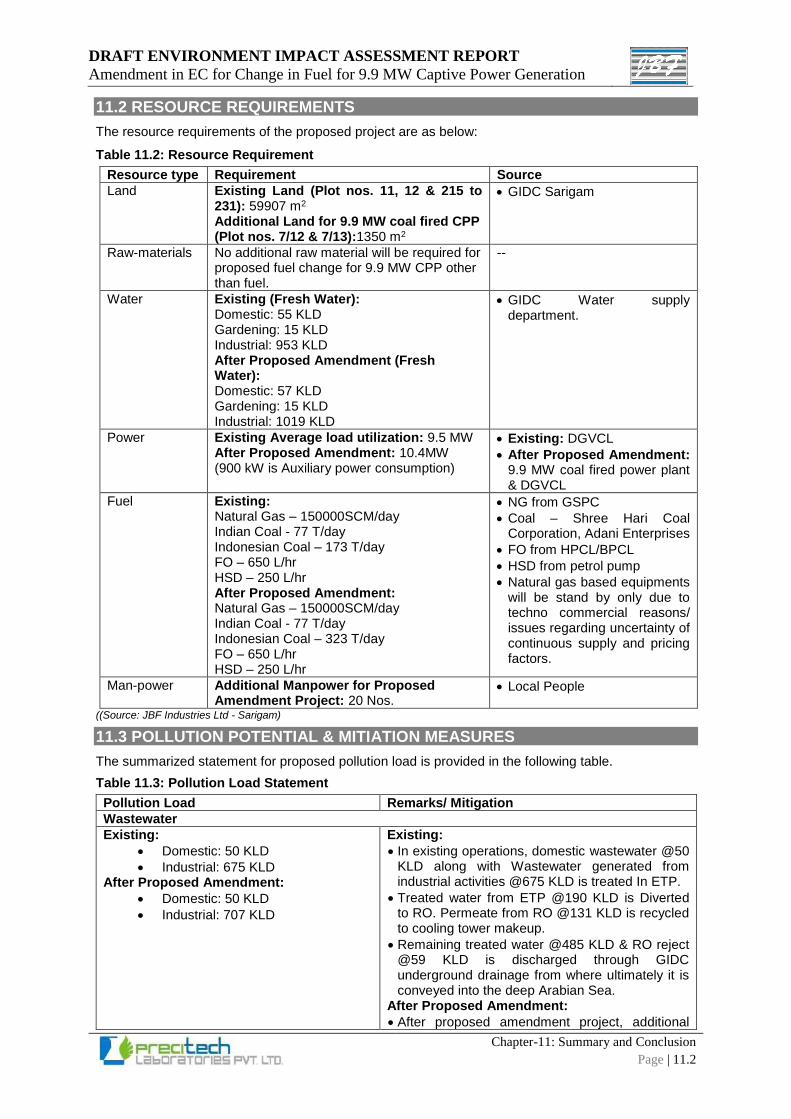
DRAFT ENVIRONMENT IMPACT ASSESSMENT REPORT
Amendment in EC for Change in Fuel for 9.9 MW Captive Power Generation
Chapter-11: Summary and Conclusion
Page | 11.2
11.2 RESOURCE REQUIREMENTS
The resource requirements of the proposed project are as below:
Table 11.2: Resource Requirement
Resource type Requirement Source
Land Existing Land (Plot nos. 11, 12 & 215 to 231): 59907 m2 Additional Land for 9.9 MW coal fired CPP (Plot nos. 7/12 & 7/13):1350 m2
• GIDC Sarigam
Raw-materials
No additional raw material will be required for proposed fuel change for 9.9 MW CPP other than fuel.
--
Water Existing (Fresh Water): Domestic: 55 KLD Gardening: 15 KLD Industrial: 953 KLD After Proposed Amendment (Fresh Water): Domestic: 57 KLD Gardening: 15 KLD Industrial: 1019 KLD
• GIDC Water supply department.
Power Existing Average load utilization: 9.5 MW After Proposed Amendment: 10.4MW (900 kW is Auxiliary power consumption)
• Existing: DGVCL
• After Proposed Amendment: 9.9 MW coal fired power plant & DGVCL
Fuel Existing: Natural Gas – 150000SCM/day Indian Coal - 77 T/day Indonesian Coal – 173 T/day FO – 650 L/hr HSD – 250 L/hr After Proposed Amendment: Natural Gas – 150000SCM/day Indian Coal - 77 T/day Indonesian Coal – 323 T/day FO – 650 L/hr HSD – 250 L/hr
• NG from GSPC
• Coal – Shree Hari Coal Corporation, Adani Enterprises
• FO from HPCL/BPCL
• HSD from petrol pump
• Natural gas based equipments will be stand by only due to techno commercial reasons/ issues regarding uncertainty of continuous supply and pricing factors.
Man-power Additional Manpower for Proposed Amendment Project: 20 Nos.
• Local People
((Source: JBF Industries Ltd - Sarigam)
11.3 POLLUTION POTENTIAL & MITIATION MEASURES
The summarized statement for proposed pollution load is provided in the following table.
Table 11.3: Pollution Load Statement
Pollution Load Remarks/ Mitigation
Wastewater
Existing:
• Domestic: 50 KLD
• Industrial: 675 KLD After Proposed Amendment:
• Domestic: 50 KLD
• Industrial: 707 KLD
Existing:
• In existing operations, domestic wastewater @50 KLD along with Wastewater generated from industrial activities @675 KLD is treated In ETP.
• Treated water from ETP @190 KLD is Diverted to RO. Permeate from RO @131 KLD is recycled to cooling tower makeup.
• Remaining treated water @485 KLD & RO reject @59 KLD is discharged through GIDC underground drainage from where ultimately it is conveyed into the deep Arabian Sea.
After Proposed Amendment:
• After proposed amendment project, additional
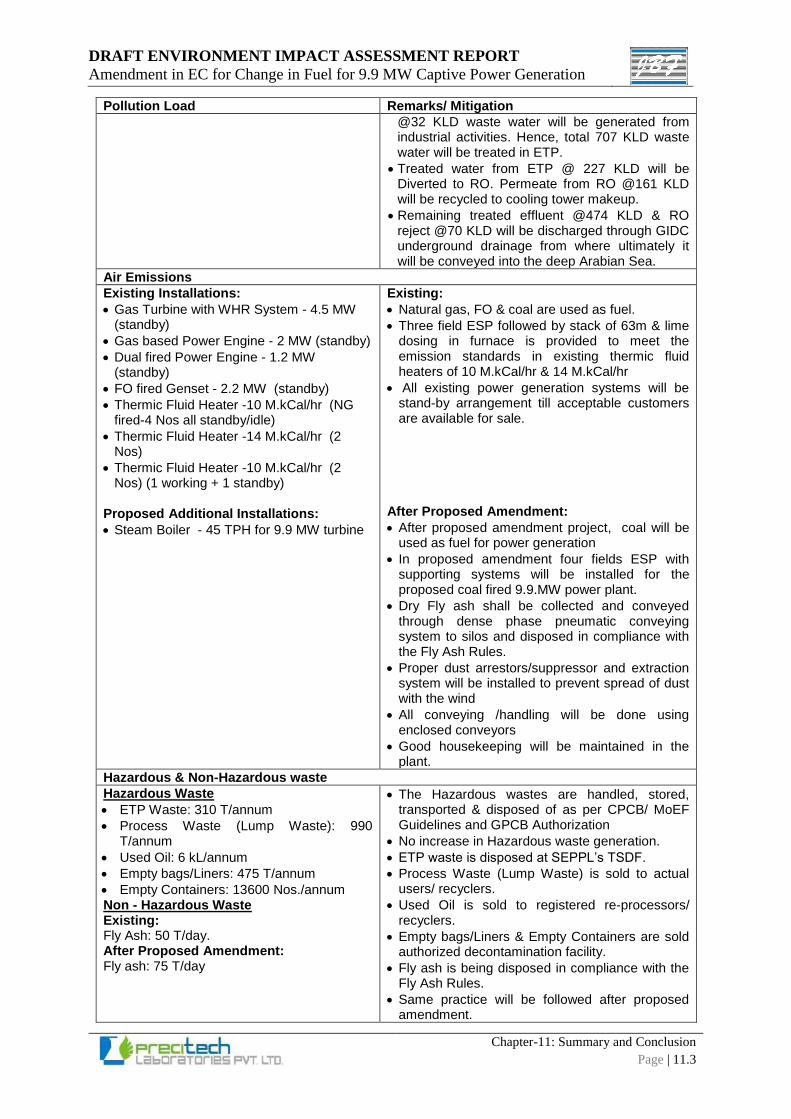
DRAFT ENVIRONMENT IMPACT ASSESSMENT REPORT
Amendment in EC for Change in Fuel for 9.9 MW Captive Power Generation
Chapter-11: Summary and Conclusion
Page | 11.3
Pollution Load Remarks/ Mitigation
@32 KLD waste water will be generated from industrial activities. Hence, total 707 KLD waste water will be treated in ETP.
• Treated water from ETP @ 227 KLD will be Diverted to RO. Permeate from RO @161 KLD will be recycled to cooling tower makeup.
• Remaining treated effluent @474 KLD & RO reject @70 KLD will be discharged through GIDC underground drainage from where ultimately it will be conveyed into the deep Arabian Sea.
Air Emissions
Existing Installations:
• Gas Turbine with WHR System - 4.5 MW (standby)
• Gas based Power Engine - 2 MW (standby)
• Dual fired Power Engine - 1.2 MW (standby)
• FO fired Genset - 2.2 MW (standby)
• Thermic Fluid Heater -10 M.kCal/hr (NG fired-4 Nos all standby/idle)
• Thermic Fluid Heater -14 M.kCal/hr (2 Nos)
• Thermic Fluid Heater -10 M.kCal/hr (2 Nos) (1 working + 1 standby)
Proposed Additional Installations:
• Steam Boiler - 45 TPH for 9.9 MW turbine
Existing:
• Natural gas, FO & coal are used as fuel.
• Three field ESP followed by stack of 63m & lime dosing in furnace is provided to meet the emission standards in existing thermic fluid heaters of 10 M.kCal/hr & 14 M.kCal/hr
• All existing power generation systems will be stand-by arrangement till acceptable customers are available for sale.
After Proposed Amendment:
• After proposed amendment project, coal will be used as fuel for power generation
• In proposed amendment four fields ESP with supporting systems will be installed for the proposed coal fired 9.9.MW power plant.
• Dry Fly ash shall be collected and conveyed through dense phase pneumatic conveying system to silos and disposed in compliance with the Fly Ash Rules.
• Proper dust arrestors/suppressor and extraction system will be installed to prevent spread of dust with the wind
• All conveying /handling will be done using enclosed conveyors
• Good housekeeping will be maintained in the plant.
Hazardous & Non-Hazardous waste
Hazardous Waste
• ETP Waste: 310 T/annum
• Process Waste (Lump Waste): 990 T/annum
• Used Oil: 6 kL/annum
• Empty bags/Liners: 475 T/annum
• Empty Containers: 13600 Nos./annum Non - Hazardous Waste Existing: Fly Ash: 50 T/day. After Proposed Amendment: Fly ash: 75 T/day
• The Hazardous wastes are handled, stored, transported & disposed of as per CPCB/ MoEF Guidelines and GPCB Authorization
• No increase in Hazardous waste generation.
• ETP waste is disposed at SEPPL’s TSDF.
• Process Waste (Lump Waste) is sold to actual users/ recyclers.
• Used Oil is sold to registered re-processors/ recyclers.
• Empty bags/Liners & Empty Containers are sold authorized decontamination facility.
• Fly ash is being disposed in compliance with the Fly Ash Rules.
• Same practice will be followed after proposed amendment.
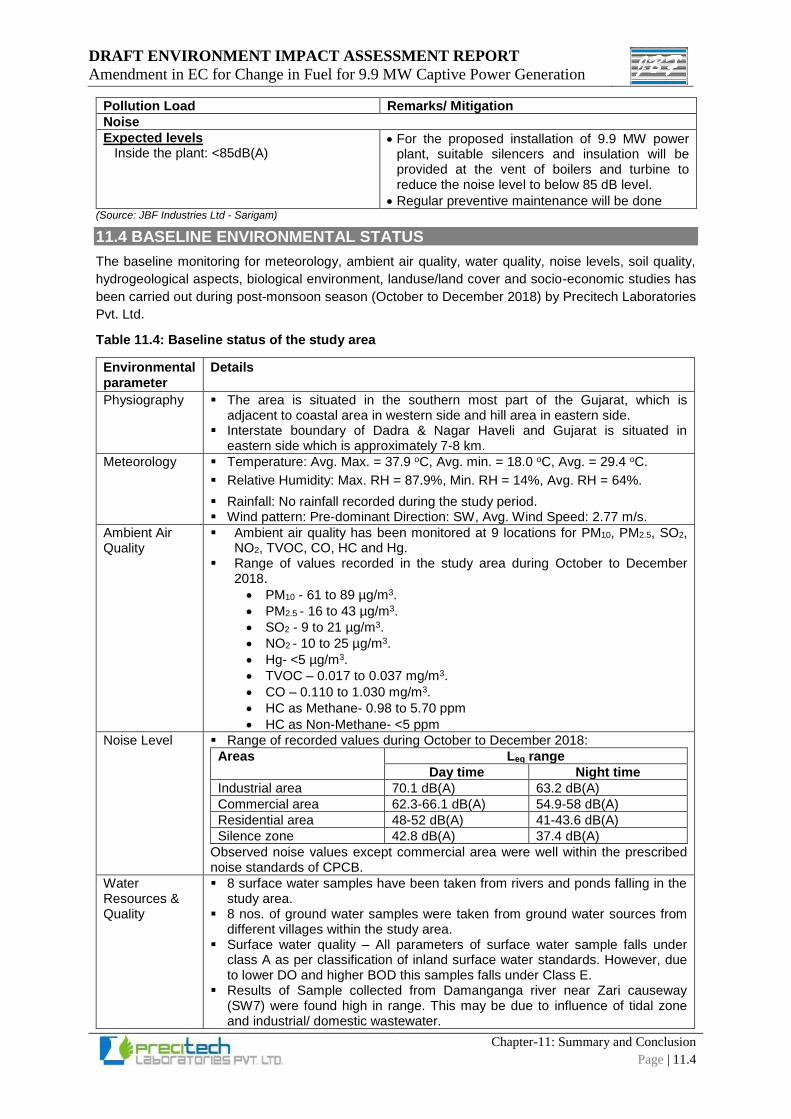
DRAFT ENVIRONMENT IMPACT ASSESSMENT REPORT
Amendment in EC for Change in Fuel for 9.9 MW Captive Power Generation
Chapter-11: Summary and Conclusion
Page | 11.4
Pollution Load Remarks/ Mitigation
Noise
Expected levels Inside the plant: <85dB(A)
• For the proposed installation of 9.9 MW power plant, suitable silencers and insulation will be provided at the vent of boilers and turbine to reduce the noise level to below 85 dB level.
• Regular preventive maintenance will be done (Source: JBF Industries Ltd - Sarigam)
11.4 BASELINE ENVIRONMENTAL STATUS
The baseline monitoring for meteorology, ambient air quality, water quality, noise levels, soil quality,
hydrogeological aspects, biological environment, landuse/land cover and socio-economic studies has
been carried out during post-monsoon season (October to December 2018) by Precitech Laboratories
Pvt. Ltd.
Table 11.4: Baseline status of the study area
Environmental parameter
Details
Physiography ▪ The area is situated in the southern most part of the Gujarat, which is adjacent to coastal area in western side and hill area in eastern side.
▪ Interstate boundary of Dadra & Nagar Haveli and Gujarat is situated in eastern side which is approximately 7-8 km.
Meteorology ▪ Temperature: Avg. Max. = 37.9 oC, Avg. min. = 18.0 oC, Avg. = 29.4 oC.
▪ Relative Humidity: Max. RH = 87.9%, Min. RH = 14%, Avg. RH = 64%.
▪ Rainfall: No rainfall recorded during the study period. ▪ Wind pattern: Pre-dominant Direction: SW, Avg. Wind Speed: 2.77 m/s.
Ambient Air Quality
▪ Ambient air quality has been monitored at 9 locations for PM10, PM2.5, SO2, NO2, TVOC, CO, HC and Hg.
▪ Range of values recorded in the study area during October to December 2018.
• PM10 - 61 to 89 µg/m3.
• PM2.5 - 16 to 43 µg/m3.
• SO2 - 9 to 21 µg/m3.
• NO2 - 10 to 25 µg/m3.
• Hg- <5 µg/m3.
• TVOC – 0.017 to 0.037 mg/m3.
• CO – 0.110 to 1.030 mg/m3.
• HC as Methane- 0.98 to 5.70 ppm
• HC as Non-Methane- <5 ppm
Noise Level ▪ Range of recorded values during October to December 2018:
Areas Leq range
Day time Night time
Industrial area 70.1 dB(A) 63.2 dB(A)
Commercial area 62.3-66.1 dB(A) 54.9-58 dB(A)
Residential area 48-52 dB(A) 41-43.6 dB(A)
Silence zone 42.8 dB(A) 37.4 dB(A)
Observed noise values except commercial area were well within the prescribed noise standards of CPCB.
Water Resources & Quality
▪ 8 surface water samples have been taken from rivers and ponds falling in the study area.
▪ 8 nos. of ground water samples were taken from ground water sources from different villages within the study area.
▪ Surface water quality – All parameters of surface water sample falls under class A as per classification of inland surface water standards. However, due to lower DO and higher BOD this samples falls under Class E.
▪ Results of Sample collected from Damanganga river near Zari causeway (SW7) were found high in range. This may be due to influence of tidal zone and industrial/ domestic wastewater.
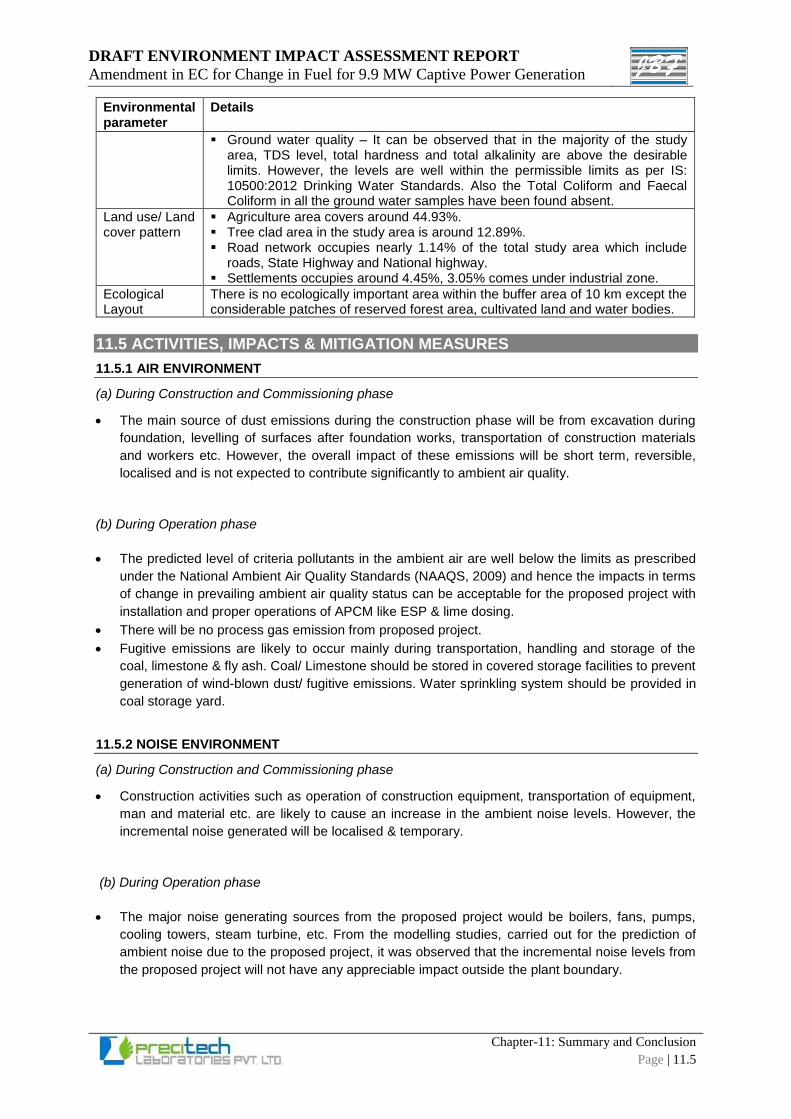
DRAFT ENVIRONMENT IMPACT ASSESSMENT REPORT
Amendment in EC for Change in Fuel for 9.9 MW Captive Power Generation
Chapter-11: Summary and Conclusion
Page | 11.5
Environmental parameter
Details
▪ Ground water quality – It can be observed that in the majority of the study area, TDS level, total hardness and total alkalinity are above the desirable limits. However, the levels are well within the permissible limits as per IS: 10500:2012 Drinking Water Standards. Also the Total Coliform and Faecal Coliform in all the ground water samples have been found absent.
Land use/ Land cover pattern
▪ Agriculture area covers around 44.93%. ▪ Tree clad area in the study area is around 12.89%. ▪ Road network occupies nearly 1.14% of the total study area which include
roads, State Highway and National highway. ▪ Settlements occupies around 4.45%, 3.05% comes under industrial zone.
Ecological Layout
There is no ecologically important area within the buffer area of 10 km except the considerable patches of reserved forest area, cultivated land and water bodies.
11.5 ACTIVITIES, IMPACTS & MITIGATION MEASURES
11.5.1 AIR ENVIRONMENT
(a) During Construction and Commissioning phase
• The main source of dust emissions during the construction phase will be from excavation during
foundation, levelling of surfaces after foundation works, transportation of construction materials
and workers etc. However, the overall impact of these emissions will be short term, reversible,
localised and is not expected to contribute significantly to ambient air quality.
(b) During Operation phase
• The predicted level of criteria pollutants in the ambient air are well below the limits as prescribed
under the National Ambient Air Quality Standards (NAAQS, 2009) and hence the impacts in terms
of change in prevailing ambient air quality status can be acceptable for the proposed project with
installation and proper operations of APCM like ESP & lime dosing.
• There will be no process gas emission from proposed project.
• Fugitive emissions are likely to occur mainly during transportation, handling and storage of the
coal, limestone & fly ash. Coal/ Limestone should be stored in covered storage facilities to prevent
generation of wind-blown dust/ fugitive emissions. Water sprinkling system should be provided in
coal storage yard.
11.5.2 NOISE ENVIRONMENT
(a) During Construction and Commissioning phase
• Construction activities such as operation of construction equipment, transportation of equipment,
man and material etc. are likely to cause an increase in the ambient noise levels. However, the
incremental noise generated will be localised & temporary.
(b) During Operation phase
• The major noise generating sources from the proposed project would be boilers, fans, pumps,
cooling towers, steam turbine, etc. From the modelling studies, carried out for the prediction of
ambient noise due to the proposed project, it was observed that the incremental noise levels from
the proposed project will not have any appreciable impact outside the plant boundary.
DRAFT ENVIRONMENT IMPACT ASSESSMENT REPORT
Amendment in EC for Change in Fuel for 9.9 MW Captive Power Generation
Chapter-11: Summary and Conclusion
Page | 11.6
11.5.3 WATER ENVIONMENT
(a) During Construction and Commissioning phase
• Water requirement during construction phase will be met through the existing water supply
resources of GIDC water supply department. The total water required will be well within the
sanctioned drawl capacity by GIDC water supply department.
• There will be no impact on ground water level as groundwater will not be abstracted.
• The domestic wastewater i.e. sewage generated will be treated in existing ETP discharge through
into GIDC underground drainage.
• Hence, there is no impact envisaged on water resources and on water environment during the
construction phase.
(b) During Operation phase
• The impact on water quantity will be negligible as the source of water is GIDC water supply dept.
• In existing operations, the fresh water requirement is @1023 KLD which will increase to @1091
KLD after proposed amendment project.
• In existing operations, total wastewater generation is @725 KLD bifurcated as @50 KLD as
domestic waste water, @675 KLD as industrial waste water to ETP.
• After proposed project, additional 32 KLD industrial wastewater will be generate, which will be
treated in existing ETP followed by RO. The quantity of recycling effluent from RO will be
increased@30 KLD. There will be no additional wastewater discharge into GIDC underground
drainage. The total discharge into the GIDC underground drainage will be @544 KLD as per
existing permitted quantity.
• Existing ETP is adequate to cater the treatment for proposed industrial waste water generation
quantity.
• Improper storage of Coal & fly ash can either result in contamination of surface water if coal/ ash
particles are washed off with storm water during monsoon or in contamination of ground water
due to leaching in soil. Hence, it is suggested that closed storage area should be provided for coal
with impervious bottom and leachate collection line (connected with ETP) and Fly ash should be
stored in Silos.
• Thus, looking to the overall scenario no significant impact on the water environment is envisaged
with proper implementation of suggested measures.
11.5.4 LAND ENVIRONMENT
(a) During Construction and Commissioning phase
• The proposed project is to be established at land designated for industrial purpose. Hence, there
will be no change in the land use/land cover in the study area after the establishment of the
proposed project.
(b) During Operation phase
• Impacts on soil quality can occur due to the particulate emission from transportation, handling &
storage of coal and ash as well as improper disposal of fly ash (non-hazardous waste). To
prevent these impacts, all necessary mitigation measures suggested for control of emission of
particulates from boiler as well as coal & ash handling operations are provided
• In furtherance to these, the impacts on landuse-vegetation/plantation area can occur due to
settling of particulates emitted from project on leaves of plants & tree of the area, hence, for
control of particulate emissions, efficient functioning of control measures should be ensured
• Thus, the impacts are likely to be insignificant with implementation of adequate control measures.
DRAFT ENVIRONMENT IMPACT ASSESSMENT REPORT
Amendment in EC for Change in Fuel for 9.9 MW Captive Power Generation
Chapter-11: Summary and Conclusion
Page | 11.7
11.5.5 SOCIO-ECONOMIC ENVIONMENT
(a) During Construction and Commissioning phase
• The local residents will be employed contractually as per their skill and aptitude.
• All the necessary health and sanitation facilities will be provided at the construction site.
• The social impacts during construction phase are likely to create direct and indirect employment
including business opportunities for the local people, which will improve their economic conditions
and quality of life.
(b) During Operation phase
• The project site is well connected with the National highway and there will be no requirement of
additional infrastructures.
• Impacts on social environment are likely to occur mainly due to dust emission from
transportation/storage, handling of coal/ ash, emission from utility-boiler. To prevent impacts
occurred from particulate/ dust emission, all necessary mitigation measures suggested for control
of emission of particulates from boiler as well as coal & ash handling operations should be
provided.
• All necessary mitigation measures suggested for noise control should be provided to reduce the
impacts of noise generation due to CPP operations.
• Existing road network is adequate to cater additional traffic load due to proposed project.
• All safety measures and required essential plans should be provided & implemented for safety,
disaster & emergency action, as mentioned in RA Report for proposed project.
• Approximately 20 nos. of people are expected to benefit from direct employment for the project.
• Social development program should be conducted as the part of CER activities.
• Minor beneficial impacts on employment & contract services are likely due to increase potential of
indirect employment in transportation activities for coal & ash
• Thus, the impacts on socio-economic environment would not be major, if suggested EMP is
implemented.
11.5.6 ECOLOGICAL ENVIRONMENT
(a) During Construction and Commissioning phase
• The proposed projects will be established on open land as well as plot adjacent to existing site,
having negligible vegetation cover. Hence, no tree cutting activities will be involved.
• Minor impacts on local flora and fauna are anticipated due to air emissions and noise generated
during construction activities. However, these impacts would be short-term, localised and would
be restricted within project site.
(b) During Operation phase
• To ensure there will be no major impacts on ecology, proponent should provide all other
mitigation measures as suggested for prevention of pollution of air, water, land/ soil and noise.
• Appropriate air pollution control systems with online monitoring system should be installed to
meet the emission standards stipulated for PM, SO2 and NOx by State Pollution Control Board.
• Coal & ash particle can get washed off from storage area with storm water during rainy days
which may get mixed in to the nearby river, which can adversely affect the aquatic ecology.
Hence, it is suggested to provide closed storage area for storage of coal & silo for fly ash.
• Since, the high noise generation from turbine can impact the local faunal species, it is suggested
to provide the effective noise control & noise attenuation measures.
• Contribution should be made to ecological welfare & forest development activities conducted by
Govt. Organization, NGOs and other such organizations.
DRAFT ENVIRONMENT IMPACT ASSESSMENT REPORT
Amendment in EC for Change in Fuel for 9.9 MW Captive Power Generation
Chapter-11: Summary and Conclusion
Page | 11.8
• Regular monitoring of Valued Environmental Components as per Environmental Monitoring
Programs designed for the project should be carried out.
11.6 POST PROJECT MONITORING PLAN
As a part of EIA study, a post-project monitoring plan has been prepared and necessary suggestion &
guidelines for post project monitoring are provided therein. The capital cost for proposed project will
be Rs. 42 crores. The Capex for implementation of Environmental Management Systems will be Rs.
4.8 crores and Opex for environment protection & continual improvement will be Rs. 3.3 crores/
annum.
Post project monitoring plan covers sampling & analysis of water, air, emission, wastewater, noise,
hazardous wastes. The environmental compliance report should be prepared and submitted as per
the regulatory guidelines.
11.7 ADDITIONAL STUDIES
The Risk Assessment study involving consequence analysis related to fire/ toxic dispersion due to
storage/ handling of fuel and raw material has been carried out. Accordingly, a Disaster Management
Plan has been prepared. The suggestions cited in RA report should be implemented for fire &
explosion hazard prevention, emergency management, other potential occupational health hazard
prevention, safety gear etc. A safety & environment management cell has been designated to
manage the responsibilities delineated in the EMP.
The proposed project will be established on the existing site as well as additional land within the
GIDC, which is in possession of JBF. Hence, there will not be any resettlement & rehabilitation due to
the proposed project. Therefore, R&R study has not been conducted for the proposed project.
Public consultation is applicable to the proposed project as per the TOR granted by SEIAA Gujarat.
Hence, Environment Public hearing will be conducted as per the schedule of state pollution control
board and necessary action to address the issues raised in Environment Public hearing will be
initiated after public hearing.
11.8 ECOLOGICAL DAMAGE ASSESSMENT & REMEDIATION PLAN
The partial construction activities for foundation of boiler & ESP has been carried out. The impacts
due the activity is marginal & localized.
As per as per indicative guideline provide in TOR, the calculated amount of remediation plan and
natural and community resource augmentation plan worked out to be Rs. 14,24,644 for a year.
CER cost for the proposed project as per MoEF&CC’s O.M. No. F No 22-65/2017-IA-III dated
01/05/2018, is Rs.42 Lakhs which is 1% of the total cost of the project Rs. 42 Cr.
As per recommendation by the SEAC and finalization by the regulatory authority, the bank guarantee
will be submitted to GPCB equivalent to the amount of remediation plan and natural & community
resource augmentation plan or equivalent to CER amount, whichever is higher. As the CER cost is
higher than amount of remediation plan and natural & community resource augmentation plan, the
amount of bank guarantee will be Rs. 42 Lakhs.
11.9 PROJECT BENEFITS
Approximately 20 nos. of people are expected to benefit from direct employment for the project.
Benefits to contract services is also expected due to increase potential of indirect employment in
transportation activities for coal & ash. Thus, the potential of employment will be beneficial to the local
people in long term with routine human resource management plan of the company.
The company will have to spend Rs. 84 lakhs (double the applicable amount) for the next five years
for corporate environmental responcibility as per the awarded TORs. The CER activities planned by
the company will be considerably beneficial for the health, education, community developement,
DRAFT ENVIRONMENT IMPACT ASSESSMENT REPORT
Amendment in EC for Change in Fuel for 9.9 MW Captive Power Generation
Chapter-11: Summary and Conclusion
Page | 11.9
socialwelfare etc. These all together with the economic benefits of the proposed project will result in
further benefits in terms of the literacy level, primary and middle level education and on health
facilities.
11.10 ENVIRONMENT MANAGEMENT PLAN
Environmental Management Plan has been formulated as a part of the EIA study. The major issues of
predicted impacts of proposed expansion project have been considered for delineation of necessary
action plan. The EMP has been formulated considering all necessary mitigation measures to prevent/
minimize/ eliminate the environmental impacts as well as to delineate implementation schedule and
responsibilities. Necessary action plans for ecological conservation & welfare, social upliftment by
CER, greenbelt development, energy efficiency & conservation and resources conservation through
“Cleaner Production Activities” have been covered in the EMP prepared for the proposed project.
11.11 CONCLUSION
As evaluated and shown at Chapter 4, the cumulative value of significance of the project, in terms of
the impacts on the environment, without mitigation measures and with mitigation measures works out
to be, (-) 35.55 and (-) 8.20 respectively, which indicates that with the implementation of the mitigation
measures, the negative impacts of the project can be reduced significantly and brought down to
acceptable levels.
The proponent of the project has agreed to proceed in line with the EIA agency’s comments and
suggestions to mitigate the adverse impacts to the most techno-economically viable extent
DRAFT ENVIRONMENT IMPACT ASSESSMENT REPORT
Amendment in EC for Change in Fuel for 9.9 MW Captive Power Generation
Chapter-12: The EIA Team
Page | 12.1
12. The EIA Team 12.1 EIA CONSULTANT ORGANIZATION
M/s. Precitech Laboratories Pvt. Ltd. is a firm engaged in the field of environmental engineering,
testing/monitoring & consultancy services since 1991. Rooted at Vapi, it has its branches in Ankleshwar,
Rajkot, Kutch and Ahmedabad.
Precitech Laboratories Pvt. Ltd. holds the following recognitions:
Recognized Environmental Laboratory under EPA Act – 1986 by MoEF.
Accredited Laboratory from NABL
An ISO 9001: 2008 certified Laboratory.
Recognized Environmental Auditors (Schedule-II) with the GPCB.
Certification by BS OHSAS 18001-2007
Accredited EIA Consultant Organization from QCI, NABET (Figure 11.1).
Moreover, the entire team of M/s. JBF Industries Ltd., Sarigam has contributed to the current project
and extended their kind courtesy by way of sharing their data relevant to the project. Precitech
Laboratories Pvt. Ltd. is thankful for their inputs & support through the current study.
12.2 PROJECT TEAM FOR EIA STUDY
The Precitech team consists of qualified & experienced personnel in the fields of Environment
Engineering, Mechanical Engineering, Chemical Engineering, Environmental Science, Geology,
Microbiology, Botany and Chemistry.
Moreover, Precitech Laboratories Pvt. Ltd. also has the privilege of being associated with various
technical experts in various fields and utilizing their services as and when required.
The project team for the present study is listed in Table 12.1.
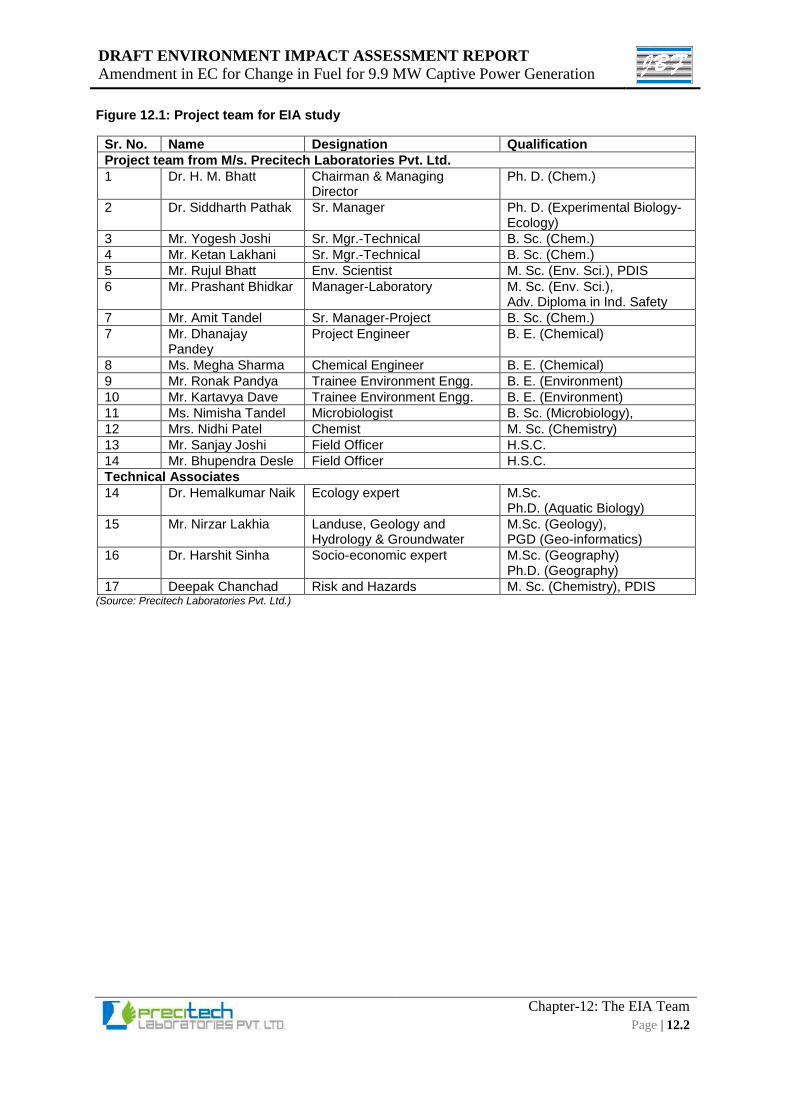
DRAFT ENVIRONMENT IMPACT ASSESSMENT REPORT
Amendment in EC for Change in Fuel for 9.9 MW Captive Power Generation
Chapter-12: The EIA Team
Page | 12.2
Figure 12.1: Project team for EIA study
Sr. No. Name Designation Qualification
Project team from M/s. Precitech Laboratories Pvt. Ltd.
1 Dr. H. M. Bhatt Chairman & Managing Director
Ph. D. (Chem.)
2 Dr. Siddharth Pathak Sr. Manager Ph. D. (Experimental Biology-Ecology)
3 Mr. Yogesh Joshi Sr. Mgr.-Technical B. Sc. (Chem.)
4 Mr. Ketan Lakhani Sr. Mgr.-Technical B. Sc. (Chem.)
5 Mr. Rujul Bhatt Env. Scientist M. Sc. (Env. Sci.), PDIS
6 Mr. Prashant Bhidkar Manager-Laboratory M. Sc. (Env. Sci.), Adv. Diploma in Ind. Safety
7 Mr. Amit Tandel Sr. Manager-Project B. Sc. (Chem.)
7 Mr. Dhanajay Pandey
Project Engineer B. E. (Chemical)
8 Ms. Megha Sharma Chemical Engineer B. E. (Chemical)
9 Mr. Ronak Pandya Trainee Environment Engg. B. E. (Environment)
10 Mr. Kartavya Dave Trainee Environment Engg. B. E. (Environment)
11 Ms. Nimisha Tandel Microbiologist B. Sc. (Microbiology),
12 Mrs. Nidhi Patel Chemist M. Sc. (Chemistry)
13 Mr. Sanjay Joshi Field Officer H.S.C.
14 Mr. Bhupendra Desle Field Officer H.S.C.
Technical Associates
14 Dr. Hemalkumar Naik
Ecology expert M.Sc. Ph.D. (Aquatic Biology)
15 Mr. Nirzar Lakhia Landuse, Geology and Hydrology & Groundwater
M.Sc. (Geology), PGD (Geo-informatics)
16 Dr. Harshit Sinha Socio-economic expert M.Sc. (Geography) Ph.D. (Geography)
17 Deepak Chanchad Risk and Hazards M. Sc. (Chemistry), PDIS (Source: Precitech Laboratories Pvt. Ltd.)
Annexure