Embed Size (px)
Citation preview

Earnings Release 2Q18
1
GP Investments Earnings Release
Fourth Quarter 2020
GP Investments
2
2020 highlights
March 31, 2021 – This release reports the 4Q20 and full-year results of GP Investments, Ltd. (‘GP’) [B3: GPIV33], a leader in private equity and alternative investments.
2020 was a challenging year worldwide; and for GP Investments this was no different. At the beginning of the Covid-19 pandemic, most of the companies in GP’s portfolio that have physical premises had to close facilities or operate under restrictions. Brick-and-mortar stores had to be closed, restaurants had to depend mostly on delivery and take-out, and many businesses had to be reinvented fast.
In March, GP moved 100% of its team members, across all its offices, to remote working, following procedures in its Business Continuity Plan. The transition to a work-at-home model was seamless, with no interruptions in our activities, and we have continued to leverage multiple digital technologies to enable our teamwork.
The results reported by GP Investments in 2020 reflected the volatility of the financial markets, and the economic impacts of the pandemic. In the 4th quarter of 2020, GP posted net income of USD 33.8 million, which was driven by increases in the share prices of our listed companies – primarily Centauro – as well as the positive impact of the temporary BRL appreciation. Nevertheless, for the full year, mark-to-market adjustments in the companies in the portfolio have translated into significant net unrealized losses, which together with the rapid devaluation of the Brazilian Real have led to a total net loss of USD (91.8) million in 2020. Despite the difficulties created by the pandemic, GP has been able to offer extensive support to the management teams leading our portfolio companies, while at the same time leveraging its resources to pursue new investments and take advantage of opportunities created by market dislocations and
accelerated digitalization across industries. Highlights of the year include:
1. On June 5, 2020, Centauro raised BRL 900 million in a follow-on offering, priced at BRL 30.00 per share. The
company used the proceeds mainly in the acquisitions of (i) the Brazilian operations of Nike, and (ii) NWB (Network
Brasil) – a sports content producer that owns the sports-related YouTube channels Desimpedidos and Acelerados,
among other operations.
2. Expanding our portfolio of tech-enabled businesses, GP concluded, in the first quarter, an investment in Blu, a
Brazilian fintech focused on reducing transaction costs between retailers and suppliers. In the second quarter, GP
invested in sim;paul, a brokerage platform that is redesigning the way the financial market relates to the customer.
In the third quarter, a new investment was made in CERC, a company that provides the underlying infrastructure of
credit financial markets. Recently, in the first quarter of 2021, the investment in Mercado Bitcoin was made – the
company is the largest digital assets platform in Latin America.
3. In September, an organizational restructuring was announced: GP Investments and Spice PE contributed their high-
growth assets to create G2D Investments, Ltd (‘G2D’), a vehicle that will target primarily minority investments in
tech-enabled companies that have developed disruptive technologies and operate in large addressable markets, led
by outstanding management teams, and with clear competitive advantages. G2D is exploring an initial public
offering (“IPO”) and has submitted preliminary documents to the Brazilian Securities and Exchange Commission.
About GP Investments
GP Investments is a leading private equity and alternative investments firm. Since its founding in 1993, it has raised
USD 5 billion from investors worldwide, completed investments in more than 50 companies, and executed over 25 equity
capital market transactions.
GP Investments has a consistent and disciplined investment strategy targeting established companies that have the
potential to grow and to be more efficient and profitable by becoming leaders in their industries. Since 2006, the Class A
shares of GP Investments have traded in the form of Brazilian Depositary Receipts (BDRs) on the Brazilian Stock Exchange
(B3 S.A. – Brasil, Bolsa, Balcão), under the ticker GPIV33, and on the Luxembourg Stock Exchange. The firm currently has
offices in São Paulo, New York, London and Bermuda. For more information, please see www.gp-investments.com

GP Investments
3
GP Investments – Portfolio Overview
GP Investments has a diversified portfolio of companies held directly or indirectly through affiliated vehicles that
are managed by GP and have significant influence on their investee companies. Each investment vehicle focuses on
specific strategies, mainly differentiated by company size, geography, and sectors.
Spice Private Equity Ltd (‘Spice PE’) is an investment company focused on global private equity investments. GP
Investments became the controlling shareholder of Spice PE, listed on the SIX Swiss Exchange (SPCE), , using
proprietary capital as part of its strategy of pursuing a portfolio of companies with global leadership ambitions.
4Q20 update
At the end of 4Q20 Spice PE reported Net Asset Value of USD 136.8 million, up 18.1% when compared to 3Q20, and its
balance sheet comprised: cash & cash equivalents (19% of total NAV); direct investments (74%); and the Legacy Portfolio
(7%). Its balance sheet is debt-free. The increase in NAV mainly reflects the appreciation of the shares of Rimini Street,
which is listed on NASDAQ, in the quarter and the FMV reassessments made in private companies.
In July 2020, GP Investments and Spice PE created G2D Investments, Ltd (‘G2D’), a new investment vehicle focused
on companies that have developed disruptive technologies. G2D will primarily target minority investments in tech
enabled companies operating in large addressable markets, led by outstanding management teams, and with clear
competitive advantages.
G2D was born with a geographically diversified portfolio and with platforms that allow it to pursue new investment
opportunities in companies headquartered in Europe, the United States and Brazil. As of December/20, G2D
Investments’ portfolio comprised: Blu, The Craftory, Expanding Capital, Quero Educação, CERC and sim;paul.

GP Investments
4
The Publicly Listed Portfolio – Performance
GP’s portfolio of publicly listed companies this quarter had a positive contribution of USD 13.8 million (excluding the FX impact) resulting in a fair market value (“FMV”) within GP’s 4Q20 results as shown in the quarter below:
LTM Share Performance (in local currency¹)
Base: Dec. 2019 = 100.
1. BR Properties (BRPR3) and Centauro (CNTO3) are priced in Brazilian Reais, while Rimini Street (RMNI) is priced in U.S. Dollars.
1. BR Properties (BRPR3) and Centauro (CNTO3) are priced in Brazilian Reais, while Rimini Street (RMNI) is priced in U.S. Dollars.
81
66
113
50
60
70
80
90
100
110
120
130
140
150
Dec-19 Feb-20 Apr-20 Jun-20 Aug-20 Oct-20 Dec-20
Centauro BRPR Rimini Street

GP Investments
5
GP Investments portfolio: Centauro
Date of investment November 2012
Investment vehicle GPCP V
Industry Sporting Goods Retail
Asset liquidity Publicly traded
Centauro (B3: CNTO3) is Latin America’s largest retailer of sporting goods. Founded in April 1981 in Belo Horizonte,
Minas Gerais, Brazil, it now operates nearly 200 stores across 22 of Brazil’s 27 states. The stores are designed as
‘temples for sports’, aiming to offer customers not only products but an outstanding experience in sports shopping.
Centauro focuses on making technology an increasingly important element in this experience. The backbone of
this technological strategy is supported by wholly integrated on-line and off-line sales and support operations.
4Q20 update
The company’s performance improved in 4Q20 driven by its digital strategy. In 2020, same-store sales (‘SSS’) were
down 28.6% from 2019. E-commerce sales alone, on the SSS basis, were up 74.5% from 2019. Sales through the
App were 48% of the digital platform sales in 2020.
In September, Centauro signed a contract with NWB (Network Brasil) – a sports content producer that owns the
sports-related YouTube channels Desimpedidos and Acelerados, among others. Since it started operating in 2013,
NWB has had more than 10 billion views, and currently has the largest audience base in the sports entertainment
market in Brazil. The acquisition was approved by the Brazilian antitrust authority, CADE, and the closing has
already taken place.
In November, CADE also approved the Nike transaction. Nike’s Brazilian operating company was renamed Fisia
and is now a wholly owned subsidiary of Centauro’s parent company, Grupo SBF. The partnership agreement
establishes Fisia as: (i) the exclusive distributor of Nike products in Brazil, and the operator of its e-commerce, until
2030; and (ii) the Nike Store Partner, authorized to open and operate further Nike stores in Brazil for an initial
period of 5 years.

GP Investments
6
GP Investments portfolio: BR Properties
Date of investment June 2016
Investment vehicle GPCP VI
Industry Commercial real estate
Asset liquidity Publicly traded
BR Properties (B3: BRPR3) is one of Brazil’s leading commercial real estate investment companies. It operates in
acquisition, rental, management, development and sale of commercial real estate, primarily in the high-end
segment, including offices and warehouses (both logistics and industrial) in Brazil’s main metropolitan areas.
4Q20 update
BR Properties (‘BRPR’) is continuously working on improving its occupancy rates, operational efficiency, and capital
structure.
In 2020, net revenues were BRL 313.6 million, 11% higher on a same-properties basis than in 2019. Same-properties
Ebitda was BRL 227.9 million, 19% higher than in 2019, with Ebitda margin of 73%. Physical vacancy at the end of
January 2021 was 19.9%.
Due to the optimization of its capital structure over recent years, BRPR reduced financial expenses by 83% from
2019 to 2020. As a result FFO in 2020, at BRL 189.4 million, was 234% higher than in 2019. FFO margin was 60%,
the highest in the company’s history.
Finally, BRPR set a new dividend policy: payment of the greater of (a) the minimum mandatory dividend (25% of
Net profit) and (b) 50% of FFO, in quarterly payments – making it a consistent dividends payer.

GP Investments
7
GP Investments and Spice Private Equity portfolio: Rimini Street
Rimini Street (Nasdaq: RMNI) is a global provider of enterprise software products and services. It is the leading
third-party provider of support for Oracle and SAP software products, and a Salesforce partner. The company
offers premium, ultra-responsive and integrated application management and support services targeting Oracle
and SAP enterprise software users, thus providing this segment with support and services at a price point that
allows such clients to save significant costs, free up resources for innovation, and achieve better business results.
4Q20 update
The company continued successfully executing its strategic growth plan, reporting 2020 net revenues of USD 327
million, an increase of 16% compared to 2019, and record new sales, and backlog. It also strengthened its balance
sheet, generating USD 42 million in operational cash flow in the year, a 105% improvement from 2019.
The 4Q20 and 2020 results show strong growth in all key operational and financial metrics, consistently beating
analysts’ estimates. In addition, Rimini Street completed partial repayment of USD 10 million of its Series A
preferred stock, at a 10% discount, with a waiver of the make-whole clause. These factors were reflected in the
stock performance – the share price increased by 37.6% in 4Q20, from USD 3.22 to USD 4.43 and continued to
appreciate in the early months of 2021, ending February at USD 7.77 at the end of February.
Date of investment October 2017
Investment vehicles GP, Spice PE & GPIAC
Industry Enterprise software support
Asset liquidity Publicly traded

GP Investments
8
Spice Private Equity portfolio: LEON
Founded in 2005 and based in the UK, LEON is a food chain offering healthy fast food. The founders set out to prove that it is possible to serve fast food that both tastes good and is good for you – “Natural Fast Food”. The menu is inspired by the flavors, variety, and the natural healthy goodness of Mediterranean cooking, offered at reasonable prices.
4Q20 update
Despite the severely negative impacts of the Covid-19 pandemic, LEON has been able to adapt its operations and
respond to multiple challenges.
In the UK, delivery and grocery sales have continued to drive revenues while in store dining remains limited by
government restrictions With the recent progress in the rate of vaccinations, we expect LEON restaurants soon to
be able to benefit from increased foot traffic.
In the grocery channel, LEON continues to expand its product line, and to test new distribution and marketing
campaigns.
In the USA, given the severe limitations caused by Covid-19 the US subsidiary has decided to make a Chapter 7
bankruptcy filing and to liquidate its operations.
Date of investment August 2017
Investment vehicle Spice Private Equity
Industry Restaurants
Asset liquidity Privately held

GP Investments
9
Spice Private Equity portfolio: Bravo Brio
Date of investment May 2018
Investment vehicle Spice Private Equity
Industry Restaurants
Asset liquidity Privately held
Bravo Brio (formerly FoodFirst Global Restaurants) is the owner and operator of two distinct Italian restaurant
brands in the upscale affordable dining segment: Bravo Fresh Italian and Brio Italian Mediterranean. The company
aims to be the best upscale affordable Italian restaurant company in the United States, with a focus on providing
guests with an excellent dining experience through consistent execution of food quality and service.
4Q20 update
With Covid-19 profoundly impacting the restaurant industry, same-store sales continue to be compressed vs 2019
given the reduced foot traffic. However, as vaccinations are starting to gain pace in the US, several states are lifting
dine in restrictions and Bravo Brio is showing signs of recovery. It has also improved its delivery strategy and
successfully supported the launch of virtual brands in partnership with influencers and celebrities.
Since the Chapter 11 case dismissal in August, management has made significant progress rebuilding processes
across the system marketing, technology, and operations. Additionally, the launch of virtual brands has provided
additional revenue streams for each restaurant. The new management team has also restructured labor costs, in
an ongoing effort to capture synergies and increase service quality.

GP Investments
10
G2D Investments portfolio: Blu
Blu. Connecting Retail to Industry
Date of investment March 2020
Investment vehicle Proprietary
Industry Fintech
Asset liquidity Privately held
Blu is a fintech business that offers innovative financial solutions for independent merchants and suppliers in
selected segments such as mattresses, furniture, eyewear and fashion. Its digital platform provides simple and
advantageous solutions that help retailers grow their businesses and reduce transaction costs, while enabling the
companies in these industries to sell more while reducing the risk of default. Today, more than 12,000 shops and
2,000 suppliers are connected through Blu’s marketplace.
4Q20 update
Blu is innovating constantly in its function of providing financial solutions to merchants and suppliers in selected
verticals, such as mattresses, furniture and other products.
In 2020 it developed several new products for its B2B marketplace, such as Blu À Vista, Boleto Blu and CRM Blu
Venda+, providing new payment options, payment splits, credit offerings and CRM services, increasing the value
proposition of its platform to customers. In 2020, it also consolidated its positioning in new verticals, such as
eyewear, sporting goods and fashion.
Blu performed well during the Covid-19 crisis, nearly doubling its active customer base and posting very strong TPV
(total payment volume) growth when compared to 2019, despite the impact of the pandemic on physical retail
operations.

GP Investments
11
G2D Investments portfolio: The Craftory
Date of investment May 2018
Investment vehicle Spice Private Equity
Industry Investment platform
Asset liquidity Privately held
The Craftory is an independent investment holding company with approximately USD 375 million of actively
directed capital that is deployed in up to 10 of the world’s boldest competitive brands within the fast-moving
consumer goods space. The company focuses on Europe and the U.S., seeking high-growth consumer brands with
annual revenues of at least USD 10 million. The goal is to boost sales using scalable operations, effective storytelling
and digital marketing strategies. The Craftory is led by entrepreneurs and brand experts who are seeking targets that
have truly disruptive business models, where they can leverage their experience and expertise to help catapult growth.
4Q20 update The Craftory’s investments
The companies in The Craftory’s portfolio
continue to grow at a rapid pace, based on their
Direct-to-Consumer distribution models, digital
strategy and righteous causes. The team at the
Craftory remains actively engaged with their
investees, helping them adapt their processes,
strengthen their teams and evolve their strategy.

GP Investments
12
G2D Investments portfolio (continued)
In addition to Blu and The Craftory, G2D has a foundational portfolio of unique tech-enabled businesses and
platforms. A brief description of these high-potential companies in its portfolio is shown in the table below:
Expanding Capital is a venture capital firm based in San Francisco, California,
that typically invests in series C+ rounds. GP Investments provided seed
capital to Expanding Capital to start operations in late 2016.
Quero Educação operates an online marketplace that connects students with
schools in Brazil. Its marketplace allows students to find information about
courses and schools where they want to study, compare college programs and
options, learn about tuitions and scholarships, and enroll and apply for
graduation. The investment in Quero Educação was made in the third quarter
of 2020.
sim;paul is redesigning the way the financial market relates to the customer
and intends to operate offering a more personalized advisory through IFAs
(Independent Financial Advisors). The investment in sim;paul was made in the
second quarter of 2020.
CERC provides the underlying infrastructure of credit financial markets,
offering services of validation, registry and clearing of receivables. Its goal is to
increase security and efficiency in the use of receivables for credit
transactions. The investment in CERC was made in the third quarter of 2020.
Mercado Bitcoin is the largest digital asset platform in Latin America, in which
users can buy and sell cryptocurrencies and other digital assets, such as
tokens that represent real assets. The investment in Mercado Bitcoin was
made in the first quarter of 2021.

GP Investments
13
Results
GP Investments presents its results excluding non-controlling interests from its private equity and real estate activities and segregates its results into:
• Fund Management, which includes the fees received by GP Investments as the general partner in its private equity and real estate funds and its ownership as the controlling shareholder of GP Advisors – and
• Capital Results, which includes the participation of GP Investments as an investor in the funds it manages and other directly held investments.
In addition, Spice Private Equity’s financial accounts are consolidated within GP’s balance sheet. The proportional balance sheet consolidates 100% of Spice PE’s individual accounts within GP’s financials and the minority interests are excluded from the company’s equity.
The figures on the following pages are management figures and, as such, are unaudited.
The complete financial statements, which include all non-controlling interests and are reviewed by our independent auditors, are presented at the end of this release.
These financial statements are in accordance with U.S. GAAP standards and are being released simultaneously in all jurisdictions in which GP Investments has its securities traded. In compliance with requirements of the Brazilian Securities and Exchange Commission (Comissão de Valores Mobiliários) the issuer also releases financial statements in accordance with IFRS standards, which may differ from these financial statements due to the different basis of the accounting standard.
GP Investments
14
Net Asset Value (NAV)
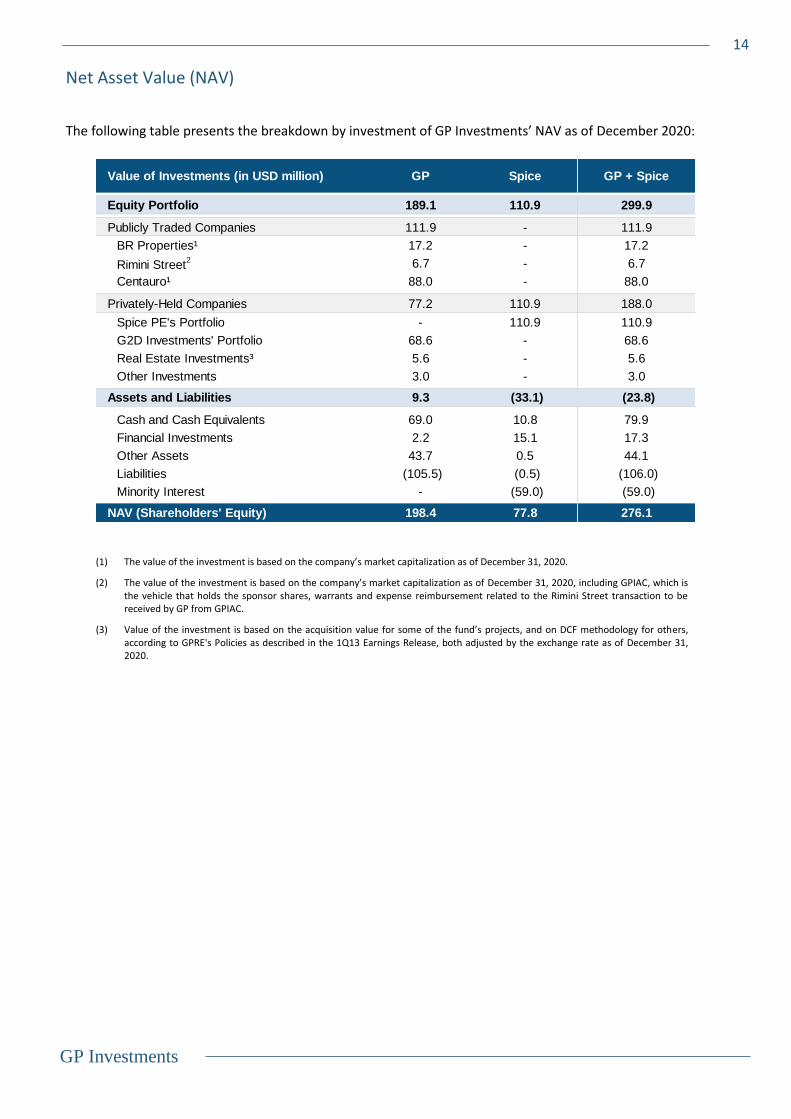
The following table presents the breakdown by investment of GP Investments’ NAV as of December 2020:
(1) The value of the investment is based on the company’s market capitalization as of December 31, 2020.
(2) The value of the investment is based on the company’s market capitalization as of December 31, 2020, including GPIAC, which is the vehicle that holds the sponsor shares, warrants and expense reimbursement related to the Rimini Street transaction to be received by GP from GPIAC.
(3) Value of the investment is based on the acquisition value for some of the fund’s projects, and on DCF methodology for others, according to GPRE's Policies as described in the 1Q13 Earnings Release, both adjusted by the exchange rate as of December 31, 2020.
Value of Investments (in USD million) GP Spice GP + Spice
Equity Portfolio 189.1 110.9 299.9
Publicly Traded Companies 111.9 - 111.9
BR Properties¹ 17.2 - 17.2
Rimini Street2 6.7 - 6.7
Centauro¹ 88.0 - 88.0
Privately-Held Companies 77.2 110.9 188.0
Spice PE's Portfolio - 110.9 110.9
G2D Investments' Portfolio 68.6 - 68.6
Real Estate Investments³ 5.6 - 5.6
Other Investments 3.0 - 3.0
Assets and Liabilities 9.3 (33.1) (23.8)
Cash and Cash Equivalents 69.0 10.8 79.9
Financial Investments 2.2 15.1 17.3
Other Assets 43.7 0.5 44.1
Liabilities (105.5) (0.5) (106.0)
Minority Interest - (59.0) (59.0)
NAV (Shareholders' Equity) 198.4 77.8 276.1
GP Investments
15
NAV Change Breakdown
(USD mm)
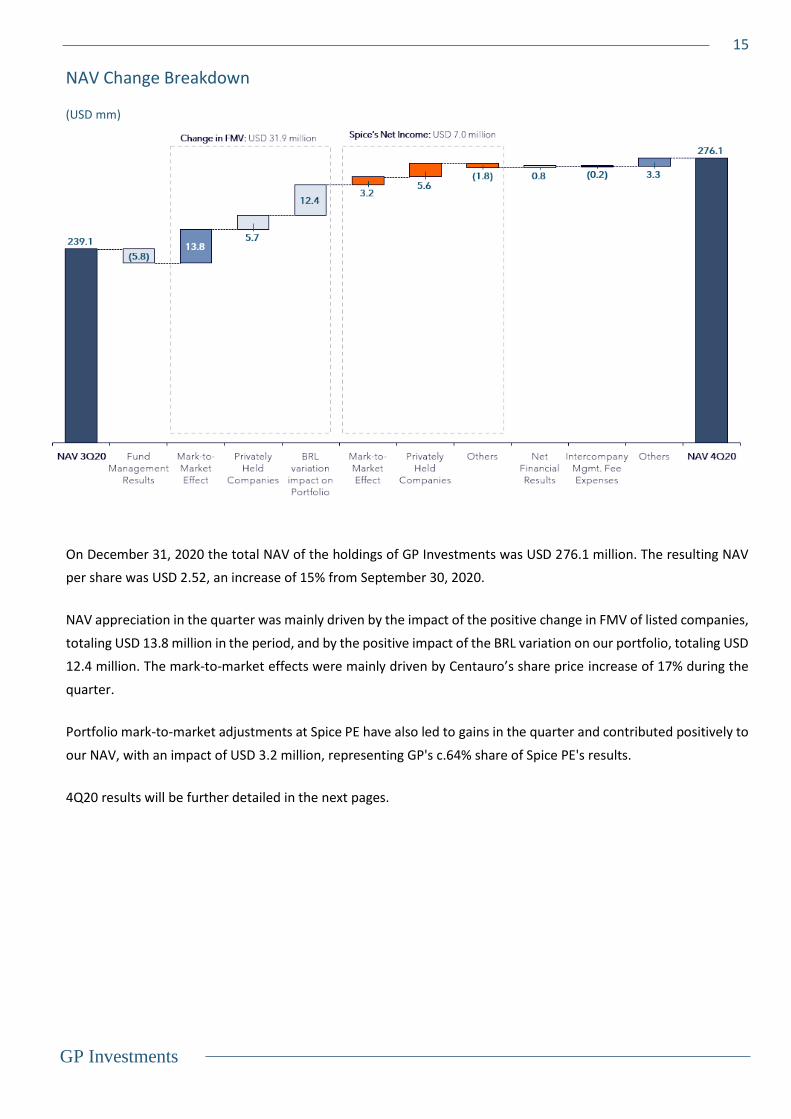
On December 31, 2020 the total NAV of the holdings of GP Investments was USD 276.1 million. The resulting NAV
per share was USD 2.52, an increase of 15% from September 30, 2020.
NAV appreciation in the quarter was mainly driven by the impact of the positive change in FMV of listed companies,
totaling USD 13.8 million in the period, and by the positive impact of the BRL variation on our portfolio, totaling USD
12.4 million. The mark-to-market effects were mainly driven by Centauro’s share price increase of 17% during the
quarter.
Portfolio mark-to-market adjustments at Spice PE have also led to gains in the quarter and contributed positively to
our NAV, with an impact of USD 3.2 million, representing GP's c.64% share of Spice PE's results.
4Q20 results will be further detailed in the next pages.

GP Investments
16
Net Revenues
Fund Management
Management fees, including intercompany management fees, totaled USD 1.8 mm in the fourth quarter of 2020.
Capital Results
The total FMV of our portfolio companies increased by USD 31.9 mm during the quarter, mainly driven by the impact
of the positive change in the FMV of listed companies, totaling USD 13.8 mm and by positive effects of FX change
totaling USD 12.4 mm.
Proportional Change in Fair Market Value
In USD millionBRL
Translation
Chg. In
Valuation
Chg. in FMV
4Q20
Centauro 7.2 10.6 17.8
BR Properties 1.6 1.2 2.8
Rimini Street + GPIAC - 2.0 2.0
Real Estate Investments 0.5 (0.7) (0.2)
G2D 3.0 5.9 8.9
Others (0.0) 0.5 0.5
Total 12.4 19.5 31.9
Revenues per Segment 4Q20 4Q19 2020 2019
In USD million
Fund Management Revenues 1.8 37.6 9.3 50.5
Management fees 1.8 3.3 9.3 14.7
Performance fees - 2.2 - 4.6
Unrealized performance fees - 32.1 - 31.2
Capital Results Revenues 31.9 48.3 (41.8) 94.3
Appreciation / Depreciation in fair value of investments 31.9 52.5 (31.2) 88.7
Net realized gains 0.0 (4.2) (10.7) 1.5
Dividends and others 0.1 - 0.2 4.1
Total Revenues 33.7 85.9 (32.5) 144.8

GP Investments
17
Expenses
During the year, Operating expenses totaled USD (13.2) mm, representing a decrease of 13% year-over-year
compared to USD (15.2) mm in 2019. This decline was a result of GP’s continuous focus on operational efficiency.
The reduction relates to a 29% drop in Personnel expenses, from USD (8.5) mm in 2019 to USD (6.1) mm in 2020 and
a 4% increase in G&A expenses, from USD (6.7) mm in 2019 to USD (7.0) mm in 2020, mainly explained by higher
Project Expenses.
Net Income per Business Segment
Expenses breakdown 4Q20 4Q19 2020 2019
In USD million
Operating expenses (4.2) (4.0) (13.2) (15.2)
General and administrative (2.6) (2.2) (7.0) (6.7)
Payroll (1.5) (1.8) (6.1) (8.5)
Contingencies (1.2) 3.5 (1.5) 2.9
Intercompany management fees (0.2) (0.4) (1.3) (2.3)
Intercompany performance fees - (1.2) - (2.2)
Stock options (0.0) (0.1) (0.2) (0.3)
Total Expenses (ex-Bonus and Unrealized Carried Interest Expenses) (5.6) (2.1) (16.2) (17.1)
Proportional Income Statement per Segment 4Q20 2020
In USD Million Fund Capital Fund Capital
Management Results Total Management Results Total
Management fees 1.8 - 1.8 9.3 - 9.3
Performance fees - - - - - -
Unrealized change in FMV - 31.9 31.9 - (31.2) (31.2)
Net realized gains - 0.0 0.0 - (10.7) (10.7)
Dividends and others - 0.1 0.1 - 0.2 0.2
Unrealized performance fees - - - (31.3) - (31.3)t - -
Net Revenues 1.8 31.9 33.7 (22.0) (41.8) (63.8)t - -
Operating expenses (4.2) - (4.2) (13.2) - (13.2)
General and administrative (2.6) - (2.6) (7.0) - (7.0)
Payroll (1.5) - (1.5) (6.1) - (6.1)
Contingencies (1.2) - (1.2) (1.5) - (1.5)
Bonus (2.1) - (2.1) (3.4) - (3.4)
Unrealized carried interest - - - 33.7 - 33.7t - -
Expenses (7.4) - (7.4) 15.7 - 15.7t - -
Intercompany management fees - (0.2) (0.2) - (1.3) (1.3)
Intercompany performance fees - - - - - -
Stock options - (0.0) (0.0) - (0.2) (0.2)
Financial income / loss net - 0.8 0.8 - (8.7) (8.7)
Financial Income - 3.2 3.2 - (0.0) (0.0)
Financial Expenses - (2.4) (2.4) - (8.8) (8.8)t - -
EBT (5.7) 32.6 26.9 (6.4) (51.9) (58.3)t - -
Income taxes (0.1) - (0.1) (0.2) - (0.2)
Spice's Net Income - 7.0 7.0 - (33.3) (33.3)t - -
Net Income (5.8) 39.6 33.8 (6.6) (85.2) (91.8)

GP Investments
18
Breakdown of Funds
On December 31, 2020, the aggregate value of investments in the six portfolio companies and more than 20 real estate projects totaled more than USD 919.9 mm, and included:
• USD202.8 mm from GPCP V; USD 543.5 mm for GPCP VI; and USD 11.4 mm from GPRE, with:
• USD 646.9 mm from limited partners; and
• USD 110.8 mm from GP Investments;
• USD 86.9 mm from GP Investments’ direct stake in Spice Private Equity at book value;
• USD 68.6 mm from GP Investments’ direct stake in G2D Investments;
• USD 1.8 mm from GP Investments’ direct stake in GPIAC; and
• USD 4.9 mm from GP Investments’ direct stake in Rimini Street.
* The value of the investments represents GP Investments’ direct and indirect stakes in each company within the portfolio.
** Figures include value and ownership of investments in the GPCP V, GPVP VI and GPRE funds.
(1) The value of the investment is based on the company’s market capitalization at December 31, 2020.
(2) The investment in Spice Private Equity is consolidated in the balance sheet of GP Investments.
The valuation shown above is based on its shareholders' equity at December 31, 2020.
(3) Value of the investment is based on the acquisition value for some of the fund’s projects and on DCF methodology for others, according to GPRE’s
policies described in the 1Q13 Earnings Release, both adjusted by the exchange rate at December 31, 2020.
(4) GPIAC is related to GP’s 16.7% stake in the vehicle that holds the sponsor shares, warrants and expenses reimbursement related to the Rimini Street
transaction, to be received by GP from GPIAC.
Portfolio Companies GPCPV GPCPVI GPRE GP's Stake LPs GP Direct Stake
Centauro¹ 202.8 - - 88.0 114.8 -
BR Properties¹ - 543.5 - 17.2 526.2 -
Real Estate Investments3 - - 11.4 5.6 5.8 -
Total Fund Investments 202.8 543.5 11.4 110.8 646.9 -
Spice PE² - - - - - 86.9
G2D Investments - - - - - 68.6
GPIAC4 - - - - - 1.8
Rimini Street¹ - - - - - 4.9
Total Proprietary Investments - - - - - 162.2
Total 202.8 543.5 11.4 110.8 646.9 162.2
Value of Investment* (USD million)
Portfolio Companies Total Co-Investors GPCPV GPCPVI GPREGP Direct
Stake
GP Total
Ownership*
Centauro¹ 22.3% 7.6% 14.7% - - - 6.4%
BR Properties¹ 58.0% - - 58.0% - - 1.8%
Real Estate Investments3 100.0% - - - 100.0% - 47.0%
Fund Investments
Spice PE² 63.5% - - - - 63.5% 63.5%
G2D Investments 75.3% - - - - 75.3% 75.3%
GPIAC4 16.7% - - - - 16.7% 16.7%
Rimini Street¹ 3.3% - - - - 3.3% 3.3%
Proprietary Investments
Ownership** (%) as of December 31, 2020

GP Investments
19
GP Investments: Investor Relations
Rodrigo Boscolo
CFO and Investor Relations Officer
Eduardo Coutinho
Corporate Development and Investor Relations Manager
GP Investments
+55 (11) 3556-5505

GP Investments
20
Proportional Balance Sheet
Proportional Balance Sheet 4Q20 3Q20 2019 4Q20 3Q20 2019
In USD million
Assets Liabilities and shareholders' equity
Current assets 113.5 130.2 183.7 Current liabilities 24.9 25.6 47.3
Cash and cash equivalents 79.9 98.6 64.4 Accounts payable 1.8 1.9 3.5
Financial investments 17.3 17.3 63.1 Taxes payable 0.8 0.8 1.6
Management and performance fees 2.9 0.1 0.1 Payroll accruals and related charges 3.2 1.2 37.6
Deferred costs and prepaid expenses 0.8 0.6 0.8 Accrued interest 1.4 3.3 1.4
Other 12.7 13.6 55.3 Other 15.3 15.1 -
Loans and financings 2.4 3.4 3.3
Non-current liabilities 81.1 79.7 82.4
Perpetual notes 67.5 67.5 69.9
Provision for contigencies 13.6 12.2 12.5
Non-current assets 327.7 256.9 417.3
Investments 305.6 235.5 387.4
Equity Portfolio 299.9 230.4 377.3 Shareholders' equity 335.2 281.7 471.2
Financial investments at fair value through profit and loss 5.7 5.1 10.1 Share capital 0.3 0.3 0.3
Funds held in escrow 1.3 1.2 3.9 Share premium 603.7 603.7 597.7
Receivables from employees and shareholders 6.2 5.7 8.5 Retained earnings / losses (295.8) (302.6) (308.9)
Furniture and equipment 0.6 0.6 0.7 Treasury shares (5.0) (5.0) (1.1)
Receivables from related parties 13.4 13.3 16.0 Other accumulated comprehensive income (27.0) (27.0) (26.7)
Other 0.6 0.5 0.8 Minority Interest 59.0 12.3 209.9
Total assets 441.2 387.0 600.9 Total liabilities and shareholders' equity 441.2 387.0 600.9

GP Investments
21
Proportional Balance Sheet (GP + Spice PE)
Balance Sheet GP Investments Spice PE GP + Spice PE GP Investments Spice PE GP + Spice PE
In USD million
Assets 4Q20 4Q20 4Q20 Liabilities and shareholders' equity 4Q20 4Q20 4Q20
Current assets 87.1 26.4 113.5 Current liabilities 24.5 0.5 24.9
Cash and cash equivalents 69.0 10.8 79.9 Accounts payable 1.3 0.5 1.8
Financial investments trading securities 2.2 15.1 17.3 Taxes payable 0.8 - 0.8
Management and performance fees 2.9 - 2.9 Payroll accruals and related charges 3.2 - 3.2
Deferred costs and prepaid expenses 0.6 0.2 0.8 Accrued interest 1.4 - 1.4
Other 12.4 0.3 12.7 Loans and financings 15.3 - 15.3
Other 2.4 - 2.4
Non-current liabilities 81.1 - 81.1
Perpetual notes 67.5 - 67.5
Provision for contingencies 13.6 - 13.6
Non-current assets 216.8 110.9 327.7
Investments 194.7 110.9 305.6
Equity Portfolio 189.1 110.9 299.9
Financial investments available for sale 5.7 - 5.7
Receivables from employees and shareholders 6.2 - 6.2 Shareholders' equity 198.4 136.8 335.2
Furniture and equipment 0.6 - 0.6
Loans & receivables from related parties 13.4 - 13.4
Funds held in escrow 1.3 - 1.3
Other 0.6 - 0.6
Total assets 303.9 137.3 441.2 Total liabilities and shareholders' equity 303.9 137.3 441.2

GP Investments
22
Proportional Income Statement

GP Investments
23
Consolidated Balance Sheet
Consolidated Balance Sheet 4Q20 3Q20 2019 4Q20 3Q20 2019
In USD million
Assets Liabilities and shareholders' equity
Current assets 140.5 163.6 213.4 Current liabilities 29.6 30.1 48.8
Cash and cash equivalents 41.9 64.3 66.5 Accounts payable 2.4 2.5 4.7
Financial investments 93.2 94.3 101.0 Taxes payable 0.8 0.8 1.8
Management and performance fees 0.0 0.0 27.9 Payroll accruals, bonuses and related charges 3.2 1.2 38.5
Deferred costs and prepaid expenses 0.8 0.6 0.8 Accrued interest 1.4 3.3 1.4
Other 4.6 4.3 17.2 Loans and financings 20.2 20.1 -
Other 1.4 2.2 2.4
Non-current liabilities 105.3 97.5 99.9
Perpetual notes 72.5 67.5 69.9
Provision for contigencies 32.8 30.0 30.0
Non-current assets 459.2 357.0 611.8
Investments 433.5 331.9 574.1
Equity Portfolio 427 326.3 565.6 Shareholders' equity 464.8 393.0 676.4
Financial investments at fair value through profit and loss 6.2 5.6 8.5 Share capital 0.3 0.3 0.3
Receivables from related parties 15.2 15.2 15.2 Share premium 603.7 601.0 597.6
Funds held in escrow 3.1 3.1 9.4 Accumulated deficit (300.4) (334.2) (208.6)
Receivables from employees and shareholders 6.2 5.7 8.5 Other accumulated comprehensive loss (27.0) (27.8) (23.8)
Furniture and equipment 0.6 0.6 0.7 Treasury shares (5.0) (5.0) (1.0)
Other 0.6 0.6 3.8 Non-controlling interest 193.2 158.8 311.90 3812 3812
Total assets 599.7 520.5 825.2 Total liabilities and shareholders' equity 599.7 520.5 825.2

GP Investments
24
Consolidated Income Statement
Consolidated Income Statement 4Q20 4Q19 2020 2019
In USD million
Fund Management Revenues 0.9 2.9 4.8 10.5
Management fees 0.9 2.4 4.8 9.8
Performance fees - 0.5 - 0.7
Capital Results Revenues 79.9 64.1 (169.2) 171.2
Appreciation / Depreciation in fair value of investments 79.8 79.5 (143.7) 160.6
Net realized gains (losses) 0.0 (15.4) (25.9) (0.5)
Dividends and others 0.1 0.1 0.3 11.2
Total Revenues 80.8 67.0 (164.4) 181.7
Operating Expenses (5.1) (5.8) (16.1) (21.3)
General and administrative (3.6) (4.7) (10.0) (12.8)
Payroll (1.5) (1.1) (6.1) (8.5)
Bonus and carried interest sharing expenses (2.1) (1.4) (3.4) (5.3)
Bonuses and carried on unrealized gain - (5.4) 5.7 (4.1)
Stock options - (0.0) - (0.3)
Contingencies (2.8) (4.8) (3.4) (6.3)
Total Expenses (10.1) (17.6) (17.2) (37.4)
Financial income / loss net 1.0 0.1 (15.0) (5.7)
Financial income 1.7 2.8 5.0 6.6
Financial expenses (0.7) (2.7) (20.0) (12.3)
Net Income / loss for the period before taxes 71.8 49.5 (196.6) 138.6
Income taxes (0.1) 0.0 (0.3) (0.9)
Net Income / loss for the period 71.7 49.5 (197.0) 137.7
Non-controlling net income / loss for the period 37.9 8.5 (105.2) 63.3
Net Income / loss for the period attributable to GP 33.8 41.0 (91.8) 74.3

GP Investments
25
Consolidated Cash Flow
Consolidated Cash Flow 2020 2019
In USD million
Net income (loss) for the year (197.0) 137.7
Reconciliation of net income (loss) to net cash flows
from operating activities 203.5 (195.1)
Depreciation (appreciation) in fair value of the investments 169.5 (192.1)
Reversal of unrealized fair value on disposal of investments (25.8) 31.6
Non-controlling interest - -
Gain (loss) on dilution of participation of minorities shareholders (0.0) -
Realized loss (gain), net 25.9 0.5
Stock based compensation 0.3 0.3
Accrued interests and foreign exchange variation on escrow account 1.4 0.1
Accrued interests - (0.4)
Accrued interests on perpetual notes (0.0) (0.4)
Accrued interests on financial assets at fair value through profit and loss 2.4 0.6
Accrued interests on payable due on acquisition of non-controlling interest 0.2 -
Accrued interests on loan receivable - 0.1
Amortization of deferred costs and prepaid expenses 0.1 0.5
Bonuses and carried on unrealized gain 26.8 (26.8)
Depreciation of furniture and equipment 0.1 0.2
Provision for contingencies 2.8 (9.2)
Change in assets/liabilities (19.8) (13.4)
Loan receivable from related parties 0.0 9.7
Management and performance fees 1.1 (0.5)
Financial investments 0.4 (55.1)
Receivable from employees and shareholders 2.3 2.2
Accounts payable (2.3) (1.1)
Taxes payable (1.0) (0.2)
Other - long term 3.2 -
Payroll, performance bonuses and related charges (35.2) 31.1
Other assets 12.6 1.4
Other liabilities (0.9) (0.9)
Net cash provided by (used in) operating activities (13.3) (70.8)
Proceeds from sale of financial investments 29.1 20.3
Acquisition of financial investments (19.8) (1.6)
Transfer to SPVs for payment of expenses (0.2) (0.9)
Financial investments and trading securities, net (1.8) (0.2)
(Acquisition) sale of investments owned through Spice (7.0) (14.9)
Acquisition of investment - Inova FIP (3.0) -
Proceeds from sale of investments - private equity - 145.6
Proceeds from release of escrow 4.9 12.4
Acquisition of investment - The Craftory (16.5) -
Acquisition of other investments (4.5) -
Sale (acquisition) of real estate investments 2.6 10.3
Sale (acquisition) of furniture and equipment 0.0 (0.2)
Sale (acquisition) of other invested assets (5.1) (9.8)
Sale (acquisition) of financial assets at fair value through profit and loss 2.4 -
Net cash provided by (used in) investing activities (19.0) 161.0
Capital contribution by limited partners - private equity 1.7 49.7
Capital contribution by limited partners - real estate 0.2 -
Distribution to limited partners - private equity investments (4.8) (102.1)
Distribution to limited partners - real estate (1.5) (9.7)
Distribution to other non-controlling (0.1) (2.1)
Amortization of perpetual notes 2.6 (60.3)
Capital subscription - -
Acquisition of treasury shares (4.1) (0.7)
Non-controlling interest FoodFirst - Spice (0.5) 3.7
Proceeds from loans 20.0 -
Repurchase of shares from non-controlling interests - Spice (3.0) -
Repurchase of shares from non-controlling interests - BRZ (0.9) (0.1)
Net cash provided by (used in) financing activities 9.7 (121.6)
Effects of exchange rate changes on cash and equivalents (2.0) (3.2)
Net increase (decrease) in cash and cash equivalents (24.5) (34.6)
Cash and cash equivalents at beginning of the period 66.5 101.10
Cash and cash equivalents at end of the period 41.5 66.50
Supplemental information 12.80
Interest paid 7.5 12.1
Income taxes and social contributions paid 0.7 0.7

GP Investments
26
GP Investments