Embed Size (px)
DESCRIPTION
GoWell Research & Learning Programme Presentation to SURF Board 14 th May 2009. Glasgow Community Health and Well-being Research and Learning Programme: Investigating the Processes and Impacts of Neighbourhood Change. - PowerPoint PPT Presentation
Citation preview
GoWell Research & Learning Programme
Presentation to SURF Board
14th May 2009

GoWell is a collaborative partnership between the Glasgow Centre for Population Health, the University of Glasgow and the MRC Social and
Public Health Sciences Unit, sponsored by Glasgow Housing Association, the Scottish Government, NHS Health Scotland and NHS
Greater Glasgow & Clyde.
Glasgow Community Health and Well-being Research and Learning Programme:
Investigating the Processes and Impacts of Neighbourhood Change
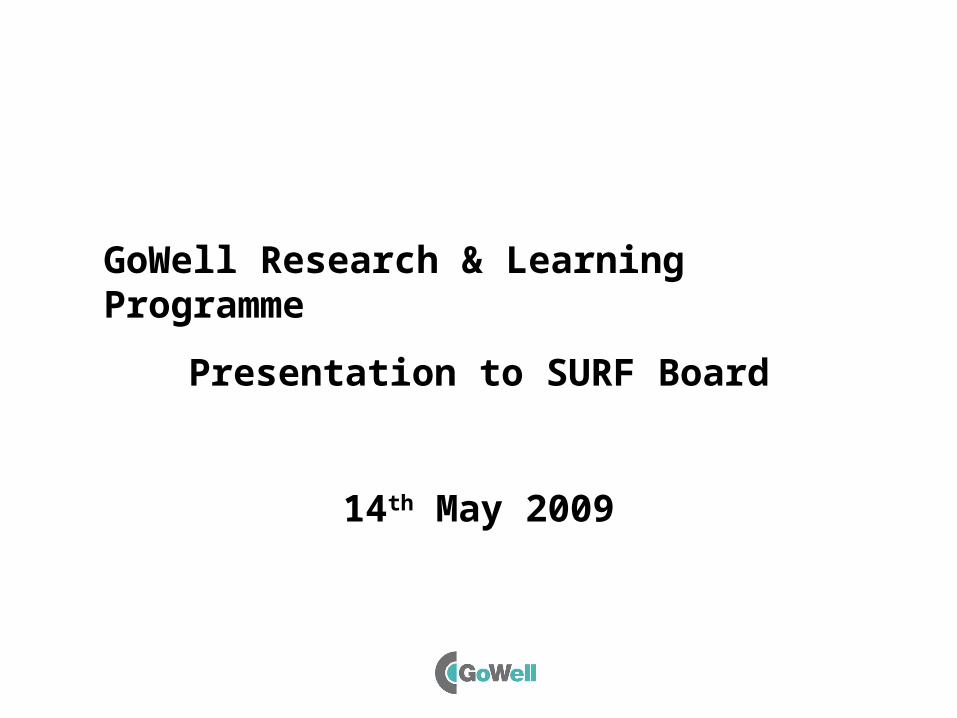
Aims
• To investigate the health and wellbeing impacts of regeneration and housing investment.
• To understand the processes of change and implementation which contribute to (+ve and –ve) health and wellbeing impacts.
• To contribute to community awareness and understanding … and enable community members to take part in change.
• To share best practice and knowledge.
Research objectives
• To investigate how regeneration and housing investment affect individuals’ health and wellbeing
• To assess degree to which places are transformed
• To understand processes that support cohesive, sustainable communities
• To monitor the effects of interventions on area-based inequalities
• To develop and test research methods
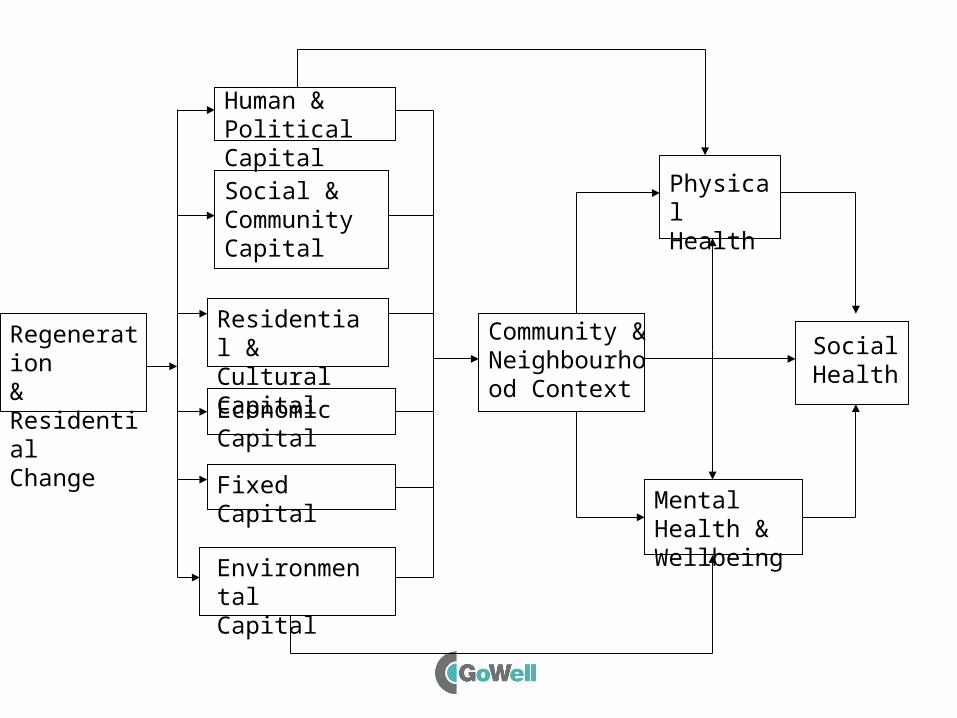
Regeneration& ResidentialChange
Residential & Cultural Capital
Economic Capital
Community & Neighbourhood Context
Physical Health
Mental Health & Wellbeing
Social Health
Fixed Capital
Environmental Capital
Social & Community Capital
Human & Political Capital
Learning objectives
• To distil learning in a way that enables policy and implementation to take account of health and wellbeing
• To make opportunities to influence policy• To facilitate communities and local
structures to use learning in an empowering way
• To disseminate methodological developments and research findings
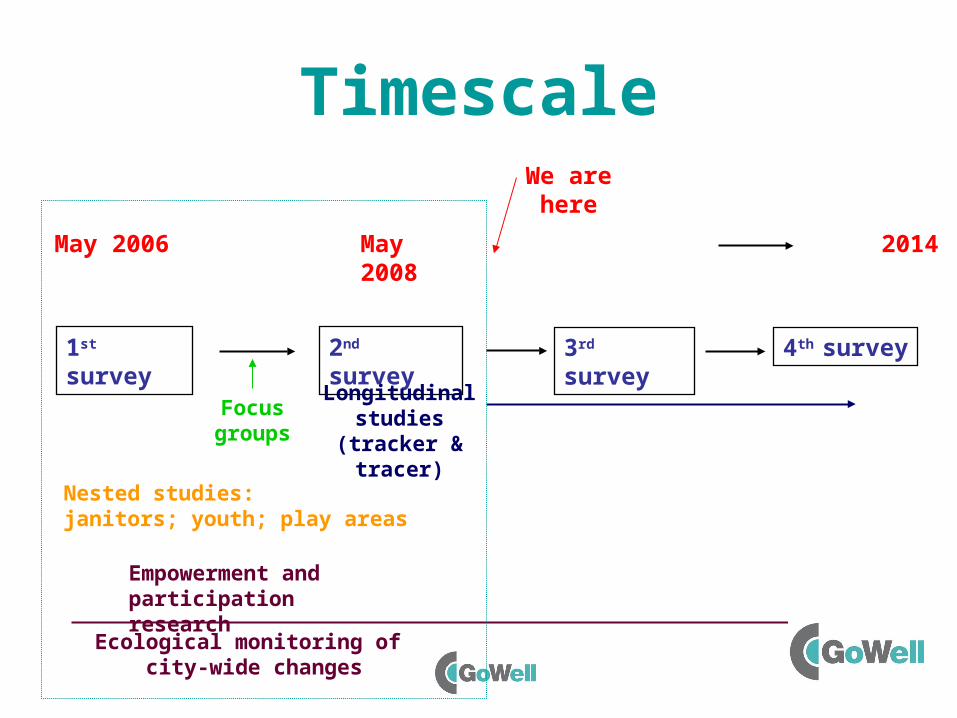
Timescale
1st survey 2nd survey 3rd survey 4th survey
May 2006 2014
We are here
May 2008
Focus groups
Longitudinal studies (tracker
& tracer)
Empowerment and participation research
Ecological monitoring of city-wide changes
Nested studies: janitors; youth; play areas
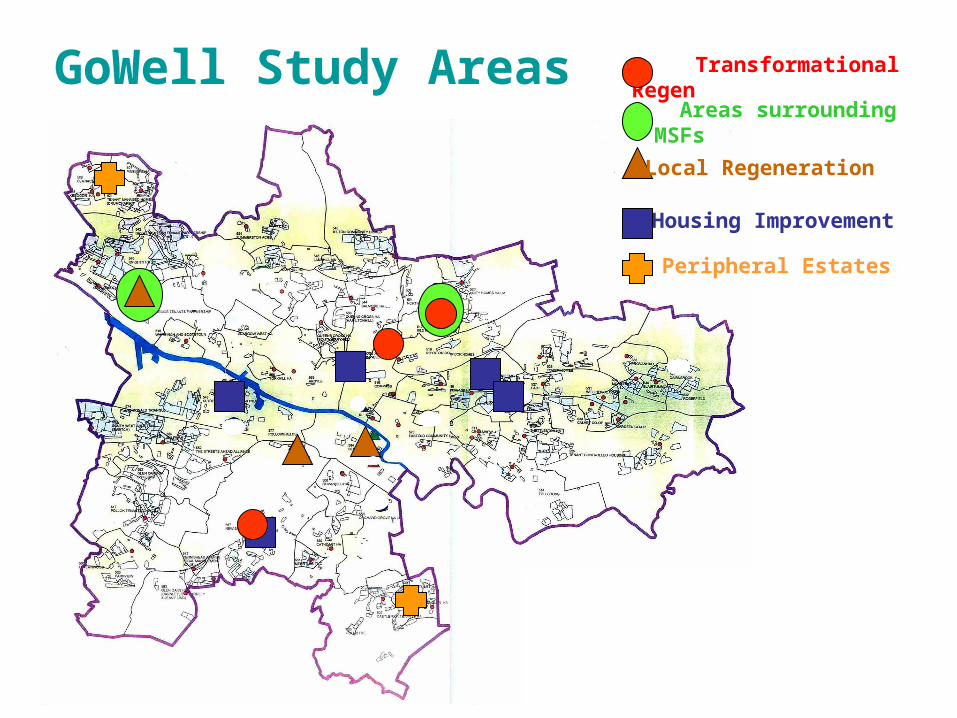
Transformational Regen
Local Regeneration
Housing Improvement
GoWell Study Areas
Peripheral Estates
Areas surrounding MSFs
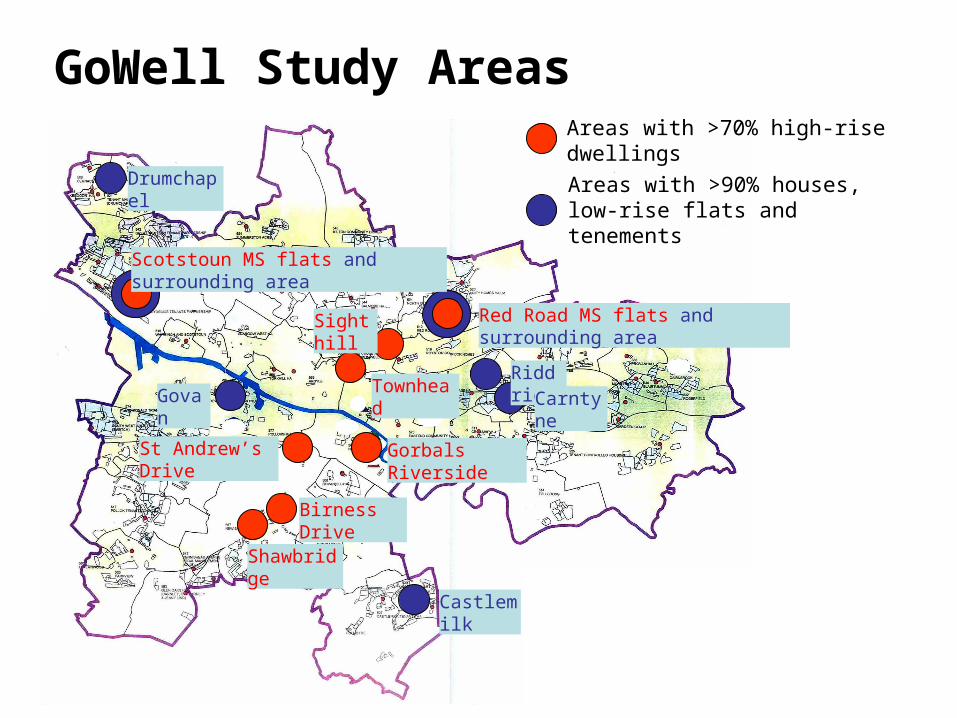
Areas with >70% high-rise dwellings
GoWell Study Areas
Areas with >90% houses, low-rise flats and tenements
Red Road MS flats and surrounding area
Riddrie Carnty
ne
Sighthill
Townhead
Drumchapel
Shawbridge
Scotstoun MS flats and surrounding area
Gorbals Riverside
St Andrew’s Drive
Castlemilk
Govan
Birness Drive
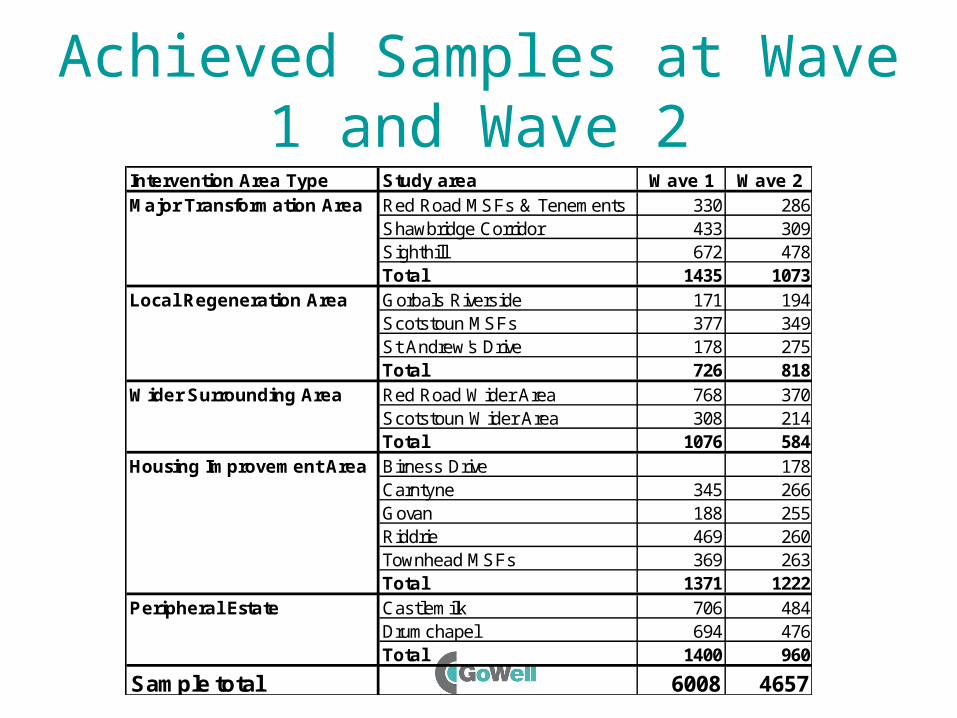
Achieved Samples at Wave 1 and Wave 2
Intervention Area Type Study area Wave 1 Wave 2Red Road MSFs & Tenements 330 286Shawbridge Corridor 433 309Sighthill 672 478Total 1435 1073Gorbals Riverside 171 194Scotstoun MSFs 377 349St Andrew's Drive 178 275Total 726 818Red Road Wider Area 768 370Scotstoun Wider Area 308 214Total 1076 584Birness Drive 178Carntyne 345 266Govan 188 255Riddrie 469 260Townhead MSFs 369 263Total 1371 1222Castlemilk 706 484Drumchapel 694 476Total 1400 960
Sample total 6008 4657
Peripheral Estate
Major Transformation Area
Local Regeneration Area
Wider Surrounding Area
Housing Improvement Area
Sample Sizes and Weighting• Achieved samples of 6,000 in 2006 & 4,600 in 2008• Samples weighted in the same way for both Waves.
• To make samples representative of our study areas and sub-areas:– Weighting by gender, age group and housing tenure.– Using up-to-date information from NHS & Council Tax
records.
• To adjust for different rates of interview success in different areas:– Scaling factors applied to samples by sub-area and study
area to reflect their relative population sizes.
Housing
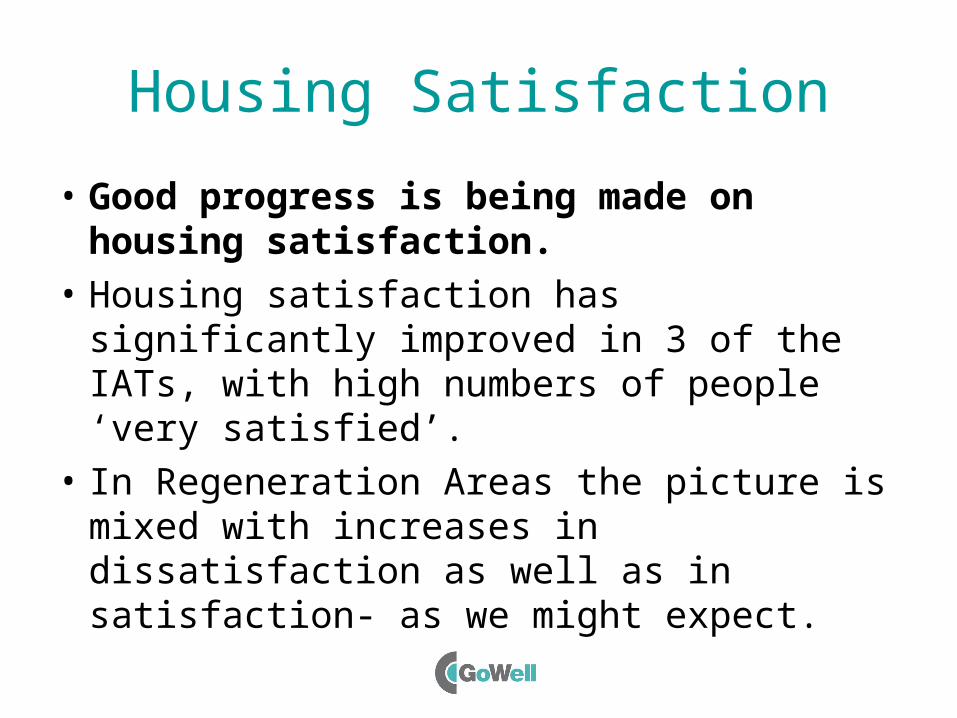
Housing Satisfaction
• Good progress is being made on housing satisfaction.
• Housing satisfaction has significantly improved in 3 of the IATs, with high numbers of people ‘very satisfied’.
• In Regeneration Areas the picture is mixed with increases in dissatisfaction as well as in satisfaction- as we might expect.
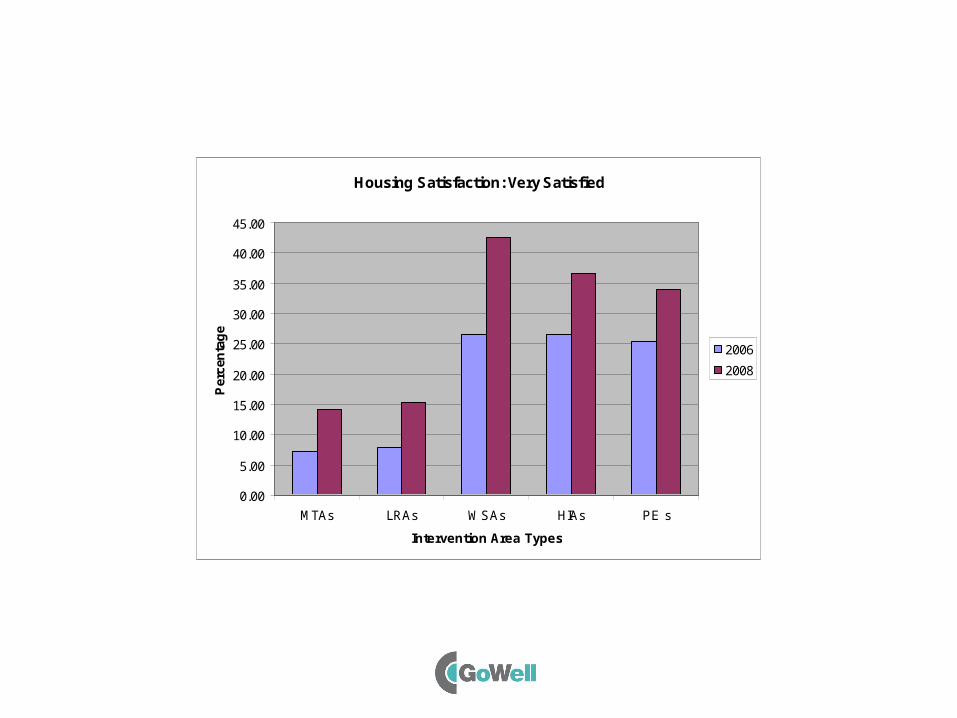
Housing Satisfaction: Very Satisfied
0.00
5.00
10.00
15.00
20.00
25.00
30.00
35.00
40.00
45.00
MTAs LRAs WSAs HIAs PE s
Intervention Area Types
Per
cen
tag
e
2006
2008
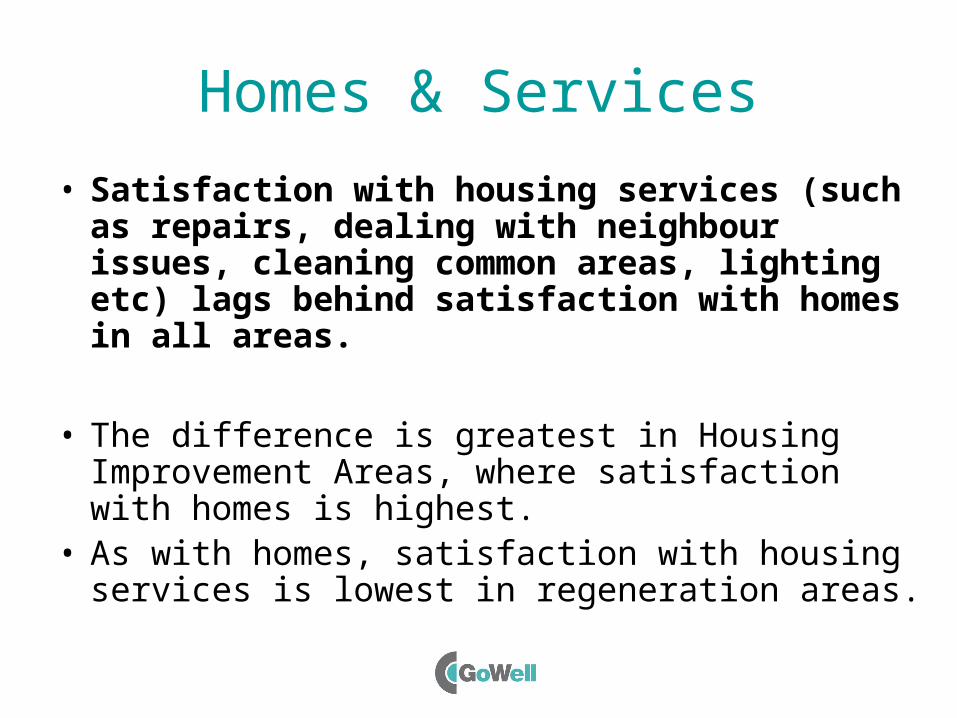
Homes & Services
• Satisfaction with housing services (such as repairs, dealing with neighbour issues, cleaning common areas, lighting etc) lags behind satisfaction with homes in all areas.
• The difference is greatest in Housing Improvement Areas, where satisfaction with homes is highest.
• As with homes, satisfaction with housing services is lowest in regeneration areas.
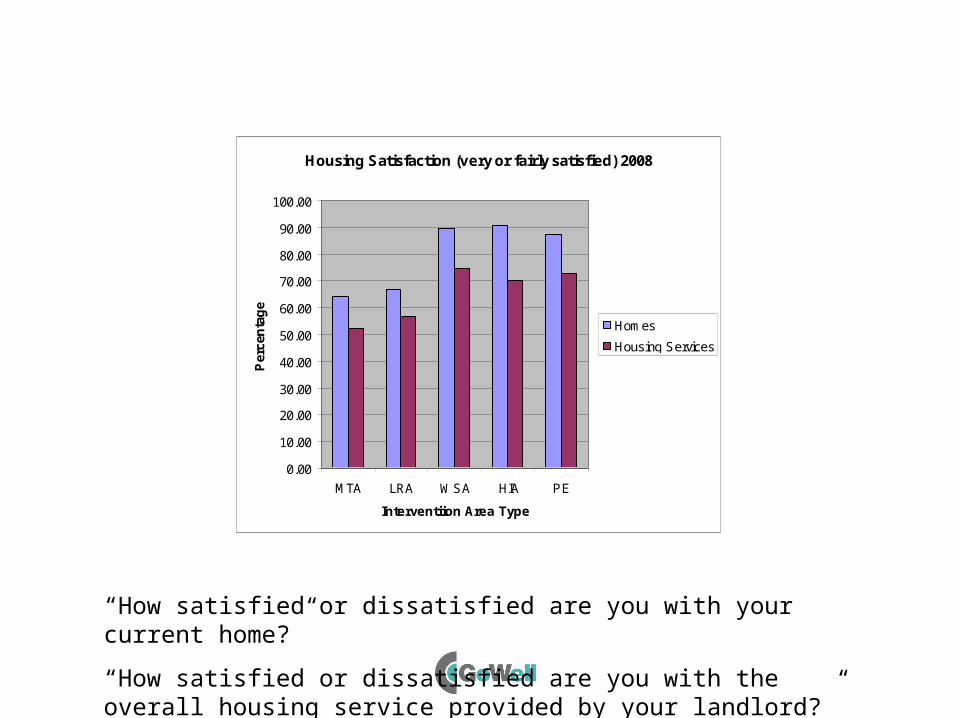
Housing Satisfaction (very or fairly satisfied) 2008
0.00
10.00
20.00
30.00
40.00
50.00
60.00
70.00
80.00
90.00
100.00
MTA LRA WSA HIA PE
Interventiion Area Type
Per
cen
tag
e
Homes
Housing Services
“How satisfied or dissatisfied are you with your current home?”
“How satisfied or dissatisfied are you with the overall housing service provided by your landlord?”

Psychosocial Benefits by Dwelling Type
• Houses perform best in providing all 8 psychosocial benefits to occupants, followed by other flats (tenement & deck access), and lastly high-rise flats.
• High-rise flats perform reasonably well on many items such as providing privacy, personal freedom and a sense of safety and retreat inside the home.
• High-rise flats do not perform well in providing feelings of relative status, personal progress, and a degree of ‘fit’ between the dwelling-type and the personality and values of the occupants.
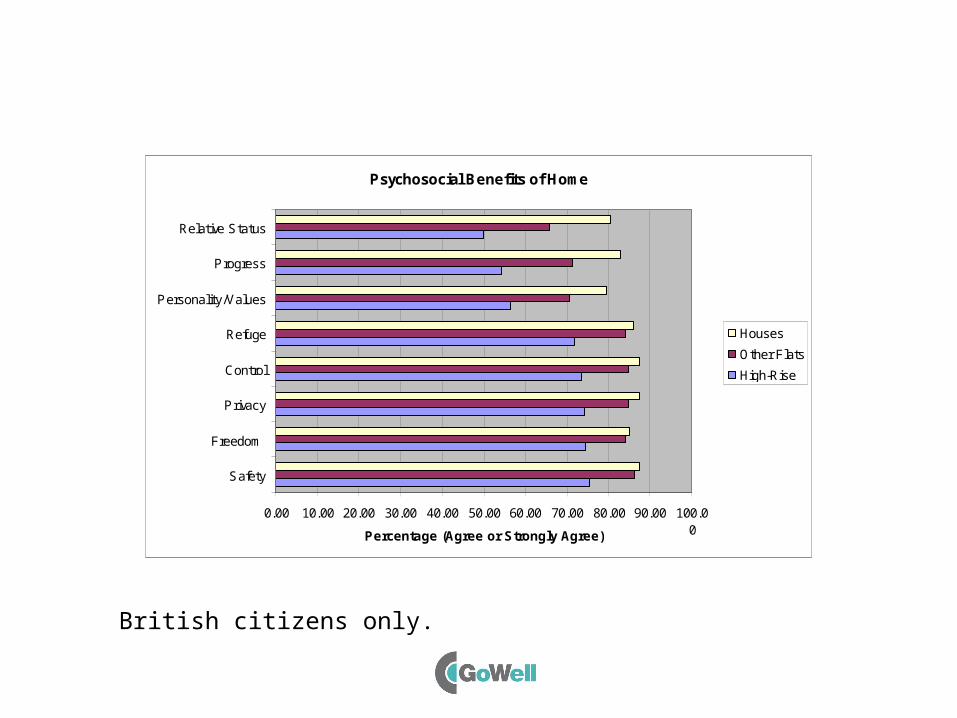
Psychosocial Benefits of Home
0.00 10.00 20.00 30.00 40.00 50.00 60.00 70.00 80.00 90.00 100.00
Safety
Freedom
Privacy
Control
Refuge
Personality/Values
Progress
Relative Status
Percentage (Agree or Strongly Agree)
Houses
Other Flats
High-Rise
British citizens only.
Neighbourhoods
Neighbourhood Environments
• Change in ratings of the environment seem to be associated with investment activity.
• Regeneration areas have seen significant declines in the quality of the environment.
• WSAs and HIAs have seen significant improvements in environmental quality.
• There has been little change in PEs where ratings are relatively low.
• All areas, apart from MTAs, have seen gains in the quiet and peacefulness of environments.
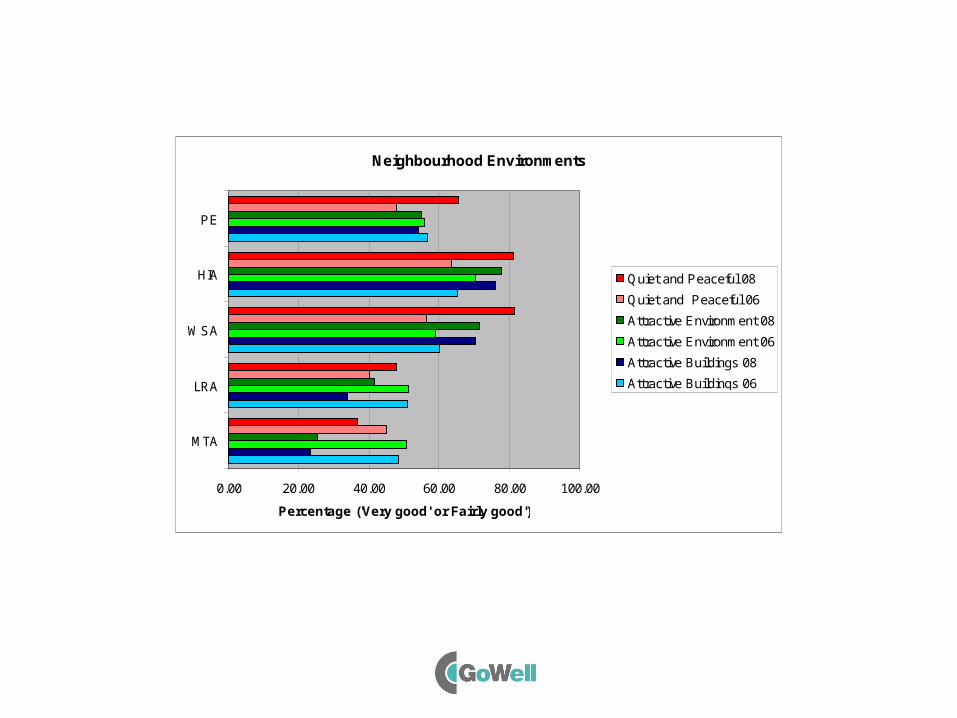
Neighbourhood Environments
0.00 20.00 40.00 60.00 80.00 100.00
MTA
LRA
WSA
HIA
PE
Percentage ('Very good' or Fairly good')
Quiet and Peaceful 08
Quiet and Peaceful 06
Attractive Environment 08
Attractive Environment 06
Attractive Buildings 08
Attractive Buildings 06
Antisocial Behaviour Problems
• We asked people about 11 antisocial behaviour issues at both Waves. Combining the responses to all these questions into an index* reveals that perceptions of ASB problems have worsened in all types of area.
* (0 =no problems; 100 = all serious problems)
• ASB problems are greatest in regeneration areas.• The biggest increase in problems was in PEs.• There was little change in HIAs.
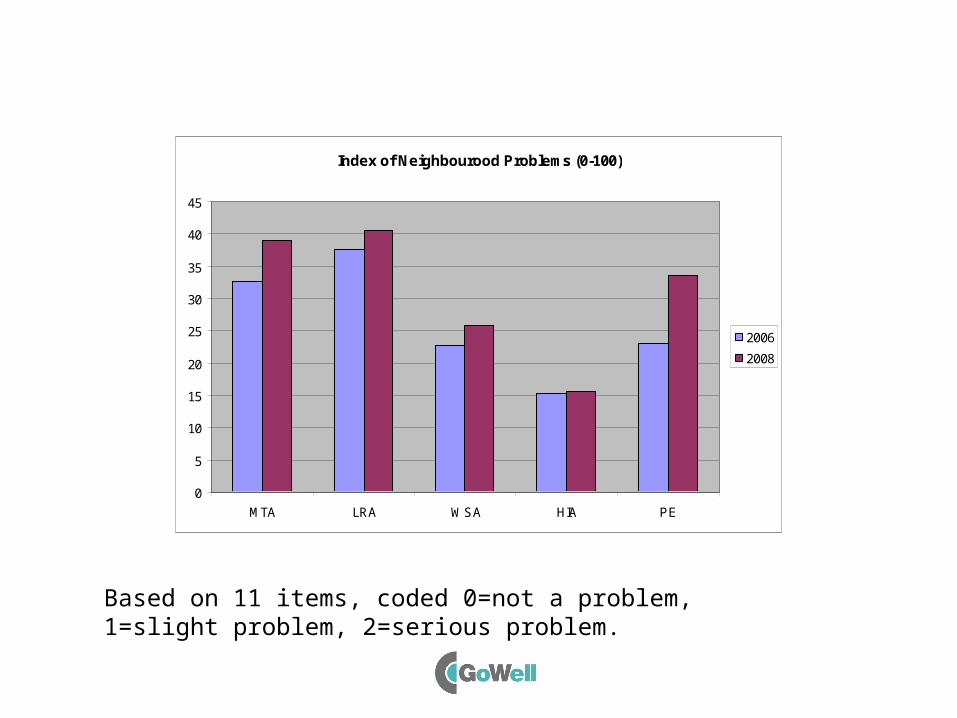
Index of Neighbourood Problems (0-100)
0
5
10
15
20
25
30
35
40
45
MTA LRA WSA HIA PE
2006
2008
Based on 11 items, coded 0=not a problem, 1=slight problem, 2=serious problem.
Communities
Sense of Community
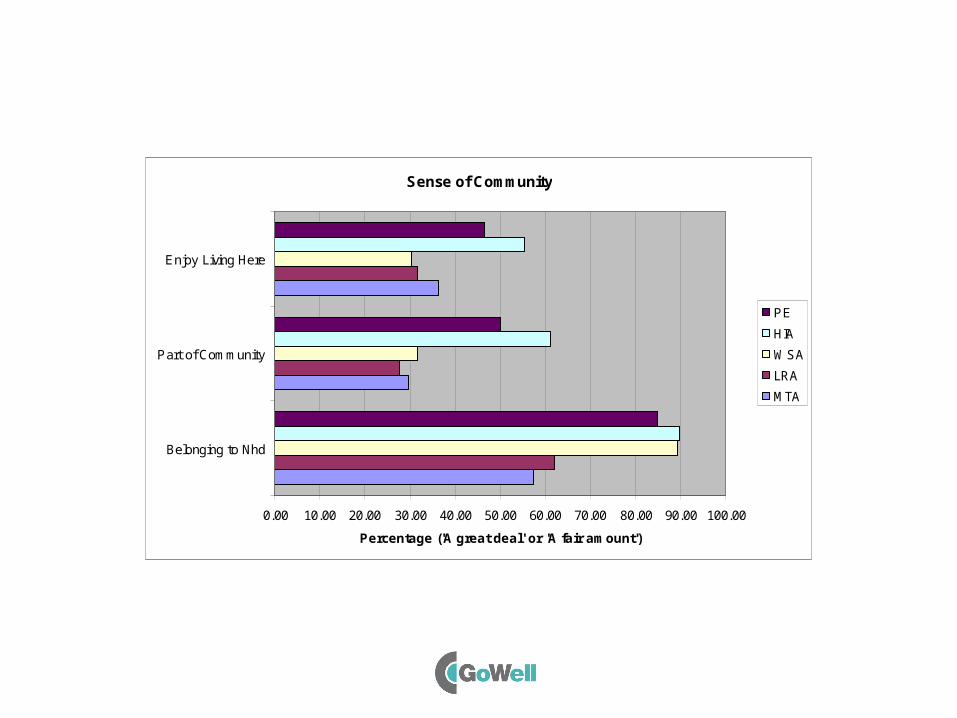
• Many more people feel they belong to an area than feel they are part of the community. This may detract from their enjoyment of where they live.
• Sense of community and enjoyment in the area are very low not only in regeneration areas but also in their surrounding areas.
• Belonging to the neighbourhood has fallen in MTAs (-13%), but remained stable elsewhere.
Sense of Community
0.00 10.00 20.00 30.00 40.00 50.00 60.00 70.00 80.00 90.00 100.00
Belonging to Nhd
Part of Community
Enjoy Living Here
Percentage ('A great deal' or 'A fair amount')
PE
HIA
WSA
LRA
MTA
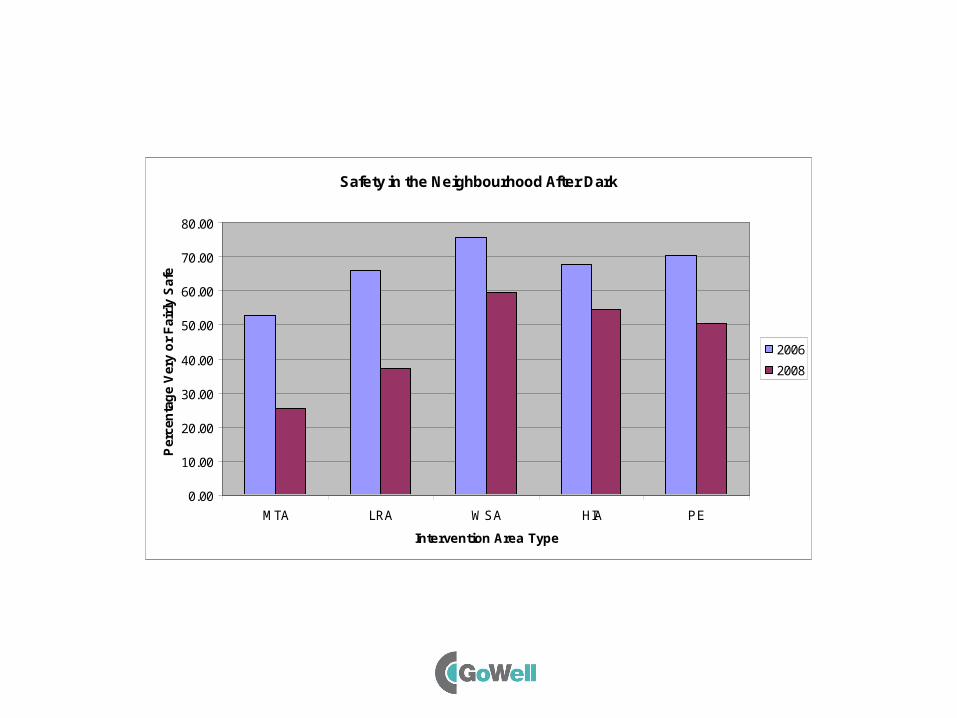
Community Cohesion: Safety• Sense of safety has declined in all areas,
with many more people deciding not to venture out alone after dark.
• A quarter (24%) of all respondents in 2008 said they never walk alone after dark.
• The biggest falls in sense of safety after dark were in regeneration areas.
• In MTAs half the respondents in 2008 said they felt ‘very unsafe’ or that they ‘never walk alone’. [This is in contrast to more people feeling safe in the home]
Safety in the Neighbourhood After Dark
0.00
10.00
20.00
30.00
40.00
50.00
60.00
70.00
80.00
MTA LRA WSA HIA PE
Intervention Area Type
Per
cen
tag
e V
ery
or
Fai
rly
Saf
e
2006
2008
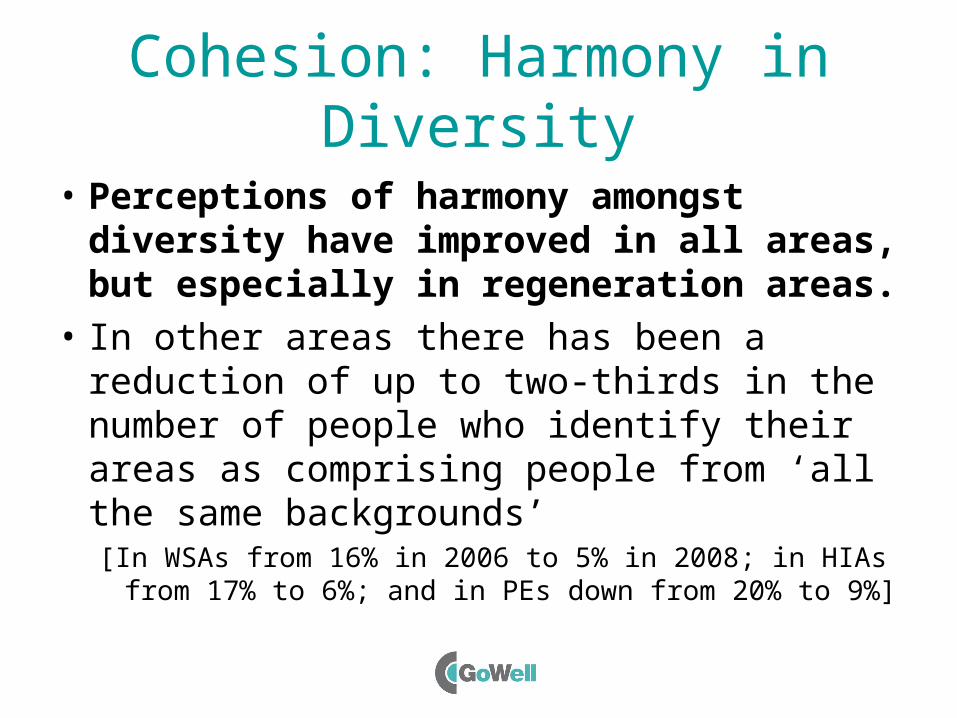
Cohesion: Harmony in Diversity
• Perceptions of harmony amongst diversity have improved in all areas, but especially in regeneration areas.
• In other areas there has been a reduction of up to two-thirds in the number of people who identify their areas as comprising people from ‘all the same backgrounds’[In WSAs from 16% in 2006 to 5% in 2008; in HIAs from
17% to 6%; and in PEs down from 20% to 9%]
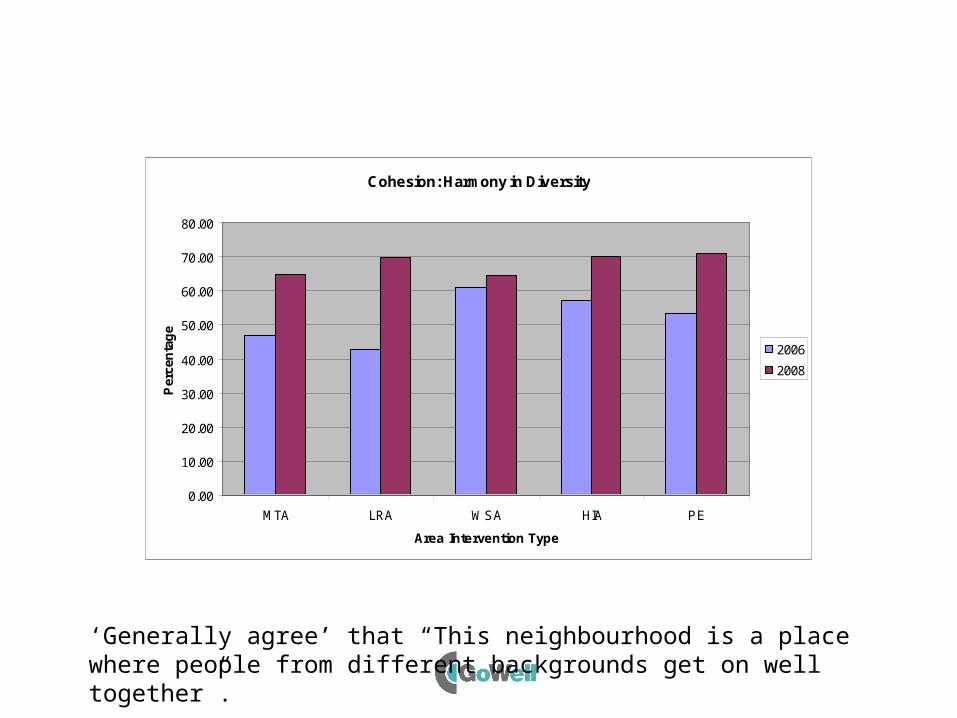
Cohesion: Harmony in Diversity
0.00
10.00
20.00
30.00
40.00
50.00
60.00
70.00
80.00
MTA LRA WSA HIA PE
Area Intervention Type
Per
cen
tag
e
2006
2008
‘Generally agree’ that “This neighbourhood is a place where people from different backgrounds get on well together”.
Mental Wellbeing
Positive Mental Wellbeing: The WEMWBS Scale
• In 2008 we included the Warwick-Edinburgh Mental Wellbeing Scale for the UK, developed with NHS Health Scotland.
• It consists of 14 items covering things such as confidence, optimism, happiness, clear thinking, closeness to others etc.
• It is closely correlated with other emotional and psychological scales.
• It is being used in the Scottish Health Survey and the Scottish Prison Survey so there are national benchmarks for us to compare with.
WEMWBS Scoring
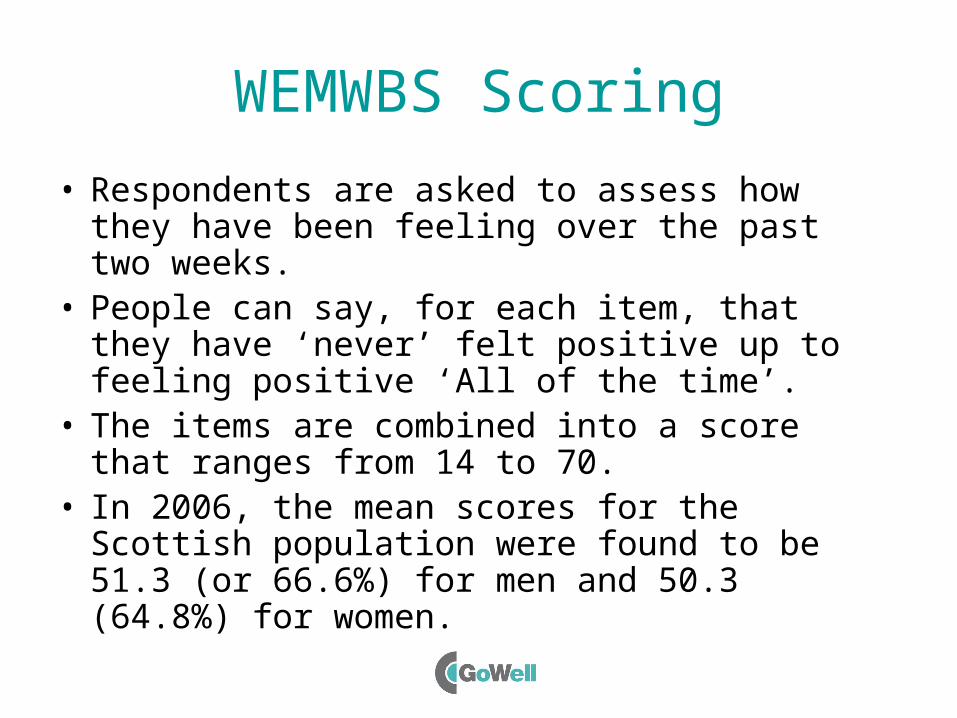
• Respondents are asked to assess how they have been feeling over the past two weeks.
• People can say, for each item, that they have ‘never’ felt positive up to feeling positive ‘All of the time’.
• The items are combined into a score that ranges from 14 to 70.
• In 2006, the mean scores for the Scottish population were found to be 51.3 (or 66.6%) for men and 50.3 (64.8%) for women.
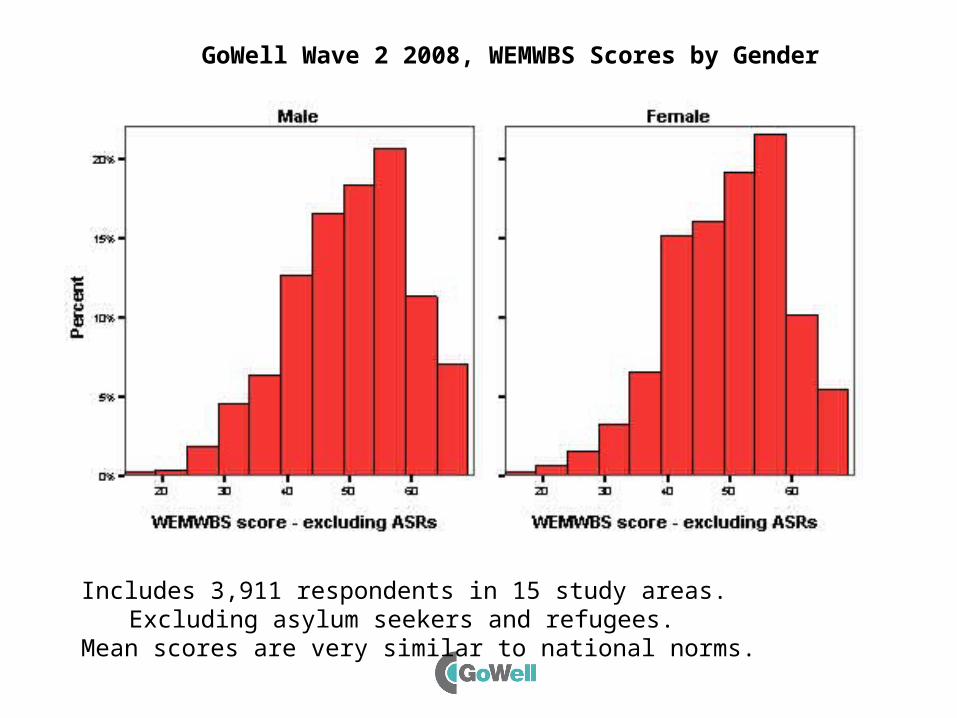
Includes 3,911 respondents in 15 study areas.Excluding asylum seekers and refugees.
Mean scores are very similar to national norms.
GoWell Wave 2 2008, WEMWBS Scores by Gender
More & Less Positive About What?
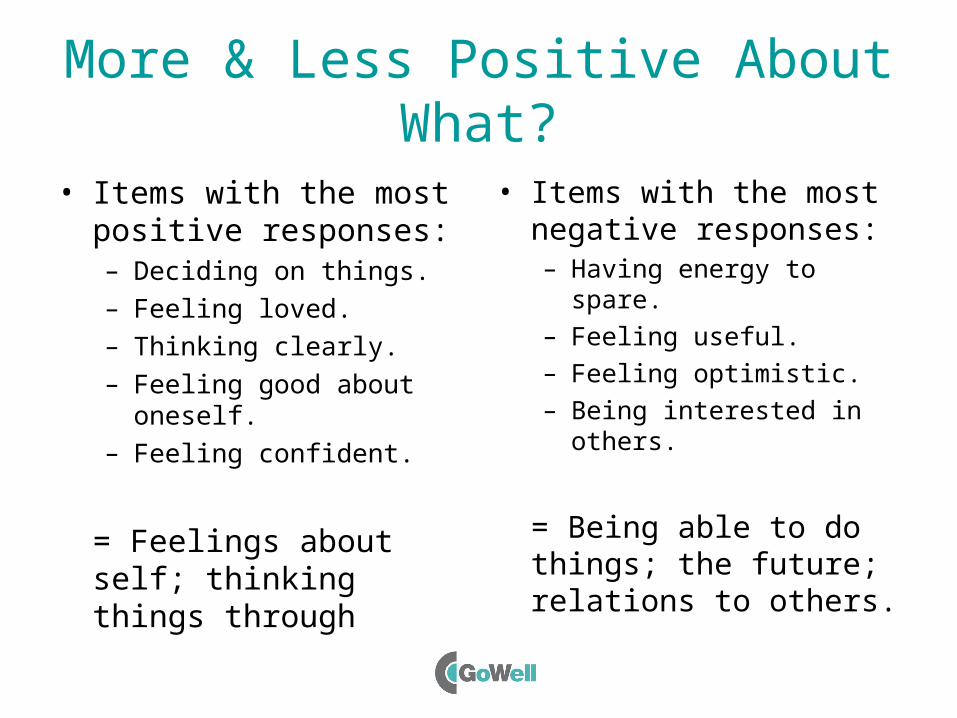
• Items with the most positive responses:– Deciding on things.– Feeling loved.– Thinking clearly.– Feeling good about
oneself.– Feeling confident.
= Feelings about self; thinking things through
• Items with the most negative responses:– Having energy to spare.– Feeling useful.– Feeling optimistic.– Being interested in others.
= Being able to do things; the future; relations to others.
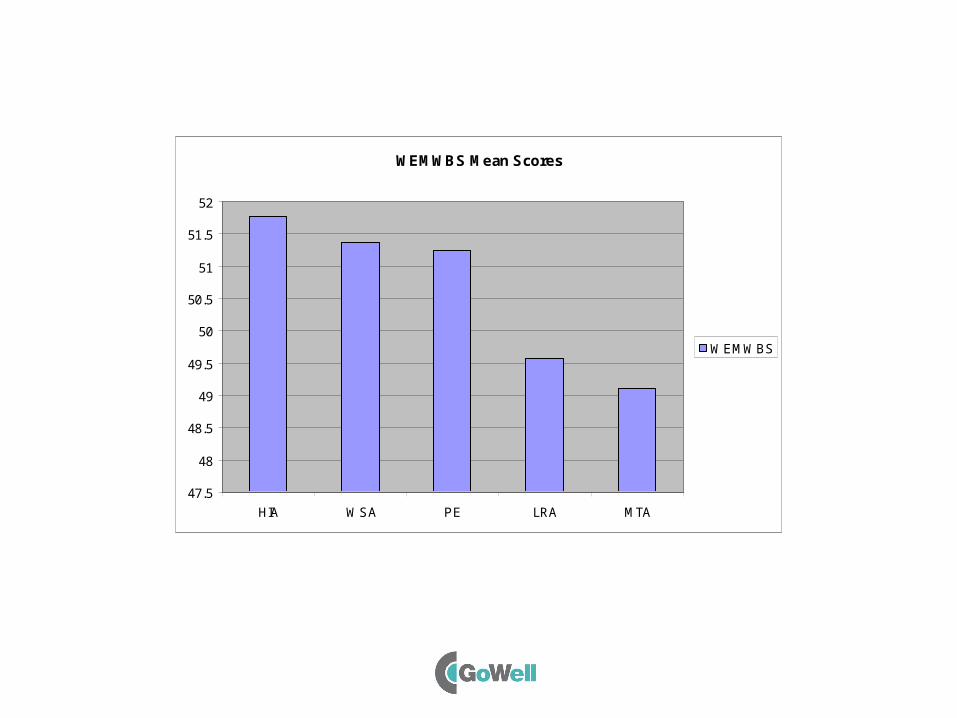
WEMWBS Mean Scores
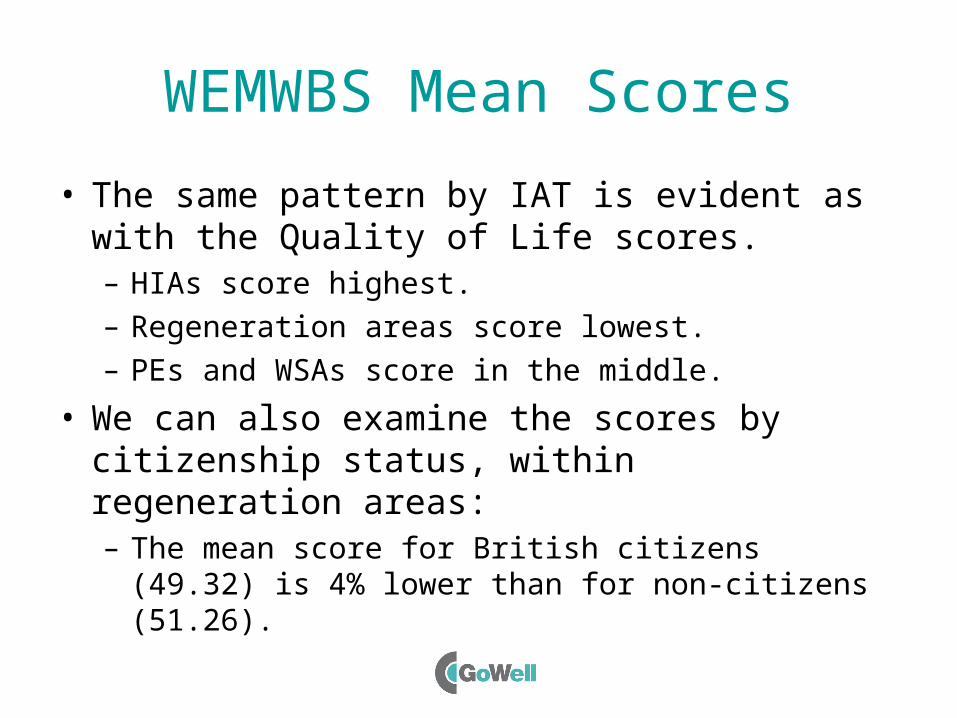
• The same pattern by IAT is evident as with the Quality of Life scores. – HIAs score highest.– Regeneration areas score lowest.– PEs and WSAs score in the middle.
• We can also examine the scores by citizenship status, within regeneration areas:– The mean score for British citizens (49.32) is 4%
lower than for non-citizens (51.26).
WEMWBS Mean Scores
47.5
48
48.5
49
49.5
50
50.5
51
51.5
52
HIA WSA PE LRA MTA
WEMWBS
Mental Wellbeing & Sense of Progress through Neighbourhood
• Where you live is a barometer of how well you are doing in life. Feeling good about your area contributes to feeling good about yourself, and this may support mental wellbeing.
• This sense of progress through nhd improved in all types of area over time, apart from MTAs.
• Mental wellbeing scores appear to be associated with whether or not people think that ‘Living in this neighbourhood makes me feel that I’m doing well in life’:– The mean WEMWBS score ranges by 19% across
the responses to this neighbourhood statement.
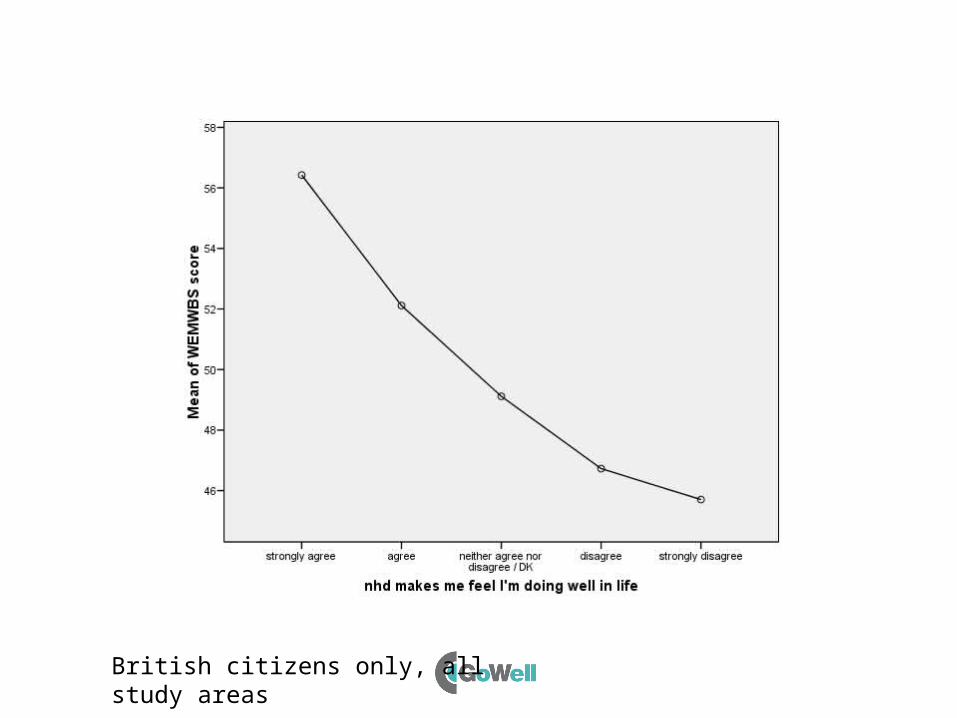
British citizens only, all study areas
Mental Wellbeing & Neighbourhood Empowerment
• Feeling empowered locally appears to be associated with mental wellbeing.
• We asked people three questions about local empowerment:– Could they influence decisions affecting their local area, on their own
or with others;– Were people in the area able to find ways to improve things in they
want;– Were the council and local service providers responsive to people’s
views.• We created a local empowerment score from all three
answers.• This shows a positive relationship with mental wellbeing
scores, with a range of 10 points or 18%.
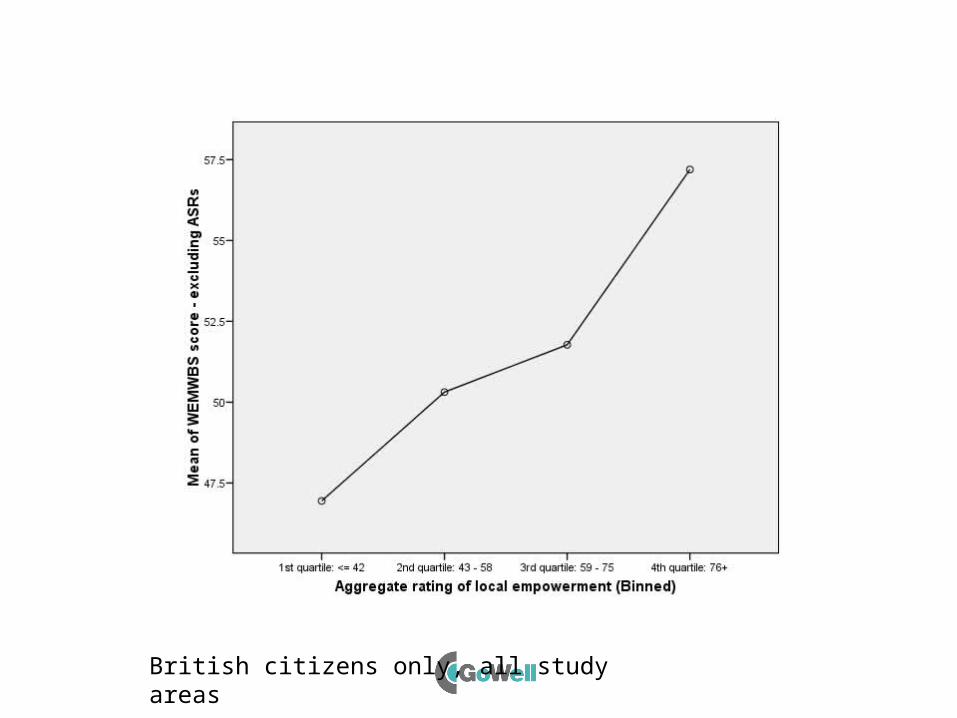
British citizens only, all study areas
Mental Wellbeing & Social Capital
• Local social capital is appears to be positively associated with mental wellbeing. Community interaction, and activities that make people feel they belong may therefore be important for mental wellbeing.
• We asked about people’s sense of belonging, feeling part of the community, and enjoyment of living in the area.
• We also asked about interactions with neighbours: knowing them; talking to them; visiting them; exchanging things with them.
• Both of these dimensions of social capital were associated with mental wellbeing.
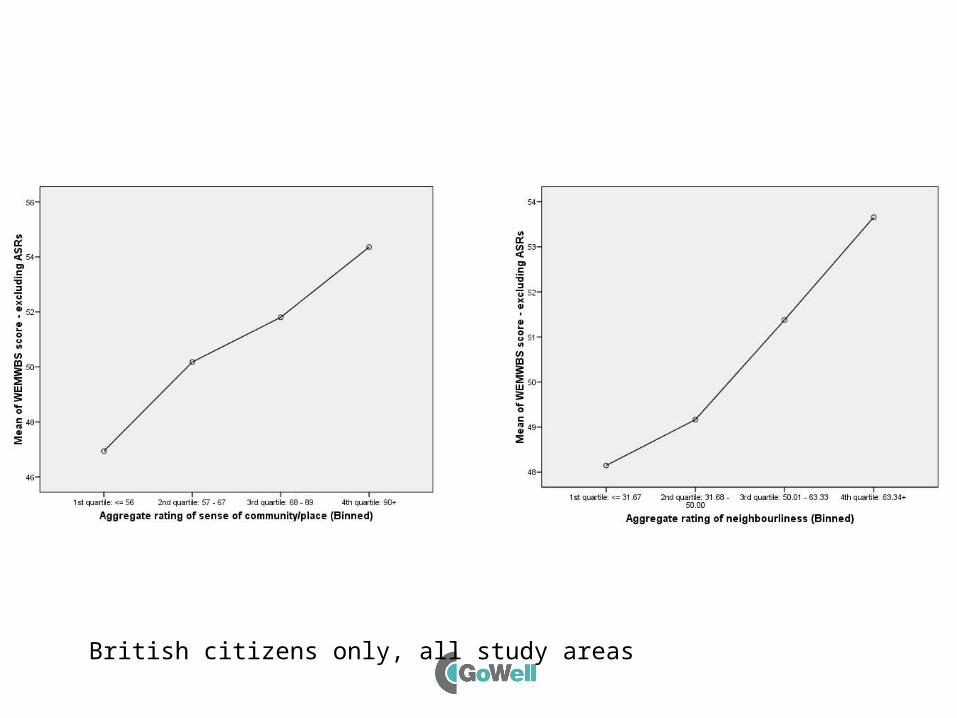
British citizens only, all study areas
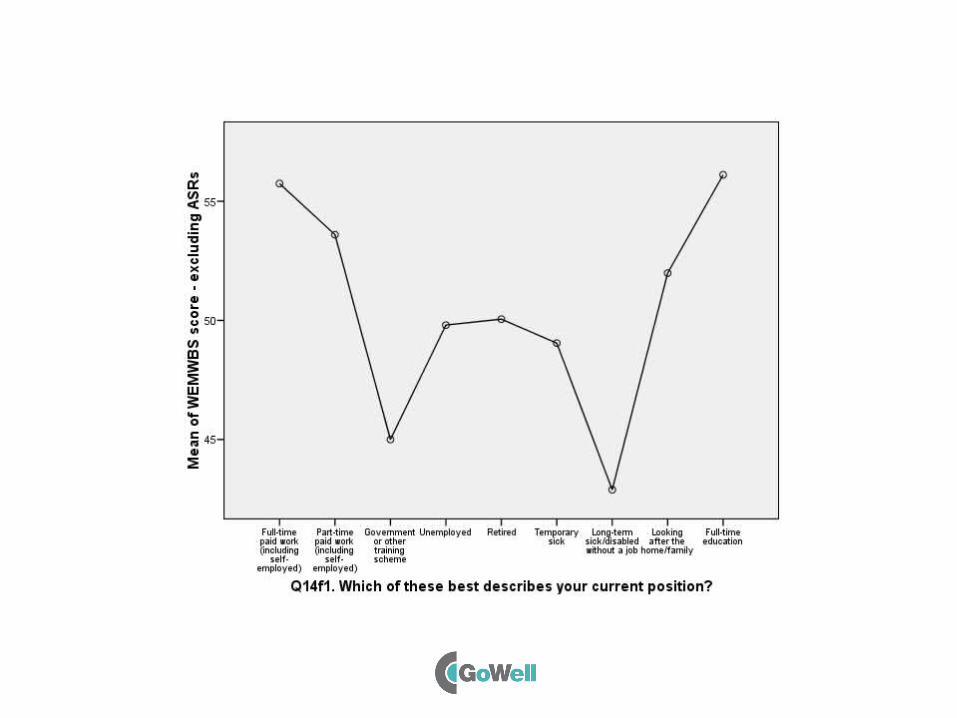
Human Capital• Being active is crucial to mental wellbeing.• People living alone may need support.• Younger adults have more positive mental health,
with the divide being around age 30.• Single adults (below or above retirement age)
have lower mental wellbeing than people in other types of household.
• People who are occupied full time, either with a job or in further or higher education, have the highest mental wellbeing.
• People who are long-term sick or disabled and without a job have very low mental wellbeing.
Summary: Mental Wellbeing
• Our new questions on quality of life and on positive mental wellbeing display patterns across Intervention Area Types that are consistent with assessments of area quality.
• There are some interesting potential relationships between mental wellbeing and place-based psychological measures (e.g. sense of community, progress and empowerment).
• Being active in some way is very important.
Next Steps
• Produce a report on area change across the different levels of GoWell study sites.
• Investigate some issues in more depth, both in the area change report and in separate articles and briefing papers, e.g. the relationships between feeling empowered, being active and mental wellbeing.
• Arrange focus groups within some of the study areas for late summer this year, again to explore selected issues in more depth.
• Plan GoWell Wave 3.