Embed Size (px)
Citation preview

1
Govt. of India Ministry of Human Resource Development
Dept. of School Education and Literacy
Mid Day Meal Division
PAB-MDM meeting to consider and approve AWP&B 2018-19
(Date of the meeting: 14.06.2018)
APPRAISAL NOTE
STATE : UTTAR PRADESH
INDEX
Sl. No. CHAPTER Page no.
Pre-requisite steps for submission of AWP&B
Part-A General Information
Part-B Review of performance during 2017-18
Part-C Recommendations of Appraisal team and quantification of variables for central assistance during 2018-19.
Part-D Fact sheet.
2
Status on Pre requisite steps required for submission of AWP&B
Pre-requisite step Status
Plan should be approved by SSMC Meeting Yes
100% payment of honorarium shall be made to cook cum helpers up to March, 2018.
Yes.
100% payment of cost of food grains shall be made to FCI up to
31st March, 2018.
No
Separate and detailed MME plan. No
Bank account should be opened for cook cum helpers Yes
Plan should also be submitted through MDM-MIS Yes
Action Taken Note on the assurances given by the State during PAB meeting 2017-18.
Yes
Annual and Monthly data entry for the FY 2017-18 should be completed up to March 2018.
Yes
Plan should be submitted within the scheduled date in hard and soft copies both.
Yes
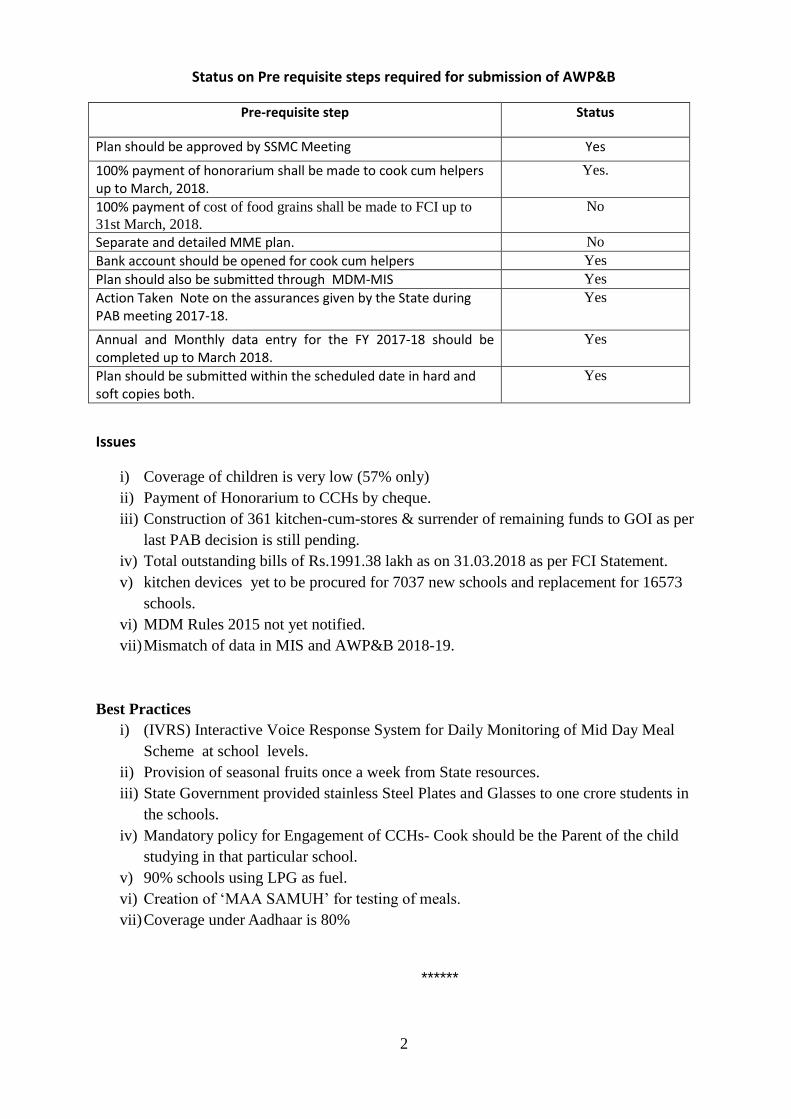
Issues
i) Coverage of children is very low (57% only)
ii) Payment of Honorarium to CCHs by cheque.
iii) Construction of 361 kitchen-cum-stores & surrender of remaining funds to GOI as per
last PAB decision is still pending.
iv) Total outstanding bills of Rs.1991.38 lakh as on 31.03.2018 as per FCI Statement.
v) kitchen devices yet to be procured for 7037 new schools and replacement for 16573
schools.
vi) MDM Rules 2015 not yet notified.
vii) Mismatch of data in MIS and AWP&B 2018-19.
Best Practices
i) (IVRS) Interactive Voice Response System for Daily Monitoring of Mid Day Meal
Scheme at school levels.
ii) Provision of seasonal fruits once a week from State resources.
iii) State Government provided stainless Steel Plates and Glasses to one crore students in
the schools.
iv) Mandatory policy for Engagement of CCHs- Cook should be the Parent of the child
studying in that particular school.
v) 90% schools using LPG as fuel.
vi) Creation of „MAA SAMUH‟ for testing of meals.
vii) Coverage under Aadhaar is 80%
******
3
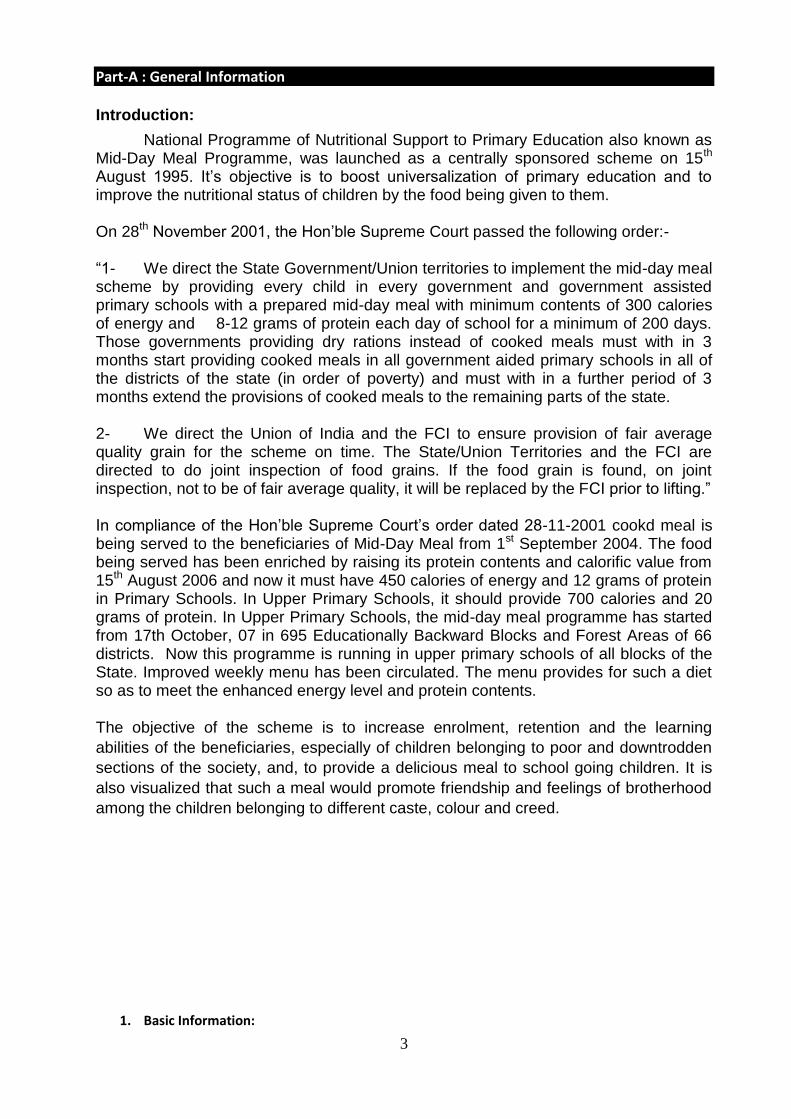
Part-A : General Information
Introduction:
National Programme of Nutritional Support to Primary Education also known as Mid-Day Meal Programme, was launched as a centrally sponsored scheme on 15th August 1995. It’s objective is to boost universalization of primary education and to improve the nutritional status of children by the food being given to them.
On 28th November 2001, the Hon’ble Supreme Court passed the following order:-
“1- We direct the State Government/Union territories to implement the mid-day meal scheme by providing every child in every government and government assisted primary schools with a prepared mid-day meal with minimum contents of 300 calories of energy and 8-12 grams of protein each day of school for a minimum of 200 days. Those governments providing dry rations instead of cooked meals must with in 3 months start providing cooked meals in all government aided primary schools in all of the districts of the state (in order of poverty) and must with in a further period of 3 months extend the provisions of cooked meals to the remaining parts of the state.
2- We direct the Union of India and the FCI to ensure provision of fair average quality grain for the scheme on time. The State/Union Territories and the FCI are directed to do joint inspection of food grains. If the food grain is found, on joint inspection, not to be of fair average quality, it will be replaced by the FCI prior to lifting.” In compliance of the Hon’ble Supreme Court’s order dated 28-11-2001 cookd meal is being served to the beneficiaries of Mid-Day Meal from 1st September 2004. The food being served has been enriched by raising its protein contents and calorific value from 15th August 2006 and now it must have 450 calories of energy and 12 grams of protein in Primary Schools. In Upper Primary Schools, it should provide 700 calories and 20 grams of protein. In Upper Primary Schools, the mid-day meal programme has started from 17th October, 07 in 695 Educationally Backward Blocks and Forest Areas of 66 districts. Now this programme is running in upper primary schools of all blocks of the State. Improved weekly menu has been circulated. The menu provides for such a diet so as to meet the enhanced energy level and protein contents.
The objective of the scheme is to increase enrolment, retention and the learning
abilities of the beneficiaries, especially of children belonging to poor and downtrodden
sections of the society, and, to provide a delicious meal to school going children. It is
also visualized that such a meal would promote friendship and feelings of brotherhood
among the children belonging to different caste, colour and creed.
1. Basic Information:

4
(Year 2017-18)
*percentage to enrolment # The minimum mandatory State Share is Rs. 1.65 and Rs. 2.47 per child per day for primary and upper primary respectively.
S. No. INDICATORS STATUS 1. No. of Institutions PRY U PRY TOTAL
i) Approved by MDM-PAB for 2017-18 114507 54387 168894
ii) Covered during the year 114080 53765 167845
2. No. of Children
i) Approved by MDM-PAB 7215553 3105735 10321288 Ii) Enrollment as on 30.9.2017 12094277 5589011 17683288 ii) Average No. of children availed
MDM during 01.04.2017 to 31.03.2018*
7092792 (59%)
2956481 (53%)
10049273 (57%)
3. Coverage of children as per Quarterly Progress Report (QPR)
i) Average no. of children availed MDM as per QPR-1
5570438 2169704 7740142
ii) Average no. of children availed MDM as per QPR-2
7132176 3133910 10266086
iii) Average no. of children availed MDM as per QPR-3
7784140 3279288 11063428
iv) Average no. of children availed MDM as per QPR-4
7234212 2849595 10083807
4. No. of Working Days
i) Approved for 2017-18 247 227 ii) Covered during 2017-18 247 226
5. Per unit cooking cost per child per day (in Rs.)
AVERAGE UNIT COOKING COST PCPD 4.13 6.18 State’s contributions in cooking cost per child per day
1.65 2.47

5
Part-B : Review of Performance in 2017-18 (01.04.17 to 31.03.2018)
2. Based on the information provided by the State Government in its AWP&B 2018-19, the performance during 2017-18 (01.04.17 to 31 03.2018) was reviewed. The major issues in implementation during 2017-18 are summarized as under: - 2.0 Coverage of Institutions
Coverage in terms of No. of institutions. Difference between PAB Approval (Target) Vs No. of institutions covered (Achievement) – i) PRIMARY
The number of existing institutions = 114460 Number of institutions covered during 01.04.17 to 31.03.18 =114080 (100%) ii) UPPER PRIMARY WITH PRIMARY CLASSES
The number of existing institutions = 1299 Number of institutions covered during 01.04.17 to 31.03.18 = 1206 (93%) ii) UPPER PRIMARY
The number of existing institutions = 53073 Number of institutions covered during 01.04.17 to 31.03.18 = 52559(99%)
The State is not covering 987 schools under Mid Day Meal because guardians of students in 08 schools are not accepting mid day meal; 147 schools have zero enrolment; District Magistrate has removed the NGO which was supply mid day meal in 75 schools; 26 New Schools; 08 Schools in Rented building and negligible enrollment No Space for Kitchen; mid day meal is not being served in 369 schools due to management dispute and mid day meal would be started in 354 schools from July, 2018. 2.1 Coverage of Children
2.1.1 Coverage against Enrolment :
a) Primary - Coverage in terms of No. of children. Difference between Enrolment vs Average No. of Children Availed MDM (Achievement) (Refer Table 2.3 of the Analysis Sheet).
Total Enrolment as on 30.09.2017 = 12094277
Average number of children availed MDM during 01.04.17 to 31.03.18 =7092792 (59%)
Districts Enrolment
Primary
Average number of children
availed MDM
% Coverage against
enrolment
1 2 3 4
66-SHRAWASTI 101637 48745 48%
73-SAMBHAL 155635 78016 50%
61-RAI BAREILY 182386 92744 51%
59-PILIBHIT 128411 66516 52%
03-ALLAHABAD 330601 172287 52%
13-BARABANKI 251732 132616 53%
07-BADAUN 245300 131697 54%
6
02-ALIGARH 161807 87187 54%
57-MORADABAD 135871 73507 54%
32-GORAKHPUR 244393 132349 54%
21-AMETHI 123823 67184 54%
65-SHAHJAHANPUR 258528 140701 54%
16-BHADOHI 104518 57156 55%
35-HATHRAS 91190 50194 55%
06-AZAMGARH 283186 156669 55%
46-KUSHINAGAR 240716 134364 56%
54-MAU 139076 77930 56%
01-AGRA 195857 109842 56%
62-RAMPUR 127668 71782 56%
39-JAUNPUR 298613 168576 56%
68-SITAPUR 385484 218237 57%
09-BAHRAICH 337749 191576 57%
43-KANPUR NAGAR 128492 73622 57%
44-KAAS GANJ 103441 59706 58%
48-LALITPUR 112769 65133 58%
55-MEERUT 102753 59392 58%
69-SONBHADRA 178696 103324 58%
31-GONDA 263964 153210 58%
12-BANDA 157110 91451 58%
38-JALAUN 89769 52334 58%
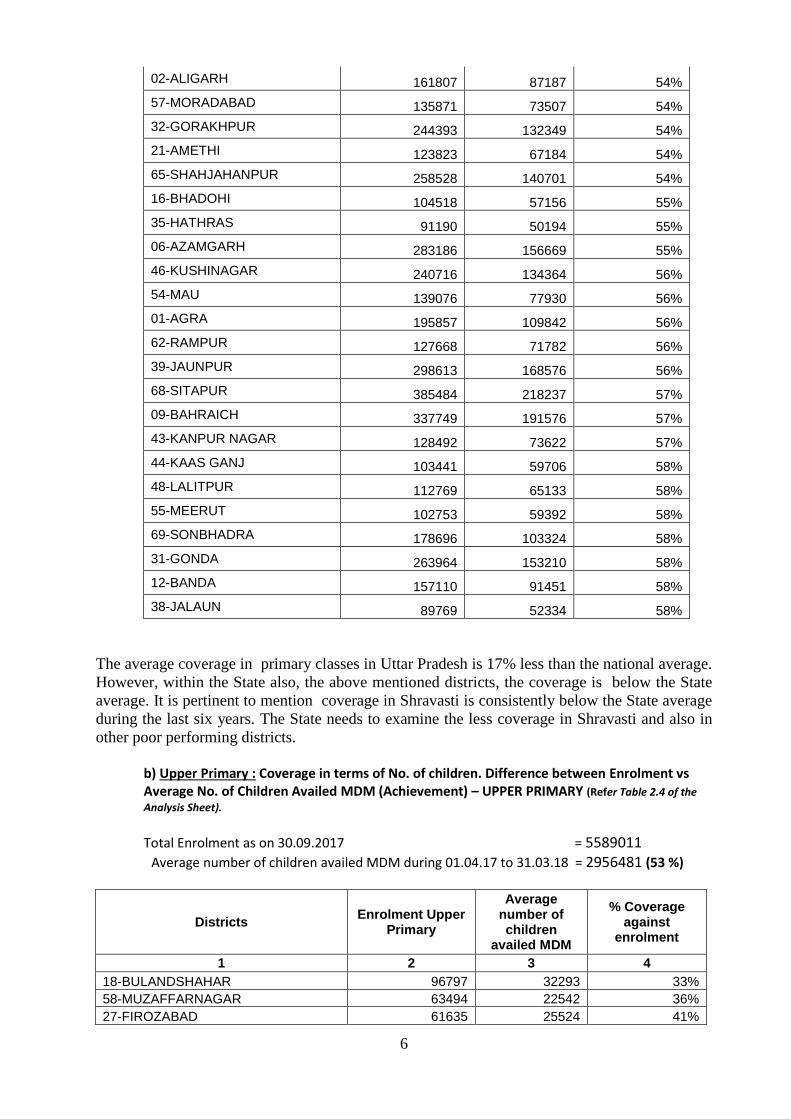
The average coverage in primary classes in Uttar Pradesh is 17% less than the national average.
However, within the State also, the above mentioned districts, the coverage is below the State
average. It is pertinent to mention coverage in Shravasti is consistently below the State average
during the last six years. The State needs to examine the less coverage in Shravasti and also in
other poor performing districts.
b) Upper Primary : Coverage in terms of No. of children. Difference between Enrolment vs Average No. of Children Availed MDM (Achievement) – UPPER PRIMARY (Refer Table 2.4 of the
Analysis Sheet).
Total Enrolment as on 30.09.2017 = 5589011
Average number of children availed MDM during 01.04.17 to 31.03.18 = 2956481 (53 %)
Districts Enrolment Upper
Primary
Average number of children
availed MDM
% Coverage against
enrolment
1 2 3 4
18-BULANDSHAHAR 96797 32293 33%
58-MUZAFFARNAGAR 63494 22542 36%
27-FIROZABAD 61635 25524 41%
7
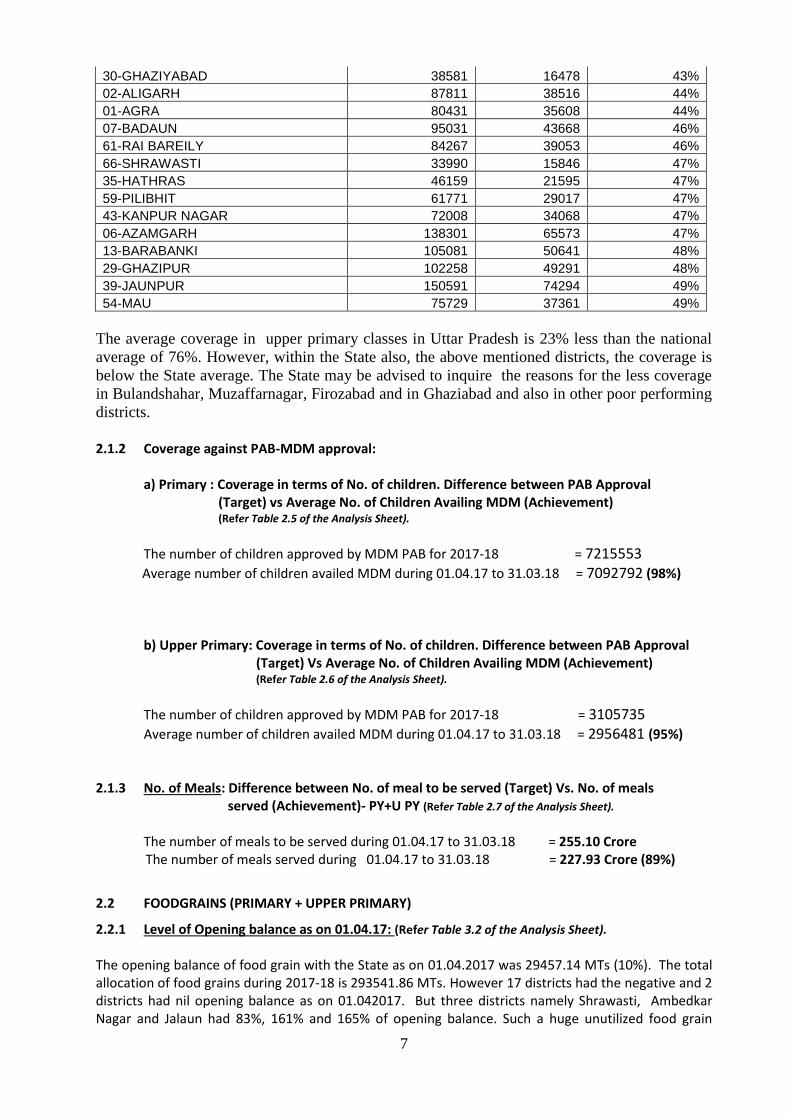
30-GHAZIYABAD 38581 16478 43%
02-ALIGARH 87811 38516 44%
01-AGRA 80431 35608 44%
07-BADAUN 95031 43668 46%
61-RAI BAREILY 84267 39053 46%
66-SHRAWASTI 33990 15846 47%
35-HATHRAS 46159 21595 47%
59-PILIBHIT 61771 29017 47%
43-KANPUR NAGAR 72008 34068 47%
06-AZAMGARH 138301 65573 47%
13-BARABANKI 105081 50641 48%
29-GHAZIPUR 102258 49291 48%
39-JAUNPUR 150591 74294 49%
54-MAU 75729 37361 49%
The average coverage in upper primary classes in Uttar Pradesh is 23% less than the national
average of 76%. However, within the State also, the above mentioned districts, the coverage is
below the State average. The State may be advised to inquire the reasons for the less coverage
in Bulandshahar, Muzaffarnagar, Firozabad and in Ghaziabad and also in other poor performing
districts.
2.1.2 Coverage against PAB-MDM approval:
a) Primary : Coverage in terms of No. of children. Difference between PAB Approval (Target) vs Average No. of Children Availing MDM (Achievement) (Refer Table 2.5 of the Analysis Sheet).
The number of children approved by MDM PAB for 2017-18 = 7215553
Average number of children availed MDM during 01.04.17 to 31.03.18 = 7092792 (98%)
b) Upper Primary: Coverage in terms of No. of children. Difference between PAB Approval (Target) Vs Average No. of Children Availing MDM (Achievement) (Refer Table 2.6 of the Analysis Sheet).
The number of children approved by MDM PAB for 2017-18 = 3105735
Average number of children availed MDM during 01.04.17 to 31.03.18 = 2956481 (95%) 2.1.3 No. of Meals: Difference between No. of meal to be served (Target) Vs. No. of meals
served (Achievement)- PY+U PY (Refer Table 2.7 of the Analysis Sheet). The number of meals to be served during 01.04.17 to 31.03.18 = 255.10 Crore The number of meals served during 01.04.17 to 31.03.18 = 227.93 Crore (89%)
2.2 FOODGRAINS (PRIMARY + UPPER PRIMARY)
2.2.1 Level of Opening balance as on 01.04.17: (Refer Table 3.2 of the Analysis Sheet). The opening balance of food grain with the State as on 01.04.2017 was 29457.14 MTs (10%). The total allocation of food grains during 2017-18 is 293541.86 MTs. However 17 districts had the negative and 2 districts had nil opening balance as on 01.042017. But three districts namely Shrawasti, Ambedkar Nagar and Jalaun had 83%, 161% and 165% of opening balance. Such a huge unutilized food grain
8
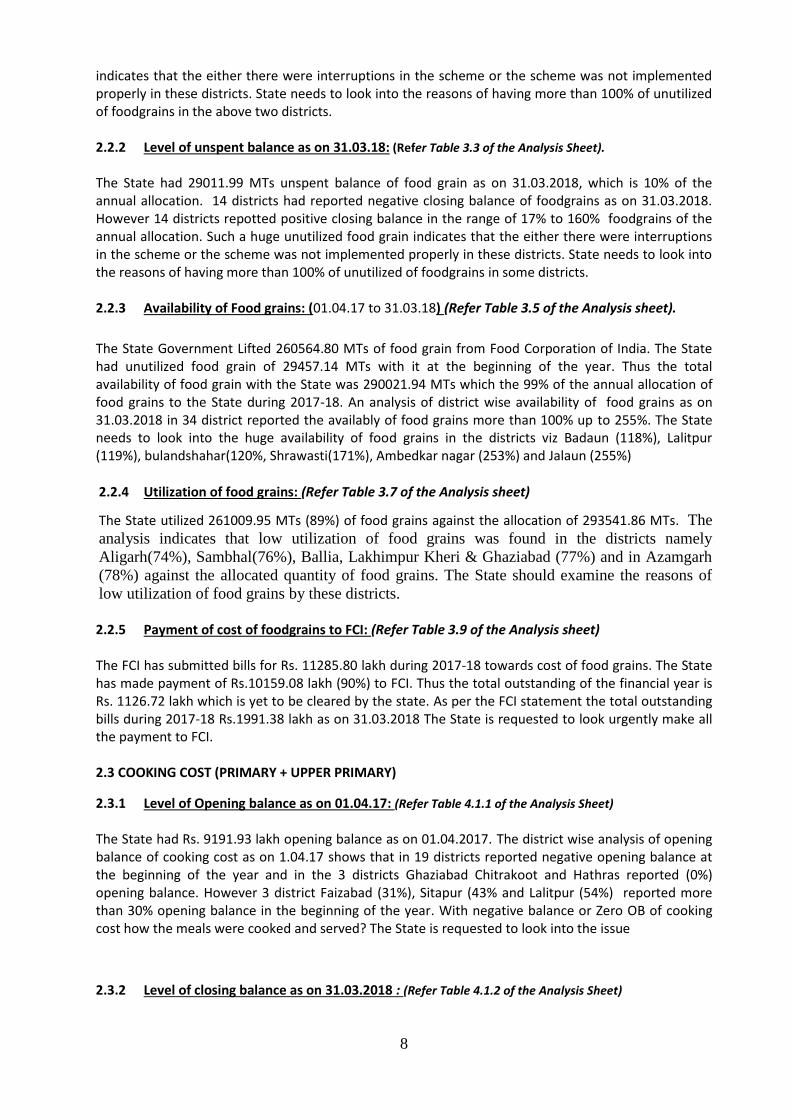
indicates that the either there were interruptions in the scheme or the scheme was not implemented properly in these districts. State needs to look into the reasons of having more than 100% of unutilized of foodgrains in the above two districts. 2.2.2 Level of unspent balance as on 31.03.18: (Refer Table 3.3 of the Analysis Sheet). The State had 29011.99 MTs unspent balance of food grain as on 31.03.2018, which is 10% of the annual allocation. 14 districts had reported negative closing balance of foodgrains as on 31.03.2018. However 14 districts repotted positive closing balance in the range of 17% to 160% foodgrains of the annual allocation. Such a huge unutilized food grain indicates that the either there were interruptions in the scheme or the scheme was not implemented properly in these districts. State needs to look into the reasons of having more than 100% of unutilized of foodgrains in some districts.
2.2.3 Availability of Food grains: (01.04.17 to 31.03.18) (Refer Table 3.5 of the Analysis sheet).
The State Government Lifted 260564.80 MTs of food grain from Food Corporation of India. The State had unutilized food grain of 29457.14 MTs with it at the beginning of the year. Thus the total availability of food grain with the State was 290021.94 MTs which the 99% of the annual allocation of food grains to the State during 2017-18. An analysis of district wise availability of food grains as on 31.03.2018 in 34 district reported the availably of food grains more than 100% up to 255%. The State needs to look into the huge availability of food grains in the districts viz Badaun (118%), Lalitpur (119%), bulandshahar(120%, Shrawasti(171%), Ambedkar nagar (253%) and Jalaun (255%)
2.2.4 Utilization of food grains: (Refer Table 3.7 of the Analysis sheet)
The State utilized 261009.95 MTs (89%) of food grains against the allocation of 293541.86 MTs. The
analysis indicates that low utilization of food grains was found in the districts namely
Aligarh(74%), Sambhal(76%), Ballia, Lakhimpur Kheri & Ghaziabad (77%) and in Azamgarh
(78%) against the allocated quantity of food grains. The State should examine the reasons of
low utilization of food grains by these districts. 2.2.5 Payment of cost of foodgrains to FCI: (Refer Table 3.9 of the Analysis sheet) The FCI has submitted bills for Rs. 11285.80 lakh during 2017-18 towards cost of food grains. The State has made payment of Rs.10159.08 lakh (90%) to FCI. Thus the total outstanding of the financial year is Rs. 1126.72 lakh which is yet to be cleared by the state. As per the FCI statement the total outstanding bills during 2017-18 Rs.1991.38 lakh as on 31.03.2018 The State is requested to look urgently make all the payment to FCI. 2.3 COOKING COST (PRIMARY + UPPER PRIMARY)
2.3.1 Level of Opening balance as on 01.04.17: (Refer Table 4.1.1 of the Analysis Sheet) The State had Rs. 9191.93 lakh opening balance as on 01.04.2017. The district wise analysis of opening balance of cooking cost as on 1.04.17 shows that in 19 districts reported negative opening balance at the beginning of the year and in the 3 districts Ghaziabad Chitrakoot and Hathras reported (0%) opening balance. However 3 district Faizabad (31%), Sitapur (43% and Lalitpur (54%) reported more than 30% opening balance in the beginning of the year. With negative balance or Zero OB of cooking cost how the meals were cooked and served? The State is requested to look into the issue
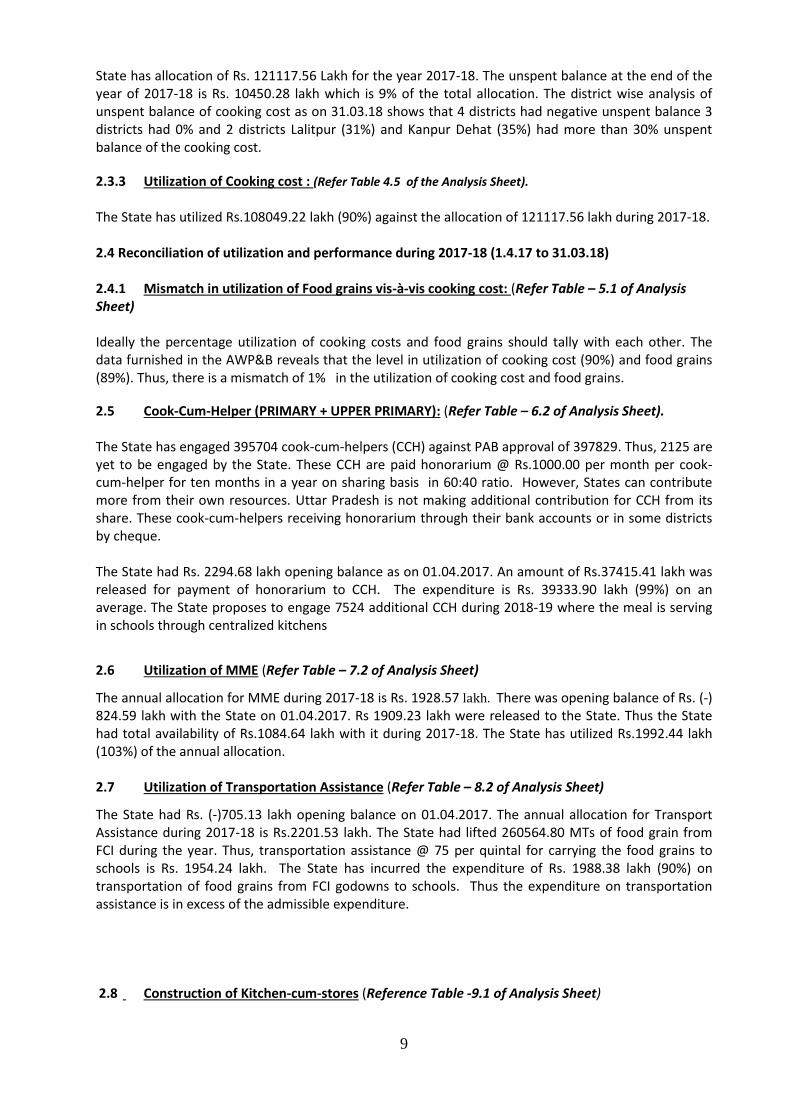
2.3.2 Level of closing balance as on 31.03.2018 : (Refer Table 4.1.2 of the Analysis Sheet)
9
State has allocation of Rs. 121117.56 Lakh for the year 2017-18. The unspent balance at the end of the year of 2017-18 is Rs. 10450.28 lakh which is 9% of the total allocation. The district wise analysis of unspent balance of cooking cost as on 31.03.18 shows that 4 districts had negative unspent balance 3 districts had 0% and 2 districts Lalitpur (31%) and Kanpur Dehat (35%) had more than 30% unspent balance of the cooking cost.
2.3.3 Utilization of Cooking cost : (Refer Table 4.5 of the Analysis Sheet).
The State has utilized Rs.108049.22 lakh (90%) against the allocation of 121117.56 lakh during 2017-18.
2.4 Reconciliation of utilization and performance during 2017-18 (1.4.17 to 31.03.18) 2.4.1 Mismatch in utilization of Food grains vis-à-vis cooking cost: (Refer Table – 5.1 of Analysis Sheet) Ideally the percentage utilization of cooking costs and food grains should tally with each other. The data furnished in the AWP&B reveals that the level in utilization of cooking cost (90%) and food grains (89%). Thus, there is a mismatch of 1% in the utilization of cooking cost and food grains.
2.5 Cook-Cum-Helper (PRIMARY + UPPER PRIMARY): (Refer Table – 6.2 of Analysis Sheet). The State has engaged 395704 cook-cum-helpers (CCH) against PAB approval of 397829. Thus, 2125 are yet to be engaged by the State. These CCH are paid honorarium @ Rs.1000.00 per month per cook-cum-helper for ten months in a year on sharing basis in 60:40 ratio. However, States can contribute more from their own resources. Uttar Pradesh is not making additional contribution for CCH from its share. These cook-cum-helpers receiving honorarium through their bank accounts or in some districts by cheque. The State had Rs. 2294.68 lakh opening balance as on 01.04.2017. An amount of Rs.37415.41 lakh was released for payment of honorarium to CCH. The expenditure is Rs. 39333.90 lakh (99%) on an average. The State proposes to engage 7524 additional CCH during 2018-19 where the meal is serving in schools through centralized kitchens
2.6 Utilization of MME (Refer Table – 7.2 of Analysis Sheet)
The annual allocation for MME during 2017-18 is Rs. 1928.57 lakh. There was opening balance of Rs. (-) 824.59 lakh with the State on 01.04.2017. Rs 1909.23 lakh were released to the State. Thus the State had total availability of Rs.1084.64 lakh with it during 2017-18. The State has utilized Rs.1992.44 lakh (103%) of the annual allocation.
2.7 Utilization of Transportation Assistance (Refer Table – 8.2 of Analysis Sheet)
The State had Rs. (-)705.13 lakh opening balance on 01.04.2017. The annual allocation for Transport Assistance during 2017-18 is Rs.2201.53 lakh. The State had lifted 260564.80 MTs of food grain from FCI during the year. Thus, transportation assistance @ 75 per quintal for carrying the food grains to schools is Rs. 1954.24 lakh. The State has incurred the expenditure of Rs. 1988.38 lakh (90%) on transportation of food grains from FCI godowns to schools. Thus the expenditure on transportation assistance is in excess of the admissible expenditure.
2.8 Construction of Kitchen-cum-stores (Reference Table -9.1 of Analysis Sheet)

10
Central assistance of Rs. 75000.66 Lakhs has been released for construction of Kitchen-cum-Stores in 122572 schools during 2006 -07 to 2017-18. No additional kitchen-cum-stores was sanctioned to the State from 2010-11 till 2017-18. Out of 122572 Kitchen-cum-Stores sanctioned, 112803 (92%) Kitchen sheds have been constructed. State Government during appraisal informed that 361 units will be constructed as per plinth area norms and State schedule rates. The remaining 9392 kitchen-cum-store and their corresponding central assistance amounting to Rs. 7723.22 lakh are proposed to be surrendered during 2018-19 as there is no demand from districts. 2.9 Procurement of Kitchen devices (Reference Table -9.4 of Analysis sheet) The non-recurring central assistance of Rs. 9143.75 lakh was released during 2006-07 to 2014-15 for the procurement of kitchen devices in 182875 schools @ Rs. 5000/- each school. The State has utilized Rs. 8798.90 lakh entire non-recurring central assistance for the procurement of sanctioned 175838 kitchen devices. The State Government could not utilize Rs 351.85 lakh for procurement 7037 kitchen devices till 2017-18. State is requested to procure all sanctioned Kitchen Devices. Non recurring central assistance of Rs. 7220.15 lakh was released during 2012-13 and 2015-16 for the replacement of kitchen devices in 144403 schools. The State has utilized Rs. 6391.50 lakh non-recurring central assistance for the replacement 127830 sanctioned kitchen devices ie. State could not utilized Rs. 828.65 lakh for replacement of 16573 kitchen devices. The State may utilize the remaining central assistance for replacing kitchen devices in 16573 schools during 2018-19.
3. Data Entry Status on the MIS Web Portal
3.1 Annual Data Entry:
S. No. District Total
Schools Completed (Saved) Pending
1 AGRA 2746 2731 99%
2 ALIGARH 2493 2443 98%
3 ALLAHABAD 3886 3840 99%
4 AMBEDKAR NAGAR 2031 2031 100%
5 AMETHI 1919 1607 84%
6 AMROHA 1618 1618 100%
7 AURAIYA 1652 1644 100%
8 AZAMGARH 3303 3298 100%
9 BAGHPAT 743 743 100%
10 BAHRAICH 3504 3504 100%
11 BALLIA 2623 2572 98%
12 BALRAMPUR 2296 2296 100%
13 BANDA 2011 2011 100%
14 BARABANKI 3050 3050 100%
15 BAREILLY 2971 2881 97%
16 BASTI 2535 2535 100%
17 BHADOHI 1141 1125 99%
18 BIJNOR 2700 2700 100%
19 BUDAUN 2491 2385 96%
20 BULANDSHAHR 2483 2434 98%
21 CHANDAULI 1546 1546 100%
22 CHITRAKOOT 1477 1469 99%
23 DEORIA 2837 2837 100%
24 ETAH 2030 2030 100%
25 ETAWAH 1884 1884 100%
26 FAIZABAD 2146 2146 100%

11
S. No. District Total
Schools Completed (Saved) Pending
27 FARRUKHABAD 1988 1988 100%
28 FATEHPUR 2816 2816 100%
29 FIROZABAD 2071 2063 100%
30 GAUTAM BUDDHA NAGAR 738 727 99%
31 GHAZIABAD 674 674 100%
32 GHAZIPUR 2786 2781 100%
33 GONDA 3049 3010 99%
34 GORAKHPUR 3003 3003 100%
35 HAMIRPUR - U.P. 1231 1231 100%
36 HAPUR 701 701 100%
37 HARDOI 3692 3670 99%
38 HATHRAS 1600 1600 100%
39 JALAUN 1927 1927 100%
40 JAUNPUR 3178 3145 99%
41 JHANSI 1856 1856 100%
42 KAASGANJ 1465 1441 98%
43 KANNAUJ 1777 1716 97%
44 KANPUR DEHAT 2349 2308 98%
45 KANPUR NAGAR 2464 2417 98%
46 KAUSHAMBI 1425 1407 99%
47 KUSHINAGAR 2887 2887 100%
48 LAKHIMPURKHERI 3723 3723 100%
49 LALITPUR 1560 1560 100%
50 LUCKNOW 2003 1990 99%
51 MAHARAJGANJ 2150 2150 100%
52 MAHOBA 1054 1054 100%
53 MAINPURI 2043 1974 97%
54 MATHURA 1842 1842 100%
55 MAU 1713 1704 99%
56 MEERUT 1470 1357 92%
57 MIRZAPUR 2306 2282 99%
58 MORADABAD 1853 1783 96%
59 MUZAFFARNAGAR 1293 1261 98%
60 PILIBHIT 1843 1843 100%
61 PRATAPGARH 2922 2922 100%
62 RAE BARELI 2013 2013 100%
63 RAMPUR 1984 1984 100%
64 SAHARANPUR 2064 2064 100%
65 SAMBHAL 1520 1520 100%
66 SANTKABIR NAGAR 1590 1577 99%
67 SHAHJAHANPUR 3272 3272 100%
68 SHAMLI 759 758 100%
69 SHRAWASTI 1295 1295 100%
70 SIDDHARTHNAGAR 2646 2486 94%
71 SITAPUR 4183 4183 100%
72 SONBHADRA 2331 2287 98%
73 SULTANPUR 2443 2443 100%
74 UNNAO 3064 3064 100%
75 VARANASI 1451 1440 99%
Total 162183 160559 99%
3.3 Monthly Data Entry
Sl.No. District Percentage (%) Montly data entry status : 2017-18
Average Apr-17
May-17
Jun-17
Jul-17
Aug-17
Sep-17
Oct-17
Nov-17
Dec-17
Jan-18
Feb-18
Mar-18

12
Sl.No. District
Percentage (%) Montly data entry status : 2017-18
Average Apr-17
May-17
Jun-17
Jul-17
Aug-17
Sep-17
Oct-17
Nov-17
Dec-17
Jan-18
Feb-18
Mar-18
1 AGRA 95 95 95 95 95 95 90 89 80 73 56 34 83
2 ALIGARH 100 100 100 100 100 100 100 100 100 100 100 99 100
3 ALLAHABAD 97 97 97 97 97 96 95 92 92 72 62 56 87
4 AMBEDKAR NAGAR 100 100 100 100 100 100 100 100 100 100 100 99 100
5 AMETHI 100 100 100 100 100 100 100 100 100 100 100 98 100
6 AMROHA 100 100 100 100 100 100 100 100 100 100 100 100 100
7 AURAIYA 100 100 100 100 100 100 100 100 100 100 100 100 100
8 AZAMGARH 99 99 99 99 99 99 99 99 99 95 94 87 98
9 BAGHPAT 100 100 100 100 100 100 100 100 100 100 95 90 99
10 BAHRAICH 100 100 100 100 100 100 100 100 100 100 99 95 99
11 BALLIA 98 98 98 97 97 97 97 95 95 73 60 52 88
12 BALRAMPUR 100 100 100 100 100 100 100 100 100 100 100 97 100
13 BANDA 100 100 100 100 100 100 100 100 100 100 100 100 100
14 BARABANKI 91 90 90 90 90 90 90 64 59 58 58 43 76
15 BAREILLY 99 99 99 99 99 99 99 99 98 98 90 89 97
16 BASTI 100 100 100 100 100 100 100 100 100 100 100 100 100
17 BHADOHI 100 100 100 100 100 100 100 100 100 100 100 99 100
18 BIJNOR 100 100 100 100 100 100 100 100 100 100 100 100 100
19 BUDAUN 87 87 87 84 84 84 83 81 80 60 58 55 78
20 BULANDSHAHR 99 99 99 99 99 99 99 99 90 73 43 26 85
21 CHANDAULI 97 97 97 97 97 97 97 97 97 97 97 93 97
22 CHITRAKOOT 100 100 100 100 100 100 100 100 100 100 97 88 99
23 DEORIA 100 100 100 100 100 100 100 100 100 100 100 100 100
24 ETAH 100 100 100 100 100 100 100 100 100 100 100 100 100
25 ETAWAH 100 100 100 100 100 100 100 100 100 100 100 100 100
26 FAIZABAD 99 99 99 99 99 99 99 99 99 96 95 95 98
27 FARRUKHABAD 100 100 100 100 100 100 100 100 100 100 100 100 100
28 FATEHPUR 100 100 100 100 100 100 100 100 100 100 100 99 100
29 FIROZABAD 100 100 100 100 100 100 100 100 99 99 99 97 100
30 GAUTAM BUDDHA NAGAR 100 100 100 100 100 100 100 100 100 100 100 100 100
31 GHAZIABAD 100 100 100 100 100 100 100 100 100 100 100 99 100
32 GHAZIPUR 100 100 100 100 100 100 100 100 100 99 99 98 100
33 GONDA 100 100 100 100 100 100 100 99 99 99 98 97 99
34 GORAKHPUR 100 100 100 100 100 100 100 100 100 100 100 100 100
35 HAMIRPUR - U.P. 100 100 100 100 100 100 100 100 100 100 100 98 100
36 HAPUR 100 100 100 100 100 100 100 100 100 100 100 100 100
37 HARDOI 100 100 100 100 100 100 100 100 100 100 100 100 100
38 HATHRAS 100 100 100 100 100 100 100 100 100 100 100 90 99
39 JALAUN 100 100 100 100 100 100 100 100 100 100 100 100 100
40 JAUNPUR 95 95 95 95 94 94 91 90 84 63 23 18 78
41 JHANSI 100 100 100 99 99 99 99 99 96 94 90 66 95
42 KAASGANJ 99 99 99 99 99 98 98 97 97 95 94 65 95
43 KANNAUJ 93 93 92 92 92 92 92 91 86 73 46 32 81
44 KANPUR DEHAT 99 99 99 99 99 99 99 99 99 98 87 72 96
45 KANPUR NAGAR 99 99 99 99 99 99 98 98 98 98 98 98 99
46 KAUSHAMBI 98 96 89 80 80 80 80 79 76 69 43 29 75
47 KUSHINAGAR 100 100 100 100 100 100 100 100 100 99 99 99 100
48 LAKHIMPURKHERI 100 100 100 100 100 100 100 100 100 100 100 100 100
49 LALITPUR 100 100 100 100 100 100 100 99 99 87 65 63 93
50 LUCKNOW 97 97 97 97 97 97 97 97 97 86 65 35 88
51 MAHARAJGANJ 100 100 100 100 100 100 100 100 100 80 60 51 91
52 MAHOBA 100 100 100 100 100 100 100 100 100 84 82 76 95
53 MAINPURI 58 55 55 54 54 53 53 53 53 52 11 0 46
54 MATHURA 100 100 100 100 100 100 100 100 100 100 100 57 96
55 MAU 98 98 98 98 98 95 95 94 94 75 61 60 89
56 MEERUT 83 82 82 82 82 82 76 75 73 58 41 40 71
57 MIRZAPUR 99 99 99 99 99 99 99 99 99 99 99 95 99
58 MORADABAD 100 100 100 100 100 100 100 100 100 100 100 100 100
59 MUZAFFARNAGAR 100 100 100 100 100 100 100 100 100 100 100 100 100
60 PILIBHIT 98 98 98 98 98 98 95 90 84 52 51 25 82
61 PRATAPGARH 100 100 100 100 100 100 100 99 99 98 98 98 99
62 RAE BARELI 94 94 94 94 94 94 94 92 92 92 91 90 93
63 RAMPUR 100 100 100 100 100 100 100 100 100 99 94 71 97
64 SAHARANPUR 100 100 100 100 100 100 100 100 100 100 100 100 100
65 SAMBHAL 100 100 100 100 100 100 100 100 100 100 100 100 100
13
Sl.No. District
Percentage (%) Montly data entry status : 2017-18
Average Apr-17
May-17
Jun-17
Jul-17
Aug-17
Sep-17
Oct-17
Nov-17
Dec-17
Jan-18
Feb-18
Mar-18
66 SANTKABIR NAGAR 100 100 100 100 100 100 100 100 100 100 100 100 100
67 SHAHJAHANPUR 100 100 100 100 100 100 100 100 100 100 91 86 98
68 SHAMLI 100 100 100 100 100 100 100 100 100 100 100 100 100
69 SHRAWASTI 100 100 100 100 100 100 100 100 100 100 100 100 100
70 SIDDHARTHNAGAR 96 96 96 95 95 95 94 94 80 67 67 66 87
71 SITAPUR 100 100 100 100 100 100 92 76 74 59 57 55 84
72 SONBHADRA 99 99 99 99 99 99 99 99 99 78 77 75 94
73 SULTANPUR 100 100 100 100 100 100 100 100 100 100 100 100 100
74 UNNAO 100 100 100 100 100 100 100 100 100 100 100 100 100
75 VARANASI 99 99 99 99 99 99 99 99 99 98 97 95 98
Total 98 98 98 98 98 98 97 96 95 90 85 80 94
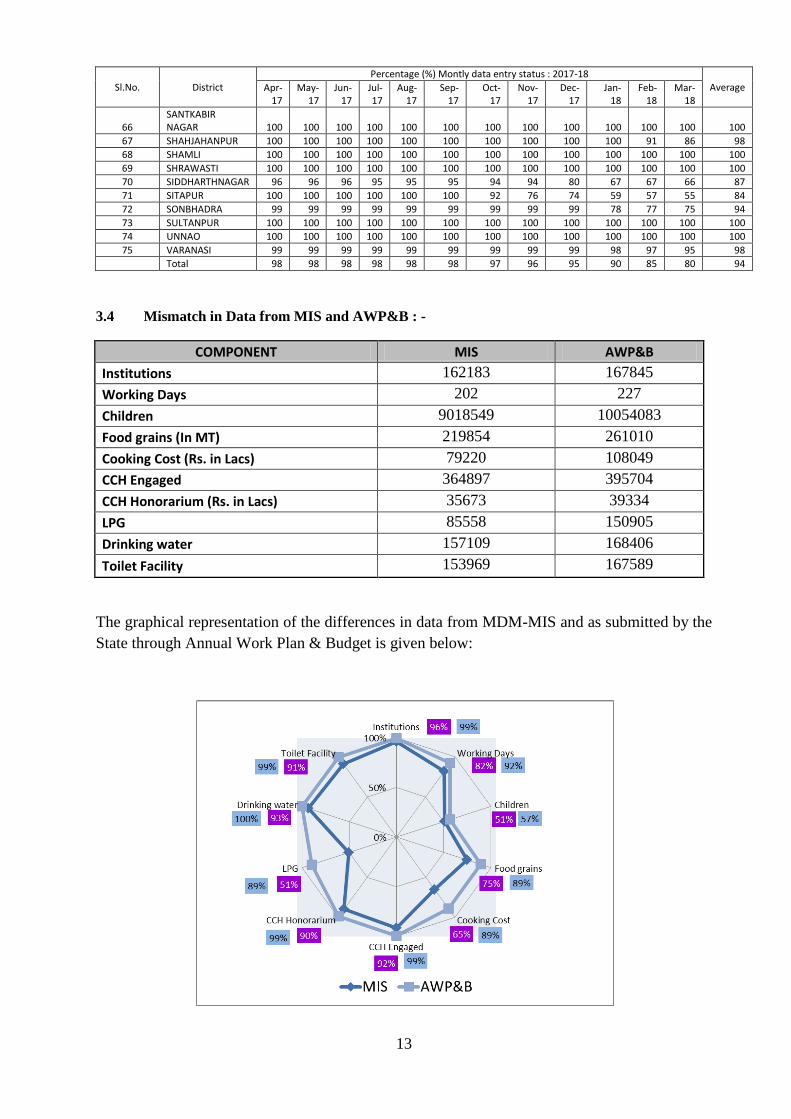
3.4 Mismatch in Data from MIS and AWP&B : -
COMPONENT MIS AWP&B
Institutions 162183 167845
Working Days 202 227
Children 9018549 10054083
Food grains (In MT) 219854 261010
Cooking Cost (Rs. in Lacs) 79220 108049
CCH Engaged 364897 395704
CCH Honorarium (Rs. in Lacs) 35673 39334
LPG 85558 150905
Drinking water 157109 168406
Toilet Facility 153969 167589
The graphical representation of the differences in data from MDM-MIS and as submitted by the
State through Annual Work Plan & Budget is given below:
14
The above chart shows mismatch in the data under AWP&B-2018-19 and MIS in respect of
number of Cook-cum-helpers engaged (7%), payment of honorarium to Cook-cum-helpers
(9%), working days (10%), Cooking cost (24%) and food grains utilization (14%). The State is
advised to reconcile the data.
4. Fund Flow
The State government makes budgetary provision for different objects and grants and nodal
department of the state government releases financial sanctions directly to the District
Collectors. The district collectors draw funds according to their requirements from district
treasuries and send directly to Madhyan Bhojan Nidhi in the schools of rural areas; and in urban
areas Nagar Nigams, Nagar Palika, Nagar Panchayats, town areas, FCI and Transportation
agencies etc, as the case may be. In urban areas where NGO‟s are in operation, the conversion
cost is given to them according to the bills raised by them after verification from the education
department. MME fund is sent through RTGS to districts who sent to the schools through
NEFT.
The status of release of funds is as under:
Instalment Date of receipt by
State
District
Authorities
MDM Nidhi of
schools
Ad-hoc release 27.04.2017 18.05.2017 Within a month
Balance of first
instalment
13.07.2017 24.08.2017
2nd
Instalment 01.12.2017 09.01.2018
Balance of 2nd
Instalment
26.12.2017 08.03.2018
Timely release of funds is ensured from the state level to school level through district via e-
transfer mechanism. Sometimes procedural delay occurs only. Instructions have been issued to
the implementing agencies/institutions to run the scheme from the available resources, which
thereafter, are reimbursed from the routine budget.
5. Management Structure
In Uttar Pradesh Basic Education Department is a nodal department for rimplementing Mid-Day
Meal Scheme. Mid-Day Meal Authority with proper staff has been constituted in 2006 to act as
a Nodal body at State level for implementing the MDM Scheme. District Magistrates have been
designated as the Nodal Officer of this scheme at District level. For frequent & effective
supervision of MDM scheme in Schools, various MDM Task forces have been formed at
District & Block level under the leadership of District Magistrate & Sub Divisional Magistrate
respectively. The Task Forces comprise of officers from the Education department as well as
other departments. At Divisional & District level, MDM cells have been established, in the
office of Asst. Director (Basic)/District Basic Education Officer respectively. There is one
Coordinator & one Computer Operator appointed on contractual basis in MDM cells. At the
school level Mid Day Meal is provided mostly through Gram Panchayats in rural areas. In urban
15
areas, the Ward Members & NGOs are responsible for providing MDM. The official
(accountants and computer operators) at block level made available under SSA have been
instructed to work for MDM scheme too. An innovative mechanism of IVRS based monitoring
system has been deployed to take information directly from schools on daily basis.
The Annual Work Plan and Budget 2017-18 has been prepared on the basis of bottom up
approach. For this purpose MDM Authority made available AWP&B formats formulated by
GOI to all districts. Detailed guidelines were issued to all districts for filling the AWP&B
formats with the help of block and school level authority. The district level authority collected
these data from block/school level. The divisional & district co-ordinators have also been
trained at the workshop regarding AWP&B 2017-18 organized by mid-day meal authority.
District coordinators were called at the authority to present their respective plan after which the
final plan was submitted. The information of allotment of budget and food grain has taken from
the sanction received from Government of India and released by state to districts. The
requirement of food grains & budget for the year 2017-18 has been estimated on the basis of
maximum average availing children in a quarter between the period of three quarters (Apr-Jun
2016, Jul-Sep 2016 and Oct-Dec 2016) in Primary Schools and Upper Primary schools given by
district authorities in prescribed formats. The number of working days expected for the year
2017-18 is 236 for PS/UPS and 310 for STC
6. Capacity Building
In Uttar Pradesh, there are about 4 lakh cook-cum helpers working in mid-day meal scheme.
Due to the compulsory provision of guardians of student to be selected as cook-cum helper, a
large number of cook-cum helpers change every year. Most of the cook-cum helpers are not
literate. Therefore, for the training purpose of cook-cum helpers a short film named “Poshana”
is developed by MDMA with the help of UNICEF. Keeping in mind the sensitivity of mid day
meal scheme, the major aspects of the scheme such as hygiene and safety measures, nutrition,
inclusion, social equity etc. are included in the film. Since a majority of the cooks are not
literate enough, this audio visual method of training is adopted. Also, this training film shall be
used again and again to train the changed cooks over the years.
7. Grievance Redressal Mechanism
On receipt of any Grievance, MDM Authority obtains the report form district level. After
scrutinizing that report, authority instructs the district level administration for taking remedial
action. In many cases, the grievances are solved at district/block level by district/block
authorities. For this purpose a Toll Free Number 1800-4190-102 is also established at Mid Day
Meal Authority. Complaints regarding Mid day meal not being cooked regularly and quality of
food are mostly received through toll free number. Necessary actions are taken by the district
authorities to stop the interruptions caused in regular supply of Mid day Meal and accordingly
the issues are addressed.
8. Tasting of Meal
Instructions have been issued for the food to be tasted by the teachers/Gram Pradhan and
one or two of the parent, and when they certify that the food is palatable, delicious and harmless
it is to be given to the children
16
9. Testing of Meal by accredited labs
There are 05 functional FDA laboratories in UP in Lucknow, Varanasi, Agra, Gorakhpur and
Meerut. The samples collected by the Food Safety Officers are tested in these FDA laboratories.
1679 samples have been randomly collected and 1394 sample tested in laboratories, out of
which only 03 samples were found substandard, for which necessary actions were taken by the
district authorities. 10. Monitoring through Community Participation:
To ensure community participation in the scheme, "Mata Abhibhavak Sanghs" have been
formed in the schools, so that they can supervise the cooking process and taste the food also. To
ensure good quality of food being served to children in schools, it is mandatory that the cooks
engaged for cooking mid day meal in school should be the parent of any child studying in that
school. A Toll-Free Number 1800-419-0102 has been circulated so that people could directly
inform about any interruption to Mid-Day meal Authority. School Management Committee
(SMCs) have been constituted under the RTE rules and are being involved in the monitoring of
the scheme. “MAA Samuh” have also been created in all schools, under which a group of 6
mothers is formed and they regularly visit the schools according to their roaster and supervise
the food being cooked and served to the students
12. Rashtriya Bal Swasthya Karyakaram (RBSK)
All children in the age group 2-18 are covered under RBSK. Under this programme, general
health checkup, eye checkup, recording of height and weight, distribution of iron and folic acid
tablets as well as de-worming tablets and referral of seriously ill children to health centers is
being done by the health professionals. This programme is conducted twice in a year. Health
Check up was carried out for 11213817 children in 167877 schools, Weekly Iron Folic Acid
tablets and de-worming tablets were distributed to 11213817 children in 167877 schools and
139792 spectacles were distributed in 167877 schools.
13. Aadhaar Enrolment:
11931870 students have been enrolled under Aadhar. 2167852 students have applied for
Aadhar enrolment. 3583566 students are yet to be registered under Aadhar. 11925 proxy
students have been deleted.
14. Kitchen Gardens
Kitchen gardens have been set up in 2226 schools at present and the work is in progress in 1372
schools. The State proposes to set up kitchen gardens in 28671 schools during 2018-19.
15. Water filtration facilities Safe drinking water is available in 168561 schools. However 1117 schools having facilities of
water filteration, 840 schools having RO, 79 schools UF, 2 schools have UV, 144 candle filter
purifier, 52 schools activated carbon filter.
--oOo--
Part : C - State Govt.’s Proposals for 2018-19 and PAB -MDM Approvals for 2017-18
17
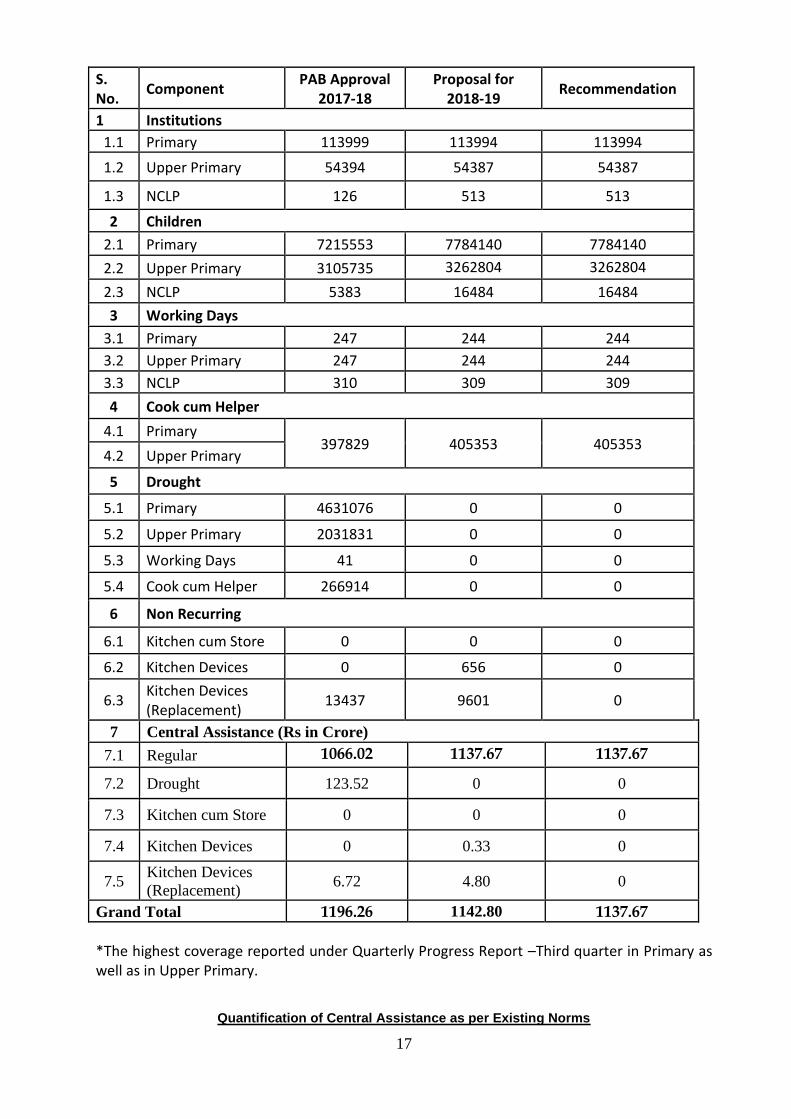
S. No.
Component PAB Approval
2017-18 Proposal for
2018-19 Recommendation
1 Institutions
1.1 Primary 113999 113994 113994
1.2 Upper Primary 54394 54387 54387
1.3 NCLP 126 513 513
2 Children
2.1 Primary 7215553 7784140 7784140
2.2 Upper Primary 3105735 3262804 3262804
2.3 NCLP 5383 16484 16484
3 Working Days
3.1 Primary 247 244 244
3.2 Upper Primary 247 244 244
3.3 NCLP 310 309 309
4 Cook cum Helper
4.1 Primary 397829 405353 405353
4.2 Upper Primary
5 Drought
5.1 Primary 4631076 0 0
5.2 Upper Primary 2031831 0 0
5.3 Working Days 41 0 0
5.4 Cook cum Helper 266914 0 0
6 Non Recurring
6.1 Kitchen cum Store 0 0 0
6.2 Kitchen Devices 0 656 0
6.3 Kitchen Devices (Replacement)
13437 9601 0
7 Central Assistance (Rs in Crore)
7.1 Regular 1066.02 1137.67 1137.67
7.2 Drought 123.52 0 0
7.3 Kitchen cum Store 0 0 0
7.4 Kitchen Devices 0 0.33 0
7.5 Kitchen Devices
(Replacement) 6.72 4.80 0
Grand Total 1196.26 1142.80 1137.67
*The highest coverage reported under Quarterly Progress Report –Third quarter in Primary as well as in Upper Primary.
Quantification of Central Assistance as per Existing Norms
18
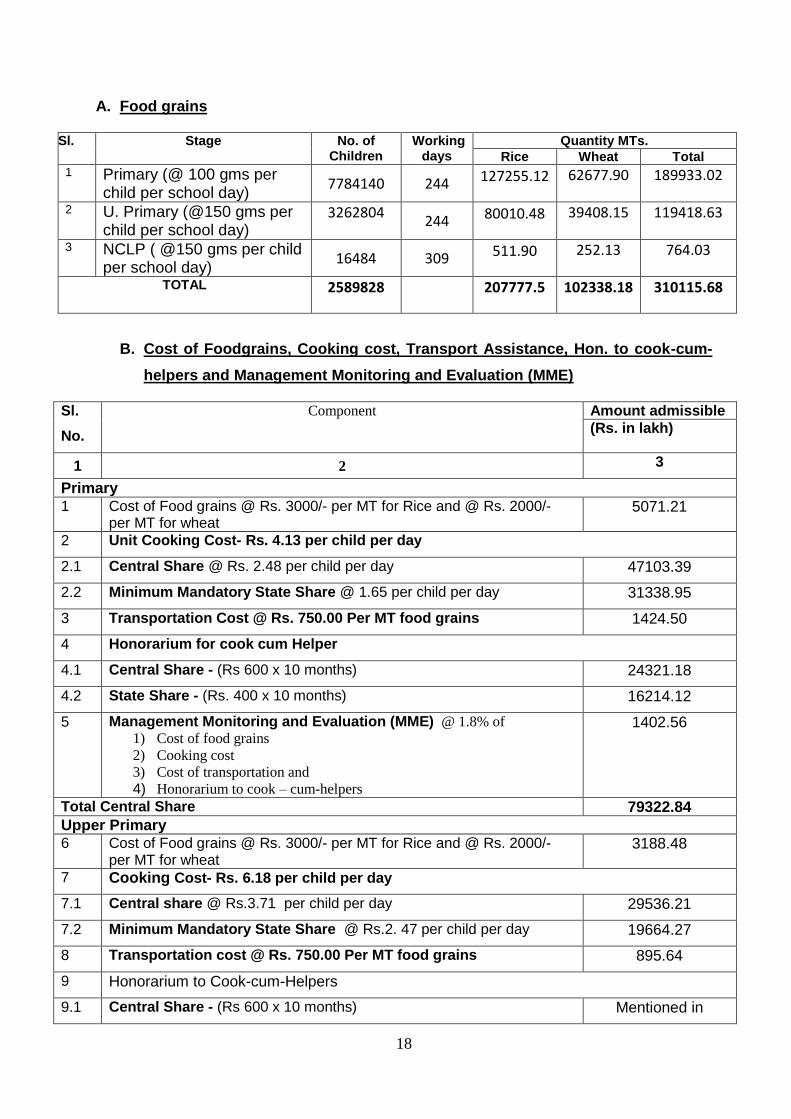
A. Food grains
Sl. Stage No. of Children
Working days
Quantity MTs.
Rice Wheat Total 1 Primary (@ 100 gms per
child per school day) 7784140 244 127255.12 62677.90 189933.02
2 U. Primary (@150 gms per child per school day)
3262804 244 80010.48 39408.15 119418.63
3 NCLP ( @150 gms per child per school day)
16484 309 511.90 252.13 764.03
TOTAL 2589828 207777.5 102338.18 310115.68
B. Cost of Foodgrains, Cooking cost, Transport Assistance, Hon. to cook-cum-
helpers and Management Monitoring and Evaluation (MME)
Sl.
No.
Component Amount admissible
(Rs. in lakh)
1 2 3
Primary 1 Cost of Food grains @ Rs. 3000/- per MT for Rice and @ Rs. 2000/-
per MT for wheat 5071.21
2 Unit Cooking Cost- Rs. 4.13 per child per day
2.1 Central Share @ Rs. 2.48 per child per day 47103.39
2.2 Minimum Mandatory State Share @ 1.65 per child per day 31338.95
3 Transportation Cost @ Rs. 750.00 Per MT food grains 1424.50
4 Honorarium for cook cum Helper
4.1 Central Share - (Rs 600 x 10 months) 24321.18
4.2 State Share - (Rs. 400 x 10 months) 16214.12
5 Management Monitoring and Evaluation (MME) @ 1.8% of
1) Cost of food grains
2) Cooking cost
3) Cost of transportation and
4) Honorarium to cook – cum-helpers
1402.56
Total Central Share 79322.84
Upper Primary 6 Cost of Food grains @ Rs. 3000/- per MT for Rice and @ Rs. 2000/-
per MT for wheat 3188.48
7 Cooking Cost- Rs. 6.18 per child per day
7.1 Central share @ Rs.3.71 per child per day 29536.21
7.2 Minimum Mandatory State Share @ Rs.2. 47 per child per day 19664.27
8 Transportation cost @ Rs. 750.00 Per MT food grains 895.64
9 Honorarium to Cook-cum-Helpers
9.1 Central Share - (Rs 600 x 10 months) Mentioned in

19
9.2 Minimum Mandatory State Share- (Rs. 400 x 10 months) primary
10 Management Monitoring and Evaluation (MME) @ 1.8% of
1) Cost of food grains
2) Cooking cost
3) Cost of transportation and
4) Honorarium to cook – cum-helpers
605.17
Total Central Share 34225.49
NCLP
11 Cost of Food grains @ Rs. 3000/- per MT for Rice and @ Rs. 2000/- per MT for wheat
20.40
12 Cooking Cost- Rs. 6.18 per child per day
12.1 Central share @ Rs.3.71 per child per day 188.97
12.2 Minimum Mandatory State Share @ Rs.2. 47 per child per day 125.81 13 Transportation cost @ Rs. 750.00 Per MT food grains 5.73 14 Management Monitoring and Evaluation (MME) @ 1.8% of
1) Cost of food grains
2) Cooking cost
3) Cost of transportation and
4) Honorarium to cook – cum-helpers
3.87
Total Central Share 218.97
Grand Total for Central Share (Pry + Upper Primary + NCLP) 113767.30
C. Non-recurring : NIL
D. Total Requirement of Funds for 2018-19
(Rs. in lakh)
Component Centre Share Minimum Mandatory State share
Recurring Normal 113767.30 67343.15
Drought 0 0
Non- recurring 0 0
Total 113767.30 67343.15
--oOo--