Embed Size (px)
Citation preview

Governor's Planning Council on Developmental Disabilities Minnesota State Planning Agency
300 Centennial Building 658 Cedar Street St. Paul, Minnesota 55155
INTERNATIONAL CENTER FOR THE DISABLED

Study No. 864009
THE ICD SURVEY II:
EMPLOYING DISABLED AMERICANS
A Nationwide Survey of 920 Employers
Conducted for
ICD-International Center for the Disabled
New York, New York
In Cooperation With
National Council on the Handicapped
and
The President's Committee on Employment
of the Handicapped
March 1987
Harris Survey Directors
Humphrey Taylor, President
Michael R. Kagay, Ph.D., Vice President
Stuart Leichenko, Research Associate
ICD Survey Staff
John B. Wingate Executive Director
Nina M. Hill, Ph.D. Survey Director
Thomas G. Mehnert, Assistant Survey Director
Mary E. Boyd Research Analyst
Sanders W. Davis, M.D., Medical Director
LOUIS HARRIS AND ASSOCIATES, INC.
New York, New York

The material in this project was prepared in part under Grant No. 90DD0133 from the Office of Human Development Services - U.S. Department of Health and Human Services; Grant No. 996339698-02 from the Employment and Training Administration - U.S. Department of Labor under the authority of Title III, part B of the Comprehensive Employment and Training Act of 1973, as amended; and Grant No. 12D70260-2-01 from Social Security Administration - U.S. Department of Health and Human Services.
Grantees undertaking such projects under Government sponsorship are encouraged to express freely their professional judgment. Therefore, points of view or opinions stated in this document do not necessarily represent the official position or policy of the U.S. Department of Labor or the U.S. Department of Health and Human Services.

FOREWORD AND ACKNOWLEDGMENTS FROM ICD
ICD-International Center for the Disabled, in cooperation with the
National Council on the Handicapped, and The President's Committee on
Employment of the Handicapped is proud to have made this survey possible.
This is the first major nationwide survey to study comprehensively employer
attitudes, policies and experiences pertaining to the hiring, training,
retention and job performance of disabled individuals. The survey also
focuses on a series of initiatives which could be taken by employers,
government, private rehabilitation agencies, foundations, and by disabled
citizens themselves to promote employment of individuals with disabilities.
The new survey is a follow-up study to the 1986 The ICD Survey of
Disabled Americans: Bringing Disabled Americans into the Mainstream.
This document identified "not working" as "the truest definition of what it
means to be disabled in the United States today." Two-thirds of disabled
persons between the ages of 16 and 64 are not working. Of these 12.4 million
people, 8.2 million want to work. We hope that the results of the new survey
will inform and guide policymakers and rehabilitation professionals in their
efforts to improve the employment status of disabled Americans.
A study of this magnitude required the commitment, dedication and
expert help of many individuals. We would particularly like to thank
Jeremiah Milbank, Jr. who perceived the need for a study of employment
issues arising from the findings of the first survey.

We would also like to thank the National Council on the Handicapped,
particularly Mrs. Sandra S. Parrino, Chairperson, Lex Frieden, Executive
Director and Ethel Briggs, Adult Services Specialist, for their invaluable
guidance. We owe much to The President's Committee on Employment of the
Handicapped, especially Harold Russell, Chairman and Jay Rochlin, Acting
Executive Director for their continued assistance.
We are grateful to the Office of Human Development Services - U.S.
Department of Health and Human Services; to the Employment and Training
Administration - U.S. Department of Labor; Social Security Administration -
U.S. Department of Health and Human Services; The President's Committee on
Employment of the Handicapped in cooperation with the Office of the Assistant
Secretary for Special Education and Rehabilitative Services - U.S. Department
of Education; The Leon Lowenstein Foundation, The Manufacturers Hanover Trust
Company, The Commonwealth Fund, The Hoffman LaRoche Foundation, General Mills,
Incorporated, 3M Corporation and E.I. duPont de Nemours & Company, Incorporated
for their support of this survey project.
Members of the ICD Survey Committee included John B. Wingate, Executive
Director of ICD, Nina M. Hill, Ph.D., Survey Director, Thomas G. Mehnert,
Assistant Survey Director, Mary E. Boyd, Research Analyst and
Sanders W. Davis, M.D., Medical Director of ICD.
We gratefully acknowledge the expertise contributed by distinguished
members of industry, rehabilitation, government and consumer advocacy in
the development of this survey. Their names are listed below. It has once
again been our pleasure to work with Louis Harris and Associates. As expected,
they have provided us with valuable insights into a critical issue affecting
the lives of disabled Americans.

Survey Advisors
Adrienne Asch Senior Human Rights Specialist New York State Division of Human Rights
New York, NY
C. William Bechman Director, Employee Relations ICD-International Center for
the Disabled New York, NY
Paul Ashton Member, The President's Committee
on Employment of the Handicapped Licensed Psychologist Assessment and Career Services 3M St. Paul, MN
Iwona Blazewski Employment Interviewer First Nationwide Bank New York, NY
Frank Bowe, Ph.D. Chairman, U.S. Congress Commission
on Education of the Deaf Washington, DC
Mary E. Boyd Research Analyst ICD-International Center for
the Disabled New York, NY
Jack Brauntuch Executive Director J.M. Foundation New York, NY
Ethel Briggs Adult Services Specialist National Council on the Handicapped Washington, DC
Robert L. Burgdorf, Jr. Research Specialist National Council on the Handicapped Washington, DC
James R. Campbell Consultant, The President's Committee
on Employment of the Handicapped New York, NY
Sanders W. Davis, M.D. Medical Director ICD-International Center for
the Disabled New York, NY
Richard Drach Member, The President's Committee
on Employment of the Handicapped Consultant Affirmative Action Section Employee Relations Department E.I. duPont de Nemours & Company, Inc. Wilmington, DE
Joe Easterday Research Associate Indiana University Bloomington, IN
Bessie Edwards Manager of Training and Development Paragon Cable-Manhattan New York, NY
Valerie Ellien, Ph.D. NYU Rehabilitation Counseling Department Employment Research & Training Center New York, NY
Sharon Feffer Employee Relations Manager Republic National Bank New York, NY
Elizabeth (Buffy) A. Fetter Consultant Marketing Research and Strategic Planning
Minneapolis, MN
Donna Fingerhut Director, Education and Training ICD-International Center for
the Disabled New York, NY
Frederick L. Francis Director of Marketing, Outreach
and Placement New York State Education Department Office of Vocational Rehabilitation Albany, NY

Lex Frieden Executive Director National Council on the Handicapped Washington, DC
Donald Galvin, Ph.D. Director of Strategic Planning National Rehabilitation Hospital Washington, DC
Thomas G. Garlock Former Director, Employee
Rehabilitation Service ICD-International Center for
the Disabled New York, NY
Joseph Greenblum Social Science Research Analyst Division of Disability Studies Social Security Administration Baltimore, MD
Paul G. Hearne Executive Director Just One Break, Incorporated New York, NY
Nina M. Hill, Ph.D. (Survey Director) Director, Clinical Services and Professional Education
ICD-International Center for the Disabled
New York, NY
Joan Hoeffel Rehabilitation Coordinator Xerox Corporation Webster, NY
Herbert Krauss, Ph.D. Director, Rehabilitation Research ICD-International Center for
the Disabled New York, NY
Elisa G. Lederer Director, Placement ICD-International Center for
the Disabled New York, NY
William T. Leonard Corporate Manager of Recruitment McGraw-Hill, Incorporated New York, NY
Patricia J. Livingston, Ph.D. Chair, Rehabilitation Counseling
Department New York University New York, NY
Michael I. Markowitz Director of Personnel The New School for Social Research New York, NY
Henry McCarthy, Ph.D. Louisiana State University School of Allied Health Professions Department of Rehabilitation Counseling
New Orleans, LA
Thomas G. Mehnert (Assistant Survey Director)
Director, Quality Assurance ICD-International Center for
the Disabled New York, NY
Jeremiah Milbank, Jr. Member, National Council on the Handicapped
President, ICD-International Center for the Disabled
New York, NY
Malcolm H. Morrison, Ph.D. Acting Director Division of Disability Studies Social Security Administration Baltimore, MD
Tom O'Bryant Chairman, Employer Committee The President's Committee
on Employment of the Handicapped Champion International Corporation Stamford, CT
Edward J. O'Malley Director, Personnel Department The Port Authority of New York
and New Jersey New York, NY
Sandra S. Parrino Chairperson National Council on the Handicapped Washington, DC

Paul A. Rivera, D.P.S. Manager of Corporate EEO and
Compliance Xerox Corporation Stamford, CT
Jay Rochlin Acting Executive Director The President's Committee on
Employment of the Handicapped Washington, DC
Bernard Rosenberg, M.A., CRC, NCC Director, Vocational Rehabilitation ICD-International Center for
the Disabled New York, NY
Barbara Ross Assistant Director, Employee Relations ICD-International Center for
the Disabled New York, NY
Ruth Ellen Ross Manager, Plans, Projects and Services The President's Committee on
Employment of the Handicapped Washington, DC
Harold Russell Chairman The President's Committee on Employment of the Handicapped
Washington, DC
Gail Schwartz Director, Institute for Rehabili
tation and Disability Management Washington Business Group on Health Washington, DC
David Vandergoot, Ph.D. Vice-President of Research Human Resources Center Albertson, NY
Donald Windey Vice-President, Human Resources Republic National Bank New York, NY
John B. Wingate Executive Director ICD-International Center for
the Disabled New York, NY
Harold E. Yuker, Ph.D. Psychology Department Hofstra University Hempstead, NY

CONTENTS
Page
INTRODUCTION 1 The Samples 3 Terminology 4 Notes on Reading the Tables 5 Public Release of Survey Findings 5 Project Responsibility 6
SURVEY HIGHLIGHTS 7 Employers' Experiences With Disabled Employees 7 The Cost of Employing and Accommodating Disabled People 9 Recent Hiring of Disabled People 10 Barriers to Increased Hiring of Disabled People 10 The Rehabilitation of Disabled Employees 13 What Companies Plan to Do in the Near Future 14 Managers Rate the Effectiveness of Proposed Policy Changes 14 Conclusions 16
CHAPTER 1: MANAGERS ASSESS DISABLED JOB APPLICANTS 17 Recruiting Efforts and Attitudes Toward Disabled Persons 17 E.E.O. and Line Managers Rate Disabled Job Applicants 21
CHAPTER 2: JOB DISCRIMINATION AND CIVIL RIGHTS LAWS 23 Job Discrimination Against Disabled People 23 Whether Civil Rights Laws Should Also Cover Disabled People.... 25
CHAPTER 3: HIRING POLICIES TOWARD DISABLED PEOPLE 27 Prevalence of Hiring Policies or Programs for Disabled People.. 27 Prevalence of Hiring Quotas for Disabled People 33 Screening Job Candidates for Disability 33 Self-Identification by Disabled Job Candidates and Employees... 33
CHAPTER 4: RECENT HIRING OF DISABLED PEOPLE 37 Percentage of Companies That Have Hired Disabled People in the Three Past Years and Past Year 37
How Disabled Employees Came to Their Companies 40 Reasons Why Disabled People Have Not Been Hired 42
CHAPTER 5: MANAGERS RATE THE JOB PERFORMANCE OF DISABLED EMPLOYEES 45 The Overall Performance of Disabled Employees 45 Disabled and Non-Disabled Employees Compared on Key Job Criteria 47
Promoting Disabled Employees 50 Supervision of Disabled Employees 53 Firing Disabled Employees 57 Perceptions Relating to the Employment of Disabled People 57
CHAPTER 6: THE COST OF EMPLOYING AND ACCOMMODATING DISABLED EMPLOYEES 60 The Average Cost of Employing Disabled People 60 Accommodations in the Workplace 62 The Cost of Accommodations 67 Reasons for Not Making Accommodations 70
(CONTINUED)

CONTENTS (CONTINUED)
Page
CHAPTER 7: COMPANIES' EXPERIENCES WITH TRAINING PROGRAMS FOR DISABLED EMPLOYEES 72
Job Initiatives and Programs for Disabled People 72 Training Disabled Employees In-House 75
CHAPTER 8: REHABILITATION OF EMPLOYEES WHO BECOME DISABLED 78 The Effects of Rehabilitation Efforts 78 Prevalence of Various Disability Management Programs 80 Potential Problems When Employees Return to Work 83 Managers' Attitudes Toward Rehabilitation 85
CHAPTER 9: THE LIKELIHOOD THAT COMPANIES WILL INCREASE EFFORTS TO HIRE DISABLED PEOPLE 89
Whether Companies Should Do More To Employ Disabled People.... 89 Top Management's Commitment to Employing Disabled People 92
CHAPTER 10: STEPS AND POLICY CHANGES TO INCREASE EMPLOYMENT OF DISABLED PEOPLE . 95
Steps for Public and Private Agencies to Take 95 The Perceived Effect of Increased Tax Deductions 97 Managers Rate the Effectiveness of Proposed Policy Changes.... 99
APPENDIX A: SURVEY METHOD 104 Sample Design 105 Interviewing 105 Questionnaires 106 Data Processing 106 Sampling Error 106
APPENDIX B: QUESTIONNAIRE 110
TABLES
Table Page
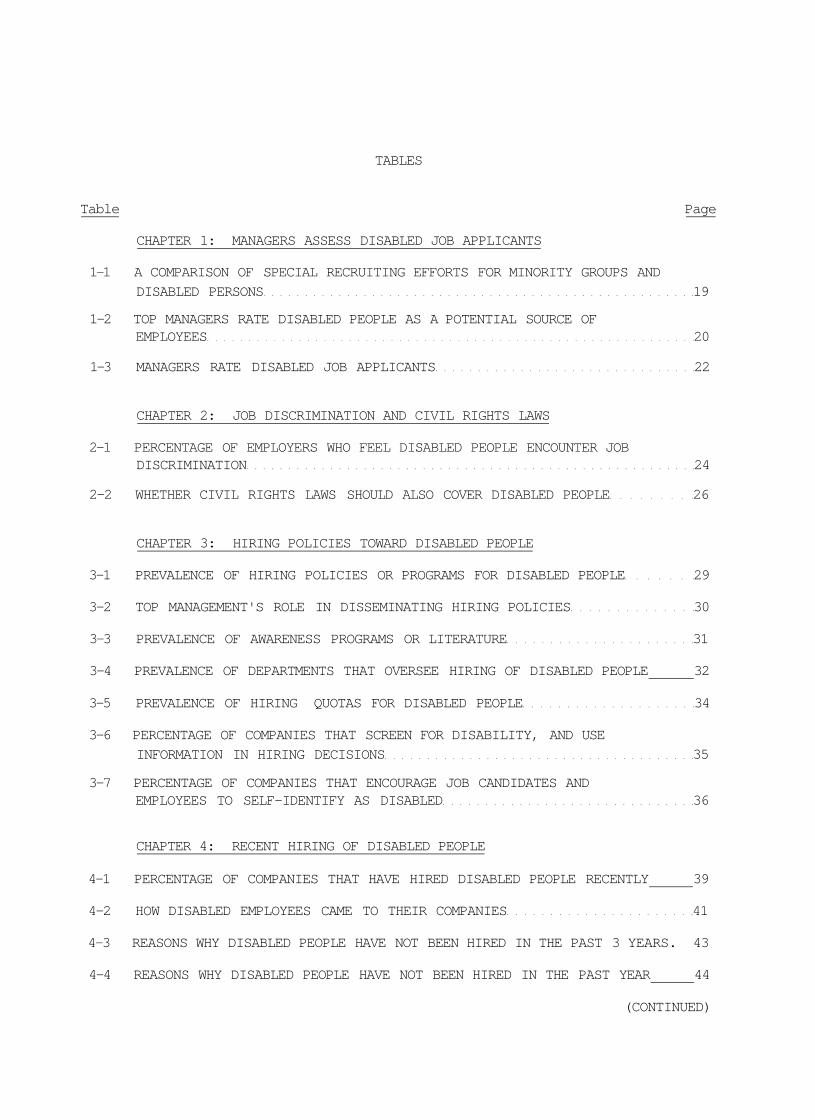
CHAPTER 1: MANAGERS ASSESS DISABLED JOB APPLICANTS
1-1 A COMPARISON OF SPECIAL RECRUITING EFFORTS FOR MINORITY GROUPS AND
DISABLED PERSONS 19
1-2 TOP MANAGERS RATE DISABLED PEOPLE AS A POTENTIAL SOURCE OF EMPLOYEES 20
1-3 MANAGERS RATE DISABLED JOB APPLICANTS 22
CHAPTER 2: JOB DISCRIMINATION AND CIVIL RIGHTS LAWS
2-1 PERCENTAGE OF EMPLOYERS WHO FEEL DISABLED PEOPLE ENCOUNTER JOB DISCRIMINATION 24
2-2 WHETHER CIVIL RIGHTS LAWS SHOULD ALSO COVER DISABLED PEOPLE 26
CHAPTER 3: HIRING POLICIES TOWARD DISABLED PEOPLE
3-1 PREVALENCE OF HIRING POLICIES OR PROGRAMS FOR DISABLED PEOPLE 29
3-2 TOP MANAGEMENT'S ROLE IN DISSEMINATING HIRING POLICIES 30
3-3 PREVALENCE OF AWARENESS PROGRAMS OR LITERATURE 31
3-4 PREVALENCE OF DEPARTMENTS THAT OVERSEE HIRING OF DISABLED PEOPLE 32
3-5 PREVALENCE OF HIRING QUOTAS FOR DISABLED PEOPLE 34
3-6 PERCENTAGE OF COMPANIES THAT SCREEN FOR DISABILITY, AND USE
INFORMATION IN HIRING DECISIONS 35
3-7 PERCENTAGE OF COMPANIES THAT ENCOURAGE JOB CANDIDATES AND EMPLOYEES TO SELF-IDENTIFY AS DISABLED 36
CHAPTER 4: RECENT HIRING OF DISABLED PEOPLE
4-1 PERCENTAGE OF COMPANIES THAT HAVE HIRED DISABLED PEOPLE RECENTLY 39
4-2 HOW DISABLED EMPLOYEES CAME TO THEIR COMPANIES 41
4-3 REASONS WHY DISABLED PEOPLE HAVE NOT BEEN HIRED IN THE PAST 3 YEARS. 43
4-4 REASONS WHY DISABLED PEOPLE HAVE NOT BEEN HIRED IN THE PAST YEAR 44
(CONTINUED)

TABLES (CONTINUED)
T a b l e Page
CHAPTER 5: MANAGERS RATE THE JOB PERFORMANCE OF DISABLED EMPLOYEES
5-1 MANAGERS RATE THE JOB PERFORMANCE OF DISABLED EMPLOYEES 46
5-2 MANAGERS COMPARE DISABLED AND NON-DISABLED EMPLOYEES ON KEY JOB CRITERIA 49
5-3 RATE OF PROMOTION: A COMPARISON OF DISABLED AND NON-DISABLED
EMPLOYEES 51
5-4 COMPANIES' SUCCESS AT PROMOTING DISABLED EMPLOYEES 52
5-5 PERCENTAGE OF DEPARTMENT HEADS WHO HAVE SUPERVISED A DISABLED
EMPLOYEE 54
5-6 WHETHER OR NOT IT'S HARDER TO SUPERVISE DISABLED EMPLOYEES 55
5-7 WHETHER I T ' S NECESSARY TO BRIEF CO-WORKERS WHEN A DISABLED
EMPLOYEE IS HIRED 56
5-8 WHETHER OR NOT DISABLED EMPLOYEES ARE MORE DIFFICULT TO FIRE 58
5-9 EMPLOYING HANDICAPPED PEOPLE: SOME PERCEPTIONS 59
CHAPTER 6: THE COST OF EMPLOYING AND ACCOMMODATING DISABLED EMPLOYEES
6-1 AVERAGE COST OF EMPLOYMENT: DISABLED VERSUS NON-DISABLED EMPLOYEES. 61
6-2 PREVALENCE OF ACCOMMODATIONS IN THE WORKPLACE 64
6-3 TYPES OF ACCOMMODATIONS 65
6-4 PERCENTAGE OF COMPANIES THAT EMPLOY A DISABILITY PROFESSIONAL 66
6-5 THE COST OF ACCOMMODATIONS 68
6-6 WHETHER OR NOT THE COST OF ACCOMMODATIONS IS CHARGED TO DEPARTMENTAL BUDGETS 69
6-7 WHY NO ACCOMMODATIONS HAVE BEEN MADE 71
CHAPTER 7: COMPANIES' EXPERIENCE WITH TRAINING PROGRAMS FOR DISABLED EMPLOYEES
7-1 COMPANIES' PARTICIPATION IN JOB INITIATIVES AND PROGRAMS FOR DISABLED PEOPLE 73
(CONTINUED)
Tab le
TABLES (CONTINUED)
Page
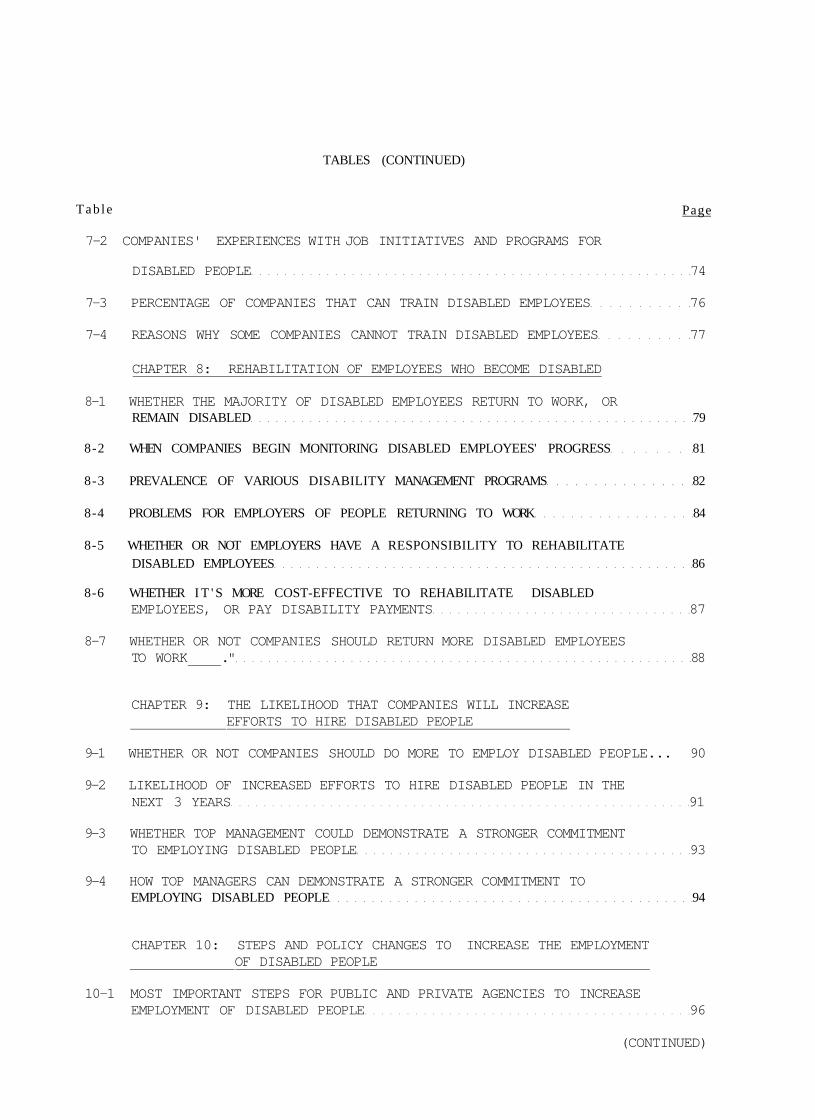
7-2 COMPANIES' EXPERIENCES WITH JOB INITIATIVES AND PROGRAMS FOR
DISABLED PEOPLE 74
7-3 PERCENTAGE OF COMPANIES THAT CAN TRAIN DISABLED EMPLOYEES 76
7-4 REASONS WHY SOME COMPANIES CANNOT TRAIN DISABLED EMPLOYEES 77
CHAPTER 8: REHABILITATION OF EMPLOYEES WHO BECOME DISABLED
8-1 WHETHER THE MAJORITY OF DISABLED EMPLOYEES RETURN TO WORK, OR REMAIN DISABLED 79
8-2 WHEN COMPANIES BEGIN MONITORING DISABLED EMPLOYEES' PROGRESS 81
8-3 PREVALENCE OF VARIOUS DISABILITY MANAGEMENT PROGRAMS 82
8-4 PROBLEMS FOR EMPLOYERS OF PEOPLE RETURNING TO WORK 84
8-5 WHETHER OR NOT EMPLOYERS HAVE A RESPONSIBILITY TO REHABILITATE DISABLED EMPLOYEES 86
8-6 WHETHER I T ' S MORE COST-EFFECTIVE TO REHABILITATE DISABLED EMPLOYEES, OR PAY DISABILITY PAYMENTS 87
8-7 WHETHER OR NOT COMPANIES SHOULD RETURN MORE DISABLED EMPLOYEES TO WORK ." 88
CHAPTER 9: THE LIKELIHOOD THAT COMPANIES WILL INCREASE EFFORTS TO HIRE DISABLED PEOPLE
9-1 WHETHER OR NOT COMPANIES SHOULD DO MORE TO EMPLOY DISABLED PEOPLE... 90
9-2 LIKELIHOOD OF INCREASED EFFORTS TO HIRE DISABLED PEOPLE IN THE NEXT 3 YEARS 91
9-3 WHETHER TOP MANAGEMENT COULD DEMONSTRATE A STRONGER COMMITMENT TO EMPLOYING DISABLED PEOPLE 93
9-4 HOW TOP MANAGERS CAN DEMONSTRATE A STRONGER COMMITMENT TO EMPLOYING DISABLED PEOPLE 94
CHAPTER 10: STEPS AND POLICY CHANGES TO INCREASE THE EMPLOYMENT OF DISABLED PEOPLE
10-1 MOST IMPORTANT STEPS FOR PUBLIC AND PRIVATE AGENCIES TO INCREASE EMPLOYMENT OF DISABLED PEOPLE 96
(CONTINUED)

TABLES (CONTINUED)
Table Page
10-2 WHETHER INCREASED TAX DEDUCTIONS WOULD HELP EMPLOY MORE DISABLED PEOPLE 98
10-3 MANAGERS REACT TO PROPOSED POLICY CHANGES THAT MIGHT INCREASE EMPLOYMENT OF DISABLED PEOPLE 102
APPENDIX A: SURVEY METHOD
A-l SAMPLE DISPOSITION 107
A-2 THE SAMPLES 108
A-3 SAMPLE ERROR 109

-1-
INTRODUCTION
The purpose of this survey is to learn what employers across the
nation are doing to employ disabled people and return disabled employees to
work, and what their experiences with disabled employees have been. The survey
also seeks to identify barriers that prevent employers from hiring disabled
people, and steps that the public and private sector could take to increase the
employment of disabled people.
This is the first nationwide survey of managers to focus primarily on
issues concerning the employment of disabled people. It is hoped that the
results will provide guidance to employers, disability advocates,rehabilitation
and placement agencies, and legislators who are working to help disabled people
enter the mainstream as productive members of society.
The need for this research was made clear by the ICD Survey of
Disabled Americans: Bringing Disabled Americans into the Mainstream, conducted
for ICD and the National Council on the Handicapped by Louis Harris and
Associates in 1985.
The survey of disabled Americans found that two-thirds of all
working-age disabled persons are not working, even though a large majority of
this group say that they would like to work. Disabled persons are, therefore,
much less likely to be working than any other demographic group under 65,
including black teenagers. The challenge presented by these findings is how to
induce the private and public sectors to effect policies and programs which will
bring many more disabled people into the workforce.

-2-
That survey found that work makes a vast qualitative difference in the
lives of disabled Americans. Comparisons between working and non-working
disabled people show that those who work are more satisfied with life, much less
likely to consider themselves disabled, and much less likely to say that their
disability has prevented them from reaching their full abilities as a person.
Working disabled persons also are better educated and have more money than do
non-working disabled persons.
The survey identified a number of barriers which many disabled people
cite as important reasons why they are not working, as well as measures of
disabled people's work experience. But these findings provided few guides which
could be used to stimulate and encourage the employment of many more disabled
people. This new survey is designed to fill this gap.
Specifically, the survey provides:
-- A comparison of current recruiting efforts made for disabled people and those made for other groups.
-- Managers' comparisons between disabled and non-disabled job applicants.
-- Managers' opinions about the prevalence of job discrimination against disabled people.
-- Measures of the prevalence of company policies or programs for the hiring of disabled people.
-- The percentage of companies that have hired disabled people in the past three years and in the past year.
-- The most important reasons why some companies have not hired disabled people.
-- Comparisons of the job performance of disabled and non-disabled employees.
-- Comparisons of the cost of employing disabled and non-disabled employees.

-3-
-- The percentage of companies that have made accommodations for disabled employees, and the cost of these accommodations.
-- Managers' experiences with job initiatives and training programs for disabled people.
-- Measures of the prevalence of various disability management programs for current employees who become disabled.
-- Managers' reactions to 13 initiatives and policy changes that have been proposed to increase employment of disabled people.
The Samples
The survey is based on interviews with four separate samples of
managers: 210 interviews with top managers, 301 interviews with equal
employment opportunity (EEO) managers, 210 interviews with department heads and
line managers, and 200 interviews with top managers in very small companies
(that employ 10-49 people). In all, 921 interviews were conducted with managers
of 921 different companies.
Top managers were defined as corporate executives with at least the
rank of senior vice president. The EEO sample is composed of managers who have
responsibility for equal employment opportunity at their company locations. The
third sample is of department heads and line managers in a variety of company
departments, ranging from sales to accounting and finance. Top managers in very
small companies, the fourth sample, were defined as principals or ranking
officers. Generally, managers were speaking from their current knowledge and
experience without drawing on detailed company records.
It should be noted that while each sample was drawn to be a
representative cross-section of each category of manager, the aggregate data is
not strictly projectable to any population. In most tables therefore the
replies of top managers, EEO officers, line managers and small business managers
are shown separately.
-4-
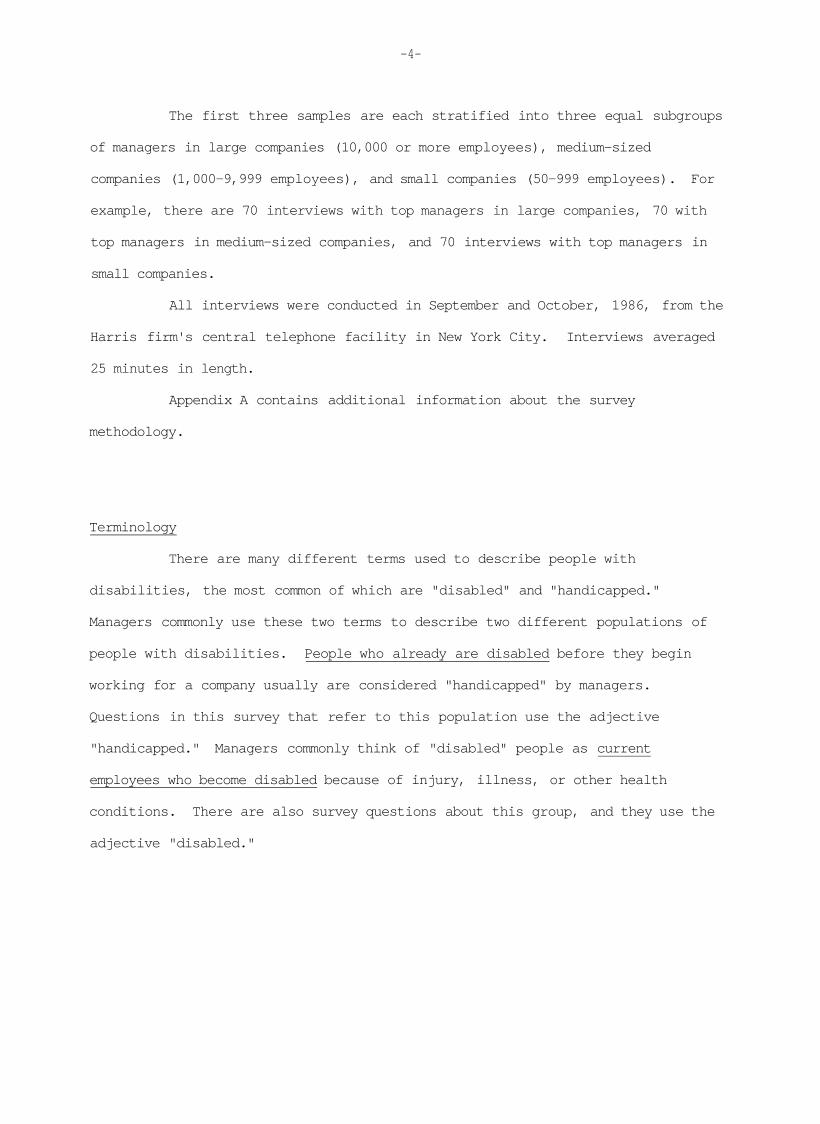
The first three samples are each stratified into three equal subgroups
of managers in large companies (10,000 or more employees), medium-sized
companies (1,000-9,999 employees), and small companies (50-999 employees). For
example, there are 70 interviews with top managers in large companies, 70 with
top managers in medium-sized companies, and 70 interviews with top managers in
small companies.
All interviews were conducted in September and October, 1986, from the
Harris firm's central telephone facility in New York City. Interviews averaged
25 minutes in length.
Appendix A contains additional information about the survey
methodology.
Terminology
There are many different terms used to describe people with
disabilities, the most common of which are "disabled" and "handicapped."
Managers commonly use these two terms to describe two different populations of
people with disabilities. People who already are disabled before they begin
working for a company usually are considered "handicapped" by managers.
Questions in this survey that refer to this population use the adjective
"handicapped." Managers commonly think of "disabled" people as current
employees who become disabled because of injury, illness, or other health
conditions. There are also survey questions about this group, and they use the
adjective "disabled."
-5-
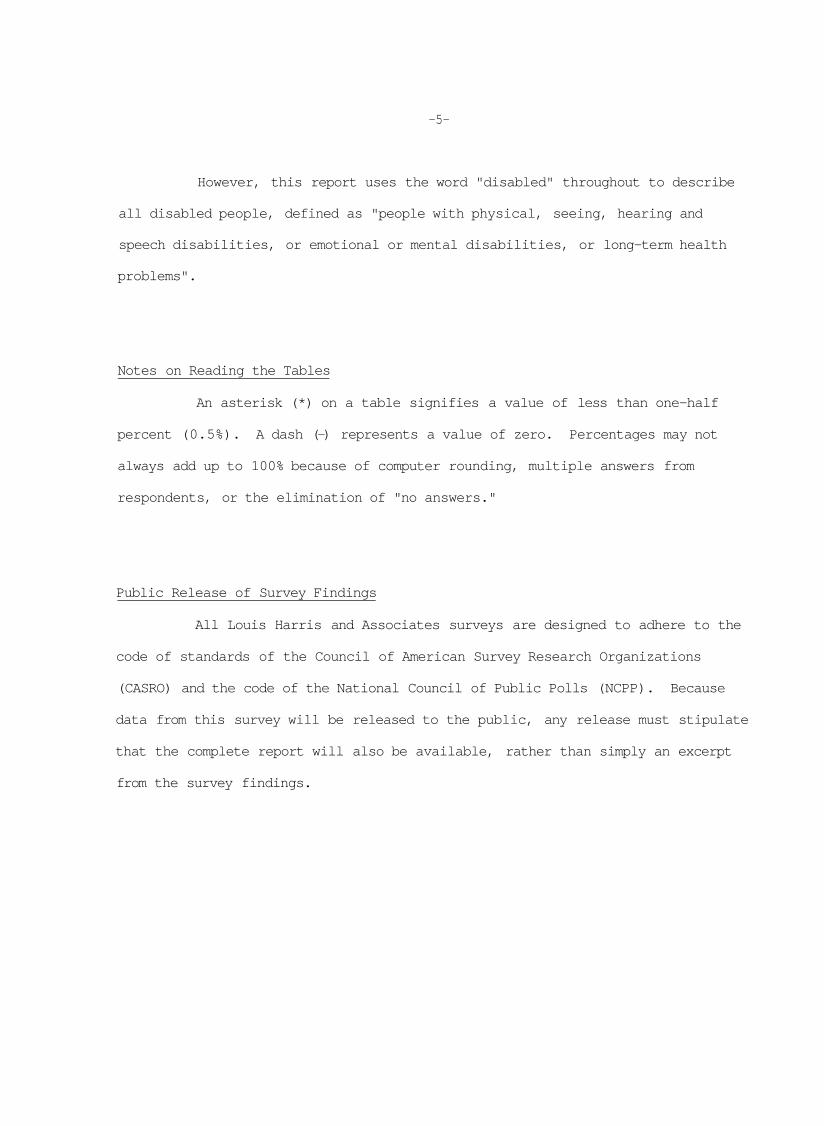
However, this report uses the word "disabled" throughout to describe
all disabled people, defined as "people with physical, seeing, hearing and
speech disabilities, or emotional or mental disabilities, or long-term health
problems".
Notes on Reading the Tables
An asterisk (*) on a table signifies a value of less than one-half
percent (0.5%). A dash (-) represents a value of zero. Percentages may not
always add up to 100% because of computer rounding, multiple answers from
respondents, or the elimination of "no answers."
Public Release of Survey Findings
All Louis Harris and Associates surveys are designed to adhere to the
code of standards of the Council of American Survey Research Organizations
(CASRO) and the code of the National Council of Public Polls (NCPP). Because
data from this survey will be released to the public, any release must stipulate
that the complete report will also be available, rather than simply an excerpt
from the survey findings.

-6-
Project Responsibility
The director of this project at Louis Harris and Associates was
Humphrey Taylor, President. The chief analyst was Stuart Leichenko, Research
Associate. He worked under the supervision of Michael R. Kagay, Ph.D., Vice
President and Division Head.
Louis Harris and Associates would like to thank ICD-International
Center for the Disabled for sponsoring this research. We would in particular
like to thank Jeremiah Milbank Jr. and Jack Brauntuch of the J.M. Foundation,
and John B. Wingate, Dr. Nina M. Hill, Dr. Sanders Davis, Thomas G. Mehnert and
Mary E. Boyd of ICD-International Center for the Disabled. We are also greatly
in debt to the many other people who contributed to the development of the
questionnaire. However, responsibility for topics, question wordings, the
findings, and for their interpretation rests solely with Louis Harris and
Associates.

-7-
SURVEY HIGHLIGHTS
This summary provides an overview of the survey findings. Many
findings described in the chapters of the report do not appear in this summary.
Readers are urged to read the chapters in order to understand the full findings
of the survey.
Employers' Experiences With Disabled Employees
1. Overwhelming majorities of managers give disabled employees a good
or excellent rating on their overall job performance. Only one in twenty
managers say that disabled employees' job performance is only fair, and
virtually no one says that they do poor work.
Twenty-four percent of top managers give disabled employees an
excellent performance rating, 64% rate their job performance as good, 5% call it
only fair, and 1% call it poor.
Twenty-percent of equal employment opportunity (EEO) officers say that
disabled employees do an excellent job, 71% say that they do a good job, 4% say
only fair, and none rate their job performance as poor.
Twenty-seven percent of department heads and line managers give
disabled employees an excellent rating, 64% rate their job performance as good,
3% call it only fair, and none said that disabled employees do a poor job.
2. Nearly all disabled employees do their jobs as well or better than
other employees in similar jobs.
The great majority of managers say that disabled employees work as
hard or harder than non-disabled employees, and are as reliable and punctual or
more so. They produce as well or better than non-disabled employees, and

-8-
demonstrate average or better than average leadership ability. They are also
ambitious. In other words, disabled employees are an asset to any employer.
Line managers' comparisons between disabled and non-disabled employees
are indicative of the total responses:
-- On willingness to work hard: 46% of line managers rate disabled employees as better than non-disabled employees, and 33% rate them about the same.
-- On reliability: 39% rate disabled employees as better than non-disabled employees, and 42% rate them about the same.
--On attendance and punctuality: 39% rate disabled employees as better than non-disabled employees, and 40% rate them about the same.
-- On productivity: 20% rate disabled employees as better, and 57% rate them about the same as non-disabled employees.
-- On desire for promotion: 23% rate disabled employees as better, and 55% rate them about the same as non-disabled employees.
--On leadership ability: 10% rate disabled employees as better, and 62% rate them about the same as non-disabled employees.
3. Eight out of ten department heads and line managers feel that
disabled employees are no harder to supervise than non-disabled employees.
Eighty-four percent of line managers who have supervised disabled employees, and
80% of those who have not, feel this way.
4. The majority of managers (60% of top managers and 61% of E.E.O.
officers) report that their companies can provide ln-house training for disabled
employees.

-9-
The Cost of Employing and Accommodating Disabled People
1. Cost should not be a barrier to increased employment of disabled
people. A three-fourths majority of all three manager groups say that the
average cost of employing a disabled person is about the same as the cost of
employing a non-disabled person.
Eighty-one percent of top managers, 79% of EEO officers, and 75% of
department heads and line managers say that it costs about the same amount to
employ either a disabled or non-disabled person. Only 13% to 17% of these
managers consider it more expensive to employ a disabled person.
2. Large majorities of managers also say that making accommodations
for disabled employees is not expensive. The cost of accommodations rarely
drives the cost of employment above the average range of costs for all
employees.
3. About half of EEO officers (48%) say that their company has made
accommodations for disabled employees. The most common accommodations are the
removal of architectural barriers in the workplace, the purchase of special
equipment for disabled employees, and adjusting work hours or restructuring jobs
for disabled employees.
A recent federal study emphasized that accommodations, when needed,
are a crucial step toward the full integration of disabled employees into the
workforce.
Most managers whose companies have not made accommodations say that
they were not needed. However, the survey did not determine the extent to which
accommodations were actually needed. Nevertheless, it seems likely that many
managers could benefit from further education about the excellent performance
record achieved by disabled employees, the generally low cost of accommodations,
and their effectiveness in helping people do their jobs well.

-10-
Recent Hiring of Disabled People
1. Strong performance evaluations and an absence of cost barriers
have not translated into widespread hiring of disabled employees. Only 43% of
EEO officers say that their company has hired a disabled employee in the past
year. This number does not take account of the hiring of people with "invisible
disabilities" or those who do not self-identify as disabled.
2. Large companies are much more likely to hire disabled employees
than are smaller companies. Fifty-two percent of companies with at least 10,000
employees have hired disabled people in the past year. That percentage drops to
27% for companies with 50-999 employees, and 16% for companies with 10-49
employees. These differences reflect, at least in part, the obvious fact that
large employers hire more people of all kinds. The survey does not provide
information on whether the proportion of disabled employees hired is greater
among large, medium-sized or small companies.
3. Companies that have federal contracts are also more likely to hire
disabled people than are companies without federal contracts. Federal law
requires companies that have federal contracts in excess of $2,500 to provide
equal employment opportunities to disabled people.
Barriers to Increased Hiring of Disabled People
1. Companies that have not hired disabled people in the past three
years say that a lack of qualified applicants is the most important reason.
Sixty-six percent of managers say that a lack of qualified applicants is an
important reason why they have not hired disabled people.

-11-
The message in this finding is clear: increase the pool of qualified
disabled people through education and appropriate training efforts. A new
generation of disabled people are now being educated under the auspices of the
1975 Education for All Handicapped Children Act. These young people must also
receive the training necessary to enter the profession of their choice.
Millions of unemployed disabled people who finished their education
before 1975 also need to acquire additional job skills. The 1985 ICD Survey of
Disabled Americans showed that only one-third of working-age disabled people are
employed either full-time or part-time, even though a two-thirds majority of
unemployed disabled persons want to work. The evidence suggests many employers
could acquire valuable employees and help more disabled people to become
productive members of society.
2. A second key barrier is that few companies have established a
policy or program for the hiring of disabled employees. Only 37% of managers
say that their company has such a policy or program, and these are mostly large
companies.
Employment of disabled people would increase dramatically if many more
companies established these policies. Sixty-seven percent of companies that
have such a hiring policy have hired disabled employees in the past year,
compared to only 42% of companies that do not have a policy. The active
dissemination of these employment policies raises the consciousness of managers,
and increases the likelihood that they will try harder to employ disabled
people. Many companies could clearly do much more in this area.
3. Top managers can play a vital role in raising the consciousness of
middle managers about employing disabled people, and ensuring that hiring
policies are followed. In companies that have such a policy, 88% of top
managers say that they play an active role in disseminating the policy.

-12-
4. But managers generally display a low level of consciousness toward
disabled people as a group, which is another barrier to their increased
employment. The consciousness of all managers -- top, middle, and line
supervisors -- toward disabled people needs to be raised. Many managers are not
aware that unemployed disabled people want to work, and are capable of becoming
loyal, productive employees.
For example, only one in ten top managers display a strongly
optimistic attitude toward disabled people as a potential source of employees.
Both minority groups and elderly people are more likely to be considered an
excellent source of employees by top managers, than are disabled people.
5. Job discrimination remains one of the most persistent
barriers to increased employment of disabled people. A three-fourths majority
of managers feel that disabled people often encounter discrimination from
employers.
This finding supports the anecdotal evidence of job discrimination
that disability advocates and journalists have gathered for years. Until
discrimination from employers is eliminated, large numbers of unemployed
disabled people may never join the working mainstream of American life.
6. The majority of managers say that their companies can provide
in-house training for disabled employees. Sixty percent of top managers and 61%
of EEO officers say their companies can do this. Among small businesses,
however, only 46% of managers say they can provide in-house training. The main
reasons why employers cannot provide in-house training are the lack of special
training for managers, the lack of special equipment and architectural barriers.
-13-
The Rehabilitation of Disabled Employees
1. Most employers who have dealt with employees who become disabled
say that a majority of these employees return to work. Only relatively small
minorities (from 22% to 8%) of the four employer groups say that a majority of
their disabled employees remain disabled or take early retirement.
2. Most employers are supportive of, and committed to, the
rehabilitation of employees, who become disabled. Approximately three-quarters
of each of the three types of managers surveyed feel that employers have a
responsibility to rehabilitate disabled employees. Equally large majorities
feel the rehabilitation of disabled employees is cost-effective. Disability
management programs widely used include light duty, part-time work or flexible
hours (72%), trial work periods (38%), the use of private rehabilitation vendors
(36%) and medical case management (35%).
3. Most employers (70%-74%) believe that their companies are doing
enough to rehabilitate disabled employees. Only tiny minorities (8%-16%)
believe they should make greater efforts. These findings suggest that, as
things are, employers are unlikely to significantly increase their
rehabilitation efforts.

-14-
What Companies Plan to Do in the Near Future
1. Most managers think that their company is already doing enough to
employ disabled people, and should not make greater efforts to employ them.
Sixty-seven percent of top managers, 71% of EEO officers, and 70% of department
heads and line managers think that their companies are doing enough now to
employ disabled people.
2. Majorities of managers also think it is somewhat likely or very
likely that their companies will make greater efforts to employ disabled people
in the next three years. Between 57% and 63% of managers think that their
company will make some greater efforts to increase employment of disabled
people. From 28% to 38% think that this will not happen.
Many managers are willing to try harder to employ disabled people, and
may do so. But they expect rehabilitation and placement agencies to shoulder
most of the burden of producing qualified applicants.
Managers Rate the Effectiveness of Proposed Policy Changes
1. Managers express strong support for many different proposed
initiatives and policy changes designed to help increase employment of disabled
people. These include steps and changes that could be taken by employers,
federal and state agencies, legislatures, private rehabilitation agencies and
placement services, and foundations.
These proposals are thought to have the most potential:
-- Establishing direct training and recruiting programs with schools and vocational rehabilitation agencies: 54% of managers rate this very effective, and 38% rate it somewhat effective.
-15-
-- Having more companies provide internships or part-time jobs to disabled persons as an introduction to full-time jobs: 35% rate this very effective, and 53% rate it somewhat effective.
-- Having employers explain specific functional requirements as part of job descriptions for open positions: 35% rate this very effective, and 45% rate it somewhat effective.
-- Having the government provide additional tax deductions for expensive accommodations, or share in their cost: 27% consider this very effective, and 47% consider it somewhat effective.
-- Having the government subsidize salaries for severely disabled employees for a trial period: 26% rate this very effective, and 42% rate it somewhat effective.
-- Having disability professionals give technical assistance or counsel to employers for accommodations or problems with specific employees: 24% rate this very effective, and 57% rate it somewhat effective.
-- Having chief executive officers establish voluntary employment targets for disabled people: 24% rate this very effective, and 48% rate it somewhat effective.
When asked what they see as the most important steps that
public and private agencies should take to help employers employ more
disabled people, many managers mention programs which would increase
the numbers of job-qualified disabled people, or which would better
inform employers about qualified applicants.
2. Substantial majorities of all types of managers support
the concept that civil rights laws which protect minorities against
discrimination should also apply to disabled people. E.E.O. officers
(80%) are the most supportive of this extension of civil rights laws,
top managers (56%) the least supportive.
-16-
IN CONCLUSION
There are several important findings in this survey which are very
encouraging:
-- Employers give their disabled employees high marks as hard working, reliable and productive employees.
-- The cost of employing disabled people is not a significant barrier.
-- Most employers appear to be willing to consider the
employment of more disabled people if they are qualified.
However, the evidence of this survey is that, without some
new stimulation, the employment of disabled people is unlikely to increase
significantly:
-- Most managers think their company is already doing enough to employ disabled people and should not make greater efforts to do so.
-- Most employers believe that the shortage of disabled job applicants with appropriate qualifications is a major barrier to their employing more disabled people.
-- Employers give the hiring of disabled people a lower priority than the hiring of people from minority groups and the elderly. And disabled people are the least likely to be viewed as an excellent source of employees.
Reviewing the data, and reading between the lines of some of the
responses, it is clear that most managers give the recruitment of disabled
people a very low priority, and that little societal or business pressure is
brought to bear on them to give it a higher priority.
Efforts to increase the employment of disabled people will only
succeed therefore if:
1. There is an increase in the number of job applicants who are perceived by employers to be qualified.
2. Employers give the employment of disabled people a higher priority.
This survey suggests a number of steps that leaders in government,
business and voluntary organizations could take to raise the consciousness of
employers on these issues.

[ -17-
CHAPTER 1: MANAGERS ASSESS DISABLED JOB APPLICANTS
Recruiting Efforts and Attitudes Toward Disabled Persons
The survey results show that companies are more likely to make special
recruiting efforts for people from minority groups than they are for disabled
people. Seventy-two percent of EEO officers and 50% of line managers say that
their companies currently make a special effort to recruit people from minority
groups. In comparison, 60% of EEO officers and only 33% of line managers
believe that their companies do special recruiting for disabled people
(Table 1-1). One explanation for this difference is presumably the legal
requirement for recruiting minorities.
Companies with federal contracts are much more likely than those
without such contracts to make special efforts to hire both minorities and
disabled people.
Another possible explanation is suggested in top managers' attitudes
toward disabled people as a potential source of employees. Top managers were
asked to consider their company's future employment needs, and rate three groups
as potential sources of employees -- people in minority groups, disabled people,
and elderly people (Table 1-2). The results are as follows:
-- Twenty-seven percent of top managers consider minority
groups an excellent potential source of employees, 54% consider them good, 14% rate them as only fair, and 2% rate them as poor.
The results for elderly people are 14% excellent, 42% good, 27% only fair, and 13% poor.
-- Ten percent give disabled people an excellent rating, 51% rate them as good, 31% consider them only fair, and 5% rate them as a poor potential source of employees.

-18-
Disabled people are the least likely to be viewed as an excellent source of
employees, and are about as likely as elderly people to be considered as only
fair or poor. Only one in ten top managers -- people with at least the rank of
senior vice president -- display a strongly optimistic attitude towards disabled
people as potential employees.
Observations:
1. Disabled people are about as likely as elderly people to receive strong consideration for hiring from top managers. It is difficult not to see this as evidence of negativism, or at least a lack of enthusiasm, toward disabled people. These attitudes pose a barrier to increased employment of disabled people.
2. These findings sharply contradict the positive ratings given to disabled job applicants by EEO officers and line managers (see Table 1-3) and the high marks awarded to disabled employees for their job performance (see Chapter 4).

-19-
Q.2
Table 1-1
A COMPARISON OF SPECIAL RECRUITING EFFORTS FOR MINORITY GROUPS AND DISABLED PERSONS
Q.: Does your company currently make a special effort to recruit (READ EACH ITEM), or not?
EEO Officers
Makes a special effort
Does not make
Not sure
Department Heads/Line Managers
Makes a special effort
Does not make
Not sure
Companies with Federal Government Contracts
Makes a special effort
Does not make
Not sure
Base
(301)
(210)
(273)
People From
Minority Groups
%
72
27
1
%
50
46
4
%
82
16
2
Disabled People
%
60
30
10
%
33
53
14
%
56
41
3
Companies without Federal Government Contracts
Makes a special effort
Does not make
Not sure
(570) %
49
47
3
28
67
5

-20-
Q.30
Table 1-2
TOP MANAGERS RATE DISABLED PEOPLE AS A POTENTIAL SOURCE OF EMPLOYEES
Q.: When you think of your company's employment needs in the next few years, how would you rate (READ EACH ITEM) as a potential source of employees --excellent, good, only fair, or poor?
Only Not Base: 210 Excellent Good Fair Poor Sure Refused
People in minority groups % 27 54 14 2 2
Handicapped people % 10 51 31 5 2 *
Elderly people % 14 42 27 13 4
*Less than 0.5%.
-21-
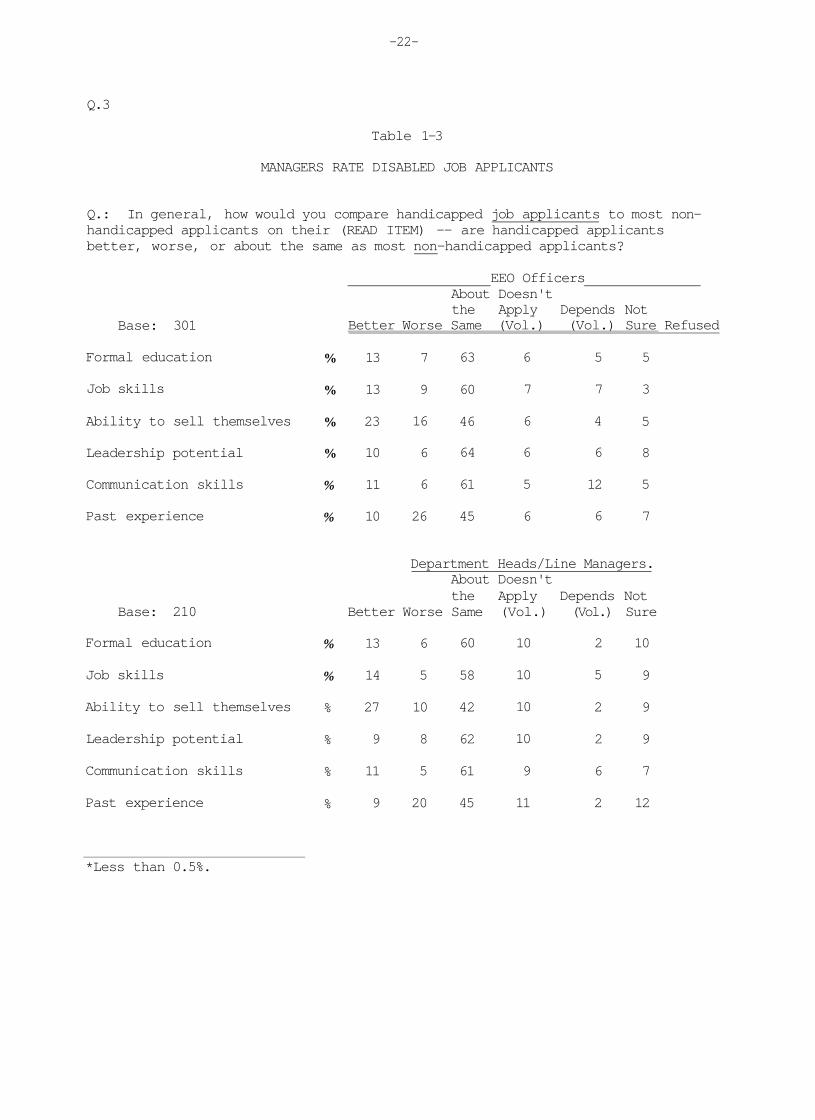
EEO and Line Managers Rate Disabled Job Applicants
EEO officers and line managers compared disabled and non-disabled job
applicants on a number of criteria. Substantial majorities of both manager
groups rate disabled applicants as equal to, or better than, non-disabled
applicants on: formal education, job skills, ability to sell themselves,
leadership potential, communication skills, and past experience (Table 1-3).
Among EEO officers, majorities ranging from 60% to 64% consider
disabled applicants about the same as non-disabled applicants on formal
education, job skills, leadership potential, and communication skills.
Minorities of 10% to 13% rate disabled applicants better than non-disabled
applicants on all of these criteria except one, the ability to sell themselves,
for which 23% of EEO officers rate disabled applicants superior.
Line managers give disabled job applicants virtually the same
evaluations for all six criteria as those given by EEO officers. For example,
27% of line managers rate disabled applicants as better than non-disabled
applicants on their ability to sell themselves.
Observation:
Both EEO officers and line managers say that a lack of past experience hurts disabled applicants most. The problem, of course, is how to gain experience when one can't get a job. One way in which this can be addressed is internship and other on-the-job training programs.
-22-
Q.3
Table 1-3
MANAGERS RATE DISABLED JOB APPLICANTS
Q.: In general, how would you compare handicapped job applicants to most non-handicapped applicants on their (READ ITEM) -- are handicapped applicants better, worse, or about the same as most non-handicapped applicants?
EEO Officers
Base: 301
Formal education
Job skills
Ability to sell themselves
Leadership potential
Communication skills
Past experience
About Doesn't the Apply Depends Not
Better Worse Same (Vol.) (Vol.) Sure Refused
%
%
%
%
%
%
13
13
23
10
11
10
7
9
16
6
6
26
63
60
46
64
61
45
6
7
6
6
5
6
5
7
4
6
12
6
5
3
5
8
5
7
Department Heads/Line Managers. About Doesn't the Apply Depends Not
Base: 210
Formal education
Job skills
Ability to sell themselves
Leadership potential
Communication skills
Past experience
%
%
%
%
%
%
Better
13
14
27
9
11
9
Worse
6
5
10
8
5
20
Same
60
58
42
62
61
45
(Vol.)
10
10
10
10
9
11
(Vol.)
2
5
2
2
6
2
Sure
10
9
9
9
7
12
*Less than 0.5%.

-23-
CHAPTER 2: JOB DISCRIMINATION AND CIVIL RIGHTS LAWS
Job Discrimination Against Disabled People
Large majorities of top managers (72%), EEO officers (76%), department
heads/line managers (80%), and small business managers (70%) feel that disabled
people often encounter job discrimination from employers (Table 2-1).
Observation:
This assertion by three-fourths of managers supports the anecdotal evidence of job discrimination against disabled people that disability advocates and journalists have gathered for many years. Discrimination by employers remains a barrier to increased employment of disabled people.
The 1985 ICD Survey of Disabled Americans found that only one-third of working-age disabled people are employed either full-time or part-time, even though a two-thirds majority of unemployed disabled people want to work. Until job discrimination and other employment barriers are eliminated, large numbers of disabled people may not enter the working mainstream of American life.

-24-
Q.7
Table 2-1
PERCENTAGE OF EMPLOYERS WHO FEEL DISABLED PEOPLE ENCOUNTER JOB DISCRIMINATION
Q. : Do you feel that handicapped people often encounter job discrimination from employers, or not?
Department Small Top EEO Heads/ Business
Management Officers Line Managers Managers Base
Yes, encounter discrimination
Do not encounter
Not sure
210 %
72
17
11
301 %
76
15
7
210 %
80
11
9
200 %
70
18
12
Refused 1 1

-25-
Whether Civil Rights Laws Should Also Cover Disabled People
All four manager groups were asked if the civil rights laws that cover
minorities against discrimination should also cover disabled persons.
Majorities of top managers, EEO officers, line managers, and small business
managers think that they should. But EEO officers and line managers express
much stronger support than top managers. Eighty percent of EEO officers and 72%
of line managers support coverage for disabled people by anti-discrimination
laws. Only 56% of top managers take this view, a far smaller majority
(Table 2-2).
Observation:
This is, perhaps, one of the more surprising findings in the survey. It is, however, typical of the attitudes of business executives reported in this survey who are shown to be generally supportive of policies which would help disabled people.
This is the second finding to suggest that EEO officers and line managers are closer to the problems faced by disabled employees, and are more supportive of change than are top managers.

-26-
Q.6
Table 2-2
WHETHER CIVIL RIGHTS LAWS SHOULD ALSO COVER DISABLED PEOPLE
Q.: Do you think that the civil rights laws that cover minorities against discrimination should also cover handicapped persons, or not? (IF RESPONDENT SAYS THAT LAWS ALREADY COVER THEM, PROBE WITH: Do you think that civil rights laws should or should not ...?)
Base
Should cover
Should not cover
Not sure
Refused
Top Management
210 %
56
30
13
*
EEO Officers 301
%
80
16
4
_
Department Heads/
Line Managers 210
%
72
19
8
*
Small Business Managers 200 %
65
26
9
1
*Less than 0.5%.

-27-
CHAPTER 3: HIRING POLICIES TOWARD DISABLED PEOPLE
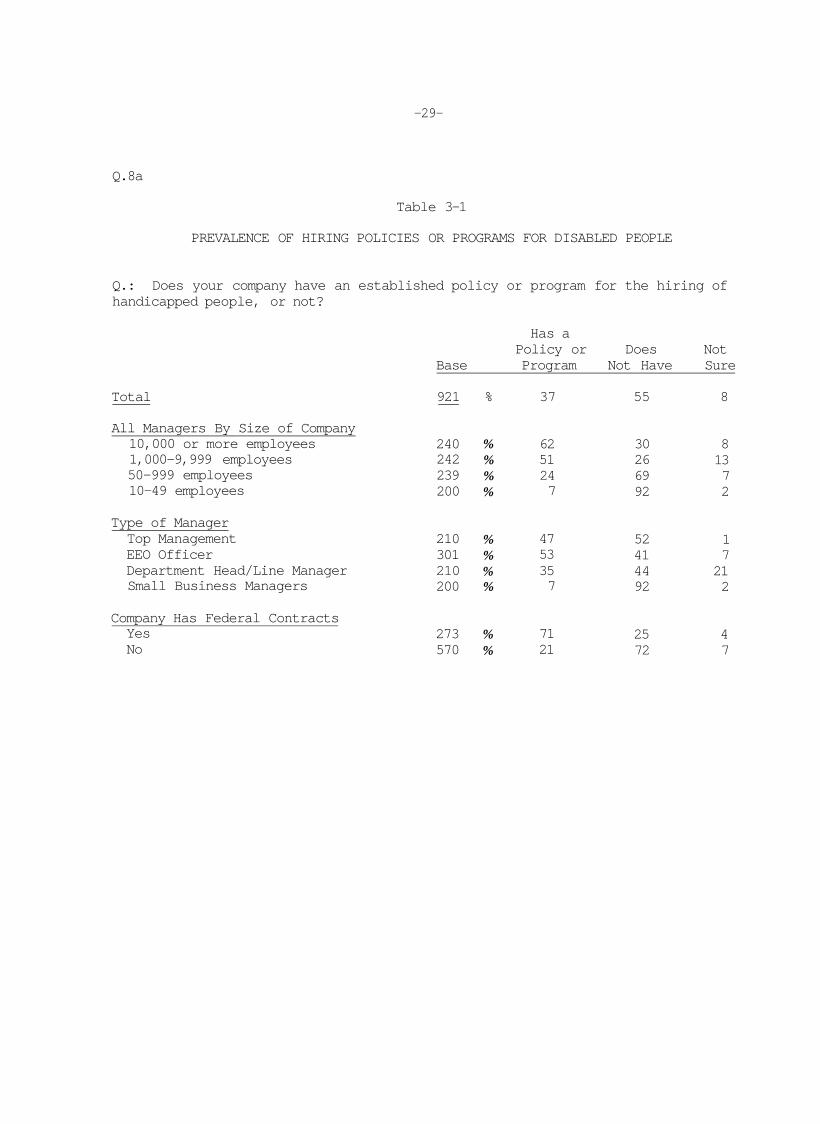
Prevalence of Hiring Policies or Programs for Disabled People
Thirty-seven percent of all managers interviewed say that their
company has an established policy or program for the hiring of disabled people
(Table 3-1).
Companies that employ at least 10,000 people are two to nine times
more likely to have a hiring policy than are companies with less than one
thousand employees. Sixty-two percent of managers in companies with at least
10,000 employees say that they have a hiring policy for disabled people,
compared to 24% in companies with 50-999 employees and a mere 7% in companies
with 10-49 employees.
Observation:
If one accepts the premise that establishing equal employment policies for disabled people is a necessary step toward their full employment, then these results show a long haul ahead for the advocacy movement. It will be many years until large majorities of all managers say that their company has an established policy for employing disabled people.
Federal law requires companies that have federal contracts in excess
of $2,500 to effect equal employment hiring policies toward disabled people. In
companies that have federal contracts, 71% of managers say that they have an
established hiring policy for disabled people. Only 21% of managers in
companies without federal contracts have such a policy or program.
Awareness of these policies appears to be significantly lower among
department heads and line managers. About one-third of this group says that
their company has a hiring policy toward disabled people. The corresponding
figures for top managers and EEO officers are 47% and 53%, respectively.

-28-
In companies that have a hiring policy for disabled people, 88% of top
managers state that they play an active role in disseminating this policy to
managers (Table 3-2).
Half of these companies also have awareness programs or distribute
literature to help managers learn to work with disabled people (Table 3-3).
Observation:
Top managers report a remarkably high level of participation in educating middle managers about these hiring policies. The big dropoff in awareness of these policies among line managers suggests that neither their efforts nor awareness programs have succeeded fully as of yet.
Almost half (47%) of EEO officers (or managers with those
responsibilities) in companies with hiring policies say that a specific person
or department oversees the hiring of handicapped people (Table 3-4). The
existence of such a position or department perhaps suggests a more firmly
established policy for employing disabled people.
-29-
Q.8a
Table 3-1
PREVALENCE OF HIRING POLICIES OR PROGRAMS FOR DISABLED PEOPLE
Q.: Does your company have an established policy or program for the hiring of handicapped people, or not?
Has a Policy or Does Not
Base Program Not Have Sure
Total 921 % 37 55 8
All Managers By Size of Company 10,000 or more employees 1,000-9,999 employees 50-999 employees 10-49 employees
Type of Manager Top Management EEO Officer Department Head/Line Manager Small Business Managers
Company Has Federal Contracts Yes No
240 242 239 200
210 301 210 200
273 570
% % % %
% % % %
% %
62 51 24 7
47 53 35 7
71 21
30 26 69 92
52 41 44 92
25 72
8 13 7 2
1 7 21 2
4 7

-30-
Q.7
Table 3-2
TOP MANAGEMENT'S ROLE IN DISSEMINATING HIRING POLICIES
Base: Top Managers in companies that have a hiring policy for disabled people
Q.: Does top management in your company play an active role in the dissemination of this policy to your managers, or not?
Does Plays an Not Play Not
Base Active Role a Role Sure Refused
Top Managers 98 % 88 11 1

-31-
Q.8d
Table 3-3
PREVALENCE OF AWARENESS PROGRAMS OR LITERATURE
Base: Managers in companies that have a hiring policy for disabled people
Q.: Does your company have any program or distribute any literature that helps your managers and employees learn to work with handicapped people, or not?
Company Has Awareness Does Not Not Base Program or Literature Have Sure
Type of Manager Top Managers 98 % 46 52 2 EEO Officers 159 % 53 43 4 Department Heads/ Line Managers 73 % 47 47 7
All Managers By Size of Company 10,000 or more employees 1,000-9,999 employees 1,000 or fewer
149 % 62 123 % 45 72 % 24
34 4 52 3 72 4

-32-
Q.8b
Table 3-4
PREVALENCE OF DEPARTMENTS THAT OVERSEE HIRING OF DISABLED PEOPLE
Base: EEO Officers and Line Managers in companies that have a hiring policy for disabled people
Q.: Does your company have a specific person or department that oversees the hiring of handicapped people, or not?
Has a Specific Person\ Does Not
Base Department Not Have Sure
EEO Officers 159 % 47 50 3
Department Heads/Line Managers 73 % 36 55 10

-33-
Prevalence of Hiring Quotas for Disabled People
A small minority of EEO officers say that their company's hiring
policy toward disabled people amounts to a specific quota. Nine percent say
that their company policy requires employment of a certain number of disabled
people, or a certain proportion of disabled employees (Table 3-5).
Screening Job Candidates for Disability
Forty-four percent of EEO officers say that their company screens job
candidates for disabilities that could limit their ability to do the job. This
information is used in making hiring decisions by 91% of companies that screen
for functional limitations (Table 3-6).
Self-Identification by Disabled Job Candidates and Employees
A 53% majority of EEO officers encourage job candidates and employees
to self-identify as being disabled or having a specific disability (Table 3-7).
Observation:
Encouragement to self-identify is considered an important step in the integration of disabled employees into a work environment. Self-identification, as recommended by Berkeley Planning Associates for the Department of Labor (1982) places the special needs of disabled employees in the same status as other work situations and potential problems that managers regularly address.
A large increase in the majority of companies that encourage self-identification would be beneficial to managers, current employees, and job candidates. Then, necessary accommodations could be made.
The survey does not provide information on how companies use screening for disability, or whether this helps or hinders the matching of disabled job applicants with appropriate jobs.

-34-
Q.8c
PREVALENCE OF HIRING
Base: EEO Officers hiring policy
Q.: Does your company policy require handicapped people, or have a certain your work force, or not?
Bas
EEO Officers 159
Table 3-5
QUOTAS FOR DISABLED PEOPLE
in companies that have a for disabled people
that you employ a certain number of proportion of handicapped employees in
Policy Requires a Certain Number of Does Not Not Disabled Employees Require Sure
% 9 86 5

-35-
Q.lla, lib
Table 3-6
PERCENTAGE OF COMPANIES THAT SCREEN FOR DISABILITY, AND USE INFORMATION IN HIRING DECISIONS
Base: EEO Officers
Q. : Does your company screen job candidates for functional limitations for doing the job, or not?
Does Not Not Base Screens Screen Sure
EEO Officers 301 % 44 52 4
Q. : Is this information used in making hiring decisions, or not?
Use Do Not Base Information Not Use Sure Refused
EEO Officers in companies that screen for disability 132 % 91 6 2 1

-36-
Q.llc
Table 3-7
PERCENTAGE OF COMPANIES THAT ENCOURAGE JOB CANDIDATES AND EMPLOYEES TO SELF-IDENTIFY AS DISABLED
Base: EEO Officers
Q.: Does your company encourage job candidates and employees to self-identify themselves as handicapped or as having a specific disability, or not?
Encouraged Not Not Base to Self-Identify Encouraged Sure Refused
EEO Officers 301 % 53 44 2 2

-37-
CHAPTER 4: RECENT HIRING OF DISABLED PEOPLE
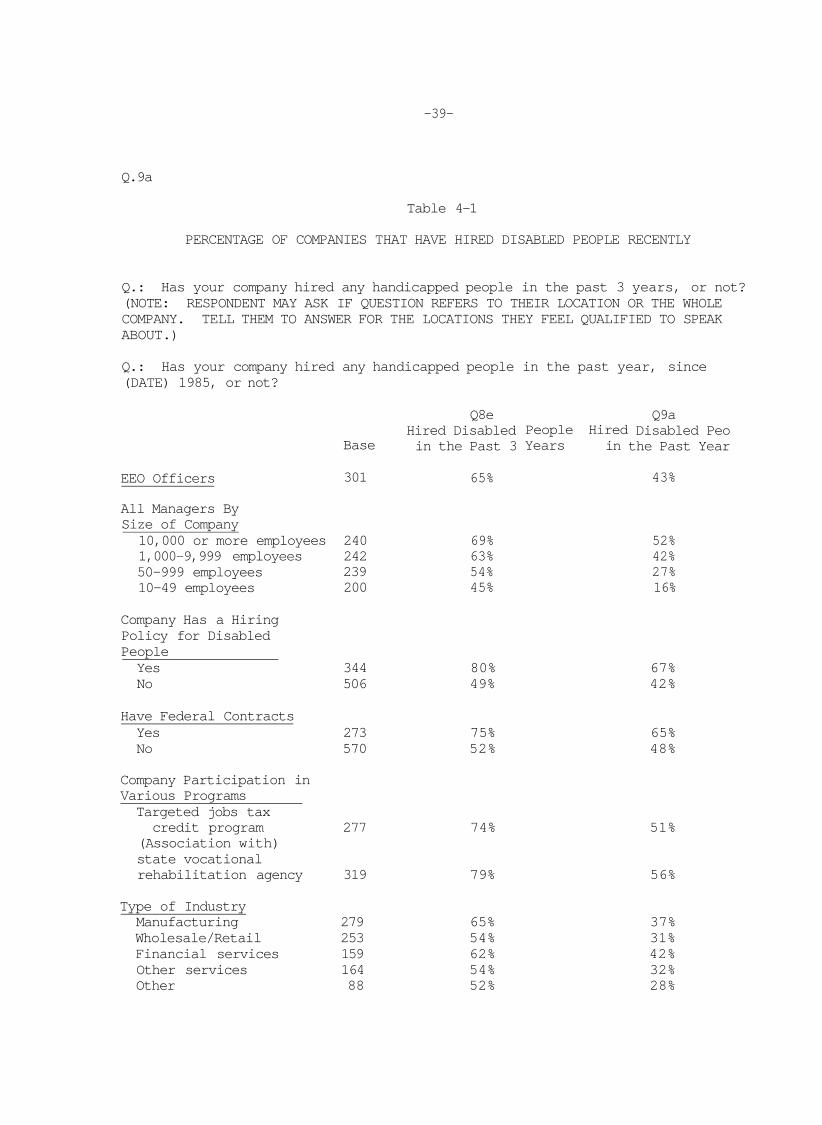
Percentage of Companies That Have Hired Disabled People in the Three Past Years and Past Year
Sixty-five percent of EEO officers say that their company has hired
disabled people in the past three years. Managers who said yes to this question
then were asked if their company had hired any disabled people in the past 12
months. The percentage of EEO officers who claim to have done this drops
sharply to 43% (Table 4-1). A 57% majority of companies, especially smaller
companies, have not hired disabled people in the past year.
Observation:
This line of questioning was employed in order to achieve a "harder" measure of the percentage of companies that have hired disabled people in the past year. The idea behind this kind of test is to focus on progressively more recent time periods. The series could have started farther back in time, at five or ten years ago, and continued until only 6 months or 3 months back from the date of the interview. In theory, the percentage should always grow smaller as the time frame is tightened.
All manager groups were asked these questions, even though top
managers and line managers could have less direct knowledge of recent hirings
than EEO officers and other personnel officers who have these responsibilities.
Combining the samples allows for analysis across some broad measures, such as
differences by size of company or the possible effects of federal contracts on
company policies and actions. It should be understood that the combined sample
of all managers is not projectable to any exact universe of managers. Only the
individual samples of managers or companies by size, or both, are representative
of a particular universe of companies.

-38-
The results for all managers reveal a powerful trend toward greater
hiring of disabled people in larger companies. Fifty-two percent of companies
with at least 10,000 employees have hired disabled people in the past year. The
percentage drops to 27% for companies with 50-999 employees and 16% for
companies with 10-49 employees (Table 4-1). These differences reflect at least
in part the obvious fact that large employers hire more people of all kinds.
This survey does not provide information on whether the proportion of disabled
employees hired is greater among large, medium-sized or small companies.
The presence of a hiring policy for disabled people greatly increases
the likelihood that disabled people will be hired. A two-thirds majority (67%)
of companies with a hiring policy for disabled people have hired them in the
past year, compared to only 42% of companies that do not have such a policy.
Companies that have federal contracts are also more likely to hire
disabled people than are companies without federal contracts. Sixty-five
percent of companies with federal contracts have hired disabled people in the
past year; 48% of companies without federal contracts have hired disabled people
in the past year.
-39-
Q.9a
Table 4-1
PERCENTAGE OF COMPANIES THAT HAVE HIRED DISABLED PEOPLE RECENTLY
Q.: Has your company hired any handicapped people in the past 3 years, or not? (NOTE: RESPONDENT MAY ASK IF QUESTION REFERS TO THEIR LOCATION OR THE WHOLE COMPANY. TELL THEM TO ANSWER FOR THE LOCATIONS THEY FEEL QUALIFIED TO SPEAK ABOUT.)
Q.: Has your company hired any handicapped people in the past year, since (DATE) 1985, or not?
Base
301
240 242 239 200
Q8e Hired Disabled in the Past 3
65%
69% 63% 54% 45%
People Years
Hired in
Q9a Disabled Peo the Past Year
43%
52% 42% 27% 16%
EEO Officers
All Managers By Size of Company 10,000 or more employees 1,000-9,999 employees 50-999 employees 10-49 employees
Company Has a Hiring Policy for Disabled People Yes 344 80% 67% No 506 49% 42%
Have Federal Contracts Yes 273 75% 65% No 570 52% 48%
Company Participation in Various Programs Targeted jobs tax credit program 277 74% 51%
(Association with) state vocational rehabilitation agency 319 79% 56%
Type of Industry Manufacturing 279 65% 37% Wholesale/Retail 253 54% 31% Financial services 159 62% 42% Other services 164 54% 32% Other 88 52% 28%
-40-
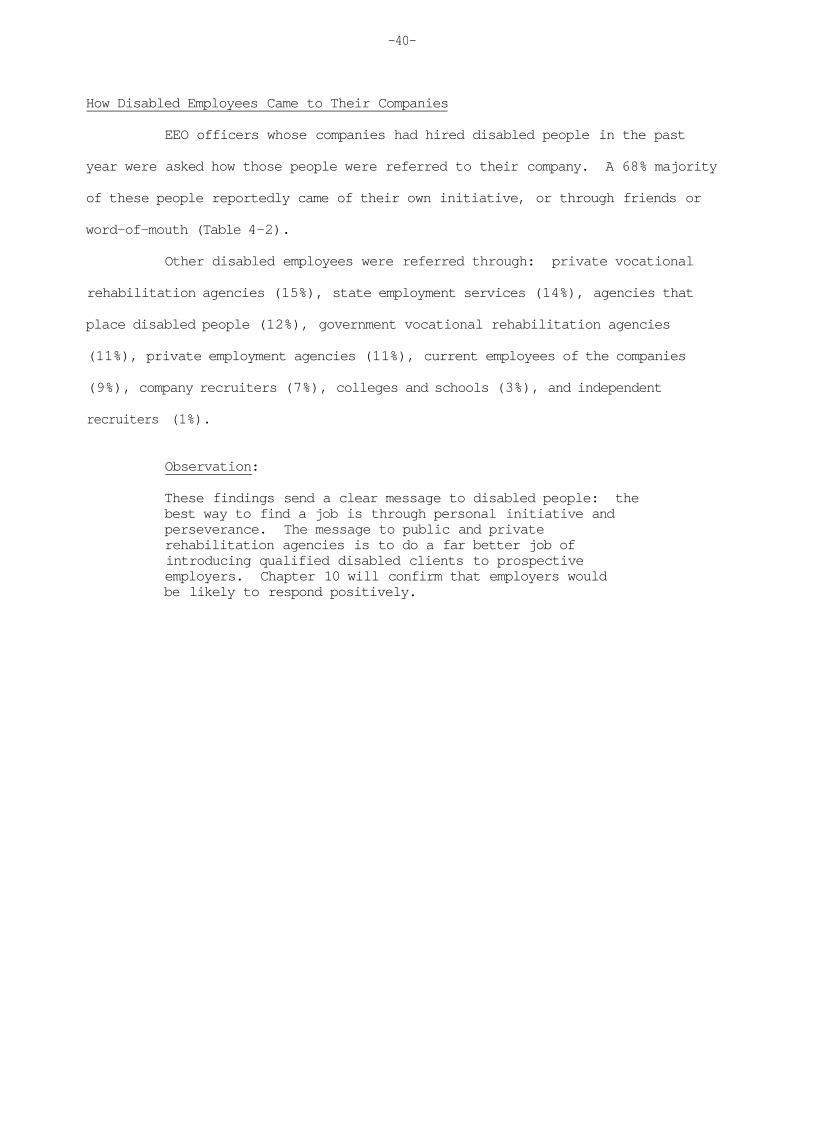
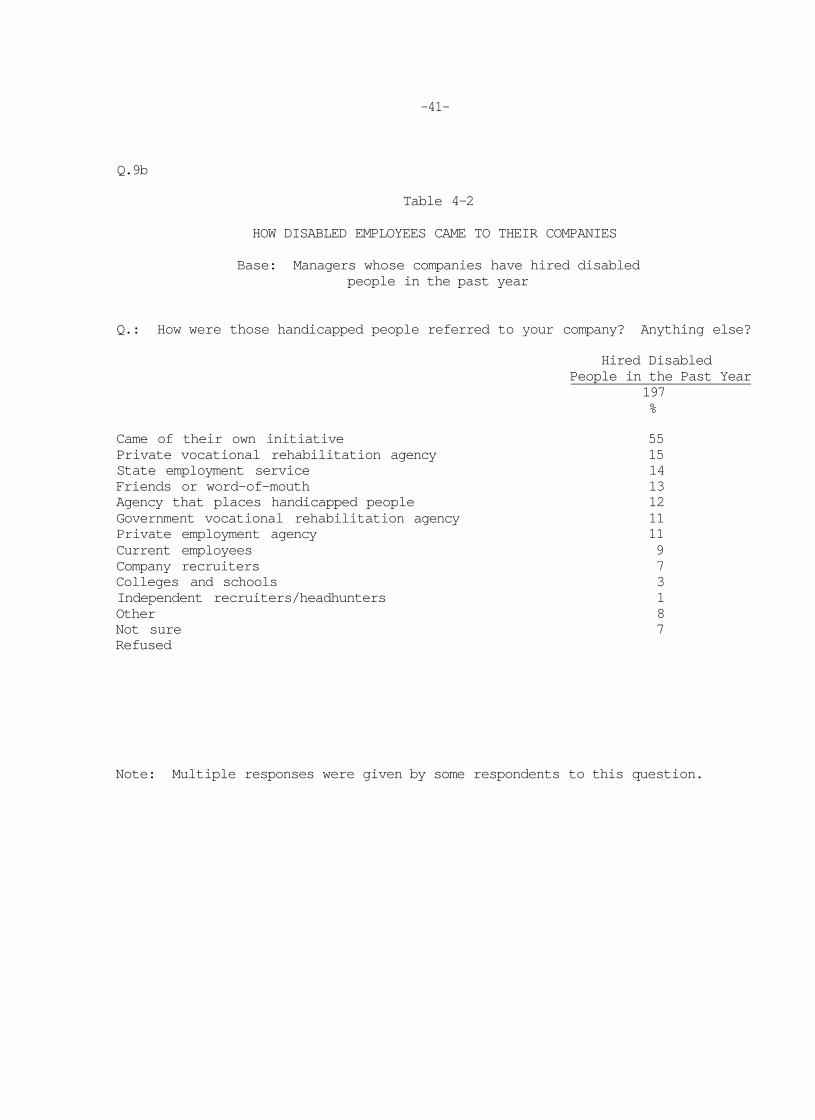
How Disabled Employees Came to Their Companies
EEO officers whose companies had hired disabled people in the past
year were asked how those people were referred to their company. A 68% majority
of these people reportedly came of their own initiative, or through friends or
word-of-mouth (Table 4-2).
Other disabled employees were referred through: private vocational
rehabilitation agencies (15%), state employment services (14%), agencies that
place disabled people (12%), government vocational rehabilitation agencies
(11%), private employment agencies (11%), current employees of the companies
(9%), company recruiters (7%), colleges and schools (3%), and independent
recruiters (1%).
Observation:
These findings send a clear message to disabled people: the best way to find a job is through personal initiative and perseverance. The message to public and private rehabilitation agencies is to do a far better job of introducing qualified disabled clients to prospective employers. Chapter 10 will confirm that employers would be likely to respond positively.
-41-
Q.9b
Table 4-2
HOW DISABLED EMPLOYEES CAME TO THEIR COMPANIES
Base: Managers whose companies have hired disabled people in the past year
Q.: How were those handicapped people referred to your company? Anything else?
Hired Disabled People in the Past Year
197 %
Came of their own initiative 55 Private vocational rehabilitation agency 15 State employment service 14 Friends or word-of-mouth 13 Agency that places handicapped people 12 Government vocational rehabilitation agency 11 Private employment agency 11 Current employees 9 Company recruiters 7 Colleges and schools 3 Independent recruiters/headhunters 1 Other 8 Not sure 7 Refused
Note: Multiple responses were given by some respondents to this question.

-42-
Reasons Why Disabled People Have Not Been Hired
Managers whose companies have not hired disabled people in the past
three years cited various reasons why they may not have done so (Table 4-3).
Two reasons emerged as major barriers to the employment of disabled people:
-- Sixty-six percent of managers say that a lack of qualified applicants is an important reason why they have not hired disabled people in the past three years.
-- Fifty-two percent called an absence of job openings or a hiring freeze an important reason for not hiring disabled people in this time period.
No more than one in five managers said that any of the other factors
tested was an important reason why they had not hired disabled people recently.
These factors include: disabled people being a safety risk to themselves and
others (19%); architectural barriers or a lack of special equipment in the
workplace (17%); an inability to train disabled people (12%); and a lack of
support from top management (5%).
Those managers whose companies had hired disabled people in the past
three years, but not in the past 12 months, also assessed the importance of
these reasons. Once again, the two major reasons were an absence of jobs (65%)
and a lack of qualified applicants (61%), only the order switched. The rank
ordering of the other four reasons was the same (Table 4-4).
Observation:
Society must increase the pool of qualified disabled applicants through increased education and appropriate job training. A new generation of young disabled people are being educated under the 1975 Education for All Handicapped Children Act. Employers, public and private agencies and disabled people must insure that they receive all necessary training to enter the profession of their choice.
But millions of other unemployed disabled people finished their education long ago. Many of these people want to work, and are capable of working, but lack the necessary training to get jobs. Employers could acquire many valuable employees (as Chapter 5 will show) and help disabled people become productive members of society.

-43-
Q.8f
Table 4-3
REASONS WHY DISABLED PEOPLE HAVE NOT BEEN HIRED IN THE PAST 3 YEARS
Base: Managers whose companies have not hired disabled people in the past 3 years
Q.: Is/Are (READ EACH ITEM) an important reason why you haven't hired handicapped people in the past three years, or not?
Not an Important Important Not
base: 319 Reason Reason Depends Sure Refused
A lack of qualified applicants % 66 32 1 1 *
An absence of job openings or a hiring freeze % 5 2 4 7 1 1 -
They're being a safety risk to themselves or others % 19 78 3 *
Architectural barriers or a lack of special equipment % 17 80 2 2 -
The fact that you are unable to train handicapped people % 12 85 1
Not Asked of Top Managers
A lack of support from top management % 5 90 1 4 -
*Less than 0.5%.

-44-
Q.9c
Table 4-4
REASONS WHY DISABLED PEOPLE HAVE NOT BEEN HIRED IN THE PAST YEAR
Base: Managers whose companies have not hired disabled people in the past year but which had hired them in the
two preceding years
Q.: Is/Are (READ EACH ITEM) an important reason why you haven't hired handicapped people in the past year, or not?
Not an Important Important Not
Base: 187 Reason Reason Depends Sure Refused
An absence of job openings or a hiring freeze
A lack of qualified applicants
They're being a safety risk to themselves or others
Architectural barriers or a lack of special equipment
The fact that you are unable to train handicapped people
Not Asked of Top Managers
A lack of support from top management % 4 94
%
%
%
%
%
65
61
16
12
7
32
36
81
84
89
1
1
2
1
2
3
2
2
2
2
.
-
-
-

-45-
CHAPTER 5: MANAGERS RATE THE JOB PERFORMANCE OF DISABLED EMPLOYEES
The Overall Performance of Disabled Employees
Overwhelming majorities of top managers, EEO officers, department
heads/line managers, and small business managers give disabled employees a good
or excellent rating on their overall performance. Only one in twenty managers
say that disabled employees' job performance is only fair, and virtually no one
says that they do their jobs poorly (Table 5-1).
Eighty-eight percent of top managers give disabled employees an
excellent or good rating, (24% call their job performance excellent, 64 % good,
5% call it only fair, and 1% call it poor.)
Ninety one percent of EEO officers say that disabled employees do an
excellent or good job, (20% say that they do an excellent job, 71% a good job,
4% say only fair, and none call their performance poor.)
Line managers give a similar rating: 91% rate disabled employees
excellent or good, (27% rate them excellent, 64% good, 3% rate them only fair,
and none said that disabled employees do a poor job.)
Observation:
This strong endorsement of disabled employees is the first of several findings to show that disabled employees do a fine job, and perform as well or better than most other employees in similar jobs. Employers who may still harbor fears that disabled people won't measure up to performance standards should be reassured by the findings in this chapter.

-46-
Q.lld
Table 5-1
MANAGERS RATE THE JOB PERFORMANCE OF DISABLED EMPLOYEES
Base: Managers in companies with disabled employees
Q.: Now let's talk about your company's experiences with handicapped employees, past and present. In general, how would you rate the job performance of handicapped employees who work for your company -- excellent, good, only fair, or poor?
Base
Excellent
Good
Only fair
Poor
Not sure
Top Managers
198 %
24
64
5
1
7
EEO Officers 253 %
20
71
4
-
4
Department Heads/Line Managers
162 %
27
64
3
-
7
Small Business Managers
118 %
23
59
11
3
3
Refused 1
-47-
Disabled and Non-Disabled Employees Compared on Key Job Criteria
Top managers, EEO officers, line managers, and small business managers
compared disabled and non-disabled employees on key criteria for job
performance. The overwhelming majority of disabled employees perform either on
a par with non-disabled employees in similar jobs, or often above them (Table
5-2).
The comparisons made by line managers for six key criteria are as
follows:
--On willingness to work hard: 46% rate disabled employees better than non-disabled employees, and 33% rate them about the same.
-- On reliability: 39% rate disabled employees better than non-disabled employees, and 42% rate them about the same.
--On attendance and punctuality on the job: 39% rate disabled employees better than non-disabled employees, and 40% rate them about the same.
-- On productivity: 20% rate them better than non-disabled employees, and 57% rate them about the same.
-- On desire for promotion: 23% rate them better than non-disabled employees, and 55% rate them about the same.
-- On leadership ability: 10% rate them better than non-disabled employees, and 62% rate them about the same. Six percent of line managers rated disabled employees worse than non-disabled employees on leadership potential.
Observation:
The data shown in Table 5-2 are remarkable both in their content and consistency between the manager groups. Managers are convinced that disabled employees almost always perform their jobs as well or better than other employees in similar jobs.

-48-
Disabled employees work hard, and are reliable and punctual. They produce as well or better than non-disabled employees, and demonstrate average or better than average leadership ability and ambition. In other words, disabled employees are an asset to any employer. The challenge posed by these evaluations is how society can find ways to bring many more disabled people into the workplace as productive members of society.

-49-
Q.12
Table 5-2
MANAGERS COMPARE DISABLED AND NON-DISABLED EMPLOYEES ON KEY JOB CRITERIA
Q.: I'm going to read some criteria used to evaluate employees. How would you rate handicapped employees on their (READ EACH ITEM) -- are they better, worse, or about the same as non-handicapped employees in similar jobs?
Top Managers' Evaluation.
Base: 210
Willingness to work hard Reliability Attendance and punctuality on the job Productivity Desire for promotion Leadership ability
Base: 301
Willingness to work hard Reliability Attendance and punctuality on the job Productivity Desire for promotion Leadership ability
Base: 210
Willingness to work hard Reliability Attendance and punctuality on the job Productivity Desire for promotion Leadership ability
Base: 200
Willingness to work hard Reliability Attendance and punctuality on the job Productivity Desire for promotion Leadership ability
% % % % % %
% % % % % %
% % % % % %
% % % % % %
Better
50 42 43 18 13 7
Better
49 47 43 21 18 7
Worse
-
-1 6 4 13
About the Same
40 46 44 66 69 60
Not Sure
4 5 4 4 7 12
Refus
*
1 1 1 1 1
ed
EEO Officers' Evaluation
Worse
* *
1 2 4 11
About the Same
44 47 50 68 70 69
Not Sure
2 3 3 4 5 8
Not Applicable
6 6 6 6 6 7
Not Refused Applicable
3 3 3 3 3 3
Department Head/Line Managers'
Better
46 39 39 20 23 10
Worse
* * 1 2 1 6
About the Same
33 42 40 57 55 62
Not Sure
5 4 5 5 5 6
Small Business Managers'
Better
37 33 32 17 15 7
Worse
1 1 1 5 4 14
About the Same
30 34 33 45 45 44
Not Sure
3 3 3 4 5 4
Refus
_
-----
1 1 1 1 1 1
Evaluation
ed Not
Applicable
15 15 15 15 16 16
Evaluation
Refus
-
-1 ---
ed Not
Applicable
30 30 30 31 32 31
*Less than 0.5%.

-50-
Promoting Disabled Employees
Tables 5-3 and 5-4 contain what appear to be somewhat contradictory
data about the rate at which disabled employees get promoted. Sixty-eight
percent of EEO officers say that disabled employees get promoted at about the
same rate as most other employees, which would seem to be a strong sign of their
full integration into the workforce (Table 5-3). But nearly three-fourths of
these same managers say that they have been only somewhat successful (45%) or
not successful (27%) in promoting disabled employees (Table 5-4).
Observation:
The meaning of these findings is open to interpretation. The first question, in Table 5-3, was asked very early in the survey, and the second question, in Table 5-4, was asked at about the midpoint in the interview. It could be that these findings are, in fact, consistent because they reflect the availability of promotions at the level where most disabled people are employed. To the extent that promotions are available, which may not be too often, disabled employees may receive them at about the same rate as everyone else.
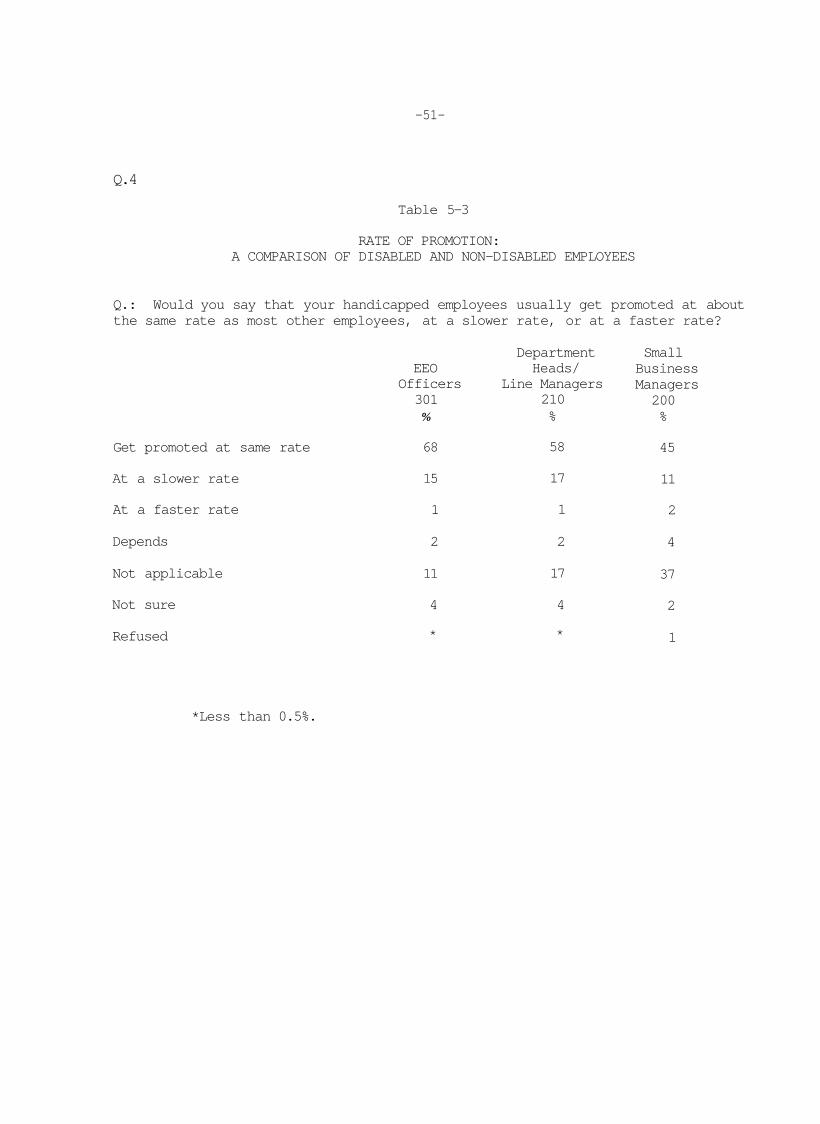
-51-
Q.4
Table 5-3
RATE OF PROMOTION: A COMPARISON OF DISABLED AND NON-DISABLED EMPLOYEES
Q.: Would you say that your handicapped employees usually get promoted at about the same rate as most other employees, at a slower rate, or at a faster rate?
Get promoted at same rate
At a slower rate
At a faster rate
Depends
Not applicable
Not sure
Refused
EEO Officers 301
%
68
15
1
2
11
4
*
Department Heads/
Line Managers 210 %
58
17
1
2
17
4
*
Small Business Managers 200 %
45
11
2
4
37
2
1
*Less than 0.5%.

-52-
Q.13a
Table 5-4
COMPANIES' SUCCESS AT PROMOTING DISABLED EMPLOYEES
Q.: How would you rate your company's success at promoting handicapped employees -- have you been very successful, somewhat successful, not too successful, or not successful at all?
Base
Very successful
Somewhat successful
Not too successful
Not successful at all
Not sure
Refused
Not applicable
Top Management
210 %
3
40
29
7
9
-
12
EEO Managers 301 %
3
45
21
6
8
1
17
Line Managers 210 %
6
31
13
9
5
-
36
Small Business Managers 200 %
4
23
11
12
1
-
51
-53-
Supervision of Disabled Employees
A majority of line managers (54%) have supervised disabled employees
at some point in their career (Table 5-5).
The overwhelming majority (82%) of both those who have and have not
supervised disabled employees feel that disabled employees are not more
difficult to supervise (Table 5-6). Half (50%) consider it necessary to brief
other employees about working with a disabled person when one is hired
(Table 5-7).

-54-
Q.31 Table 5-5
PERCENTAGE OF DEPARTMENT HEADS WHO HAVE SUPERVISED A DISABLED EMPLOYEE
Base: Department Heads/Line Managers
Q.: Do you now supervise, or have you ever supervised, any handicapped employees, or not?
Base Supervised Has Not Not Sure Refused
Total
Size of Company 10,000 or more employees 1,000-9,999 employees 50-999 employees
210
70 70 70
%
% % %
54
57 46 59
M
41 54 39
1
1 -3
-
---

-55-
Q.31
Table 5-6
WHETHER OR NOT IT'S HARDER TO SUPERVISE DISABLED EMPLOYEES
Base: Department Heads/Line Managers
Q.: Do you feel that it is more difficult to supervise a handicapped employee than a non-handicapped employee, or not?
More Not More Base Difficult Difficult Not Sure Refused
Total
Have Supervised a Disabled Employee Yes No
210
113 94
%
% %
10
13 7
82
84 80
7
3 13
-
--

-56-
Q.16c Table 5-7
WHETHER IT'S NECESSARY TO BRIEF CO-WORKERS WHEN A DISABLED EMPLOYEE IS HIRED
Base: Department Heads/Line Managers
Q.: If you hire a handicapped person, do you think it is necessary to talk with other employees whom you supervise about working with, and reacting to, a handicapped person, or not?
Base
Total 210 %
Have Supervised a Disabled Employee Yes 113 % No 94 %
Not Necessary Necessary Not Sure Refused
% 50 47 3
% 49 47 4 % 52 47 1

-57-
Firing Disabled Employees
Managers in all groups are divided about whether it is more difficult
to fire a disabled employee than a non-disabled employee (Table 5-8).
Forty-four percent of top managers believe that it is more difficult
to fire a disabled employee, and 46% believe it is not more difficult.
By a two-to-one majority, EEO officers think that it, is not more
difficult to fire disabled employees. Sixty-two percent think that it is not
more difficult, and 30% think that it is more difficult.
A 57% majority of line managers also believe that it is not more
difficult to fire disabled employees than non-disabled employees; however a
sizable 37% feel that it is.
Small business managers are more equally divided; 44% believing it is
more difficult, and 47% that it is not more diffiuclt, to fire disabled
employees.
Observation
So long as managers feel that it is difficult to fire employees, if they are disabled, this will tend to be a barrier to the hiring and integration of disabled people.
Some Perceptions Relating to the Employment of Disabled People
One significant barrier to the employment of disabled persons is that
almost half of all managers (46%) believe that special privileges must usually
be made for them (Table 5-9). On the other hand a plurality (47%) of employers
believe that disabled employees have fewer accidents on the job, and a massive
93% majority reject the argument that handicapped employees don't fit in.

-58-
Q.17
Table 5-8
WHETHER OR NOT DISABLED EMPLOYEES ARE MORE DIFFICULT TO FIRE
Q.: Do you think that it is more difficult to fire a handicapped employee than a non-handicapped employee, or not?
Base
More difficult
Not more difficult
Not sure
Refused
Small Top
Management 210 %
44
46
10
_
EEO Officers 301 %
30
62
7
1
Department Heads, Line Managers
210 %
37
57
6
.
/ Business Managers 200 %
44
47
9
1

-59-
Q.5
Table 5-9
EMPLOYING HANDICAPPED PEOPLE: SOME PERCEPTIONS
Q.: Let me read you some statements that people have made about employing handicapped people. Please say If you agree strongly, agree somewhat, disagree somewhat, or disagree strongly.
Base: 921 Agree Disagree Not Sure
Special privileges must usually be made for handicapped employees
Handicapped employees have fewer accidents on the job than do non-handicapped employees
Handicapped people just don't fit in with most non-handicapped employees
46 49
% 47 28
93
25
Note: On the table the answer for the total sample is shown because the differences between top managers, EEO officers, line managers and small business managers are small.

-60-
CHAPTER 6: THE COST OF EMPLOYING AND ACCOMMODATING DISABLED EMPLOYEES
The Average Cost of Employing Disabled People
Overwhelming majorities of top managers (81%), EEO officers (79%),
department heads/line managers (75%), and small business managers (64%) say that
the average cost of employing a disabled person is about the same as the cost of
employing a non-disabled person. Only 13% to 17% of these managers say that the
average cost of employment is greater for disabled employees (Table 6-1).
Observations:
1. For many years, it has been alleged that high costs are a major barrier to large-scale employment of disabled people. These findings disprove that theory. Eight out of ten managers say that the costs of employing both disabled and non-disabled people are about the same.
2. Disabled employees meet the standards of large majorities of managers on job performance, ease of supervision, desire for promotion and, now, cost of employment.

-61-
Q.16
Table 6-1
AVERAGE COST OF EMPLOYMENT: DISABLED VERSUS NON-DISABLED EMPLOYEES
Q.: Would you say that the average cost of employing a handicapped person is greater than, less than, or about the same as the cost of employing a non-handicapped person in a similar job?
Base
Greater than
Less than
About the same
Depends (vol.)
Not sure
Refused
Top Management
210 %
13
*
81
2
3
.
EEO Officers 301
%
13
2
79
2
3
1
Department Heads/ Line Managers
210 %
17
2
75
1
4
.
Small Business Managers 200 %
14
4
64
7
11
1
*Less than 0.5%.

-62-
Accommodations in the Workplace
About half (48%) of EEO officers say that their company has made
accommodations in the workplace or changed its practices in order to help
disabled employees do their jobs. However, only one-third (35%) of line
managers say their company has made accommodations. Top managers seem to
overestimate with what actually has been done: 70% of them say that
accommodations have been made. Small business managers are less likely to have
made accommodations (Table 6-2).
The nature of accommodations and their prevalence varies greatly. EEO
officers whose companies have made accommodations answered questions about the
kinds of steps that have been taken (Table 6-3).
-- Ninety percent of these companies have removed
architectural barriers or changed furniture to give disabled employees full access to the workplace.
-- Fifty percent of these companies have purchased special equipment to help disabled employees.
-- Fifty percent of these companies have adjusted work hours or restructured jobs to accommodate disabled employees.
-- Twenty-three percent of these companies have provided readers or interpreters to help blind or speech and hearing-impaired employees do their jobs.
-- Ten percent of these companies have made other accommodations for disabled employees.
A few companies (6%) also employ a disability professional who works
with disabled employees and their supervisors (Table 6-4). However, this figure
may underrepresent the proportion of companies that subcontract disability
professionals on an as needed basis.

-63-
Observatlon:
Federal and private studies have emphasized the Importance of making accommodations as a crucial step In the full integration of disabled employees in the workplace. Not all disabled employees require accommodations. But for those who do, these studies urge that accommodations be made at the earliest possible stage in their employment. The sooner that accommodations are made, the sooner that an employee's disability ceases to be an issue or potential problem.
Seeking the advice or services of a disability professional is also encouraged. Many disability professionals are trained to choose the most effective types of accommodations at the cheapest cost to employers.
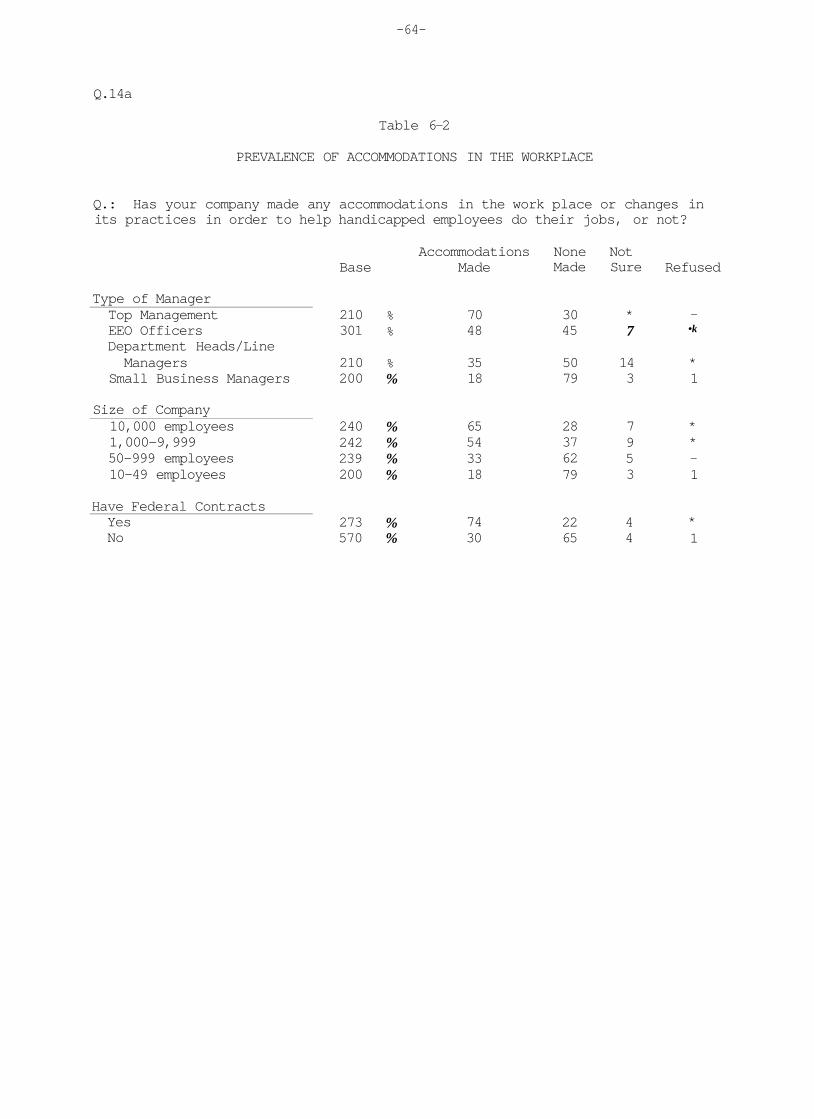
-64-
Q.14a
Table 6-2
PREVALENCE OF ACCOMMODATIONS IN THE WORKPLACE
Q.: Has your company made any accommodations in the work place or changes in its practices in order to help handicapped employees do their jobs, or not?
Type of Manager Top Management EEO Officers Department Heads/Line Managers
Small Business Managers
Size of Company 10,000 employees 1,000-9,999 50-999 employees 10-49 employees
Have Federal Contracts Yes No
Base
210 301
210 200
240 242 239 200
273 570
% %
% %
% % % %
% %
Accommodations Made
70 48
35 18
65 54 33 18
74 30
None Made
30 45
50 79
28 37 62 79
22 65
Not Sure
*
7
14 3
7 9 5 3
4 4
Refused
-•k
* 1
* * -1
*
1

-65-
Q.14b
Table 6-3
TYPES OF ACCOMMODATIONS
Base: EEO Officers whose companies have made accommodations
Q.: Has your company (READ EACH ITEM)?
Base: 145 Have
Removed architectural barriers or changed furniture to give handicapped employees full access, or not
Purchased any special telephones or equipment to help handicapped employees, or not
Adjusted work hours or restructured jobs to accommodate handicapped employees, or not
Provided readers or interpreters to help blind or speech and hearing-impaired employees, or not
Make any other accommodations for handicapped employees, or not
% 90
% 50
% 50
% 23
% 10
Have Not Not Not Sure Refused Applicable
9 1
43 4
42 5
65 8
79 1 10

-66-
Q.13b
Table 6-4
PERCENTAGE OF COMPANIES THAT EMPLOY A DISABILITY PROFESSIONAL
Q.: Does your company employ a disability professional who works with handicapped employees or their supervisors, or not?
Employs a Does Not Not Base Professional Employ One Sure Refused
EEO Officers 301 % 6 88
*Less than 0.5%.

-67-
The Cost of Accommodations
Large majorities of managers in companies that have made
accommodations say that the cost of making accommodations has not been
expensive. Seventy-four percent of top managers, 72% of EEO officers, and 80%
of line managers in these companies consider the cost of accommodations not too
expensive or not expensive at all. Less than one-quarter consider the cost of
accommodations somewhat expensive, and virtually no one considers them very
expensive (Table 6-5).
Thirty-two percent of department heads and line managers say that the
cost of accommodating a disabled employee is charged to their departmental
budget (Table 6-6).
Observation:
The Berkeley study also shows that most accommodations (81%), cost less than $500 and that half cost nothing. Since the average cost of employing a disabled person is in the range of costs for all employees, the average cost of accommodations must not significantly raise the cost of employing disabled people (Table 6-1).
Where department heads and line managers are charged with the costs of accommodations, this may be a disincentive to hiring disabled people -- however modest the cost --particularly for small companies.
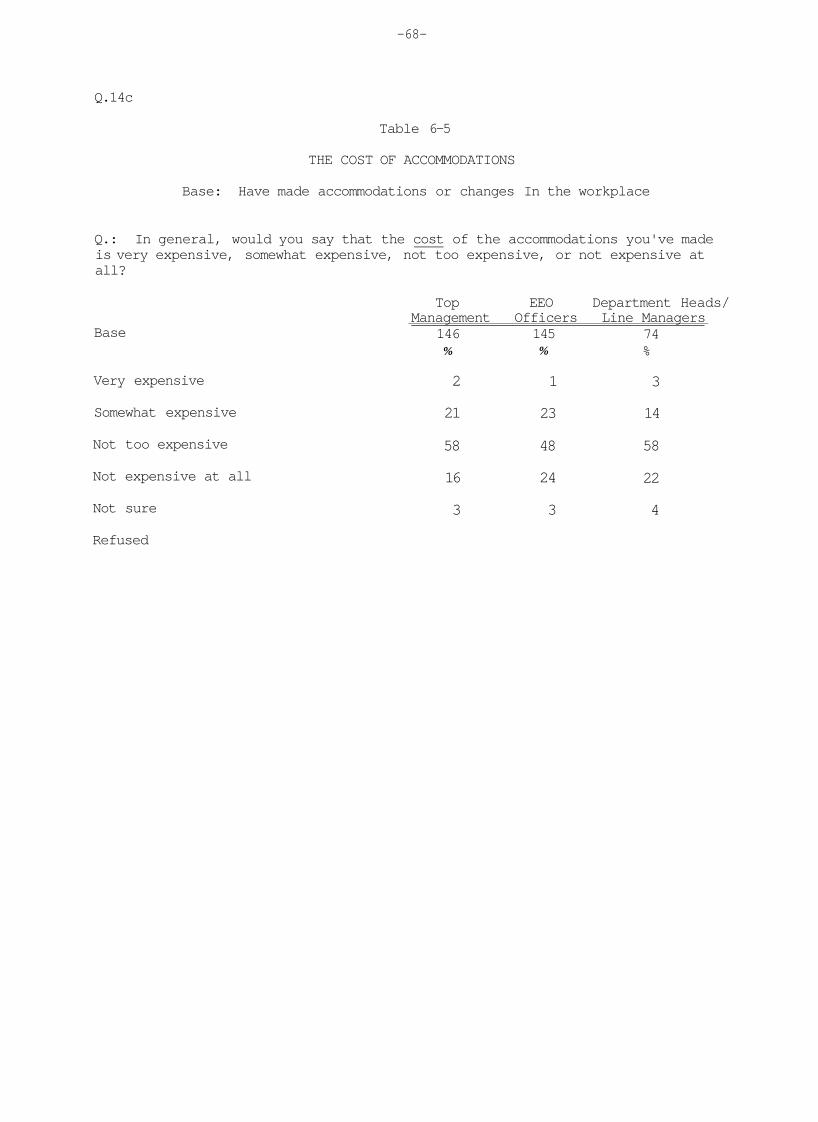
-68-
Q.14c
Table 6-5
THE COST OF ACCOMMODATIONS
Base: Have made accommodations or changes In the workplace
Q.: In general, would you say that the cost of the accommodations you've made is very expensive, somewhat expensive, not too expensive, or not expensive at all?
Top EEO Department Heads/ Management Officers Line Managers
Base
Very expensive
Somewhat expensive
Not too expensive
Not expensive at all
Not sure
Refused
146 %
2
21
58
16
3
145 %
1
23
48
24
3
74 %
3
14
58
22
4

-69-
Q.15b
Table 6-6
WHETHER OR NOT THE COST OF ACCOMMODATIONS IS CHARGED TO DEPARTMENTAL BUDGETS
Q.: Is the cost of accommodating a handicapped employee charged to your department's budget, or not?
Not Base Charged Charged Not Sure Refused
Department Heads/ Line Managers 180 % 32 48 18 1

-70-
Reasons for Not Making Accommodations
More than eight out of ten managers whose companies have not made
accommodations say that none were needed or requested (Table 6-7).
Observation:
The survey did not determine the extent to which accommodations were actually needed. Nevertheless, it seems likely that many managers could benefit from further education about the excellent performance record of disabled employees, the generally low cost of making accommodations, and their effectiveness in helping people do their jobs.

-71-
Q.15
Table 6-7
WHY NO ACCOMMODATIONS HAVE BEEN MADE
Base: Have not made accommodations or changes in the workplace
Q.: Why have no accommodations in the work place been made? Any other reasons?
Small Top EEO Department Heads/ Business
Management Officers Line Managers Managers Base
None needed
None requested
Too expensive
Changes needed were too extensive
Changes needed were not feasible
Laws requiring accommodations don't apply to us
Other
Not sure
Refused - - - 1
No handicapped employees 5 3 5 6
63 %
89
3
-
-
-
2
-
5
135 %
80
4
1
3
4
2
1
5
106 %
83
2
-
-
3
-
2
8
158 %
86
1
1
2
5
-
-
1
-72-
CHAPTER 7: COMPANIES' EXPERIENCES WITH TRAINING PROGRAMS FOR DISABLED EMPLOYEES
Job Initiatives and Programs for Disabled People
Corporate participation in the major government and private job
initiatives and training programs has been low during the past three years.
About four out of ten EEO officers say that their companies participated in the
Targeted Jobs Tax Credit Program (40%) or had experience with state vocational
rehabilitation agencies (42%) in this period. Twenty-five percent of companies
participated in a Job Training Partnership Act Program or Private Industry
Council (PIC). Only one in ten companies participated in a Projects with
Industry (PWI) program, and a mere 6% had any association with an independent
living center (Table 7-1).
Among small businesses, participation is much lower. The great
majority of small business managers have had no involvement with any such
programs.
Companies that have participated in these programs generally rate
their experiences as very successful or somewhat successful. For example, a
large majority of EEO officers rate their company's experience with a Projects
with Industry Program as very successful (26%) or somewhat successful (58%).
Similar majorities gave positive ratings for their experiences with the other
major programs mentioned above (Table 7-2). Very few EEO officers rated their
company's experience as not too successful, and only 3% to 5% said that the
experience had been a failure.
Observation:
Given that most companies do not participate in these programs, and that those which do overwhelmingly find them successful, there is clearly a need and an opportunity to greatly expand their use.
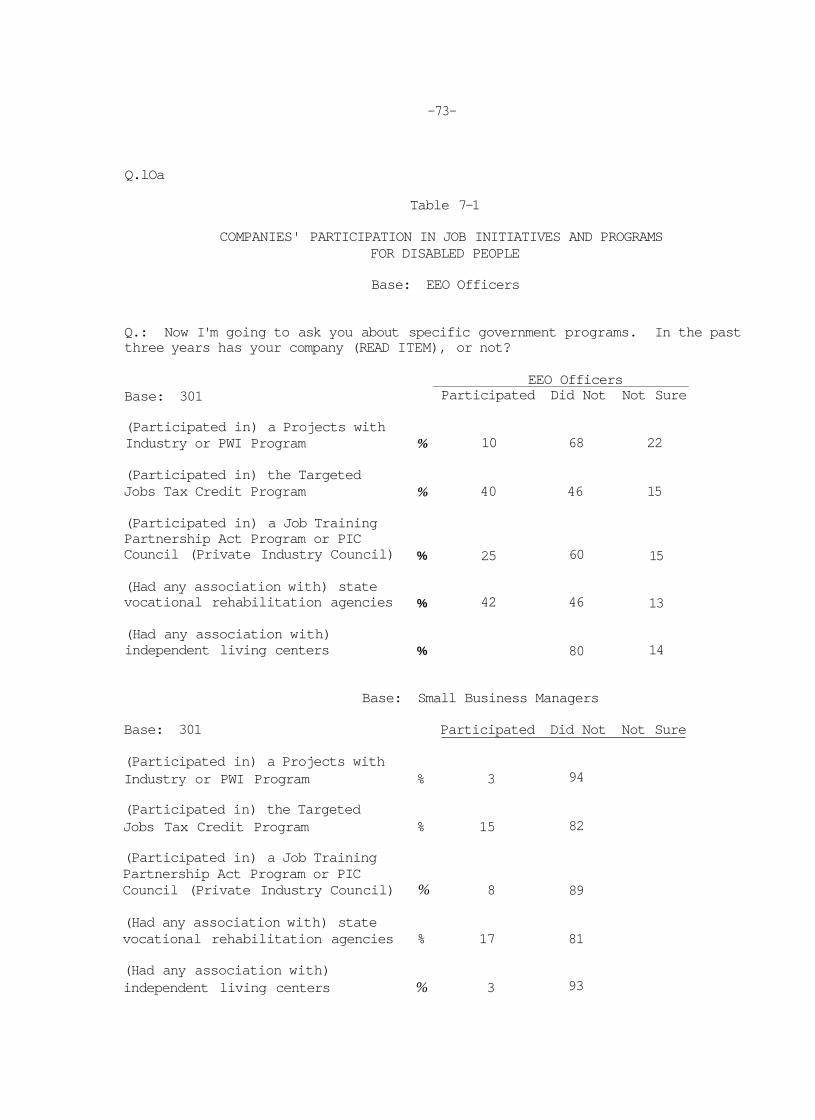
-73-
Q.lOa
Table 7-1
COMPANIES' PARTICIPATION IN JOB INITIATIVES AND PROGRAMS FOR DISABLED PEOPLE
Base: EEO Officers
Q.: Now I'm going to ask you about specific government programs. In the past three years has your company (READ ITEM), or not?
Base: 301
(Participated in) a Projects with Industry or PWI Program
(Participated in) the Targeted Jobs Tax Credit Program
(Participated in) a Job Training Partnership Act Program or PIC Council (Private Industry Council)
(Had any association with) state vocational rehabilitation agencies
(Had any association with) independent living centers
%
%
EEO Officers Participated Did Not Not Sure
10 68 22
40 46 15
%
%
%
25
42
60
46
80
15
13
14
Base: 301
Base: Small Business Managers
Participated Did Not Not Sure
(Participated in) a Projects with Industry or PWI Program % 3
(Participated in) the Targeted Jobs Tax Credit Program % 15
(Participated in) a Job Training Partnership Act Program or PIC Council (Private Industry Council) % 8
(Had any association with) state vocational rehabilitation agencies % 17
(Had any association with) independent living centers % 3
94
82
89
81
93

-74-
Q.lOb
Table 7-2
COMPANIES' EXPERIENCES WITH JOB INITIATIVES AND PROGRAMS FOR DISABLED PEOPLE
Base: EEO Officers whose companies have participated in the program in the past 3 years
Q.: Would you rate your company's experience with (READ ITEM) very successful, somewhat successful, not too successful, or not successful at all?
Not Very Somewhat Not Too Successful Not
Base Successful Successful Successful at All Sure Refused
(Participated in) a Projects with Industry or PWI Program 31* % 26 58 10 3 3-
(Participated in) the Targeted Jobs Tax Credit Program 120 % 23 53 12 5 8-
(Participated in) a Job Training Partnership Act Program or PIC Council (Private Industry Council) 75* % 24 61 9 - 5 -
(Had any association with) state vocational rehabilitation agencies 125 % 15 62 17 3 3-
(Had any association with) independent living centers 19* % 16 63 5 5 11 -
* Percentages of small bases should be interpreted with caution.

-75-
Training Disabled Employees In-House
The majority of managers say that their company Is able to provide
ln-house training for disabled employees. Sixty percent of top managers and 61%
of EEO officers say that they have this capability (Table 7-3). However, only
46% of small business managers say their companies can do so.
Companies that have a policy for hiring disabled people are far more
likely to be able to train them (70%) than are companies without a policy (49%).
Some important reasons why companies cannot train disabled people
in-house include: a lack of special training for managers; a lack of needed
special equipment; and architectural barriers in buildings (Table 7-4).
Observation:
Roughly 40% of companies currently do not have the facilities or personnel to train disabled people in-house, which is presumably a barrier to upward mobility and promotion. Many more corporations could demonstrate a stronger commitment toward employing disabled people by acquiring the capability to train them.
Stronger links between companies and government training programs for disabled people -- i.e., higher participation in the programs discussed above -- could also increase the number of companies capable of training disabled people.

-76-
Q.27
Table 7-3
PERCENTAGE OF COMPANIES THAT CAN TRAIN DISABLED EMPLOYEES
Q. : At present, is your company able to provide in-house training for handicapped employees, or not?
Able to Provide
Type of Manager Top Management EEO Officers Department Heads/ Line Managers
Small Business Managers
Size of Company 10,000 or more employees 1,000-9,999 employees 50-999 employees 10-49 employees
Has Federal Contracts Yes No
Company Has a Policy for Hiring Disabled People Yes 344 % 70 25 5 No 506 % 49 46 5
Base
210 301
210 200
240 242 239 200
273 570
% %
% %
% % % %
% %
Training
60 61
57 46
60 58 61 46
62 54
Not Able
38 34
29 49
28 37 35 49
34 41
Not Sure
1 6
13 6
12 5 3 6
5 5
Refused
*
-
*
-
*
-* -
—
*

-77-
Q.28
Bases:
Table 7-4
REASONS WHY SOME COMPANIES CANNOT TRAIN DISABLED EMPLOYEES
EEO Officers and small business managers in companies that cannot train disabled employees in-house
Important Reason
Not an Important Reason
Not Sure
Q.: (Is/Are) (READ EACH ITEM) an important reason why you currently cannot train handicapped people in-house, or not?
EEO Officers
Base: 101
Architectural barriers in your building %
A lack of needed special equipment %
A lack of special training for your managers and supervisors %
21
38
43
77
59
53
2
3
Base: 97
Architectural barriers in your building
A lack of needed special equipment
A lack of special training for your managers and supervisors
Small Business Managers Not an
Important Important Not Reason Reason Sure
% 19
% 33
% 31
79
64
68
2
3

-78-
CHAPTER 8: REHABILITATION OF EMPLOYEES WHO BECOME DISABLED
All of the findings in this chapter concern corporate attitudes and
policies toward current employees who become disabled, either from injury,
illness, or other health conditions.
The Effects of Rehabilitation Efforts
What are the effects of disability management programs? About half of
managers report that the majority of disabled employees return to work, compared
to 14% to 22% who say that the majority remain disabled or take early
retirement. Many employers, particularly small business managers (50%) say this
question is not applicable to them (Table 8-1).

-79-
Q.19
Table 8-1
WHETHER THE MAJORITY OF DISABLED EMPLOYEES RETURN TO WORK, OR REMAIN DISABLED
Q.: Do the majority of your disabled employees return to work, or do the majority remain disabled or take an early retirement?
Small Top EEO Department Heads/ Business
Management Officers Line Managers Managers Base 210 301 210 200
A> % % %Majority return to work 50 52 47 39
Majority remain disabled/take
early retirement 14 19 22 8
Equal number do both (vol.) 3 2 3 2
Not sure 15 14 14 3
Refused 1 1 *
Not applicable 18 12 13 50

-80-
Prevalence of Various Disability Management Programs
Sixty-seven percent of companies begin monitoring the progress of
employees who go on sick leave or workers' compensation within the first three
months after they stop work (Table 8-2).
Support for rehabilitiation of employees who become sick or injured is
reflected by the prevalence of disability management programs. In rank order of
prevalence, some programs currently in use are: light duty employment options,
or part-time, or flexible hours (72% of EEO officers); a trial work period
during which disability benefits are continued (38% of EEO officers);
consultation from private rehabilitation vendors (36%); and medical case
management (35%). The most common program is long-terra disability benefits
(82%). Small businesses are substantially less likely to offer any of the
programs (Table 8-3).
Observation:
Studies of the rehabilitation of disabled employees strongly recommend intervention at the earliest possible date after employees begin sick leave or workers' compensation. Monitoring of their progress should begin almost immediately, followed by rehabilitation at the first opportunity. The results of early intervention and disability management are a significant increase in the proportion of disabled employees who fully return to their jobs.

-81-
Q.23
Table 8-2
WHEN COMPANIES BEGIN MONITORING DISABLED EMPLOYEES' PROGRESS
Q.: When employees go on sick leave or on workers compensation, after filing claims do you begin monitoring their progress within the first month they're out, or after one to three months, or after four to six months, or after more than six months?
EEO Officers Base 301
%
Within first month 40
After 1 to 3 months 27
After 4 to 6 months 3
After more than 6 months 5
Depends (vol.) 4
Do not monitor progress (vol.) 4
Not sure 16
Refused 2

-82-
Q.22
Table 8-3
PREVALENCE OF VARIOUS DISABILITY MANAGEMENT PROGRAMS
Bases: EEO Officers and Small Business Managers
Does your company have (READ EACH ITEM) for any disabled employees, or not?
Base: 301
Long-term disability benefits
Light duty employment options, or part-time, or flexible hours
A trial work period during which disability benefits are continued
Consultation from private rehabilitation vendors
Medical case management
Base: 200
Long-term disability benefits
Light duty employment options, or part-time, or flexible hours
A trial work period during which disability benefits are continued
Consultation from private rehabilitation vendors
Medical case management
%
%
%
EEO Officers Has Not Have Not Sure Refused
82
72
% 38
38
55
21
% 8
% 16
14
22
40 21
%
%
36
35
Has
54 10 *
41 24 1
Small Business Managers Does
Not Have Not Sure Refused
59
44
74
90
79
2
5
*Less than 0.5%.
-83-
Potential Problems When Employees Return to Work
It has, on occasion, been suggested that disabled employees, encounter
resistance from labor unions or supervisors and co-workers when they seek to
return to work. Unions, it has been alleged, sometimes resist job modifications
or reassignments. In reality those problems occur only very rarely.
Overwhelmingly employers have not encountered them.
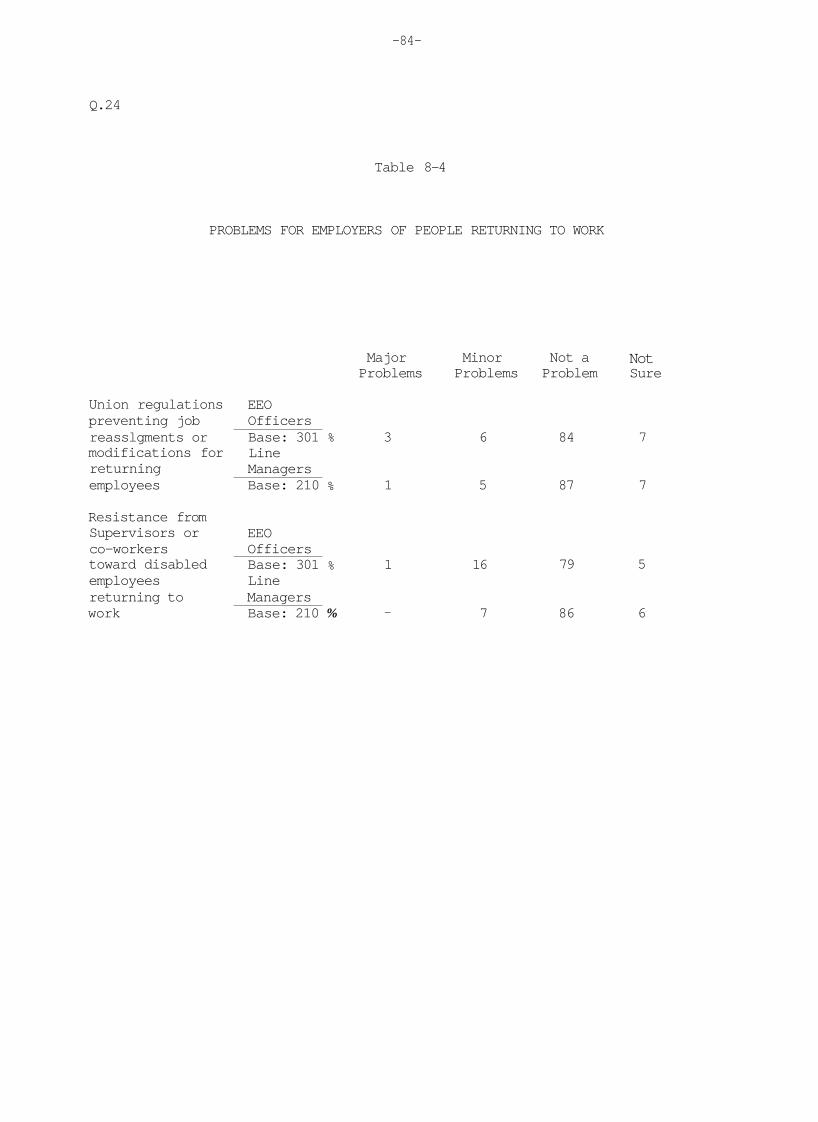
-84-
Q.24
Table 8-4
PROBLEMS FOR EMPLOYERS OF PEOPLE RETURNING TO WORK
Union regulations preventing job reasslgments or modifications for returning employees
Resistance from Supervisors or co-workers toward disabled employees returning to work
EEO Officers Base: 301 Line Managers Base: 210
EEO Officers Base: 301 Line Managers Base: 210
%
%
%
%
Major Problems
3
1
1
-
Minor Problems
6
5
16
7
Not a Problem
84
87
79
86
Not Sure
7
7
5
6

-85-
Managers' Attitudes Toward Rehabilitation
A three-fourths majority of top managers (73%), EEO officers (74%),
and department heads/line managers (78%) think that employers have a
responsibility to rehabilitate their employees who become disabled. An
additional 8% to 10% believe that employers have this responsibility only when
employees become injured on the job (Table 8-5).
A majority (57%), albeit a smaller one, of small employers agree that
companies have this responsiblity.
Equally large majorities of managers believe that it is more
cost-effective to rehabilitate disabled employees and return them to work than
to pay them disability benefits and replace them (Table 8-6).
However seven out of ten managers also believe that their companies
should not make a greater effort to rehabilitate disabled employees because they
are doing enough now (Table 8-7)
Observation:
These findings suggest some complacency and that rehabilitation is not a high priority. Large majorities of managers are supportive of rehabilitation, at least in theory, and say that it is their responsibility. However, the great majority feel that they're trying hard enough now to accomplish this.

-86-
Q.18
Table 8-5
WHETHER OR NOT EMPLOYERS HAVE A RESPONSIBILITY TO REHABILITATE DISABLED EMPLOYEES
Q.: Now let's talk about current employees who become disabled, either from injury, illness, or some other health condition. Do you think that employers have a responsibility to rehabilitate their employees who become disabled, or not?
Small Top EEO Department Heads/ Business
Management Officers Line Managers Managers Base
Employers have a responsibility
Do not have a responsibility
Have a responsibility only if injured on the job (vol.)
Not sure
210 %
73
13
10
4
301 %
74
11
9
5
210 %
78
9
8
6
200 %
57
17
16
10
Refused 1 1
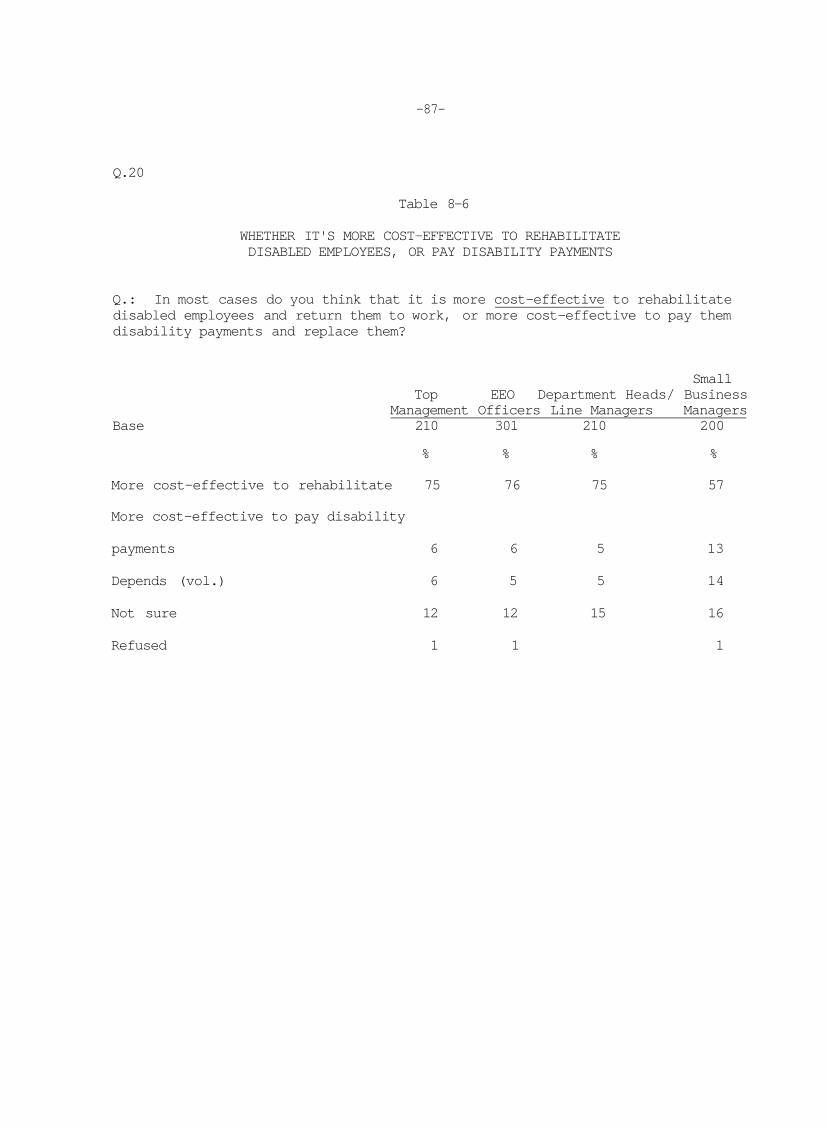
-87-
Q.20
Table 8-6
WHETHER IT'S MORE COST-EFFECTIVE TO REHABILITATE DISABLED EMPLOYEES, OR PAY DISABILITY PAYMENTS
Q.: In most cases do you think that it is more cost-effective to rehabilitate disabled employees and return them to work, or more cost-effective to pay them disability payments and replace them?
Small Top EEO Department Heads/ Business
Management Officers Line Managers Managers Base 210 301 210 200
% % % %
More cost-effective to rehabilitate 75 76 75 57
More cost-effective to pay disability
payments 6 6 5 13
Depends (vol.) 6 5 5 14
Not sure 12 12 15 16
Refused 1 1 1

-88-
Q.21
Table 8-7
WHETHER OR NOT COMPANIES SHOULD RETURN MORE DISABLED EMPLOYEES TO WORK
Q.: Do you think that your company should make a greater effort than it makes now to return more disabled employees to their former jobs or place them elsewhere in your company, or is it doing enough now?
Top Management
Base 210
%
Should make a greater effort 16
Doing enough now 70
Not sure 2
Refused
Not applicable 12
Small EEO Department Heads/ Business
Officers Line Managers Managers 301 210 200
% % %
9 8 7
75 74 69
7 9 4
1 * 1
9 9 20

-89-
CHAPTER 9: THE LIKELIHOOD THAT COMPANIES WILL INCREASE EFFORTS TO HIRE DISABLED PEOPLE
Whether Companies Should Do More to Employ Disabled People
Most managers think that their companies should not make greater
efforts to employ disabled people because they are already doing enough.
Sixty-seven percent of top managers, 71% of EEO officers, 70% of department
heads/line managers, and 76% of small business managers think that their
companies are doing enough now to employ disabled people (Table 9-1).
But majorities of all management groups surveyed think it is somewhat
likely or very likely that in the next three years their companies will make
greater efforts to employ disabled people. Fifty-seven percent of top managers,
58% of EEO officers, and 63% of line managers think it is likely that their
companies will make greater efforts to employ disabled people in the near
future. Among small business managers the figure is somewhat lower (46%) (Table
9-2).
Observation:
Employers repeat a theme that appeared earlier in the findings. They are willing to try harder to employ more disabled people, and may do so, but they expect disabled people and employment agencies to take the lead in increasing the pool of qualified job applicants.

-90-
Q.25
Table 9-1
WHETHER OR NOT COMPANIES SHOULD DO MORE TO EMPLOY DISABLED PEOPLE
Q.: Do you think that your company should make a greater effort than it makes now to employ handicapped people, or is it doing enough now?
Base
Should do more now
Doing enough now
Not sure
Refused
Top Management
210 %
30
67
2
1
EEO Officers 301
%
26
71
3
_
Department Heads/ Line Managers
210 1
19
70
10
1
Small Business Managers 200
%
17
76
7
1
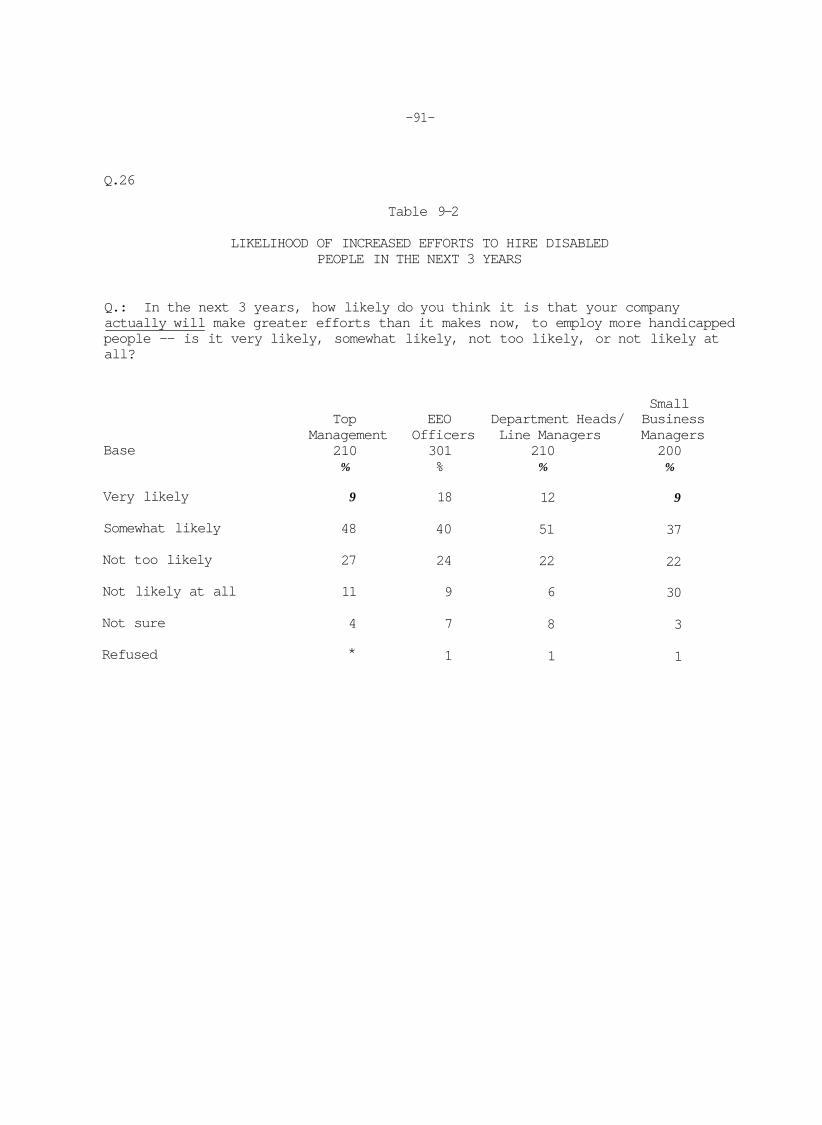
-91-
Q.26
Table 9-2
LIKELIHOOD OF INCREASED EFFORTS TO HIRE DISABLED PEOPLE IN THE NEXT 3 YEARS
Q.: In the next 3 years, how likely do you think it is that your company actually will make greater efforts than it makes now, to employ more handicapped people -- is it very likely, somewhat likely, not too likely, or not likely at all?
Small
Base
Very likely
Somewhat likely
Not too likely
Not likely at all
Not sure
Refused
Top Management
210 %
9
48
27
11
4
*
EEO Officers 301 %
18
40
24
9
7
1
Department Heads/ Line Managers
210 %
12
51
22
6
8
1
Business Managers 200
%
9
37
22
30
3
1

-92-
Top Management's Commitment to Employing Disabled People
Top managers are divided about whether they could demonstrate a
stronger commitment to employing disabled people than they do now. Half (49%)
believe that they could, and half don't (46%) (Table 9-3).
Among those who feel that a greater effort could be made, most feel
that the way to do this would be to encourage or order personnel departments and
supervisors to hire more disabled people. Other approaches suggested would be
to increase awareness that disabled employees do as well as other employees, and
increase contact with agencies that place disabled people in jobs (Table 9-4).

-93-
Q.24
Table 9-3
WHETHER TOP MANAGEMENT COULD DEMONSTRATE A STRONGER COMMITMENT TO EMPLOYING DISABLED PEOPLE
Base: Top Managers
Q.: What about the role played by top management in your company -- do you think that top management could demonstrate a stronger commitment to increased employment of handicapped people than you do now, or not?
Could Demonstrate a Stronger
Base Commitment Could Not Not Sure Refused
Top Managers 210 % 49 46 4 1

-94-
Q.25
Table 9-4
HOW TOP MANAGERS CAN DEMONSTRATE A STRONGER COMMITMENT TO EMPLOYING DISABLED PEOPLE
Base: Top Managers who say they could demonstrate a stronger commitment to employing disabled people
Q.: What do you think is the most important thing that top managers like yourself can do to demonstrate a stronger commitment to employing handicapped people?
Top Managers 102
%
Hire handicapped 25
Instruct/encourage personnel/supervisors to hire
handicapped 22
Reinforce/establish company policy 13
More involvement in the process 12
Increase awareness that handicapped are equal to/
as good as other employees 12
More active recruitment/actively seek out handicapped 10
Contact agency/meet with agency 9
Training for handicapped 3
All other mentions 12
Don't know 9

-95-
CHAPTER 10: STEPS AND POLICY CHANGES TO INCREASE EMPLOYMENT OF DISABLED PEOPLE
Steps for Public and Private Agencies to Take
EEO officers named the most important steps that public and private
agencies should take that they are not taking now, to help companies employ
disabled people (Table 10-1).
The most common responses are the obvious ones --an increased flow of
information to employers about available applicants, and increased and
appropriate job training for disabled people, training programs, and placement
agencies. Employers would also like to know what specific skills candidates
have that would be compatible with available jobs. They would even like
agencies to provide specific training for particular positions.
Employers see a need for disabled applicants to be more aggressive
about marketing themselves. That message translates into more intense coaching
by agencies, to accustom disabled applicants to discussing their job skills and
attributes. Agencies should also do a better job of informing their clients
about job opportunities, according to employers.
Observation:
These responses outline a plan-of-action for rehabilitation and placement agencies to follow as they work with disabled people and employers to match candidates with positions.

-96-
Q.lOc
Table 10-1
MOST IMPORTANT STEPS FOR PUBLIC AND PRIVATE AGENCIES TO INCREASE EMPLOYMENT OF DISABLED PEOPLE
Q.: What is the most important step that public or private agencies should take that they are not taking now, to help companies like yours employ handicapped people? Anything else?
EEO Officers 301 %
Job training/programs for disabled people 16
Information on availability of applicants 10
Make employers aware of programs/agencies 9
Identify/target specific skills compatible
with available jobs 6
Encourage disabled people to apply/send applicants 5
More aggressive approach/marketing 5
Eliminate prejudice/fear/mlsconceptions of
disabled people 3
Specific training for specific jobs available 3
Job referral service 2
Make disabled people aware of job opportunities 2
Eliminate government involvement 1
Too many barriers for disabled people in our industry 1
Vocational training *
Focus on applicant's ability, not disability *
All other mentions 28
None/no steps 2
Don't know - 12
*Less than 0.5%.

_97-
The Perceived Effect of Increased Tax Deductions
Some tax deductions currently are available to companies that
participate in certain government training programs for disabled people, such as
the Targeted Jobs Tax Credit Program. Managers were asked if increased tax
deductions and financial incentives would induce employers to train and employ
more disabled people.
All four manager groups, as well as managers in different size
companies, are divided in their responses. Roughly half believe that increased
tax deductions and financial incentives would induce greater employment of
disabled people, while the other half believe that tax incentives would have no
effect (Table 10-2).
Observation:
Tax incentives would undoubtedly induce some companies to employ more disabled people. How many companies would be persuaded to act? That would depend on the size of the deductions. In considering the impact of tax deductions one should note that factors such as the paperwork involved and the type of deduction are also relevant.

-98-
Q.29
Table 10-2
WHETHER INCREASED TAX DEDUCTIONS WOULD HELP EMPLOY MORE DISABLED PEOPLE
Q.: Do you think that increased tax deductions and financial incentives would induce employers like yourself to train and employ more handicapped people, or not?
Would Induce Would Greater Not Depends Not
Base Employment Induce (Vol.) Sure Refused
Type of Manager Top Management EEO Officers Department Heads/ Line Managers
Small Business Managers
Number of Employees 10,000 or more employees 1,000-9,999 employees 50-999 employees 10-49 employees
Company has a Policy for Hiring Disabled People Yes No
210 301
210 200
240 242 239 200
344 506
% %
% %
% % % %
% %
46 56
57 47
56 49 54 47
50 52
50 39
32 47
36 45 39 47
43 42
2 2
4 3
3 4 2 3
3 3
1 3
7 3
5 2 4 3
4 3
* -
* 1
ft
-* 1
* *
*Less than 0.5%.

-99-
Managers Rate the Effectiveness of Proposed Policy Changes
The final section of the survey sought managers' reactions to 13
different initiatives and policy changes that have been proposed to help
increase the employment of disabled people. It is a richly diverse list
designed to meet the varying employment needs of employers in large, medium, and
small companies, and in different industries. The list also reflects the
important roles played by our entire society in this effort, including
employers, federal and state agencies, legislators at both the state and federal
level, private rehabilitation agencies and placement services, and foundations.
For each item on the list, managers were asked whether it would be
very effective, somewhat effective, not too effective, or not effective at all
in helping them to hire handicapped people, or retain handicapped employees.
What emerges is a strong and fairly uniform level of endorsement for
ten of the 13 proposals. Only one proposal ranks far above the others by
receiving majority endorsement as a very effective change.
The rank ordering of the perceived effectiveness of these proposals is
as follows (Table 10-3):
Establishing direct training and recruiting programs with schools and
vocational rehabilitation agencies: 54% of managers rate this step as very
effective, and 38% rate it somewhat effective.
Having more companies provide internships or part-time jobs to
disabled persons as an introduction to full-time jobs: 35% of managers rate
this very effective, and 53% rate it somewhat effective.
Having employers explain specific functional requirements as part of
job descriptions for open positions: 35% rate this very effective, and 45% rate
it somewhat effective.

-100-
Having the government provide additional tax deductions for expensive
accommodations, or share in their cost: 27% consider this very effective, and
47% consider it somewhat effective.
Having the government subsidize salaries for severely disabled
employees for a trial period: 26% rate this very effective, and 42% rate it
somewhat effective.
Having disability professionals give technical assistance or counsel
to employers for accommodations or problems with specific employees: 24% rate
this very effective, and 57% rate it somewhat effective.
Having chief executive officers establish voluntary employment targets
for disabled people: 24% rate this very effective, and 48% rate it somewhat
effective.
Having foundations and trusts pay some costs for on-the-job training
for disabled employees: 23% rate this very effective, and 56% rate it somewhat
effective.
Broadening federal affirmative action requirements so that disabled
people get the same coverage as other minority groups: 23% rate this very
effective, and 42% rate is somewhat effective.
Having outside rehabilitation vendors provide job coaches to companies
to help disabled employees learn their jobs: 22% rate this very effective, and
48% rate it somewhat effective.
Having companies provide awareness training to employees about the
special needs of disabled employees and company policies towards them: 21%
consider this very effective, and 52% consider it somewhat effective.
Only top managers were asked the next two proposals:
Having a group of chief executive officers in major companies appeal
to business and government to employ more handicapped people: 13% of top
managers rate this very effective, and 46% rate it somewhat effective.

•101-
Increasing the recognition for companies with exemplary records for
employing disabled people: 12% of top managers rate this very effective, and
63% rate it somewhat effective.

-102-
Q.30 Table 10-3
MANAGERS REACT TO PROPOSED POLICY CHANGES THAT MIGHT INCREASE EMPLOYMENT OF DISABLED PEOPLE
Base: All managers
Q.: And finally, I'm going to read some proposed initiatives and policy changes which might help to employ more handicapped people. Please say if you think each one would be very effective, somewhat effective, not too effective, or not effective at all in helping employers to hire handicapped people, or retain disabled employees.
Base: 921
Not Very Somewhat Not Too Effective Not
Effective Effective Effective at All Sure Refused
Establishing direct training and recruiting programs with schools and vocational rehabilitation agencies so that employers meet more qualified handicapped applicants % 54 38 1 *
Having more companies provide internships or part-time jobs as a way of opening the door to full-time jobs for handicapped people % 35 53 1 *
Having employers explain specific functional requirements as part of job descriptions for openings % 35 45 12 1 *
Having the government provide additional tax deductions for, or share in the cost of, expensive accommodations % 27 47 16 1 *
Having the government subsidize salaries for severely handicapped employees for a trial period % 26 42 17 12 2 *
Having disability professionals give technical assistance or counsel to employers for accommodations or problems with specific handicapped employees 24 57 12 2 *
(Continued)
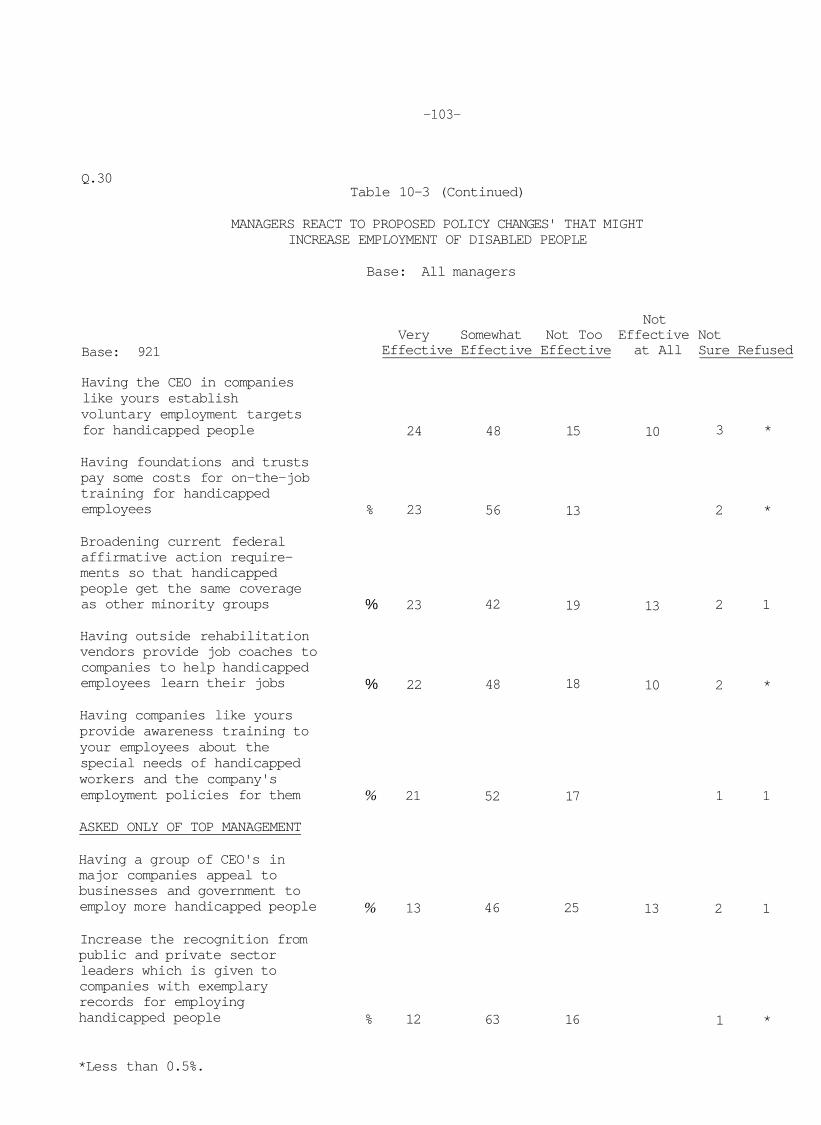
-103-
Q.30 Table 10-3 (Continued)
MANAGERS REACT TO PROPOSED POLICY CHANGES' THAT MIGHT INCREASE EMPLOYMENT OF DISABLED PEOPLE
Base: All managers
Base: 921
Not Very Somewhat Not Too Effective Not
Effective Effective Effective at All Sure Refused
Having the CEO in companies like yours establish voluntary employment targets for handicapped people
Having foundations and trusts pay some costs for on-the-job training for handicapped employees
Broadening current federal affirmative action requirements so that handicapped people get the same coverage as other minority groups
Having outside rehabilitation vendors provide job coaches to companies to help handicapped employees learn their jobs
Having companies like yours provide awareness training to your employees about the special needs of handicapped workers and the company's employment policies for them
ASKED ONLY OF TOP MANAGEMENT
Having a group of CEO's in major companies appeal to businesses and government to employ more handicapped people
Increase the recognition from public and private sector leaders which is given to companies with exemplary records for employing handicapped people
24 48 15 10 3 *
% 23 56 13 2 *
% 23 42 19 13 2 1
% 22 48 18 10 2 *
% 21 52 17 1 1
% 13 46 25 13 2 1
% 12 63 16 1 *
*Less than 0.5%.

-104-
APPENDIX A: SURVEY METHOD

-105-
Sample Design
For this study, ten systematic samples were drawn from the Dunn &
Bradstreet universe of corporations in the United States:
o Three separate samples of corporations with 10,000 or more employees generated interviews with 70 top managers, 100 equal employment opportunity (EEO) officers, and 70 department heads or line managers. The sample of top managers was drawn only from corporate headquarters. The other two samples were drawn from branch or single locations.
o Three separate samples of corporations with 1,000 to 9,999 employees generated interviews with 71 top managers, 101 EEO officers, and 70 department heads or line managers. As in the samples of larger companies, top managers were drawn from headquarters locations, and the other two samples were drawn from branch or single locations.
o Three separate samples of corporations with 50-999 employees generated interviews with 69 top managers, 100 EEO officers, and 70 department heads or line managers. Once again, top managers were drawn from headquarters locations, and the other two samples were drawn from branch or single locations.
o A sample of corporations with 10-49 employees generated 200 interviews with principals or ranking officers.
In all, 921 interviews were conducted in 921 companies. Factual
profiles of the companies are displayed in Table A-2.
Interviewing
All interviews were conducted by telephone from the New York offices
of Louis Harris & Associates during September and October, 1986. Interviews
were conducted on weekdays from 9:00 a.m. to 5:00 p.m. When necessary,
appointments were made to interview the relevant officers in a company.
Up to three callback attempts were made to reach all selected
respondents in the three separate groups.

-106-
Questionnaires
Four questionnaires were developed for the study: one for top
managers, one for EEO officers, one for department heads and line managers, and
one for top managers in very small companies. All four questionnaires are
nearly identical, but each contains some unique questions. Appendix B contains
a copy of the questionnaire used for EEO officers. Copies of the other
questionnaires can be obtained from L C D .
Data Processing
The editing, coding, and data processing of all questionnaires were
conducted by Louis Harris & Associates.
Codes were developed for responses to open-ended questions, with only
those responses given by less than 0.2% of the respondents being coded as
"other" responses.
Sampling Error
Table A-3 indicates the sampling error associated with various sample
sizes and the reported sample percentages, at the 95% confidence level.

-107-
Table A-l
SAMPLE DISPOSITION
Total number called 1926
Ineligible
-- No reply after 4 calls 204
-- Duplicate number 14
-- Wrong number (not company listed) 17
Respondent away for duration of survey 101
-- Not in service 65
401
Total Eligible 1525
Not interviewed because
Respondent terminated during interview 39
Respondent refused 547
Respondent busy 18
Interviewed 921

-108-
Table A-2
THE SAMPLES
Base
Size of Company
10,000 or more employees 1,000-9,999 employees 50-999 employees 10-49 employees
Region
Total
921 %
Top EE0 Line Managers of Managers Officers Managers Small Companies
210
% in Blue Collar or Skilled Labor
(Median)
Unionized or Not
52 54
301 %
50
210
26 26 26 22
33 34 33
33 33 33
33 33 33
49
200 %
100
East Midwest South West
Type of Business
Manufacturing Wholesale or retail Financial services Other services Other
26 24 31 19
30 29 17 18 10
38 23 25 14
41 17 15 16 12
21 23 32 25
28 32 21 17 10
21 24 37 18
28 34 20 17 5
26 26 31 19
26 29 11 21 12
49
Has union members Does not
Federal Government Contracts
Has Does not have
Type of Disability Insurance
Outside Self-insured Both
34 65
30 62
57 30 6
51 49
42 55
52 32 11
35 63
36 51
53 34 7
36 62
28 57
50 36 4
12 88
9 91
76 15 3

-109-
Table A-3
SAMPLE ERROR This table shows the sampling tolerance, at 95% confidence level, to use in evaluating any individual percentage result.
REPORTED SAMPLE PERCENTAGE
Result Is Based 10% or 90% 20% or 80% 30% or 70% 40% or 60% Result at 50%
900
800
700
600
500
400
300
200
100
50
2
2
2
2
3
3
3
4
6
8
3
3
3
3
4
4
5
6
8
11
3
3
3
4
4
4
5
6
9
13
3
3
4
4
4
5
6
7
10
14
3
3
4
4
4
5
6
7
10
14

-110-
APPENDIX B: QUESTIONNAIRE
Note: In the interest of keeping down the length of this report, only one
of the four questionnaires is included. The other three questionnaires were
similar but shorter. Copies can be obtained on request from I.C.D.

LOUIS HARRIS AND ASSOCIATES, INC. / FOR OFFICE USE ONLY: 630 Fifth Avenue / New York, New York 10111 / Questionnaire No.:
/ 5-6-7-8_
Study No. 864009
August 28, 1986 (EEO Officers) Sample Point No./ / / / / / /
10-11-12-13-14-15
Time Started: A.M./P.M.
Interviewer: I.D. No. : Date: Area Code: Telephone No. :
(16-25)
Respondent's Name:.
Title:
Organization:.
Address:
City/Town: State: Zip:.
SWITCHBOARD INTRODUCTION:
Hello, I'm calling from Louis Harris and Associates, the opinion polling firm in New York. I am trying to identify the senior manager responsible for equal employment opportunity in your company. Could you give me that person's name and telephone extension please? RECORD NAME ABOVE.
RESPONDENT INTRODUCTION:
Hello, I'm calling from Louis Harris and Associates, the opinion polling firm in New York. I would like to confirm that you are (RESPONDENT NAME), the manager responsible for equal employment opportunity.
(IF NAME AND RESPONSIBILITIES CONFIRMED, CONTINUE. IF NOT, ASK: Could you please tell me who is the equal employment opportunity manager? RECORD NAME AND REPEAT INTRODUCTION WITH PROPER RESPONDENT.)
We are conducting a survey on the employment of people with disabilities, (and are interested in your opinions and your organization's policies).
OPTIONAL: As in all our surveys, neither your name nor your organizational affiliation will ever be released, and the results of this study will be reported in aggregate form only.
OPTIONAL: The interview will take about 15-20 minutes. When the survey is finished we will send you a copy of the full report, which will be designed to help employers with the employment of handicapped people.
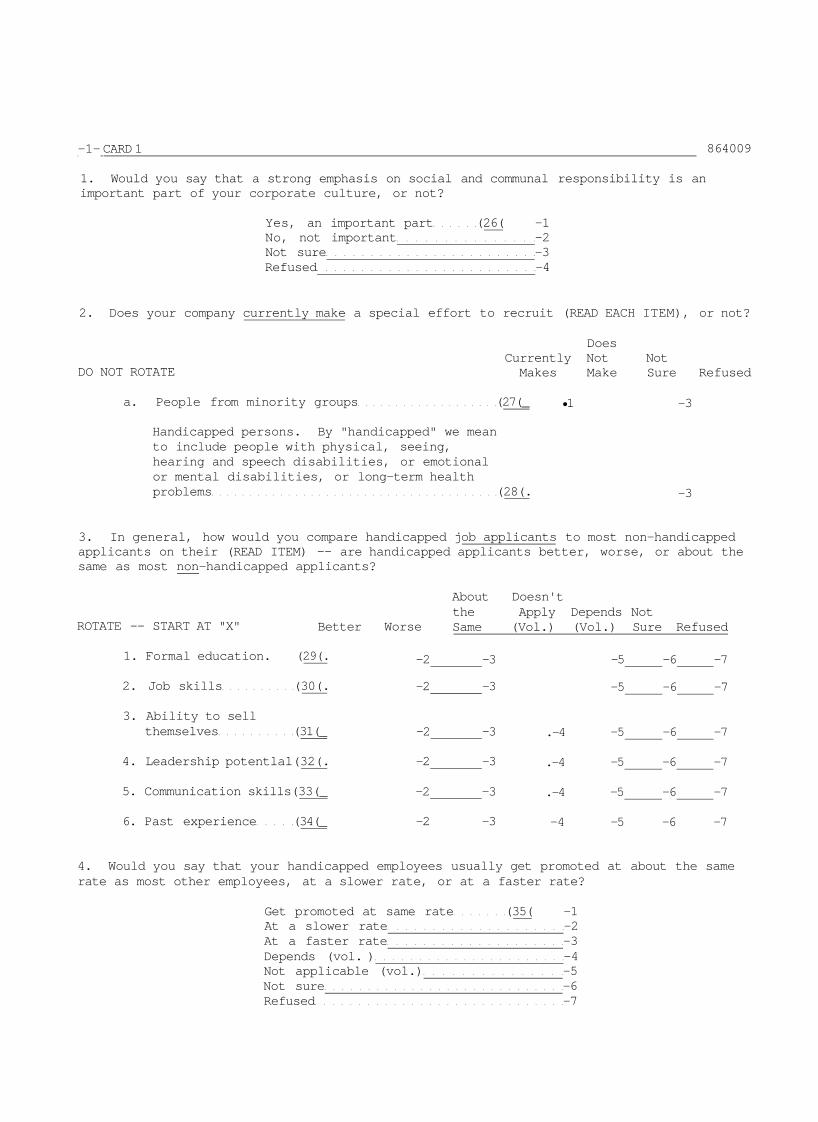
-1- CARD 1
1. Would you say that a strong emphasis on social and communal responsibility is an important part of your corporate culture, or not?
Yes, an important part (26( -1 No, not important -2 Not sure -3 Refused -4
864009
2. Does your company currently make a special effort to recruit (READ EACH ITEM), or not?
DO NOT ROTATE
Does Currently Not Not Makes Make Sure Refused
a. People from minority groups (27(_
Handicapped persons. By "handicapped" we mean to include people with physical, seeing, hearing and speech disabilities, or emotional or mental disabilities, or long-term health problems (28(.
•1 -3
-3
3. In general, how would you compare handicapped job applicants to most non-handicapped applicants on their (READ ITEM) -- are handicapped applicants better, worse, or about the same as most non-handicapped applicants?
ROTATE -- START AT "X"
1. Formal education.
Better Worse
(29(.
2. Job skills (30(.
3. Ability to sell themselves (31(_
4. Leadership potentlal(32(.
5. Communication skills(33(_
6. Past experience (34(_
-2 -3
-2 -3
-2 -3
-2 -3
-2 -3
-2 -3
About Doesn't the Apply Depends Not Same (Vol.) (Vol.) Sure Refused
.-4
.-4
.-4
-4
-5 -6 -7
-5 -6 -7
-5 -6 -7
-5 -6 -7
-5 -6 -7
-5 -6 -7
4. Would you say that your handicapped employees usually get promoted at about the same rate as most other employees, at a slower rate, or at a faster rate?
Get promoted at same rate (35( -1 At a slower rate -2 At a faster rate -3 Depends (vol. ) -4 Not applicable (vol.) -5 Not sure -6 Refused -7

-2- CARD 1 864009
5. Let me read you some statements that people have made about employing handicapped people. For each, please say if you agree strongly, agree somewhat, disagree somewhat, or disagree strongly? READ EACH STATEMENT
Dis- Not Agree agree Appli- No
Agree Some- Some- Disagree cable Not Answer/ ROTATE -- START AT "X" Strongly what what Strongly (Vol.) Sure Refused
( ) a. Special privileges usually must be made for handicapped employees (36( -1 -2 -3 -4 -5 -6 -7
( ) b. Handicapped employees have fewer accidents on the job than do non-handicapped employees (37( -1 -2 -3 -4 -5 -6 -7
( ) c. Handicapped people just don't fit in with most non-handicapped employees (38( -1 -2 -3 -4 -5 -6 -7
6. Do you think that the civil rights laws that cover minorities against discrimination should also cover handicapped persons, or not? (IF RESPONDENT SAYS THAT LAWS ALREADY COVER THEM, PROBE WITH: Do you think that civil rights laws should or should not ....?)
Yes, should cover (39( -1 No, should not cover -2 Not sure -3 Refused -4
7. Do you feel that handicapped people often encounter job discrimination from employers, or not?
Yes, encounter discrimination....(40( -1 No, do not encounter -2 Not sure -3 Refused -4
8a. Does your company have an established policy or program for the hiring of handicapped people, or not?
Yes, has a policy or program. . (41(___-1 (ASK Q.8b)
No, has no policy or program -2 Not sure -3 SKIP TO Q.8e) Refused -4
8b. Does your company have a specific person or department that oversees the hiring of handicapped people, or not?
Yes, has specific person/department (42( ~1 No, does not have specific person/department -2 Not sure -3 Refused -4

-3- CARD 1 864009
8c. Does your company policy require that you employ a certain number of handicapped people, or have a certain proportion of handicapped employees in your work force, or not?
Yes, policy requires a certain number of handicapped employees (43( -1
No, policy does not require this -2 Not sure -3 Refused -4
8d. Does your company have any program or distribute any literature that helps your managers and employees learn to work with handicapped people, or not?
Yes, has program or literature (44( -1 No, does not have program or literature -2 Not sure -3 Refused -4
8e. Has your company hired any handicapped people in the past 3 years, or not? (NOTE: RESPONDENT MAY ASK IF QUESTION REFERS TO THEIR LOCATION OR THE WHOLE COMPANY. TELL THEM TO ANSWER FOR THE LOCATIONS THEY FEEL QUALIFIED TO SPEAK ABOUT.)
Yes, have hired (45( -1 (SKIP TO Q.9a)
No, have not hired -2 (ASK Q.8f)
Not sure -3 (SKIP TO Q.9a) Refused
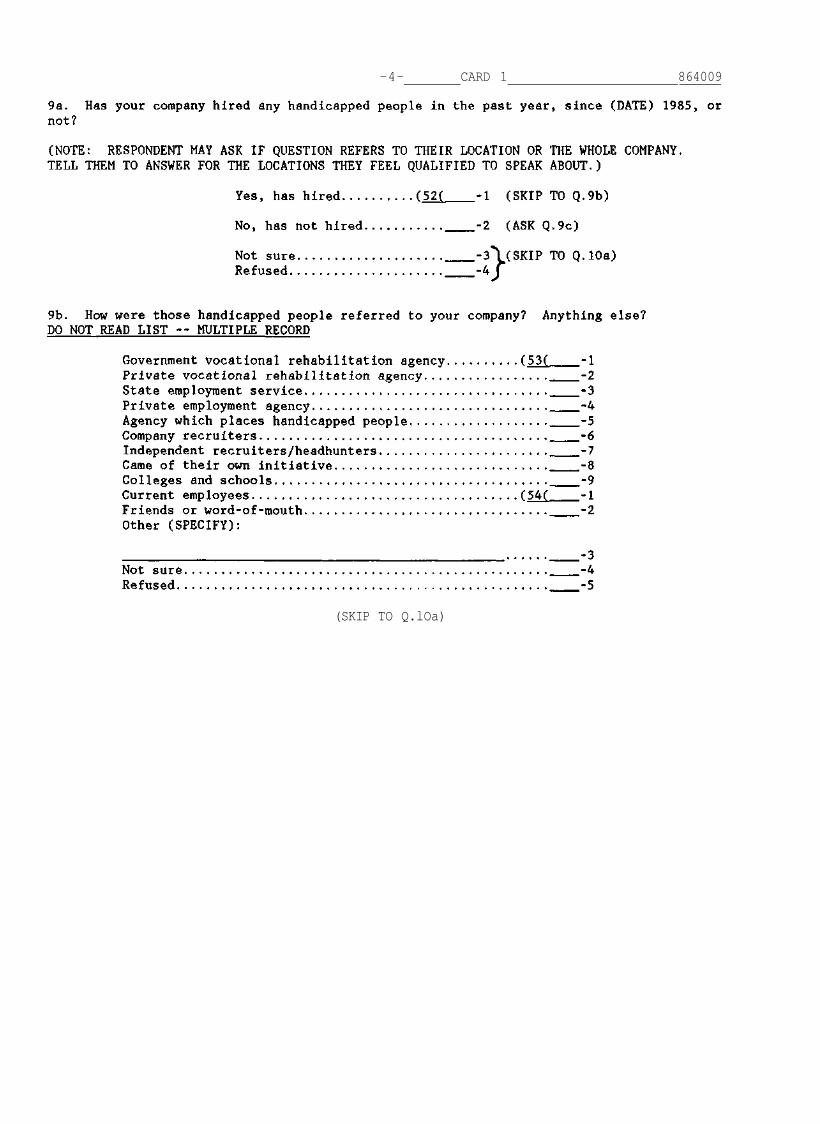
-4- CARD 1 864009
(SKIP TO Q.lOa)


11b. Is this information used in making hiring decisions, or not?
Used (78( -1 Not used -2 Not sure -3 Refused -4
l1e. Does your company encourage job candidates and employees to self-identify themselves as handicapped or as having a specific disability, or not?
Yes, candidates/employees encouraged to self-identify (79( -1
No, not asked -2 Not applicable (vol.) -3 Not sure -4 Refused -5
l1d. Now let's talk about your company's experiences with handicapped employees, past and present. In general, how would you rate the job performance of handicapped employees who work for your company -- excellent, good, only fair, or poor?
Excellent (80( -1 Good -2 Only fair -3 Poor -4 Not applicable (vol.)... -5 Not sure -6 Refused -7
12. I'm going to read some criteria used to evaluate employees. How would you rate handicapped employees on their (READ EACH ITEM) -- are they better, worse, or about the same as non-handicapped employees in similar jobs?
About the Not
ROTATE -- START AT "X" Better Worse Same Sure Refused
) a. Leadership ability (2*10(
) b. Desire for promotion (11(
) c. Attendance and punctuality on the job.(12(.
) d. Willingness to work hard (13(.
) e. Reliability (14(,
) f. Productivity (15(.
-2 -3
-2 -3
-2 -3
-2 -3
-2 -3
-2 -3
4 -5
4 -5
4 -5
4 -5
4 -5
4 -5

-8- CARD 2 864009
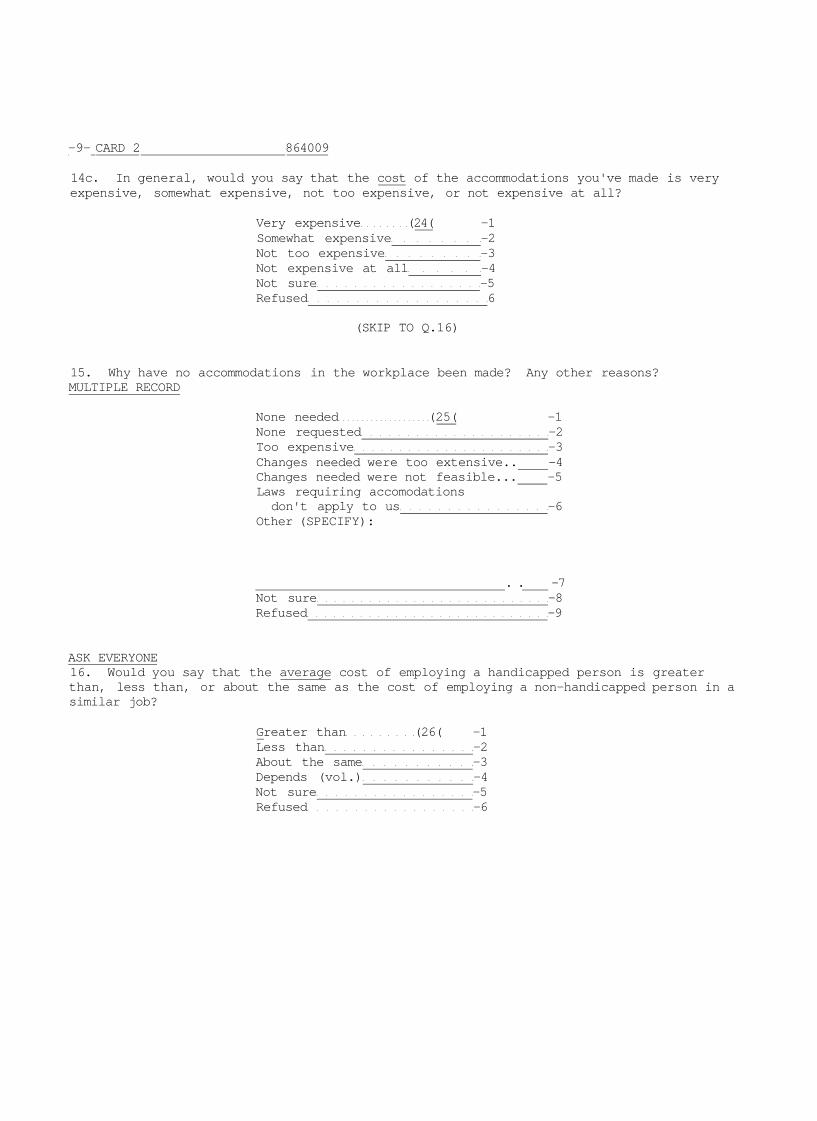
-9- CARD 2 864009
14c. In general, would you say that the cost of the accommodations you've made is very expensive, somewhat expensive, not too expensive, or not expensive at all?
Very expensive (24( -1 Somewhat expensive -2 Not too expensive -3 Not expensive at all -4 Not sure -5 Refused 6
(SKIP TO Q.16)
15. Why have no accommodations in the workplace been made? Any other reasons? MULTIPLE RECORD
None needed (25( -1 None requested -2 Too expensive -3 Changes needed were too extensive.. -4 Changes needed were not feasible... -5 Laws requiring accomodations don't apply to us -6
Other (SPECIFY):
. . -7 Not sure -8 Refused -9
ASK EVERYONE 16. Would you say that the average cost of employing a handicapped person is greater than, less than, or about the same as the cost of employing a non-handicapped person in a similar job?
Greater than (26( -1 Less than -2 About the same -3 Depends (vol.) -4 Not sure -5 Refused -6

-10- CARD 2 864009
17. Do you think that it is more difficult to fire a handicapped employee than a non-handicapped employee, or not?
Yes, more difficult (2_7_L__-l No, not more difficult -2 Not sure -3 Refused -4
18. Now let's talk about current employees who become disabled, either from injury, illness, or some other health condition. Do you think that employers have a responsibility to rehabilitate their employees who become disabled, or not?
Yes, have responsibility (28( -1 No, do not have -2 Have a responsibility only if they're injured on the job (vol.)... -3
Not sure -4 Refused -5
19. Do the majority of your disabled employees return to work, or do the majority remain disabled or take an early retirement?
Majority return to work (29( -1 Majority remain disabled/take early retirement -2 Equal number do both (vol.) -3 Not applicable (vol.) -4 Not sure -5 Refused -6
20. In most cases do you think that it is more cost-effective to rehabilitate disabled employees and return them to work, or more cost-effective to pay them disability payments and replace them?
More cost-effective to rehabilitate....(30( -1 More cost-effective to pay disability payments -2
Depends (vol.) -3 Not sure -4 Refused -5
21. Do you think that your company should make a greater effort than it makes now to return more disabled employees to their former jobs or place them elsewhere in your company, or is it doing enough now?
Yes, should make greater effort (31( -1 Doing enough now -2 Not applicable (vol.) -3 Not sure -4 Refused -5

-11- CARD 2 864009


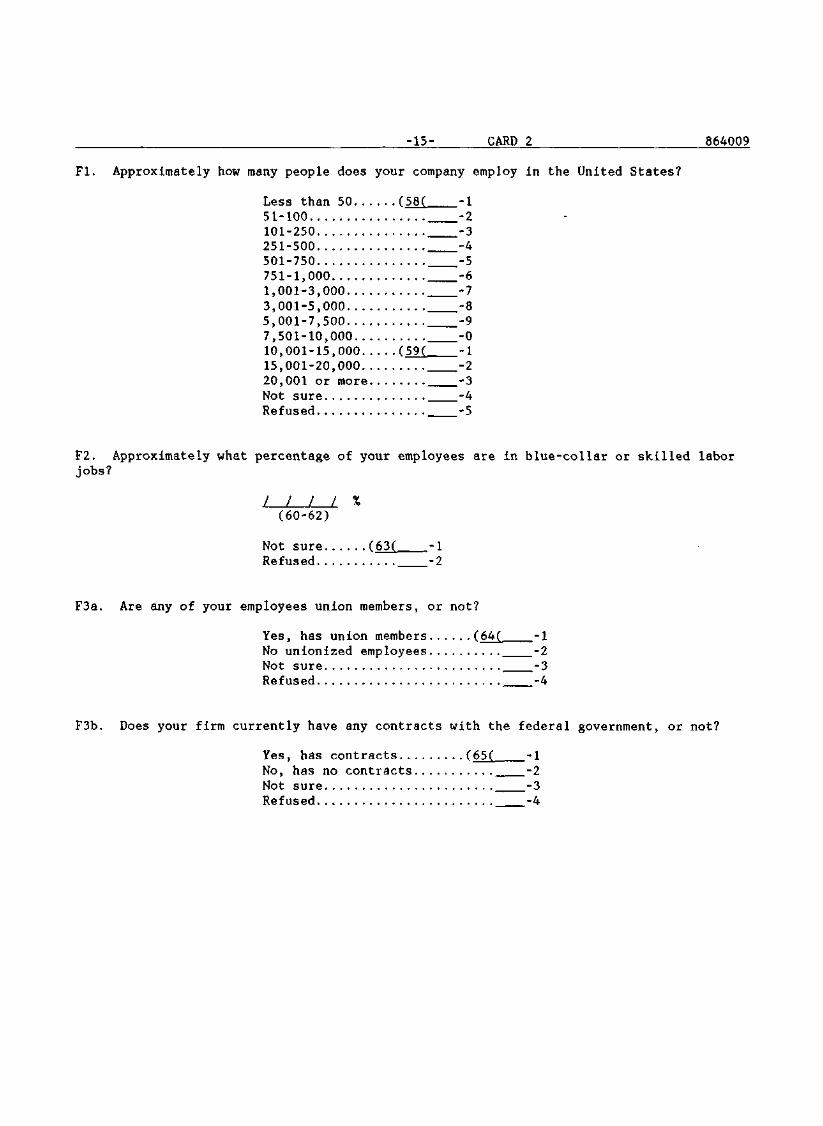

-16- CARD 2 864009
F4a. What is the main business or businesses of your corporation? PROBE TO BE ABLE TO CLASSIFY
a. Manufacturing -- agribusiness (66( -1 b. Manufacturing -- airlines/aerospace -2 c. Manufacturing -- chemicals/pharmaceuticals -3 d. Manufacturing -- energy -4 e. Manufacturing -- high technology -5 f. Manufacturing -- mining and minerals -6 g. Other manufacturing -7 h. Construction -8 i. Transportation . . -9 j . Public utility -0 k. Wholesale (67( -1 L. Retail -2 m. Financial, insurance, real estate -3 n. Services -4
Other type of company (SPECIFY):
. . . -5 Not sure -6
F4b. Does your company have outside insurance for disability, or are you self-insured for disability?
Outside insurance (68( -1 Self-insured -2 Both (vol.) -3 Not sure -4 Refused -5
F5. What is your title?
(69-70)
71-80Z
That completes the interview. Thank you very much for your cooperation!
TIME ENDED: A.M./P.M.