Embed Size (px)
Citation preview

Governors Data Analysis Report2011-12

Targets and Results Target for
2012
Results2012
Difference BromleyResults
DifferenceWR & B
English Level 4 + 92% 92% 0 88% +4English Level 5+ 54% 48% -6% 44% +4Reading Level 4+ 93% 92% -1% 90% +2Reading Level 5+ 66% 64% -2% 54% +10Writing Level 4+ 85% 89% +4% 84.5% +4.5Writing Level 5+ 37% 33% -4% 33.6% -0.6Maths Level 4+ 90% 95% +5% 86% +9Maths Level 5+ 55% 64% +9% 44% +20Percentage achieving Level 4+ in both English and maths
87% 90% +3% 83% +7
Science Level 4+ 93% 98% +5% 90% +8Science Level 5+ 68% 64% -4% 41% +23Percentage making 2 Nat. CC levels progress in English from KS1
91% 91%APP = 12.8
0 13.6
- 0.8
Percentage making 2 Nat. CC levels progress in Maths from KS 1
91% 95%APP = 14.9
+4% 13 +1.9

Graph comparison Warren road and Bromley
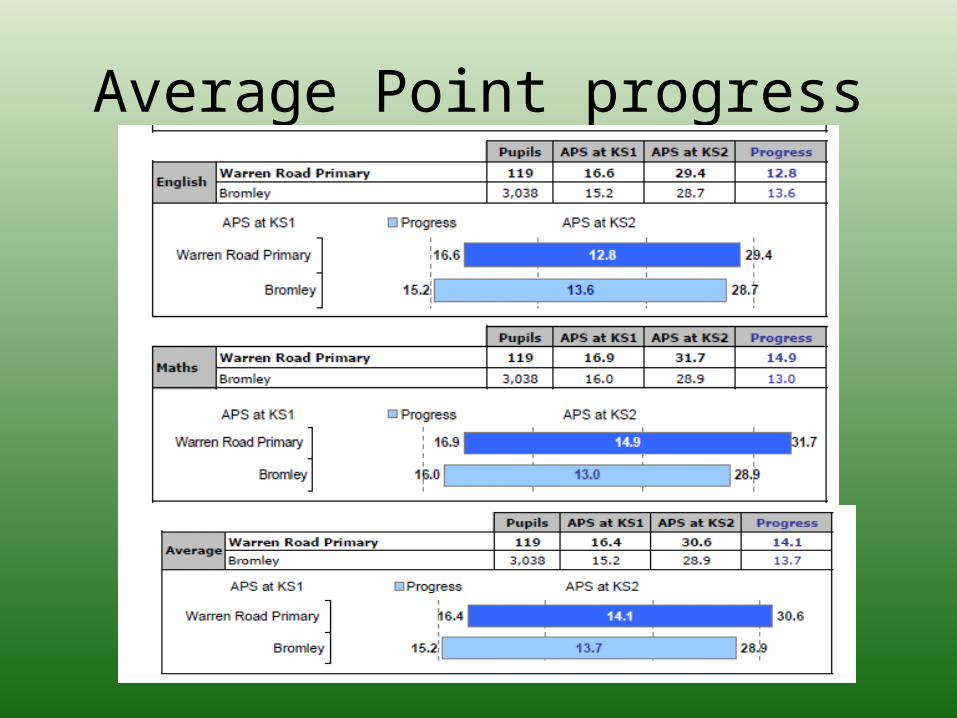
Average Point progress

5 Year trend

Bromley League Tables by percentage out of 64 schools L4 English 22nd Maths 15th Science 12th English and maths 17th
Bromley League Tables by percentage out of 64 schools L5 English 20th Maths 7th Science 10th
Level 6 maths = Warren Road = 1st = 25 children.

FFT Significant improvement/decline

Pupil Level FFT.

Showing Intervention Success
APSSci Y2 Y5 Y6
Y2-Y6
Y5-Y6
Y6 18.3 26.1 30.1 11.8 4
Y6 15.3 25.9 30.6 15.3 4.7
Y6 16.4 26.4 30.6 14.2 4.2
Y6 18 26.4 31.6 13.6 5.2

Gender Differences
In writing girls performed above the boys, gaining 93.1% against the boys 85.2% 11 boys didn’t get a level 4 in writing. Of that 11, 2 were statements and 4 were either school action or school action +. 7 boys from that group were only L1 at the end of KS1.

Key Stage 12C Change 2C 3C Change 3C%
W Rd on National W Rd on National2C 3C 2C 3C 2012 2011 2011 2012 2011 2011 APS
Reading 92% 38% 95% 36% 93% -2% 85% 50% 14% 26% 17.8Writing 95% 15% 93% 19% 91% -2% 81% 25% 6% 13% 16.0Maths 98% 22% 99% 39% 91% -8% 90% 46% 7% 20% 17.2Science 99% 28% 99% 33% 92% -7% 89% 31% -2% 20% 16.4
2010 2011
Although we experienced a drop in Level 2+ in 2012 our level 3C in Reading, Writing and Maths showed an increase. The drop was cohort led; this year group has the highest percentage (16%) of SEND children throughout the school. Taking these issues into account the Y2 teaching team have managed to sustain a 90%+ overall and should be commended for this. The impact of setting more challenging targets for the most able Y2 pupils is evident in our Level 3C results.

Graph Comparison between Warren Road and Bromley

Gender Differences
When comparing results by Pupil Characteristics the gap continues to narrow between the genders. There appears to be a small gap opening between girls and boys in literacy skils although it should be noted that of the SEND children in the cohort 68% are boys, and the gap is not significant, but will be monitored.

Foundation Stage
The Foundation Stage Profile results show an increase on previous years. In the Governors 2011 report particular concern was noted about five areas, Dispositions and Attitudes, Reading, Writing, Linking Sounds and Letters, and Physical Development. All areas showed significant improvement. Books began to go home with the Reception children for the first time in the summer term. The children’s progress in Letters & Sounds which was closely monitored and tracked, and there is no doubt that both these had a significant effect on Reading and Writing.


Predictions 2014Estimate Basis: PA - Rank: 15 - Year: 2013/2014 Bromley (305)
School Details KS2 Estimates
Pupil Pupil Est Est % of pupils estimated to
achieve KS2 Level
School Name GroupNumber
Basis
Rank
Subject 2+ 3+ 4+ 5+ EP
Warren Road Pri All Pupils 119 PA 15 English 100.% 99.2%94.7%
50.1%
92.6%
Warren Road Pri All Pupils 119 PA 15 Reading 100.% 98.6%94.9%
62.4%
Warren Road Pri All Pupils 119 PA 15 Writing 100.% 99.4%91.6%
37.9%
Warren Road Pri All Pupils 119 PA 15 Mathematics
100.% 99.2%93.7%
54.9%
93.3%
Warren Road Pri All Pupils 119 PA 15 Science 100.% 99.7%96.7%
59.1%
Warren Road Pri All Pupils 119 PA 15English &
Maths100.% 98.9%
91.5%
39.2%

2012Results
201425%
201415%
Current resultsY4
RecommendedPast results + top 10%
English Level 4 + 92% 93% 91% 95% 90% 94%
English Level 5+ 48% 47% 50% 50% 48% 55%
Reading Level 4+ 92% 94% 94% 95% 92% 95%
Reading Level 5+ 64% 61% 61% 62% 52% 66%
Writing Level 4+ 89% 89% 89% 92% 88% 92%
Writing Level 5+ 33% 32% 34% 38% 25% 43%
Maths Level 4+ 95% 92% 92% 94% 92% 95%
Maths Level 5+ 64% 51% 61% 55% 32% 61%
Percentage achieving Level 4+ in both English and maths
90% 89% 88% 92% 89% 92%
Science Level 4+ 98% 95% 95% 97% 96% 97%
Science Level 5+ 64% 53% 69% 59% 27% 71% (top 5%)
Percentage making 2 Nat. CC levels progress in English from KS1
91%APP = 12.8
92% 94% 94% 92% 94%
Percentage making 2 Nat. CC levels progress in Maths from KS 1
95%APP = 14.9
91% 92% 94% 92% 94%