Embed Size (px)
Citation preview
The Commission is led by Commonwealth Corporation. Visit our website for more information.
Second Meeting of the Commission | Tuesday, May 22, 2018
One Ashburton Place, 21st Floor | Conference Room 3
Agenda
10:00 a.m. Call to order and introduction of Commission members.
10:10 a.m. Action Items
▪ Approval of Minutes of the April 23, 2018, meeting
▪ Decision on adopting remote participation of Commissioners
10:15 a.m. – 11:00 a.m. Review of major themes from Meeting 1 and framework for the work
ahead. Dr. J.D. LaRock, President and CEO, Commonwealth Corporation & Chair, Commission on Digital Innovation & Lifelong Learning
▪ Conceptual framework for models to assist aspiring workers
and incumbent workers
▪ Homing in further on the categories of learners we seek to
assist
▪ The work of the Commission’s committees – organization and
process
▪ Discussion by Commission members
11:00 a.m. – 11:50 a.m. The incumbent worker as learner: Performance outcomes for Partners
HealthCare’s competency-based, job-aligned college program.
Featuring Kathryn Decelles, RCC, Academic & Career Coach, Partners HealthCare and Yaziris Lucerna, Learner and OBGYN Finance Coordinator, Brigham and Women’s Hospital
▪ Overview and program results
▪ The voice of the learner
▪ Discussion by Commission members
11:50 p.m. – 12:00 noon Next steps. J.D. LaRock
▪ Overview of Meeting 3
▪ Committee meetings and future meeting dates
Governor’s Commission on Digital Innovation and Lifelong Learning
GOVERNOR’SCOMMISSION ON
DIGITAL INNOVATION AND LIFELONG LEARNING
SECOND MEETING OF THE COMMISSION
MAY 22, 2018
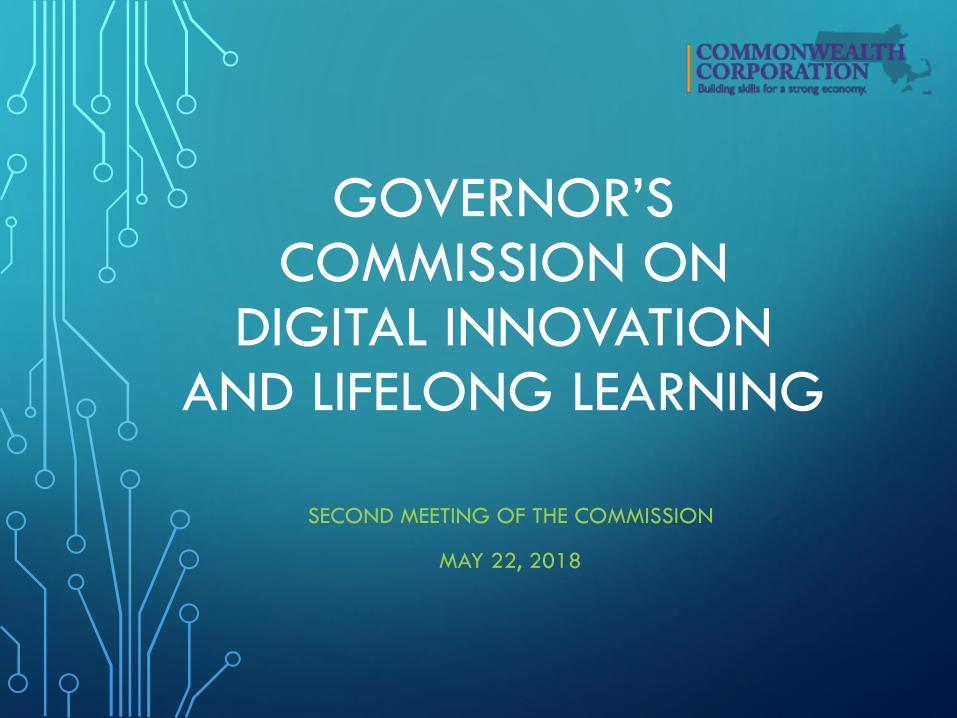
WHAT IS THE PURPOSE OF THE COMMISSION?
• Build on Governor Baker’s fall 2017 Convening
• Examine how Massachusetts can dramatically expand learning/training opportunities that are affordable, high-quality, and employer-aligned
• Examine the impact of automation & technology on the future of work and learning
• Propose bold solutions and specific action plan to the Governor
© 2018 Commonwealth Corporation
WHICH LEARNERS ARE WE INTERESTED IN?
• Learners who must work
• People who have not prospered in, or can’t access, existing education and training programs
• Diverse learners, including English language learners
• People with some college but no degree
• Opportunity youth (not in employment, education or training)
© 2018 Commonwealth Corporation 3
WHAT STRATEGIES ARE WE EXAMINING?• Programs that are co-designed with employers
• Online, competency-based education
• Micro-credentials/stackable credentials
• Experiential learning
• Credit for prior learning
• Soft skills and employability curricula
• Student support models, such as coaching
© 2018 Commonwealth Corporation 4
FIRST COMMISSION MEETING: MAJOR THEMES
• General interest in the proposed strategies
• Systems needed to inform young people better about careers available to them and what jobs today entail
• Broad agreement that work is changing dramatically, but skepticism that jobs will disappear
• Strong interest in solutions like micro-credentials, but caution about the limits of online learning
© 2018 Commonwealth Corporation 5
EMPLOYER INSIGHTS AND NEEDS
• Skills trump credentials
• Strong interest in experiential learning
• Credentialism/degree inflation must be addressed
• Employers and education/training institutions need a shared language
• Hiring managers and HR need to shift their mindsets and approaches
2018 Commonwealth Corporation 6
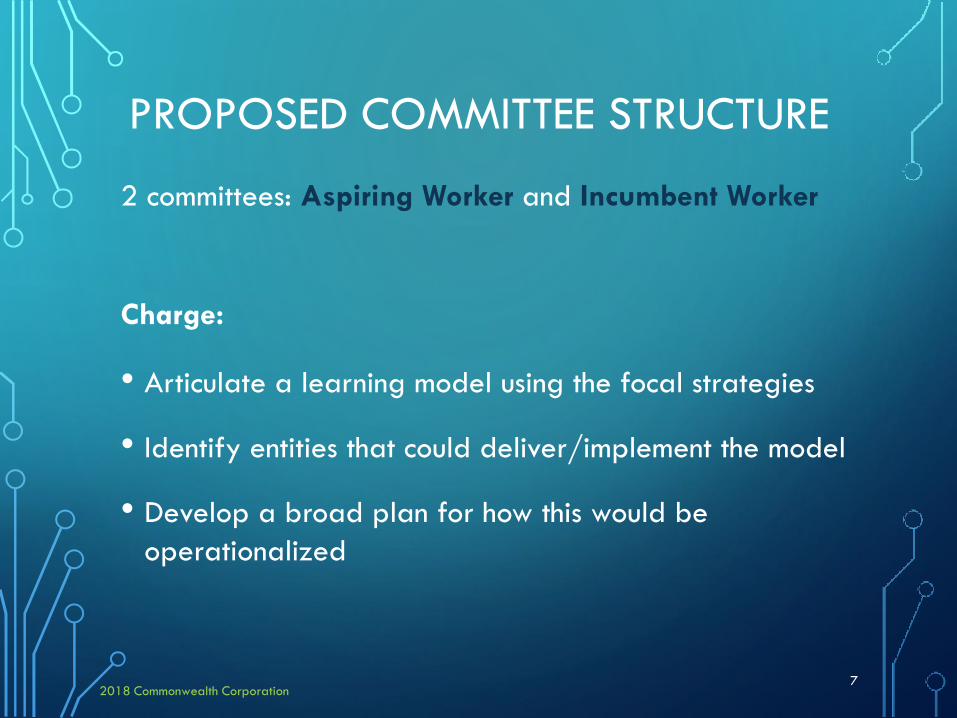
PROPOSED COMMITTEE STRUCTURE
2 committees: Aspiring Worker and Incumbent Worker
Charge:
• Articulate a learning model using the focal strategies
• Identify entities that could deliver/implement the model
• Develop a broad plan for how this would be operationalized
2018 Commonwealth Corporation 7
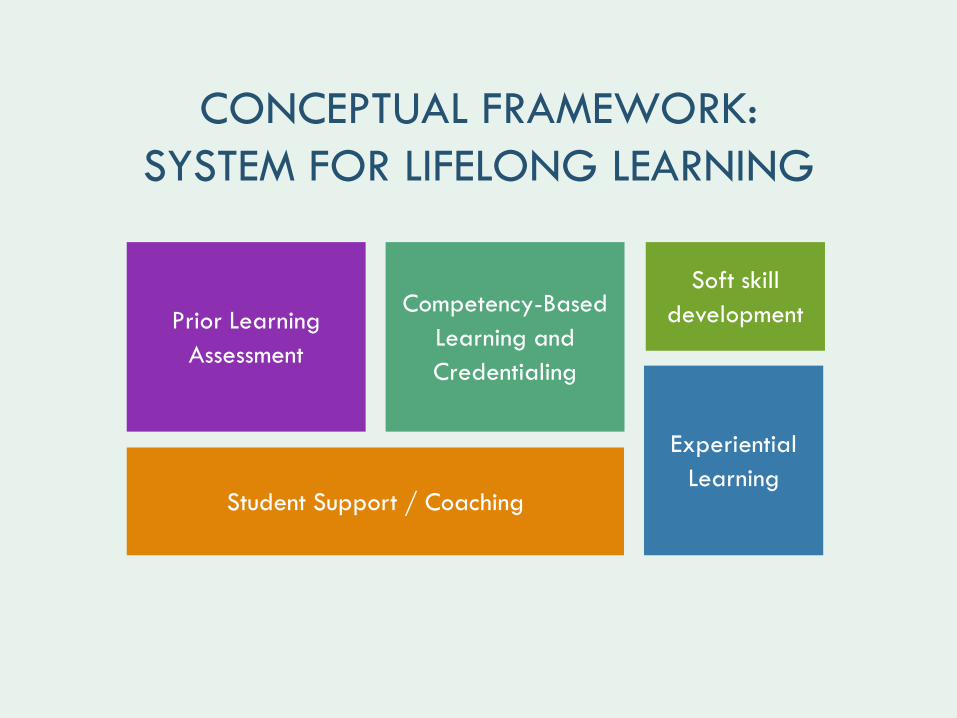
Experiential Learning
Student Support / Coaching
Prior Learning Assessment
Competency-Based Learning and Credentialing
Soft skill development
CONCEPTUAL FRAMEWORK: SYSTEM FOR LIFELONG LEARNING
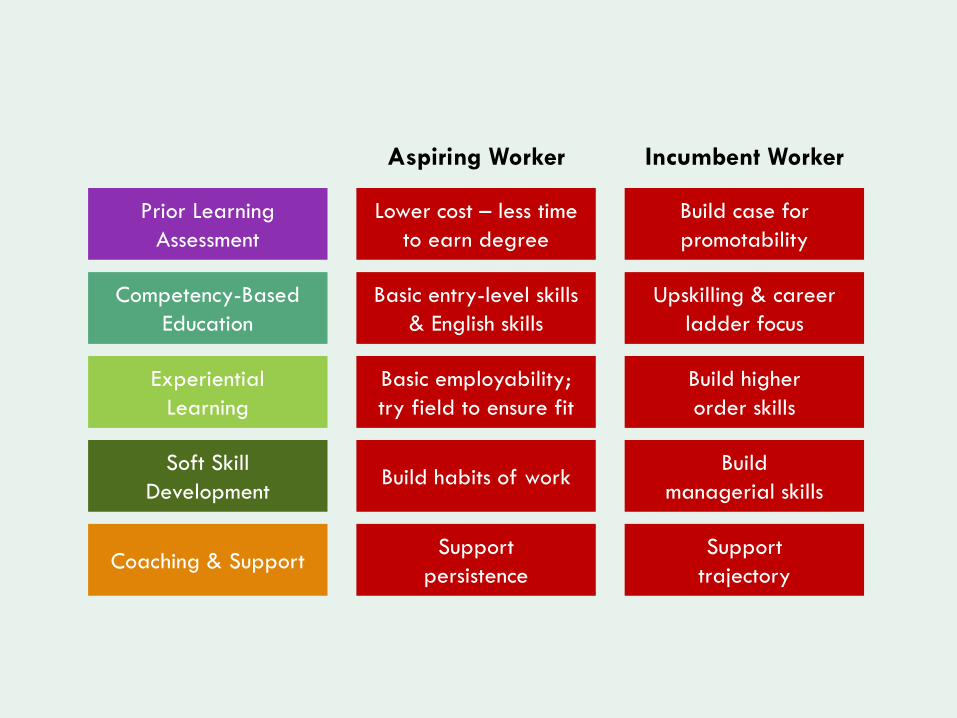
Prior Learning Assessment
Coaching & Support
Competency-Based Education
ExperientialLearning
Soft Skill Development
Lower cost – less time to earn degree
Build case for promotability
Basic entry-level skills & English skills
Upskilling & career ladder focus
Basic employability; try field to ensure fit
Build higher order skills
Build habits of workBuild
managerial skills
Support persistence
Supporttrajectory
Aspiring Worker Incumbent Worker
PARTNERS HEALTHCARE COLLEGE FOR AMERICA
INITIATIVE
PROGRAM OUTCOMESMAY 2018
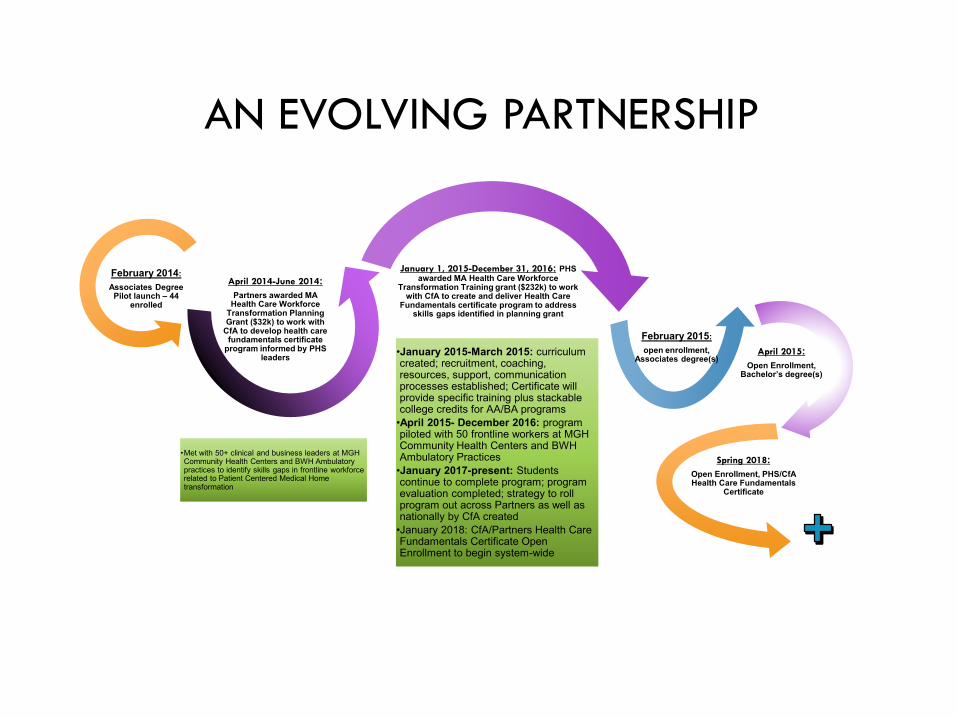
February 2014: Associates Degree
Pilot launch – 44 enrolled
•Met with 50+ clinical and business leaders at MGH Community Health Centers and BWH Ambulatory practices to identify skills gaps in frontline workforce related to Patient Centered Medical Home transformation
April 2014-June 2014: Partners awarded MA
Health Care Workforce Transformation Planning Grant ($32k) to work with
CfA to develop health care fundamentals certificate
program informed by PHS leaders •January 2015-March 2015: curriculum
created; recruitment, coaching, resources, support, communication processes established; Certificate will provide specific training plus stackable college credits for AA/BA programs
•April 2015- December 2016: program piloted with 50 frontline workers at MGH Community Health Centers and BWH Ambulatory Practices
•January 2017-present: Students continue to complete program; program evaluation completed; strategy to roll program out across Partners as well as nationally by CfA created
•January 2018: CfA/Partners Health Care Fundamentals Certificate Open Enrollment to begin system-wide
January 1, 2015-December 31, 2016: PHS awarded MA Health Care Workforce
Transformation Training grant ($232k) to work with CfA to create and deliver Health Care
Fundamentals certificate program to address skills gaps identified in planning grant
February 2015: open enrollment,
Associates degree(s)April 2015:
Open Enrollment, Bachelor’s degree(s)
Spring 2018: Open Enrollment, PHS/CfA Health Care Fundamentals
Certificate
AN EVOLVING PARTNERSHIP
PARTNERS/CFA:
HOW DOES IT WORK?
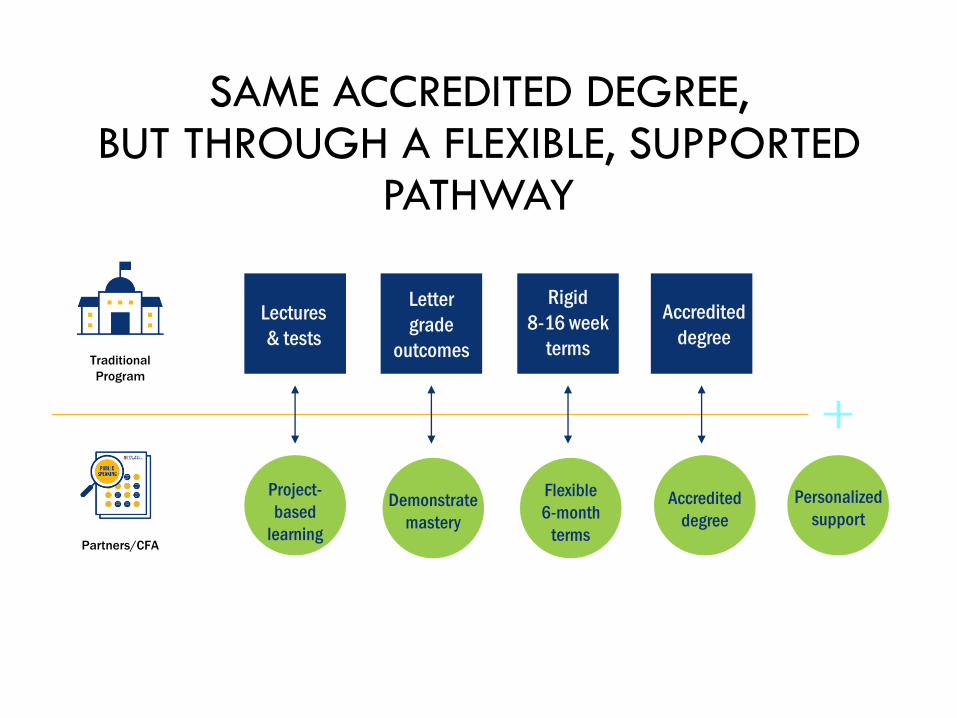
SAME ACCREDITED DEGREE, BUT THROUGH A FLEXIBLE, SUPPORTED
PATHWAY
Traditional Program
Partners/CFAProgram
Lectures & tests
Project-based
learning
Letter grade
outcomes
Flexible6-month
terms
Rigid 8-16 week
terms
Demonstratemastery
Accrediteddegree
Personalized support
Accrediteddegree
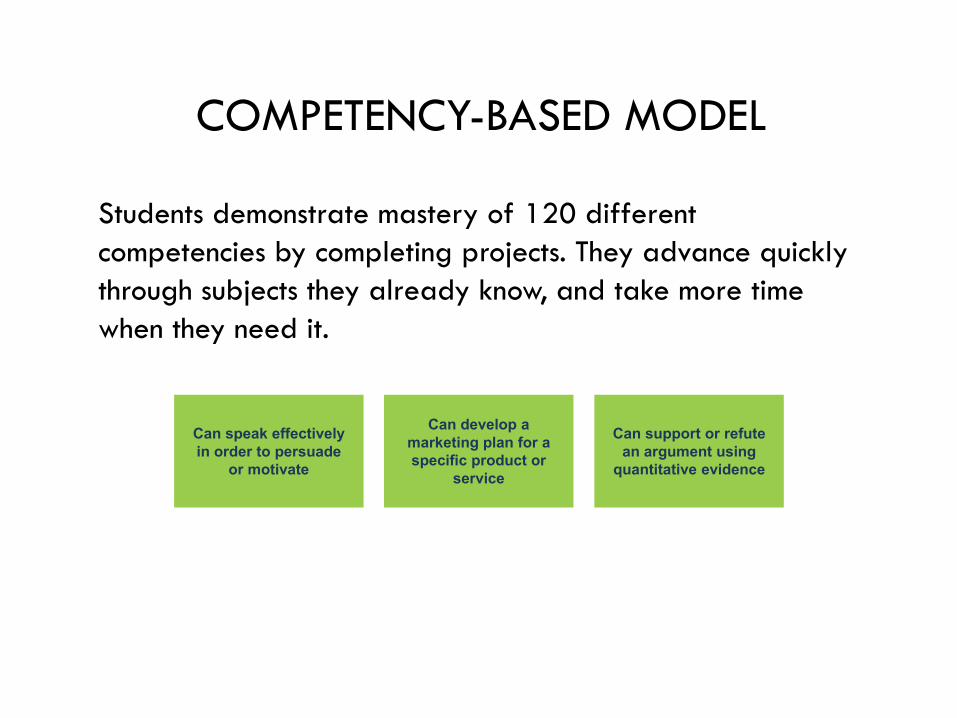
COMPETENCY-BASED MODEL
Students demonstrate mastery of 120 different competencies by completing projects. They advance quickly through subjects they already know, and take more time when they need it.
Can speak effectively in order to persuade
or motivate
Can develop a marketing plan for a specific product or
service
Can support or refute an argument using
quantitative evidence
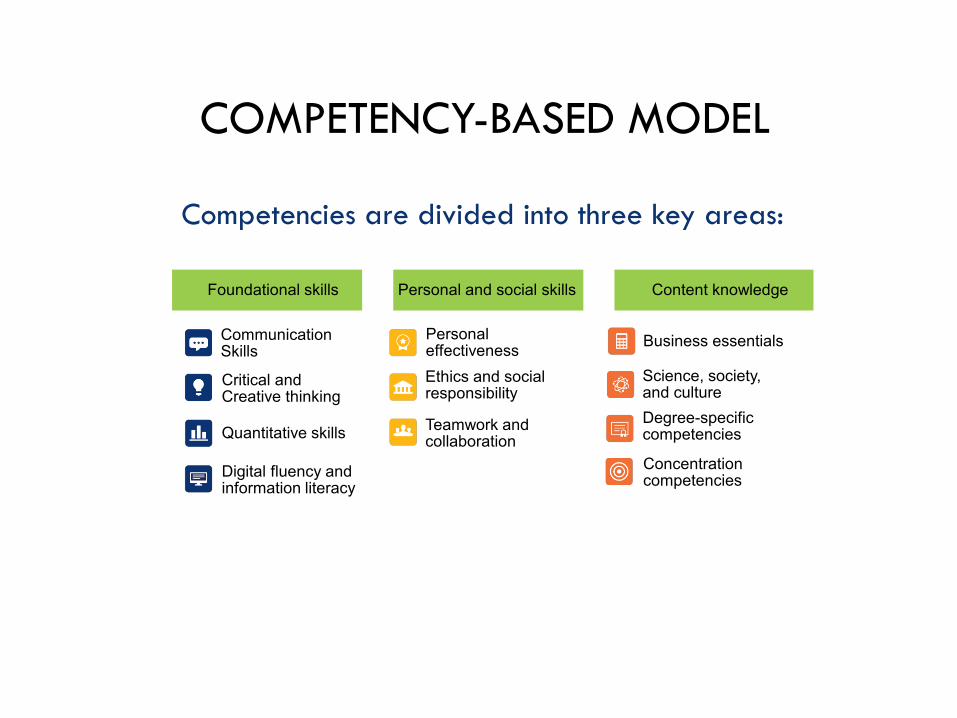
COMPETENCY-BASED MODEL
Competencies are divided into three key areas:
Foundational skills
Communication Skills
Critical and Creative thinking
Quantitative skills
Digital fluency and information literacy
Personal and social skills
PersonaleffectivenessEthics and socialresponsibility
Teamwork and collaboration
Content knowledge
Business essentials
Science, society, and cultureDegree-specific competencies
Concentration competencies
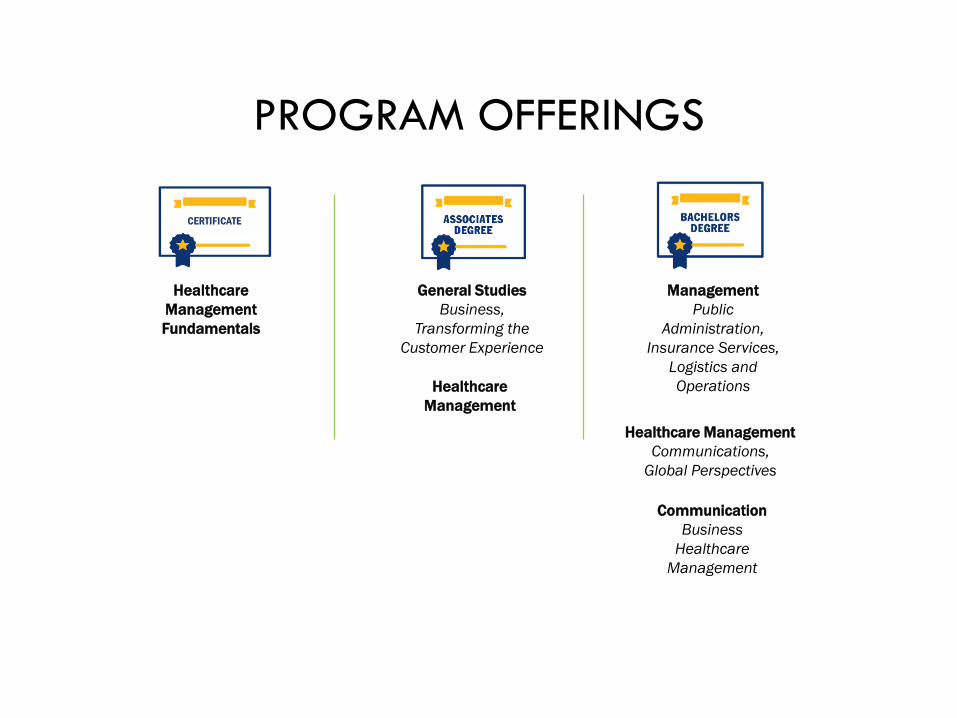
PROGRAM OFFERINGS
ManagementPublic
Administration,Insurance Services,
Logistics and Operations
CommunicationBusiness
Healthcare Management
General StudiesBusiness,
Transforming the Customer Experience
HealthcareManagement
HealthcareManagement Fundamentals
CERTIFICATE
Healthcare ManagementCommunications,
Global Perspectives
DATA AND OUTCOMES
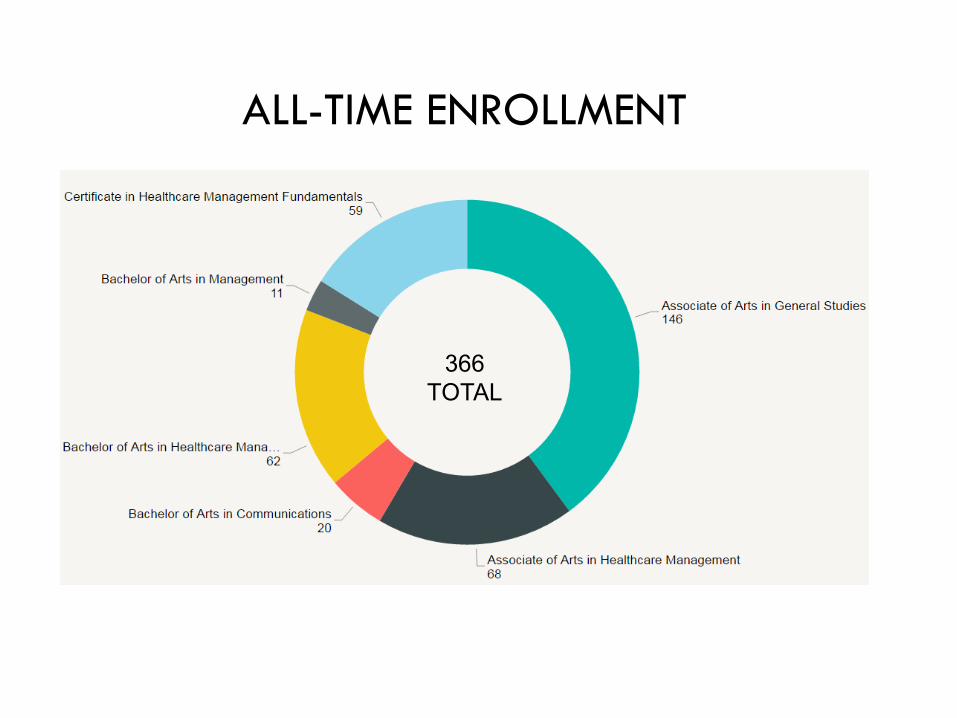
366 TOTAL
ALL-TIME ENROLLMENT
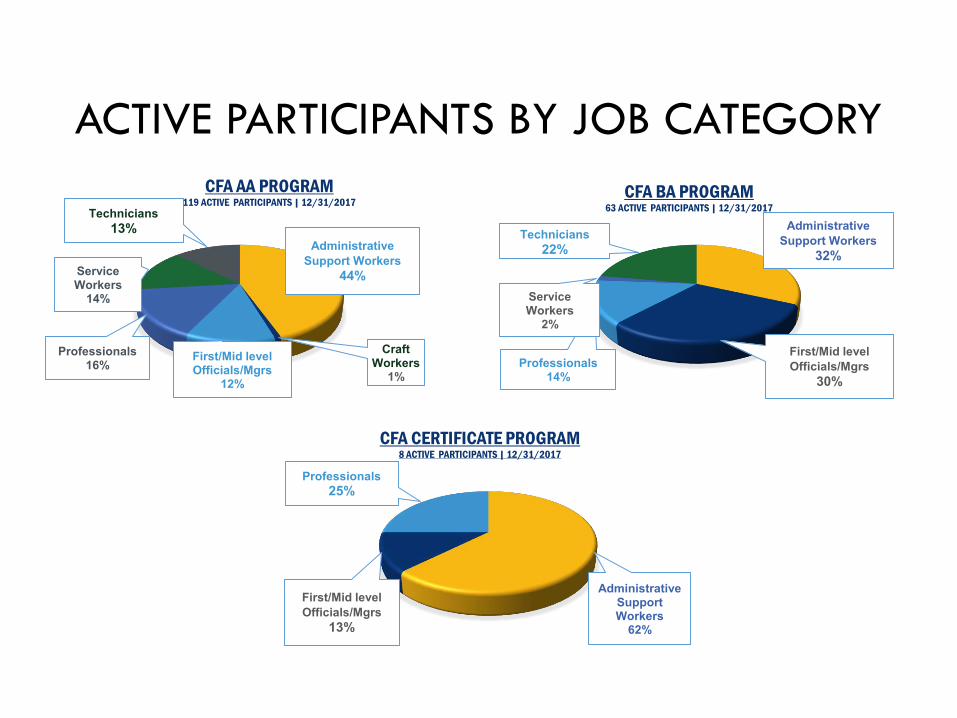
Administrative Support Workers
62%
First/Mid level Officials/Mgrs
13%
Professionals25%
CFA CERTIFICATE PROGRAM8 ACTIVE PARTICIPANTS | 12/31/2017
Administrative Support Workers
32%
First/Mid level Officials/Mgrs
30%Professionals
14%
Service Workers
2%
Technicians22%
CFA BA PROGRAM63 ACTIVE PARTICIPANTS | 12/31/2017
ACTIVE PARTICIPANTS BY JOB CATEGORY
Administrative Support Workers
44%
Craft Workers
1%First/Mid level Officials/Mgrs
12%
Professionals16%
Service Workers
14%
Technicians13%
CFA AA PROGRAM119 ACTIVE PARTICIPANTS | 12/31/2017
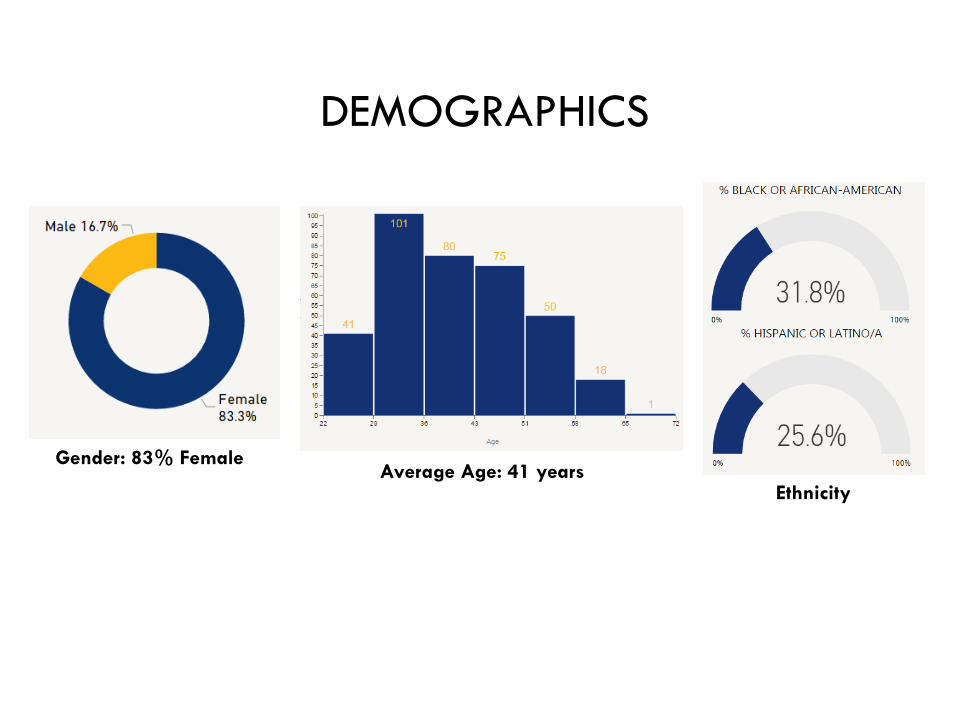
Average Age: 41 years
DEMOGRAPHICS
Gender: 83% Female
Ethnicity
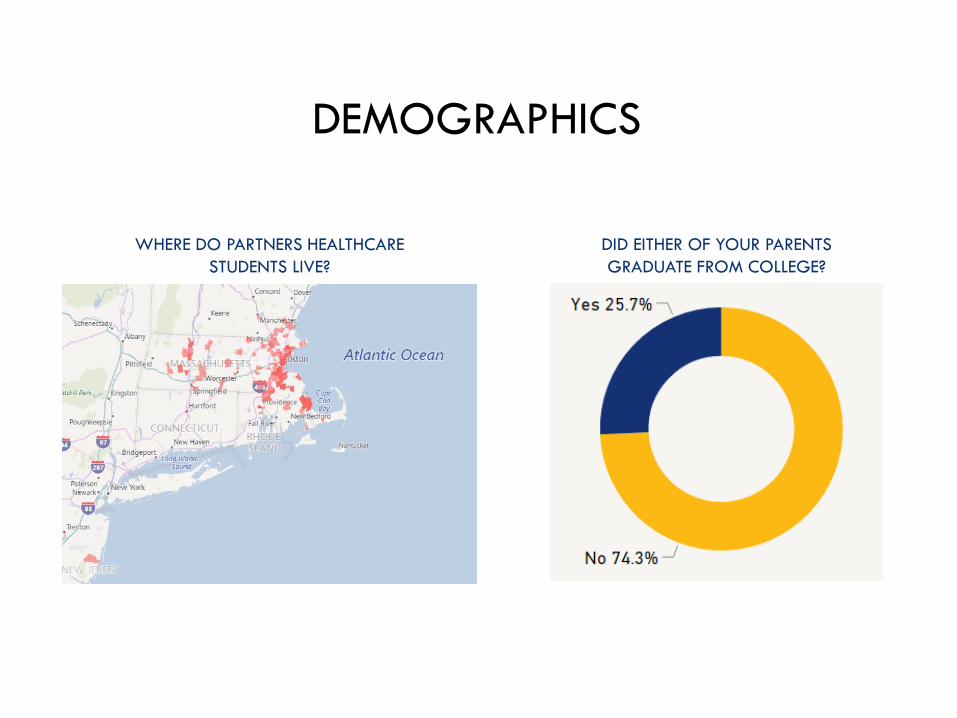
DID EITHER OF YOUR PARENTS GRADUATE FROM COLLEGE?
WHERE DO PARTNERS HEALTHCARE STUDENTS LIVE?
DEMOGRAPHICS
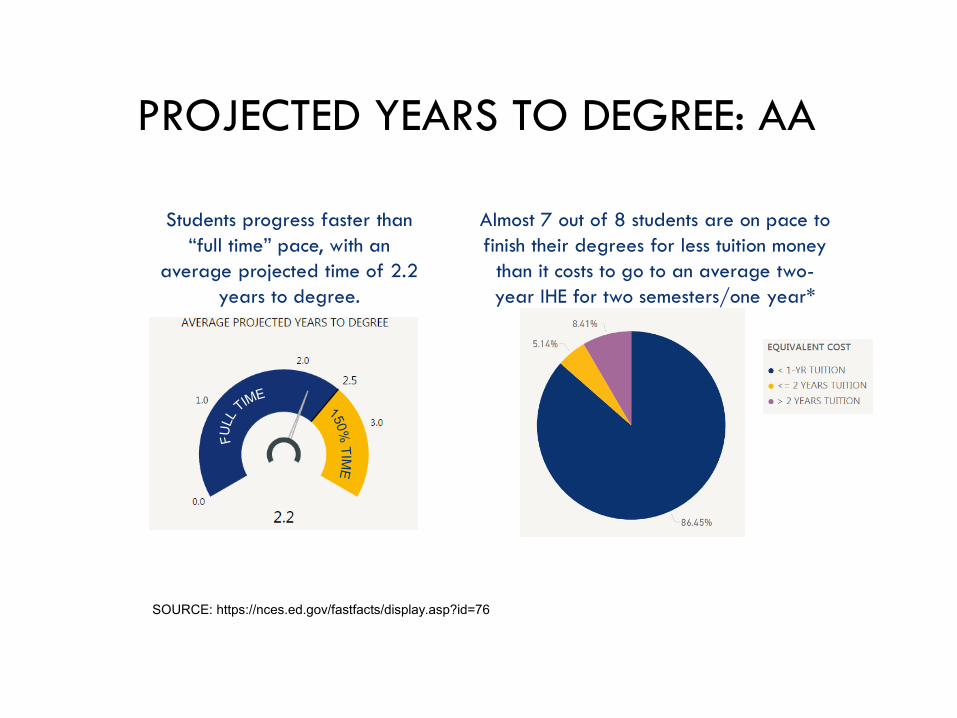
Students progress faster than “full time” pace, with an
average projected time of 2.2 years to degree.
SOURCE: https://nces.ed.gov/fastfacts/display.asp?id=76
Almost 7 out of 8 students are on pace to finish their degrees for less tuition money
than it costs to go to an average two-year IHE for two semesters/one year*
PROJECTED YEARS TO DEGREE: AA
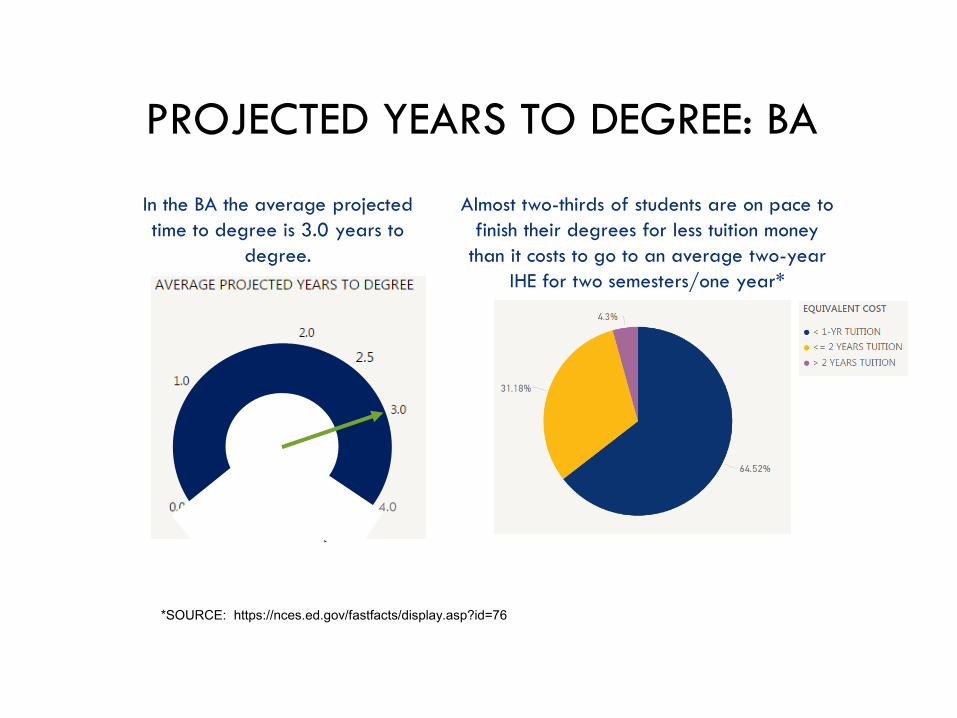
In the BA the average projected time to degree is 3.0 years to
degree.
*SOURCE: https://nces.ed.gov/fastfacts/display.asp?id=76
Almost two-thirds of students are on pace to finish their degrees for less tuition money
than it costs to go to an average two-year IHE for two semesters/one year*
PROJECTED YEARS TO DEGREE: BA
4.0
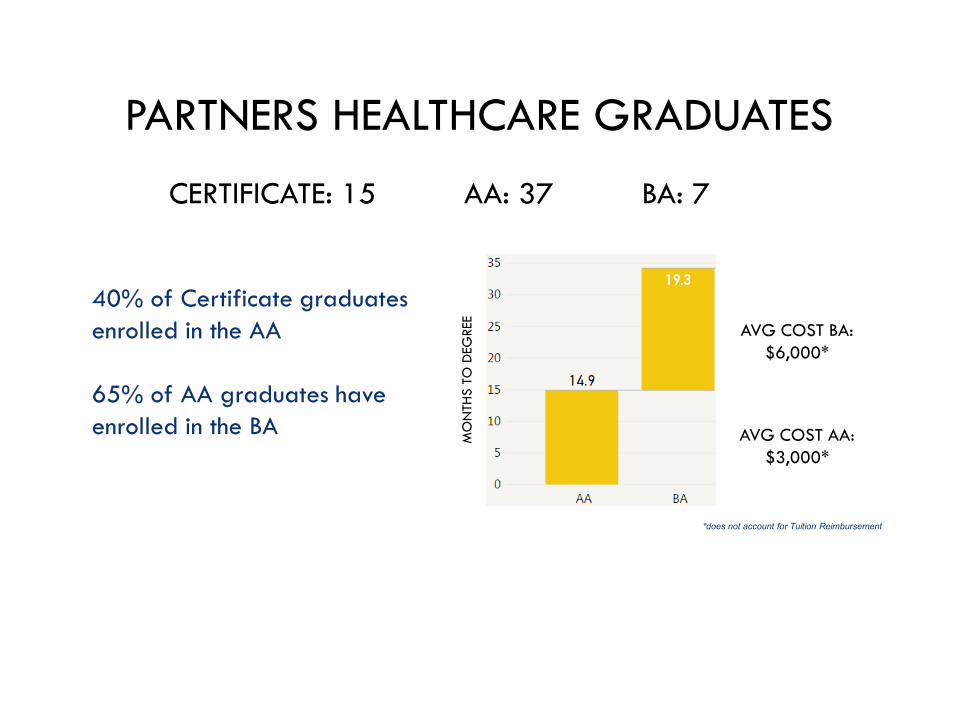
40% of Certificate graduates enrolled in the AA
65% of AA graduates have enrolled in the BA
PARTNERS HEALTHCARE GRADUATES
CERTIFICATE: 15 AA: 37 BA: 7
MO
NTH
S TO
DEG
REE
AVG COST AA: $3,000*
AVG COST BA: $6,000*
*does not account for Tuition Reimbursement
16
PERCEPTIONS OF SKILLS AND ABILITIES
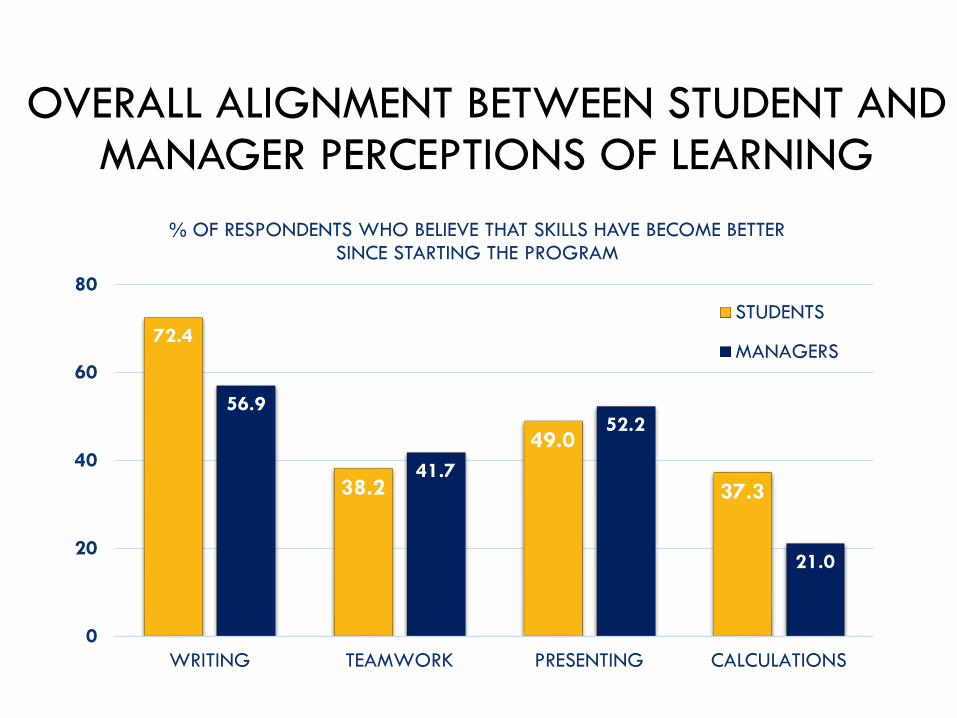
OVERALL ALIGNMENT BETWEEN STUDENT AND MANAGER PERCEPTIONS OF LEARNING
72.4
38.2
49.0
37.3
56.9
41.7
52.2
21.0
0
20
40
60
80
WRITING TEAMWORK PRESENTING CALCULATIONS
% OF RESPONDENTS WHO BELIEVE THAT SKILLS HAVE BECOME BETTER SINCE STARTING THE PROGRAM
STUDENTS
MANAGERS
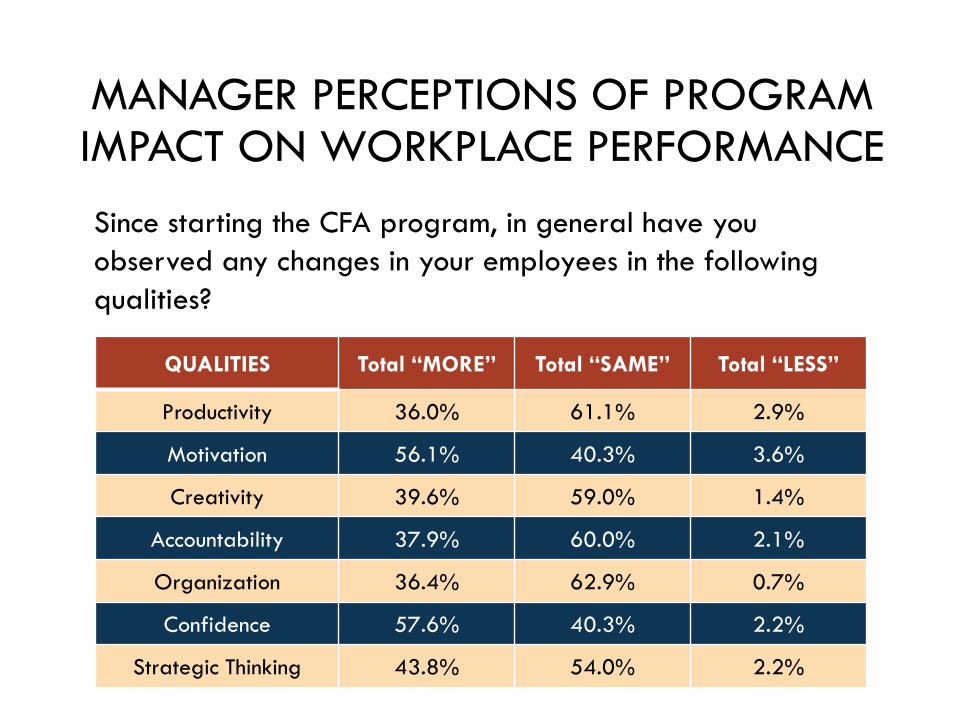
Since starting the CFA program, in general have you observed any changes in your employees in the following qualities?
QUALITIES Total “MORE” Total “SAME” Total “LESS”
Productivity 36.0% 61.1% 2.9%
Motivation 56.1% 40.3% 3.6%
Creativity 39.6% 59.0% 1.4%
Accountability 37.9% 60.0% 2.1%
Organization 36.4% 62.9% 0.7%
Confidence 57.6% 40.3% 2.2%
Strategic Thinking 43.8% 54.0% 2.2%
MANAGER PERCEPTIONS OF PROGRAM IMPACT ON WORKPLACE PERFORMANCE
19
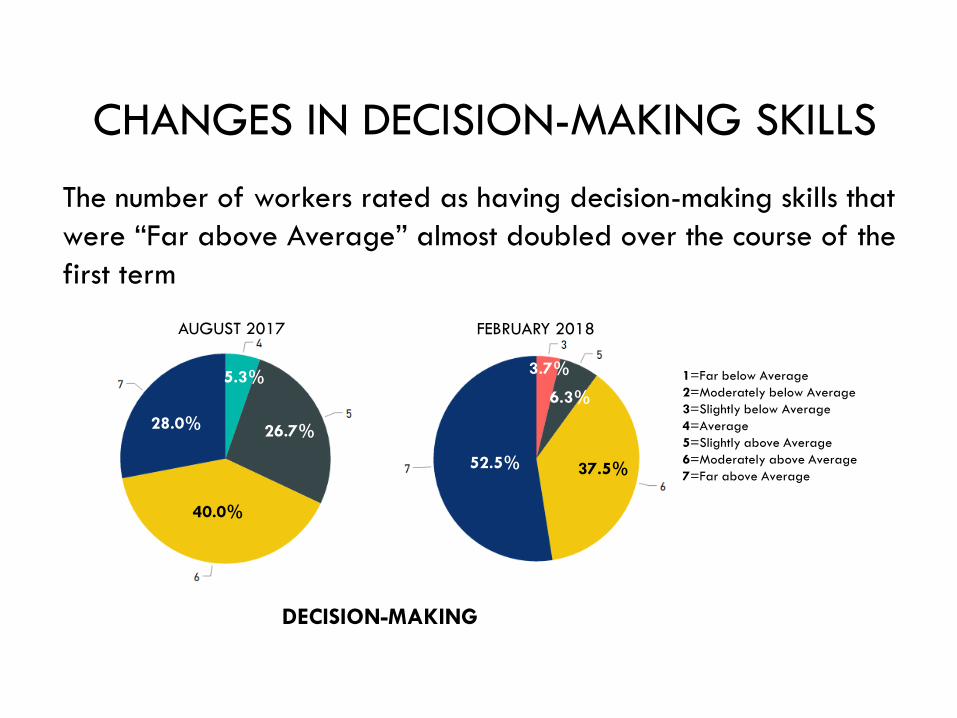
CHANGES IN DECISION-MAKING SKILLS
The number of workers rated as having decision-making skills that were “Far above Average” almost doubled over the course of the first term
AUGUST 2017 FEBRUARY 2018
DECISION-MAKING
28.0% 26.7%
40.0%
52.5% 37.5%
6.3%1=Far below Average2=Moderately below Average3=Slightly below Average4=Average5=Slightly above Average6=Moderately above Average7=Far above Average
5.3% 3.7%
20
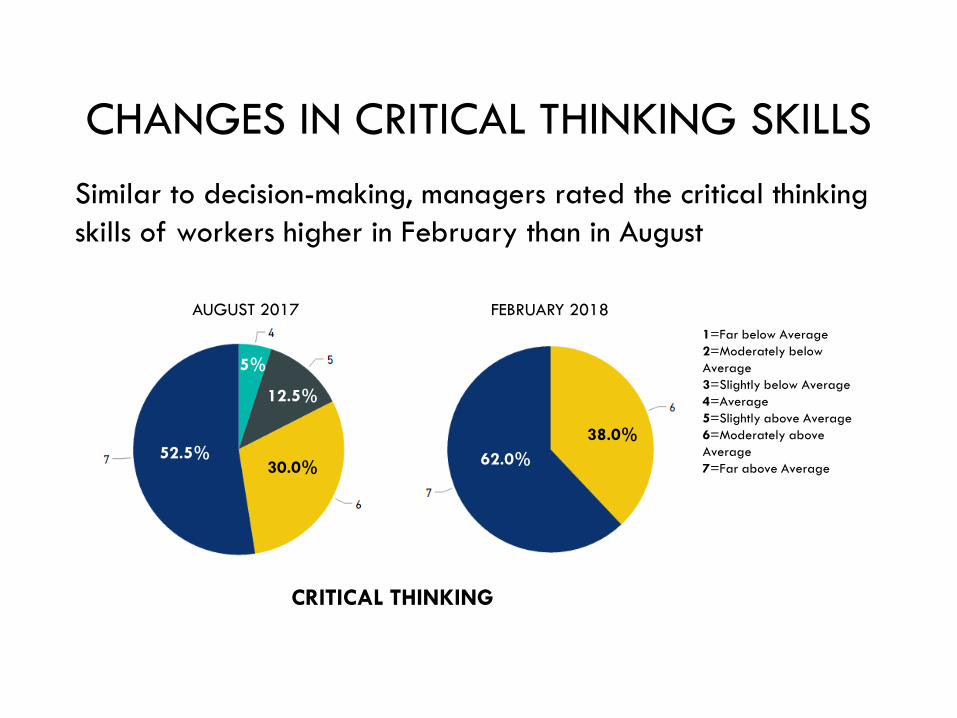
CHANGES IN CRITICAL THINKING SKILLSSimilar to decision-making, managers rated the critical thinking skills of workers higher in February than in August
AUGUST 2017 FEBRUARY 2018
CRITICAL THINKING
52.5%
12.5%
30.0% 62.0%38.0%
1=Far below Average2=Moderately below Average3=Slightly below Average4=Average5=Slightly above Average6=Moderately above Average7=Far above Average
5%
21
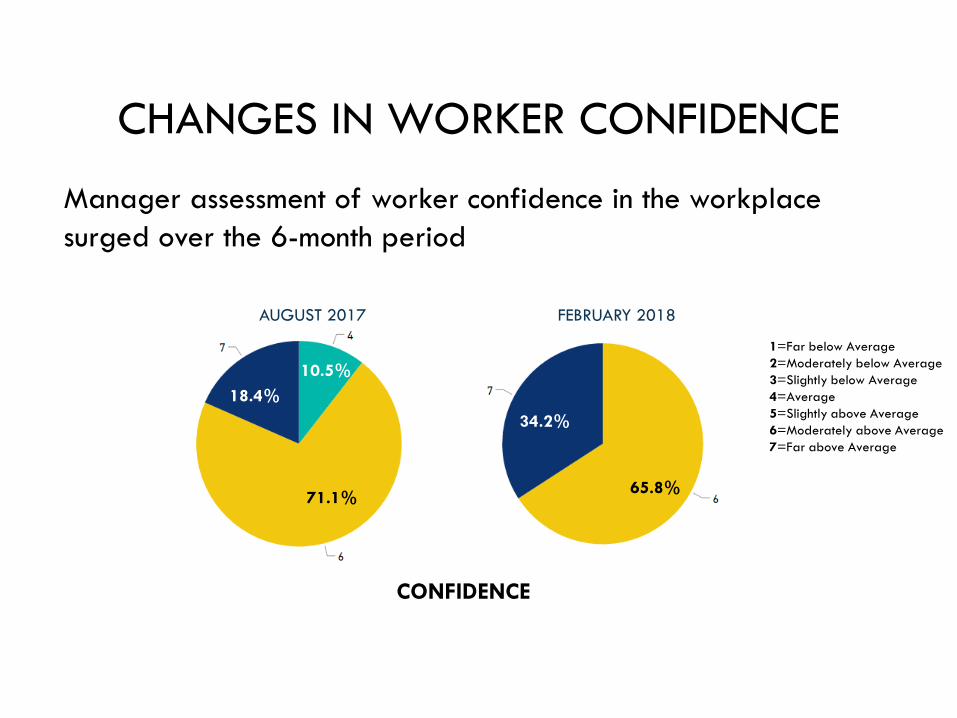
CHANGES IN WORKER CONFIDENCE
Manager assessment of worker confidence in the workplace surged over the 6-month period
AUGUST 2017 FEBRUARY 2018
CONFIDENCE
18.4%
71.1%
10.5%
34.2%
65.8%
1=Far below Average2=Moderately below Average3=Slightly below Average4=Average5=Slightly above Average6=Moderately above Average7=Far above Average
22
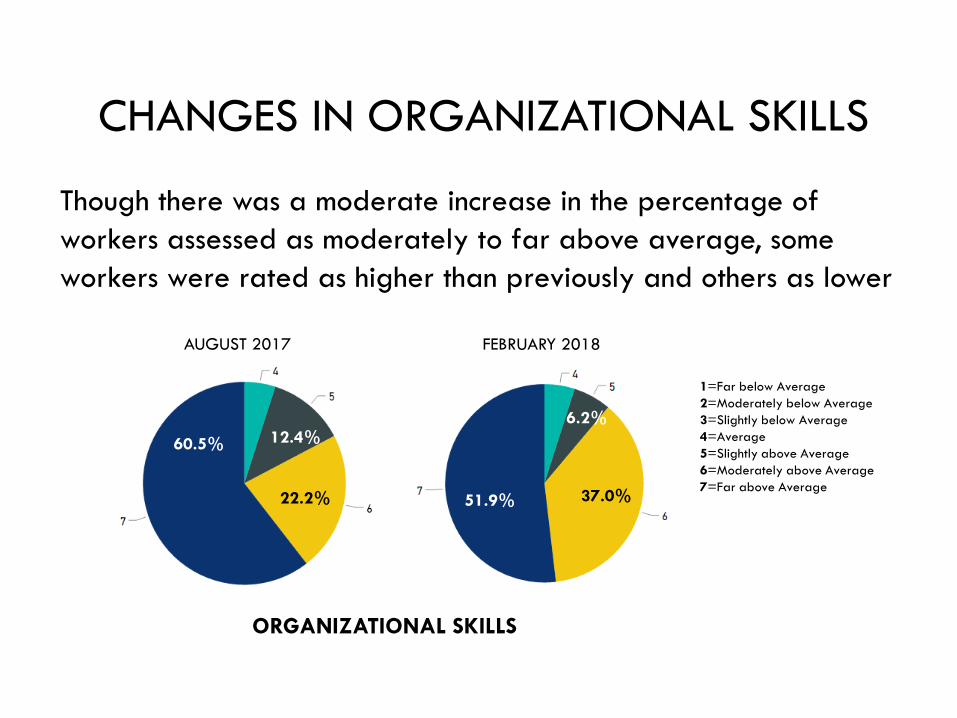
CHANGES IN ORGANIZATIONAL SKILLS
Though there was a moderate increase in the percentage of workers assessed as moderately to far above average, some workers were rated as higher than previously and others as lower
AUGUST 2017 FEBRUARY 2018
ORGANIZATIONAL SKILLS
60.5%
22.2%
12.4%
51.9% 37.0%
6.2%
1=Far below Average2=Moderately below Average3=Slightly below Average4=Average5=Slightly above Average6=Moderately above Average7=Far above Average
23
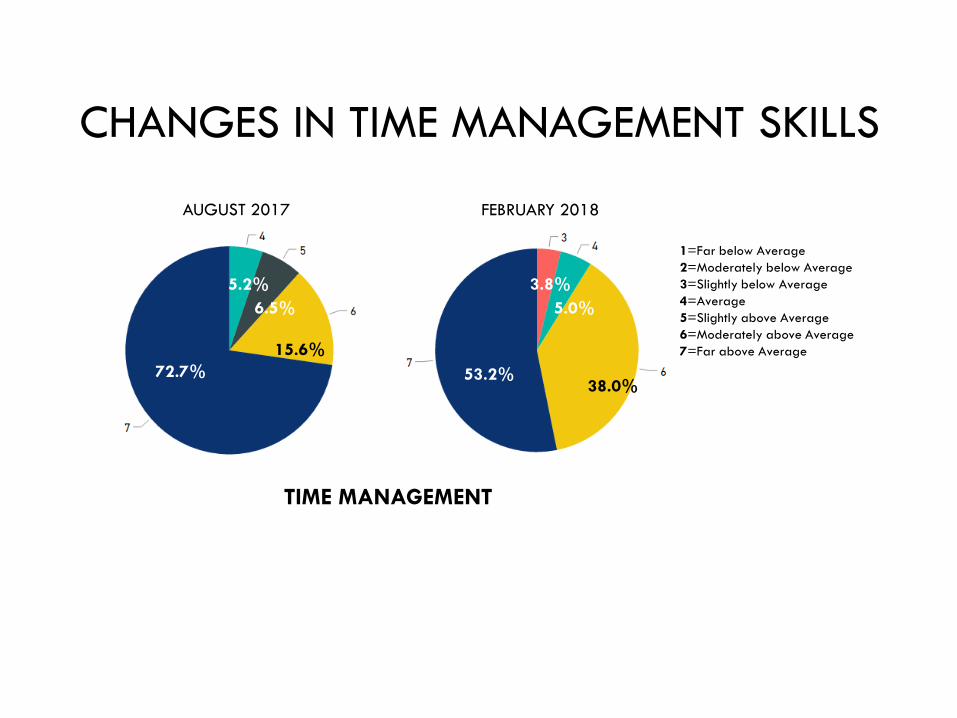
CHANGES IN TIME MANAGEMENT SKILLS
AUGUST 2017 FEBRUARY 2018
TIME MANAGEMENT
72.7%
5.2%
15.6%53.2%
38.0%
5.0%
1=Far below Average2=Moderately below Average3=Slightly below Average4=Average5=Slightly above Average6=Moderately above Average7=Far above Average
6.5%3.8%
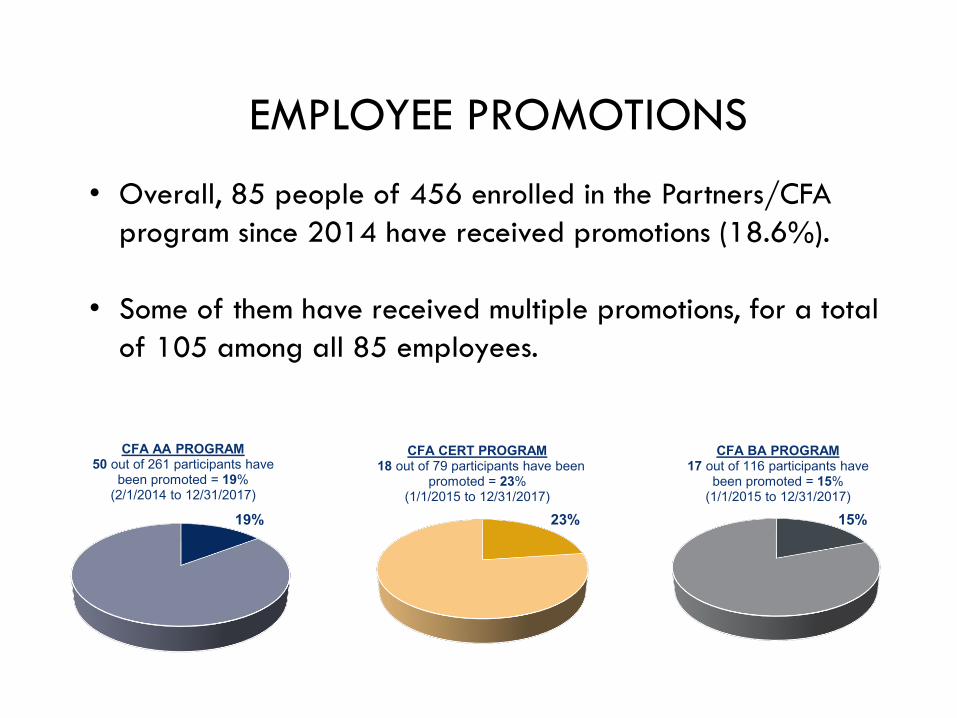
CFA CERT PROGRAM 18 out of 79 participants have been
promoted = 23%(1/1/2015 to 12/31/2017)
23%
CFA BA PROGRAM 17 out of 116 participants have
been promoted = 15%(1/1/2015 to 12/31/2017)
15%
CFA AA PROGRAM 50 out of 261 participants have
been promoted = 19%(2/1/2014 to 12/31/2017)
19%
• Overall, 85 people of 456 enrolled in the Partners/CFA program since 2014 have received promotions (18.6%).
• Some of them have received multiple promotions, for a total of 105 among all 85 employees.
EMPLOYEE PROMOTIONS
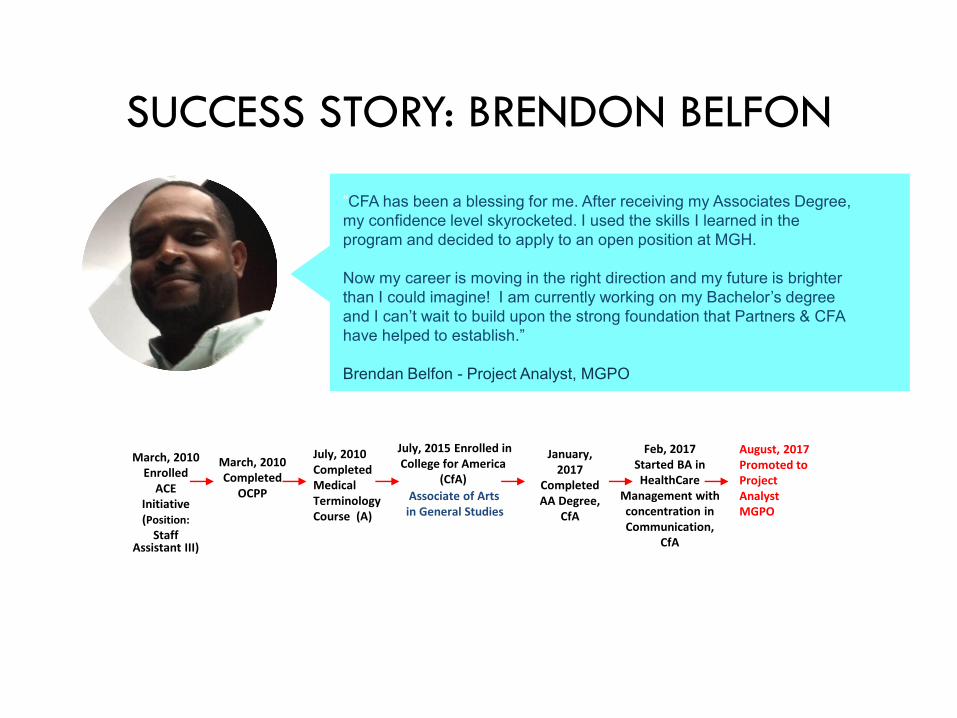
March, 2010Enrolled
ACE Initiative(Position:
Staff Assistant III)
March, 2010Completed
OCPP
July, 2015 Enrolled in College for America
(CfA)
Feb, 2017Started BA in HealthCare
Management with concentration in Communication,
CfA
January, 2017
Completed AA Degree,
CfA
July, 2010Completed Medical Terminology Course (A)
August, 2017Promoted to Project Analyst MGPO
Associate of Artsin General Studies
SUCCESS STORY: BRENDON BELFON
“CFA has been a blessing for me. After receiving my Associates Degree, my confidence level skyrocketed. I used the skills I learned in the program and decided to apply to an open position at MGH.
Now my career is moving in the right direction and my future is brighter than I could imagine! I am currently working on my Bachelor’s degree and I can’t wait to build upon the strong foundation that Partners & CFA have helped to establish.”
Brendan Belfon - Project Analyst, MGPO
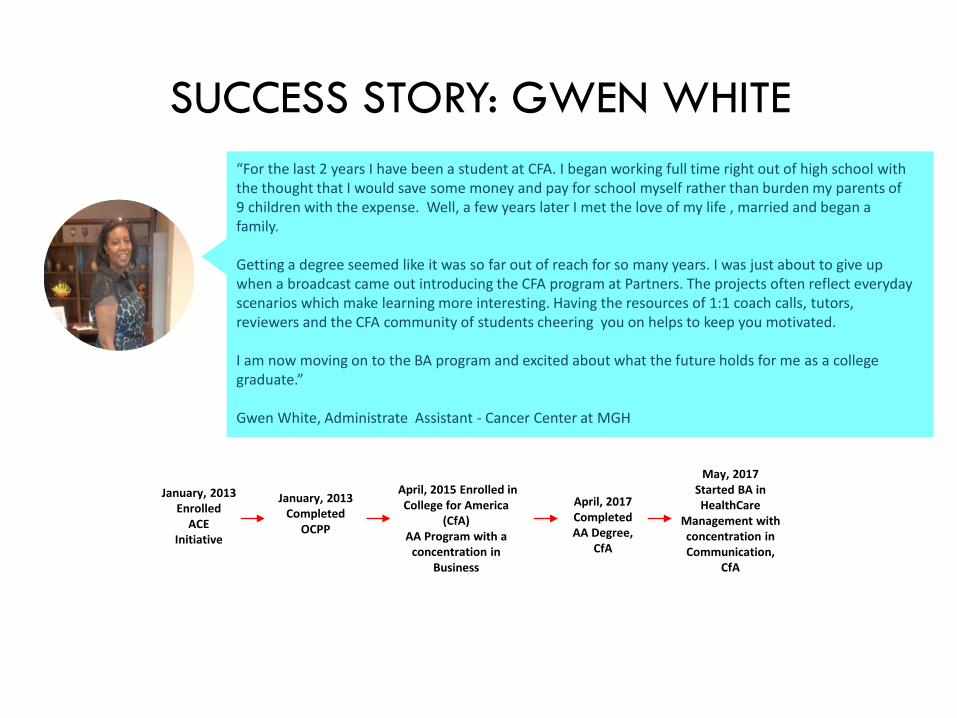
SUCCESS STORY: GWEN WHITE
January, 2013Enrolled
ACE Initiative
January, 2013Completed
OCPP
April, 2015 Enrolled in College for America
(CfA)AA Program with a
concentration in Business
May, 2017Started BA in HealthCare
Management with concentration in Communication,
CfA
April, 2017Completed AA Degree,
CfA
“For the last 2 years I have been a student at CFA. I began working full time right out of high school with the thought that I would save some money and pay for school myself rather than burden my parents of 9 children with the expense. Well, a few years later I met the love of my life , married and began a family.
Getting a degree seemed like it was so far out of reach for so many years. I was just about to give up when a broadcast came out introducing the CFA program at Partners. The projects often reflect everyday scenarios which make learning more interesting. Having the resources of 1:1 coach calls, tutors, reviewers and the CFA community of students cheering you on helps to keep you motivated.
I am now moving on to the BA program and excited about what the future holds for me as a college graduate.”
Gwen White, Administrate Assistant - Cancer Center at MGH
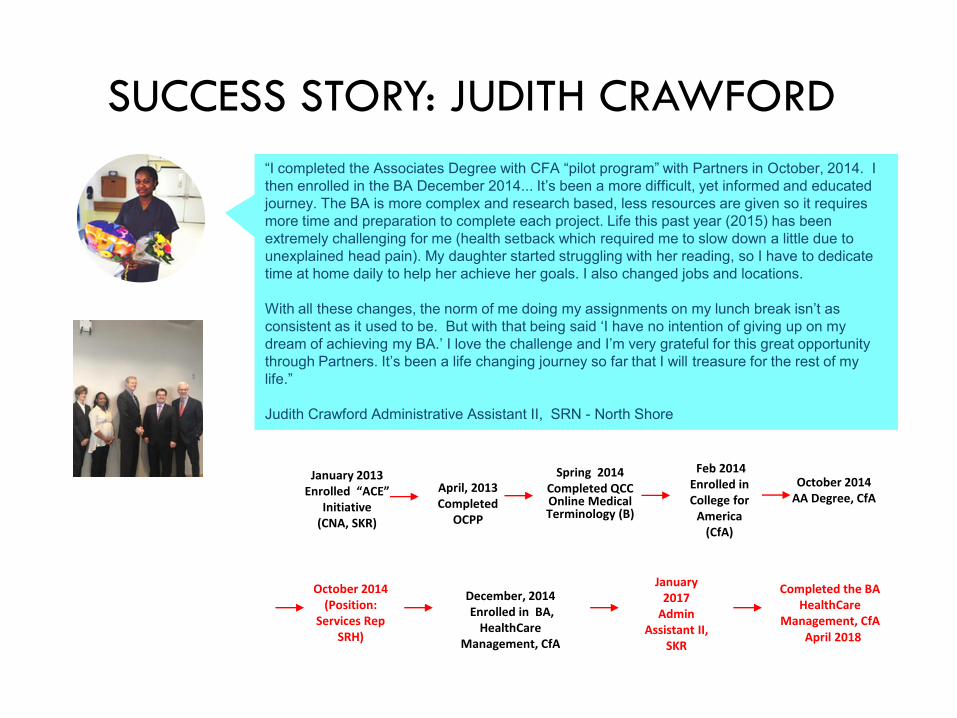
SUCCESS STORY: JUDITH CRAWFORD
January 2013Enrolled “ACE”
Initiative(CNA, SKR)
April, 2013Completed
OCPP
Spring 2014Completed QCC Online Medical Terminology (B)
Feb 2014 Enrolled in College for
America (CfA)
October 2014AA Degree, CfA
December, 2014Enrolled in BA,
HealthCareManagement, CfA
Completed the BA HealthCare
Management, CfAApril 2018
January 2017
Admin Assistant II,
SKR
October 2014(Position:
Services Rep SRH)
“I completed the Associates Degree with CFA “pilot program” with Partners in October, 2014. I then enrolled in the BA December 2014... It’s been a more difficult, yet informed and educated journey. The BA is more complex and research based, less resources are given so it requires more time and preparation to complete each project. Life this past year (2015) has been extremely challenging for me (health setback which required me to slow down a little due to unexplained head pain). My daughter started struggling with her reading, so I have to dedicate time at home daily to help her achieve her goals. I also changed jobs and locations.
With all these changes, the norm of me doing my assignments on my lunch break isn’t as consistent as it used to be. But with that being said ‘I have no intention of giving up on my dream of achieving my BA.’ I love the challenge and I’m very grateful for this great opportunity through Partners. It’s been a life changing journey so far that I will treasure for the rest of my life.”
Judith Crawford Administrative Assistant II, SRN - North Shore
28
VOICE OF THE LEARNER:
YAZIRIS (YARI) LUCERNAWITH KATHERINE DECELLES
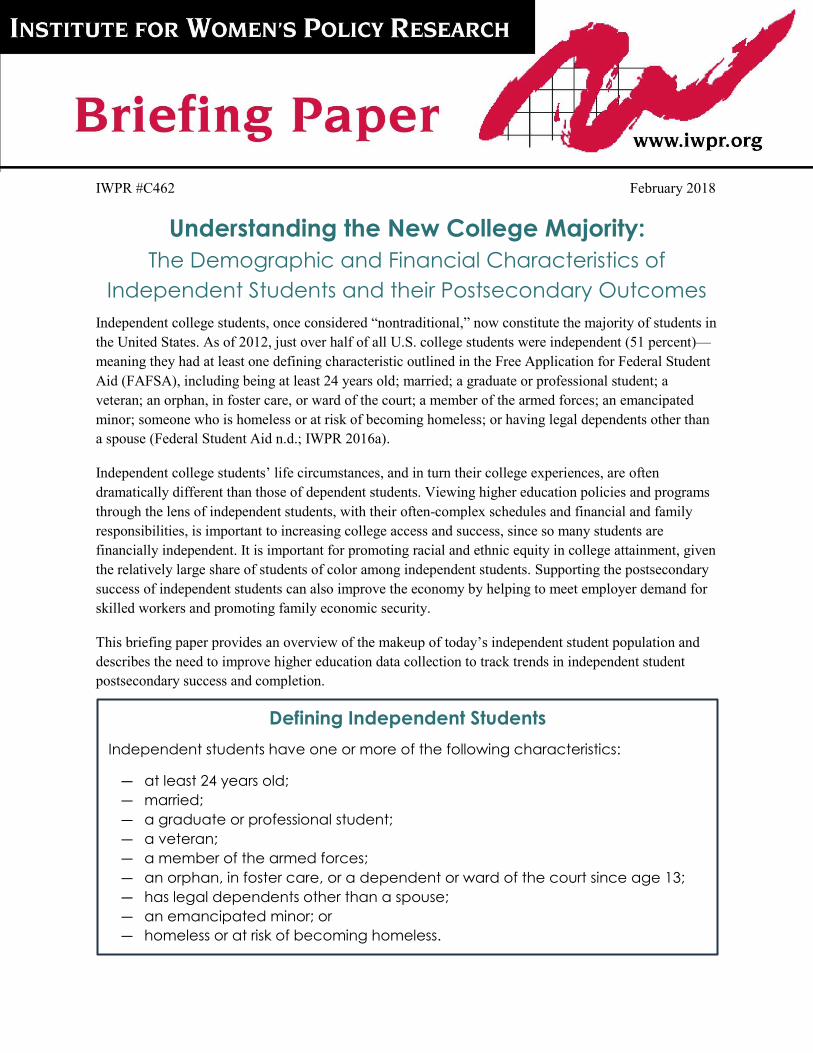
IWPR #C462 February 2018
Understanding the New College Majority: The Demographic and Financial Characteristics of
Independent Students and their Postsecondary Outcomes Independent college students, once considered “nontraditional,” now constitute the majority of students in the United States. As of 2012, just over half of all U.S. college students were independent (51 percent)—meaning they had at least one defining characteristic outlined in the Free Application for Federal Student Aid (FAFSA), including being at least 24 years old; married; a graduate or professional student; a veteran; an orphan, in foster care, or ward of the court; a member of the armed forces; an emancipated minor; someone who is homeless or at risk of becoming homeless; or having legal dependents other than a spouse (Federal Student Aid n.d.; IWPR 2016a).
Independent college students’ life circumstances, and in turn their college experiences, are often dramatically different than those of dependent students. Viewing higher education policies and programs through the lens of independent students, with their often-complex schedules and financial and family responsibilities, is important to increasing college access and success, since so many students are financially independent. It is important for promoting racial and ethnic equity in college attainment, given the relatively large share of students of color among independent students. Supporting the postsecondary success of independent students can also improve the economy by helping to meet employer demand for skilled workers and promoting family economic security.
This briefing paper provides an overview of the makeup of today’s independent student population and describes the need to improve higher education data collection to track trends in independent student postsecondary success and completion.
Defining Independent Students Independent students have one or more of the following characteristics:
— at least 24 years old; — married; — a graduate or professional student; — a veteran; — a member of the armed forces; — an orphan, in foster care, or a dependent or ward of the court since age 13; — has legal dependents other than a spouse; — an emancipated minor; or — homeless or at risk of becoming homeless.

Copyright Standards
This document contains proprietary research, copyrighted materials and literary property of Gallup, Inc. and Strada Education NetworkSM. All of Gallup, Inc.’s and Strada Education Network’s content is protected by copyright. Neither the client nor the participants shall copy, modify, resell, reuse or distribute the program materials beyond the scope of what is agreed upon in writing by Gallup, Inc. Any violation of this agreement shall be considered a breach of contract and misuse of Gallup, Inc.’s intellectual property.
This document is of great value to Gallup, Inc. and Strada Education Network. Accordingly, international and domestic laws and penalties guaranteeing patent, copyright, trademark and trade secret protection safeguard the ideas, concepts and recommendations related within this document. No changes may be made to this document without the express written permission of the parties. Gallup® is a trademark of Gallup, Inc. All rights reserved. All other trademarks and copyrights are property of their respective owners.
Copyright © 2018 Strada Education Network and Gallup, Inc. All rights reserved 1
Nearly every other sector listens to consumers to drive innovation and improvements. The power of consumer insights has transformed industries like health care, transportation, hospitality, travel and tourism, and financial services. Why not bring these benefits to higher education?
Traditionally, we have measured the value and quality of colleges and universities using factors that are in institutional control, such as admissions criteria, quality of facilities, and faculty credentials.
Now, for the first time in the history of higher ed, we are learning what makes for a valuable postsecondary experience by listening to education consumers themselves: students who earned associate degrees, bachelor’s degrees, postgraduate degrees, vocational or technical certificates or other credentials, as well as those who started college but did not complete. Who better to assess the quality and value of the experience than those who experienced it?
While some in the field may be wary of the term “consumer,” U.S. adults make a variety of choices and major decisions about investing their resources in higher education. They are indeed consumers of our postsecondary system, which exists to fulfill their interests and aspirations while fueling the talent pipeline that drives our national economy.
Since the summer of 2016, Strada Education NetworkSM and Gallup have listened to more than 250,000 Americans share insights about their education paths and experiences after high school. As a result, we are generating insights that we believe will result in more people completing postsecondary programs that lead to successful careers and fulfilling lives.
By listening to consumers, the story that is emerging is showing us what it means for higher education to be valuable, and there is much to be learned from the data. For example, some associate degrees are rated higher on value than some bachelor’s degrees. And it isn’t necessary that everyone rush to get a STEM-related degree as value can occur in many fields and at different education levels.
Consumers are also clear that the single most important ingredient for a high-quality and valuable higher ed experience is the relevance of coursework to their careers and daily lives.
For some, this confirms the obvious. Others may resist this notion of “relevance” and suggest that it points to the further “vocationalization” of higher ed or denigration of the liberal arts. Regardless of interpretation, the magnitude of these findings is such that we all need to understand them to decide how best to move forward in delivering quality and value in ways that matter most to the education consumers we exist to serve.
There is no doubt why people pursue higher ed in the first place. Our research revealed that, for 58 percent of those who attend college, their main motivation is to obtain a job or a career outcome. No other reason even comes close. In a survey of college freshman, 85 percent indicate they are pursuing higher education to obtain a good job. However, less than 30 percent report they have that job upon graduation. And, despite the overwhelming importance of relevance, this study reveals that only 26% of working Americans with college experience strongly agree that their education is relevant to their work and daily life.
Clearly there is a disconnect between what consumers want and expect from postsecondary education and what they are receiving. While these gaps are alarming, our collective wherewithal to close them is encouraging. By listening to consumers, scalable solutions quickly emerge and point to clear actions for higher ed leaders, policymakers, employers, and partner organizations.
Relevance – and its importance to the value of higher ed for consumers – holds transformational potential that must not be ignored.
Carol D’AmicoExecutive Vice President Mission Advancement and PhilanthropyStrada Education Network
Carol D’Amico is executive vice president, mission advancement and philanthropy, for Strada Education Network, a national nonprofit dedicated to improving lives by strengthening the pathways between education and employment. Prior to Strada, she previously served the U.S. Department of Education as assistant secretary for adult and vocational education, and as executive vice president and chancellor of Ivy Tech Community College of
Indiana.
Foreword

Consumer insights are a vital part of Strada’s nonprofit mission to advance Completion With a Purpose® for individuals across all educational pathways. These insights provide us an opportunity to transform America’s higher education system and supercharge our labor force. They can help higher education better fulfill its promise of economic and social mobility so that all Americans can achieve rewarding careers and lead fulfilling lives.
To give consumers a direct voice, Strada Education NetworkSM has committed to building the nation’s largest database of consumer insights on educational experiences after high school. As a first step, Strada partnered with Gallup to launch a nationally representative survey of education consumers. Since 2016, we’ve heard from more than 250,000 U.S. adults from all backgrounds and educational attainment levels, representing more than 3,000 different schools and programs.
This report examines consumer perspectives on education relevance among a nationally representative sample of 110,4811 adults, aged 18 to 65, who are currently employed and have taken at least some college courses.
For the purposes of this analysis, “education relevance” is defined by agreement with two key statements on our daily Strada-Gallup Education Consumer Survey:
• The courses you took are directly relevant to what you do at work.• You learned important skills during your education program that you use in your day-to-day life.
Individuals rate their level of agreement with these items on a five-point scale, ranging from strongly disagree (1) to strongly agree (5). By adding the scores from these two questions together, we calculate a combined “relevance score” ranging from two to 10 for each person.
Key findings center on the relationship between relevance and:
1. Quality of education2. Value of education3. Quality of life4. Educational pathway5. Field of study
Education consumers are very clear on how essential relevance is in finding quality and value in postsecondary educational experiences. This overall importance of relevance may not be surprising to some, but the failure to deliver more of it, more consistently should concern all. Additionally, the importance of career relevance and the gaps that exist in its integration and application are emerging as a consistent theme in surveys among the general population, current college students and alumni — suggesting that lack of career relevance may be a “root cause” of multiple challenges facing higher education today.
Overview
1 The total sample of respondents for which institution-level factors such as SAT/ACT math scores, student loan default rates, average cost
of attendance, alumni income earnings and graduation rates could be matched to survey responses is n=78,091.
Copyright © 2018 Strada Education Network and Gallup, Inc. All rights reserved 3
• Only 26% of working U.S. adults with college experience strongly agree that their education is relevant to their work and day-to-day life.
• Relevance strongly predicts value and quality. The more relevant people find their courses to be to their work and daily lives, the greater their belief that they received a high-quality education and that it was worth the cost. Compared with those who strongly disagree, consumers who strongly agree that the courses they took are relevant to their careers and lives are:
• 63 percentage points more likely to strongly agree that their education was worth the cost.
• 50 percentage points more likely to strongly agree that they received a high-quality education.
• Relevance is related to well-being. Consumers who strongly agree that the courses they took are relevant to their careers and lives are 18 points more likely to be considered “thriving” in their overall well-being than are those who strongly disagree.
• Consumer ratings of relevance are more powerful predictors of quality and value than demographic characteristics of individuals, their fields of study and their levels of education. Relevance better predicts quality and value than gender, race, ethnicity, age, income, field of study and level of education (some college, two-year degree, four-year degree, or postgraduate or professional degree).
• Relevance is a better predictor of quality and value than other measures used in college rankings. Alumni ratings of relevance are two and three times more powerful at predicting quality and value than traditional college ranking inputs such as average SAT/ACT math scores, student loan default rates, average cost of attendance, alumni income earnings and graduation rates.
• Relevance to work and relevance to day-to-day life go hand in hand. Increases in one dimension of relevance are accompanied by increases in the other. There is room to improve on both dimensions, but levels of work relevance are lower overall.
• Fit matters. Both two-year and four-year degrees are valuable. While the common perception of higher education tends to focus on four-year degrees, equally high levels of relevance found among those with two-year degrees make it clear this is a powerful pathway to Completion With a Purpose — especially given the lifelong learning that’s all but required for workers and employers to thrive in the 21st century economy.
• Completion matters. Regardless of the field of study or degree type consumers pursue, those who complete their studies find greater relevance, value and quality in their education investments. A clear call to action is ensuring that more students complete their postsecondary pathway, and that includes helping consumers understand the relevance of their higher education investment and effort.
Key Findings

The Importanceof Relevance
Copyright © 2018 Strada Education Network and Gallup, Inc. All rights reserved5
From College to Life: Relevance and the Value of Higher Education
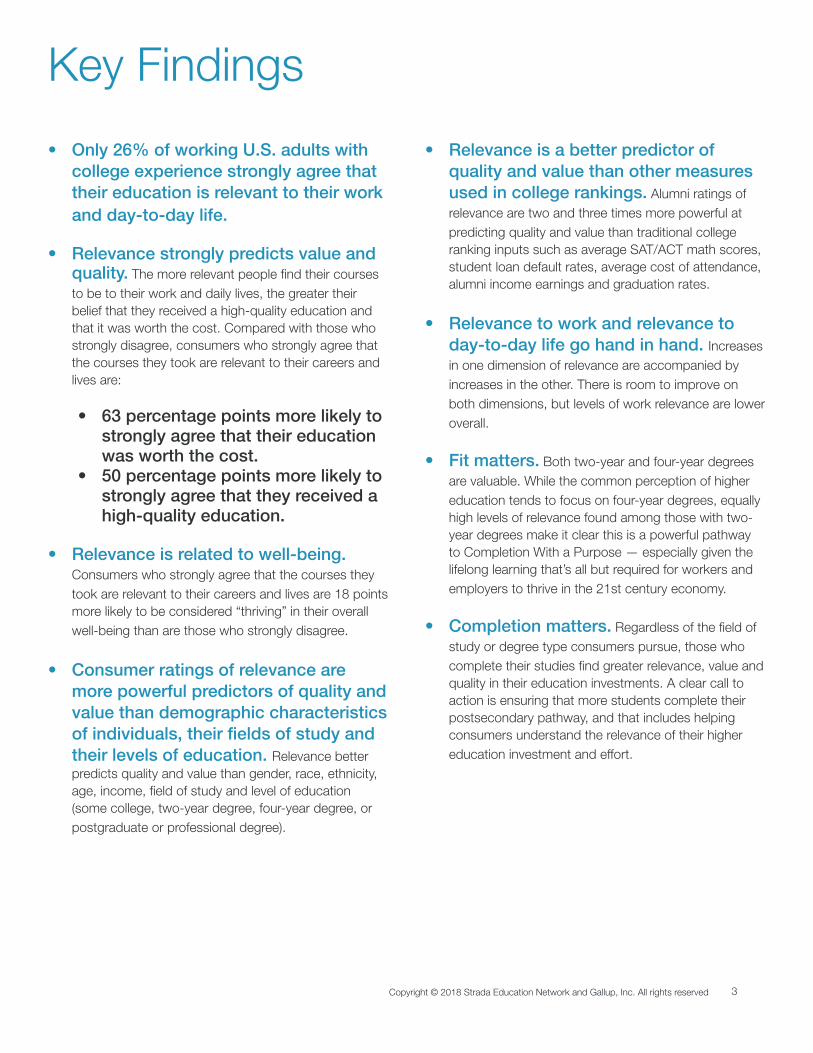
The more relevant that consumers find their courses
to be in their work and daily lives, the greater their
belief that they received a high-quality education and
that it was worth the cost. This is true for individuals
across all walks of life. Comparing the individuals with
the lowest relevance scores to those with the highest
in Figure 1 below, we see:
• A 63-point difference in the percentage who
strongly agree that their education was worth the
cost (14% vs. 77%)
• A 50-point gap in the percentage who strongly
agree that they received a high-quality education
(27% vs. 77%)
The Importance of Relevance
Relevance Is the Strongest Predictor of Consumers’ Perceptions of Quality and Value
90%
80%
70%
60%
50%
40%
30%
20%
10%
0%2
Strongly Disagree 3 4 5 6 7 8 9 10
Value (Strongly agree education was worth the cost)
Quality (Strongly agree received high-quality education)
Relevance Influences Value and Quality
Relevance Score
77% 77%
14%
27%
Learned important skills I use in
day-to-day life
Coursework is directly relevant to my work
Strongly Agree Learned important
skills I use in day-to-day life
Coursework is directly relevant to my work
Figure 1
Copyright © 2018 Strada Education Network and Gallup, Inc. All rights reserved 6
From College to Life: Relevance and the Value of Higher Education
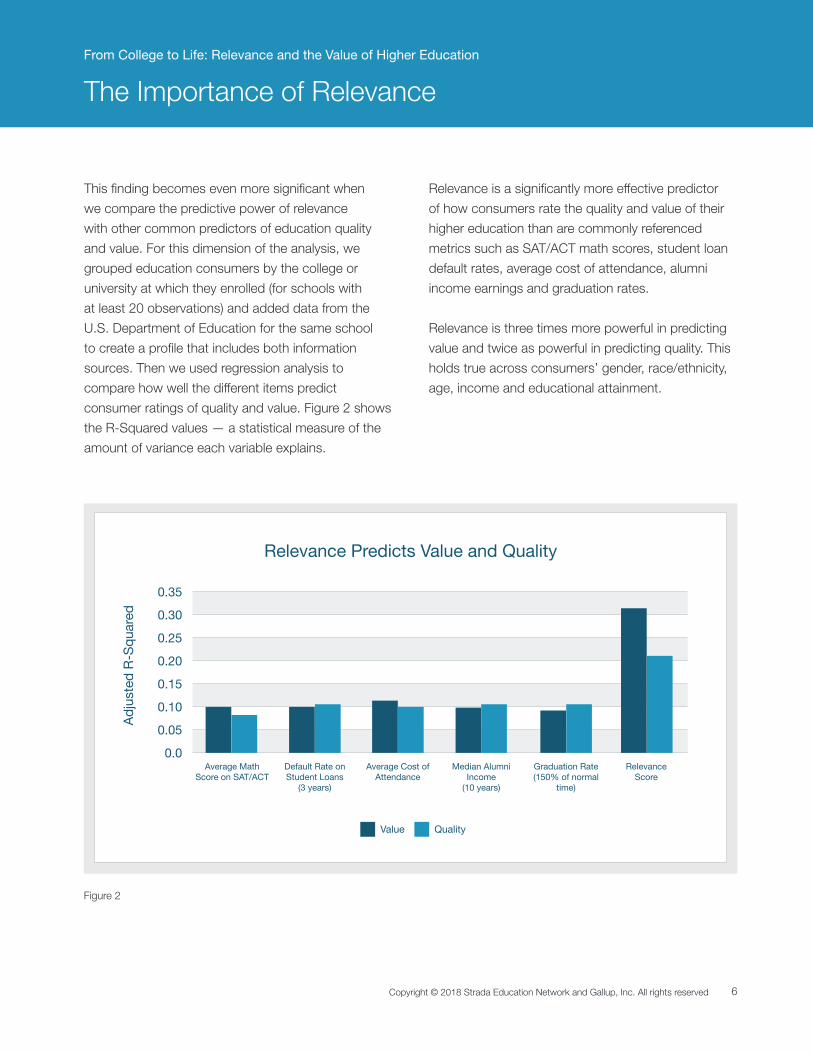
This finding becomes even more significant when
we compare the predictive power of relevance
with other common predictors of education quality
and value. For this dimension of the analysis, we
grouped education consumers by the college or
university at which they enrolled (for schools with
at least 20 observations) and added data from the
U.S. Department of Education for the same school
to create a profile that includes both information
sources. Then we used regression analysis to
compare how well the different items predict
consumer ratings of quality and value. Figure 2 shows
the R-Squared values — a statistical measure of the
amount of variance each variable explains.
Relevance is a significantly more effective predictor
of how consumers rate the quality and value of their
higher education than are commonly referenced
metrics such as SAT/ACT math scores, student loan
default rates, average cost of attendance, alumni
income earnings and graduation rates.
Relevance is three times more powerful in predicting
value and twice as powerful in predicting quality. This
holds true across consumers’ gender, race/ethnicity,
age, income and educational attainment.
The Importance of Relevance
0.35
0.30
0.25
0.20
0.15
0.10
0.05
0.0Average Math
Score on SAT/ACT
Value Quality
Relevance Predicts Value and Quality
Adju
sted
R-S
quar
ed
Default Rate on Student Loans
(3 years)
Average Cost of Attendance
Median Alumni Income
(10 years)
Graduation Rate(150% of normal
time)
RelevanceScore
Figure 2
Copyright © 2018 Strada Education Network and Gallup, Inc. All rights reserved7
From College to Life: Relevance and the Value of Higher Education
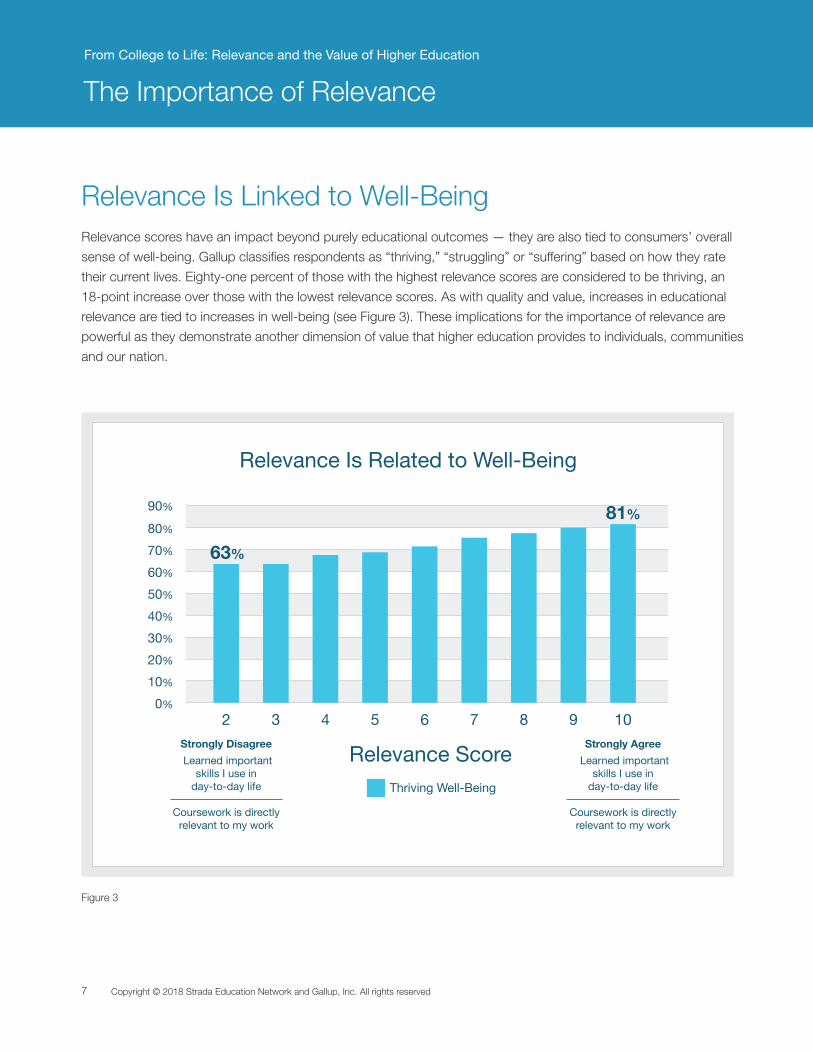
Relevance scores have an impact beyond purely educational outcomes — they are also tied to consumers’ overall
sense of well-being. Gallup classifies respondents as “thriving,” “struggling” or “suffering” based on how they rate
their current lives. Eighty-one percent of those with the highest relevance scores are considered to be thriving, an
18-point increase over those with the lowest relevance scores. As with quality and value, increases in educational
relevance are tied to increases in well-being (see Figure 3). These implications for the importance of relevance are
powerful as they demonstrate another dimension of value that higher education provides to individuals, communities
and our nation.
The Importance of Relevance
Relevance Is Linked to Well-Being
90%
80%
70%
60%
50%
40%
30%
20%
10%
0%2 3 4 5 6 7 8 9 10
Thriving Well-Being
Relevance Is Related to Well-Being
Relevance Score
63%
81%
Strongly Disagree Learned important
skills I use in day-to-day life
Coursework is directly relevant to my work
Strongly Agree Learned important
skills I use in day-to-day life
Coursework is directly relevant to my work
Figure 3
Copyright © 2018 Strada Education Network and Gallup, Inc. All rights reserved 8
From College to Life: Relevance and the Value of Higher Education
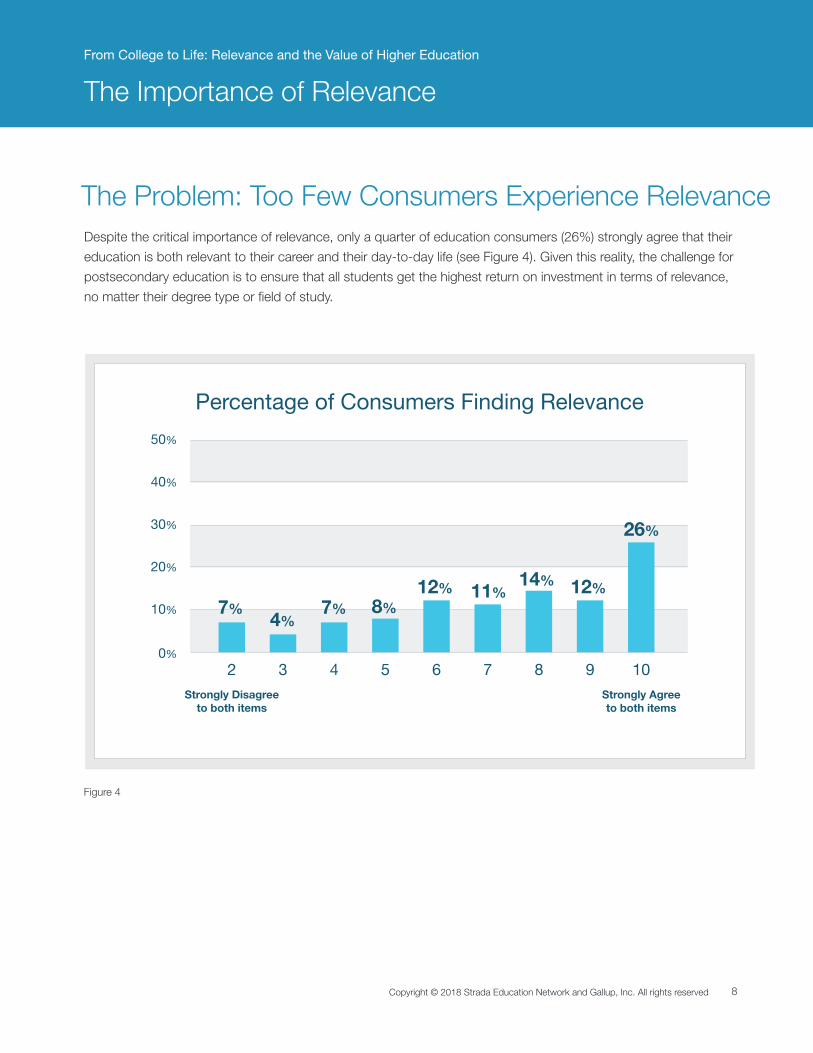
Despite the critical importance of relevance, only a quarter of education consumers (26%) strongly agree that their
education is both relevant to their career and their day-to-day life (see Figure 4). Given this reality, the challenge for
postsecondary education is to ensure that all students get the highest return on investment in terms of relevance,
no matter their degree type or field of study.
The Importance of Relevance
The Problem: Too Few Consumers Experience Relevance
50%
40%
30%
20%
10%
0%2 3 4 5 6 7 8 9 10
Percentage of Consumers Finding Relevance
7%
26%
Strongly Disagreeto both items
Strongly Agreeto both items
4%7% 8%
12% 11%14% 12%
Figure 4

Copyright © 2018 Strada Education Network and Gallup, Inc. All rights reserved9
Varying Degreesof Relevance
Copyright © 2018 Strada Education Network and Gallup, Inc. All rights reserved10
From College to Life: Relevance and the Value of Higher Education
Varying Degrees of Relevance
50%
40%
30%
20%
10%
0%
Some college,no degree
Highest Relevance Scores by Level of Education
14%
29%
21%
43%
Two-yeardegree
Four-yeardegree
Postgradwork/degree
10 (Strongly agree to both items)
% Strongly agree to both items
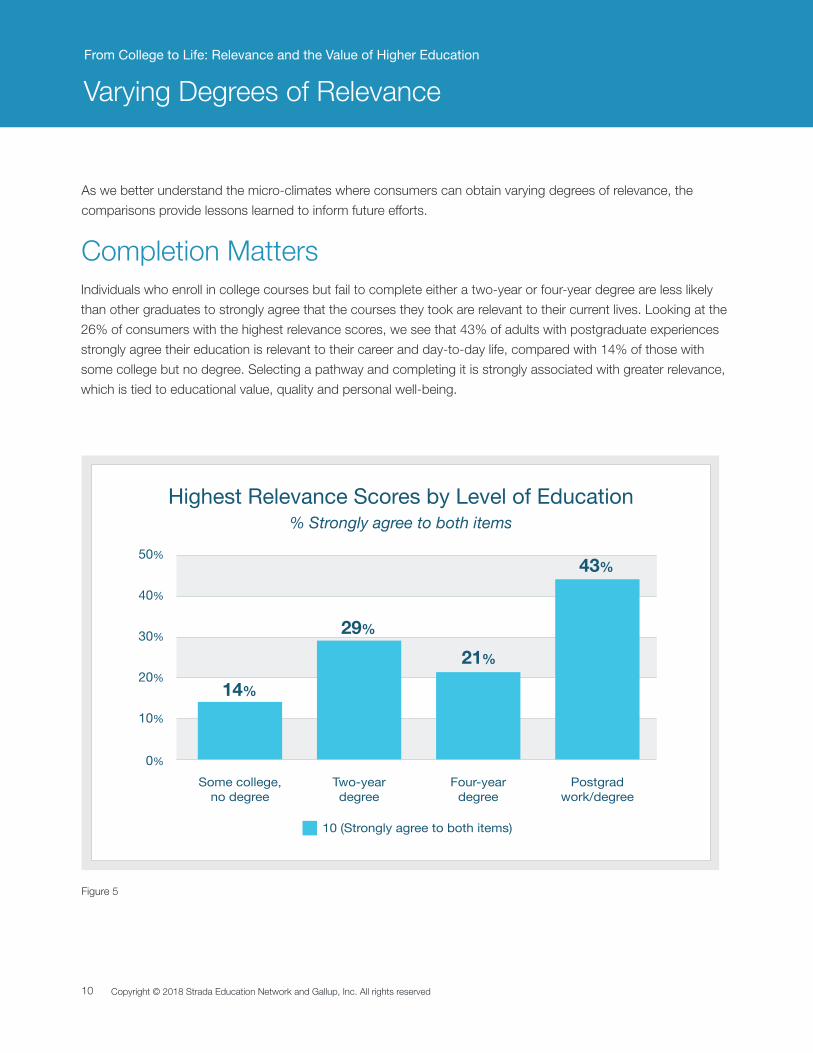
As we better understand the micro-climates where consumers can obtain varying degrees of relevance, the
comparisons provide lessons learned to inform future efforts.
Completion MattersIndividuals who enroll in college courses but fail to complete either a two-year or four-year degree are less likely
than other graduates to strongly agree that the courses they took are relevant to their current lives. Looking at the
26% of consumers with the highest relevance scores, we see that 43% of adults with postgraduate experiences
strongly agree their education is relevant to their career and day-to-day life, compared with 14% of those with
some college but no degree. Selecting a pathway and completing it is strongly associated with greater relevance,
which is tied to educational value, quality and personal well-being.
Figure 5
Copyright © 2018 Strada Education Network and Gallup, Inc. All rights reserved 11
From College to Life: Relevance and the Value of Higher Education
Varying Degrees of Relevance
10.09.08.07.06.05.04.03.02.0
Mean Relevance Scores by College Experience
Combined Relevance Mean Score
Courses-no degree
5.97.1 7.2
8.4
Four-year degree PostgraduateTwo-year degree
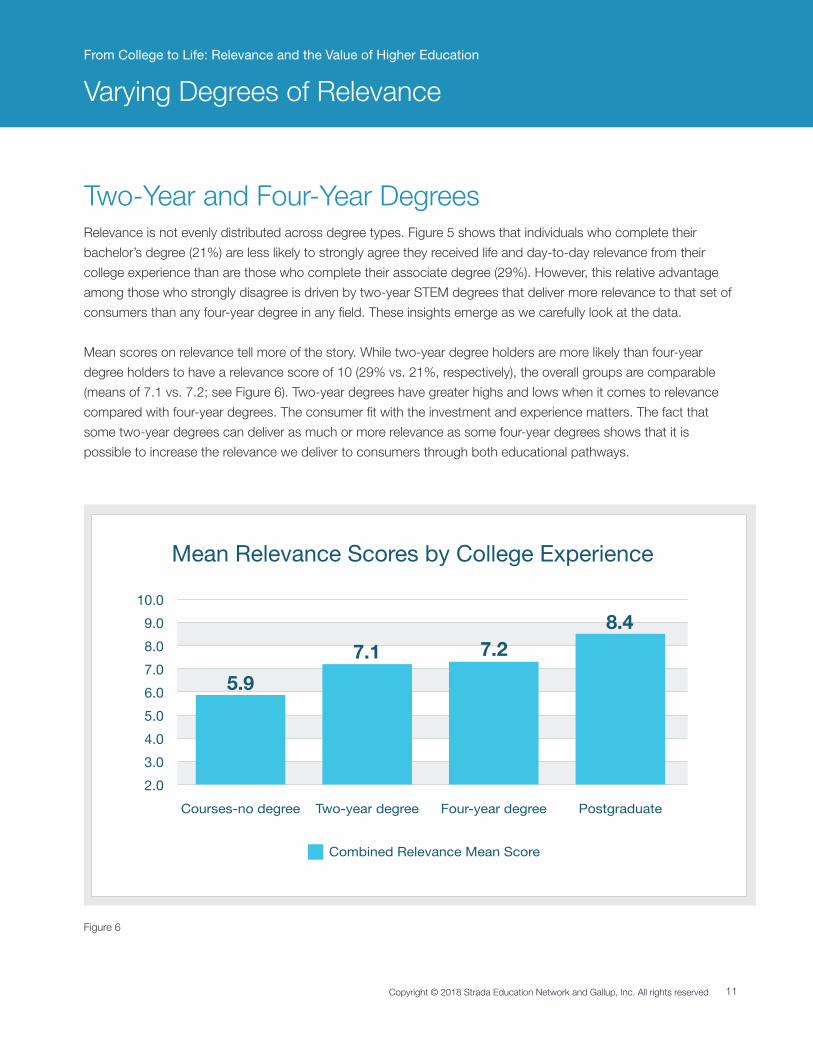
Relevance is not evenly distributed across degree types. Figure 5 shows that individuals who complete their
bachelor’s degree (21%) are less likely to strongly agree they received life and day-to-day relevance from their
college experience than are those who complete their associate degree (29%). However, this relative advantage
among those who strongly disagree is driven by two-year STEM degrees that deliver more relevance to that set of
consumers than any four-year degree in any field. These insights emerge as we carefully look at the data.
Mean scores on relevance tell more of the story. While two-year degree holders are more likely than four-year
degree holders to have a relevance score of 10 (29% vs. 21%, respectively), the overall groups are comparable
(means of 7.1 vs. 7.2; see Figure 6). Two-year degrees have greater highs and lows when it comes to relevance
compared with four-year degrees. The consumer fit with the investment and experience matters. The fact that
some two-year degrees can deliver as much or more relevance as some four-year degrees shows that it is
possible to increase the relevance we deliver to consumers through both educational pathways.
Two-Year and Four-Year Degrees
Figure 6
Copyright © 2018 Strada Education Network and Gallup, Inc. All rights reserved12
From College to Life: Relevance and the Value of Higher Education
Varying Degrees of Relevance
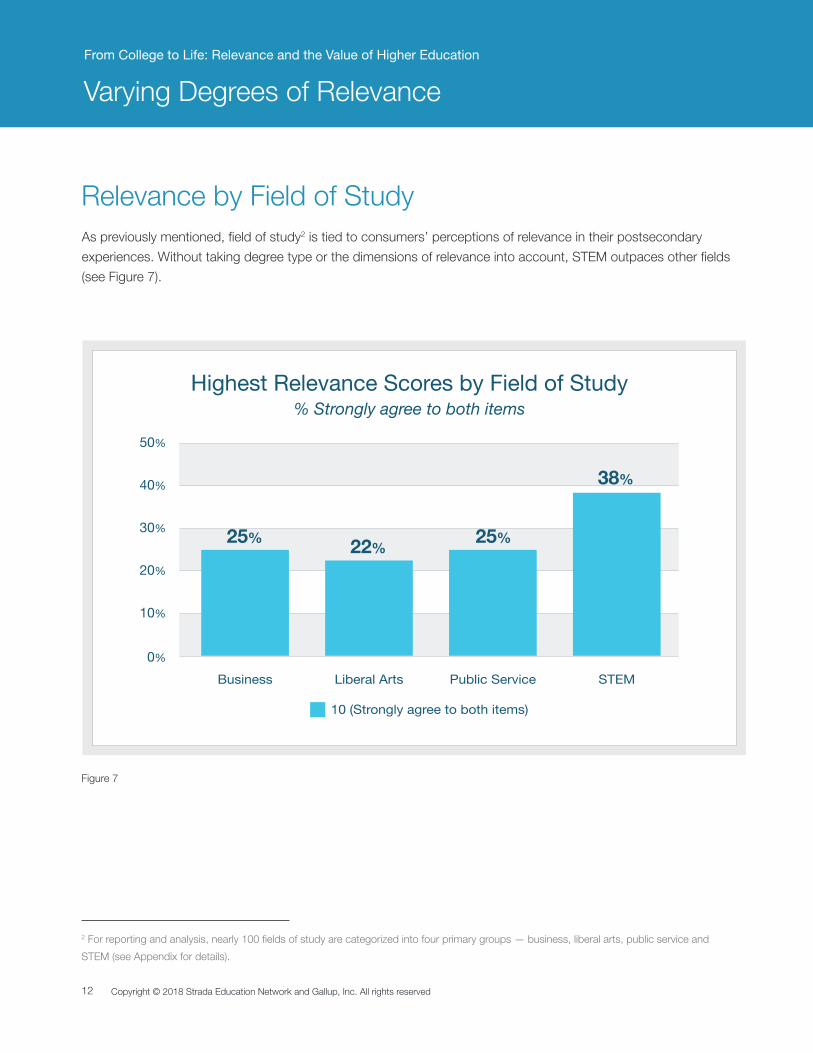
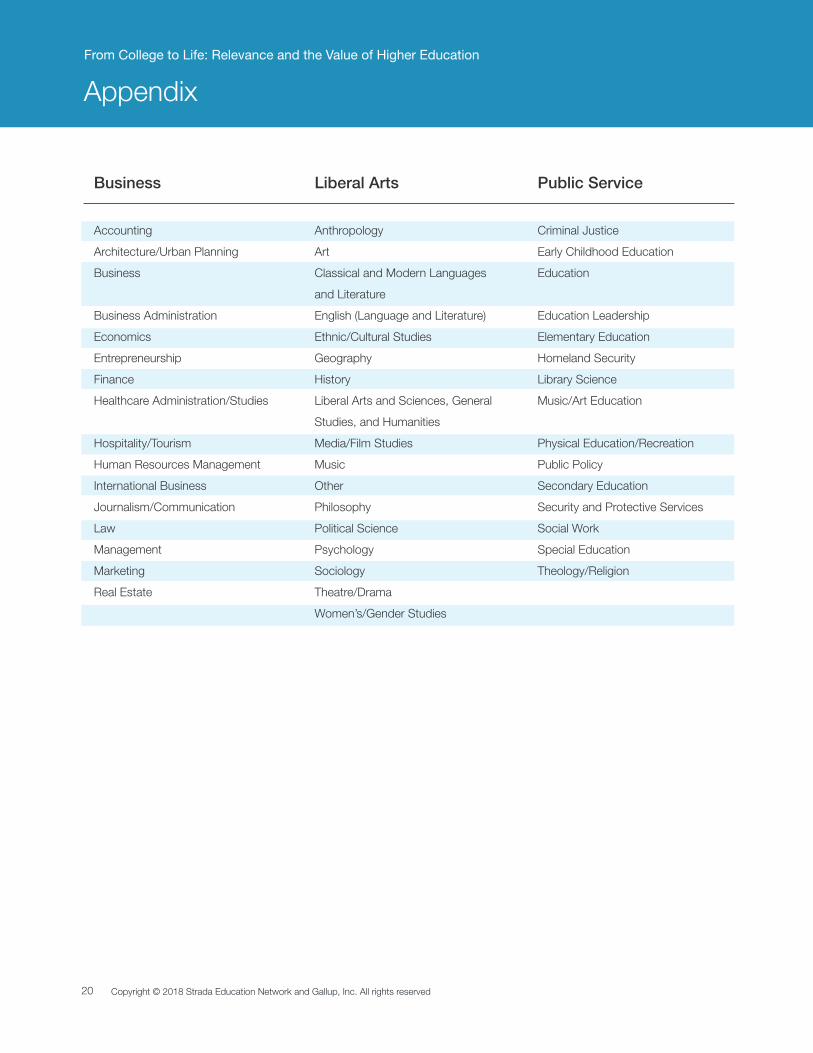
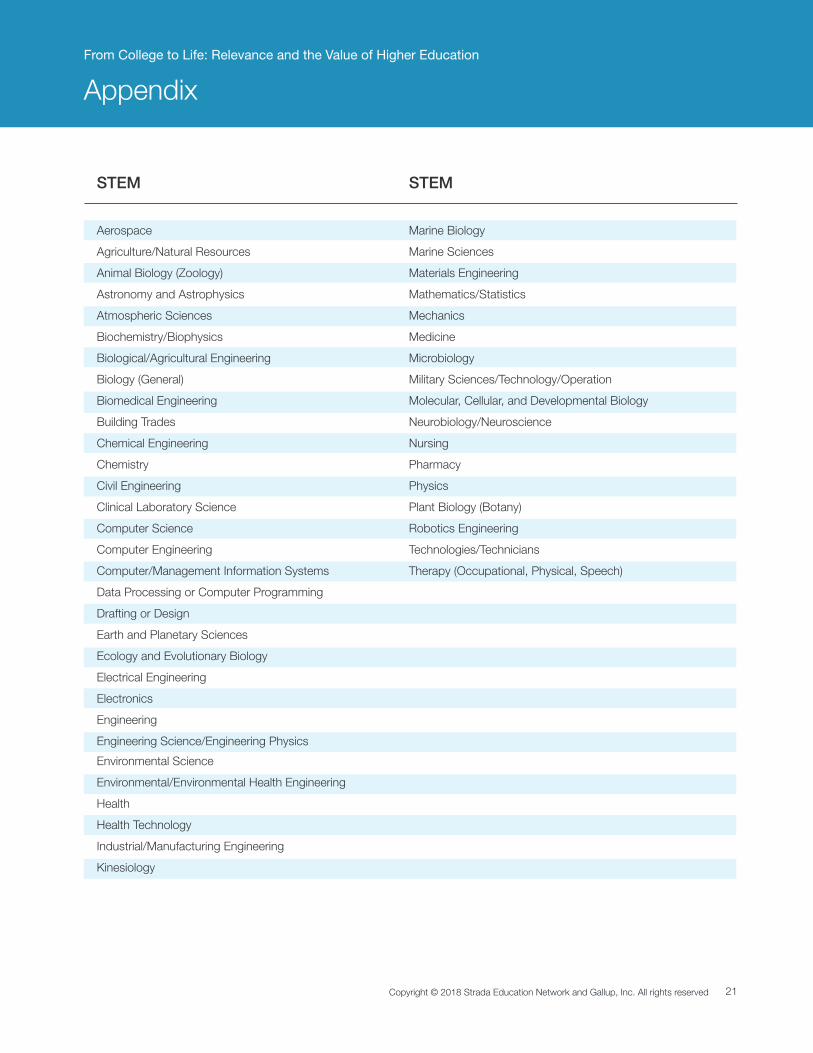
As previously mentioned, field of study2 is tied to consumers’ perceptions of relevance in their postsecondary
experiences. Without taking degree type or the dimensions of relevance into account, STEM outpaces other fields
(see Figure 7).
Relevance by Field of Study
10 (Strongly agree to both items)
50%
40%
30%
20%
10%
0%
Business
Highest Relevance Scores by Field of Study
25% 22%25%
38%
Liberal Arts Public Service STEM
% Strongly agree to both items
2 For reporting and analysis, nearly 100 fields of study are categorized into four primary groups — business, liberal arts, public service and
STEM (see Appendix for details).
Figure 7
Copyright © 2018 Strada Education Network and Gallup, Inc. All rights reserved 13
From College to Life: Relevance and the Value of Higher Education
Varying Degrees of Relevance
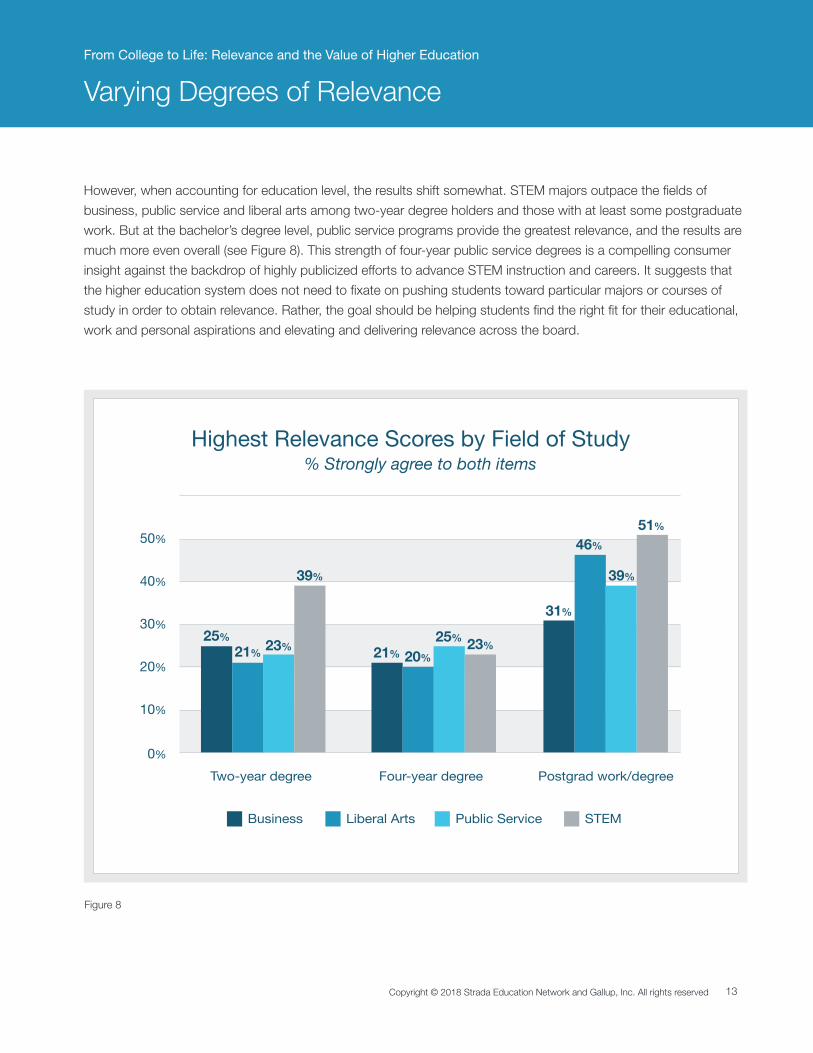
However, when accounting for education level, the results shift somewhat. STEM majors outpace the fields of
business, public service and liberal arts among two-year degree holders and those with at least some postgraduate
work. But at the bachelor’s degree level, public service programs provide the greatest relevance, and the results are
much more even overall (see Figure 8). This strength of four-year public service degrees is a compelling consumer
insight against the backdrop of highly publicized efforts to advance STEM instruction and careers. It suggests that
the higher education system does not need to fixate on pushing students toward particular majors or courses of
study in order to obtain relevance. Rather, the goal should be helping students find the right fit for their educational,
work and personal aspirations and elevating and delivering relevance across the board.
25%
20%
Business Liberal Arts Public Service STEM
50%
40%
30%
20%
10%
0%
Two-year degree
Highest Relevance Scores by Field of Study
25%
Four-year degree Postgrad work/degree
% Strongly agree to both items
21% 23%
39%
23%21%
46%
39%
51%
31%
Figure 8

Two Dimensions of Relevance: Work and Day-to-Day Life
Copyright © 2018 Strada Education Network and Gallup, Inc. All rights reserved15
From College to Life: Relevance and the Value of Higher Education
There is persistent tension in higher education between learning to think and learning to do — where is the value,
and what is the path forward? Is it education or training? Is it development of overarching skills and abilities, or
content mastery and vocational preparation? We’ve looked to the consumer voice for insights to guide and inform
us as we explore these questions.
To understand the relative outcomes and value of higher education in developing both important abilities and
specific skills, we asked consumers to rate the following statements identified at the outset of the report:
• The courses you took are directly relevant to what you do at work.
• You learned important skills during your education program that you use in your day-to-day life.
Both dimensions as measured by these items are important, and they are highly correlated with one another.
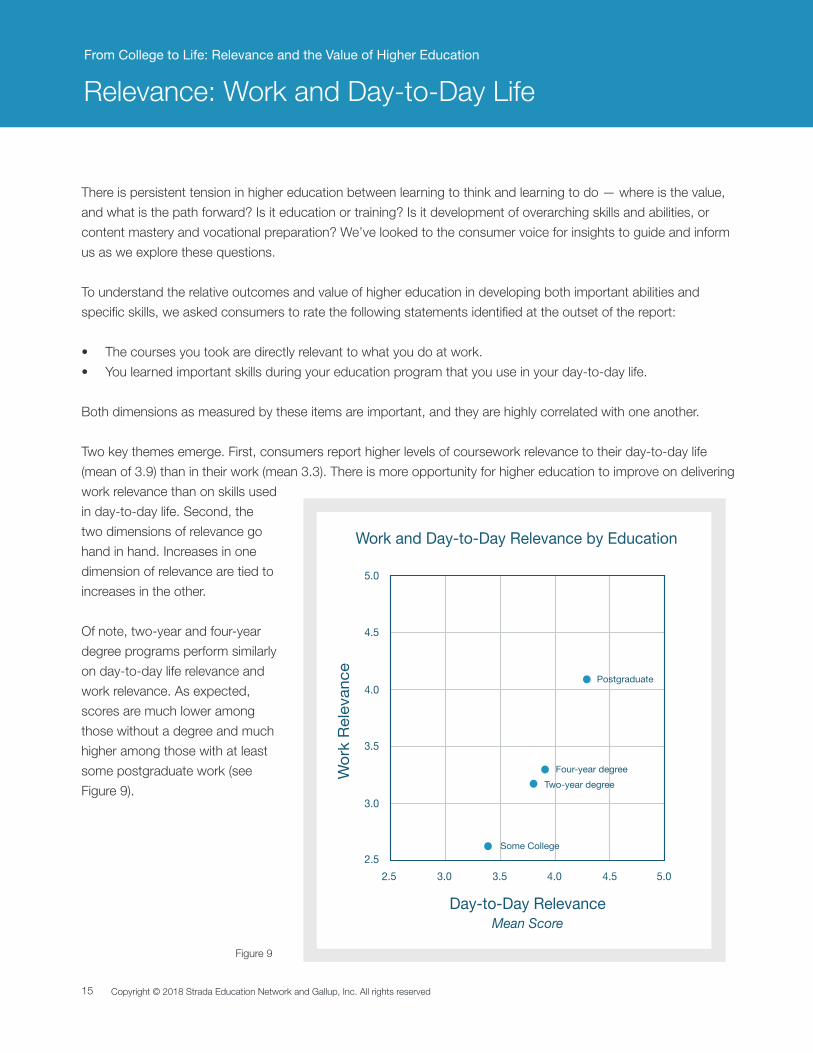
Two key themes emerge. First, consumers report higher levels of coursework relevance to their day-to-day life
(mean of 3.9) than in their work (mean 3.3). There is more opportunity for higher education to improve on delivering
work relevance than on skills used
in day-to-day life. Second, the
two dimensions of relevance go
hand in hand. Increases in one
dimension of relevance are tied to
increases in the other.
Of note, two-year and four-year
degree programs perform similarly
on day-to-day life relevance and
work relevance. As expected,
scores are much lower among
those without a degree and much
higher among those with at least
some postgraduate work (see
Figure 9).
Relevance: Work and Day-to-Day Life
Work and Day-to-Day Relevance by Education
2.5
Two-year degreeFour-year degree
Postgraduate
Day-to-Day Relevance
Wor
k Re
leva
nce
3.0
3.5
4.0
4.5
5.0
2.5 3.0 3.5 4.0 4.5 5.0
Some College
Mean Score
Figure 9
From College to Life: Relevance and the Value of Higher Education
Relevance: Work and Day-to-Day Life
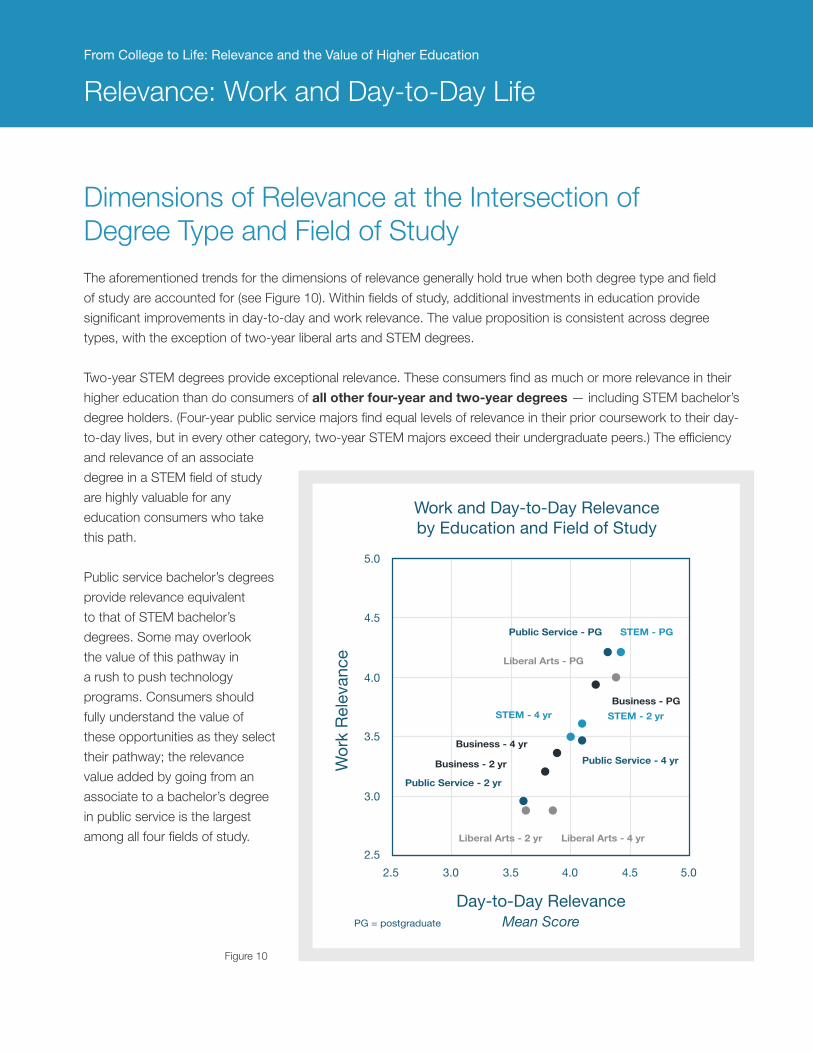
The aforementioned trends for the dimensions of relevance generally hold true when both degree type and field
of study are accounted for (see Figure 10). Within fields of study, additional investments in education provide
significant improvements in day-to-day and work relevance. The value proposition is consistent across degree
types, with the exception of two-year liberal arts and STEM degrees.
Two-year STEM degrees provide exceptional relevance. These consumers find as much or more relevance in their
higher education than do consumers of all other four-year and two-year degrees — including STEM bachelor’s
degree holders. (Four-year public service majors find equal levels of relevance in their prior coursework to their day-
to-day lives, but in every other category, two-year STEM majors exceed their undergraduate peers.) The efficiency
and relevance of an associate
degree in a STEM field of study
are highly valuable for any
education consumers who take
this path.
Public service bachelor’s degrees
provide relevance equivalent
to that of STEM bachelor’s
degrees. Some may overlook
the value of this pathway in
a rush to push technology
programs. Consumers should
fully understand the value of
these opportunities as they select
their pathway; the relevance
value added by going from an
associate to a bachelor’s degree
in public service is the largest
among all four fields of study.
Dimensions of Relevance at the Intersection ofDegree Type and Field of Study
Figure 11
Work and Day-to-Day Relevanceby Education and Field of Study
Mean Score
2.5Liberal Arts - 4 yr
Business - 4 yr
STEM - PG
Day-to-Day Relevance
Wor
k Re
leva
nce
3.0
3.5
4.0
4.5
5.0
2.5 3.0 3.5 4.0 4.5 5.0
Public Service - 4 yr
Public Service - 2 yr
Public Service - PG
STEM - 2 yrSTEM - 4 yr
Business - 2 yr
Business - PG
Liberal Arts - 2 yr
Liberal Arts - PG
PG = postgraduate
Figure 10
Copyright © 2018 Strada Education Network and Gallup, Inc. All rights reserved17
From College to Life: Relevance and the Value of Higher Education
The increasing costs associated with pursuing higher education, combined with accelerating changes in technology and the workforce, accentuate the need to assure consumers that they will find relevant curricula, quality and value in all higher education pathways. These survey findings point to a glaring gap between the importance of relevance and the number of consumers actually experiencing it. They also provide actionable insights that can inform scalable, research-based solutions — especially when combined with key learnings from across our research portfolio.
For example, we know from the Gallup-Purdue Index that college graduates who say they had the “Big Six” collegiate experiences are much more likely to strongly agree that their school prepared them well for work and life after college.
These six student experiences include:
1. Having at least one professor who made them excited about learning.
2. Having professors who cared about them as a person.
3. Having a mentor who encouraged them to pursue their goals and dreams.
4. Working on a long-term project that took a semester or more to complete.
5. Having a job or internship that allowed them to apply what they were learning in the classroom.
6. Being extremely active in extracurricular activities and organizations.
In addition, the Strada-Gallup 2017 College Student Survey found that students who have these three career-focused experiences at their institution are significantly more confident in being prepared for the workforce:
1. Speak often with faculty or staff about their career options.
2. Have at least one university official initiate a conversation with them about their career options.
3. Believe their school is committed to helping students find a rewarding career.
These are not overly complex or expensive interventions. Yet the clear majority of education consumers cite them as missing from their experience. Based on these insights and exposure to the growing number of best practices in the field, we propose a few key principles to guide our collective progress:
• Help each student identify a path connecting their education to careers. This includes improving access to work-based sources of advice when helping students determine their postsecondary path and course of study. Improved access to quality career advising is critical — especially for first-generation and minority students, who depend on these services both before and after enrollment.
• Accelerate the integration of work-based exposure and experiences into the curriculum. This can be accomplished through project-based learning, innovative work-study programs, internships and apprenticeship models. In addition, increasing employer engagement in designing and delivering curricula and in mentoring and advising students is critical, as well as encouraging and preparing faculty members to make stronger connections between coursework and real-world application.
• Leverage alumni as real-world ambassadors
and mentors across all programs of study. Alumni relations must reach beyond the development and athletics offices and into career advising and collaboration with faculty. Alumni are an untapped resource for dramatically increasing employer engagement and work-based integration across the postsecondary experience.
Scalable Solutions Are Within Reach
What Comes Next
We now know the experiences that contribute to perceptions of relevance
and better understand its significance. We also know who is — and is
not — experiencing relevance today. It is critical that we continue this
dialogue in order to increase the number of consumers who believe their
postsecondary education is relevant to their lives today, and that their
institution provided them with a valuable and high-quality educational
experience.
The final chapter of this series will expand on these concepts by engaging
leaders in the field to identify barriers and provide specific solutions that
will allow us to meet higher education consumers where they are. These
practical insights will inform our collective work to transform higher
education, including its reputation, customer relationships, and role in the
present and future of work.
To that end, Strada is engaging esteemed partners and experts — from
organizations such as Education Commission of the States, American
Association of State Colleges and Universities, the U.S. Chamber of
Commerce, Paul Quinn College, the Society for Human Resource
Management, and others — to contribute to our exploration of relevance
with a concluding chapter to this report.
We invite you to join us in listening to consumers and partnering with
thought leaders to enhance higher education’s relevance and value to
ultimately help students succeed in education, work and life.
Copyright © 2018 Strada Education Network and Gallup, Inc. All rights reserved 19
From College to Life: Relevance and the Value of Higher Education
Methodology
Results for the Strada-Gallup Education Consumer Survey are based on telephone surveys conducted June 29,
2016-March 4, 2018, with a random sample of 110,4811 currently employed respondents aged 18 and older,
living in all 50 U.S. states and the District of Columbia who have some college but no degree, an associate degree,
a bachelor’s degree, or postgraduate work/degree.
The Strada-Gallup Education Survey sample includes national adults with a minimum quota of 70% cellphone
respondents and 30% landline respondents, with additional minimum quotas by time zone within region. Landline
and cellular telephone numbers are selected using RDD methods. Landline respondents are chosen at random
within each household on the basis of which member will have the next birthday.
Interviews are conducted in English and Spanish. Samples are weighted to correct for unequal selection probability
and nonresponse. The data are weighted to match national demographics of gender, age, race, Hispanic ethnicity,
education and region. Demographic weighting targets are based on the most recent Current Population Survey
figures for the population aged 18-65 years with a U.S. bachelor’s degree or higher level of education.
All reported margins of sampling error include the computed design effects for weighting.
• For results based on 22,682 of those with some college, no degree, the margin of sampling error is ±0.9
percentage points at the 95% confidence level.
• For results based on 15,868 of associate degree holders, the margin of sampling error is ±1.1 percentage
points at the 95% confidence level.
• For results based on 40,635 bachelor’s degree holders, the margin of sampling error is ±0.7 percentage point
at the 95% confidence level.
• For results based on 31,296 of those with some postgraduate work but or degree, the margin of sampling
error is ±0.8 percentage points at the 95% confidence level.
• For results based on 5,823 of those with technical, trade, vocational or business program credentials, the
margin of sampling error is +/- 1.8 percentage points at the 95% confidence level.
In addition to sampling error, question wording and practical difficulties in conducting surveys can introduce error
or bias into the findings of public opinion polls.
Study Design
1 The total sample of respondents for which institution-level factors such as SAT/ACT math scores, student loan default rates, average cost of attendance, alumni income earnings and graduation rates could be matched to survey responses is n=78,091.
Copyright © 2018 Strada Education Network and Gallup, Inc. All rights reserved20
From College to Life: Relevance and the Value of Higher Education
Appendix
Accounting
Architecture/Urban Planning
Business
Business Administration
Economics
Entrepreneurship
Finance
Healthcare Administration/Studies
Hospitality/Tourism
Human Resources Management
International Business
Journalism/Communication
Law
Management
Marketing
Real Estate
Anthropology
Art
Classical and Modern Languages
and Literature
English (Language and Literature)
Ethnic/Cultural Studies
Geography
History
Liberal Arts and Sciences, General
Studies, and Humanities
Media/Film Studies
Music
Other
Philosophy
Political Science
Psychology
Sociology
Theatre/Drama
Women’s/Gender Studies
Criminal Justice
Early Childhood Education
Education
Education Leadership
Elementary Education
Homeland Security
Library Science
Music/Art Education
Physical Education/Recreation
Public Policy
Secondary Education
Security and Protective Services
Social Work
Special Education
Theology/Religion
Business Liberal Arts Public Service
Copyright © 2018 Strada Education Network and Gallup, Inc. All rights reserved 21
From College to Life: Relevance and the Value of Higher Education
Appendix
Aerospace
Agriculture/Natural Resources
Animal Biology (Zoology)
Astronomy and Astrophysics
Atmospheric Sciences
Biochemistry/Biophysics
Biological/Agricultural Engineering
Biology (General)
Biomedical Engineering
Building Trades
Chemical Engineering
Chemistry
Civil Engineering
Clinical Laboratory Science
Computer Science
Computer Engineering
Computer/Management Information Systems
Data Processing or Computer Programming
Drafting or Design
Earth and Planetary Sciences
Ecology and Evolutionary Biology
Electrical Engineering
Electronics
Engineering
Engineering Science/Engineering Physics
Environmental Science
Environmental/Environmental Health Engineering
Health
Health Technology
Industrial/Manufacturing Engineering
Kinesiology
STEM
Marine Biology
Marine Sciences
Materials Engineering
Mathematics/Statistics
Mechanics
Medicine
Microbiology
Military Sciences/Technology/Operation
Molecular, Cellular, and Developmental Biology
Neurobiology/Neuroscience
Nursing
Pharmacy
Physics
Plant Biology (Botany)
Robotics Engineering
Technologies/Technicians
Therapy (Occupational, Physical, Speech)
STEM

9998 Crosspoint Blvd.Suite 400Indianapolis, IN 46256
1.317.806.1200
www.stradaeducation.org
The Gallup Building901 F Street, NWWashington, D.C. 20004
1.877.242.5587
www.gallup.com
EDSURGE.COM
COLUMN | POSTSECONDARY LEARNING
‘Talent’ Has Become the New Theme Uniting Education and Employment
By Sean Gallagher (Columnist) May 7, 2018
The postsecondary education sector is on a collision course with the world of work.
Entrepreneurs and investors, government leaders, foundations and others are increasingly
framing their goals around the concept of developing “talent”–or human capital–with less regard
to where and how the education takes place. This theme was evident as thought leaders and
executives gathered at the recent ASU+GSV Summit, an event that itself was framed around
talent just as much as education. Talent as the organizing principle for activity in the higher
education and employment sectors is driven by the convergence of skills demands in the
economy; evolutions in public policy; trends in venture and philanthropic investment; and new
technology developments.
Beyond ‘College-to-Career’
Demand for talent is at all-time highs in an expanding global economy. There are more than six
million open jobs in the U.S. alone—and jobless claims are now at the lowest level since 1969.
Significantly, talent strategy has risen to the top of C-suite and board-level priority lists.
According to the 2017 PWC Global CEO survey, human capital was among CEO’s top-three
business priorities—alongside developing digital and technology capabilities. The bigger picture
is that we’re going through a period of change some have called the “second machine age” that is
driving a need to focus on talent, as 80 percent of “middle-skill” jobs today require digital skills.
From the perspective of corporate leaders, “talent strategy” can be thought of as encompassing
both talent acquisition (hiring) and talent development (classically referred to as “training”).
Often, those in education circles fall into the trap of thinking about talent acquisition as relating
only to new college graduates beginning a career, and talent development as taking place only
within the corporate world. However, it’s important to keep in mind that the market for
experienced talent–recruiting, developing and credentialing the tens of millions of adults who are
already in workforce–is many times larger than the traditional college-to-career pipeline that
captures so much attention. And the ecosystem to support professional and lifelong learning is
growing to include a host of options, ranging from employers themselves to start-up providers, as
well as colleges and universities.
On the talent-acquisition side of the equation, demand—especially in the technology field–is so
great that firms such as IBM, Google, Microsoft, Hubspot and a host of others are providing their
own public-facing education and credentials. At Northeastern University, we are working in
partnership with General Electric to offer modularized learning experiencesthat create an onramp
to careers in advanced manufacturing. Additionally, a number of employers have recognized that
there are untapped or overlooked talent pools, and are now purposefully shifting away from a
long-standing bias toward college degrees in their hiring practices—as part of what is becoming
known as the skills-based hiring movement. Examples include IBM’s “new collar jobs” effort
and the U.S. Chamber of Commerce Foundation’s Talent Pipeline Management Initiative.
Employers’ talent-development strategies and investments are also evolving rapidly. While there
are high-profile examples of companies enhancing their tuition assistance benefits—such as
the Starbucks deal with Arizona State or Chipotle’s work with Guild Education—that is not the
norm (even though it represents a trend worth watching). The share of U.S. employers who
provide traditional tuition assistance to their employees has dropped from 61 percent in 2013 to
53 percent in 2017, according to the Society for Human Resource Management. Instead,
companies today are increasingly likely to promote microlearning approaches that provide
employees with short-form learning that may eventually stack into a larger credential.
In decades past, the corporation was the steward of many workers’ education. But employees
today are increasingly more responsible for their own skill development. This shift in
responsibility is arguably similar to how responsibility for retirement savings went from
corporate-funded pensions to shared-risk and co-investment in the 401(K) in recent decades.
Professionals understand that we are in a job market that demands lifelong learning. According
to a Pew survey, 87 percent of Americans believe it will be necessary to develop new skills
throughout their career to keep up with changes in the workplace.
Meanwhile, top executives in the U.S. aren’t always eager to be the ones paying to train their
workers for those new skills. A global PwC poll recently found that only 50 percent of U.S.
CEOs believe it is their responsibility to retrain employees whose jobs are automated by
technology—compared to over 80 percent of CEOs in China and Germany.
But wait, didn’t companies say they see talent as a top priority? There is a paradox here. But
remember, the market for talent is increasingly global and dynamic. Employers are identifying
and acquiring talent through a wider range of sources, and employees and employers have more
choices than ever in an open market for learning and development content and credentials—
across a wide ecosystem of players and providers.
Blurring Traditional Boundaries
New players have emerged in recent years, in response to new demands. While degrees from
traditional colleges remain the gold standard in many fields, a parallel ecosystem of options is
emerging—often fueled by venture capital—which investor Ryan Craig refers to as “faster and
cheaper alternatives to college.” His thesis that HR and staffing firms will increasingly play a
role in lifelong learning seems confirmed in the recent acquisition of coding and skills bootcamp
General Assembly for $412.5 million by European HR and talent-management firm Adecco.
Investment funding in what has traditionally been considered the “edtech” sector is now driven
by firms that focus squarely on services and technologies related to talent development and
acquisition. The largest funding rounds of 2017 and 2018, and the most richly-capitalized
companies overall, include Coursera, Degreed, Andela, MasterClass, and Trilogy Education
Services—which for example each represent services or platforms to help meet the talent
challenge, rather than, say, companies that offer software or tools to traditional colleges.
Meanwhile, a whole new technology infrastructure sector is emerging to help companies and
professionals document and share competencies in a world of digital credentialing. These include
Credly, which recently made the news with the acquisition of Pearson’s Acclaim platform—as
well as companies like Parchment, Accredible, TrueCred, Learning Machine and the non-profit
Credential Engine. As learning and credentialing increasingly take place on the job, online, and
from a mix of accredited institutions and other providers, a new generation of corporate software
is emerging to organize and document this learning. Expert HR analyst Josh Bersin of Deloitte—
who spoke at the ASU+GSV Summit—has described this market segment as “learning
experience platforms.” He says these platforms are replacing the traditional corporate LMS, as
employees increasingly “learn in the flow of work.”
In the past, companies that served the corporate training market were often off on their own, with
little interaction with traditional higher education. Today, there are more multi-sided platform
businesses serving a combination of consumer learners directly; employers; and working with
universities.
Additionally, many of the foundations and nonprofits that have been major catalysts for
innovation in higher education are also positioning their work around the “talent” and theme—
recognizing the need for solutions that cut across traditional sector boundaries, and utilizing a
combination of traditional grant-making and public-policy work, as well as new forms of impact
investing.
For example, the Lumina Foundation—whose CEO Jamie Merisotis has written an entire
book framed around the dynamics of America’s need for talent—has traditionally been known as
the largest private foundation focused on higher education. Today, the foundation is describing
its work in terms of meeting the nation’s need for talent by shaping and supporting
postsecondary learning “however and wherever it is obtained,” through both traditional college
credentials and workforce-based credentialing. Another large postsecondary education-focused
non-profit and philanthropy, Strada Education Network, has made waves in recent weeks by
acquiring labor market analytics firm EMSI; acquiring the Council for Adult and Experiential
Learning; and launching an Institute for the Future of Work—all in service of better aligning
education and work and meeting employers’ talent and skills needs.
Learning Happens Everywhere
In the emerging talent ecosystem—which includes new forms of microlearning and digital
credentialing—technology tools and infrastructure will play a major role, often as a bridge
between education providers and employers. The fundamental conceptual shift is away from the
near monopoly by educational institutions as the principal place to help individuals gain skills, to
a world where there’s a broader array of non-institutional providers and technology partners.
This means that traditional educational institutions will need to be more nimble and responsive,
and will face new competition for resources, funding and attention—while simultaneously being
presented with new types of partners and technology enablers.
Government policy is also playing a role. For instance, governors in many states have started
pushing to build out apprenticeship models, which are often positioned as an alternative to
traditional postsecondary education. The extension of federal funds to non-institutional providers
such as coding bootcamps already has a recent if still under-the-radar example in the 2017
“Forever GI Bill.” With the Higher Education Act up for reauthorization in Congress, the
question of moving beyond postsecondary institutions as the sole recipients of financial aid and
directing it to non-institutional providers—including the quality control mechanisms to oversee
this—awaits debate and can be found in the PROSPER Act.
Shifting to a focus on “talent”—and the development of an ecosystem that supports and
recognizes learning wherever it occurs—holds the promise of creating a more efficient and
equitable market when it comes to education and careers. However, we are still in the early
stages of this digitally-fueled transition. The blurring boundaries between postsecondary
education and employment will require new types of collaboration and public-private
partnerships, more evidence-based research and new approaches to quality control, standards,
and infrastructure.
These changes are already happening—and the entities that do not recognize the significance of
this shift will be in danger of missing the opportunity.
Sean Gallagher is founder and executive director of Northeastern University’s Center for the
Future of Higher Education and Talent Strategy.
FAST COMPANY.COM
05.15.18
WORKPLACE EVOLUTION
Employers like EY and IBM are now hiring workers without college degrees
Companies often use a bachelor’s degree requirement as shorthand for a variety of soft skills. But the tight labor market is forcing them to broaden their talent pools.
BY GWEN MORAN4 MINUTE READ
At many companies, having a college degree is simply the price of admission for landing a job. A Bureau of Labor Statistics report released in June 2017 found that occupations that typically require some type of post-secondary education made up nearly 37% of employment in May 2016. The most common requirement was a bachelor’s degree. But some labor experts say it’s time to toss degree requirements except in situations where they’re necessary.
“I think there are a couple of motivations to relax [degree requirements],” says Joseph B. Fuller, a professor of management practice at Harvard Business School. “They’ll have to revisit it because the combination of what they can afford to pay and the response to that from the market for labor is not going to be a good one,” he says. Plus, many of the degree requirements demanded simply aren’t necessary to do the job.
THE DEGREE INFLATION DRAG
Degree inflation–requiring a college degree as hiring criteria for a position that doesn’t require it–is making the U.S. labor market inefficient, Fuller and his co-authors argue in “Dismissed by Degrees: How degree inflation is undermining U.S. competitiveness and hurting America’s middle class.” Companies look at a bachelor’s degree as shorthand for a variety of soft skills such as written and verbal communication, problem-solving, and others. However, the increasingly tight labor market, where leaders are scrambling to find talent, may force them to take a more inclusive view, considering people who are trained through community college programs, formal and informal apprenticeships, career program partnerships with community groups, and other job-training programs.
Fuller’s report describes the degree gap–the difference between job postings requiring a college degree and people in that industry who have a degree–in a number of industries found in an analysis of more than 26 million job postings. “For example, in 2015, 67% of
production supervisor job postings asked for a college degree, while only 16% of employed production supervisors had one. Our analysis indicates that more than 6 million jobs are currently at risk of degree inflation,” the report found.
HIRING “NEW COLLAR” WORKERS
While there isn’t exactly a race to drop degree requirements, some top companies are broadening their hiring criteria. At publishing house Penguin Random House U.S., it’s long been policy not to require college degrees, says Paige Mcinerny, vice president, human resources. The company has some job postings that state as a suggested requirement “college degree or equivalent work experience.” Except for specific jobs where a targeted, accredited degree is truly required–such as a certified public accountant or attorney–“we do not have a mandatory, companywide higher-education requirement for working at Penguin Random House U.S.,” she says.
While management consulting firm EY still requires bachelor’s degrees for most positions in the U.S., it dropped the requirement for its U.K. hires in 2015. “They did some research and they saw that the individual strengths and future potential rather than the academic performance of those they hired were a greater indicator of success in working at the firm,” says Larry Nash, EY’s U.S. director of recruiting. He says the U.S. division “is always looking at our recruiting strategy,” but there are no immediate plans to drop degree requirements from most positions.
About 18 months ago, IBM also began looking at the skills gap and looming hiring issues. Concerns about not being able to find enough workers led the tech giant to look at new sources of talent–without bachelor’s degrees. “We started to look at ways we could build new pipeline, whether that was through community colleges, boot camps, partnering with other companies who might be working on development, as well as what we could do internally around skill development, and that was when we launched our apprenticeship program as well,” says Kelli Jordan, IBM’s new collar HR lead. Roughly 15 percent of new hires come from these “new collar” programs.
A CHALLENGE FOR EMPLOYERS
Jeff Strohl, PhD, analyzes education and labor market outcomes at Georgetown University Center on Education and the Workforce. He believes the labor market is dealing with “spot shortages where the employer can identify a specific skill that they’re missing and the certificate and the certification is a sure, clean way to get a demonstrated skill set, and in particular the certification,” he says.
However, he has concerns that these programs are collectively considered a broad-brush solution when they vary in the foundation they give prospective employees. Just 42% of certificates offer the potential for reasonable earnings and upward mobility, he says. Some simply offer entrée into dead-end jobs. And he’d like to see more data on the long-term outcomes of hires from “new collar” programs.
Fuller says companies need to do more than just complain about the labor shortage. Ultimately, they are going to need to try new things. But there are still barriers. Job-training programs, formal apprenticeship programs, and co-ops programs like that at Northeastern Universitycan be effective, but they require investment and a long-term commitment from employers. And employers are reluctant to take on that cost or obligation. However, maintaining the status quo has hidden costs, including turnover, higher salaries for unnecessary credentials, and difficulty filling key roles, to name a few, that many companies don’t acknowledge. Employers need to begin looking for talent in new areas.
“That means you don’t just kind of up-credential every job, assume that someone’s going to show up and take wages you can afford. You do the math, so you know whether it’s smarter to build your own,” Fuller says. When you do that, you know you’re getting skilled, capable workers who understand your culture, he adds. If you don’t? “You are leaving yourself at the mercy of market forces, which are often dictated by firms with higher brand recognition, who are viewed as more desirable and pay higher,” he says.
ABOUT THE AUTHOR
Gwen Moran writes about business, money and assorted other topics for leading publications and websites. She was named a Small Business Influencer Awards Top 100 Champion in 2015, 2014, and 2012 and is the co-author of The Complete Idiot's Guide to Business Plans (Alpha, 2010), and several other books. More


![Lifelong Learning: One important aspect is to strengthen the third · Council resolution on lifelong Learning [2002]; European Parlia-ment, Commission proposal for the introduction](https://img.pdfslide.us/doc/110x75/5f5853380307852c215f9494/lifelong-learning-one-important-aspect-is-to-strengthen-the-third-council-resolution.jpg)