Embed Size (px)
Citation preview

October 2021 Cash Collections Report
STATE OF RHODE ISLAND GOVERNOR DANIEL J. MCKEE
Office of Revenue Analysis
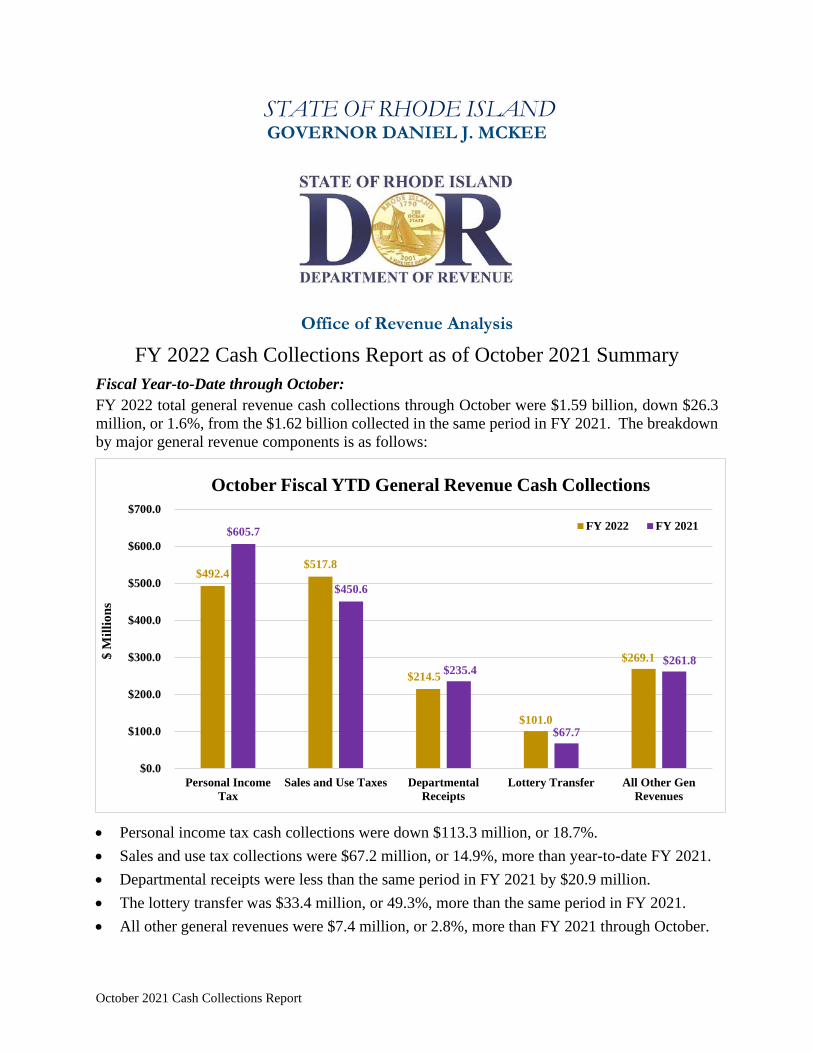
FY 2022 Cash Collections Report as of October 2021 Summary
Fiscal Year-to-Date through October:
FY 2022 total general revenue cash collections through October were $1.59 billion, down $26.3
million, or 1.6%, from the $1.62 billion collected in the same period in FY 2021. The breakdown
by major general revenue components is as follows:
• Personal income tax cash collections were down $113.3 million, or 18.7%.
• Sales and use tax collections were $67.2 million, or 14.9%, more than year-to-date FY 2021.
• Departmental receipts were less than the same period in FY 2021 by $20.9 million.
• The lottery transfer was $33.4 million, or 49.3%, more than the same period in FY 2021.
• All other general revenues were $7.4 million, or 2.8%, more than FY 2021 through October.
$492.4 $517.8
$214.5
$101.0
$269.1
$605.7
$450.6
$235.4
$67.7
$261.8
$0.0
$100.0
$200.0
$300.0
$400.0
$500.0
$600.0
$700.0
Personal Income
Tax
Sales and Use Taxes Departmental
Receipts
Lottery Transfer All Other Gen
Revenues
$ M
illi
on
s
October Fiscal YTD General Revenue Cash Collections
FY 2022 FY 2021
2
October 2021 Cash Collections Report
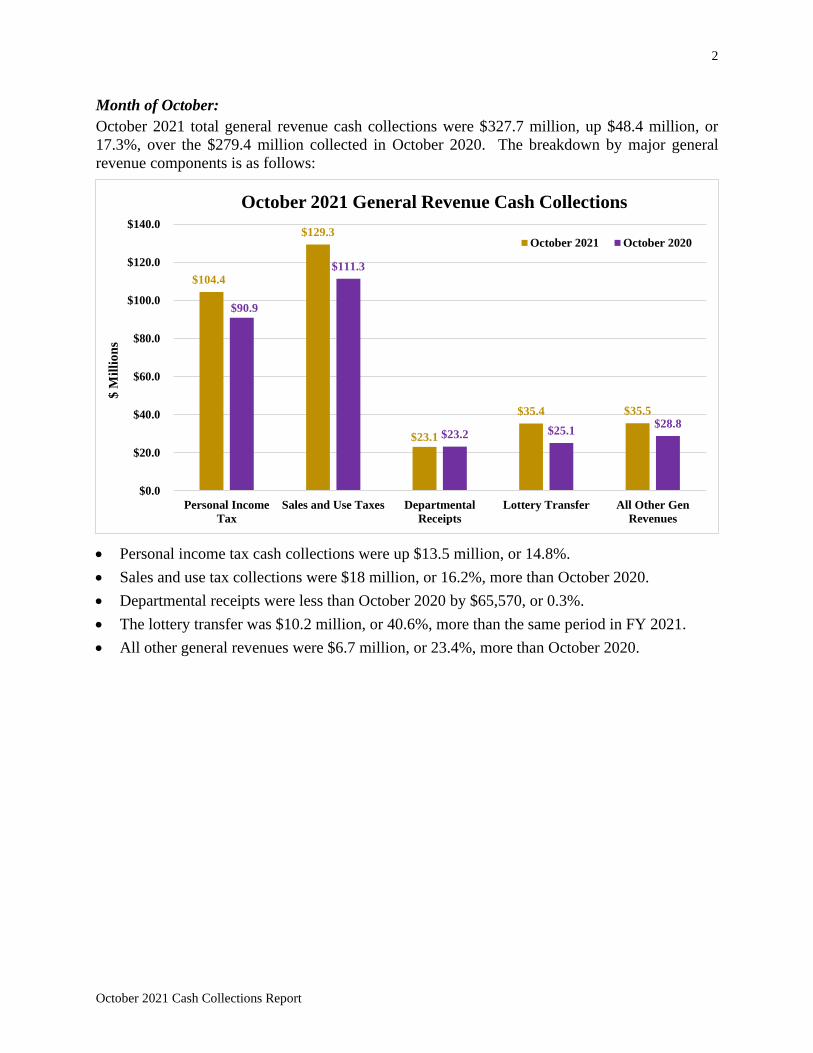
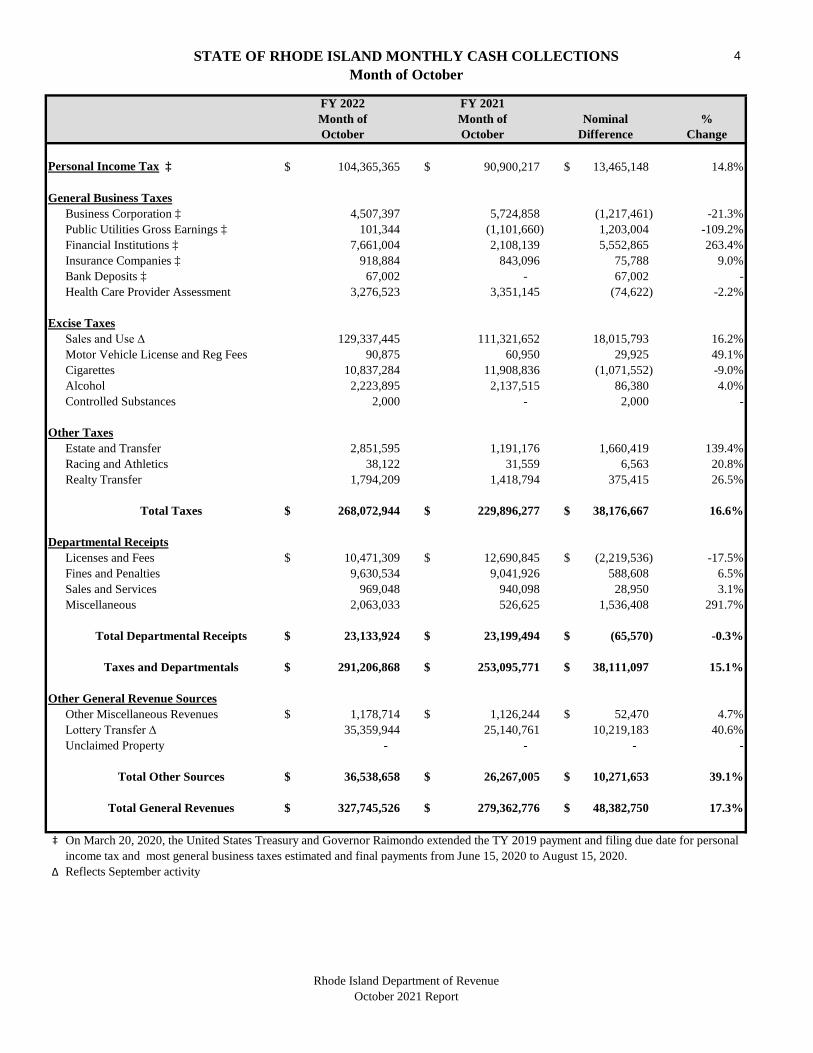
Month of October:
October 2021 total general revenue cash collections were $327.7 million, up $48.4 million, or
17.3%, over the $279.4 million collected in October 2020. The breakdown by major general
revenue components is as follows:
• Personal income tax cash collections were up $13.5 million, or 14.8%.
• Sales and use tax collections were $18 million, or 16.2%, more than October 2020.
• Departmental receipts were less than October 2020 by $65,570, or 0.3%.
• The lottery transfer was $10.2 million, or 40.6%, more than the same period in FY 2021.
• All other general revenues were $6.7 million, or 23.4%, more than October 2020.
$104.4
$129.3
$23.1
$35.4 $35.5
$90.9
$111.3
$23.2 $25.1 $28.8
$0.0
$20.0
$40.0
$60.0
$80.0
$100.0
$120.0
$140.0
Personal Income
Tax
Sales and Use Taxes Departmental
Receipts
Lottery Transfer All Other Gen
Revenues
$ M
illi
on
s
October 2021 General Revenue Cash Collections
October 2021 October 2020
STATE OF RHODE ISLAND MONTHLY CASH COLLECTIONSFiscal Year To Date
3
FY 2022 FY 2021YTD YTD Nominal
October October Difference Change
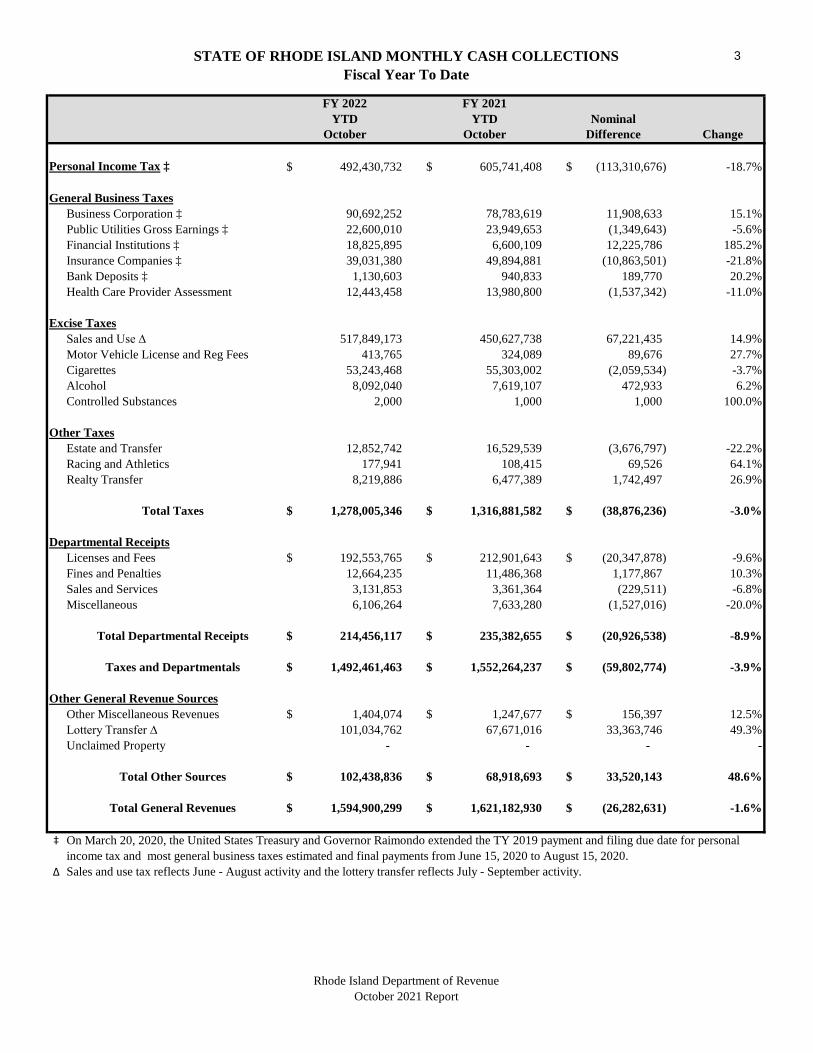
Personal Income Tax ‡ 492,430,732$ 605,741,408$ (113,310,676)$ -18.7%
General Business TaxesBusiness Corporation ‡ 90,692,252 78,783,619 11,908,633 15.1%Public Utilities Gross Earnings ‡ 22,600,010 23,949,653 (1,349,643) -5.6%Financial Institutions ‡ 18,825,895 6,600,109 12,225,786 185.2%Insurance Companies ‡ 39,031,380 49,894,881 (10,863,501) -21.8%Bank Deposits ‡ 1,130,603 940,833 189,770 20.2%Health Care Provider Assessment 12,443,458 13,980,800 (1,537,342) -11.0%
Excise TaxesSales and Use ∆ 517,849,173 450,627,738 67,221,435 14.9%Motor Vehicle License and Reg Fees 413,765 324,089 89,676 27.7%Cigarettes 53,243,468 55,303,002 (2,059,534) -3.7%Alcohol 8,092,040 7,619,107 472,933 6.2%Controlled Substances 2,000 1,000 1,000 100.0%
Other TaxesEstate and Transfer 12,852,742 16,529,539 (3,676,797) -22.2%Racing and Athletics 177,941 108,415 69,526 64.1%Realty Transfer 8,219,886 6,477,389 1,742,497 26.9%
Total Taxes 1,278,005,346$ 1,316,881,582$ (38,876,236)$ -3.0%
Departmental ReceiptsLicenses and Fees 192,553,765$ 212,901,643$ (20,347,878)$ -9.6%Fines and Penalties 12,664,235 11,486,368 1,177,867 10.3%Sales and Services 3,131,853 3,361,364 (229,511) -6.8%Miscellaneous 6,106,264 7,633,280 (1,527,016) -20.0%
Total Departmental Receipts 214,456,117$ 235,382,655$ (20,926,538)$ -8.9%
Taxes and Departmentals 1,492,461,463$ 1,552,264,237$ (59,802,774)$ -3.9%
Other General Revenue SourcesOther Miscellaneous Revenues 1,404,074$ 1,247,677$ 156,397$ 12.5%Lottery Transfer ∆ 101,034,762 67,671,016 33,363,746 49.3%Unclaimed Property - - - -
Total Other Sources 102,438,836$ 68,918,693$ 33,520,143$ 48.6%
Total General Revenues 1,594,900,299$ 1,621,182,930$ (26,282,631)$ -1.6%
‡ On March 20, 2020, the United States Treasury and Governor Raimondo extended the TY 2019 payment and filing due date for personal income tax and most general business taxes estimated and final payments from June 15, 2020 to August 15, 2020.
∆ Sales and use tax reflects June - August activity and the lottery transfer reflects July - September activity.
Rhode Island Department of RevenueOctober 2021 Report

STATE OF RHODE ISLAND MONTHLY CASH COLLECTIONSMonth of October
4
FY 2022 FY 2021Month of Month of Nominal %October October Difference Change
Personal Income Tax ‡ 104,365,365$ 90,900,217$ 13,465,148$ 14.8%
General Business TaxesBusiness Corporation ‡ 4,507,397 5,724,858 (1,217,461) -21.3%Public Utilities Gross Earnings ‡ 101,344 (1,101,660) 1,203,004 -109.2%Financial Institutions ‡ 7,661,004 2,108,139 5,552,865 263.4%Insurance Companies ‡ 918,884 843,096 75,788 9.0%Bank Deposits ‡ 67,002 - 67,002 -Health Care Provider Assessment 3,276,523 3,351,145 (74,622) -2.2%
Excise TaxesSales and Use ∆ 129,337,445 111,321,652 18,015,793 16.2%Motor Vehicle License and Reg Fees 90,875 60,950 29,925 49.1%Cigarettes 10,837,284 11,908,836 (1,071,552) -9.0%Alcohol 2,223,895 2,137,515 86,380 4.0%Controlled Substances 2,000 - 2,000 -
Other TaxesEstate and Transfer 2,851,595 1,191,176 1,660,419 139.4%Racing and Athletics 38,122 31,559 6,563 20.8%Realty Transfer 1,794,209 1,418,794 375,415 26.5%
Total Taxes 268,072,944$ 229,896,277$ 38,176,667$ 16.6%
Departmental ReceiptsLicenses and Fees 10,471,309$ 12,690,845$ (2,219,536)$ -17.5%Fines and Penalties 9,630,534 9,041,926 588,608 6.5%Sales and Services 969,048 940,098 28,950 3.1%Miscellaneous 2,063,033 526,625 1,536,408 291.7%
Total Departmental Receipts 23,133,924$ 23,199,494$ (65,570)$ -0.3%
Taxes and Departmentals 291,206,868$ 253,095,771$ 38,111,097$ 15.1%
Other General Revenue SourcesOther Miscellaneous Revenues 1,178,714$ 1,126,244$ 52,470$ 4.7%Lottery Transfer ∆ 35,359,944 25,140,761 10,219,183 40.6%Unclaimed Property - - - -
Total Other Sources 36,538,658$ 26,267,005$ 10,271,653$ 39.1%
Total General Revenues 327,745,526$ 279,362,776$ 48,382,750$ 17.3%
‡ On March 20, 2020, the United States Treasury and Governor Raimondo extended the TY 2019 payment and filing due date for personal income tax and most general business taxes estimated and final payments from June 15, 2020 to August 15, 2020.
∆ Reflects September activity
Rhode Island Department of RevenueOctober 2021 Report
5
October 2021 Cash Collections Report
STATE OF RHODE ISLAND GOVERNOR DANIEL J. MCKEE
Office of Revenue Analysis
FY 2022 State of Rhode Island Cash Collections Report
October 2021 Detail
The Rhode Island Department of Revenue cash collections report is a comprehensive analysis of
fiscal year-to-date and monthly cash collections on all revenue sources estimated by the principals
of the Revenue Estimating Conference (see Rhode Island General Laws § 35-16-1). Users of this
report should be cautious when comparing year-to-date growth rates for Other Miscellaneous
Revenues and Unclaimed Property as the receipt of these revenues occurs at discrete points in
time over the course of a fiscal year. Further complicating matters is the fact that the discrete
pattern of receipts varies so that payments received do not necessarily occur at the same point in
time in each fiscal year.
The October 2021 Cash Collections Report includes the impact of the COVID-19 pandemic on
State cash flows. For several cash items, such as the sales and use tax, the October cash collections
reflect taxable sales activity in September. For others, such as the personal income tax, the FY
2021 cash collections reflect changes in the timing of the receipt of cash payments due to the TY
2019 extension of filing and payment deadlines from April 15, 2020 to July 15, 2020. It is
important the reader not interpret all surpluses in cash collections as realized increases in cash
receipts; the delayed receipt of cash payments may also be responsible.
6
October 2021 Cash Collections Report
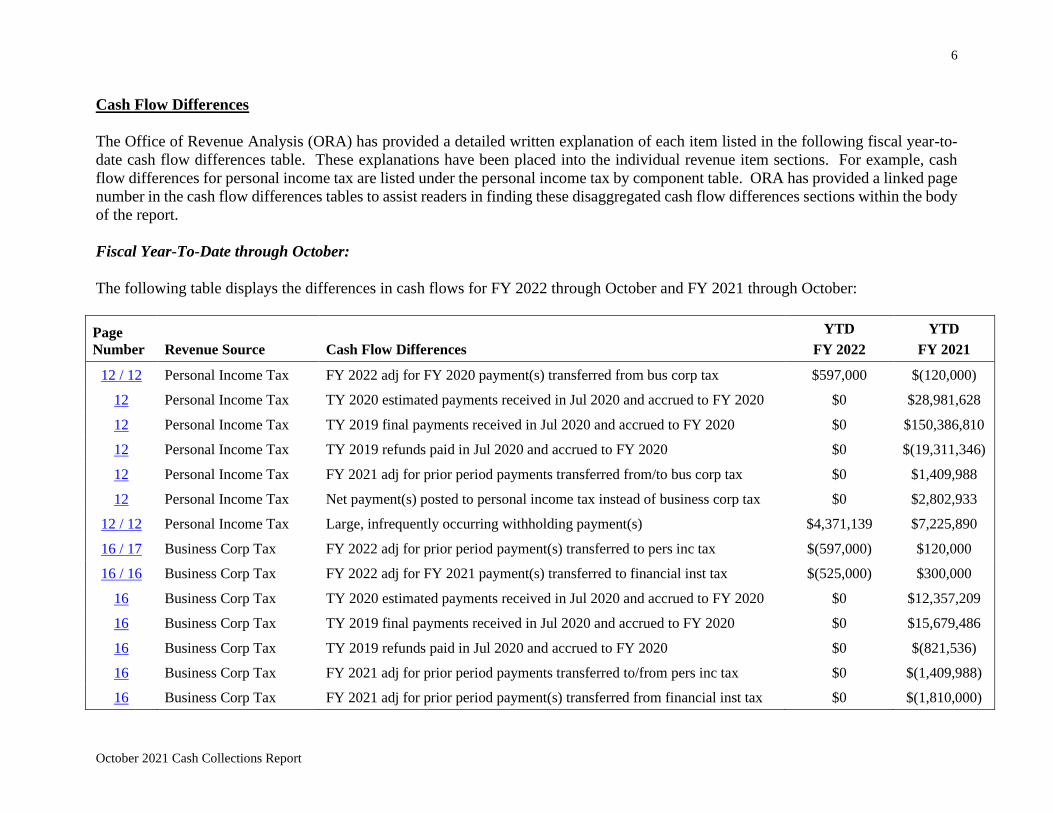
Cash Flow Differences
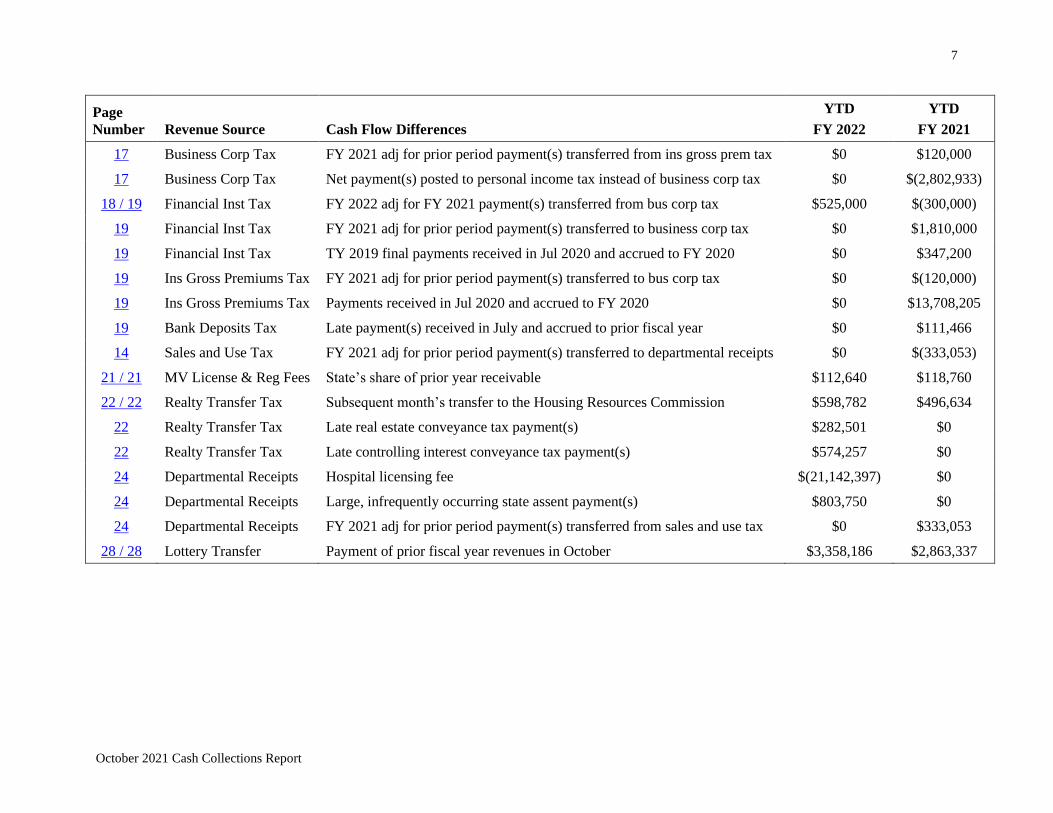
The Office of Revenue Analysis (ORA) has provided a detailed written explanation of each item listed in the following fiscal year-to-
date cash flow differences table. These explanations have been placed into the individual revenue item sections. For example, cash
flow differences for personal income tax are listed under the personal income tax by component table. ORA has provided a linked page
number in the cash flow differences tables to assist readers in finding these disaggregated cash flow differences sections within the body
of the report.
Fiscal Year-To-Date through October:
The following table displays the differences in cash flows for FY 2022 through October and FY 2021 through October:
Page
Number Revenue Source Cash Flow Differences
YTD
FY 2022
YTD
FY 2021
12 / 12 Personal Income Tax FY 2022 adj for FY 2020 payment(s) transferred from bus corp tax $597,000 $(120,000)
12 Personal Income Tax TY 2020 estimated payments received in Jul 2020 and accrued to FY 2020 $0 $28,981,628
12 Personal Income Tax TY 2019 final payments received in Jul 2020 and accrued to FY 2020 $0 $150,386,810
12 Personal Income Tax TY 2019 refunds paid in Jul 2020 and accrued to FY 2020 $0 $(19,311,346)
12 Personal Income Tax FY 2021 adj for prior period payments transferred from/to bus corp tax $0 $1,409,988
12 Personal Income Tax Net payment(s) posted to personal income tax instead of business corp tax $0 $2,802,933
12 / 12 Personal Income Tax Large, infrequently occurring withholding payment(s) $4,371,139 $7,225,890
16 / 17 Business Corp Tax FY 2022 adj for prior period payment(s) transferred to pers inc tax $(597,000) $120,000
16 / 16 Business Corp Tax FY 2022 adj for FY 2021 payment(s) transferred to financial inst tax $(525,000) $300,000
16 Business Corp Tax TY 2020 estimated payments received in Jul 2020 and accrued to FY 2020 $0 $12,357,209
16 Business Corp Tax TY 2019 final payments received in Jul 2020 and accrued to FY 2020 $0 $15,679,486
16 Business Corp Tax TY 2019 refunds paid in Jul 2020 and accrued to FY 2020 $0 $(821,536)
16 Business Corp Tax FY 2021 adj for prior period payments transferred to/from pers inc tax $0 $(1,409,988)
16 Business Corp Tax FY 2021 adj for prior period payment(s) transferred from financial inst tax $0 $(1,810,000)
7
October 2021 Cash Collections Report
Page
Number Revenue Source Cash Flow Differences
YTD
FY 2022
YTD
FY 2021
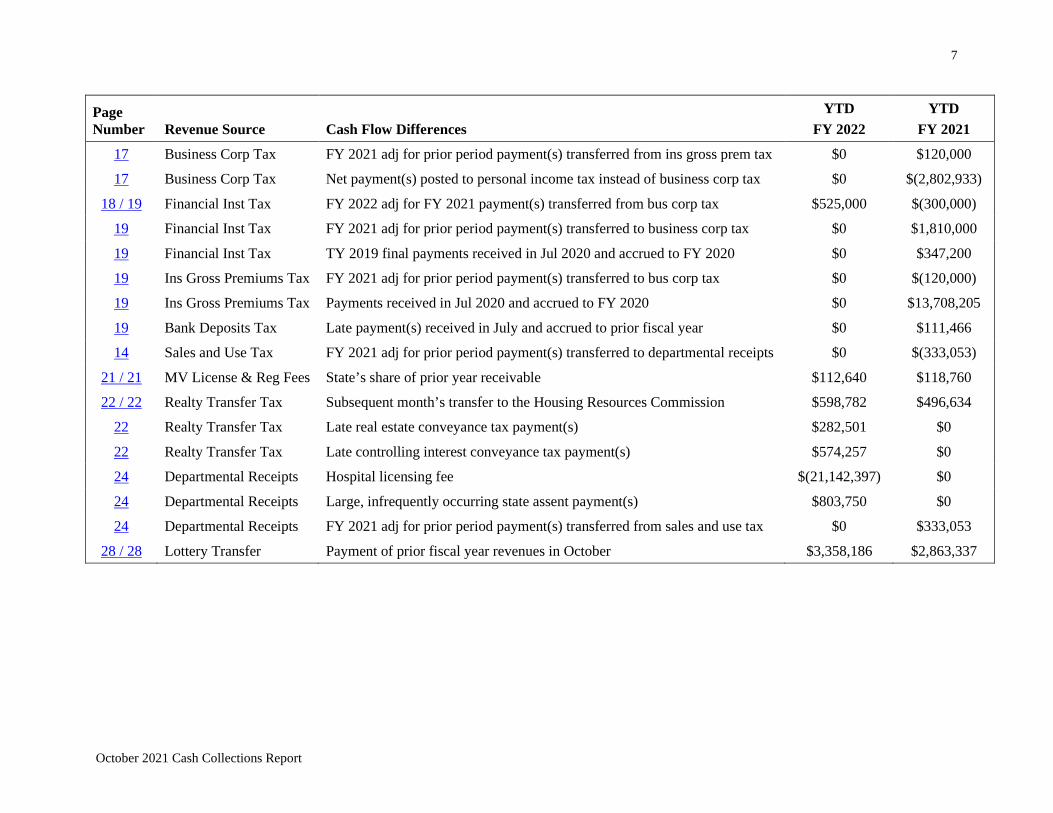
17 Business Corp Tax FY 2021 adj for prior period payment(s) transferred from ins gross prem tax $0 $120,000
17 Business Corp Tax Net payment(s) posted to personal income tax instead of business corp tax $0 $(2,802,933)
18 / 19 Financial Inst Tax FY 2022 adj for FY 2021 payment(s) transferred from bus corp tax $525,000 $(300,000)
19 Financial Inst Tax FY 2021 adj for prior period payment(s) transferred to business corp tax $0 $1,810,000
19 Financial Inst Tax TY 2019 final payments received in Jul 2020 and accrued to FY 2020 $0 $347,200
19 Ins Gross Premiums Tax FY 2021 adj for prior period payment(s) transferred to bus corp tax $0 $(120,000)
19 Ins Gross Premiums Tax Payments received in Jul 2020 and accrued to FY 2020 $0 $13,708,205
19 Bank Deposits Tax Late payment(s) received in July and accrued to prior fiscal year $0 $111,466
14 Sales and Use Tax FY 2021 adj for prior period payment(s) transferred to departmental receipts $0 $(333,053)
21 / 21 MV License & Reg Fees State’s share of prior year receivable $112,640 $118,760
22 / 22 Realty Transfer Tax Subsequent month’s transfer to the Housing Resources Commission $598,782 $496,634
22 Realty Transfer Tax Late real estate conveyance tax payment(s) $282,501 $0
22 Realty Transfer Tax Late controlling interest conveyance tax payment(s) $574,257 $0
24 Departmental Receipts Hospital licensing fee $(21,142,397) $0
24 Departmental Receipts Large, infrequently occurring state assent payment(s) $803,750 $0
24 Departmental Receipts FY 2021 adj for prior period payment(s) transferred from sales and use tax $0 $333,053
28 / 28 Lottery Transfer Payment of prior fiscal year revenues in October $3,358,186 $2,863,337
8
October 2021 Cash Collections Report
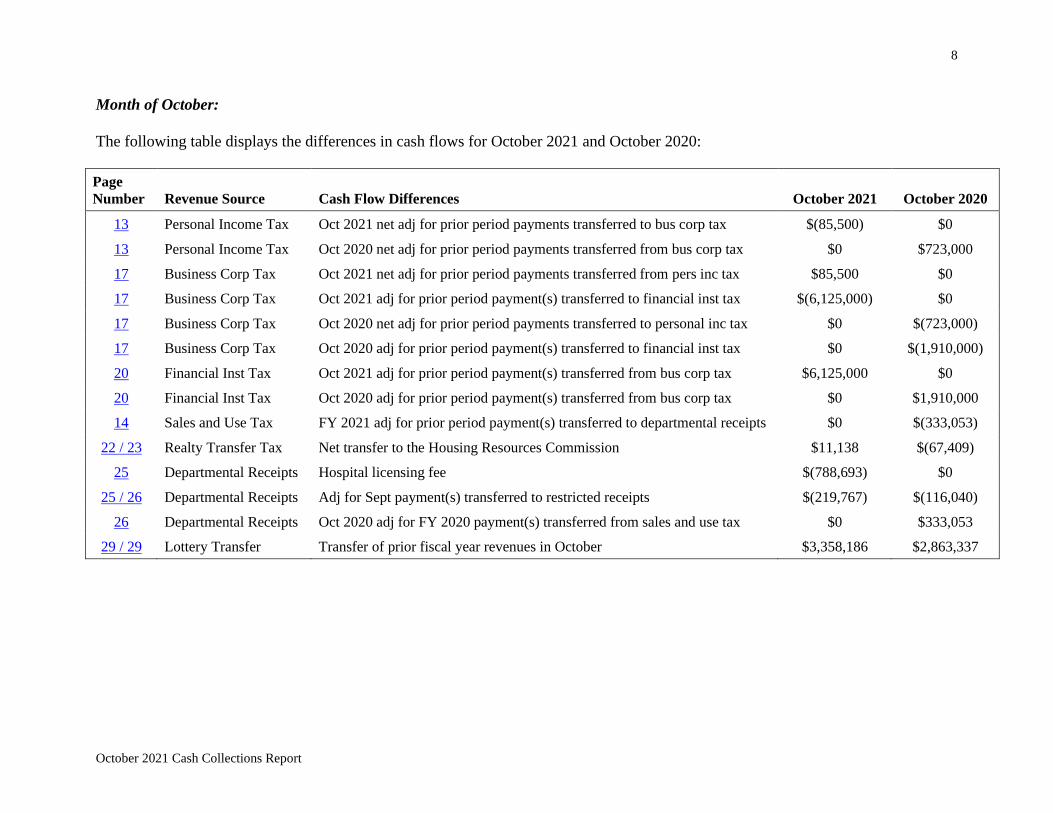
Month of October:
The following table displays the differences in cash flows for October 2021 and October 2020:
Page
Number Revenue Source Cash Flow Differences October 2021 October 2020
13 Personal Income Tax Oct 2021 net adj for prior period payments transferred to bus corp tax $(85,500) $0
13 Personal Income Tax Oct 2020 net adj for prior period payments transferred from bus corp tax $0 $723,000
17 Business Corp Tax Oct 2021 net adj for prior period payments transferred from pers inc tax $85,500 $0
17 Business Corp Tax Oct 2021 adj for prior period payment(s) transferred to financial inst tax $(6,125,000) $0
17 Business Corp Tax Oct 2020 net adj for prior period payments transferred to personal inc tax $0 $(723,000)
17 Business Corp Tax Oct 2020 adj for prior period payment(s) transferred to financial inst tax $0 $(1,910,000)
20 Financial Inst Tax Oct 2021 adj for prior period payment(s) transferred from bus corp tax $6,125,000 $0
20 Financial Inst Tax Oct 2020 adj for prior period payment(s) transferred from bus corp tax $0 $1,910,000
14 Sales and Use Tax FY 2021 adj for prior period payment(s) transferred to departmental receipts $0 $(333,053)
22 / 23 Realty Transfer Tax Net transfer to the Housing Resources Commission $11,138 $(67,409)
25 Departmental Receipts Hospital licensing fee $(788,693) $0
25 / 26 Departmental Receipts Adj for Sept payment(s) transferred to restricted receipts $(219,767) $(116,040)
26 Departmental Receipts Oct 2020 adj for FY 2020 payment(s) transferred from sales and use tax $0 $333,053
29 / 29 Lottery Transfer Transfer of prior fiscal year revenues in October $3,358,186 $2,863,337
9
October 2021 Cash Collections Report
Impact on General Revenue Cash Collections from the COVID-19 Pandemic
Due to the COVID-19 pandemic, on March 20, 2020, the Division of Taxation, in conjunction
with announcements made by the United States Treasury and Governor Gina M. Raimondo,
postponed the return filing and final and estimated payment due date from April 15, 2020 and June
15, 2020 to July 15, 2020 for personal income tax and certain business taxes. For the affected tax
types, the change in the filing date provided taxpayers three additional months to file TY 2019
returns and pay balances due, with no penalties or interest accrued on these balances if paid on or
before July 15, 2020. At this time, the Department of Revenue has information on the amount of
cash receipts that were received in July 2020 due to this extension. These figures are included in
the cash flow differences table by payment and tax type.
COVID-19 Pandemic Control Measures That Impacted Sales and Use Tax and the Lottery
Transfer in FY 2021 through October
• June 1, 2020: Indoor dining was allowed at 50% of capacity.
• June 30, 2020: Phase 3 of Reopening RI was put in place by Governor Raimondo. Indoor
dining was increased to 66% of capacity and larger crowd sizes were permitted at indoor
and outdoor venues.
• July 2020: Major League Soccer (MLS), Major League Baseball (MLB), and the National
Basketball Association (NBA) started either a shortened season or a championship
tournament.
• July 29, 2020: The number of people who could attend catered events was reduced to 50
for indoor events and 100 for outdoor events, and the size of informal gatherings was
capped at 15 people.
• August 1, 2020: The National Hockey League (NHL) resumed play in a playoff tournament
format.
• August 8, 2020: Bars, including those inside of restaurants, were required to close by 11:00
PM.
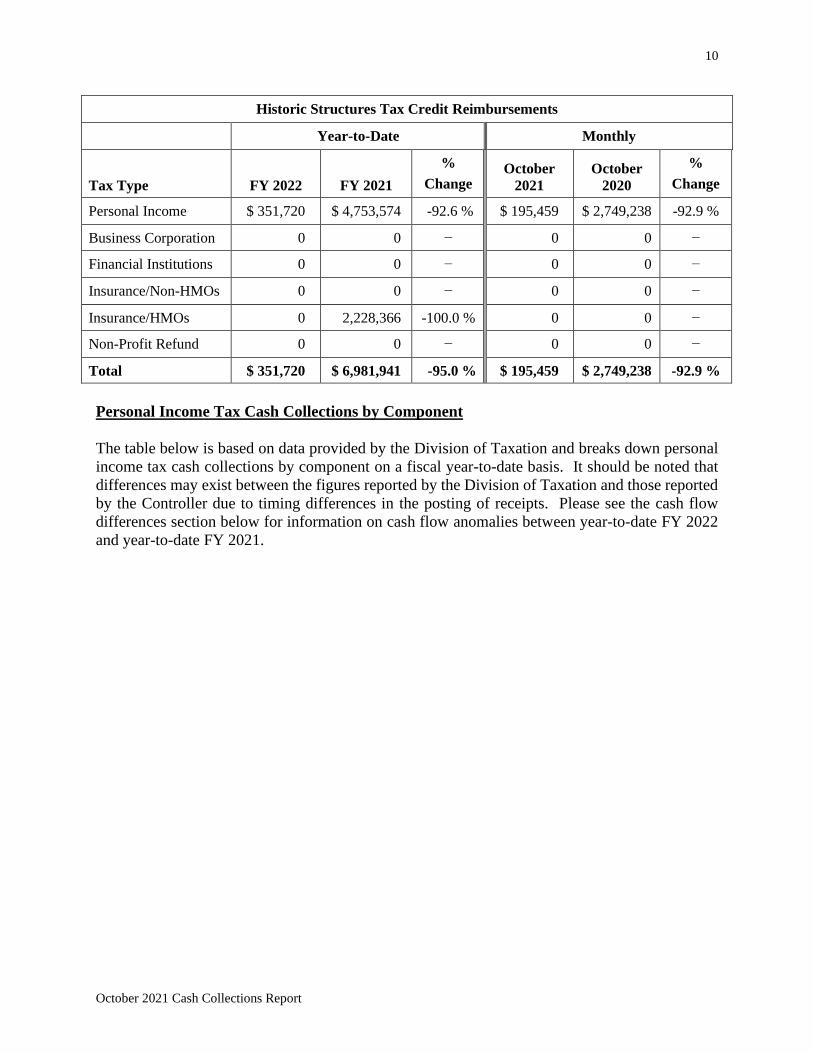
Historic Structures Tax Credit Reimbursements:
The breakdown of the reimbursement of redeemed Historic Structures Tax Credits (HSTCs) by tax
type is shown in the table below:
10
October 2021 Cash Collections Report
Historic Structures Tax Credit Reimbursements
Year-to-Date Monthly
Tax Type FY 2022 FY 2021
%
Change October
2021
October
2020
%
Change
Personal Income $ 351,720 $ 4,753,574 -92.6 % $ 195,459 $ 2,749,238 -92.9 %
Business Corporation 0 0 − 0 0 −
Financial Institutions 0 0 − 0 0 −
Insurance/Non-HMOs 0 0 − 0 0 −
Insurance/HMOs 0 2,228,366 -100.0 % 0 0 −
Non-Profit Refund 0 0 − 0 0 −
Total $ 351,720 $ 6,981,941 -95.0 % $ 195,459 $ 2,749,238 -92.9 %
Personal Income Tax Cash Collections by Component
The table below is based on data provided by the Division of Taxation and breaks down personal
income tax cash collections by component on a fiscal year-to-date basis. It should be noted that
differences may exist between the figures reported by the Division of Taxation and those reported
by the Controller due to timing differences in the posting of receipts. Please see the cash flow
differences section below for information on cash flow anomalies between year-to-date FY 2022
and year-to-date FY 2021.
11
October 2021 Cash Collections Report
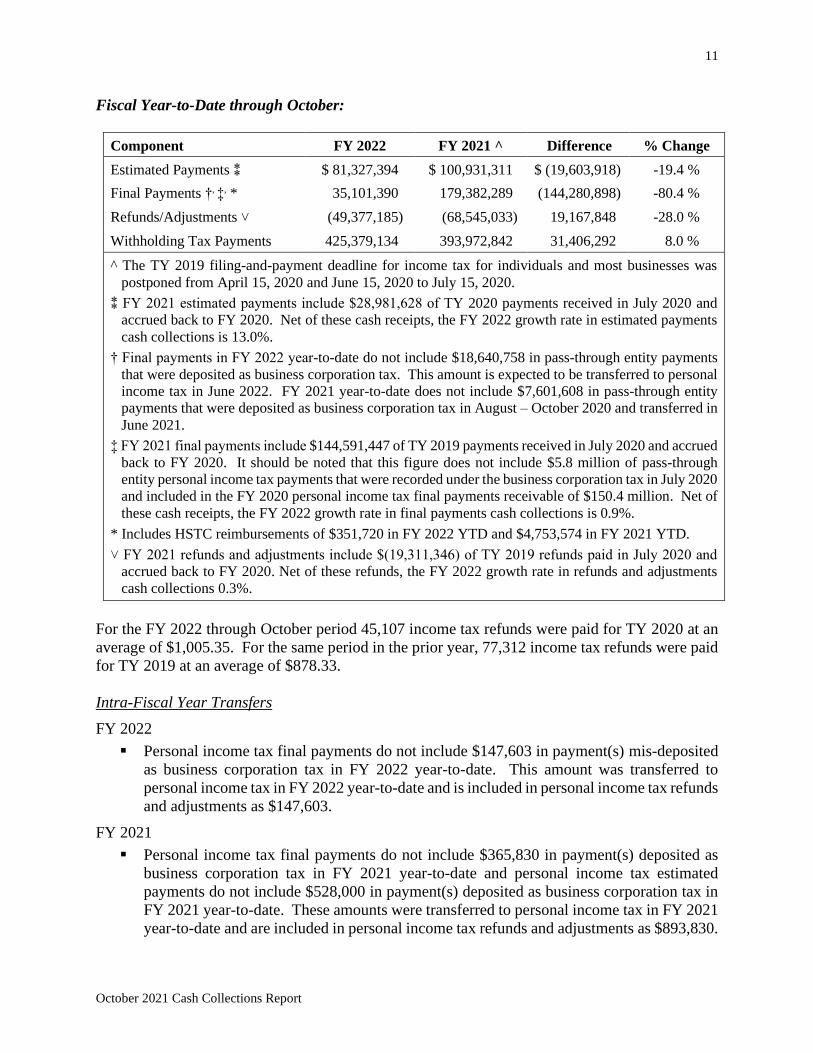
Fiscal Year-to-Date through October:
Component FY 2022 FY 2021 ^ Difference % Change
Estimated Payments ⁑ $ 81,327,394 $ 100,931,311 $ (19,603,918) -19.4 %
Final Payments †, ‡, * 35,101,390 179,382,289 (144,280,898) -80.4 %
Refunds/Adjustments ˅ (49,377,185) (68,545,033) 19,167,848 -28.0 %
Withholding Tax Payments 425,379,134 393,972,842 31,406,292 8.0 %
^ The TY 2019 filing-and-payment deadline for income tax for individuals and most businesses was
postponed from April 15, 2020 and June 15, 2020 to July 15, 2020.
⁑ FY 2021 estimated payments include $28,981,628 of TY 2020 payments received in July 2020 and
accrued back to FY 2020. Net of these cash receipts, the FY 2022 growth rate in estimated payments
cash collections is 13.0%.
† Final payments in FY 2022 year-to-date do not include $18,640,758 in pass-through entity payments
that were deposited as business corporation tax. This amount is expected to be transferred to personal
income tax in June 2022. FY 2021 year-to-date does not include $7,601,608 in pass-through entity
payments that were deposited as business corporation tax in August – October 2020 and transferred in
June 2021.
‡ FY 2021 final payments include $144,591,447 of TY 2019 payments received in July 2020 and accrued
back to FY 2020. It should be noted that this figure does not include $5.8 million of pass-through
entity personal income tax payments that were recorded under the business corporation tax in July 2020
and included in the FY 2020 personal income tax final payments receivable of $150.4 million. Net of
these cash receipts, the FY 2022 growth rate in final payments cash collections is 0.9%.
* Includes HSTC reimbursements of $351,720 in FY 2022 YTD and $4,753,574 in FY 2021 YTD.
˅ FY 2021 refunds and adjustments include $(19,311,346) of TY 2019 refunds paid in July 2020 and
accrued back to FY 2020. Net of these refunds, the FY 2022 growth rate in refunds and adjustments
cash collections 0.3%.
For the FY 2022 through October period 45,107 income tax refunds were paid for TY 2020 at an
average of $1,005.35. For the same period in the prior year, 77,312 income tax refunds were paid
for TY 2019 at an average of $878.33.
Intra-Fiscal Year Transfers
FY 2022
▪ Personal income tax final payments do not include $147,603 in payment(s) mis-deposited
as business corporation tax in FY 2022 year-to-date. This amount was transferred to
personal income tax in FY 2022 year-to-date and is included in personal income tax refunds
and adjustments as $147,603.
FY 2021
▪ Personal income tax final payments do not include $365,830 in payment(s) deposited as
business corporation tax in FY 2021 year-to-date and personal income tax estimated
payments do not include $528,000 in payment(s) deposited as business corporation tax in
FY 2021 year-to-date. These amounts were transferred to personal income tax in FY 2021
year-to-date and are included in personal income tax refunds and adjustments as $893,830.
12
October 2021 Cash Collections Report
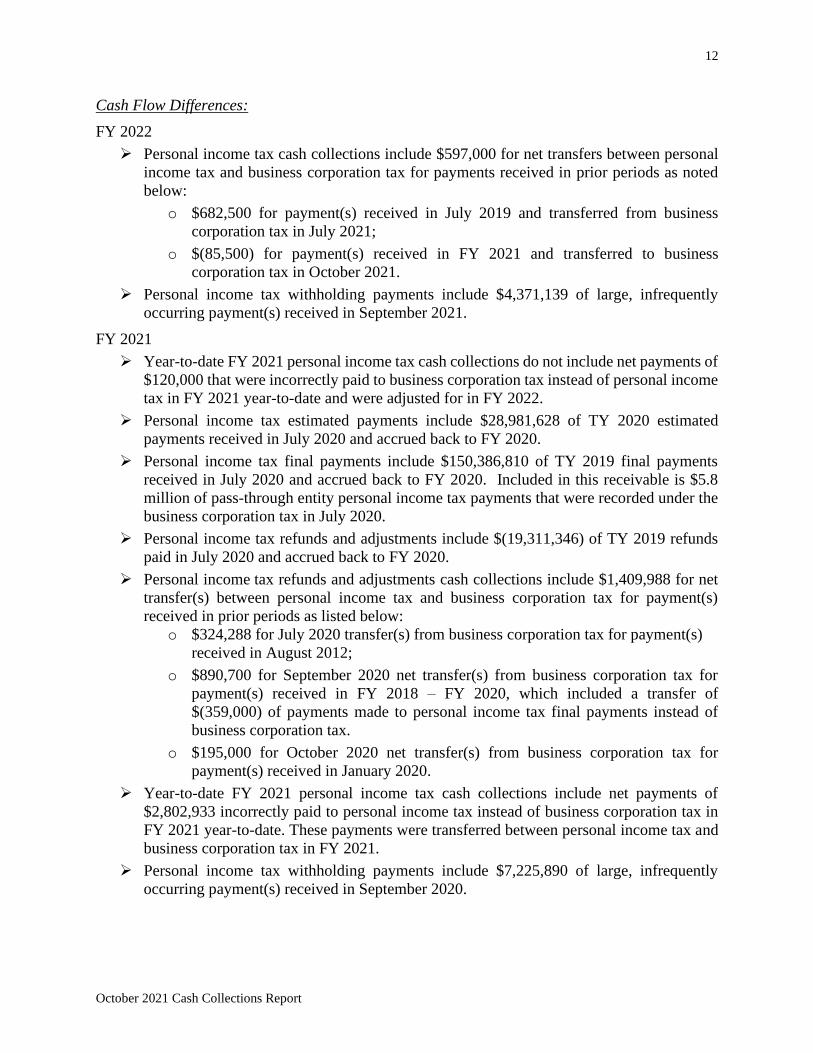
Cash Flow Differences:
FY 2022
➢ Personal income tax cash collections include $597,000 for net transfers between personal
income tax and business corporation tax for payments received in prior periods as noted
below:
o $682,500 for payment(s) received in July 2019 and transferred from business
corporation tax in July 2021;
o $(85,500) for payment(s) received in FY 2021 and transferred to business
corporation tax in October 2021.
➢ Personal income tax withholding payments include $4,371,139 of large, infrequently
occurring payment(s) received in September 2021.
FY 2021
➢ Year-to-date FY 2021 personal income tax cash collections do not include net payments of
$120,000 that were incorrectly paid to business corporation tax instead of personal income
tax in FY 2021 year-to-date and were adjusted for in FY 2022.
➢ Personal income tax estimated payments include $28,981,628 of TY 2020 estimated
payments received in July 2020 and accrued back to FY 2020.
➢ Personal income tax final payments include $150,386,810 of TY 2019 final payments
received in July 2020 and accrued back to FY 2020. Included in this receivable is $5.8
million of pass-through entity personal income tax payments that were recorded under the
business corporation tax in July 2020.
➢ Personal income tax refunds and adjustments include $(19,311,346) of TY 2019 refunds
paid in July 2020 and accrued back to FY 2020.
➢ Personal income tax refunds and adjustments cash collections include $1,409,988 for net
transfer(s) between personal income tax and business corporation tax for payment(s)
received in prior periods as listed below:
o $324,288 for July 2020 transfer(s) from business corporation tax for payment(s)
received in August 2012;
o $890,700 for September 2020 net transfer(s) from business corporation tax for
payment(s) received in FY 2018 – FY 2020, which included a transfer of
$(359,000) of payments made to personal income tax final payments instead of
business corporation tax.
o $195,000 for October 2020 net transfer(s) from business corporation tax for
payment(s) received in January 2020.
➢ Year-to-date FY 2021 personal income tax cash collections include net payments of
$2,802,933 incorrectly paid to personal income tax instead of business corporation tax in
FY 2021 year-to-date. These payments were transferred between personal income tax and
business corporation tax in FY 2021.
➢ Personal income tax withholding payments include $7,225,890 of large, infrequently
occurring payment(s) received in September 2020.
13
October 2021 Cash Collections Report
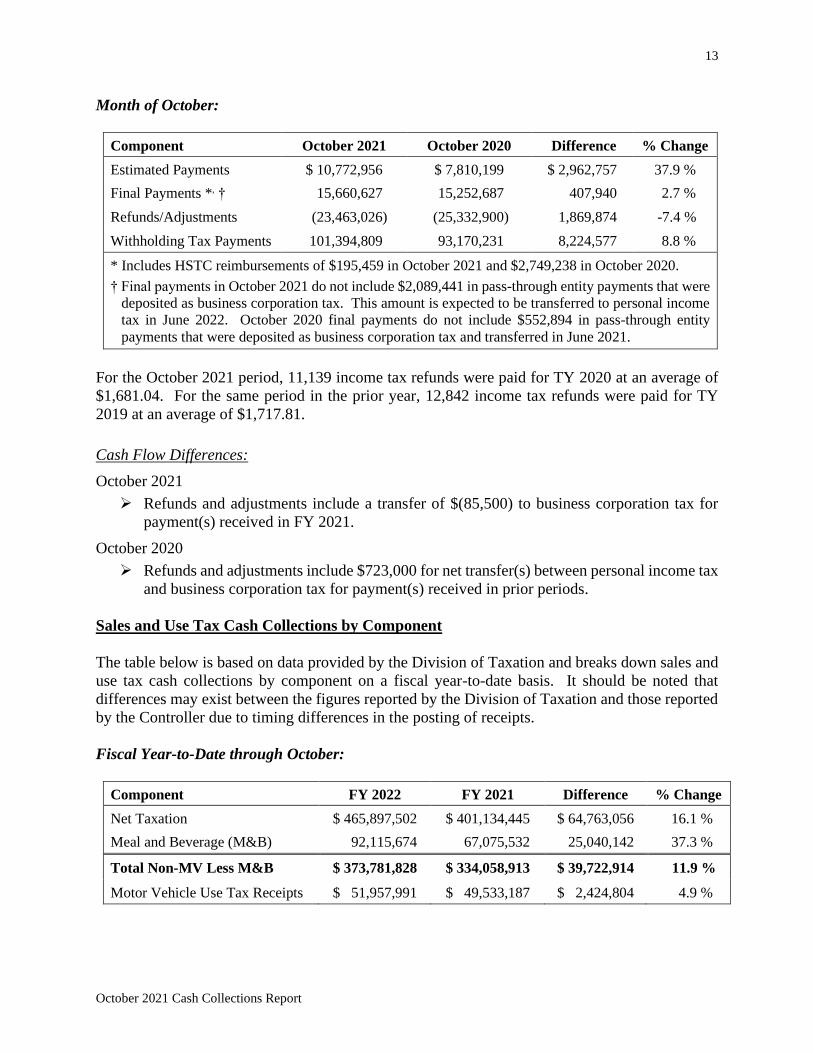
Month of October:
Component October 2021 October 2020 Difference % Change
Estimated Payments $ 10,772,956 $ 7,810,199 $ 2,962,757 37.9 %
Final Payments *, † 15,660,627 15,252,687 407,940 2.7 %
Refunds/Adjustments (23,463,026) (25,332,900) 1,869,874 -7.4 %
Withholding Tax Payments 101,394,809 93,170,231 8,224,577 8.8 %
* Includes HSTC reimbursements of $195,459 in October 2021 and $2,749,238 in October 2020.
† Final payments in October 2021 do not include $2,089,441 in pass-through entity payments that were
deposited as business corporation tax. This amount is expected to be transferred to personal income
tax in June 2022. October 2020 final payments do not include $552,894 in pass-through entity
payments that were deposited as business corporation tax and transferred in June 2021.
For the October 2021 period, 11,139 income tax refunds were paid for TY 2020 at an average of
$1,681.04. For the same period in the prior year, 12,842 income tax refunds were paid for TY
2019 at an average of $1,717.81.
Cash Flow Differences:
October 2021
➢ Refunds and adjustments include a transfer of $(85,500) to business corporation tax for
payment(s) received in FY 2021.
October 2020
➢ Refunds and adjustments include $723,000 for net transfer(s) between personal income tax
and business corporation tax for payment(s) received in prior periods.
Sales and Use Tax Cash Collections by Component
The table below is based on data provided by the Division of Taxation and breaks down sales and
use tax cash collections by component on a fiscal year-to-date basis. It should be noted that
differences may exist between the figures reported by the Division of Taxation and those reported
by the Controller due to timing differences in the posting of receipts.
Fiscal Year-to-Date through October:
Component FY 2022 FY 2021 Difference % Change
Net Taxation $ 465,897,502 $ 401,134,445 $ 64,763,056 16.1 %
Meal and Beverage (M&B) 92,115,674 67,075,532 25,040,142 37.3 %
Total Non-MV Less M&B $ 373,781,828 $ 334,058,913 $ 39,722,914 11.9 %
Motor Vehicle Use Tax Receipts $ 51,957,991 $ 49,533,187 $ 2,424,804 4.9 %

14
October 2021 Cash Collections Report
Cash Flow Differences:
FY 2021
➢ FY 2021 sales and use tax cash collections include a transfer of $(333,053) to the
compassion center surcharge in departmental receipts licenses and fees for payments
received in FY 2020.
Month of October:
Component October 2021 October 2020 Difference % Change
Net Taxation $ 116,330,738 $ 98,443,054 $ 17,887,684 18.2 %
Meals and Beverage (M&B) 21,665,399 16,650,273 5,015,126 30.1 %
Total Non-MV Less M&B $ 94,665,339 $ 81,792,781 $ 12,872,558 15.7 %
Motor Vehicle Use Tax Receipts $ 13,007,480 $ 12,912,043 $ 95,436 0.7 %
Cash Flow Differences:
October 2020
➢ October sales and use tax cash collections include a transfer of $(333,053) to the
compassion center surcharge in departmental receipts licenses and fees for payment(s)
received in FY 2020.
Business Corporation Tax Cash Collections by Component:
Businesses with Rhode Island tax liabilities make estimated payments equal to 25% of their
expected tax year liabilities by the 15th day of the fourth, sixth, ninth, and twelfth months of their
tax year. For calendar tax year corporations, this equates to April, June, September, and December.
The table below is based on data provided by the Division of Taxation and breaks down business
corporation tax cash collections by component on a fiscal year-to-date basis. It should be noted
that differences may exist between the figures reported by the Division of Taxation and those
reported by the Controller due to timing differences in the posting of receipts. Please see the cash
flow differences section below for information on cash flow anomalies between year-to-date FY
2022 and year-to-date FY 2021.
15
October 2021 Cash Collections Report
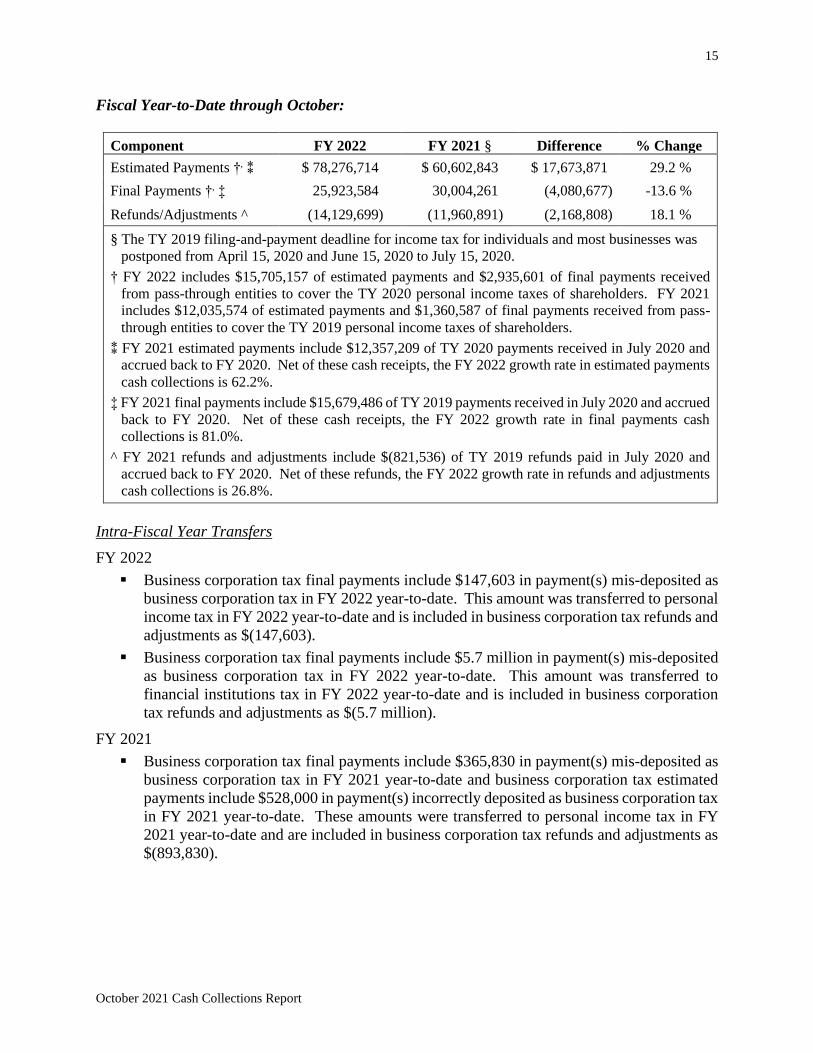
Fiscal Year-to-Date through October:
Component FY 2022 FY 2021 § Difference % Change
Estimated Payments †, ⁑ $ 78,276,714 $ 60,602,843 $ 17,673,871 29.2 %
Final Payments †, ‡ 25,923,584 30,004,261 (4,080,677) -13.6 %
Refunds/Adjustments ^ (14,129,699) (11,960,891) (2,168,808) 18.1 %
§ The TY 2019 filing-and-payment deadline for income tax for individuals and most businesses was
postponed from April 15, 2020 and June 15, 2020 to July 15, 2020.
† FY 2022 includes $15,705,157 of estimated payments and $2,935,601 of final payments received
from pass-through entities to cover the TY 2020 personal income taxes of shareholders. FY 2021
includes $12,035,574 of estimated payments and $1,360,587 of final payments received from pass-
through entities to cover the TY 2019 personal income taxes of shareholders.
⁑ FY 2021 estimated payments include $12,357,209 of TY 2020 payments received in July 2020 and
accrued back to FY 2020. Net of these cash receipts, the FY 2022 growth rate in estimated payments
cash collections is 62.2%.
‡ FY 2021 final payments include $15,679,486 of TY 2019 payments received in July 2020 and accrued
back to FY 2020. Net of these cash receipts, the FY 2022 growth rate in final payments cash
collections is 81.0%.
^ FY 2021 refunds and adjustments include $(821,536) of TY 2019 refunds paid in July 2020 and
accrued back to FY 2020. Net of these refunds, the FY 2022 growth rate in refunds and adjustments
cash collections is 26.8%.
Intra-Fiscal Year Transfers
FY 2022
▪ Business corporation tax final payments include $147,603 in payment(s) mis-deposited as
business corporation tax in FY 2022 year-to-date. This amount was transferred to personal
income tax in FY 2022 year-to-date and is included in business corporation tax refunds and
adjustments as $(147,603).
▪ Business corporation tax final payments include $5.7 million in payment(s) mis-deposited
as business corporation tax in FY 2022 year-to-date. This amount was transferred to
financial institutions tax in FY 2022 year-to-date and is included in business corporation
tax refunds and adjustments as $(5.7 million).
FY 2021
▪ Business corporation tax final payments include $365,830 in payment(s) mis-deposited as
business corporation tax in FY 2021 year-to-date and business corporation tax estimated
payments include $528,000 in payment(s) incorrectly deposited as business corporation tax
in FY 2021 year-to-date. These amounts were transferred to personal income tax in FY
2021 year-to-date and are included in business corporation tax refunds and adjustments as
$(893,830).
16
October 2021 Cash Collections Report
Cash Flow Differences:
FY 2022
➢ Business corporation tax cash collections include $(597,000) for net transfers between
business corporation tax and personal income tax for payments received in prior periods as
listed below:
o $(682,500) for transfer(s) in July 2021 to personal income tax for payment(s)
received in July 2019;
o $85,500 for payment(s) received in FY 2021 and transferred in October 2021 from
personal income tax.
➢ Business corporation tax cash collections include a net transfer of $(525,000) between
business corporation tax and financial institutions tax for payment(s) received in prior
periods as noted below:
o $100,000 for transfer(s) in July 2021 to financial institutions tax for payment(s)
received June 2021;
o $425,000 for transfer(s) in October 2021 to financial institutions tax for payment(s)
received in September and December 2020.
FY 2021
➢ Business corporation tax estimated payments include $12,351,209 of TY 2020 estimated
payments received in July 2020 and accrued back to FY 2020.
➢ Business corporation tax final payments include $15,679,486 of TY 2019 final payments
received in July 2020 and accrued back to FY 2020.
➢ Business corporation tax refunds and adjustments include $(821,536) of TY 2019 refunds
paid in July 2020 and accrued back to FY 2020.
➢ Refunds and adjustments include $(1,409,988) for net transfer(s) between personal income
tax and business corporation tax for payment(s) received in prior periods as listed below:
o $(324,288) for July 2020 transfer(s) to personal income tax for payment(s) received
in August 2012;
o $(890,700) for September 2020 net transfer(s) to personal income tax for
payment(s) received in FY 2018 – FY 2020;
o $(195,000) for October 2020 net transfer(s) to personal income tax for payment(s)
received in January 2020.
➢ Refunds and adjustments include net transfers of $(1.8 million) between business
corporation tax and financial institution tax for payments received in prior periods as listed
below:
o $100,000 for July 2020 transfer(s) from financial institution tax for payment(s)
received in March 2018;
o $(1,910,000) for October 2020 transfers to financial institution tax for payments
received in FY 2019 – FY 2020.
➢ Year-to-date FY 2021 business corporation tax cash collections include net payments of
$300,000 incorrectly paid to business corporation tax instead of financial institutions tax
in September 2020 that were adjusted for in FY 2022 year-to-date.
17
October 2021 Cash Collections Report
➢ Business corporation tax refunds and adjustments include net payments of $120,000 that
were incorrectly paid to business corporation tax instead of personal income tax in FY 2021
year-to-date. These payments were transferred between personal income tax and business
corporation tax in FY 2022.
➢ Refunds and adjustments include a transfer of $120,000 from insurance company gross
premiums tax for payment(s) received in December 2018.
➢ Year-to-date FY 2021 business corporation tax cash collections do not include net
payments of $2,802,933 incorrectly paid to personal income tax instead of business
corporation tax in FY 2021 year-to-date. These payments were transferred between
personal income tax and business corporation tax in FY 2021.
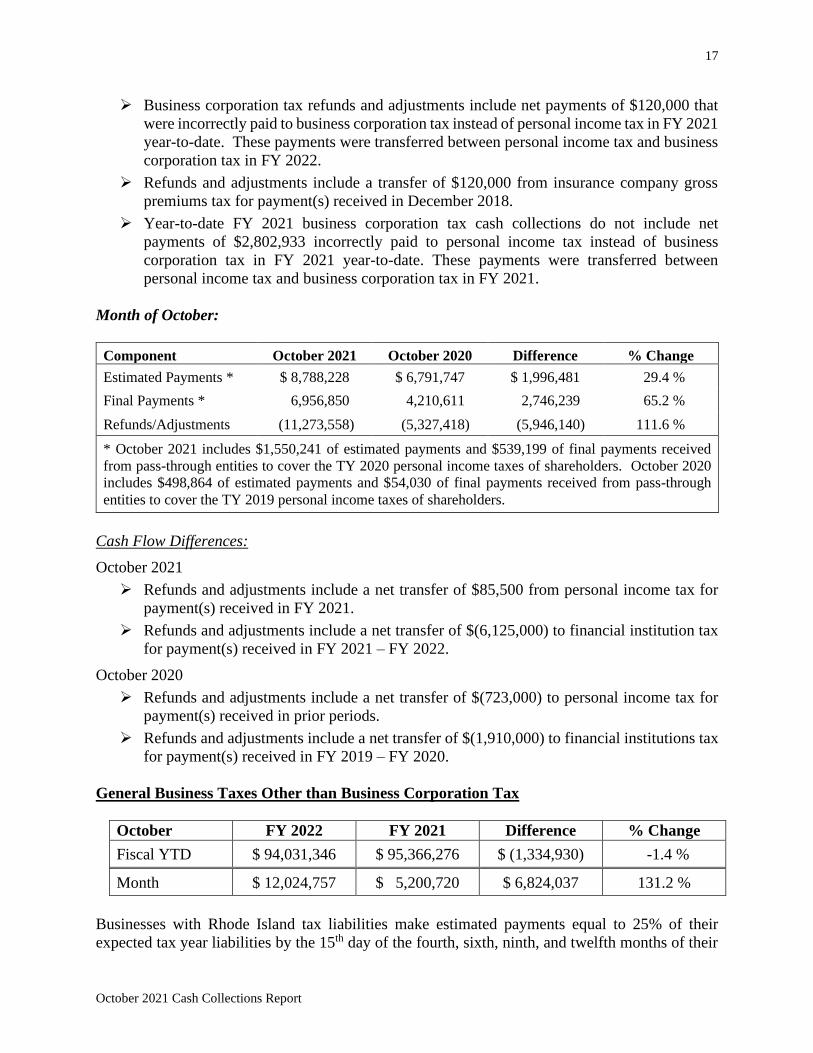
Month of October:
Component October 2021 October 2020 Difference % Change
Estimated Payments * $ 8,788,228 $ 6,791,747 $ 1,996,481 29.4 %
Final Payments * 6,956,850 4,210,611 2,746,239 65.2 %
Refunds/Adjustments (11,273,558) (5,327,418) (5,946,140) 111.6 %
* October 2021 includes $1,550,241 of estimated payments and $539,199 of final payments received
from pass-through entities to cover the TY 2020 personal income taxes of shareholders. October 2020
includes $498,864 of estimated payments and $54,030 of final payments received from pass-through
entities to cover the TY 2019 personal income taxes of shareholders.
Cash Flow Differences:
October 2021
➢ Refunds and adjustments include a net transfer of $85,500 from personal income tax for
payment(s) received in FY 2021.
➢ Refunds and adjustments include a net transfer of $(6,125,000) to financial institution tax
for payment(s) received in FY 2021 – FY 2022.
October 2020
➢ Refunds and adjustments include a net transfer of $(723,000) to personal income tax for
payment(s) received in prior periods.
➢ Refunds and adjustments include a net transfer of $(1,910,000) to financial institutions tax
for payment(s) received in FY 2019 – FY 2020.
General Business Taxes Other than Business Corporation Tax
October FY 2022 FY 2021 Difference % Change
Fiscal YTD $ 94,031,346 $ 95,366,276 $ (1,334,930) -1.4 %
Month $ 12,024,757 $ 5,200,720 $ 6,824,037 131.2 %
Businesses with Rhode Island tax liabilities make estimated payments equal to 25% of their
expected tax year liabilities by the 15th day of the fourth, sixth, ninth, and twelfth months of their
18
October 2021 Cash Collections Report
tax year. For calendar tax year corporations, this equates to April, June, September, and December.
There is one exception to this payment pattern, namely the health care provider assessment,
payments of which are made monthly. As a result, health care provider assessments flow more
evenly into the general fund over the course of a fiscal year. Please see the cash flow differences
section below for information on cash flow anomalies between year-to-date FY 2022 and year-to-
date FY 2021. For all general business taxes other than the health care provider assessment, the
tax return filing and final and estimated payment due date was delayed from April 15, 2020 to July
15, 2020.
Fiscal Year-to-Date through October:
General business taxes other than business corporation tax collected through October of FY 2022
decreased by 1.4% from general business taxes other than business corporation tax collected
through October of FY 2021. FY 2022 general business taxes other than business corporation tax
collected through October were $94.0 million compared to $95.4 million collected for the same
period in FY 2021, a decrease of $1.3 million. FY 2021 general business taxes other than business
corporation tax included $14.1 million of TY 2019 cash payments. Net of these cash receipts, the
FY 2022 growth rate in general business taxes other than business corporation tax cash collections
is 15.6%.
Public utilities gross earnings tax cash collections of $22.6 million were $1.3 million, or 5.6%, less
than the $23.9 million collected in FY 2021 through October. Financial institutions tax cash
collections of $18.8 million in year-to-date FY 2022 were up $12.2 million, or 185.2%, compared
to the $6.6 million collected in year-to-date FY 2021. Insurance company gross premiums tax cash
collections of $39.0 million were $10.9 million less than the $49.9 million received on a year-to-
date basis in FY 2021, a difference of -21.8%. Included in FY 2021 year-to-date insurance
company gross premiums tax cash collections is $2.2 million in reimbursed HSTCs. Bank deposits
tax cash collections of $1.1 million in year-to-date FY 2022 were up $189,770 compared to
$940,833 collected in year-to-date FY 2021.
FY 2022 year-to-date through October health care provider assessment cash collections of $12.4
million were down $1.5 million, or 11.0%, from the $14.0 million received on a year-to-date basis
in FY 2021.
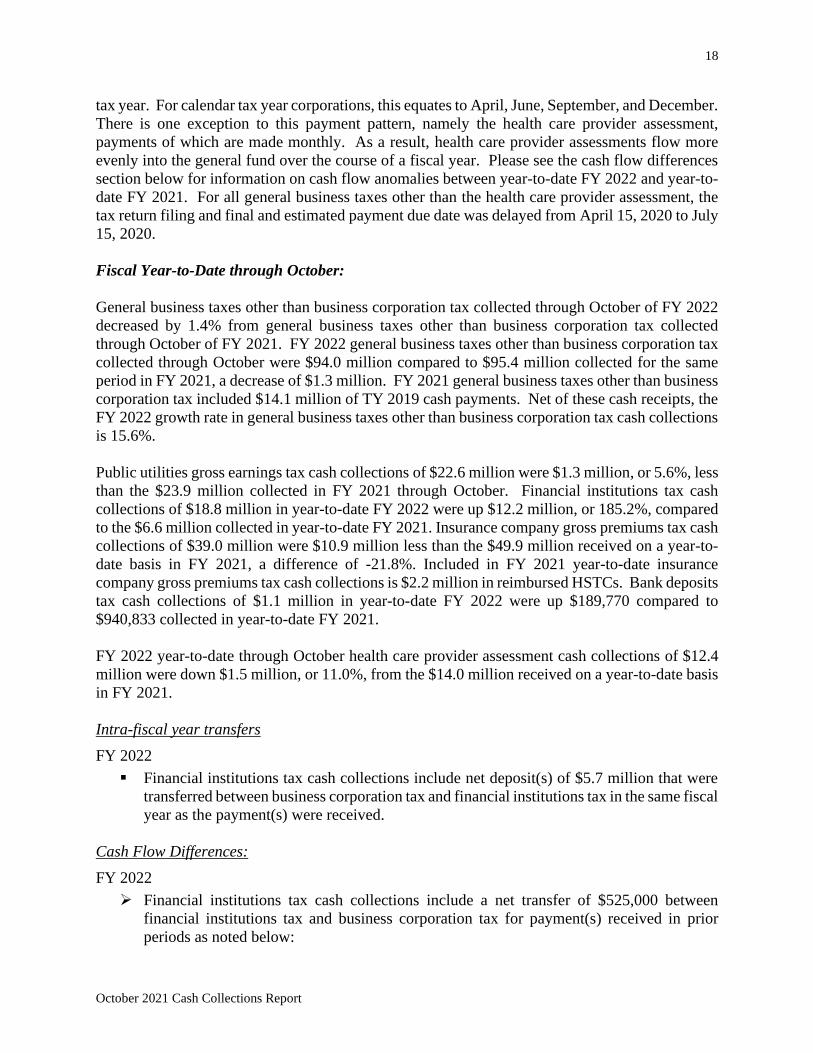
Intra-fiscal year transfers
FY 2022
▪ Financial institutions tax cash collections include net deposit(s) of $5.7 million that were
transferred between business corporation tax and financial institutions tax in the same fiscal
year as the payment(s) were received.
Cash Flow Differences:
FY 2022
➢ Financial institutions tax cash collections include a net transfer of $525,000 between
financial institutions tax and business corporation tax for payment(s) received in prior
periods as noted below:

19
October 2021 Cash Collections Report
o $100,000 for July 2021 transfer(s) from business corporation tax for payment(s)
received in June 2021;
o $425,000 for October 2021 transfer(s) from business corporation tax for payment(s)
received in September and December 2020.
FY 2021
➢ Financial institutions tax cash collections include net transfers of $1.8 million between
business corporation tax and financial institutions tax for payments received in prior
periods as listed below:
o $100,000 for July 2020 transfer(s) to business corporation tax for payment(s)
received in March 2018;
o $1,910,000 for October 2020 transfers from business corporation tax for payments
received in FY 2019 – FY 2020.
➢ Financial institutions tax cash collections include $347,200 of TY 2019 final payments
received in July 2020 and accrued back to FY 2020. Net of these cash receipts, the FY
2022 growth rate in financial institutions tax cash collections is 201.1%.
➢ Year-to-date FY 2021 financial institutions tax cash collections does not include net
payment(s) of $300,000 incorrectly paid to business corporation tax instead of financial
institutions tax in September 2020 that were adjusted for in FY 2022 year-to-date.
➢ Insurance gross premiums tax cash collections include a transfer of $(120,000) to business
corporation tax for payment(s) received in December 2018.
➢ Insurance company gross premiums tax cash collections include $825,612 of TY 2019 final
payments and $12,882,593 of TY 2020 estimated payments received in July 2020 and
accrued back to FY 2020. Net of these payments, the FY 2022 growth rate in insurance
company gross premiums tax cash collections is 7.9 %.
➢ Bank deposits tax cash collections include $111,466 in late payment(s) received in July
2020 but accrued back to FY 2020.
Month of October:
General business taxes other than the business corporation tax collected in October 2021 increased
by 131.2% over general business taxes other than business corporation tax collected in October
2020. October 2021 general business taxes other than business corporation tax collected were
$12.0 million compared to $5.2 million collected for the same period in FY 2020, an increase of
$6.8 million.
Public utilities gross earnings tax cash collections of $101,344 were $1.2 million more than the
net $(1.1 million) collected in October 2020, a difference of -109.2%. Financial institutions tax
cash collections were $7.7 million in October 2021 compared to cash collections of $2.1 million
in October 2020. Insurance company gross premiums tax cash collections of $918,884 were
$75,788 more than the $843,096 received in October 2020, a difference of 9.0%. Bank deposits
tax cash collections were $67,002 in October 2021 compared to no cash collections in October
2020.
20
October 2021 Cash Collections Report
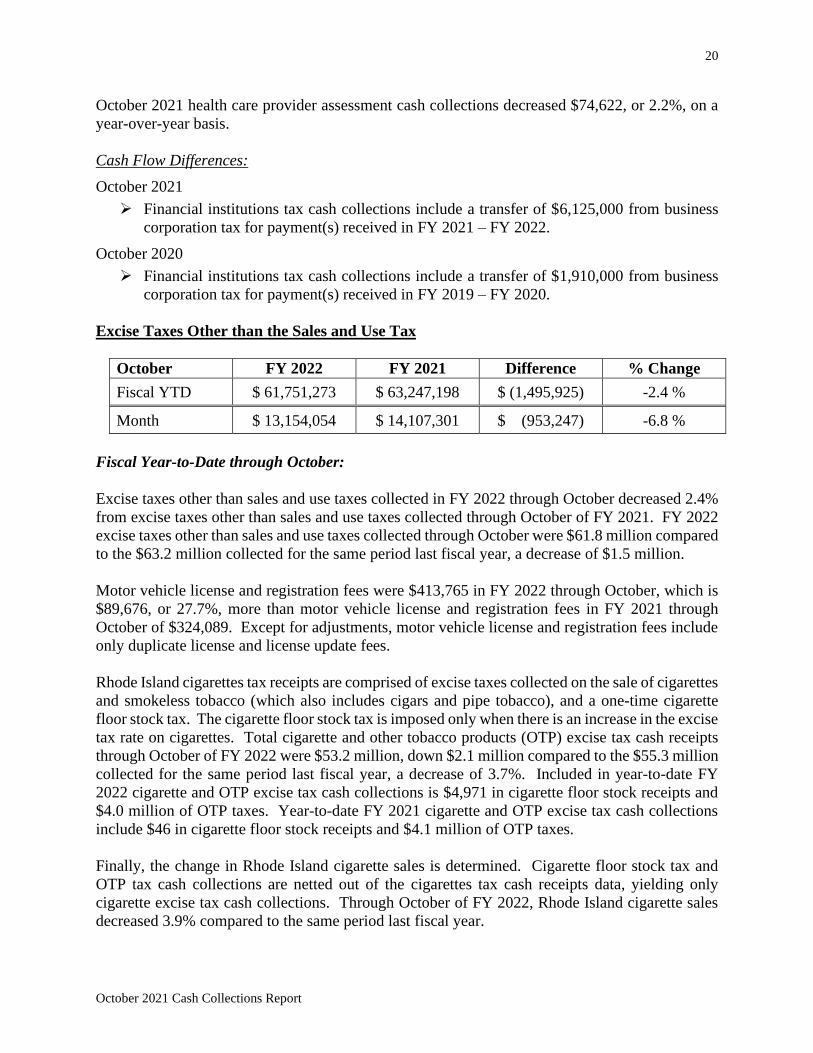
October 2021 health care provider assessment cash collections decreased $74,622, or 2.2%, on a
year-over-year basis.
Cash Flow Differences:
October 2021
➢ Financial institutions tax cash collections include a transfer of $6,125,000 from business
corporation tax for payment(s) received in FY 2021 – FY 2022.
October 2020
➢ Financial institutions tax cash collections include a transfer of $1,910,000 from business
corporation tax for payment(s) received in FY 2019 – FY 2020.
Excise Taxes Other than the Sales and Use Tax
October FY 2022 FY 2021 Difference % Change
Fiscal YTD $ 61,751,273 $ 63,247,198 $ (1,495,925) -2.4 %
Month $ 13,154,054 $ 14,107,301 $ (953,247) -6.8 %
Fiscal Year-to-Date through October:
Excise taxes other than sales and use taxes collected in FY 2022 through October decreased 2.4%
from excise taxes other than sales and use taxes collected through October of FY 2021. FY 2022
excise taxes other than sales and use taxes collected through October were $61.8 million compared
to the $63.2 million collected for the same period last fiscal year, a decrease of $1.5 million.
Motor vehicle license and registration fees were $413,765 in FY 2022 through October, which is
$89,676, or 27.7%, more than motor vehicle license and registration fees in FY 2021 through
October of $324,089. Except for adjustments, motor vehicle license and registration fees include
only duplicate license and license update fees.
Rhode Island cigarettes tax receipts are comprised of excise taxes collected on the sale of cigarettes
and smokeless tobacco (which also includes cigars and pipe tobacco), and a one-time cigarette
floor stock tax. The cigarette floor stock tax is imposed only when there is an increase in the excise
tax rate on cigarettes. Total cigarette and other tobacco products (OTP) excise tax cash receipts
through October of FY 2022 were $53.2 million, down $2.1 million compared to the $55.3 million
collected for the same period last fiscal year, a decrease of 3.7%. Included in year-to-date FY
2022 cigarette and OTP excise tax cash collections is $4,971 in cigarette floor stock receipts and
$4.0 million of OTP taxes. Year-to-date FY 2021 cigarette and OTP excise tax cash collections
include $46 in cigarette floor stock receipts and $4.1 million of OTP taxes.
Finally, the change in Rhode Island cigarette sales is determined. Cigarette floor stock tax and
OTP tax cash collections are netted out of the cigarettes tax cash receipts data, yielding only
cigarette excise tax cash collections. Through October of FY 2022, Rhode Island cigarette sales
decreased 3.9% compared to the same period last fiscal year.
21
October 2021 Cash Collections Report
Alcohol excise tax cash collections in FY 2022 through October increased $472,933, or 6.2%, over
collections in FY 2021 through October.
Cash Flow Differences:
FY 2022
➢ Motor vehicle license and registration fees include $112,640 from a June 2021 receivable.
FY 2021
➢ Motor vehicle license and registration fees include $118,760 from a June 2020 receivable.
Month of October:
Excise taxes other than sales and use taxes collected in October 2021 decreased 6.8% from excise
taxes other than sales and use taxes collected in October 2020. October 2021 excise taxes other
than sales and use taxes collected were $13.2 million compared to the $14.1 million collected for
the same period last fiscal year, a decrease of $953,247.
Motor vehicle license and registration fees were $90,875 in October 2021, which is $29,925, or
49.1%, more than motor vehicle license and registration fees of $60,950 in October 2020. Except
for adjustments, motor vehicle license and registration fees include only duplicate license and
license update fees.
Rhode Island cigarettes tax receipts are comprised of excise taxes collected on the sale of cigarettes
and smokeless tobacco (which also includes cigars and pipe tobacco), and a one-time cigarette
floor stock tax. The cigarette floor stock tax is imposed only when there is an increase in the excise
tax rate on cigarettes. Total cigarette and other tobacco products (OTP) excise tax cash receipts in
October 2021 were $10.8 million, down $1.1 million compared to the $11.9 million collected for
the same period last fiscal year, a decrease of 9.0%. Included in October 2021 cigarette and OTP
excise tax cash collections were $995,713 of OTP taxes. In October 2020, this amount was
$971,316
Finally, the change in Rhode Island cigarette sales is determined by netting out cigarette floor stock
tax and OTP tax cash collections from the cigarettes tax cash receipts data, yielding only cigarette
excise tax cash collections. In October 2021, Rhode Island cigarette sales decreased 10.0%
compared to the same period last fiscal year.
Alcohol excise tax cash collections in October 2021 increased $86,380, or 4.0%, compared to
collections in October 2020.
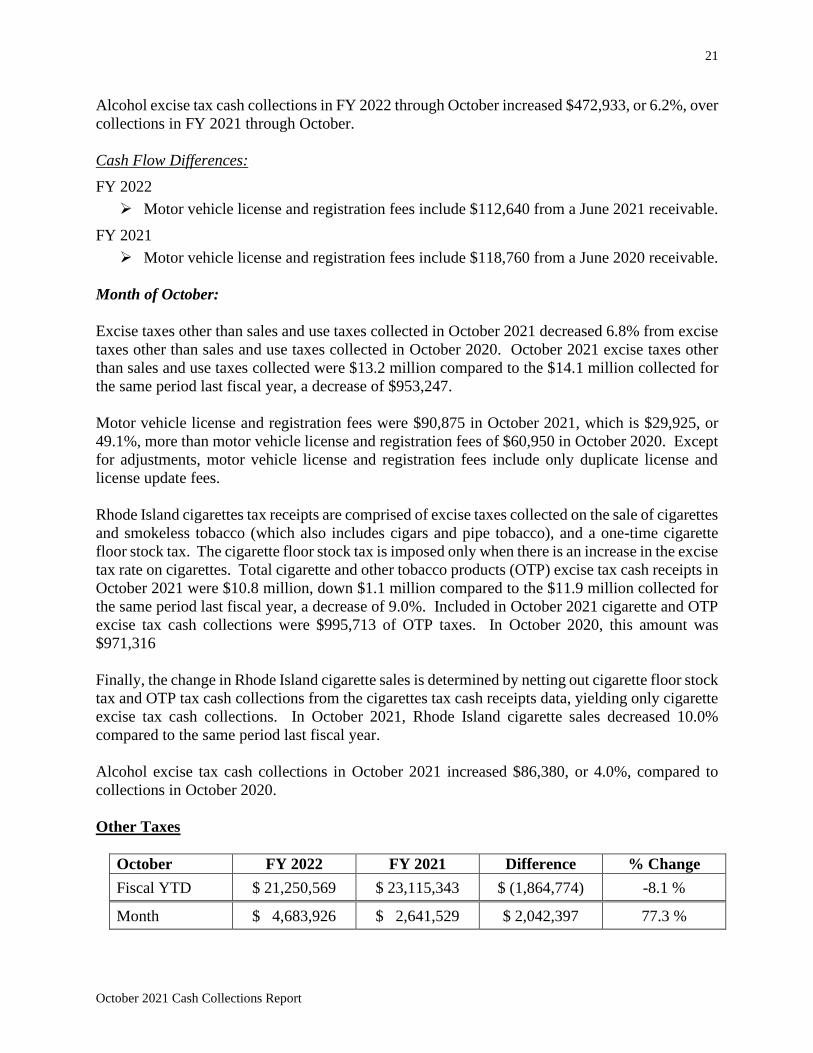
Other Taxes
October FY 2022 FY 2021 Difference % Change
Fiscal YTD $ 21,250,569 $ 23,115,343 $ (1,864,774) -8.1 %
Month $ 4,683,926 $ 2,641,529 $ 2,042,397 77.3 %
22
October 2021 Cash Collections Report
Fiscal Year-to-Date through October:
Other taxes collected in FY 2022 through October decreased 8.1% from other taxes collected
through October of FY 2021. FY 2022 other taxes collected through October were $21.3 million
compared to the $23.1 million collected in the same period last fiscal year, a decrease of $1.9
million. FY 2022 estate and transfer taxes collected through October were $12.9 million, down
$3.7 million compared to the same period in FY 2021, a variance of -22.2%. FY 2022 realty
transfer taxes collected through October were $8.2 million, up $1.7 million compared to the same
period last fiscal year.
Cash Flow Differences:
FY 2022
➢ Included in realty transfer tax cash collections is $598,782 of October 2021 real estate
conveyance taxes that will be transferred to the Housing Resources Commission (HRC) in
November 2021.
➢ Included in realty transfer tax cash collections is $282,501 in late real estate conveyance
tax payment(s) for real estate transactions that occurred in FY 2020 through FY 2021.
➢ Included in realty transfer tax cash collections is $574,257 for late controlling interest
realty transfer tax payment(s) received in August 2021 for transactions in FY 2021.
FY 2021
➢ Included in realty transfer tax cash collections is $496,634 of October 2020 real estate
conveyance taxes that were transferred to the Housing Resources Commission (HRC) in
November 2020.
Month of October:
Other taxes collected in October 2021 increased 77.3% over other taxes collected in October 2020.
October 2021 other taxes collected were $4.7 million compared to the $2.6 million collected in the
same period last fiscal year, an increase of $2.0 million. October 2021 estate and transfer tax cash
collections were $2.9 million, up $1.7 million compared to October 2020, an increase of 139.4%.
Realty transfer taxes collected in October 2021 were $1.8 million, up $375,415, or 26.5%,
compared to October 2020.
Cash Flow Differences:
October 2021
➢ Included in realty transfer tax cash collections is $11,138 of funds designated for the
Housing Resources Commission (HRC). This figure is the difference of the following
items:
o $587,644 that was transferred to HRC in October 2021 for realty transfer tax
activity that occurred in September 2021.
o $598,782 that will be transferred to HRC in November 2021 for realty transfer tax
activity that occurred in October 2021.
23
October 2021 Cash Collections Report
October 2020
➢ Included in realty transfer tax cash collections is $(67,409) of funds designated for the
Housing Resources Commission (HRC). This figure is the difference of the following
items:
o $564,043 that was transferred to HRC in October 2020 for realty transfer tax
activity that occurred in September 2020;
o $496,634 that was transferred to HRC in November 2020 for realty transfer tax
activity that occurred in October 2020.
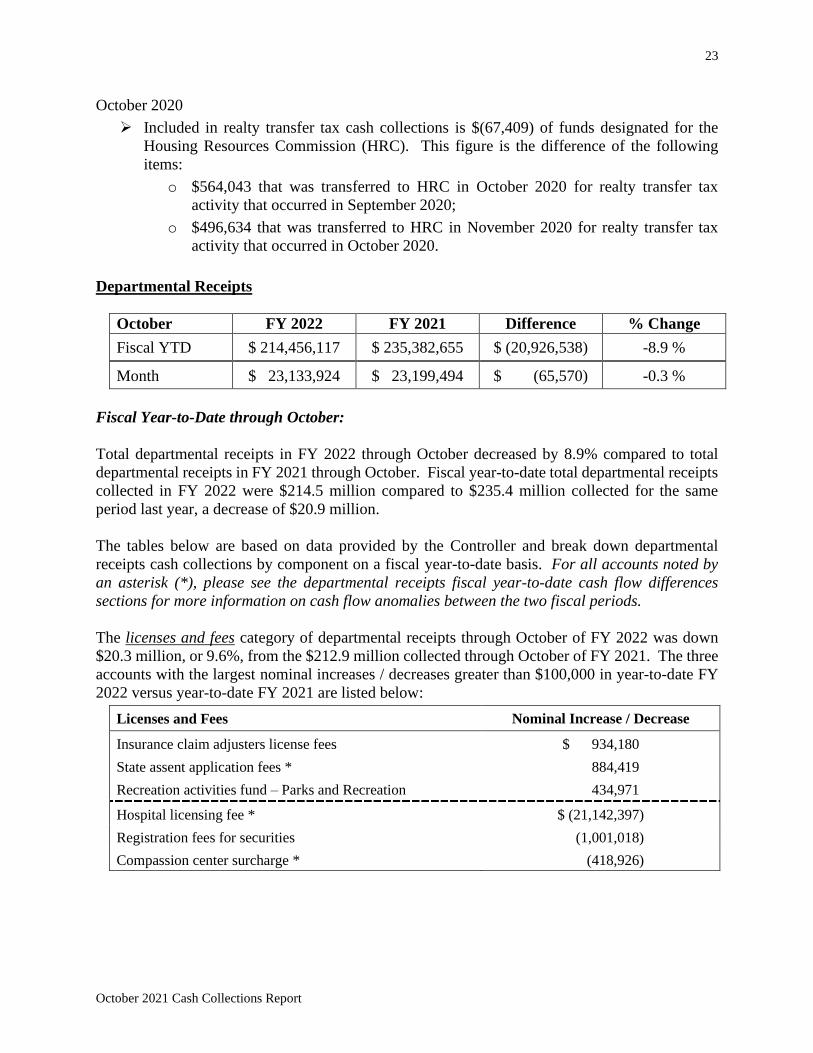
Departmental Receipts
October FY 2022 FY 2021 Difference % Change
Fiscal YTD $ 214,456,117 $ 235,382,655 $ (20,926,538) -8.9 %
Month $ 23,133,924 $ 23,199,494 $ (65,570) -0.3 %
Fiscal Year-to-Date through October:
Total departmental receipts in FY 2022 through October decreased by 8.9% compared to total
departmental receipts in FY 2021 through October. Fiscal year-to-date total departmental receipts
collected in FY 2022 were $214.5 million compared to $235.4 million collected for the same
period last year, a decrease of $20.9 million.
The tables below are based on data provided by the Controller and break down departmental
receipts cash collections by component on a fiscal year-to-date basis. For all accounts noted by
an asterisk (*), please see the departmental receipts fiscal year-to-date cash flow differences
sections for more information on cash flow anomalies between the two fiscal periods.
The licenses and fees category of departmental receipts through October of FY 2022 was down
$20.3 million, or 9.6%, from the $212.9 million collected through October of FY 2021. The three
accounts with the largest nominal increases / decreases greater than $100,000 in year-to-date FY
2022 versus year-to-date FY 2021 are listed below:
Licenses and Fees Nominal Increase / Decrease
Insurance claim adjusters license fees $ 934,180
State assent application fees * 884,419
Recreation activities fund – Parks and Recreation 434,971
Hospital licensing fee * $ (21,142,397)
Registration fees for securities (1,001,018)
Compassion center surcharge * (418,926)
24
October 2021 Cash Collections Report
Cash Flow Differences:
FY 2022
➢ In licenses and fees, cash collections from the hospital licensing fee were $21.1 million
less in year-to-date FY 2022 compared to year-to-date FY 2021. In general, the prior fiscal
year hospital licensing fee is received in July of the current year. The FY 2021 hospital
licensing fee, received in July 2021, was assessed at 5% on hospital fiscal year 2019 net
patient revenues. FY 2020 hospital license fee, received in July 2020, was assessed at the
rate of 6% on hospital fiscal year 2018 net patient revenues.
➢ Cash collections from the state assent application fees include large, infrequently occurring
payment(s) of $803,750 received in September 2021.
FY 2021
➢ FY 2021 license and fees cash collections include a transfer of $333,053 to the compassion
center surcharge from sales and use tax for payments received in FY 2020.
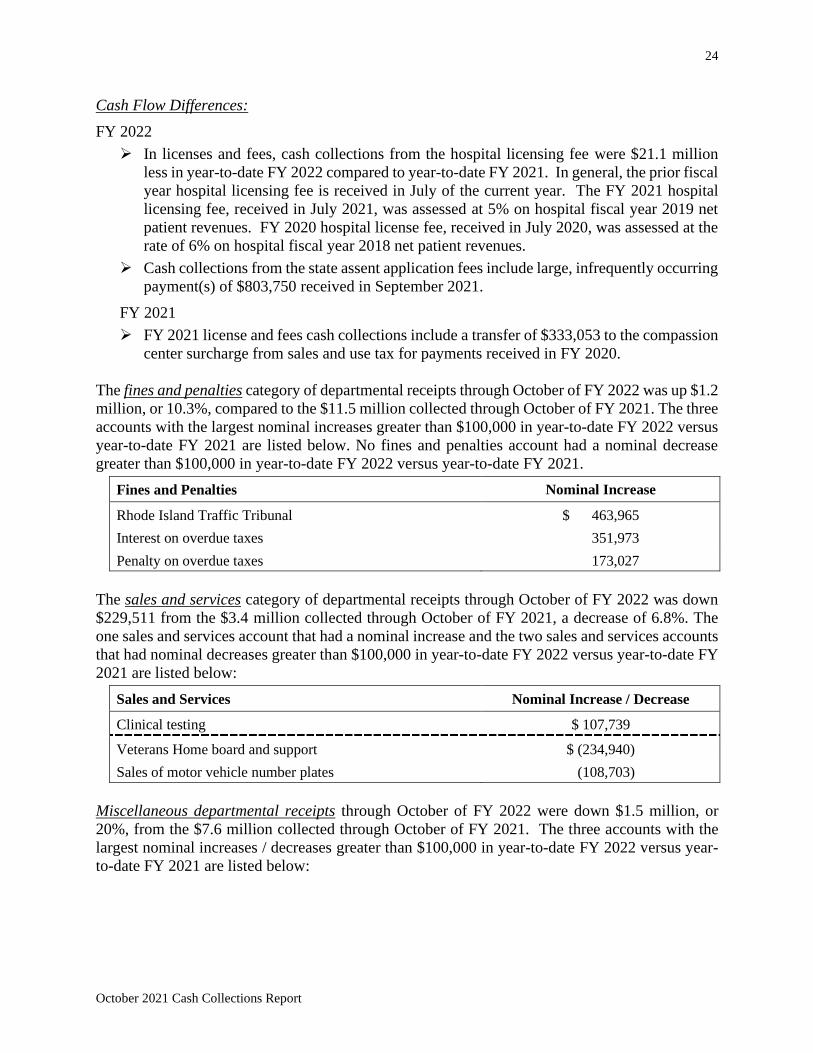
The fines and penalties category of departmental receipts through October of FY 2022 was up $1.2
million, or 10.3%, compared to the $11.5 million collected through October of FY 2021. The three
accounts with the largest nominal increases greater than $100,000 in year-to-date FY 2022 versus
year-to-date FY 2021 are listed below. No fines and penalties account had a nominal decrease
greater than $100,000 in year-to-date FY 2022 versus year-to-date FY 2021.
Fines and Penalties Nominal Increase
Rhode Island Traffic Tribunal $ 463,965
Interest on overdue taxes 351,973
Penalty on overdue taxes 173,027
The sales and services category of departmental receipts through October of FY 2022 was down
$229,511 from the $3.4 million collected through October of FY 2021, a decrease of 6.8%. The
one sales and services account that had a nominal increase and the two sales and services accounts
that had nominal decreases greater than $100,000 in year-to-date FY 2022 versus year-to-date FY
2021 are listed below:
Sales and Services Nominal Increase / Decrease
Clinical testing $ 107,739
Veterans Home board and support $ (234,940)
Sales of motor vehicle number plates (108,703)
Miscellaneous departmental receipts through October of FY 2022 were down $1.5 million, or
20%, from the $7.6 million collected through October of FY 2021. The three accounts with the
largest nominal increases / decreases greater than $100,000 in year-to-date FY 2022 versus year-
to-date FY 2021 are listed below:
25
October 2021 Cash Collections Report
Miscellaneous Departmental Receipts Nominal Increase / Decrease
Cost recovery account – Department of Labor and Training $ 454,372
Cost recovery account – Treasury Department 192,590
Cost recovery account – Department of Health 158,572
Miscellaneous revenues – Office of the Attorney General $ (960,670)
Income tax refund checks written off (751,988)
Cost recovery account – Judiciary (461,984)
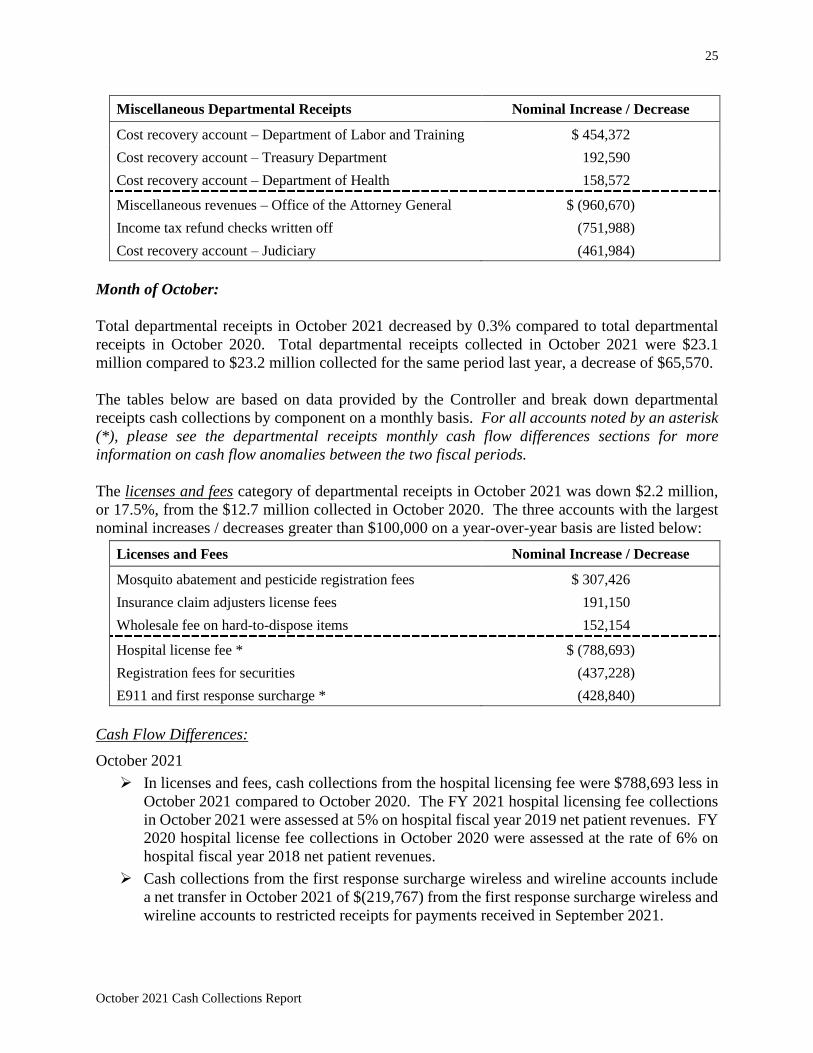
Month of October:
Total departmental receipts in October 2021 decreased by 0.3% compared to total departmental
receipts in October 2020. Total departmental receipts collected in October 2021 were $23.1
million compared to $23.2 million collected for the same period last year, a decrease of $65,570.
The tables below are based on data provided by the Controller and break down departmental
receipts cash collections by component on a monthly basis. For all accounts noted by an asterisk
(*), please see the departmental receipts monthly cash flow differences sections for more
information on cash flow anomalies between the two fiscal periods.
The licenses and fees category of departmental receipts in October 2021 was down $2.2 million,
or 17.5%, from the $12.7 million collected in October 2020. The three accounts with the largest
nominal increases / decreases greater than $100,000 on a year-over-year basis are listed below:
Licenses and Fees Nominal Increase / Decrease
Mosquito abatement and pesticide registration fees $ 307,426
Insurance claim adjusters license fees 191,150
Wholesale fee on hard-to-dispose items 152,154
Hospital license fee * $ (788,693)
Registration fees for securities (437,228)
E911 and first response surcharge * (428,840)
Cash Flow Differences:
October 2021
➢ In licenses and fees, cash collections from the hospital licensing fee were $788,693 less in
October 2021 compared to October 2020. The FY 2021 hospital licensing fee collections
in October 2021 were assessed at 5% on hospital fiscal year 2019 net patient revenues. FY
2020 hospital license fee collections in October 2020 were assessed at the rate of 6% on
hospital fiscal year 2018 net patient revenues.
➢ Cash collections from the first response surcharge wireless and wireline accounts include
a net transfer in October 2021 of $(219,767) from the first response surcharge wireless and
wireline accounts to restricted receipts for payments received in September 2021.
26
October 2021 Cash Collections Report
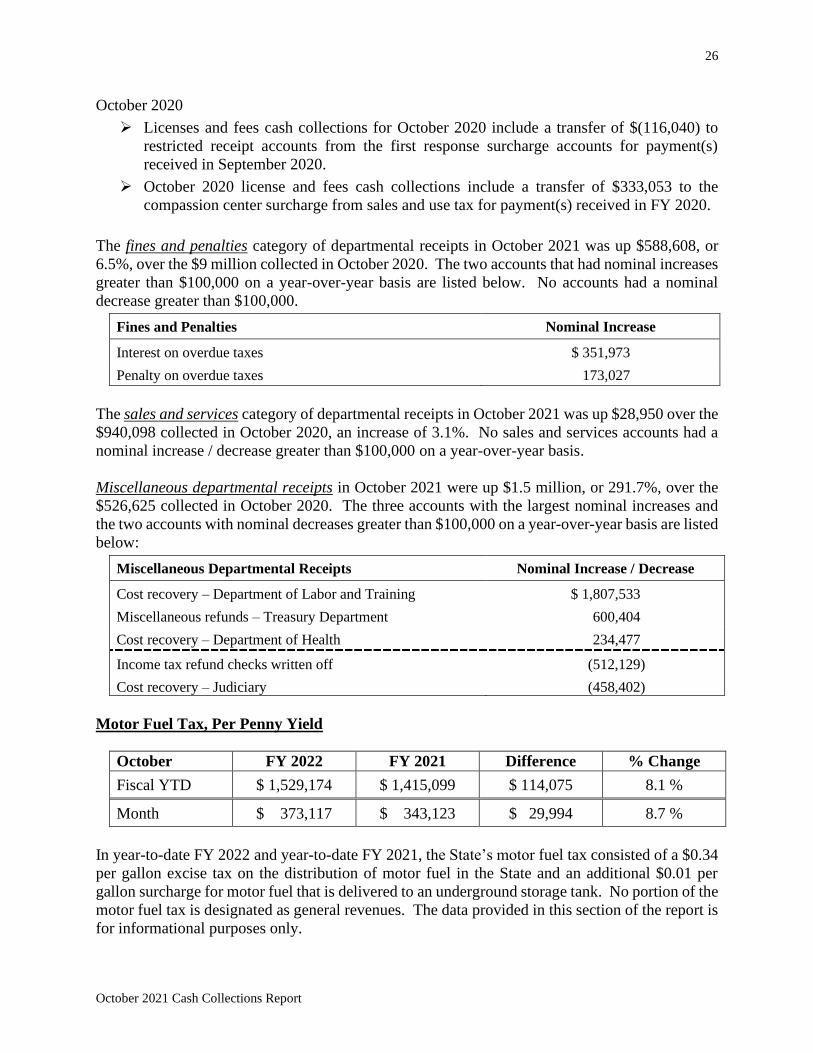
October 2020
➢ Licenses and fees cash collections for October 2020 include a transfer of $(116,040) to
restricted receipt accounts from the first response surcharge accounts for payment(s)
received in September 2020.
➢ October 2020 license and fees cash collections include a transfer of $333,053 to the
compassion center surcharge from sales and use tax for payment(s) received in FY 2020.
The fines and penalties category of departmental receipts in October 2021 was up $588,608, or
6.5%, over the $9 million collected in October 2020. The two accounts that had nominal increases
greater than $100,000 on a year-over-year basis are listed below. No accounts had a nominal
decrease greater than $100,000.
Fines and Penalties Nominal Increase
Interest on overdue taxes $ 351,973
Penalty on overdue taxes 173,027
The sales and services category of departmental receipts in October 2021 was up $28,950 over the
$940,098 collected in October 2020, an increase of 3.1%. No sales and services accounts had a
nominal increase / decrease greater than $100,000 on a year-over-year basis.
Miscellaneous departmental receipts in October 2021 were up $1.5 million, or 291.7%, over the
$526,625 collected in October 2020. The three accounts with the largest nominal increases and
the two accounts with nominal decreases greater than $100,000 on a year-over-year basis are listed
below:
Miscellaneous Departmental Receipts Nominal Increase / Decrease
Cost recovery – Department of Labor and Training $ 1,807,533
Miscellaneous refunds – Treasury Department 600,404
Cost recovery – Department of Health 234,477
Income tax refund checks written off (512,129)
Cost recovery – Judiciary (458,402)
Motor Fuel Tax, Per Penny Yield
October FY 2022 FY 2021 Difference % Change
Fiscal YTD $ 1,529,174 $ 1,415,099 $ 114,075 8.1 %
Month $ 373,117 $ 343,123 $ 29,994 8.7 %
In year-to-date FY 2022 and year-to-date FY 2021, the State’s motor fuel tax consisted of a $0.34
per gallon excise tax on the distribution of motor fuel in the State and an additional $0.01 per
gallon surcharge for motor fuel that is delivered to an underground storage tank. No portion of the
motor fuel tax is designated as general revenues. The data provided in this section of the report is
for informational purposes only.
27
October 2021 Cash Collections Report
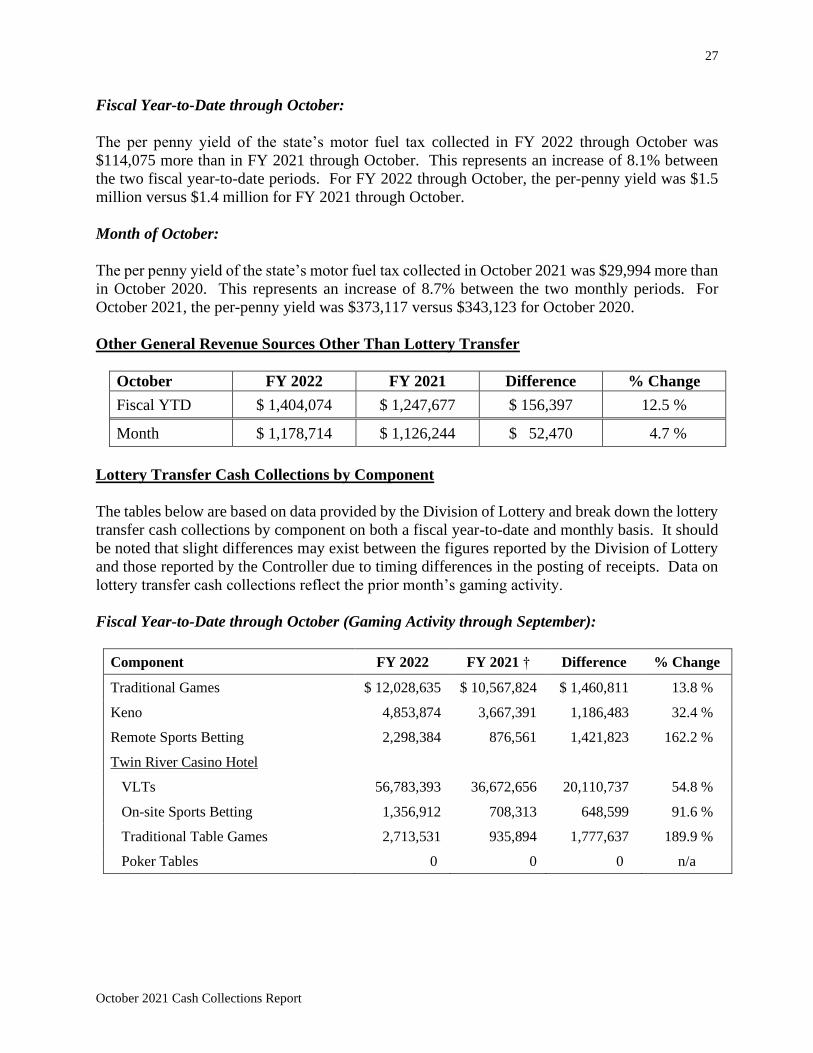
Fiscal Year-to-Date through October:
The per penny yield of the state’s motor fuel tax collected in FY 2022 through October was
$114,075 more than in FY 2021 through October. This represents an increase of 8.1% between
the two fiscal year-to-date periods. For FY 2022 through October, the per-penny yield was $1.5
million versus $1.4 million for FY 2021 through October.
Month of October:
The per penny yield of the state’s motor fuel tax collected in October 2021 was $29,994 more than
in October 2020. This represents an increase of 8.7% between the two monthly periods. For
October 2021, the per-penny yield was $373,117 versus $343,123 for October 2020.
Other General Revenue Sources Other Than Lottery Transfer
October FY 2022 FY 2021 Difference % Change
Fiscal YTD $ 1,404,074 $ 1,247,677 $ 156,397 12.5 %
Month $ 1,178,714 $ 1,126,244 $ 52,470 4.7 %
Lottery Transfer Cash Collections by Component
The tables below are based on data provided by the Division of Lottery and break down the lottery
transfer cash collections by component on both a fiscal year-to-date and monthly basis. It should
be noted that slight differences may exist between the figures reported by the Division of Lottery
and those reported by the Controller due to timing differences in the posting of receipts. Data on
lottery transfer cash collections reflect the prior month’s gaming activity.
Fiscal Year-to-Date through October (Gaming Activity through September):
Component FY 2022 FY 2021 † Difference % Change
Traditional Games $ 12,028,635 $ 10,567,824 $ 1,460,811 13.8 %
Keno 4,853,874 3,667,391 1,186,483 32.4 %
Remote Sports Betting 2,298,384 876,561 1,421,823 162.2 %
Twin River Casino Hotel
VLTs 56,783,393 36,672,656 20,110,737 54.8 %
On-site Sports Betting 1,356,912 708,313 648,599 91.6 %
Traditional Table Games 2,713,531 935,894 1,777,637 189.9 %
Poker Tables 0 0 0 n/a
28
October 2021 Cash Collections Report
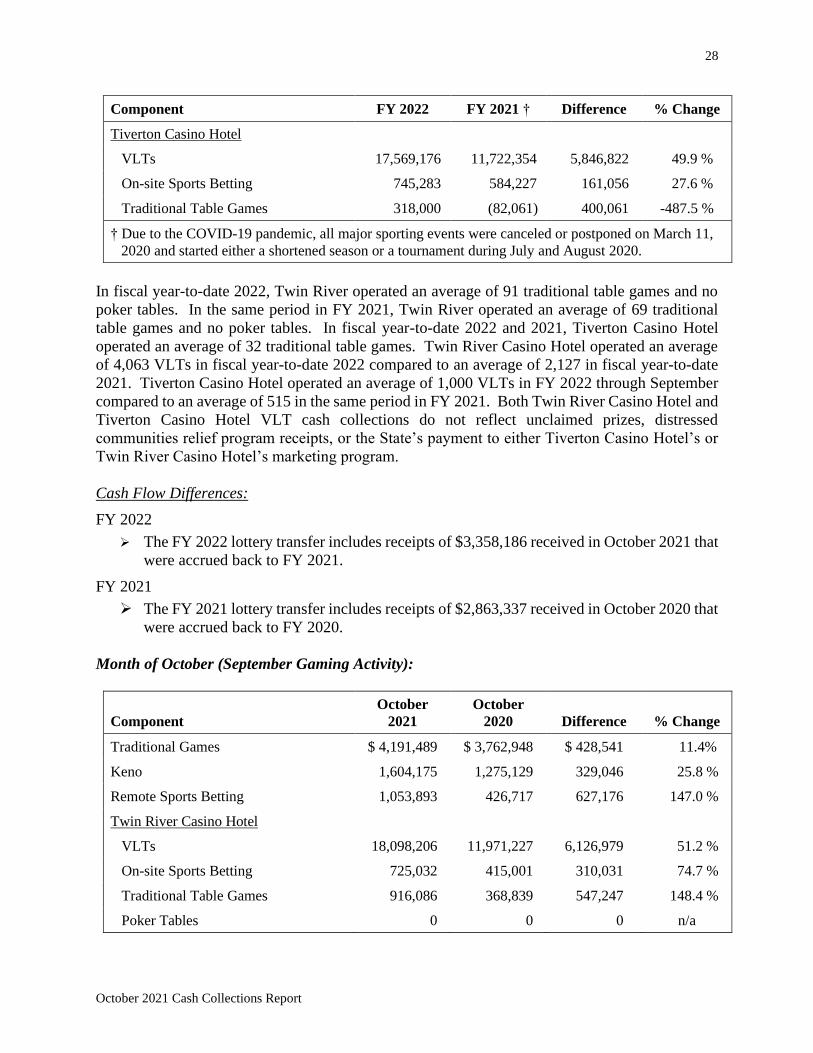
Component FY 2022 FY 2021 † Difference % Change
Tiverton Casino Hotel
VLTs 17,569,176 11,722,354 5,846,822 49.9 %
On-site Sports Betting 745,283 584,227 161,056 27.6 %
Traditional Table Games 318,000 (82,061) 400,061 -487.5 %
† Due to the COVID-19 pandemic, all major sporting events were canceled or postponed on March 11,
2020 and started either a shortened season or a tournament during July and August 2020.
In fiscal year-to-date 2022, Twin River operated an average of 91 traditional table games and no
poker tables. In the same period in FY 2021, Twin River operated an average of 69 traditional
table games and no poker tables. In fiscal year-to-date 2022 and 2021, Tiverton Casino Hotel
operated an average of 32 traditional table games. Twin River Casino Hotel operated an average
of 4,063 VLTs in fiscal year-to-date 2022 compared to an average of 2,127 in fiscal year-to-date
2021. Tiverton Casino Hotel operated an average of 1,000 VLTs in FY 2022 through September
compared to an average of 515 in the same period in FY 2021. Both Twin River Casino Hotel and
Tiverton Casino Hotel VLT cash collections do not reflect unclaimed prizes, distressed
communities relief program receipts, or the State’s payment to either Tiverton Casino Hotel’s or
Twin River Casino Hotel’s marketing program.
Cash Flow Differences:
FY 2022
➢ The FY 2022 lottery transfer includes receipts of $3,358,186 received in October 2021 that
were accrued back to FY 2021.
FY 2021
➢ The FY 2021 lottery transfer includes receipts of $2,863,337 received in October 2020 that
were accrued back to FY 2020.
Month of October (September Gaming Activity):
Component
October
2021
October
2020 Difference % Change
Traditional Games $ 4,191,489 $ 3,762,948 $ 428,541 11.4%
Keno 1,604,175 1,275,129 329,046 25.8 %
Remote Sports Betting 1,053,893 426,717 627,176 147.0 %
Twin River Casino Hotel
VLTs 18,098,206 11,971,227 6,126,979 51.2 %
On-site Sports Betting 725,032 415,001 310,031 74.7 %
Traditional Table Games 916,086 368,839 547,247 148.4 %
Poker Tables 0 0 0 n/a
29
October 2021 Cash Collections Report
Component
October
2021
October
2020 Difference % Change
Tiverton Casino Hotel
VLTs 5,333,592 3,895,426 1,438,166 36.9 %
On-site Sports Betting 321,273 410,590 (89,317) -21.8 %
Traditional Table Games 100,389 (18,286) 118,675 -649.0 %
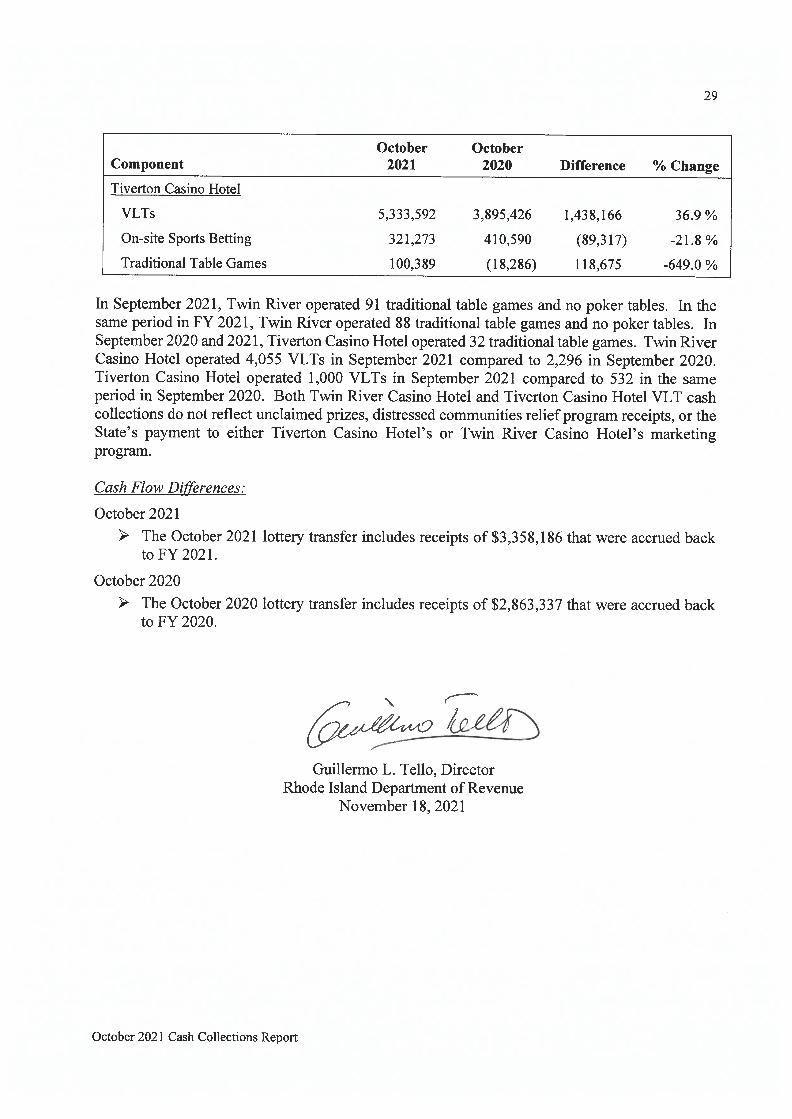
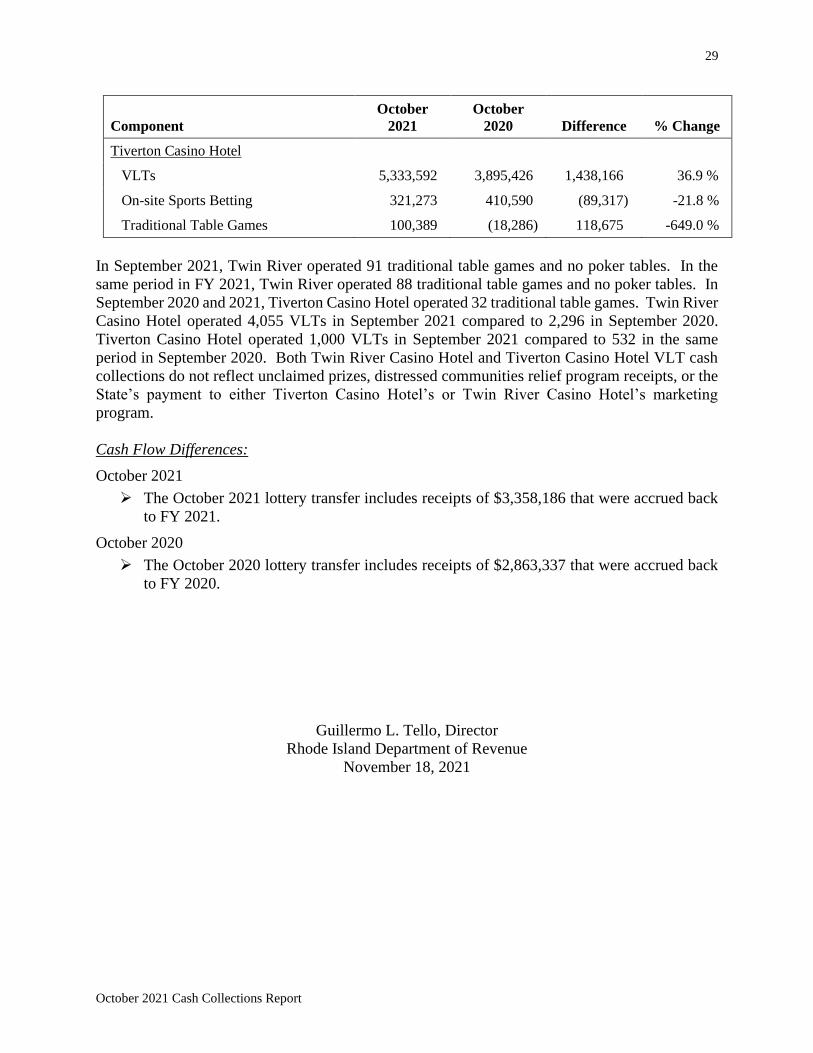
In September 2021, Twin River operated 91 traditional table games and no poker tables. In the
same period in FY 2021, Twin River operated 88 traditional table games and no poker tables. In
September 2020 and 2021, Tiverton Casino Hotel operated 32 traditional table games. Twin River
Casino Hotel operated 4,055 VLTs in September 2021 compared to 2,296 in September 2020.
Tiverton Casino Hotel operated 1,000 VLTs in September 2021 compared to 532 in the same
period in September 2020. Both Twin River Casino Hotel and Tiverton Casino Hotel VLT cash
collections do not reflect unclaimed prizes, distressed communities relief program receipts, or the
State’s payment to either Tiverton Casino Hotel’s or Twin River Casino Hotel’s marketing
program.
Cash Flow Differences:
October 2021
➢ The October 2021 lottery transfer includes receipts of $3,358,186 that were accrued back
to FY 2021.
October 2020
➢ The October 2020 lottery transfer includes receipts of $2,863,337 that were accrued back
to FY 2020.
Guillermo L. Tello, Director
Rhode Island Department of Revenue
November 18, 2021
October 2021 Cash Collections Report
STATE OF RHODE ISLAND GOVERNOR DANIEL J. MCKEE
Office of Revenue Analysis
FY 2022 Cash Collections Report as of October 2021 Summary Fiscal Year-to-Date through October: FY 2022 total general revenue cash collections through October were $1.59 billion, down $26.3 million, or 1.6%, from the $1.62 billion collected in the same period in FY 2021. The breakdown by major general revenue components is as follows:
• Personal income tax cash collections were down $113.3 million, or 18.7%. • Sales and use tax collections were $67.2 million, or 14.9%, more than year-to-date FY 2021. • Departmental receipts were less than the same period in FY 2021 by $20.9 million. • The lottery transfer was $33.4 million, or 49.3%, more than the same period in FY 2021. • All other general revenues were $7.4 million, or 2.8%, more than FY 2021 through October.
$492.4 $517.8
$214.5
$101.0
$269.1
$605.7
$450.6
$235.4
$67.7
$261.8
$0.0
$100.0
$200.0
$300.0
$400.0
$500.0
$600.0
$700.0
Personal IncomeTax
Sales and Use Taxes DepartmentalReceipts
Lottery Transfer All Other GenRevenues
$ M
illio
ns
October Fiscal YTD General Revenue Cash Collections
FY 2022 FY 2021

2
October 2021 Cash Collections Report
Month of October: October 2021 total general revenue cash collections were $327.7 million, up $48.4 million, or 17.3%, over the $279.4 million collected in October 2020. The breakdown by major general revenue components is as follows:
• Personal income tax cash collections were up $13.5 million, or 14.8%. • Sales and use tax collections were $18 million, or 16.2%, more than October 2020. • Departmental receipts were less than October 2020 by $65,570, or 0.3%. • The lottery transfer was $10.2 million, or 40.6%, more than the same period in FY 2021. • All other general revenues were $6.7 million, or 23.4%, more than October 2020.
$104.4
$129.3
$23.1
$35.4 $35.5
$90.9
$111.3
$23.2 $25.1 $28.8
$0.0
$20.0
$40.0
$60.0
$80.0
$100.0
$120.0
$140.0
Personal IncomeTax
Sales and Use Taxes DepartmentalReceipts
Lottery Transfer All Other GenRevenues
$ M
illio
ns
October 2021 General Revenue Cash Collections
October 2021 October 2020

STATE OF RHODE ISLAND MONTHLY CASH COLLECTIONSFiscal Year To Date
3
FY 2022 FY 2021YTD YTD Nominal
October October Difference Change
Personal Income Tax ‡ 492,430,732$ 605,741,408$ (113,310,676)$ -18.7%
General Business TaxesBusiness Corporation ‡ 90,692,252 78,783,619 11,908,633 15.1%Public Utilities Gross Earnings ‡ 22,600,010 23,949,653 (1,349,643) -5.6%Financial Institutions ‡ 18,825,895 6,600,109 12,225,786 185.2%Insurance Companies ‡ 39,031,380 49,894,881 (10,863,501) -21.8%Bank Deposits ‡ 1,130,603 940,833 189,770 20.2%Health Care Provider Assessment 12,443,458 13,980,800 (1,537,342) -11.0%
Excise TaxesSales and Use ∆ 517,849,173 450,627,738 67,221,435 14.9%Motor Vehicle License and Reg Fees 413,765 324,089 89,676 27.7%Cigarettes 53,243,468 55,303,002 (2,059,534) -3.7%Alcohol 8,092,040 7,619,107 472,933 6.2%Controlled Substances 2,000 1,000 1,000 100.0%
Other TaxesEstate and Transfer 12,852,742 16,529,539 (3,676,797) -22.2%Racing and Athletics 177,941 108,415 69,526 64.1%Realty Transfer 8,219,886 6,477,389 1,742,497 26.9%
Total Taxes 1,278,005,346$ 1,316,881,582$ (38,876,236)$ -3.0%
Departmental ReceiptsLicenses and Fees 192,553,765$ 212,901,643$ (20,347,878)$ -9.6%Fines and Penalties 12,664,235 11,486,368 1,177,867 10.3%Sales and Services 3,131,853 3,361,364 (229,511) -6.8%Miscellaneous 6,106,264 7,633,280 (1,527,016) -20.0%
Total Departmental Receipts 214,456,117$ 235,382,655$ (20,926,538)$ -8.9%
Taxes and Departmentals 1,492,461,463$ 1,552,264,237$ (59,802,774)$ -3.9%
Other General Revenue SourcesOther Miscellaneous Revenues 1,404,074$ 1,247,677$ 156,397$ 12.5%Lottery Transfer ∆ 101,034,762 67,671,016 33,363,746 49.3%Unclaimed Property - - - -
Total Other Sources 102,438,836$ 68,918,693$ 33,520,143$ 48.6%
Total General Revenues 1,594,900,299$ 1,621,182,930$ (26,282,631)$ -1.6%
‡ On March 20, 2020, the United States Treasury and Governor Raimondo extended the TY 2019 payment and filing due date for personal income tax and most general business taxes estimated and final payments from June 15, 2020 to August 15, 2020.
∆ Sales and use tax reflects June - August activity and the lottery transfer reflects July - September activity.
Rhode Island Department of RevenueOctober 2021 Report
STATE OF RHODE ISLAND MONTHLY CASH COLLECTIONSMonth of October
4
FY 2022 FY 2021Month of Month of Nominal %October October Difference Change
Personal Income Tax ‡ 104,365,365$ 90,900,217$ 13,465,148$ 14.8%
General Business TaxesBusiness Corporation ‡ 4,507,397 5,724,858 (1,217,461) -21.3%Public Utilities Gross Earnings ‡ 101,344 (1,101,660) 1,203,004 -109.2%Financial Institutions ‡ 7,661,004 2,108,139 5,552,865 263.4%Insurance Companies ‡ 918,884 843,096 75,788 9.0%Bank Deposits ‡ 67,002 - 67,002 -Health Care Provider Assessment 3,276,523 3,351,145 (74,622) -2.2%
Excise TaxesSales and Use ∆ 129,337,445 111,321,652 18,015,793 16.2%Motor Vehicle License and Reg Fees 90,875 60,950 29,925 49.1%Cigarettes 10,837,284 11,908,836 (1,071,552) -9.0%Alcohol 2,223,895 2,137,515 86,380 4.0%Controlled Substances 2,000 - 2,000 -
Other TaxesEstate and Transfer 2,851,595 1,191,176 1,660,419 139.4%Racing and Athletics 38,122 31,559 6,563 20.8%Realty Transfer 1,794,209 1,418,794 375,415 26.5%
Total Taxes 268,072,944$ 229,896,277$ 38,176,667$ 16.6%
Departmental ReceiptsLicenses and Fees 10,471,309$ 12,690,845$ (2,219,536)$ -17.5%Fines and Penalties 9,630,534 9,041,926 588,608 6.5%Sales and Services 969,048 940,098 28,950 3.1%Miscellaneous 2,063,033 526,625 1,536,408 291.7%
Total Departmental Receipts 23,133,924$ 23,199,494$ (65,570)$ -0.3%
Taxes and Departmentals 291,206,868$ 253,095,771$ 38,111,097$ 15.1%
Other General Revenue SourcesOther Miscellaneous Revenues 1,178,714$ 1,126,244$ 52,470$ 4.7%Lottery Transfer ∆ 35,359,944 25,140,761 10,219,183 40.6%Unclaimed Property - - - -
Total Other Sources 36,538,658$ 26,267,005$ 10,271,653$ 39.1%
Total General Revenues 327,745,526$ 279,362,776$ 48,382,750$ 17.3%
‡ On March 20, 2020, the United States Treasury and Governor Raimondo extended the TY 2019 payment and filing due date for personal income tax and most general business taxes estimated and final payments from June 15, 2020 to August 15, 2020.
∆ Reflects September activity
Rhode Island Department of RevenueOctober 2021 Report

5
October 2021 Cash Collections Report
STATE OF RHODE ISLAND GOVERNOR DANIEL J. MCKEE
Office of Revenue Analysis
FY 2022 State of Rhode Island Cash Collections Report October 2021 Detail
The Rhode Island Department of Revenue cash collections report is a comprehensive analysis of fiscal year-to-date and monthly cash collections on all revenue sources estimated by the principals of the Revenue Estimating Conference (see Rhode Island General Laws § 35-16-1). Users of this report should be cautious when comparing year-to-date growth rates for Other Miscellaneous Revenues and Unclaimed Property as the receipt of these revenues occurs at discrete points in time over the course of a fiscal year. Further complicating matters is the fact that the discrete pattern of receipts varies so that payments received do not necessarily occur at the same point in time in each fiscal year.
The October 2021 Cash Collections Report includes the impact of the COVID-19 pandemic on State cash flows. For several cash items, such as the sales and use tax, the October cash collections reflect taxable sales activity in September. For others, such as the personal income tax, the FY 2021 cash collections reflect changes in the timing of the receipt of cash payments due to the TY 2019 extension of filing and payment deadlines from April 15, 2020 to July 15, 2020. It is important the reader not interpret all surpluses in cash collections as realized increases in cash receipts; the delayed receipt of cash payments may also be responsible.

6
October 2021 Cash Collections Report
Cash Flow Differences The Office of Revenue Analysis (ORA) has provided a detailed written explanation of each item listed in the following fiscal year-to-date cash flow differences table. These explanations have been placed into the individual revenue item sections. For example, cash flow differences for personal income tax are listed under the personal income tax by component table. ORA has provided a linked page number in the cash flow differences tables to assist readers in finding these disaggregated cash flow differences sections within the body of the report. Fiscal Year-To-Date through October: The following table displays the differences in cash flows for FY 2022 through October and FY 2021 through October: Page Number Revenue Source Cash Flow Differences
YTD FY 2022
YTD FY 2021
12 / 12 Personal Income Tax FY 2022 adj for FY 2020 payment(s) transferred from bus corp tax $597,000 $(120,000)
12 Personal Income Tax TY 2020 estimated payments received in Jul 2020 and accrued to FY 2020 $0 $28,981,628
12 Personal Income Tax TY 2019 final payments received in Jul 2020 and accrued to FY 2020 $0 $150,386,810
12 Personal Income Tax TY 2019 refunds paid in Jul 2020 and accrued to FY 2020 $0 $(19,311,346)
12 Personal Income Tax FY 2021 adj for prior period payments transferred from/to bus corp tax $0 $1,409,988
12 Personal Income Tax Net payment(s) posted to personal income tax instead of business corp tax $0 $2,802,933
12 / 12 Personal Income Tax Large, infrequently occurring withholding payment(s) $4,371,139 $7,225,890
16 / 17 Business Corp Tax FY 2022 adj for prior period payment(s) transferred to pers inc tax $(597,000) $120,000
16 / 16 Business Corp Tax FY 2022 adj for FY 2021 payment(s) transferred to financial inst tax $(525,000) $300,000
16 Business Corp Tax TY 2020 estimated payments received in Jul 2020 and accrued to FY 2020 $0 $12,357,209
16 Business Corp Tax TY 2019 final payments received in Jul 2020 and accrued to FY 2020 $0 $15,679,486
16 Business Corp Tax TY 2019 refunds paid in Jul 2020 and accrued to FY 2020 $0 $(821,536)
16 Business Corp Tax FY 2021 adj for prior period payments transferred to/from pers inc tax $0 $(1,409,988)
16 Business Corp Tax FY 2021 adj for prior period payment(s) transferred from financial inst tax $0 $(1,810,000)
7
October 2021 Cash Collections Report
Page Number Revenue Source Cash Flow Differences
YTD FY 2022
YTD FY 2021
17 Business Corp Tax FY 2021 adj for prior period payment(s) transferred from ins gross prem tax $0 $120,000
17 Business Corp Tax Net payment(s) posted to personal income tax instead of business corp tax $0 $(2,802,933)
18 / 19 Financial Inst Tax FY 2022 adj for FY 2021 payment(s) transferred from bus corp tax $525,000 $(300,000)
19 Financial Inst Tax FY 2021 adj for prior period payment(s) transferred to business corp tax $0 $1,810,000
19 Financial Inst Tax TY 2019 final payments received in Jul 2020 and accrued to FY 2020 $0 $347,200
19 Ins Gross Premiums Tax FY 2021 adj for prior period payment(s) transferred to bus corp tax $0 $(120,000)
19 Ins Gross Premiums Tax Payments received in Jul 2020 and accrued to FY 2020 $0 $13,708,205
19 Bank Deposits Tax Late payment(s) received in July and accrued to prior fiscal year $0 $111,466
14 Sales and Use Tax FY 2021 adj for prior period payment(s) transferred to departmental receipts $0 $(333,053)
21 / 21 MV License & Reg Fees State’s share of prior year receivable $112,640 $118,760
22 / 22 Realty Transfer Tax Subsequent month’s transfer to the Housing Resources Commission $598,782 $496,634
22 Realty Transfer Tax Late real estate conveyance tax payment(s) $282,501 $0
22 Realty Transfer Tax Late controlling interest conveyance tax payment(s) $574,257 $0
24 Departmental Receipts Hospital licensing fee $(21,142,397) $0
24 Departmental Receipts Large, infrequently occurring state assent payment(s) $803,750 $0
24 Departmental Receipts FY 2021 adj for prior period payment(s) transferred from sales and use tax $0 $333,053
28 / 28 Lottery Transfer Payment of prior fiscal year revenues in October $3,358,186 $2,863,337
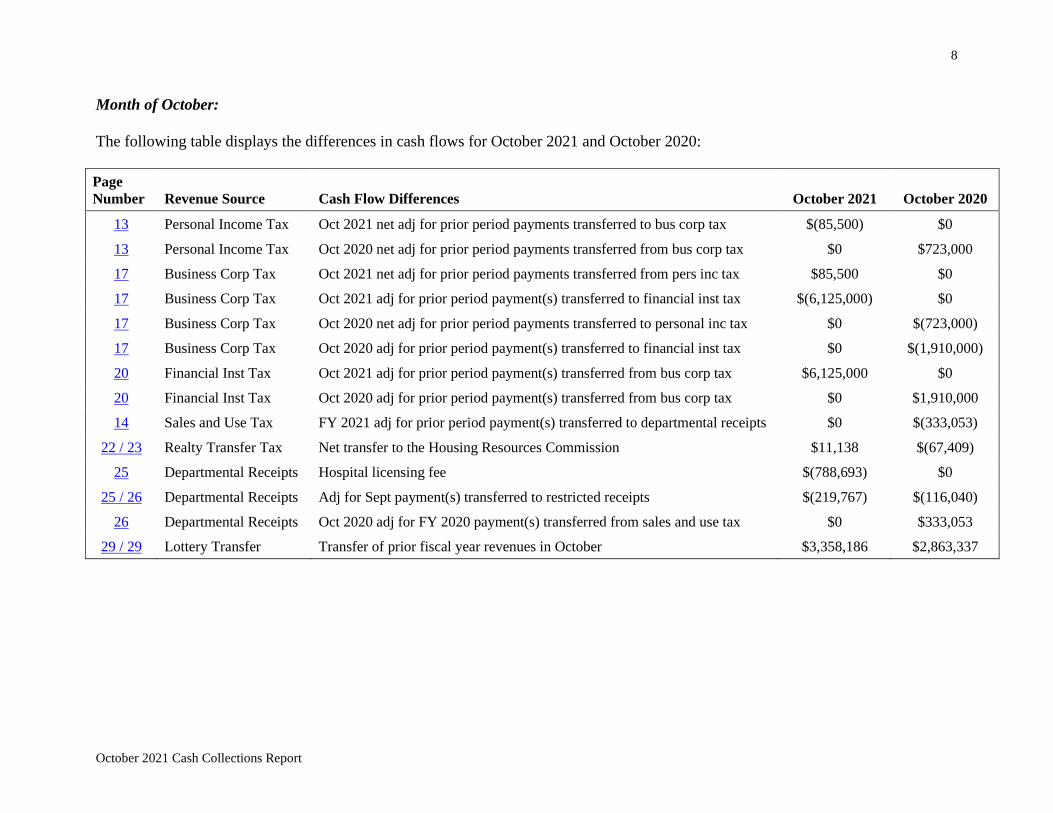
8
October 2021 Cash Collections Report
Month of October: The following table displays the differences in cash flows for October 2021 and October 2020: Page Number Revenue Source Cash Flow Differences October 2021 October 2020
13 Personal Income Tax Oct 2021 net adj for prior period payments transferred to bus corp tax $(85,500) $0
13 Personal Income Tax Oct 2020 net adj for prior period payments transferred from bus corp tax $0 $723,000
17 Business Corp Tax Oct 2021 net adj for prior period payments transferred from pers inc tax $85,500 $0
17 Business Corp Tax Oct 2021 adj for prior period payment(s) transferred to financial inst tax $(6,125,000) $0
17 Business Corp Tax Oct 2020 net adj for prior period payments transferred to personal inc tax $0 $(723,000)
17 Business Corp Tax Oct 2020 adj for prior period payment(s) transferred to financial inst tax $0 $(1,910,000)
20 Financial Inst Tax Oct 2021 adj for prior period payment(s) transferred from bus corp tax $6,125,000 $0
20 Financial Inst Tax Oct 2020 adj for prior period payment(s) transferred from bus corp tax $0 $1,910,000
14 Sales and Use Tax FY 2021 adj for prior period payment(s) transferred to departmental receipts $0 $(333,053)
22 / 23 Realty Transfer Tax Net transfer to the Housing Resources Commission $11,138 $(67,409)
25 Departmental Receipts Hospital licensing fee $(788,693) $0
25 / 26 Departmental Receipts Adj for Sept payment(s) transferred to restricted receipts $(219,767) $(116,040)
26 Departmental Receipts Oct 2020 adj for FY 2020 payment(s) transferred from sales and use tax $0 $333,053
29 / 29 Lottery Transfer Transfer of prior fiscal year revenues in October $3,358,186 $2,863,337

9
October 2021 Cash Collections Report
Impact on General Revenue Cash Collections from the COVID-19 Pandemic Due to the COVID-19 pandemic, on March 20, 2020, the Division of Taxation, in conjunction with announcements made by the United States Treasury and Governor Gina M. Raimondo, postponed the return filing and final and estimated payment due date from April 15, 2020 and June 15, 2020 to July 15, 2020 for personal income tax and certain business taxes. For the affected tax types, the change in the filing date provided taxpayers three additional months to file TY 2019 returns and pay balances due, with no penalties or interest accrued on these balances if paid on or before July 15, 2020. At this time, the Department of Revenue has information on the amount of cash receipts that were received in July 2020 due to this extension. These figures are included in the cash flow differences table by payment and tax type. COVID-19 Pandemic Control Measures That Impacted Sales and Use Tax and the Lottery Transfer in FY 2021 through October
• June 1, 2020: Indoor dining was allowed at 50% of capacity. • June 30, 2020: Phase 3 of Reopening RI was put in place by Governor Raimondo. Indoor
dining was increased to 66% of capacity and larger crowd sizes were permitted at indoor and outdoor venues.
• July 2020: Major League Soccer (MLS), Major League Baseball (MLB), and the National Basketball Association (NBA) started either a shortened season or a championship tournament.
• July 29, 2020: The number of people who could attend catered events was reduced to 50 for indoor events and 100 for outdoor events, and the size of informal gatherings was capped at 15 people.
• August 1, 2020: The National Hockey League (NHL) resumed play in a playoff tournament format.
• August 8, 2020: Bars, including those inside of restaurants, were required to close by 11:00 PM.
Historic Structures Tax Credit Reimbursements: The breakdown of the reimbursement of redeemed Historic Structures Tax Credits (HSTCs) by tax type is shown in the table below:
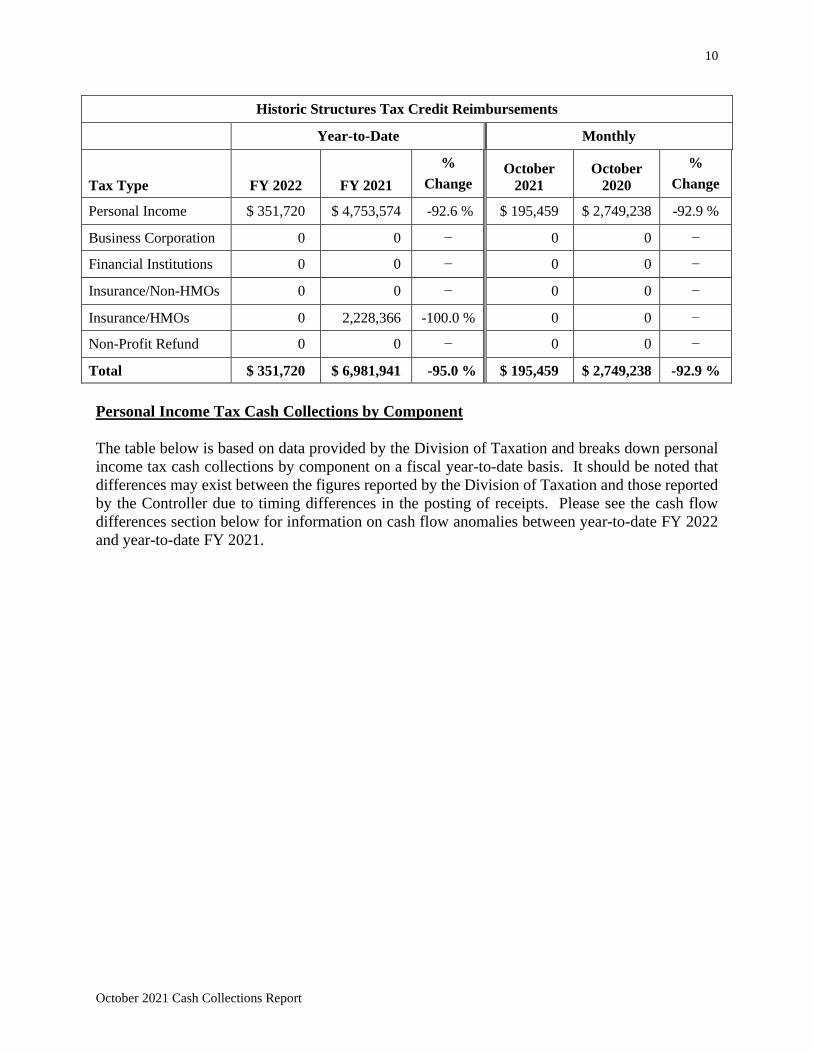
10
October 2021 Cash Collections Report
Historic Structures Tax Credit Reimbursements
Year-to-Date Monthly
Tax Type FY 2022 FY 2021 %
Change October
2021 October
2020 %
Change
Personal Income $ 351,720 $ 4,753,574 -92.6 % $ 195,459 $ 2,749,238 -92.9 %
Business Corporation 0 0 − 0 0 −
Financial Institutions 0 0 − 0 0 −
Insurance/Non-HMOs 0 0 − 0 0 −
Insurance/HMOs 0 2,228,366 -100.0 % 0 0 −
Non-Profit Refund 0 0 − 0 0 −
Total $ 351,720 $ 6,981,941 -95.0 % $ 195,459 $ 2,749,238 -92.9 % Personal Income Tax Cash Collections by Component The table below is based on data provided by the Division of Taxation and breaks down personal income tax cash collections by component on a fiscal year-to-date basis. It should be noted that differences may exist between the figures reported by the Division of Taxation and those reported by the Controller due to timing differences in the posting of receipts. Please see the cash flow differences section below for information on cash flow anomalies between year-to-date FY 2022 and year-to-date FY 2021.

11
October 2021 Cash Collections Report
Fiscal Year-to-Date through October:
Component FY 2022 FY 2021 ^ Difference % Change Estimated Payments ⁑ $ 81,327,394 $ 100,931,311 $ (19,603,918) -19.4 % Final Payments †, ‡, * 35,101,390 179,382,289 (144,280,898) -80.4 % Refunds/Adjustments ˅ (49,377,185) (68,545,033) 19,167,848 -28.0 % Withholding Tax Payments 425,379,134 393,972,842 31,406,292 8.0 %
^ The TY 2019 filing-and-payment deadline for income tax for individuals and most businesses was postponed from April 15, 2020 and June 15, 2020 to July 15, 2020.
⁑ FY 2021 estimated payments include $28,981,628 of TY 2020 payments received in July 2020 and accrued back to FY 2020. Net of these cash receipts, the FY 2022 growth rate in estimated payments cash collections is 13.0%.
† Final payments in FY 2022 year-to-date do not include $18,640,758 in pass-through entity payments that were deposited as business corporation tax. This amount is expected to be transferred to personal income tax in June 2022. FY 2021 year-to-date does not include $7,601,608 in pass-through entity payments that were deposited as business corporation tax in August – October 2020 and transferred in June 2021.
‡ FY 2021 final payments include $144,591,447 of TY 2019 payments received in July 2020 and accrued back to FY 2020. It should be noted that this figure does not include $5.8 million of pass-through entity personal income tax payments that were recorded under the business corporation tax in July 2020 and included in the FY 2020 personal income tax final payments receivable of $150.4 million. Net of these cash receipts, the FY 2022 growth rate in final payments cash collections is 0.9%.
* Includes HSTC reimbursements of $351,720 in FY 2022 YTD and $4,753,574 in FY 2021 YTD. ˅ FY 2021 refunds and adjustments include $(19,311,346) of TY 2019 refunds paid in July 2020 and
accrued back to FY 2020. Net of these refunds, the FY 2022 growth rate in refunds and adjustments cash collections 0.3%.
For the FY 2022 through October period 45,107 income tax refunds were paid for TY 2020 at an average of $1,005.35. For the same period in the prior year, 77,312 income tax refunds were paid for TY 2019 at an average of $878.33. Intra-Fiscal Year Transfers FY 2022 Personal income tax final payments do not include $147,603 in payment(s) mis-deposited
as business corporation tax in FY 2022 year-to-date. This amount was transferred to personal income tax in FY 2022 year-to-date and is included in personal income tax refunds and adjustments as $147,603.
FY 2021 Personal income tax final payments do not include $365,830 in payment(s) deposited as
business corporation tax in FY 2021 year-to-date and personal income tax estimated payments do not include $528,000 in payment(s) deposited as business corporation tax in FY 2021 year-to-date. These amounts were transferred to personal income tax in FY 2021 year-to-date and are included in personal income tax refunds and adjustments as $893,830.

12
October 2021 Cash Collections Report
Cash Flow Differences: FY 2022 Personal income tax cash collections include $597,000 for net transfers between personal
income tax and business corporation tax for payments received in prior periods as noted below:
o $682,500 for payment(s) received in July 2019 and transferred from business corporation tax in July 2021;
o $(85,500) for payment(s) received in FY 2021 and transferred to business corporation tax in October 2021.
Personal income tax withholding payments include $4,371,139 of large, infrequently occurring payment(s) received in September 2021.
FY 2021 Year-to-date FY 2021 personal income tax cash collections do not include net payments of
$120,000 that were incorrectly paid to business corporation tax instead of personal income tax in FY 2021 year-to-date and were adjusted for in FY 2022.
Personal income tax estimated payments include $28,981,628 of TY 2020 estimated payments received in July 2020 and accrued back to FY 2020.
Personal income tax final payments include $150,386,810 of TY 2019 final payments received in July 2020 and accrued back to FY 2020. Included in this receivable is $5.8 million of pass-through entity personal income tax payments that were recorded under the business corporation tax in July 2020.
Personal income tax refunds and adjustments include $(19,311,346) of TY 2019 refunds paid in July 2020 and accrued back to FY 2020.
Personal income tax refunds and adjustments cash collections include $1,409,988 for net transfer(s) between personal income tax and business corporation tax for payment(s) received in prior periods as listed below:
o $324,288 for July 2020 transfer(s) from business corporation tax for payment(s) received in August 2012;
o $890,700 for September 2020 net transfer(s) from business corporation tax for payment(s) received in FY 2018 – FY 2020, which included a transfer of $(359,000) of payments made to personal income tax final payments instead of business corporation tax.
o $195,000 for October 2020 net transfer(s) from business corporation tax for payment(s) received in January 2020.
Year-to-date FY 2021 personal income tax cash collections include net payments of $2,802,933 incorrectly paid to personal income tax instead of business corporation tax in FY 2021 year-to-date. These payments were transferred between personal income tax and business corporation tax in FY 2021.
Personal income tax withholding payments include $7,225,890 of large, infrequently occurring payment(s) received in September 2020.
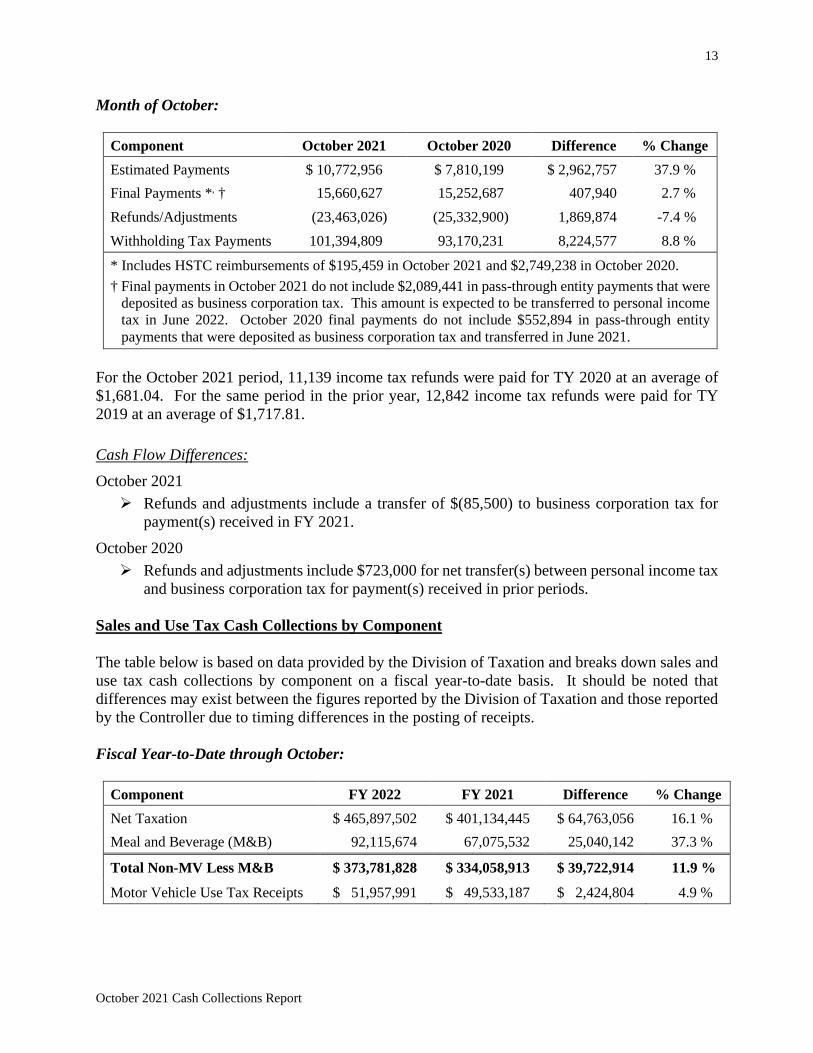
13
October 2021 Cash Collections Report
Month of October:
Component October 2021 October 2020 Difference % Change Estimated Payments $ 10,772,956 $ 7,810,199 $ 2,962,757 37.9 % Final Payments *, † 15,660,627 15,252,687 407,940 2.7 % Refunds/Adjustments (23,463,026) (25,332,900) 1,869,874 -7.4 % Withholding Tax Payments 101,394,809 93,170,231 8,224,577 8.8 %
* Includes HSTC reimbursements of $195,459 in October 2021 and $2,749,238 in October 2020. † Final payments in October 2021 do not include $2,089,441 in pass-through entity payments that were
deposited as business corporation tax. This amount is expected to be transferred to personal income tax in June 2022. October 2020 final payments do not include $552,894 in pass-through entity payments that were deposited as business corporation tax and transferred in June 2021.
For the October 2021 period, 11,139 income tax refunds were paid for TY 2020 at an average of $1,681.04. For the same period in the prior year, 12,842 income tax refunds were paid for TY 2019 at an average of $1,717.81. Cash Flow Differences: October 2021 Refunds and adjustments include a transfer of $(85,500) to business corporation tax for
payment(s) received in FY 2021. October 2020 Refunds and adjustments include $723,000 for net transfer(s) between personal income tax
and business corporation tax for payment(s) received in prior periods. Sales and Use Tax Cash Collections by Component The table below is based on data provided by the Division of Taxation and breaks down sales and use tax cash collections by component on a fiscal year-to-date basis. It should be noted that differences may exist between the figures reported by the Division of Taxation and those reported by the Controller due to timing differences in the posting of receipts. Fiscal Year-to-Date through October:
Component FY 2022 FY 2021 Difference % Change Net Taxation $ 465,897,502 $ 401,134,445 $ 64,763,056 16.1 % Meal and Beverage (M&B) 92,115,674 67,075,532 25,040,142 37.3 %
Total Non-MV Less M&B $ 373,781,828 $ 334,058,913 $ 39,722,914 11.9 %
Motor Vehicle Use Tax Receipts $ 51,957,991 $ 49,533,187 $ 2,424,804 4.9 %
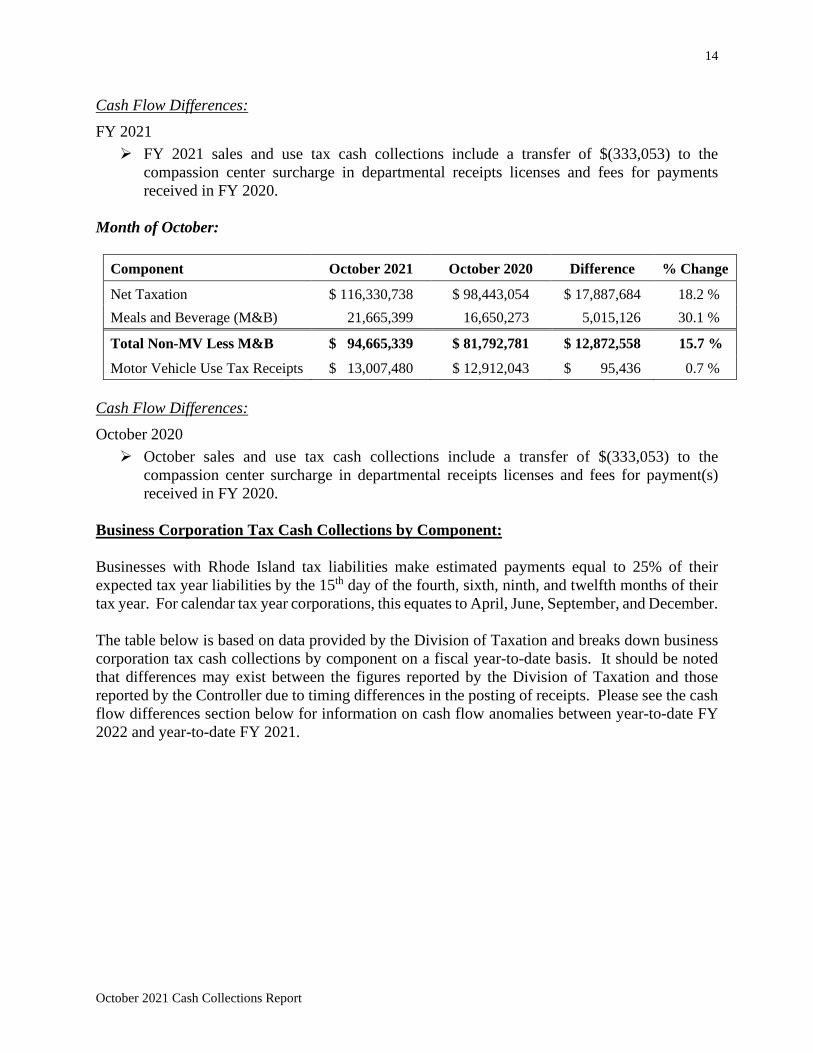
14
October 2021 Cash Collections Report
Cash Flow Differences: FY 2021 FY 2021 sales and use tax cash collections include a transfer of $(333,053) to the
compassion center surcharge in departmental receipts licenses and fees for payments received in FY 2020.
Month of October:
Component October 2021 October 2020 Difference % Change
Net Taxation $ 116,330,738 $ 98,443,054 $ 17,887,684 18.2 % Meals and Beverage (M&B) 21,665,399 16,650,273 5,015,126 30.1 %
Total Non-MV Less M&B $ 94,665,339 $ 81,792,781 $ 12,872,558 15.7 %
Motor Vehicle Use Tax Receipts $ 13,007,480 $ 12,912,043 $ 95,436 0.7 % Cash Flow Differences: October 2020 October sales and use tax cash collections include a transfer of $(333,053) to the
compassion center surcharge in departmental receipts licenses and fees for payment(s) received in FY 2020.
Business Corporation Tax Cash Collections by Component: Businesses with Rhode Island tax liabilities make estimated payments equal to 25% of their expected tax year liabilities by the 15th day of the fourth, sixth, ninth, and twelfth months of their tax year. For calendar tax year corporations, this equates to April, June, September, and December. The table below is based on data provided by the Division of Taxation and breaks down business corporation tax cash collections by component on a fiscal year-to-date basis. It should be noted that differences may exist between the figures reported by the Division of Taxation and those reported by the Controller due to timing differences in the posting of receipts. Please see the cash flow differences section below for information on cash flow anomalies between year-to-date FY 2022 and year-to-date FY 2021.
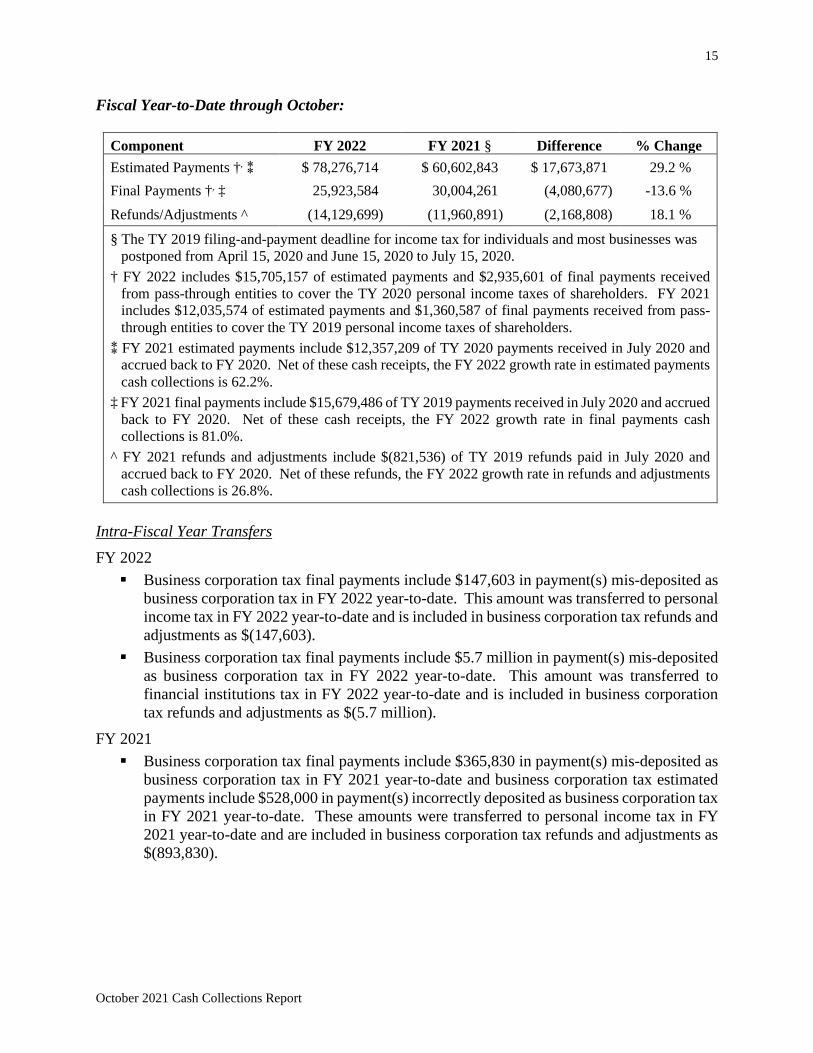
15
October 2021 Cash Collections Report
Fiscal Year-to-Date through October:
Component FY 2022 FY 2021 § Difference % Change Estimated Payments †, ⁑ $ 78,276,714 $ 60,602,843 $ 17,673,871 29.2 % Final Payments †, ‡ 25,923,584 30,004,261 (4,080,677) -13.6 % Refunds/Adjustments ^ (14,129,699) (11,960,891) (2,168,808) 18.1 %
§ The TY 2019 filing-and-payment deadline for income tax for individuals and most businesses was postponed from April 15, 2020 and June 15, 2020 to July 15, 2020.
† FY 2022 includes $15,705,157 of estimated payments and $2,935,601 of final payments received from pass-through entities to cover the TY 2020 personal income taxes of shareholders. FY 2021 includes $12,035,574 of estimated payments and $1,360,587 of final payments received from pass-through entities to cover the TY 2019 personal income taxes of shareholders.
⁑ FY 2021 estimated payments include $12,357,209 of TY 2020 payments received in July 2020 and accrued back to FY 2020. Net of these cash receipts, the FY 2022 growth rate in estimated payments cash collections is 62.2%.
‡ FY 2021 final payments include $15,679,486 of TY 2019 payments received in July 2020 and accrued back to FY 2020. Net of these cash receipts, the FY 2022 growth rate in final payments cash collections is 81.0%.
^ FY 2021 refunds and adjustments include $(821,536) of TY 2019 refunds paid in July 2020 and accrued back to FY 2020. Net of these refunds, the FY 2022 growth rate in refunds and adjustments cash collections is 26.8%.
Intra-Fiscal Year Transfers FY 2022 Business corporation tax final payments include $147,603 in payment(s) mis-deposited as
business corporation tax in FY 2022 year-to-date. This amount was transferred to personal income tax in FY 2022 year-to-date and is included in business corporation tax refunds and adjustments as $(147,603).
Business corporation tax final payments include $5.7 million in payment(s) mis-deposited as business corporation tax in FY 2022 year-to-date. This amount was transferred to financial institutions tax in FY 2022 year-to-date and is included in business corporation tax refunds and adjustments as $(5.7 million).
FY 2021 Business corporation tax final payments include $365,830 in payment(s) mis-deposited as
business corporation tax in FY 2021 year-to-date and business corporation tax estimated payments include $528,000 in payment(s) incorrectly deposited as business corporation tax in FY 2021 year-to-date. These amounts were transferred to personal income tax in FY 2021 year-to-date and are included in business corporation tax refunds and adjustments as $(893,830).
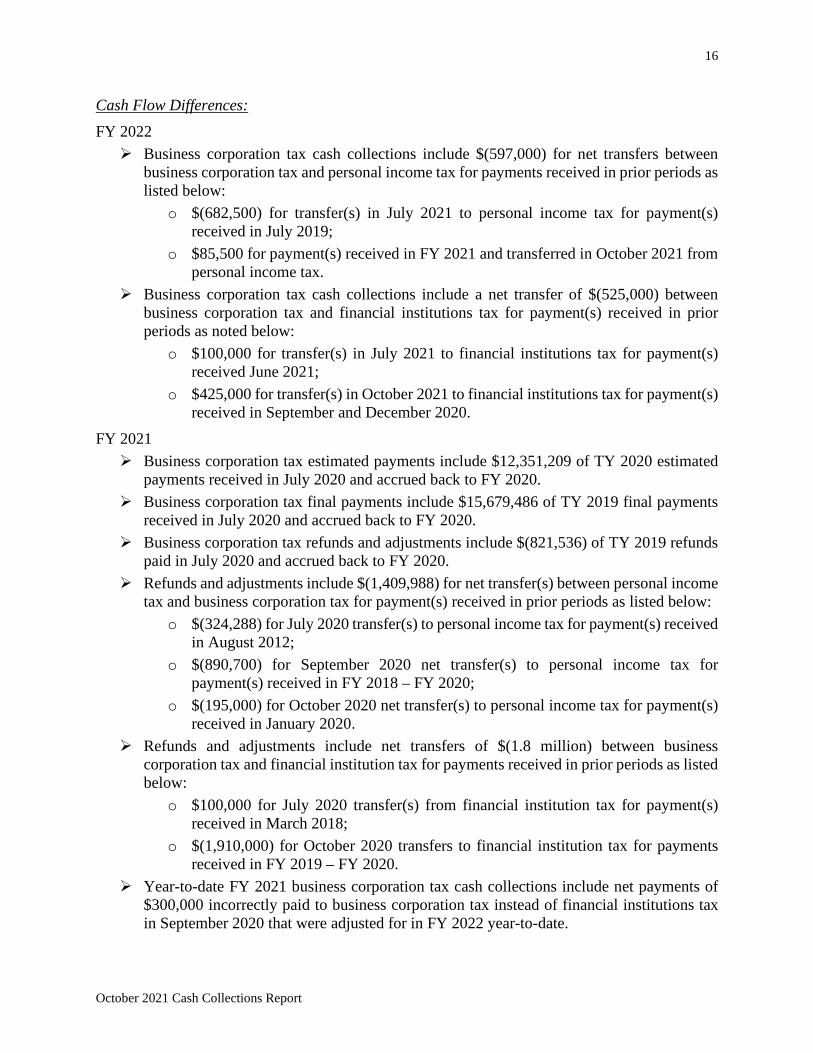
16
October 2021 Cash Collections Report
Cash Flow Differences: FY 2022 Business corporation tax cash collections include $(597,000) for net transfers between
business corporation tax and personal income tax for payments received in prior periods as listed below:
o $(682,500) for transfer(s) in July 2021 to personal income tax for payment(s) received in July 2019;
o $85,500 for payment(s) received in FY 2021 and transferred in October 2021 from personal income tax.
Business corporation tax cash collections include a net transfer of $(525,000) between business corporation tax and financial institutions tax for payment(s) received in prior periods as noted below:
o $100,000 for transfer(s) in July 2021 to financial institutions tax for payment(s) received June 2021;
o $425,000 for transfer(s) in October 2021 to financial institutions tax for payment(s) received in September and December 2020.
FY 2021 Business corporation tax estimated payments include $12,351,209 of TY 2020 estimated
payments received in July 2020 and accrued back to FY 2020. Business corporation tax final payments include $15,679,486 of TY 2019 final payments
received in July 2020 and accrued back to FY 2020. Business corporation tax refunds and adjustments include $(821,536) of TY 2019 refunds
paid in July 2020 and accrued back to FY 2020. Refunds and adjustments include $(1,409,988) for net transfer(s) between personal income
tax and business corporation tax for payment(s) received in prior periods as listed below: o $(324,288) for July 2020 transfer(s) to personal income tax for payment(s) received
in August 2012; o $(890,700) for September 2020 net transfer(s) to personal income tax for
payment(s) received in FY 2018 – FY 2020; o $(195,000) for October 2020 net transfer(s) to personal income tax for payment(s)
received in January 2020. Refunds and adjustments include net transfers of $(1.8 million) between business
corporation tax and financial institution tax for payments received in prior periods as listed below:
o $100,000 for July 2020 transfer(s) from financial institution tax for payment(s) received in March 2018;
o $(1,910,000) for October 2020 transfers to financial institution tax for payments received in FY 2019 – FY 2020.
Year-to-date FY 2021 business corporation tax cash collections include net payments of $300,000 incorrectly paid to business corporation tax instead of financial institutions tax in September 2020 that were adjusted for in FY 2022 year-to-date.

17
October 2021 Cash Collections Report
Business corporation tax refunds and adjustments include net payments of $120,000 that were incorrectly paid to business corporation tax instead of personal income tax in FY 2021 year-to-date. These payments were transferred between personal income tax and business corporation tax in FY 2022.
Refunds and adjustments include a transfer of $120,000 from insurance company gross premiums tax for payment(s) received in December 2018.
Year-to-date FY 2021 business corporation tax cash collections do not include net payments of $2,802,933 incorrectly paid to personal income tax instead of business corporation tax in FY 2021 year-to-date. These payments were transferred between personal income tax and business corporation tax in FY 2021.
Month of October:
Component October 2021 October 2020 Difference % Change Estimated Payments * $ 8,788,228 $ 6,791,747 $ 1,996,481 29.4 % Final Payments * 6,956,850 4,210,611 2,746,239 65.2 % Refunds/Adjustments (11,273,558) (5,327,418) (5,946,140) 111.6 %
* October 2021 includes $1,550,241 of estimated payments and $539,199 of final payments received from pass-through entities to cover the TY 2020 personal income taxes of shareholders. October 2020 includes $498,864 of estimated payments and $54,030 of final payments received from pass-through entities to cover the TY 2019 personal income taxes of shareholders.
Cash Flow Differences: October 2021 Refunds and adjustments include a net transfer of $85,500 from personal income tax for
payment(s) received in FY 2021. Refunds and adjustments include a net transfer of $(6,125,000) to financial institution tax
for payment(s) received in FY 2021 – FY 2022. October 2020 Refunds and adjustments include a net transfer of $(723,000) to personal income tax for
payment(s) received in prior periods. Refunds and adjustments include a net transfer of $(1,910,000) to financial institutions tax
for payment(s) received in FY 2019 – FY 2020. General Business Taxes Other than Business Corporation Tax
October FY 2022 FY 2021 Difference % Change Fiscal YTD $ 94,031,346 $ 95,366,276 $ (1,334,930) -1.4 %
Month $ 12,024,757 $ 5,200,720 $ 6,824,037 131.2 % Businesses with Rhode Island tax liabilities make estimated payments equal to 25% of their expected tax year liabilities by the 15th day of the fourth, sixth, ninth, and twelfth months of their
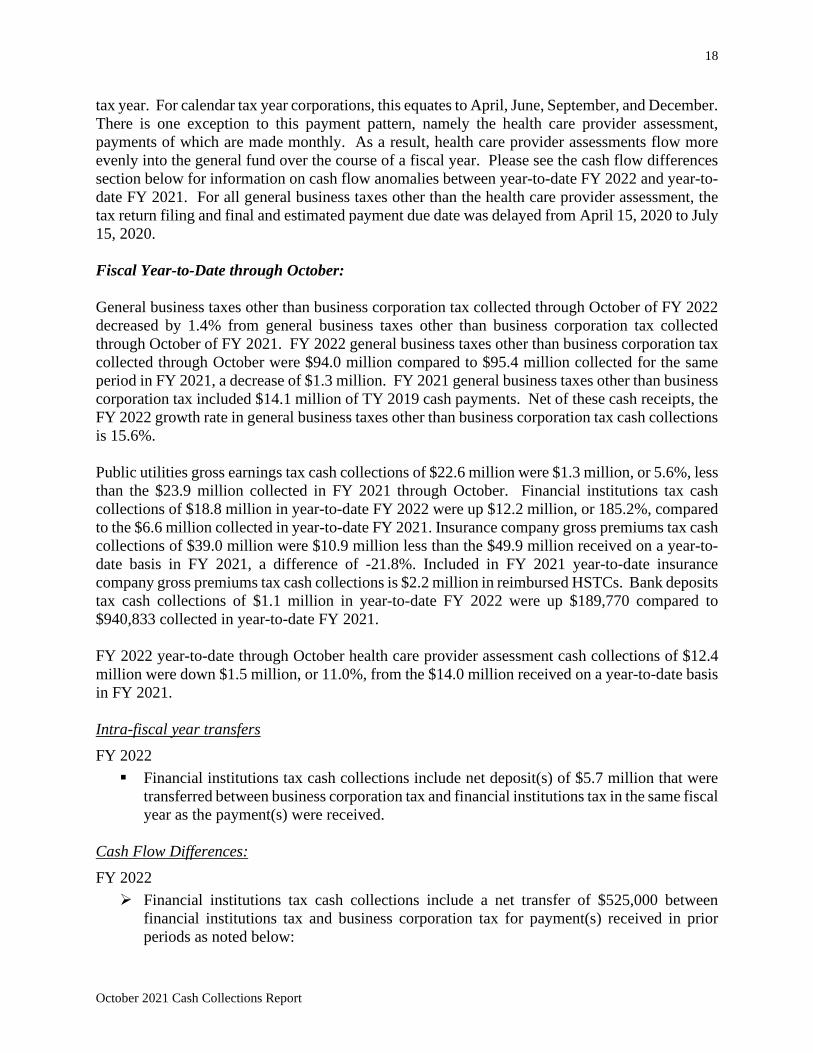
18
October 2021 Cash Collections Report
tax year. For calendar tax year corporations, this equates to April, June, September, and December. There is one exception to this payment pattern, namely the health care provider assessment, payments of which are made monthly. As a result, health care provider assessments flow more evenly into the general fund over the course of a fiscal year. Please see the cash flow differences section below for information on cash flow anomalies between year-to-date FY 2022 and year-to-date FY 2021. For all general business taxes other than the health care provider assessment, the tax return filing and final and estimated payment due date was delayed from April 15, 2020 to July 15, 2020. Fiscal Year-to-Date through October: General business taxes other than business corporation tax collected through October of FY 2022 decreased by 1.4% from general business taxes other than business corporation tax collected through October of FY 2021. FY 2022 general business taxes other than business corporation tax collected through October were $94.0 million compared to $95.4 million collected for the same period in FY 2021, a decrease of $1.3 million. FY 2021 general business taxes other than business corporation tax included $14.1 million of TY 2019 cash payments. Net of these cash receipts, the FY 2022 growth rate in general business taxes other than business corporation tax cash collections is 15.6%. Public utilities gross earnings tax cash collections of $22.6 million were $1.3 million, or 5.6%, less than the $23.9 million collected in FY 2021 through October. Financial institutions tax cash collections of $18.8 million in year-to-date FY 2022 were up $12.2 million, or 185.2%, compared to the $6.6 million collected in year-to-date FY 2021. Insurance company gross premiums tax cash collections of $39.0 million were $10.9 million less than the $49.9 million received on a year-to-date basis in FY 2021, a difference of -21.8%. Included in FY 2021 year-to-date insurance company gross premiums tax cash collections is $2.2 million in reimbursed HSTCs. Bank deposits tax cash collections of $1.1 million in year-to-date FY 2022 were up $189,770 compared to $940,833 collected in year-to-date FY 2021. FY 2022 year-to-date through October health care provider assessment cash collections of $12.4 million were down $1.5 million, or 11.0%, from the $14.0 million received on a year-to-date basis in FY 2021. Intra-fiscal year transfers FY 2022 Financial institutions tax cash collections include net deposit(s) of $5.7 million that were
transferred between business corporation tax and financial institutions tax in the same fiscal year as the payment(s) were received.
Cash Flow Differences: FY 2022 Financial institutions tax cash collections include a net transfer of $525,000 between
financial institutions tax and business corporation tax for payment(s) received in prior periods as noted below:
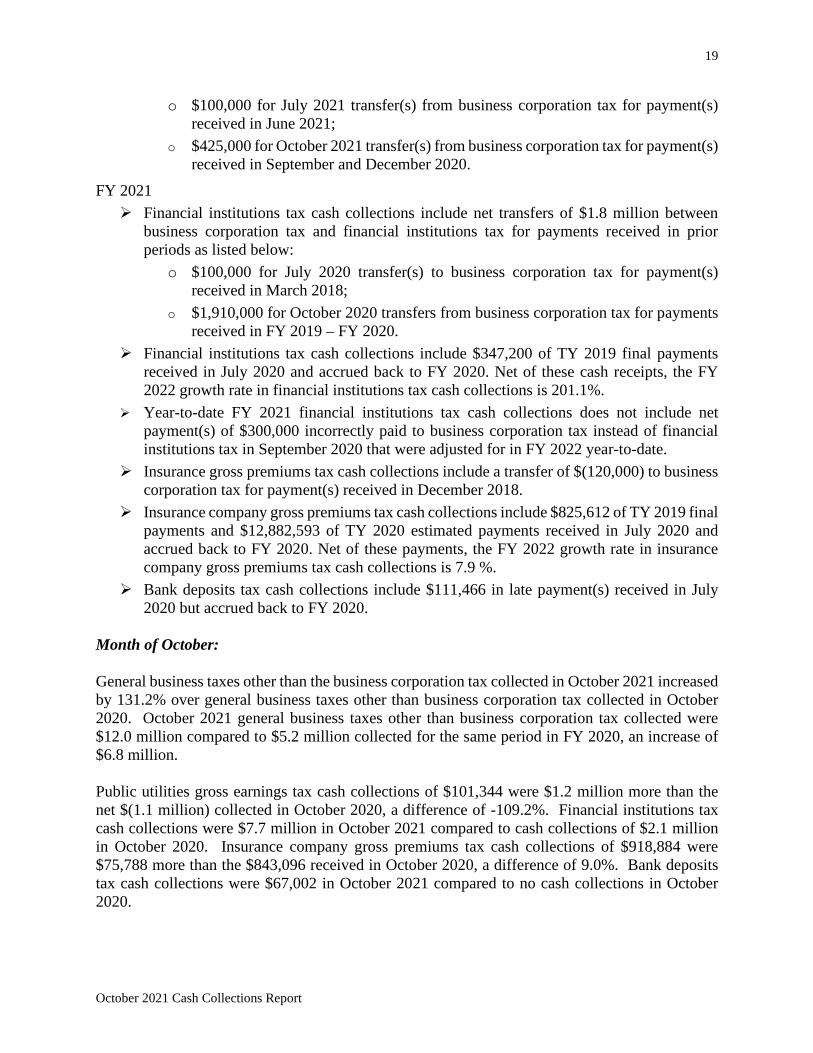
19
October 2021 Cash Collections Report
o $100,000 for July 2021 transfer(s) from business corporation tax for payment(s) received in June 2021;
o $425,000 for October 2021 transfer(s) from business corporation tax for payment(s) received in September and December 2020.
FY 2021 Financial institutions tax cash collections include net transfers of $1.8 million between
business corporation tax and financial institutions tax for payments received in prior periods as listed below:
o $100,000 for July 2020 transfer(s) to business corporation tax for payment(s) received in March 2018;
o $1,910,000 for October 2020 transfers from business corporation tax for payments received in FY 2019 – FY 2020.
Financial institutions tax cash collections include $347,200 of TY 2019 final payments received in July 2020 and accrued back to FY 2020. Net of these cash receipts, the FY 2022 growth rate in financial institutions tax cash collections is 201.1%.
Year-to-date FY 2021 financial institutions tax cash collections does not include net payment(s) of $300,000 incorrectly paid to business corporation tax instead of financial institutions tax in September 2020 that were adjusted for in FY 2022 year-to-date.
Insurance gross premiums tax cash collections include a transfer of $(120,000) to business corporation tax for payment(s) received in December 2018.
Insurance company gross premiums tax cash collections include $825,612 of TY 2019 final payments and $12,882,593 of TY 2020 estimated payments received in July 2020 and accrued back to FY 2020. Net of these payments, the FY 2022 growth rate in insurance company gross premiums tax cash collections is 7.9 %.
Bank deposits tax cash collections include $111,466 in late payment(s) received in July 2020 but accrued back to FY 2020.
Month of October: General business taxes other than the business corporation tax collected in October 2021 increased by 131.2% over general business taxes other than business corporation tax collected in October 2020. October 2021 general business taxes other than business corporation tax collected were $12.0 million compared to $5.2 million collected for the same period in FY 2020, an increase of $6.8 million. Public utilities gross earnings tax cash collections of $101,344 were $1.2 million more than the net $(1.1 million) collected in October 2020, a difference of -109.2%. Financial institutions tax cash collections were $7.7 million in October 2021 compared to cash collections of $2.1 million in October 2020. Insurance company gross premiums tax cash collections of $918,884 were $75,788 more than the $843,096 received in October 2020, a difference of 9.0%. Bank deposits tax cash collections were $67,002 in October 2021 compared to no cash collections in October 2020.
20
October 2021 Cash Collections Report
October 2021 health care provider assessment cash collections decreased $74,622, or 2.2%, on a year-over-year basis. Cash Flow Differences: October 2021 Financial institutions tax cash collections include a transfer of $6,125,000 from business
corporation tax for payment(s) received in FY 2021 – FY 2022. October 2020 Financial institutions tax cash collections include a transfer of $1,910,000 from business
corporation tax for payment(s) received in FY 2019 – FY 2020. Excise Taxes Other than the Sales and Use Tax
October FY 2022 FY 2021 Difference % Change Fiscal YTD $ 61,751,273 $ 63,247,198 $ (1,495,925) -2.4 %
Month $ 13,154,054 $ 14,107,301 $ (953,247) -6.8 % Fiscal Year-to-Date through October: Excise taxes other than sales and use taxes collected in FY 2022 through October decreased 2.4% from excise taxes other than sales and use taxes collected through October of FY 2021. FY 2022 excise taxes other than sales and use taxes collected through October were $61.8 million compared to the $63.2 million collected for the same period last fiscal year, a decrease of $1.5 million. Motor vehicle license and registration fees were $413,765 in FY 2022 through October, which is $89,676, or 27.7%, more than motor vehicle license and registration fees in FY 2021 through October of $324,089. Except for adjustments, motor vehicle license and registration fees include only duplicate license and license update fees. Rhode Island cigarettes tax receipts are comprised of excise taxes collected on the sale of cigarettes and smokeless tobacco (which also includes cigars and pipe tobacco), and a one-time cigarette floor stock tax. The cigarette floor stock tax is imposed only when there is an increase in the excise tax rate on cigarettes. Total cigarette and other tobacco products (OTP) excise tax cash receipts through October of FY 2022 were $53.2 million, down $2.1 million compared to the $55.3 million collected for the same period last fiscal year, a decrease of 3.7%. Included in year-to-date FY 2022 cigarette and OTP excise tax cash collections is $4,971 in cigarette floor stock receipts and $4.0 million of OTP taxes. Year-to-date FY 2021 cigarette and OTP excise tax cash collections include $46 in cigarette floor stock receipts and $4.1 million of OTP taxes. Finally, the change in Rhode Island cigarette sales is determined. Cigarette floor stock tax and OTP tax cash collections are netted out of the cigarettes tax cash receipts data, yielding only cigarette excise tax cash collections. Through October of FY 2022, Rhode Island cigarette sales decreased 3.9% compared to the same period last fiscal year.

21
October 2021 Cash Collections Report
Alcohol excise tax cash collections in FY 2022 through October increased $472,933, or 6.2%, over collections in FY 2021 through October. Cash Flow Differences: FY 2022 Motor vehicle license and registration fees include $112,640 from a June 2021 receivable.
FY 2021 Motor vehicle license and registration fees include $118,760 from a June 2020 receivable.
Month of October: Excise taxes other than sales and use taxes collected in October 2021 decreased 6.8% from excise taxes other than sales and use taxes collected in October 2020. October 2021 excise taxes other than sales and use taxes collected were $13.2 million compared to the $14.1 million collected for the same period last fiscal year, a decrease of $953,247. Motor vehicle license and registration fees were $90,875 in October 2021, which is $29,925, or 49.1%, more than motor vehicle license and registration fees of $60,950 in October 2020. Except for adjustments, motor vehicle license and registration fees include only duplicate license and license update fees. Rhode Island cigarettes tax receipts are comprised of excise taxes collected on the sale of cigarettes and smokeless tobacco (which also includes cigars and pipe tobacco), and a one-time cigarette floor stock tax. The cigarette floor stock tax is imposed only when there is an increase in the excise tax rate on cigarettes. Total cigarette and other tobacco products (OTP) excise tax cash receipts in October 2021 were $10.8 million, down $1.1 million compared to the $11.9 million collected for the same period last fiscal year, a decrease of 9.0%. Included in October 2021 cigarette and OTP excise tax cash collections were $995,713 of OTP taxes. In October 2020, this amount was $971,316 Finally, the change in Rhode Island cigarette sales is determined. Cigarette floor stock tax and OTP tax cash collections are netted out of the cigarettes tax cash receipts data, yielding only cigarette excise tax cash collections. In October 2021, Rhode Island cigarette sales decreased 10.0% compared to the same period last fiscal year. Alcohol excise tax cash collections in October 2021 increased $86,380, or 4.0%, compared to collections in October 2020. Other Taxes
October FY 2022 FY 2021 Difference % Change Fiscal YTD $ 21,250,569 $ 23,115,343 $ (1,864,774) -8.1 %
Month $ 4,683,926 $ 2,641,529 $ 2,042,397 77.3 %

22
October 2021 Cash Collections Report
Fiscal Year-to-Date through October: Other taxes collected in FY 2022 through October decreased 8.1% from other taxes collected through October of FY 2021. FY 2022 other taxes collected through October were $21.3 million compared to the $23.1 million collected in the same period last fiscal year, a decrease of $1.9 million. FY 2022 estate and transfer taxes collected through October were $12.9 million, down $3.7 million compared to the same period in FY 2021, a variance of -22.2%. FY 2022 realty transfer taxes collected through October were $8.2 million, up $1.7 million compared to the same period last fiscal year. Cash Flow Differences: FY 2022 Included in realty transfer tax cash collections is $598,782 of October 2021 real estate
conveyance taxes that will be transferred to the Housing Resources Commission (HRC) in November 2021.
Included in realty transfer tax cash collections is $282,501 in late real estate conveyance tax payment(s) for real estate transactions that occurred in FY 2020 through FY 2021.
Included in realty transfer tax cash collections is $574,257 for late controlling interest realty transfer tax payment(s) received in August 2021 for transactions in FY 2021.
FY 2021 Included in realty transfer tax cash collections is $496,634 of October 2020 real estate
conveyance taxes that were transferred to the Housing Resources Commission (HRC) in November 2020.
Month of October: Other taxes collected in October 2021 increased 77.3% over other taxes collected in October 2020. October 2021 other taxes collected were $4.7 million compared to the $2.6 million collected in the same period last fiscal year, an increase of $2.0 million. October 2021 estate and transfer tax cash collections were $2.9 million, up $1.7 million compared to October 2020, an increase of 139.4%. Realty transfer taxes collected in October 2021 were $1.8 million, up $375,415, or 26.5%, compared to October 2020. Cash Flow Differences: October 2021 Included in realty transfer tax cash collections is $11,138 of funds designated for the
Housing Resources Commission (HRC). This figure is the difference of the following items:
o $587,644 that was transferred to HRC in October 2021 for realty transfer tax activity that occurred in September 2021.
o $598,782 that will be transferred to HRC in November 2021 for realty transfer tax activity that occurred in October 2021.
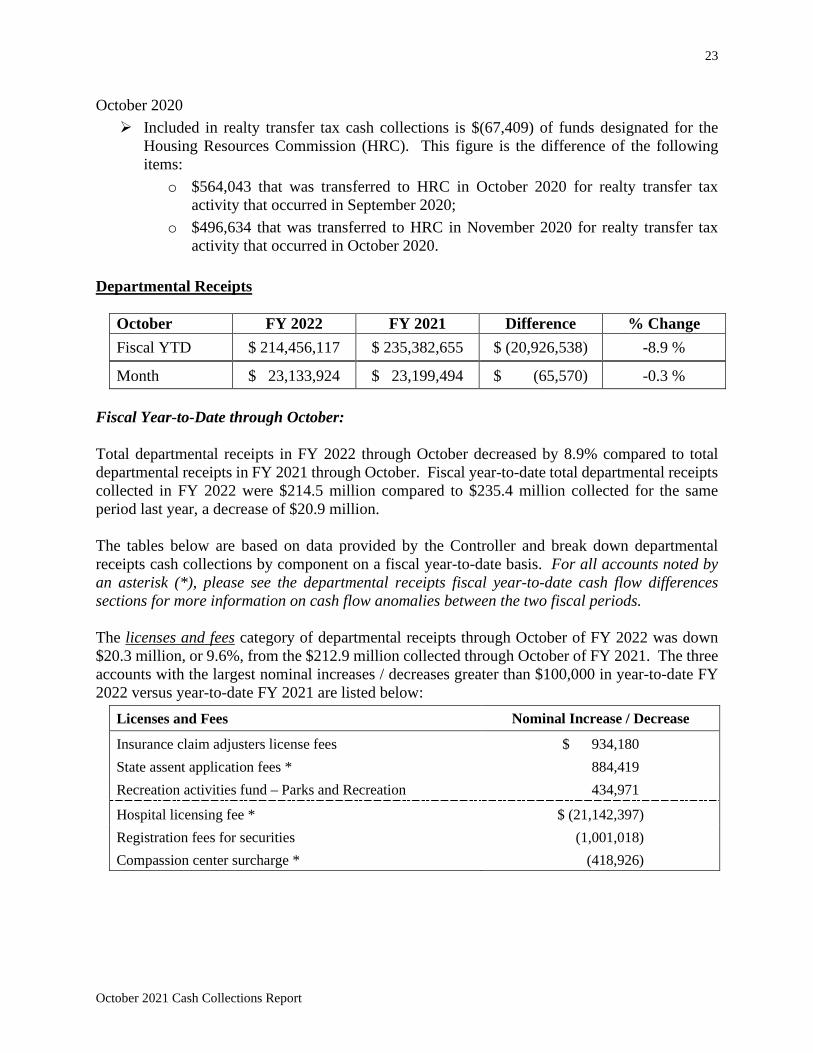
23
October 2021 Cash Collections Report
October 2020 Included in realty transfer tax cash collections is $(67,409) of funds designated for the
Housing Resources Commission (HRC). This figure is the difference of the following items:
o $564,043 that was transferred to HRC in October 2020 for realty transfer tax activity that occurred in September 2020;
o $496,634 that was transferred to HRC in November 2020 for realty transfer tax activity that occurred in October 2020.
Departmental Receipts
October FY 2022 FY 2021 Difference % Change Fiscal YTD $ 214,456,117 $ 235,382,655 $ (20,926,538) -8.9 %
Month $ 23,133,924 $ 23,199,494 $ (65,570) -0.3 % Fiscal Year-to-Date through October: Total departmental receipts in FY 2022 through October decreased by 8.9% compared to total departmental receipts in FY 2021 through October. Fiscal year-to-date total departmental receipts collected in FY 2022 were $214.5 million compared to $235.4 million collected for the same period last year, a decrease of $20.9 million. The tables below are based on data provided by the Controller and break down departmental receipts cash collections by component on a fiscal year-to-date basis. For all accounts noted by an asterisk (*), please see the departmental receipts fiscal year-to-date cash flow differences sections for more information on cash flow anomalies between the two fiscal periods. The licenses and fees category of departmental receipts through October of FY 2022 was down $20.3 million, or 9.6%, from the $212.9 million collected through October of FY 2021. The three accounts with the largest nominal increases / decreases greater than $100,000 in year-to-date FY 2022 versus year-to-date FY 2021 are listed below:
Licenses and Fees Nominal Increase / Decrease
Insurance claim adjusters license fees $ 934,180 State assent application fees * 884,419 Recreation activities fund – Parks and Recreation 434,971
Hospital licensing fee * $ (21,142,397) Registration fees for securities (1,001,018) Compassion center surcharge * (418,926)
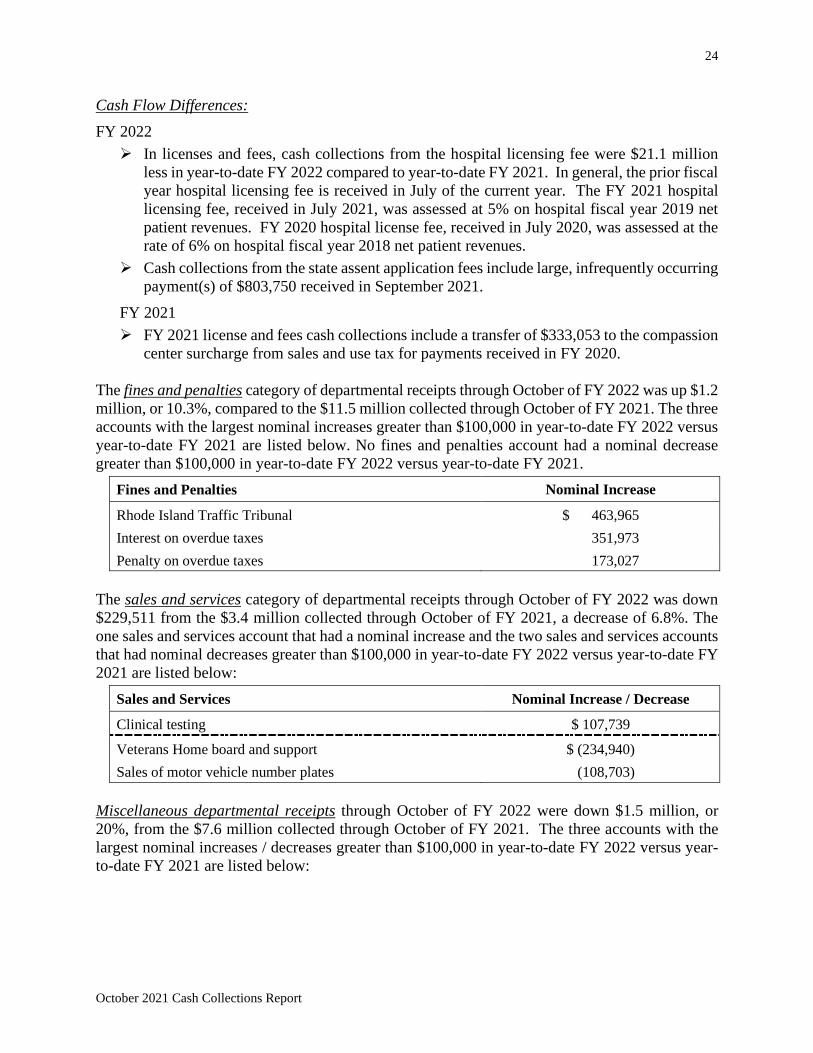
24
October 2021 Cash Collections Report
Cash Flow Differences: FY 2022 In licenses and fees, cash collections from the hospital licensing fee were $21.1 million
less in year-to-date FY 2022 compared to year-to-date FY 2021. In general, the prior fiscal year hospital licensing fee is received in July of the current year. The FY 2021 hospital licensing fee, received in July 2021, was assessed at 5% on hospital fiscal year 2019 net patient revenues. FY 2020 hospital license fee, received in July 2020, was assessed at the rate of 6% on hospital fiscal year 2018 net patient revenues.
Cash collections from the state assent application fees include large, infrequently occurring payment(s) of $803,750 received in September 2021.
FY 2021 FY 2021 license and fees cash collections include a transfer of $333,053 to the compassion
center surcharge from sales and use tax for payments received in FY 2020. The fines and penalties category of departmental receipts through October of FY 2022 was up $1.2 million, or 10.3%, compared to the $11.5 million collected through October of FY 2021. The three accounts with the largest nominal increases greater than $100,000 in year-to-date FY 2022 versus year-to-date FY 2021 are listed below. No fines and penalties account had a nominal decrease greater than $100,000 in year-to-date FY 2022 versus year-to-date FY 2021.
Fines and Penalties Nominal Increase
Rhode Island Traffic Tribunal $ 463,965 Interest on overdue taxes 351,973 Penalty on overdue taxes 173,027
The sales and services category of departmental receipts through October of FY 2022 was down $229,511 from the $3.4 million collected through October of FY 2021, a decrease of 6.8%. The one sales and services account that had a nominal increase and the two sales and services accounts that had nominal decreases greater than $100,000 in year-to-date FY 2022 versus year-to-date FY 2021 are listed below:
Sales and Services Nominal Increase / Decrease
Clinical testing $ 107,739
Veterans Home board and support $ (234,940) Sales of motor vehicle number plates (108,703)
Miscellaneous departmental receipts through October of FY 2022 were down $1.5 million, or 20%, from the $7.6 million collected through October of FY 2021. The three accounts with the largest nominal increases / decreases greater than $100,000 in year-to-date FY 2022 versus year-to-date FY 2021 are listed below:
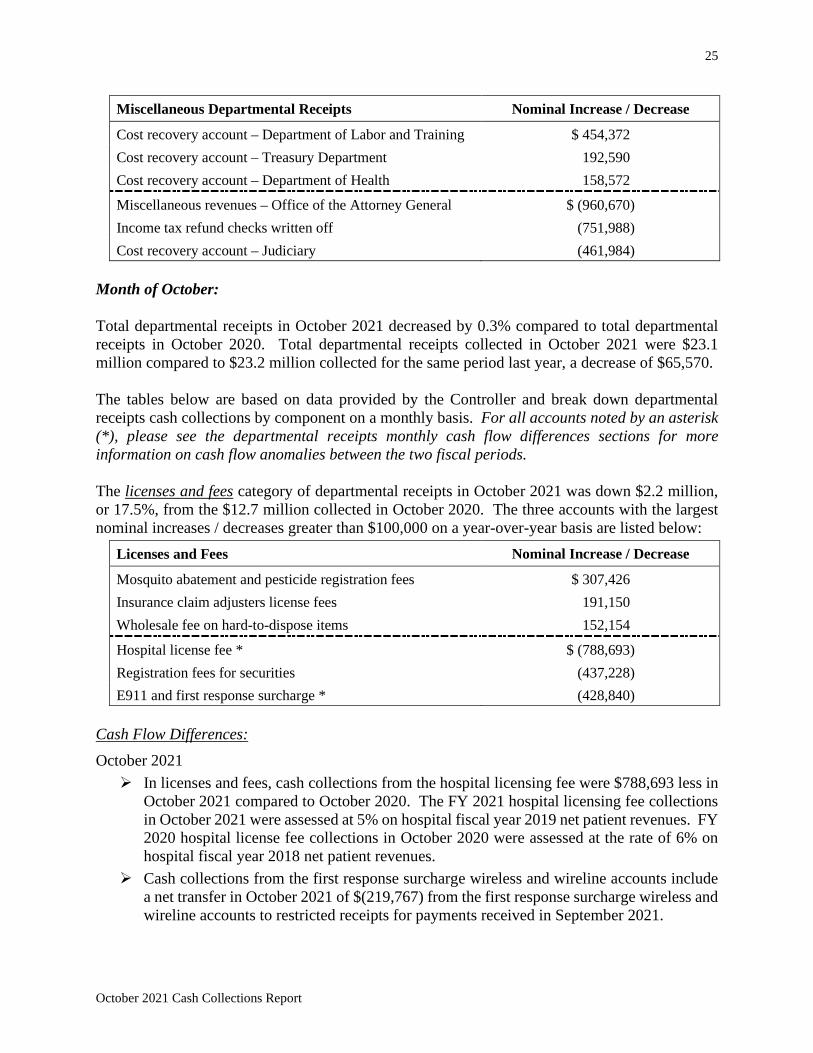
25
October 2021 Cash Collections Report
Miscellaneous Departmental Receipts Nominal Increase / Decrease
Cost recovery account – Department of Labor and Training $ 454,372 Cost recovery account – Treasury Department 192,590 Cost recovery account – Department of Health 158,572
Miscellaneous revenues – Office of the Attorney General $ (960,670) Income tax refund checks written off (751,988) Cost recovery account – Judiciary (461,984)
Month of October: Total departmental receipts in October 2021 decreased by 0.3% compared to total departmental receipts in October 2020. Total departmental receipts collected in October 2021 were $23.1 million compared to $23.2 million collected for the same period last year, a decrease of $65,570. The tables below are based on data provided by the Controller and break down departmental receipts cash collections by component on a monthly basis. For all accounts noted by an asterisk (*), please see the departmental receipts monthly cash flow differences sections for more information on cash flow anomalies between the two fiscal periods. The licenses and fees category of departmental receipts in October 2021 was down $2.2 million, or 17.5%, from the $12.7 million collected in October 2020. The three accounts with the largest nominal increases / decreases greater than $100,000 on a year-over-year basis are listed below:
Licenses and Fees Nominal Increase / Decrease
Mosquito abatement and pesticide registration fees $ 307,426 Insurance claim adjusters license fees 191,150 Wholesale fee on hard-to-dispose items 152,154
Hospital license fee * $ (788,693) Registration fees for securities (437,228) E911 and first response surcharge * (428,840)
Cash Flow Differences: October 2021 In licenses and fees, cash collections from the hospital licensing fee were $788,693 less in
October 2021 compared to October 2020. The FY 2021 hospital licensing fee collections in October 2021 were assessed at 5% on hospital fiscal year 2019 net patient revenues. FY 2020 hospital license fee collections in October 2020 were assessed at the rate of 6% on hospital fiscal year 2018 net patient revenues.
Cash collections from the first response surcharge wireless and wireline accounts include a net transfer in October 2021 of $(219,767) from the first response surcharge wireless and wireline accounts to restricted receipts for payments received in September 2021.
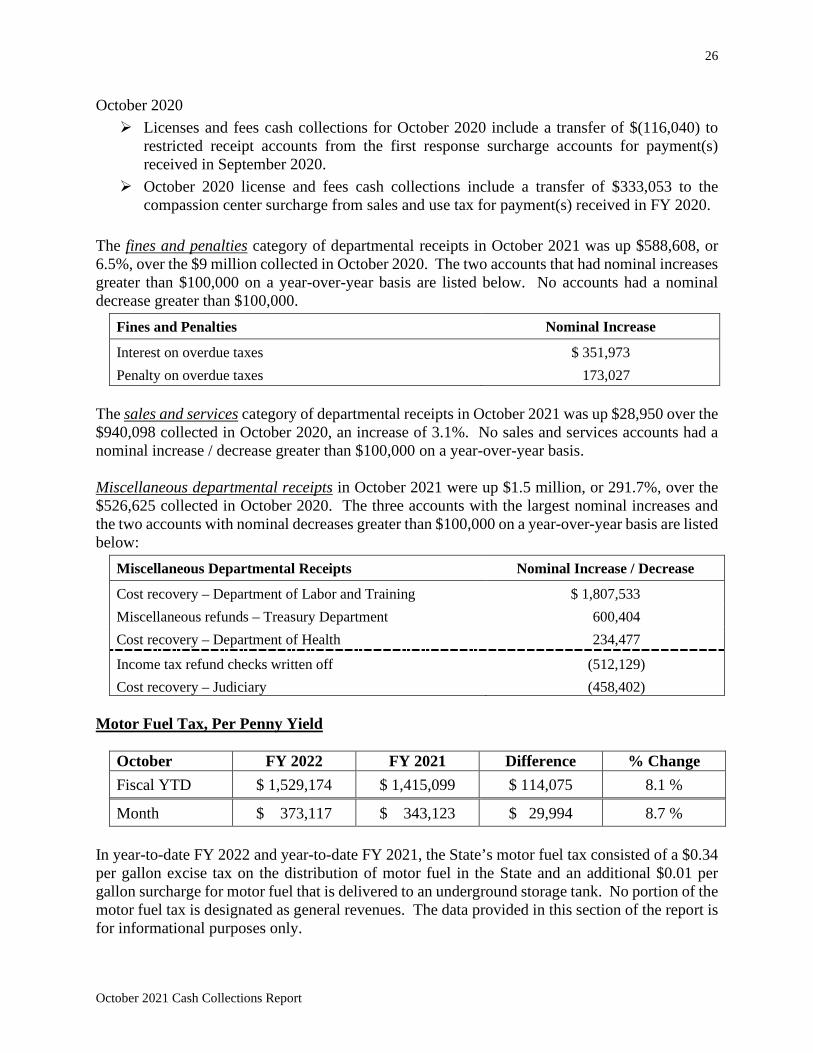
26
October 2021 Cash Collections Report
October 2020 Licenses and fees cash collections for October 2020 include a transfer of $(116,040) to
restricted receipt accounts from the first response surcharge accounts for payment(s) received in September 2020.
October 2020 license and fees cash collections include a transfer of $333,053 to the compassion center surcharge from sales and use tax for payment(s) received in FY 2020.
The fines and penalties category of departmental receipts in October 2021 was up $588,608, or 6.5%, over the $9 million collected in October 2020. The two accounts that had nominal increases greater than $100,000 on a year-over-year basis are listed below. No accounts had a nominal decrease greater than $100,000.
Fines and Penalties Nominal Increase
Interest on overdue taxes $ 351,973 Penalty on overdue taxes 173,027
The sales and services category of departmental receipts in October 2021 was up $28,950 over the $940,098 collected in October 2020, an increase of 3.1%. No sales and services accounts had a nominal increase / decrease greater than $100,000 on a year-over-year basis. Miscellaneous departmental receipts in October 2021 were up $1.5 million, or 291.7%, over the $526,625 collected in October 2020. The three accounts with the largest nominal increases and the two accounts with nominal decreases greater than $100,000 on a year-over-year basis are listed below:
Miscellaneous Departmental Receipts Nominal Increase / Decrease
Cost recovery – Department of Labor and Training $ 1,807,533 Miscellaneous refunds – Treasury Department 600,404 Cost recovery – Department of Health 234,477
Income tax refund checks written off (512,129) Cost recovery – Judiciary (458,402)
Motor Fuel Tax, Per Penny Yield
October FY 2022 FY 2021 Difference % Change Fiscal YTD $ 1,529,174 $ 1,415,099 $ 114,075 8.1 %
Month $ 373,117 $ 343,123 $ 29,994 8.7 % In year-to-date FY 2022 and year-to-date FY 2021, the State’s motor fuel tax consisted of a $0.34 per gallon excise tax on the distribution of motor fuel in the State and an additional $0.01 per gallon surcharge for motor fuel that is delivered to an underground storage tank. No portion of the motor fuel tax is designated as general revenues. The data provided in this section of the report is for informational purposes only.

27
October 2021 Cash Collections Report
Fiscal Year-to-Date through October: The per penny yield of the state’s motor fuel tax collected in FY 2022 through October was $114,075 more than in FY 2021 through October. This represents an increase of 8.1% between the two fiscal year-to-date periods. For FY 2022 through October, the per-penny yield was $1.5 million versus $1.4 million for FY 2021 through October. Month of October: The per penny yield of the state’s motor fuel tax collected in October 2021 was $29,994 more than in October 2020. This represents an increase of 8.7% between the two monthly periods. For October 2021, the per-penny yield was $373,117 versus $343,123 for October 2020. Other General Revenue Sources Other Than Lottery Transfer
October FY 2022 FY 2021 Difference % Change Fiscal YTD $ 1,404,074 $ 1,247,677 $ 156,397 12.5 %
Month $ 1,178,714 $ 1,126,244 $ 52,470 4.7 % Lottery Transfer Cash Collections by Component The tables below are based on data provided by the Division of Lottery and break down the lottery transfer cash collections by component on both a fiscal year-to-date and monthly basis. It should be noted that slight differences may exist between the figures reported by the Division of Lottery and those reported by the Controller due to timing differences in the posting of receipts. Data on lottery transfer cash collections reflect the prior month’s gaming activity. Fiscal Year-to-Date through October (Gaming Activity through September):
Component FY 2022 FY 2021 † Difference % Change
Traditional Games $ 12,028,635 $ 10,567,824 $ 1,460,811 13.8 %
Keno 4,853,874 3,667,391 1,186,483 32.4 %
Remote Sports Betting 2,298,384 876,561 1,421,823 162.2 %
Twin River Casino Hotel
VLTs 56,783,393 36,672,656 20,110,737 54.8 %
On-site Sports Betting 1,356,912 708,313 648,599 91.6 %
Traditional Table Games 2,713,531 935,894 1,777,637 189.9 %
Poker Tables 0 0 0 n/a

28
October 2021 Cash Collections Report
Component FY 2022 FY 2021 † Difference % Change
Tiverton Casino Hotel
VLTs 17,569,176 11,722,354 5,846,822 49.9 %
On-site Sports Betting 745,283 584,227 161,056 27.6 %
Traditional Table Games 318,000 (82,061) 400,061 -487.5 %
† Due to the COVID-19 pandemic, all major sporting events were canceled or postponed on March 11, 2020 and started either a shortened season or a tournament during July and August 2020.
In fiscal year-to-date 2022, Twin River operated an average of 91 traditional table games and no poker tables. In the same period in FY 2021, Twin River operated an average of 69 traditional table games and no poker tables. In fiscal year-to-date 2022 and 2021, Tiverton Casino Hotel operated an average of 32 traditional table games. Twin River Casino Hotel operated an average of 4,063 VLTs in fiscal year-to-date 2022 compared to an average of 2,127 in fiscal year-to-date 2021. Tiverton Casino Hotel operated an average of 1,000 VLTs in FY 2022 through September compared to an average of 515 in the same period in FY 2021. Both Twin River Casino Hotel and Tiverton Casino Hotel VLT cash collections do not reflect unclaimed prizes, distressed communities relief program receipts, or the State’s payment to either Tiverton Casino Hotel’s or Twin River Casino Hotel’s marketing program. Cash Flow Differences: FY 2022
The FY 2022 lottery transfer includes receipts of $3,358,186 received in October 2021 that were accrued back to FY 2021.
FY 2021 The FY 2021 lottery transfer includes receipts of $2,863,337 received in October 2020 that
were accrued back to FY 2020. Month of October (September Gaming Activity):
Component October
2021 October
2020 Difference % Change
Traditional Games $ 4,191,489 $ 3,762,948 $ 428,541 11.4%
Keno 1,604,175 1,275,129 329,046 25.8 %
Remote Sports Betting 1,053,893 426,717 627,176 147.0 %
Twin River Casino Hotel
VLTs 18,098,206 11,971,227 6,126,979 51.2 %
On-site Sports Betting 725,032 415,001 310,031 74.7 %
Traditional Table Games 916,086 368,839 547,247 148.4 %
Poker Tables 0 0 0 n/a