Embed Size (px)
Citation preview

Government TakeDaniel Johnston*
A B S T R A C T
In the far upstream, exploration end of the petroleum industry the concept of ‘government take’ is pervasivein economic discussions of fiscal analysis and design, negotiations and evaluations. This is natural because itdeals with the division of profits which is central to the relationship between international oil companies(IOCs) and governments (Gvts.).
Many IOCs point out that they make their investment decisions on the basis of internal rate of return(IRR) and not on Government Take. This is true. However, from the government point of view these statis-tics figure prominently in fiscal/contract design.
For many years, the science of fiscal system analysis and design focused on exploration economics and thekind of ‘terms’ offered, bid, or negotiated between IOCs and governments. Government Take1 statistics cap-tured much of the economic and financial soul of these agreements.
The statistic has weaknesses and is occasionally criticized, yet it is quoted and used, and misquoted andabused, often.
Most of the weaknesses are well documented,2 as are the criticisms which are often legitimate. However,the fact remains that the concept is entrenched even though Take statistics suffer from both over use and im-proper use when the weaknesses are not considered.
The Government Take statistic is like a barometric pressure reading to meteorologists. The barometerdoes not provide a complete picture, and there are many other things to consider, but no self-respecting fore-caster ignores the barometer.
Such is the case with the Government Take statistic except the concept is not so firmly understood nor isthe terminology so well defined. Unfortunately, the ‘take’ concept and associated statistics are fraught with in-consistency, non-standard terminology, non-standard definitions and controversy.
It is sometimes difficult to tell what the Government Take statistic is referring to when it is used. This isbecause there are different definitions associated with the term in the industry. Also, there are numerous simi-lar, or similar sounding terms that, although often not clearly defined, also apply to the division of revenuesor profits.
For example, to say a contract or system has a Government Take of 60% may or may not mean that ifprofits are generated the government will receive 60% of those profits. Two systems can have a reported 60%
* E-mail: [email protected] Defined terms in this report are capitalized.2 ‘Government Take – Not a Perfect Statistic’ Petroleum Accounting and Financial Management Journal, Summer 2002, Vol. 21, No. 2, pp.
101–108. (See Appendix 3)
VC The Author(s) 2018. Published by Oxford University Press on behalf of the AIPN. All rights reserved.
� 506
Journal of World Energy Law and Business, 2018, 11, 506–540doi: 10.1093/jwelb/jwy028Article

Government Take and yet be considerably different from a structural and economic/financial point of view.Or, the statistic may not even represent the division of profits.
1 . G O V E R N M E N T T A K EGovernment Take statistics are meant to quantify and characterize the government’s share of economic prof-its from the various means by which governments extract rent3 from petroleum operations. There are fourmain means by which a country may benefit financially.
• Bonuses4
• Royalties• Profits-based mechanisms:
• Profit oil sharing• Taxes
• Government Participation (Gvt. Participation or Participation)
Because of diverse design features of bonuses, royalties, sliding scales and other mechanisms, there can bevarious levels of government take for any given system depending on a variety of circumstances. Most stand-ard Government Take statistics are based on a mid-range, representative number that would be the most like-ly outcome of a stable, normal development.
Of the mechanisms mentioned above, Government Participation is somewhat abstract. Some statistics in-clude this element and some do not. So, it is common that two separate statistics are quoted by many ana-lysts. Much of the confusion in the industry, on this topic, starts here.
2 . W H Y T W O T A K E S T A T I S T I C S ?From an exploration point of view, anything that impacts the ultimate value of a discovery is important. Thevalue of a potential discovery is weighed against the odds and the stakes. The risk/reward relationship in thepetroleum industry is one of the most dynamic in the world and the take statistics capture much of the fis-cal/contractual impact on the reward side of the equation. In that context, Government Participation has animpact.
From the point of view of a development engineer (following discovery) the financial impact of ordinaryGovernment Participation is virtually nil. At that point, the investment decision is no more influenced byGovernment-as-partner than it would be with another oil company partner (assuming that the Governmentpays its share on an ongoing basis). Economic results are governed by royalties and profit-based mechanisms,not Government Participation.
The same can be said with respect to the value of reserves in the ground. The value of a company’s pro-duction operations and reserves is not influenced by other parties involved whether they are IOCs or the na-tional oil company (NOC). However, the value is strongly influenced by Government Take (excludingParticipation).
3 . G O V E R N M E N T P A R T I C I P A T I O NThe typical Government Participation structure is where a government-owned entity (typically the NOC)has the right to take up a working interest in an exploration venture if a discovery is made and deemed to be
3 The term rent here is used in the same economic sense as that of Adam Smith (1776) discussed below. Unfortunately, this concept and vari-ous associated definitions also suffer from lack of consensus.
4 Most analysts and databases exclude bonuses because the impact is ordinarily negligible. They are also difficult to factor into a quick-lookcalculation like that shown in Appendix 1.
Government Take � 507

commercial.5 Thus, it is ‘carried’ through the exploration phase and its otherwise working interest share of ex-ploration risk and costs is undertaken by the IOCs (Consortium, or Contractor Group). This element is alsooften referred to as a ‘back-in option’ as in, the NOC has the option to ‘back-in’ and take up an interest atthe commerciality point.
From that point on the NOC would pay its working interest share of costs but it does not reimburse theIOC risk capital associated with the carry in the exploration phase. The IOC will recover those costs out ofnet revenues6 if sufficient revenues are generated.
Typically, the NOC is able to take up to a 20% share although larger percentages do occur. Thus, theGovernment7 will receive 20% of the consortium cash flow8 by virtue of their Participation.
However, a 20% tax could yield 20% of these profits as well, but the difference is that with theParticipation, 20% of development and operating costs are contributed by the NOC. So, while bothParticipation and taxes reduce IOC profits, the 20% Participation has less financial impact on the IOC than atax.
From a financial point of view, depending on production rates, prices, costs and discount rate, a 20%Government Participation may have an equivalent effect on the IOCs IRR to that of a 12% tax or less. Asprofitability increases Government Participation takes on more of the characteristics of a tax. At the margin,assuming costs are zero, a 20% Government Participation has the financial characteristics of a 20% tax.
4 . R O Y A L T I E S A N D E F F E C T I V E R O Y A L T Y R A T EA royalty can be generalized as simply a percentage of gross revenues or gross production (in ‘Cash’ or in‘Kind’). A royalty of 10% means that a government will receive 10% of gross revenues or production. It alsomeans that it will receive 10% of gross revenues in any given accounting period regardless of whether or notany true economic profits have been generated. However, royalties are not the only mechanisms that guaran-tee the Government a share in each and every accounting period.
For example, with sufficient deductions a company can have no taxable income. With sufficient accumu-lated costs a company can be in the same position with the division of profit oil. In those accounting periodsthe government would receive no profit oil or taxes. However, with most production sharing contracts(PSCs) there is a limit to the amount of costs that can be recovered in any given accounting period. Thismeans that there will always be a certain percentage of production subject to profit oil sharing—a guaranteethat the government will get some profit oil each and every accounting period. Therefore, like a royalty, acost recovery limit9 provides a guarantee just as a royalty does. The combination of these two guarantees isthe effective royalty rate (ERR)10—the minimum share of gross revenues (or production) a government willreceive in any given accounting period for a given field or project.
The ERR is an important index that adds dimension to the ‘take’ statistics. It captures much of what isoften referred to as front-end loading and it is based on royalties or royalty-equivalent mechanisms such as acost recovery limit.
In a royalty/tax (R/T)11 system with no cost recovery limit, the royalty is the only government guaranteethat it will receive a share of revenues. Thus, with R/T systems the ERR is the royalty rate. In most R/T sys-tems in any given accounting period there is no limit to the amount of deductions a company may take andcompanies can be in a non-tax-paying position. But this can occur with a PSC as well both with respect to tax
5 There are a million variations on this theme.6 Net revenue is defined as gross revenue less royalty.7 Discussion of the difference between the terms and concepts of Government and State will come later.8 Aside from the cost recoverable exploration expenditures prior to commerciality.9 Also known as: Cost recovery cap, Cost cap, Cost recovery ceiling, capped cost recovery, and less commonly cost stop.
10 When the concept was first introduced it was referred to as “Revenue Protection”. “Index useful for evaluating petroleum fiscal systems”,Oil & Gas Journal, 1 December, 1997. D. Johnston, pp. 49–51.
11 These systems are also referred to as ‘Concessions’ or ‘Licenses’.
508 � Government Take

calculations as well as cost recovery and the division of profit oil. In the early years of production, during thecapital cost recovery phase of the production operations, it is common for the accumulated recoverable costsand tax deductions to be sufficient to totally ‘saturate’ the system and yield no revenues from profits-basedrent extraction mechanisms (ie taxes or profit oil).
There are two main differences between the Take statistics and the ERR statistic. The Take statistics arebased on the division of profits full cycle. The ERR statistic is based on the division of revenues in a singleaccounting period early in the life of a field during the main cost recovery phase following production startup.It is also the ERR that will determine the economic limit of production operations.
Usually, the bulk of exploration and development costs for the full cycle are incurred before productionstartup yet only a portion of the full cycle production is produced in any given accounting period. So, whenproduction begins, the cost recovery pool or the accumulated tax deductions by far outweigh revenues inthese early accounting periods. For a PSC, the cost recovery would be limited and unrecovered costs wouldbe carried forward. Similarly, with a R/T system a tax loss would be carried forward.
5 . B E S T P R A C T I C E S — S U M M A R Y O F K E Y D E F I N I T I O N S : 1 2
The following definitions constitute what appear to be industry best practices, but this is a bold claim consid-ering the lack of consistent use of the terminology associated with this concept. However, these definitions,are precise, logical and most consistent with some of the best-known practitioners in the industry (examplesare provided later in this article).
Economic Profit ($) ¼ Cumulative gross revenues less cumulative costs13 over the life ofa project (full cycle). Also, referred to as Cash Flow.14
Accounting Profits ($) ¼ In any given accounting period various taxes or profit oil splitsmay be based on gross revenues less eligible deductions.
For example, a first layer of tax or profit oil split would likely bebased on gross revenues less royalties less cost recovery or taxdeductions.
Government Participation (%) ¼ or ‘Gvt. Participation’. Any form of working interest or participatinginterest a government-owned entity (typically the NOC) mayhave in the group conducting petroleum operations. It is ordinar-ily assumed to be a ‘carried interest’ during the exploration phase.
Government Take (%)(including Gvt. Participation)
¼ Government receipts from royalties, taxes, production or profitsharing, including Government Participation,15 divided by totalEconomic Profit. This is also sometimes called State Take anddespite the confusing diversity of terms and definitions this termhas some practical and logical appeal but it also has problems(to be discussed).
Government Take (%)(excluding Gvt. Participation)
¼ Gvt. receipts from royalties, taxes, production or profit sharing,excluding Gvt. Participation, divided by total Economic Profit.
12 The associated mathematics is provided in Appendix 1.13 Both capital costs (CAPEX) and operating costs (OPEX).14 Unfortunately, many other terms are used, but these are most common.15 Bonuses are rarely included in these statistics because they ordinarily lack significance (relative to other fiscal elements). They are also
slightly abstract because on the risk side of the risk/reward equation they constitute part of the ‘risk capital’ and are understandably un-popular with IOCs. However, once a discovery is made, sunk costs, have a positive value and bonuses are part of the sunk cost pool.
Government Take � 509

This is the heart of the problem: The term Government Take must be qualified or clarified on thebasis of the treatment of Government Participation. And, unfortunately, the concept goes by manynames and a collection of definitions. These are summarized later in this article.
Effective Royalty Rate (%) ¼ Gvt. minimum share of revenues or production from royalties andprofit oil in any given accounting period. The ERR is a compan-ion of Government Take. It tells how front-end loaded the sys-tem is or ‘how’ the Government gets its share of profits. In thepast it has been referred to as ‘Minimum Government Take’ butthis caused confusion it is now nearly obsolete.
Savings Index ¼ IOC share of cost savings. The complement of this index equalsthe Government share of any savings.
Entitlement Index ¼ IOC lifting entitlement
With a PSC, it equals the IOC share of reserves (entitlement) it isentitled to ‘lift’ and take title to, relative to its individual workinginterest share of cost oil and profit oil. The government entitle-ment is the complement of the IOC entitlement.
With a R/T system, it equals the share of reserves each party isentitled to ‘lift’ ie their working interest share of gross produc-tion less royalty oil.
The number of barrels a company may ‘book’ may or may not bethe same as their entitlement.16
6 . D I V E R S I T Y O F T E R M S A N D D E F I N I T I O N SNeither the terminology nor the definitions above are industry standard. They are close, but true standardsdo not yet exist. If the terms are used, as described above, then they constitute the best practices. They areclear and precise.
Even though the term Government Take is so common, it suffers from a plague of competing terms, dif-ferent definitions and usages. Usually it means division of profits, sometimes discounted, sometimes not.Sometimes it includes Government Participation, sometimes not. Sometimes it represents the division of rev-enues (not profits). Sometimes the take statistic is based on a single accounting period, not full cycle.
Meteorologists and petroleum engineers do not have this problem. These sciences are much more com-plex but they are older, and the concepts, formulas and lexicon are more highly evolved, uniform andstandardized.
Unfortunately, the term Government Take has evolved to represent a family group of statistics that some-times bear more or less resemblance to each other. The list is too large. It needs work.
The following collection of terms and definitions, illustrates the reasons why the entire subject can be con-fusing and frustrating. Furthermore, it is clear that there has not been much resolution of the problems in thepast 50 years. When parties need to discuss the subject these days, they must first define terms and then agreeon which terminology and definition to use.
16 Booking barrels is important to IOCs. It is the focus of their reserve disclosure requirements to shareholders. The 85% statistic prevailedeven though the actual ‘take’ was closer to 86–87% depending on production timing and project profitability which effected the domesticmarket obligation mechanism. Most analysts were aware of this but were comfortable using the handy easy-to-calculate 85% statistic.
510 � Government Take

7 . M O V I N G F O R W A R DHopefully, evolution will chart a natural and logical course and practitioners in our industry will get on thesame page. There has been some progress but it has been tortuously slow. What is suggested as BestPractices, mentioned above, is not extensively practiced. They are the most common but not by a wide mar-gin and there is lots of competition. The following chronological collection of terms and definitions illustratesthe lack of consensus and progress is not easy to discern.
8 . I N D U S T R Y D E F I N I T I O N S ( E m p h a s i s a d d e d b e l o w )
(1) Adam Smith—The Wealth of Nations (1776)
‘Rent’.
‘In coal-mines a fifth of the gross produce is a very great rent; a tenth the common rent, and it is sel-dom a rent certain, but depends upon the occasional variations in the produce.’ Page 228–29
‘A sixth part of the gross produce may be reckoned the average rent of the tin mines in Cornwall, themost fertile that are known in the world, . . ..’ Page 230
A Smith, The Wealth of Nations (First published 1776; Bantam Classics, New York 2003) 229
While such terms as ‘Government Take’ or ‘State Take’ had not yet evolved, the concept was alive,and back then, just as now, a statistic (%) provided insight into the relationship between landlord andtenant. The terms described here are the equivalent of a PSC in the purest sense. Also, ‘a fifth of thegross produce’ (20%) could also be viewed as a royalty. If production costs amount to the equivalentof 40% of production, the landlord ‘Take’ would be 33.3% [20%/(100% � 40%)]. The mathematicsof Government Take are outlined in Appendix 1.
Notice, he does not use the term ‘rents’ (plural), nor does he speak of a ‘share of rent’. This may bereading too much into this 242-year-old statement but all of these terms/contexts are found in theexamples below. The concept of rent has many of the same problems as that of Government Take.
(2) Indonesia (1970s)‘Equity Split’ ‘After-tax Equity Split’.
Indonesian PSAs of the late 1970s and the 1980s provide a good example of the beginnings of the science offiscal/contractual system design. Indonesia’s ‘Government Take’ (for oil), often rated at 85% during thoseyears, was well known in the industry. For years, it was one of the most widely quoted statistics in the inter-national industry.
But the term ‘Government Take’ was not used until later. These were some of the harshest terms in theworld at that time, yet investment activity was still robust. There were aspects of the investment environment,both geotechnical and contractual, not captured by the Government Take statistic (See Appendices 4 and 5).They made a significant difference that offset the otherwise harsh 85% Take. This is a tribute to the fact thattake statistics cannot stand alone. They have weaknesses (see Appendix 3) and they need context.
Indonesia’s PSCs in the late 1960s allowed the IOCs to recover their costs out of production and whatwas left over was ‘shared’. The IOC share was commonly referred to as ‘equity oil’ and originally it was ‘split’or ‘shared’ 65/35% in favour of the government. After the first OPEC oil embargo the government increased
Government Take � 511

its share to 85% thus the ‘equity split’ was now 85/15%. It was also around this time that the ‘share oil’ beganto be referred to as ‘profit oil’. With no royalties or taxes the 85/15% profit oil split represented the divisionof profits ie Government Take.12
Subsequently, in order to satisfy double taxation issues with US companies the Indonesian governmentmade another change. Government share of profit oil, or equity oil, was reduced to 65.0909% and the IOCshare was increased to 34.0909% but the government also subjected the IOC share to two layers of tax (45%and 20%) which resulted in an effective tax rate of 56%. The IOC after-tax share was 15%, as before. But, theIndonesian government and IOC shares of ‘equity oil’ no longer represented the division of profits. Becauseof this, the term ‘after-tax equity split’ came into use. The term was awkward and only appropriate inIndonesian PSCs or other PSCs with no royalty or Government Participation. Use of this terminology fadedand by the mid 1980s it had all but disappeared and was replaced by the Government Take terminology.
(3) Industry Discussions and Debates (1980s)During the early 1980s and with some help from the World Bank a lot of governments began opening theirdoors to foreign investment in their petroleum sector. Most of these countries chose a PSC structure andincluded a Government Participation element. This provoked discussions and debates about the true natureof the Government Participation element. The following examples show that unfortunately, after all theseyears, the debates are still warm.
(4) A. Kemp, University of Aberdeen (1987)‘Government Takes’ ‘share of rent’.
‘government takes at different discount rates are expressed as percentages of the gross economic rents,which are defined as the pre-tax net present values at the different discount rates. Sometimes takes arediscussed in money-of-the-day terms to elucidate the behavior of a particular system. These takes areexpressed as a percentage of the resources generated from the project in question, which means thetotal revenues minus total costs.’
Petroleum Rent Collection Around the World, Kemp, A. G., (with Postscript by Campbell Watkins) TheInstitute for Research on Public Policy, 1987, Canada (Chapter 6).
The context of this definition is that ‘gross economic rents’ are viewed as the equivalent of total profit(‘total profit minus total costs’) ‘discounted at various discount rates’. This is only one of three mainviews of what actually constitutes ‘rent’ and this is one of the examples that refers to rents (plural).
(5) D. Johnston (1994)‘Government take’
‘Government take (%) ¼ Government income � operating incomeGovernment income ($) ¼ All government receipts from royalties, taxes, bonuses,production, or profit sharing, etc.Operating income ($) ¼ Cumulative gross revenues minus cumulative grosscosts over life of the project.Government Take. The total government share of profit oil or revenues not associated with cost recov-ery. Same as government after-tax equity split and government marginal take.’
512 � Government Take

D Johnston, International Petroleum Fiscal Systems and PSCs (PennWell Books, Tulsa, OK 1994).
Some of the terms here have not survived, as mentioned above.
Note too, that the term ‘Government after-tax equity split’ and ‘Government Marginal Take’ here aredefined as being the same thing which was only appropriate in Indonesia because of the system struc-ture. It was neither regressive nor progressive as long as the, relatively modest domestic market obliga-tion (DMO) was ignored.17 Notice too that there is no mention of Government Participation. It isnot clear. The author was not explicit. In today’s world, it should be explicitly defined as either includ-ing or excluding the Government Participation.
(6) A. Kemp, University of Aberdeen ‘Tax take’ (1995)‘Tax Take’.
‘The model then applies the petroleum fiscal system applicable in each country and calculates the taxand post-tax returns having taken account of all allowances and liabilities in MOD terms. The returnsare then converted into real terms to give the NPVs at various discount rates. To facilitate comparisonsthe model calculates the tax takes, i.e. the field lifetime tax bill as a percentage of the pre-tax cash flow, inMOD and real present value terms. The latter calculation shows the present value of the tax bill as apercentage of the pre-tax NPV. This is a practical measure of the share of economic rents collected bythe fiscal system.’ (page 2)
A.G. Kemp, D. Rose and L. Stephen, ‘Petroleum Investment and Taxation: The North Sea and the Far East’(North Sea Study Occasional Paper, n 49) (University of Dundee, Department of Economics, January 1995).
Here it is assumed that the term ‘tax takes’ is the same as Government Take without GovernmentParticipation. This is based on the assumption that ‘tax takes’ includes royalties and other mechanisms(like profit oil split). This is consistent with later work by the authors. Use of the term takes (plural)is a rare use of the term. They also refer to ‘rents’ plural.
(7) R. Sellers (1995)‘Host Country Take’ (HCT).
Host Country Take
Revenues less Costs� 100 ¼ Host Country Take ð%Þ
‘Host Country Take can be calculated in discounted terms as well as the undiscounted values . . .– Where the discounted HCT is very much greater than the undiscounted measure, it indicates thatthe fiscal regime gives an inequitable share of the front-end profits to the State’.
R Sellers, The Economic Analysis of International Petroleum Ventures (Abridge, 1995).
17 The DMO required the contractor to sell a certain percentage of its profit oil to the government at a discount.
Government Take � 513

In the formula, the numerator ‘Host Country Take’ and the denominator are denominated in terms of dol-lars and dollars divided by dollars yields a Host Country Take in percent (%). It is not clear if the defin-ition includes Government Participation but the context and usage in the book indicates that it is included.
This terminology is unique and not specific about Government Participation, but the definition isrecognizable.
(8) Petroconsultants SA (1995)‘State Take and Government Take’.
‘State Take’
This figure expresses the total State cashflow—the sum of all royalties, taxes, and state profit share, plusthe cashflow attributable to any direct participation—as a percentage of the Gross Project cashflow. Boththe total State cashflow and the Gross Project cashflow are calculated on an undiscounted basis.’
‘Government Take’
This figure is similar to State Take, but excludes any cashflow from the State’s direct participation inter-est. This cashflow is expressed as a percentage of the Gross Project cashflow, reduced by the level ofdirect State participation.’
Petroconsultants (U.K.) Ltd, Acreage Laws & Tax - Review of Petroleum Fiscal Regimes (RFR) (London UK, 1995) 2
Here a clear distinction is made on the basis of whether or not Government Participation is includedin the definition/calculation although they refer to it three different ways; ‘direct participation’, ‘State’sdirect participation interest’ and ‘direct State participation’.
Petroconsultant’s definition of Government Take does not include Government Participation. StateTake includes Government Participation. Their treatment is among the clearest and most precise of allthe definitions of this peer group.
However, there is an unfortunate, yet important source of confusion with their choice of terms. Mostinterpreters use the same word for both Government and State.18 Even if they make a distinction,these terms invariably provoke a difficult discussion of what the difference is between State andGovernment and why this distinction is made. This causes problems and for this reason there hasbeen some reluctance in the industry by others to use this terminology.
(9) D. Johnston (1997)‘Revenue Protection’.
‘Revenue Protection is the minimum share of gross revenues a government (combination of NOC, tax-ing authorities etc.) will get in any given accounting period for a given development.’
18 Explaining that Government is to the State as Management is to the Company does little to help explain the difference in terms of divisionof profits and it is likely to inspire further discussion or debate.
514 � Government Take

‘D Johnston, ’Enhancing Contract Analysis’ (1997) Petromin Magazine, Singapore 22-24Also: ‘Index useful for evaluating petroleum fiscal systems’ (1997) Oil and Gas Journal 49-51.
When the concept of an effective royalty rate was first developed, it was referred to as RevenueProtection, a terminology that did not find traction. Johnston later changed the name to ERR. TheERR terminology was more descriptive and yet it still took 20 years to catch on. By 2017 WoodMackenzie abandoned the ‘Minimum Government Take’ terminology (for this same concept) andadopted the ERR terminology.
(10) Petroconsultants (1998)‘State Take’ and ‘After Take’.
‘State Take is the state’s total cash flow, including any direct financial participation, expressed as a per-centage of the undiscounted Gross Project cash flow (gross revenues less gross costs).’
‘Gross Project means before any state participation and/or fiscal imposition and After Take means afterany state participation and/or fiscal imposition.’
Petroconsultants (U.K.) Ltd, Acreage Laws & Tax - Review of Petroleum Fiscal Regimes (RFR) (London UK,1998) 2
This edition of the RFR appears to have abandoned use of the Government Take statistic and focusedon State take where they explicitly point out, as before, the inclusion of ‘state participation’ (whichthey also referred to as ‘direct financial participation’ previously).
Petroconsultants was acquired in the mid 1990s by Information Handling Services (IHS), later IHSCERA. Their unusual ‘After Take’ term is the equivalent of economic profits but they do make thisclear. However, this use of the ‘After Take’ terminology is awkward and very uncommon. It has all butdisappeared.
(11) University of Aberdeen (1998)‘Tax Take’.
Chart 2, Page 3 Development Economics: 100 MMBBLS FieldOil Price $18 Per Barrel—Higher Development Costs
‘Tax Take @10% StatisticsMean 0.33Median 0.30Mode 0.30’
A. G. Kemp and K. Masson North Sea Study Occasional Paper No. 69 October 1998.Oil and Gas Exploration and Development in the UKCS: A Monte Carlo Analysis of the Risks and
Returns.
Government Take � 515

Translated, this represents a Mean Tax Take of 33% discounted at 10%. What they refer to here as‘Tax Take’ is similar to Government Take excluding Government Participation.
Terminology U. of Aberdeen Treatment of ParticipationTax Take ¼ Excluded
Government Take ¼ Included
The Tax Take here is equivalent to what Petroconsultants referred to as Government Take.
(12) Rapp, W.J., B.L. Litvak, G.P. Kokolis, and B. Wang (1999)‘Government Take’ ‘Discounted Government Take’.
‘Government Take is commonly defined as the percentage of all payments to Governments, over thelife of a project, as a portion of the cash flows that remain after all project capital investment and oper-ating costs have been paid. Examples of payments to Governments are: income taxes, royalties, profitpetroleum share, bonus payments, value-added taxes, excise taxes, excess profits taxes, remittance taxes,state oil company carries, import duties, etc.
- -
There can be significant differences between Discounted Government Take and Government Take, and thatas a result, the relative attractiveness of countries’ fiscal regimes can be quite different when ranked based onusing the more economically sound Discounted Government Take than when comparison is made onGovernment Take. In addition, it will be shown that the difference between Government Take andDiscounted Government Take can be used to measure the degree of front-end loading of Government Take.’
‘Utilizing discounted government take analysis for comparison of international oil and gas E&P fiscalregimes.’ Proceedings of the Society of Petroleum Engineers Hydrocarbon Economics and Evaluation Symposium,Dallas, TX, March 20–23. Society of Petroleum Engineers Paper 52958.
The definition of Government Take here explicitly includes Government Participation but refers to itas ‘state oil company carry’ which is clear and precise but unique terminology. It is also referred to asa ‘carried interest’, which is common terminology. And, although there are many variations on thistheme, it is normally assumed the ‘carry’ extends to the commerciality point. Some carries, thoughrare, go beyond this with the IOCs funding the NOC development costs as well.
This article promoted the superiority of discounted Government Take v undiscounted GovernmentTake and there is virtually universal agreement on this point.
However, discounted Government Take requires discounted cash flow (DCF) analysis with all therequisite assumptions and estimates. In contrast, it is relatively simple to calculate undiscountedGovernment Take even without a computer.
The article also introduced an interesting analytical technique measuring and comparing front-endloading of various systems as a function of the difference between discounted and undiscounted Gvt.Take. This measure almost always correlates directly with the ERR statistic which is also relatively easyto calculate without performing discounted cash flow analysis.
516 � Government Take

(13) Wood Mackenzie May (2000)‘Maximum Government Take and Minimum Government Take’.
Wood Mackenzie, OLF Conference, Presentation (May 2000).
The term Minimum Government Take here represents the minimum share of revenues (or produc-tion) an IOC will receive in any given accounting period. This is the same as ERR governed by royal-ties and cost recovery limits in conjunction with a profit oil split. Notice the Minimum GovernmentTake here for Norway and the UK is 0% as neither system had a royalty.
Minimum Take statistics in Brazil and the USA correspond directly to the royalty rates in those coun-tries. This is fully consistent with the concept except that the ERR statistic really deals with, the div-ision of revenues or production, not profits.
The ERR and the Wood Mackenzie Minimum Government Take represent the absolute minimumshare of revenues the government would ever receive regardless of whether or not true economic prof-its are ever generated.
Government Take %
Gvt. Take 50 MMBBLS Gvt. Take 500 MMBBLS Max. Gvt. Take (%) (1)
UK 30.5 30 30US 39 50 43.1Brazil 50 52.5 63.8Azerbaijan 61.5 66 90.0Angola 81 67.5 92.5Norway 71 70 78.0Iran 75 81 NA
Adapted from page 4 and the Graph on page 7.(1) From Page 4’
‘Summary of Main Fiscal Terms’.
ContractType
Min. Govt.Take (%)
Max. Govt.Take (%)
Ring-Fencing NegotiableTerms
StateParticip.
Angola PSC 31.25 92.5 Yes Yes YesAzerbaijan PSC 22.5 90.0 Yes Yes YesBrazil Concession 9-10 63.8 Partial No NoIran Service 30.0 NA Yes Yes YesNorway Concession 0 78.0 No No YesUK Concession 0 30.0 No No NoUS GoM Concession 12.5 43.1 No No No
Wood Mackenzie, OLF Conference, Presentation – May 2000, page 4
Government Take � 517
The second graph (Government Take %) shows Government Take for two different field sizes, 50MMBBLS and 500 MMBBLS.
Here they use the term ‘State Participation’ instead of Government Participation but it is unlikely thatthey are referring to something other than ordinary Gvt. Participation. Their Maximum Gvt. Take sta-tistics are confusing.
The USA 43.1% Take appears to correspond exactly to a Marginal Gvt. Take based on a 12.5% royaltyand the 35% corporate income tax at that time. Norway and the UK statistics are also equal toMarginal Government Take. However, because they have no royalties or any royalty-equivalent mecha-nisms these statistics (78% and 30% respectively) represent almost all variations of costs and prices.Marginal Government Take is based on the assumption that there are no associated costs. With this inmind the Maximum Government Take statistics for Azerbaijan and Angola appear to be inordinatelyhigh, compared to an ordinary Government Take statistic. Based on the information available it is notcertain.
The term ‘Maximum Government Take’ never was used extensively and has virtually disappeared.
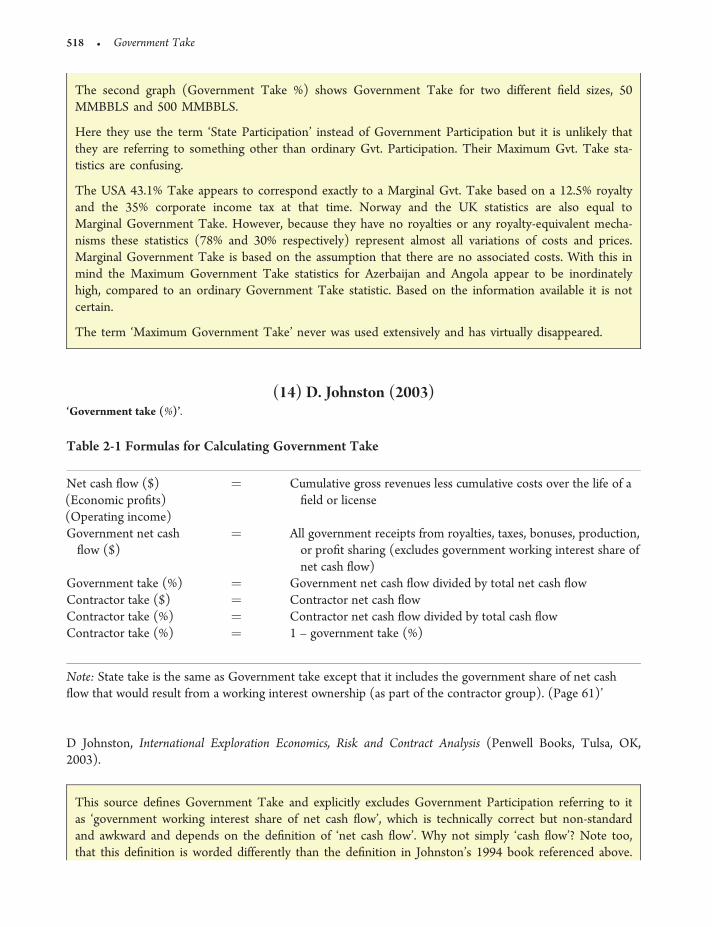
(14) D. Johnston (2003)‘Government take (%)’.
D Johnston, International Exploration Economics, Risk and Contract Analysis (Penwell Books, Tulsa, OK,2003).
This source defines Government Take and explicitly excludes Government Participation referring to itas ‘government working interest share of net cash flow’, which is technically correct but non-standardand awkward and depends on the definition of ‘net cash flow’. Why not simply ‘cash flow’? Note too,that this definition is worded differently than the definition in Johnston’s 1994 book referenced above.
Table 2-1 Formulas for Calculating Government Take
Net cash flow ($)(Economic profits)(Operating income)
¼ Cumulative gross revenues less cumulative costs over the life of afield or license
Government net cashflow ($)
¼ All government receipts from royalties, taxes, bonuses, production,or profit sharing (excludes government working interest share ofnet cash flow)
Government take (%) ¼ Government net cash flow divided by total net cash flowContractor take ($) ¼ Contractor net cash flowContractor take (%) ¼ Contractor net cash flow divided by total cash flowContractor take (%) ¼ 1 – government take (%)
Note: State take is the same as Government take except that it includes the government share of net cashflow that would result from a working interest ownership (as part of the contractor group). (Page 61)’
518 � Government Take

A literal interpretation of the 1994 reference would imply that Government Participation is notincluded but it is not explicit.
(15) Institut Francais du Petrole (2004)‘Government Take’.
‘Government take - The total revenues accruing to the government including the earnings of the na-tional oil company. It can be expressed as a percentage of the economic rent, and measures the severity(from the investor’s point of view) of the fiscal regime.’
Institut FranCais Du Petrole Publications, Oil and Gas Exploration and Production - Reserves, Costs, Contracts(Paris, Francis: Editions Technip 2004) 298
Note here, the Government Take statistic is specific about including Government Participation. However,it literally refers to revenues and not a percentage or share of profits. However, it is described as being a‘percentage of economic rent’. It appears that the only logical assumption is that economic rent is equalto all economic profits. Not everybody agrees with this or what actually constitutes true rent.
As the definition of ‘Government Take’ here includes Government Participation it is the same as theterm ‘State Take’ found in some other sources. The terms ‘Government take’ and ‘State take’ in thisarticle appear to be used interchangeably on page 209 (not quoted here).
(16) International Monetary Fund (2005)Government ‘Take’.
‘Because of the complexity of country-specific fiscal regimes, a common analytical technique applied toPSCs and other arrangements is to prepare a summary estimate of the projected overall division of rentsbetween company and government resulting from all instruments. This is often referred to as the govern-ment “take” (See Johnston 2004, and Kumar 1995). Effectively, the estimation collapses all of the rent ex-traction mechanisms into the equivalent of a single cashflow-based tax taken over the life of the project.’
International Monetary Fund, ‘Guide on Resource Revenue Transparency’ (2005) 25, box 2, para 1
Notice the terms Government Take or State Take are not used here—not as specifically and formallyas many other usages in the literature. Also, the definition is not absolutely clear on the GovernmentParticipation issue unless the definition is taken literally ie ‘all instruments’.
(17) IHS Energy (2005)‘State Take’.
‘State Take by Region 2004 v. 1999’‘Deepwater Incentives’ Graph (Slide 12) showing State Take for:
Government Take � 519

• On & Off-shore 76%• Deepwater 62%• Rate Reduction 14%
IHS Energy, I. Agalliu, Petroleum Industry Dynamics: Regulatory and Fiscal Terms, 2005.
In this Power Point presentation slide 10 shows pie charts that define State Take as a ‘Share ofRevenues’. Slide 11 shows how State Take has changed by Region (2004 v. 1999) but the values onthis Slide and on Slide 12 appear to correspond to division of profits not revenues. However, while nodefinitions are provided, the statistics in slides 11 and 12 appear to be based on the division of profitsand they appear to have included Government Participation.
(18) Chad’s ‘Take’ in Comparison to Other African Oil Producers (2005)‘Mean Estimated Oil Value Retained’.
‘Percentage of mean estimated oil value retained by African governments
Nigeria 80%
Gabon 75%
Cameroon 75%
Congo-Brazzaville 66%
Angola 60%
Equatorial Guinea 60%
Chad 28%’Adapted from a graph on page 39.
PFC Energy, “Africa Policy Advisory Panel: West Africa Petroleum Sector: Oil Value Forecast andDistribution’ (March 2004) in I Gary and N Reisch, ‘Chad’s Oil: Miracle or Mirage?’ Catholic Relief Servicesand Bank Information Centre (February 2005) 39
It is not clear if the information from the Graph is based on profits, or gross revenues or production.There is no definition but the values do not appear to include Government Participation. The 28%take for Chad was ‘production’ split in the early years of the Doba Field production—the informationsupporting that number came from a World Bank report. The 28% could simply be an ERR. Clarity islacking but the 28% statistic looks like a banana in bowl full of apples.
(19) BP Presentation on Alaska’s Proposed Petroleum Profits Tax (PPT) (2006)‘Government Take’.
‘Government Take ¼ Total Taxes
ðTotal Taxes þ Industry ProfitÞ’
Alaska State Legislature, House and Senate Resources Committees, ‘Raymond Hall Slides [2006-02-28 BPTestimony - Global Perspective’ (28 February 2006) 13
520 � Government Take

Here, based on the presentation, it was clear that the term ‘Taxes’ was meant to include royalties, butit is not clear on the issue of Government Participation for the various countries in the peer group.However, the calculations and resulting statistics conform to what is most commonly referred to asMarginal Government Take (not Government Take-with or without Government Participation) anddid not include Government Participation. Marginal Government Take, by definition, does not includeGovernment Participation.
(20) ECOS European Coalition on Oil in Sudan Fact Sheet II (2007)‘Marginal Government Take’.
‘Typical marginal government take in Sudan from US$100 million of gross revenues from a 100,000þ b/dfield’.
Gross revenues 100Cost Oil limit 40Company cost recovery 15Excess Cost Oil to Government 25Profit Oil pool 60Company % Profit Oil (20%) 12Government % Profit Oil (80%) 48Total Company take 27Marginal Government take 73’
Sudan Production EOCS Factsheet, ‘The Economy of Sudan’s Oil Industry’ (October 2007)<http://ecosonline.org>
This kind of system in Sudan, which is quite rare, is not as easy to analyse, as most countries are, be-cause it has a provision where excess cost oil (40% � 15% ¼ 25% in this example) goes directly tothe Gvt. However, this calculation assumes that there will be 25% excess cost oil in each accountingperiod. However, in the early years of production, during the main Capital Cost Recovery Phase ofthe contract, there would presumably be no excess cost oil because the system would be saturated.
The government receives 86% of the profits based on the assumptions outlined above (ie assumingcosts equal to 15% of Gross Revenues).
Total Profits ¼ (100% Gross Revenues – 15% Costs) ¼ 85% of Gross Revenues
Government Take¼ 86% (73%/85%).
Company Take ¼ 14% (12%/85%)
It is uncertain how the Marginal Government take of 73% is arrived at.
Assuming there are no costs, which would be consistent with the definition of Marginal GovernmentTake, then all of the cost oil (40%) is ‘excess’ Cost Oil. This goes to the Gvt. and the remaining 60%
Government Take � 521

profit oil is divided 80/20% in favour of the Government. This yields a Marginal Government Take of88%—not 73% [40% cost oil þ 48% profit oil].
(21) Report of the Alberta Royalty Review Panel (2007)‘Total Government Take’.
‘Total government take includes royalties, taxes and fees . . . .’
‘Total take’ is oil industry jargon. ‘Economic rent is economist jargon . . . .’
Report of the Alberta Royalty Review Panel, ‘OUP Fair Share’ (18 September 2007)
Instead of the term Government Take the terms Total Government Take or Total Take are used.This is unusual and is unique in this report’s peer group. Also, the Total Take is equated to‘Economic Rent’, not ‘Rents’ (plural), nor ‘Share of Rent’.
(22) M. Williams (2007)‘Cradle to Grave Government Take’ ‘Marginal Government Take’.
The term ‘Cradle to Grave’ was used in the Case Studies authored by Williams who referenced, ‘Sources in-clude Alberta Panel Review 2007, Wood, PFC 2007, US General Accounting Office 2007’
M D Williams, ‘Case Studies: Government Competition for Oil & Gas Investment’ Alaska Department ofRevenue (Juneau, Alaska) (October 2007)
The term ‘Cradle to Grave’, used in the Case Studies, is the equivalent of ‘Full Cycle’ which is thenormal time frame for the Take Statistics. Marginal Government Take, in the same report, is consist-ent with other definitions where it is assumed that there are no attendant costs associated with, orassumed within, the calculation. It answers the question, ‘What happens to an incremental dollar of oilprice (for which there is no associated increase in costs?)’
(23) Wood Mackenzie (2007)‘Government Take’ and ‘State Take’.
‘• Government Take: refers to any government revenues including royalties, taxes, state profit shareand any other fees or levies, but excluding any NOC participation. In most cash flow, as follows:
Government Take ¼ sum of all government revenues, excluding NOC equity cash flow divided by pre-take cash flow
522 � Government Take

Pre-take cash flow ¼ gross sales revenue less gross capital costs and operating costs
• State Take: includes the Government Take as defined above and adds NOC equity cash flow fromeach asset.
State take is also expressed as a percentage of the pre-take cash flow.’
W Mackenzie, ‘Government Take: Comparing Attractiveness and Stability of Global Fiscal terms’ (June2007)
The ‘NOC equity cash flow’ is the same as what is referred to most often as, Government Participation.And, it is explicitly excluded from the Government Take definition but explicitly included in the StateTake definition. Notice too that they specify the Takes (Gvt. and State) in terms of percentages ofpre-tax cash flow. There is no inconsistency here with respect to most other definitions ofGovernment Take but the specific language is non-standard (if a standard indeed exists). Pre-take cashflow is the same as gross profit or economic profits. Some authors or analysts equate the Pre-take cashflow with Rent.
(24) CERA—E&P Fiscal Terms 2007‘State Take’.
‘State take is a general term used to describe the share of revenue that accrues to the state over the lifeof a project. We use the calculation below:‘Calculation of State Take
State Take ¼ ð1� Company after tax cash flow
Gross project revenue��OPEX ��CAPEX’Þ � 100
J Collins, I Agalliu, E & P Fiscal Terms: Larger Pies but Smaller Portions, IHS CERA Decision Brief (2007) 47
State Take is described as ‘the share of revenue’ but it is not that. It is a share of profits, but in thatrespect their formula is consistent and based on profits.
While this definition is not explicit about the treatment of Government Participation. It could be assumedthat it is included because they do specify the focus is on ‘company’ after tax cash flow not the consor-tium or contractor group cash flow as both would include the NOC Participation. Also, the State Taketerminology is probably part of the Petroconsultants legacy which was acquired by IHS in the mid 1990s.
(25) D. Wood (2008)‘Fiscal Take’ ‘Government Fiscal Take’ ‘Government Take’.
‘It (Malaysia) operates a production-sharing system. In the late 1980s fiscal take was amongst thetoughest in the world with >90% of profits going to the government.’ 154
Government Take � 523

‘As recent events have shown, PSCs with fiscal stability clauses can be manipulated by persistent gov-ernment pressure to increase the government’s fiscal take.’ 157
‘Fiscal measures that encouraged more competition would probably both increase reserves and increasefiscal take and project profitability on a US$/boe basis.’ 163
D Wood, ‘Preliminary Report on Fiscal Designs for the Development of Alaska Natural Gas’, State of AlaskaLegislative Budget & Audit Committee (November 2008)
http://lba.akleg.gov/download/issues/fiscal/2008-12-09_wood_2-5_key_features_of_the_fiscal_designs.pdf
The term Government Take was also used in this article about twice as often as Fiscal Take and inthe same contexts ie in terms of both dollars and percentages as seen above.
(26) Iretekhai J. O. Akhigbe (2010)‘Government Share of Rent’ and ‘% Project NPV’.
‘Government take is a measure of the proportion of the project’s profits which is captured by the hostgovernment.’
Figure 3. Government Share of Rent
524 � Government Take

I Akhigbe, ‘How Attractive is the Nigerian Fiscal Regime, Which is Intended to Promote Investment inMarginal Field Development?’ Joint United Nations Development Programme/World Bank Energy SectorManagement Programme (ESMAP) (July 2010) Supra, Note 3
https://www.essays24.com/Business/Uk-Fiscal-System/217.html
The graph in this report is not clear whether the ‘Share of Rent’ statistic is the same as a GovernmentTake statistic, with or without Government Participation. It is also defined (indirectly with the Y axis)as ‘% Project NPV’. However, while the term NPV (net present value presumably) is used, no specificdiscount rate is evident.
The only indication of whether or not Government Participation is included is the Venezuelan termsrated at 83% does not appear to include the 35% Participation which would have yielded a take onthe order of 90–92% as would be expected for a 1996þ vintage contract. Unfortunately, it is becauseof the wide use of non-standard terminology that such assumptions must be employed in order to tryto understand which definition is being used.
(27) International Monetary Fund (2010)‘Marginal Effective Tax Rate (METR)’ ‘Average Effective Tax Rate (AETR)’ ‘Share of Rent’.
‘For a given investment, without other locational differences, the discrete choice between two or moremutually exclusive locations depends on the average effective tax rate (AETR)—how much tax a firmwill pay on an average investment.’
‘The METR is the ratio of the difference between the pre- and post- tax rate of return, for a marginalinvestment, to the pre-tax return . . . .’
‘The AETR—better known as “government take” in the petroleum sector—is a familiar measure usedin international comparison of fiscal regimes. It compares the share of petroleum rent taken by govern-ment across countries: the “government take” at a rate (or range of rates) of discount designed to simu-late the risk adjusted return required ex ante by investors.’
P Daniel and others, ‘Evaluating fiscal regimes for resource projects’, in The Taxation of Petroleum andMinerals: Principles, Problems and Practice in P Daniel and others (eds) (Routledge, Oxon and New York2010) (International Monetary Fund)
The definition of the METR is unrecognizable. The AETR is defined as ‘government take’ and/or‘share of petroleum rent’ which is further defined as a discounted statistic. However, it is not specifiedwhether or not Government Participation is included. Also, the discount rate is not directly specifiedother than that which would inspire investors.
Government Take � 525

(28) World Rating of Oil & Gas Terms (2010)‘Government take with state participation, discounted and undiscounted’ ‘Government take without state participa-
tion discounted and undiscounted’.
Van Meurs Corporation and PFC Energy, ‘World Rating of Oil & Gas Terms’ (31 October 2010)
Van Meurs and PFC Energy were precise here about the issue of State Participation. Although theterm Government Participation is more common, their use of the State Participation terminology isclearer. Better to say ‘Government Take without State Participation’ than the confusing ‘GovernmentTake without Government Participation’ which sounds like a contradiction, or oxymoron.
(29) IHS CERA (2010)‘Mean Government Take’ ‘Government Take’ ‘State Take’ ‘Gross Government Take’.
‘The mean government take (defined as the undiscounted revenues that accrue to the government as apercentage of the total undiscounted net revenues of a project) calculated for a peer group of deep-water offshore opportunities and across a range of natural gas prices and field sizes is 60 percent. Thiscompares with a range of 38–50 percent for Israel.’ Page 1
‘But government take is a misleading measure as it is not among the metrics that oil and gas investorsuse to make investment decisions.’ Page 1
‘Government take does not provide any measure of the attractiveness of a fiscal regime.’ Page 1
‘Some analysts calculate the percentage of the gross revenues of a project that accrue to the govern-ment (that we shall define as gross government take).’ Page 1
‘When comparing fiscal regimes most analyses focus on the level of “state take” as a tool forranking the relative attractiveness. We believe this is an oversimplification, particularly whenthe calculation is of the percentage of the gross project revenues that accrue to the state as thisignores even the effect of differences in costs of development and production. Ranking on state take,even when calculated as a percentage of net project revenues, is a crude proxy for what reallyinfluences investment decisions—the value creation resulting from the deployment of investors’capital. Page 2
Ranking on state take, even when calculated as a percentage of net project revenues, is a crude proxyfor what really influences investment decisions—the value creation resulting from the deployment ofinvestors’ capital.’ Page 2
IHS CERA, ‘A Comparison of Fiscal Regimes - Offshore Natural Gas in Israel’, Special Report (2010)
On pages 1 and 2 of the report, a number of separate terms and definitions are introduced:
The ‘mean government take’ definition is not explicit on the issue of Government Participation.However, the definition is interesting, and precise, if we take ‘net revenues’ to mean ‘net of costs’which is logical in this context. However, the term net revenues has wide use as meaning gross revenuesless royalty.
526 � Government Take

The report also defines a ‘gross government take’ in a different way; ‘gross revenues that accrue to thegovernment’. Gross revenues that accrue to the government sounds as though it could be denominatedin terms of dollars. It does not say share of gross revenues.
The article is somewhat confusing on its definitions of State Take (ie as either a percentage of grossrevenues or a percentage of net revenues).
The article makes a bold claim against the virtues of the Government Take statistic. Yet, in a subse-quent CERA 2011 report for the US Bureau of Offshore Energy Management (BOEM) the termGovernment Take is mentioned over 200 times.
(30) IHS CERA (2011)‘Government Take’.
‘What Is Government Take?
Government take is a general term used to describe the share of revenues that accrues to the govern-ment over the life of the project. Our calculation of government take includes the share of revenuesaccruing to the state through royalties, taxes, and other fiscal and quasi-fiscal levies as well as revenuesaccruing to the NOC. Government take in this report is defined as the government’s percentage of pre-tax project net cash flow. The calculation below is used to determine government take:
Government Take ¼ ð1–Company After Tax Cash Flow
Gross Project Revenue – OPEX–CAPEX’Þ � 100
US Department of the Interior, BOEM, CERA - Comparative Assessment of the Federal Oil and Gas FiscalSystem, OCS Study (Herndon, VA 2011) 300pp. https://www.energy.senate.gov/public/index.cfm/files/serve? File_id¼d174971c-4682-4d96-b194-a85fa2b86774
The definition CERA outlines is explicit about the treatment of Government Participation by including‘revenues accruing to the NOC’. It is included in the Government share (ie it is not part of Companyafter tax cash flow).
This definition is not consistent with the Petroconsultant’s Government Take statistic. It is consistentwith Petroconsultant’s State Take statistic.
Note: In this article IHS CERA uses the term Government Take 226 times.
(31) UNDP, D. Johnston (2011)‘Government Take’ (includes Government Participation).
‘Government takes – “Government take” represents the government share of economic profits fromall means by which the State extracts rent: bonuses, royalties, profit oil, taxes, government workinginterest, etc. Because of the dynamics of bonuses, royalties, cost-recovery limits, sliding scales andvarious other mechanisms, there can be various levels of government take for any given system
Government Take � 527

depending on a variety of circumstances. Thus, four separate statistics are used here to characterizegovernment take:
• Economic profit ($) – Cumulative gross revenues less cumulative gross costs over the life of the pro-ject (full cycle). Also referred to as “cash flow”;
• Government take (%) – Government receipts from royalties, taxes, bonuses, production or profit-sharing, and government participation, divided by total economic profit;
• Company take (%) ¼ 1 – Government take ¼ Company net cash flow divided by economic profit;and
• Contractor take19 (%) ¼ 1 – Government take (excluding government participation) ¼ Contractornet cash flow divided by economic profit.
D Johnston, Getting it Right: Lessons from the South in Managing Hydrocarbon Economies, United NationsDevelopment Programme (New York, 2011) 149-150
Here a distinction is made between contractor (or more precisely, contractor group) and an individualcompany within the contractor group. The Government Take statistic defined here includesGovernment Participation (referred to as government working interest) which is not consistent withJohnston’s past definitions which appear to waver on the issue of whether or not to includeGovernment Participation.
(32) Williams and Meyers (2012)‘Government Take’.
‘Government take’This term is used to encompass the total revenue (including royalties, taxation, and government partici-pation) generated for the government from oil production.’
H R Williams and C J Meyers, Manual of Oil and Gas Terms, updated and revised by P H Martin and B MKramer (Matthew Bender & Company) (2012)
It is not clear whether this Government Take statistic is meant to be based on the division of revenues orthe division of profits or if it represents dollars instead of a percentage. It is most likely that they intendedto indicate a percentage but that is not consistent with the specific language. The definition is not clear.
(33) Ernst & Young Conference, Lagos – P. Van Meurs (2012)‘Government Income Take’.
‘To be competitive and encourage production from new leases, he (Dr. P. Van Meurs) said thecountry should aim for an overall income for oil of 60 per cent for the small and high cost of fields to
19 The company and contractor take terminology is not as common as Government Take but they are just the reciprocal of Governmentand State Take statistics. “Contractor Take – Evolving Terminology”, Petromin Magazine, Singapore, January 1996, D. Johnston, pp.60–61
528 � Government Take

75 per cent for the large and low cost fields under current price conditions and noted that governmentincome take does not include the government take because of NNPC participation.’
V-P Nwinaene, ‘Expert Lists PIB’s Grey Areas’ (19 November 2012)http://www.thetidenewsonline.com/2012/11/19/expert-lists-pib’s-grey-areas/
It is unfortunate that there is almost certainly a mistake here. The term ‘government take’ here shouldhave read ‘government participation’ regardless of the awkwardness of this terminology. Much of whatis found in industry literature requires a bit of reading between the lines, (see Van Meurs 2016 quote)otherwise this misquote is very confusing.
NNPC represents the Nigerian National Petroleum Company and the discussion revolved aroundNigeria’s Petroleum Investment Bill discussions during this period (PIB 2012).
(34) World Rating of Oil and Gas Terms 2013, Van Meurs, Rogers and PFC Energy‘Government Take, Government Income Take, Government Total Take’.
‘Government Take (“GT”). The government take is the percentage that the government takes of the“divisible income”. In this case, the divisible income is simply defined as the gross revenues less all cap-ital and operating expenditures on a cash flow basis. The government take can be determined at variousdiscount rates. In this study, the undiscounted government take (“GTO”) is being used as well as thegovernment take discounted at 10% (“GT10”).’ (page 68)
‘GI0 (or “GIT0”). This is the undiscounted government income take. This is the same value as thegovernment take (GT) described above, but it excludes any form of government participation.’
‘GT0 (or “GTT0”). This is the undiscounted total government take including the participation. Thisis identical to the GT0 discussed above and applies in the previous five Volumes. However, it isrenamed for this Summary Report in order to distinguish it from the GIT0.’
Also the World Rating of Oil and Gas Terms 2013 refers to three different investor scenarios (relatingto Government Income Take and Government Total Take) referred to as: ‘Stand Alone’, ‘CountryIncremental’, and ‘Contract Incremental’.
(70)
Stand Alone. The ‘stand lone’ scenario contemplates that the investor is making its first investment inthe country.
Country Incremental. The ‘country incremental’ scenario contemplates that the investor is alreadyproducing oil and gas in the host country and there is positive taxable. This means that costs can bededucted for tax purposes based on the various depreciation provisions.
Contract Incremental. In countries with PSCs or other contractual or fiscal features that are ringfenced per contract or concession.
FC Energy, Van Meurs Corporation, Rodgers Oil and Gas Consulting, Barrows Company, ‘Volume 6ASummary and Conclusions on World Oil and Gas Terms’, World Rating of Oil and Gas Terms, (Ch 1 - Ch5, Annex) (2013) 68–70
Government Take � 529

The Government Take statistics here are based on ‘divisible income’ which is rare terminology butconsistent with other definitions based on ‘gross revenues less costs’.
It is clear that Government Participation is excluded from the definition.
However, Government Participation is clearly included in the ‘Total Government Take’ definition/stat-istic. The last three definitions are distinguished on the basis of the influence of ring fencing. Thereare further categories based on discounted cash flow analysis.
Despite obvious efforts to be precise, the profusion of terms that sound alike, and the acronyms thatlook alike, and the plethora of definitions is overwhelming.
It is hard enough for practitioners in the industry to speak the same language and this report introdu-ces a whole new range of terms and definitions.
(35) Matthew Berman (2014)‘Stake Take’, ‘Alaska state government take’, State Take per Barrel, ‘total take as a percent of wellhead value’.
REVENUE RISK (PROGRESSIVITY)
Figure 3 shows the Alaska state government take distributed among the various categories of progres-sivity. The height of the graph—the total take as a percent of wellhead value—is the same as the topline in Figure 2.
Emphasis added
‘The spike in the state take per barrel in the 1970s is due to North Slope and TAPS petroleum prop-erty taxes collected before Prudhoe Bay began commercial production, and the wellhead value wascomposed almost entirely of Cook Inlet oil and gas. Once North Slope commercial production started,the take stabilized at a higher percentage of wellhead value than before. During the 1980s and 1990s,the state take was nearly constant at about 30 percent of wellhead value in recurring revenues and 35-40 percent, considering all petroleum revenues. During the entire period through fiscal year 2006,when the ELF-based severance tax was in effect, the state take from all petroleum revenues neverreached 45 percent. The years with the highest take all corresponded to years of low oil prices, illustrat-ing the regressive nature of the overall fiscal regime. However, the state take exceeded 45 percent ofgross wellhead value in both 2008 and 2012 under the ACES production tax. Oil prices adjusted for in-flation reached their highest levels in these years, illustrating the effect of the highly progressive ratestructure of the ACES tax structure.’
M Berman, Comparing Alaska’s Oil Production Taxes: Incentives and Assumptions (1), WEB Notes, Web Note18 (Institute of Social and Economic Research, University of Alaska Anchorage) (August 2014)
The state take here is defined as a percent of wellhead value, considering all petroleum revenues. Wellheadvalue here initially appears to be the same as gross revenues but this is not clear, partly because it is alsopart of a reference to ‘wellhead value . considering all petroleum revenues’. This is not a conventional defin-ition and the terminology here is unique. Here too, reference to ‘state take’ is relative to that of the Stateof Alaska not State Take in the context of Government Take including Government Participation.
530 � Government Take

(36) P. Daniel IMF (2015)‘Fiscal Take’ ‘Government Take’ ‘take economic rent’.
‘• Increasing trend toward linking fiscal take to project profitability permits thesame fiscal terms to apply to oil and gas– automatically provides lower take from less valuable projects and vice versa’
Asia-Pacific Natural Resource Taxation Conference, ‘Fiscal Regimes, Petroleum Contracts, and Natural Gas’(Jakarta) (11-13 August, 2015) http://www.imf.org/external/np/seminars/eng/2015/natrestax/pdf/daniel.pdf
Both terms ‘Fiscal Take’ and ‘Government Take’ are used in this article in the same context, thoughnot specifically defined. They appear to be defined as a function of rent, referring to ‘rent-capturemechanisms’ page 3 and using the phrase ‘take economic rent’ page 12. This is some odd but some-what understandable, relatively recognizable logic and language.
(37) Proposed Guidance on Fiscal Take in the Extractive Industries (2016)‘Fiscal Take’ (This definition goes beyond State Take).
‘Government’s share from development of natural resources can include many components. Their na-ture and scope can be wide ranging. While likely to include income taxes and royalties normally asso-ciated with the extractive industry (EI), the government’s share can also include other taxes and fees,as well as obligations placed upon investors, such as making infrastructure investment, employingand/or training residents, purchasing services and supplies from local businesses and contributions todecommissioning and environmental costs. It is this total contribution to a developing country’seconomy that should be considered in evaluating fiscal take.’
Committee of Experts on International Cooperation in Tax Matters, Thirteenth Session, Agenda Item 3 (b) (ii) ofthe provisional agenda, Taxation of Extractive Industries (New York, 5-8 December 2016) E/C.18/2016/CRP.21.http://www.un.org/esa/ffd/wp-content/uploads/2016/12/13STM_CRP21_fiscal-take.pdf
This definition goes beyond normal definitions of Government Take by including such things as ‘pur-chasing services and supplies from local businesses’. This is very rare but certainly there are potentialbenefits that go beyond simply the government share of profits from petroleum operations.
(38) E. Bini, G. Garavini (2016)‘Marginal Fiscal Take’.
‘In December 1958, the government (Venezuela) increased the applicable income tax rate, to be paidon top of royalties, to 47.5 per cent. Hence, given the royalty rate of one-sixth, the marginal fiscaltake increased from 50 per cent to 56.25 per cent. A few months later, Venezuela got in touch againwith the other oil-exporting countries, entreating them to increase their own income tax rates to 50per cent, on top of royalties at the rate of one-eighth, thereby also taking their marginal fiscal takefrom 50 per cent to 56.25 per cent.’
Government Take � 531

E. Bini, G. Garavini, Oil Shock: The 1973 Crisis and its Economic Legacy (2016)
The ‘Marginal Fiscal Take’ is not specifically defined in prose, but based on the math it is clearly thesame as ‘Marginal Government Take’.
For example, calculation of the December 1958 system is as follows:Gross Revenues 100%Royalty -16.66——————————————Net Revenues 83.34Costs 0.00——————————————Taxable Income 83.34Income Tax 39.58 (tax rate of 47.5%)
Marginal Government Take ¼ 56.25% (16.66þ 39.58)
(39) Fiscal Stabilization in Oil and Gas Contracts:Evidence and Implications (2016)‘Government Take’ ‘Fiscal Take’.
‘Question 3: Would companies still want to stick to the stability provision if the government reducesits fiscal take?’
M Mansour and C Nakhle, ‘OIES Paper: SP 37’, The Oxford Institute for Energy Studies (January 2017)
This article uses the terms Fiscal Take and Government Take in what appears to be the same contextbut use of the term fiscal take is rare.
(40) P. Van Meurs (2016)‘Government Participation Take’ ‘Government Income Take’.
‘Total Government Take ¼ Government Income Take þ Government Participation Take’
P van Meurs, ‘Government Fiscal Strategies under Low Oil Prices and Climate Change’, Discussion paper forsubmission to the 3rd Government Oil and Gas Summit, 17-18 May 2016 (18 April, 2016)
This terminology and phrasing of the definition is unique. Use of the term ‘Government ParticipationTake’ is unusual but descriptive. It refers to the percentage share of profits that would accrue to thestate as a result of the NOC working interest (carried or otherwise). This is just another departurefrom consistency that other authors guilty of but it is not easy when so many governments and com-panies have their unique cultures and internal terminology.
532 � Government Take

(41) Developing Fiscal Policy (Alaska) (2017)‘Project Split’ ‘Marginal (dollar) Rates’ ‘project profit split’ ‘overall project splits’ ‘marginal dollar splits’.
There are some confusing graphs on pages 31 and 32 of the presentation where the terms Government Takeand State Take appear to be used interchangeably.
On page 39 the presentation discusses the various charts that are so common in the industry that comparecountries on the basis of Government Take. It states:
‘� Majority of the comparison charts do not tell the whole story� For example, let’s look at the Project Split for the entire project versus Marginal (dollar)
Rates for a new hypothetical Alaska 100 MMbbl North Slope project– Get 2 very different results– With credits and allowed deductions overall project profit split is near 40 -45% operator 55-60% government– However, on a marginal dollar basis, (depending on price) the split is nearer to 30% operator, 70%
government– Which one shows up in the “chart” for each regime?
This significant difference between overall project splits and marginal dollar splits exists for many othercountries in the comparable tables.’
Castle Gap Advisors, LLC, ‘Presentation to Alaska House Resource Committee’ (20 February, 2017)
This presentation introduces a host of terms: formally ‘Project Split’ and ‘Marginal (dollar) Rates’ andthree less-formal; ‘project profit split’, ‘overall project splits’ and ‘marginal dollar splits’. It is fairly clearthat the terms ‘project profit split’ and ‘overall project split’ are the same as ‘Project Split’. It appearstoo, that the term ‘Project Split’ in this presentation is the same as what is most often referred to asGovernment Take but treatment of Government Participation is not addressed.
The terms ‘Marginal (dollar) Rate’ and ‘marginal dollar split’ are apparently equivalent to the‘Marginal Government Take’ statistic.
From an analytical point of view, most standard industry charts compare countries on the basis ofGovernment Take (either with or without Participation), not Marginal Government Take.
The terms introduced in this presentation appear to be unique to this presentation and are not clearlydefined. Marginal Government Take statistics do not provide as much useful comparative insight as or-dinary Government Take statistics do from an investor’s point of view and this is why the MarginalGovernment Take statistics are quoted and used less often.
Outside of this article, delivered in Alaska, or other possible work by this firm the term ‘Project Split’and ‘Marginal (dollar) Rates’ do not exist. It is surprising that this kind of thing could exist in 2017.
(42) S. Mucci (2017)‘Fiscal Take’.
‘The demands usually take the form of forced contract renegotiation, increased fiscal take, or expropriation.’‘More recently, the Alaska’s Clear and Equitable Share (ACES), a fiscal system implemented in 2007,significantly increased the fiscal take from the oil companies.’
Government Take � 533

S Mucci, Political and Investment Risk in the International Oil and Gas Industry (Lexington Books, 11October 2017).
Fiscal Take is not defined but the terminology is still alive in 2017! The debates in Alaska focused onAlaska’s standing in the international marketplace for investment capital. In that context, any peer-group analysis or comparisons with Alaska’s fiscal terms should include Government Participation.Unfortunately, not all analysts did this nor were they precise or consistent in their definitions or ter-minology. The Castle Gap Advisors (above) is an example. No two reports or presentations theAlaskan legislators received used the same definitions and language.
(43) Wood Mackenzie (2017)‘Effective Royalty Rate’.
‘Effective Royalty Rate (ERR): government’s share of revenue before costs can be recovered.’
Figure 1, ‘Fiscal Competitiveness: When $50 is only $25’ (23 August 2017)
The term ERR appears to have gained traction. This definition is consistent with the definition earlierin this report. However, these definitions are unsurprisingly phrased differently. In the past WoodMackenzie referred to this same statistic (ERR) as ‘Minimum Government Take’.
(44) Schlumberger Oilfield Glossary (2018)‘Government Take’.
‘1. n. [Oil and Gas Business]
The total amount of revenue that a host government receives from production. This amount can in-clude taxes, royalties and government participation.’
‘Government Take’, Schlumberger Oil Glossary. www.glossary.oilfield.slb.comhttp://www.glossary.oilfield.slb.com/en/Terms.aspx? LookIn¼term%20name&filter¼GovernmentþTake
This definition which explicitly includes Government Participation is equivalent to the WoodMackenzie ‘State Take’ definition on that point but it is not explicit about whether or not it is refer-ring to dollars ($), which it does literally, or a percentage (%) which is probably what was intended.But the definition is wide of the mark if it is an attempt to define what the percentage share is.Government Take denominated in terms of dollars is analytically meaningless.
534 � Government Take

(45) Tarron Khemraj (2018)‘Fiscal Take’ or ‘Fiscal Intake’.
‘All the market analysts and the economic analyses I have seen indicate that Guyana’s fiscal intake isunder 40%. In other words, after accounting for royalty and 50/50 profit share, Guyana gets about 37%of revenues over the lifetime of the project. The bonus is just too low.’
‘He noted that if the price increases to US$70, US$80 or US$100 per barrel, Guyana still receives 50%of profit after accounting for unit or average total cost.’
Stabroek News, ‘Fiscal take from oil bonanza will be around 37%’ (12 March 2018)https://www.stabroeknews.com/2018/news/guyana/03/12/guyana-fiscal-take-from-oil-bonanza-will-be-around-37-tarron-khemraj/
When economist Mr. Khemraj, complains that Guyana gets only 37% of revenues he is speaking ofrevenues alone—not profits. It is important to point this out because of the common lack of under-standing and problems with terminology on this subject. However, the statistic is almost totally with-out analytical merit and it can be misleading.
Actual Government Take should be on the order of 51% undiscounted and it would be higher from apresent value point of view (discounted) depending on the discount rate. This is partly because the ERRis 13.5% with the 2% royalty in combination with a 75% cost recovery limit and 50/50% profit oil split.
The context of these terms, the geological, geopolitical, water depths, rig day rates, frontier status, risk factors,oil/gas prices, etc, have to be considered when discussing or analysing the appropriateness of the terms(Appendix 4). Further context would be based on the other contract terms, laws and regulations (Appendix 5).
This publication is a shame, it is a classical misuse of the statistics and it is misleading.
Best PracticesThe following calculations, logic, definitions and terms are the most precise, and consistent with the clearestand most consistent treatments found in the industry (despite the problems). These are also consistent withthe Best Practices definitions provided earlier in this article.
While the names are diverse the most common term is ‘Government Take’ and while many of the defini-tions may sound different, they often actually mean the same thing and there is a basic logic to most of theprofits-based Take calculations.
The term ‘Take’ usually implies a division of profits. The biggest hurdle on this point is how to treatGovernment Participation and how to distinguish the statistics because of this element. The best and mostlogical way is to simply specify how Participation is treated.
The division of revenues does not provide the insight that division of profits does. This is why so manystatistics focus on Take and so few deal with the division of revenues. Unfortunately, some practitioners de-fine their Government Take (or whatever they call it) as a function of revenues, not profits.
A P P E N D I X 1 — M A T H E M A T I C S O F G O V E R N M E N T T A K EThe following example incorporates all of the main rent extraction mechanisms and is used to illustrates thedivision of revenues and profits (full-cycle). Even though the calculation represents full-cycle results it isstructured as if everything occurred in a single accounting period. The fiscal architecture described belowcould describe either that of a R/T system or a PSC.
10% Royalty
Government Take � 535

70% Cost Recovery Limit (70% of Gross Revenues)50% Government Share of Profit Oil or Special Petroleum Tax30% Income Tax30% Government Participation
From an economic and financial point of view, there is little difference between a R/T system and a PSC ex-cept the terminology and the cost recovery limit.20 This is illustrated in the example below.
Rent extraction mechanismsIn this example, there are four rent extraction mechanisms. However, some theorists may dispute whether ornot some of these elements (particularly the corporate income tax) actually capture rent. Nevertheless, thereare means by which the Gvt. gets a piece of the pie. Of these four, there are three main kinds of mechanism:
Royalty Based on Gross Revenues or ProductionProfits-based mechanisms Based on Accounting Profits
Profit oil splitCorporate Tax
Gvt. Participation Based on Cash Flow (with the exception of the funds incurred on behalfof the NOC which are cost recoverable and tax deductible. (Ordinarilyany bonuses are not cost recoverable but they are tax deductible).
Distribution of Revenues Example distribution of Revenues/Production (Full-cycle)
This table shows the mathematical hierarchy in the distribution of revenues over the life of a field or project (full-cycle), including the mainmeans by which governments get their share of revenues and profits. The differences between R/T and PSC Regimes is the terminology.
Royalty/Tax (Concessionary) Regime Terminology PSC Regime Terminology
A Gross Revenues or Gross Production 100% Gross ProductionB Royalty 10% - 10 Royalty 10%C Net Revenues 5 90 Net ProductionD Tax Deductions (Capex and Opex)21 - 30 Cost Oil (Recovery)22 (Capex and Opex)E Petroleum Profits Tax Base23 5 60 Profit OilF First Layer of Tax 50% Petroleum Profits Tax - 30 Government Share of Profit Oil 50%G IOC or Consortium24 Taxable Income 5 30 Contractor Group Share of Profit OilH Income Tax 30% - 9 Income Tax 30%I Consortium Net Cash Flow 5 21 Contractor Group Net Cash FlowJ Government (NOC) 30% Participation - 6.3 Government (NOC) 30% ParticipationK Company (IOC) Net Cash Flow 5 14.7 Company (IOC) Net Cash Flow
Note: This same example could have been provided in terms of barrels or dollars. The results would be the same.
20 Whether or not a cost recovery limit is part of the system makes no difference on either State Take or Government Take statistics (withor without Gvt. Participation) unless the statistics are based on discounted cash flow analysis.
21 Capex ¼ Capital expenditures, and Opex ¼ Operating expenditures.22 The one real difference between Concessionary systems and PSCs is that most PSCs limit the amount of costs that can be recovered in
any given accounting period, ie a Cost Recovery Limit. Unrecovered costs are carried forward and recovered (hopefully) in subsequentaccounting periods. It is assumed here that the cost recovery limit is 70%.
23 This (60%) would be considered part of the Accounting Profits.24 This too (30%) would be considered a layer of Accounting Profits.
536 � Government Take

Formulas %
A 2 D 70% Total Economic profit(B 1 F 1 H 1 J)/(A 2 D) 78% Government Take or State Take (Including Gvt. Participation)K/(A 2 D) 22% Company Take
(B 1 F 1 H)/(A 2 D) 70% Government Take (Without Gvt. Participation)I/(A 2 D) 30% Contractor Group Take
———————————————————–(D 1 G)/A 60% Contractor Lifting Entitlement with a PSC25
A – B 90% IOC Lifting Entitlement with a Royalty/Tax system26
———————————————————–B 1 (50% * (A 2 B 2 70%))27 20% ERR for a PSCB 10% ERR for a R/T System
———————————————————————–B 1 F 1 H 1 J 55.3% Gvt. Share of Gross Revenues
25% Savings Index68.5% Marginal Gvt. Take (excluding Participation)
The Savings Index is the same for both the R/T or the PSC in this case. If the IOC saves a dollar therewill be an extra dollar worth of profit oil. Half of that goes to the consortium and that is taxed at a rate of30%. So, the consortium keeps 25% of any savings. This is divided among the Parties according to their re-spective working interest shares. A savings index of 25% is a healthy incentive to save. From a DCF point ofview, the index us almost always higher and this creates a strong alignment of interests between the consor-tium and the Gvt. on this important issue.
Marginal Government Take (excluding Gvt. Participation) is based on the assumption that costs equalzero in the same equation above. In that case, total (hypothetical) profits would equal 100% (GrossRevenues). Total profit oil would be 90% (Gross Revenues less Royalty). Government share of profit oil(50% of the total profit oil) would be 45%. Company share of profit oil would also be 45%. This would betaxed at 30% yielding another 13.5% of Gross Revenues for the Gvt. Therefore, the total GovernmentMarginal Take would be 68.5% [(10% Royalty þ 45% share of Profit Oil þ 13.5% Tax)/Total Profits,defined as 100% because costs equal zero].
25 This statistic represents the share of reserves (entitlement) each working interest shareholder is entitled to ‘lift’ relative to their individualworking interest share of cost oil and profit oil. The number of barrels a company may ‘book’ may or may not be the same as theirentitlement.
26 This statistic represents the share of reserves (entitlement) each working interest shareholder is entitled to ‘lift’ relative to their individualworking interest share of gross production less royalty. The number of barrels a company may ‘book’ may or may not be the same as theirentitlement.
27 Cost Recovery Limit is 70%
Government Take � 537

A P P E N D I X 2 — V I T A L S T A T I S T I C S
The relative insignificance of signature bonuses is one reason why they are ordinarily not included in typicalGovernment Take (or State Take) statistics. The other reason is that they cannot be properly analysed with-out performing cash flow analysis and risk analysis based on assumed success rates.
Take statistics• World average Government Take28 is around 60–70%.• Average Government Take for upper 25th Percentile is around 85%.• Average royalties7–8%.• World average Effective Royalty Rate 20%.• Most systems have relatively ineffective ‘progressive’ sliding scales if any.
A P P E N D I X 3 — W E A K N E S S E S O F T H E T A K E S T A T I S T I C S 2 9
Government Take is not a perfect statistic. This is no secret. It has a number of weaknesses yet it is difficultto ignore because it is an important metric. However, it can be more meaningful if both the strengths andweaknesses are understood and not ignored.
• Take statistics do not adequately capture signature bonuses, although over 95% of the time they arenot relevant unless the analysis addresses both present value and risk (or probabilities of either fail-ure or success). One notable exception is the US Gulf of Mexico where30 bonuses are high by worldstandards (in terms of dollars per acre).
• They do not address ‘how’ Government takes (such as front-end-loading)• The companion statistic ‘ERR’ captures much of the essence of how and how much the Gvt. gets
up front.
Government Revenues (Rent) Worldwide from Petroleum Operations
% Share of Gvt. Revenues
World Average From the Example Above
Signature bonuses and other bonuses 1–2%Royalties 15–18% 18% (1)Profits-based mechanisms (taxes and profit oil sharing) 70–80% 71%Government participation 7–10% 11%Other 1–2%
(1) Note: Government total share of Gross Revenues ¼ 55.3%. Therefore, the royalty of 10% divided byGvt. share of Revenues ¼ 18% i.e. 18% of the Gvt. Revenues comes from the royalty.From: ‘Fundamental Petroleum Fiscal Considerations’, Oxford Energy Comment, The Oxford Institutefor Energy Studies, University of Oxford, February 2015, D. Johnston
28 Includes Government Participation.29 Adapted from: Alaska’s Proposed Production Tax ‘PPT 20/20%’ Senate Bill 305/House Bill 488, D. Johnston testimony Juneau Alaska 6
March, 2006.30 ‘Bonuses enhance upstream fiscal system analysis’, A. Derman, D. Johnston, Oil & Gas Journal, 8 February, 1999. pp. 51–55.
538 � Government Take

• The statistics do not capture the effect of timing and time value of money, unless they are ‘dis-counted’. If discounted, the rate should be stated. However, the resulting statistics may not compareto other studies that may have used different assumptions with respect to production, and cost pro-files, water depths, etc.Discounted Take statistics can be more meaningful if they are accompanied by undiscountedstatistics.
• The statistics do not measure all of the means by which Governments benefit i.e. such things as localemployment and industry, infrastructure, or social development projects such as hospitals orschools.
• Says nothing of ring fencing—the ability to tax deduct costs incurred in one area against other li-cense areas.
• Contract or system stability is not captured in the statistics.• Reserve/lifting entitlements and ‘ownership’ are not accounted for• Does not differentiate between diverse work program requirements• By definition, ‘crypto taxes’ do not get captured in the Take statistics. These are elements that cause
financial pain to an oil company but are not typical levies that can be evaluated in terms of (1) rateand (2) base. Such things include, inordinately high local content provisions, hostile audits, bureau-cratic red tape, unreasonable permitting requirements, difficult visa application processes, unreason-able procurement rules, etc.
A P P E N D I X 4 — B E Y O N D G O V E R N M E N T T A K E 3 1
The fiscal/contractual terms and relationship between governments and IOCs is multidimensional. If profitsare generated, how much does the government take? How does government take? What other contract ele-ments impact the economic aspects of the relationship? There are many.
• Type of system (PSC, Concession/license, service contract)• ERR• Reserves Entitlement• Incentive to keep costs down (Savings Index)• Cost Recovery Limit• Government Approvals Processes• Timing, Duration and Relinquishment provisions• Work Programs, Timing, Guarantees• Domestic Market Obligations• Dispute Resolution• Ringfencing provisions• Lifting Entitlement provisions (ownership of or title to hydrocarbons)• Percentage of reserves that can be ‘booked’• Procurement guidelines• Government Participation provisions• Stabilization provisions• Block (license area) size• Depreciation Rates• Fees and Rentals• Bonuses
31 After, Johnston, D., International Exploration Economics, Risk, and Contract Analysis PennWell Books 2003 (pg 24).
Government Take � 539
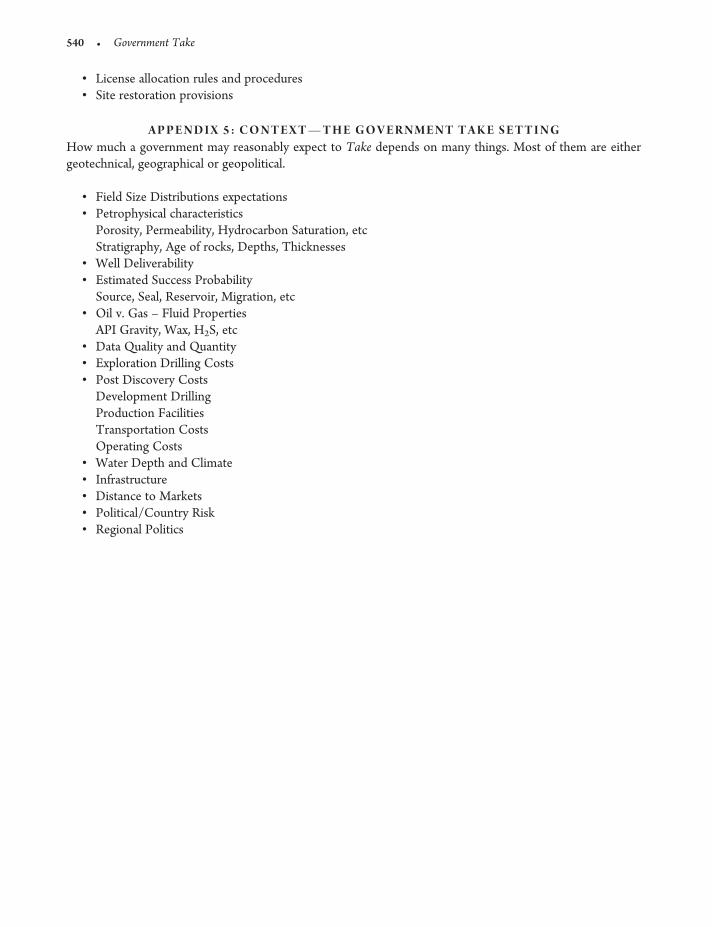
• License allocation rules and procedures• Site restoration provisions
A P P E N D I X 5 : C O N T E X T — T H E G O V E R N M E N T T A K E S E T T I N GHow much a government may reasonably expect to Take depends on many things. Most of them are eithergeotechnical, geographical or geopolitical.
• Field Size Distributions expectations• Petrophysical characteristics
Porosity, Permeability, Hydrocarbon Saturation, etcStratigraphy, Age of rocks, Depths, Thicknesses
• Well Deliverability• Estimated Success Probability
Source, Seal, Reservoir, Migration, etc• Oil v. Gas – Fluid Properties
API Gravity, Wax, H2S, etc• Data Quality and Quantity• Exploration Drilling Costs• Post Discovery Costs
Development DrillingProduction FacilitiesTransportation CostsOperating Costs
• Water Depth and Climate• Infrastructure• Distance to Markets• Political/Country Risk• Regional Politics
540 � Government Take