Embed Size (px)
Citation preview

Government
Pension Fund
Global
Second quarter 2019
Oslo, 21 August 2019

Highlights
2
▪ The market value of the fund increased by 224 billion kroner to 9,162 billion kroner
▪ The fund returned 3.0 percent in the second quarter of 2019
▪ The return on the fund was 0.19 percentage point lower than the return on the
reference index
▪ At the end of the quarter, the fund was invested as follows:
• Equity investments 69.3 percent
• Unlisted real estate investments 2.7 percent
• Fixed-income investments 28.0 percent

Market value increased to 9,162 billion kronerBillions of kroner. As at 30.06.2019
3
1,000
2,000
3,000
4,000
5,000
6,000
7,000
8,000
9,000
10,000
1,000
2,000
3,000
4,000
5,000
6,000
7,000
8,000
9,000
10,000
09 10 11 12 13 14 15 16 17 18 19
Fixed income
Real estate
Equity
Value Percentage share
Equity investments 6,348 69.3
Unlisted real estate investments 247 2.7
Fixed-income investments 2,567 28.0
Fund 9,162 100
Source: Norges Bank Investment Management

256 billion kroner in returnBillions of kroner
4
-750
-500
-250
0
250
500
750
-750
-500
-250
0
250
500
750
Q2 2018 Q3 2018 Q4 2018 Q1 2019 Q2 2019
Return
Inflow/withdrawal
Q2 2019
Return 256
Inflow 6
Source: Norges Bank Investment Management

-750
-500
-250
0
250
500
750
-750
-500
-250
0
250
500
750
Q2 2018 Q3 2018 Q4 2018 Q1 2019 Q2 2019
Krone rate
Return
Inflow/withdrawal
Total
256 billion kroner in returnBillions of kroner
5
Q2 2019
Return 256
Inflow 6
Krone rate -38
Total 224
Source: Norges Bank Investment Management
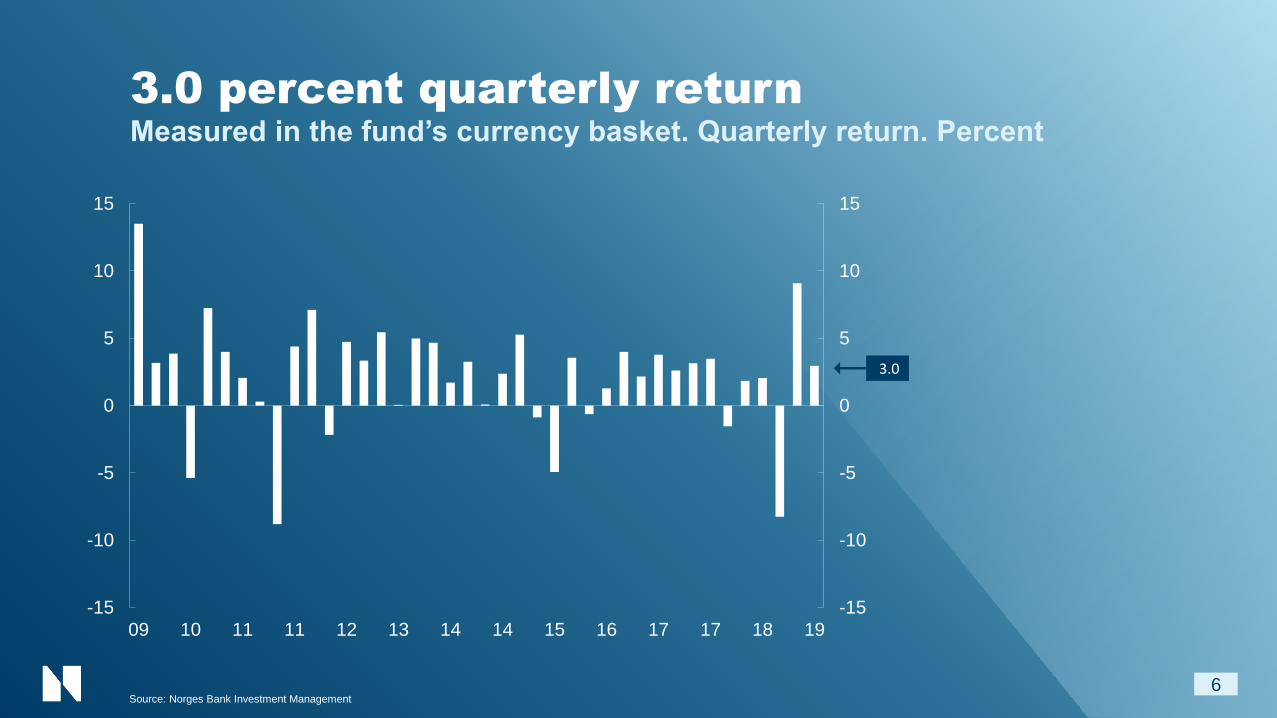
3.0 percent quarterly returnMeasured in the fund’s currency basket. Quarterly return. Percent
6
-15
-10
-5
0
5
10
15
-15
-10
-5
0
5
10
15
09 10 11 11 12 13 14 14 15 16 17 17 18 19
3.0
Source: Norges Bank Investment Management

Strongest return for fixed incomeMeasured in the fund’s currency basket. Percent
7
-15
-10
-5
0
5
10
15
-15
-10
-5
0
5
10
15
Q2 2018 Q3 2018 Q4 2018 Q1 2019 Q2 2019
Equity investments
Real estate investments
Fixed-income investments
2019 Q2 2019
Equity investments 15.6 % 3.0 %
Unlisted real estate
investments 2.5 % 0.8 %
Fixed-income investments 6.0 % 3.1 %
Source: Norges Bank Investment Management
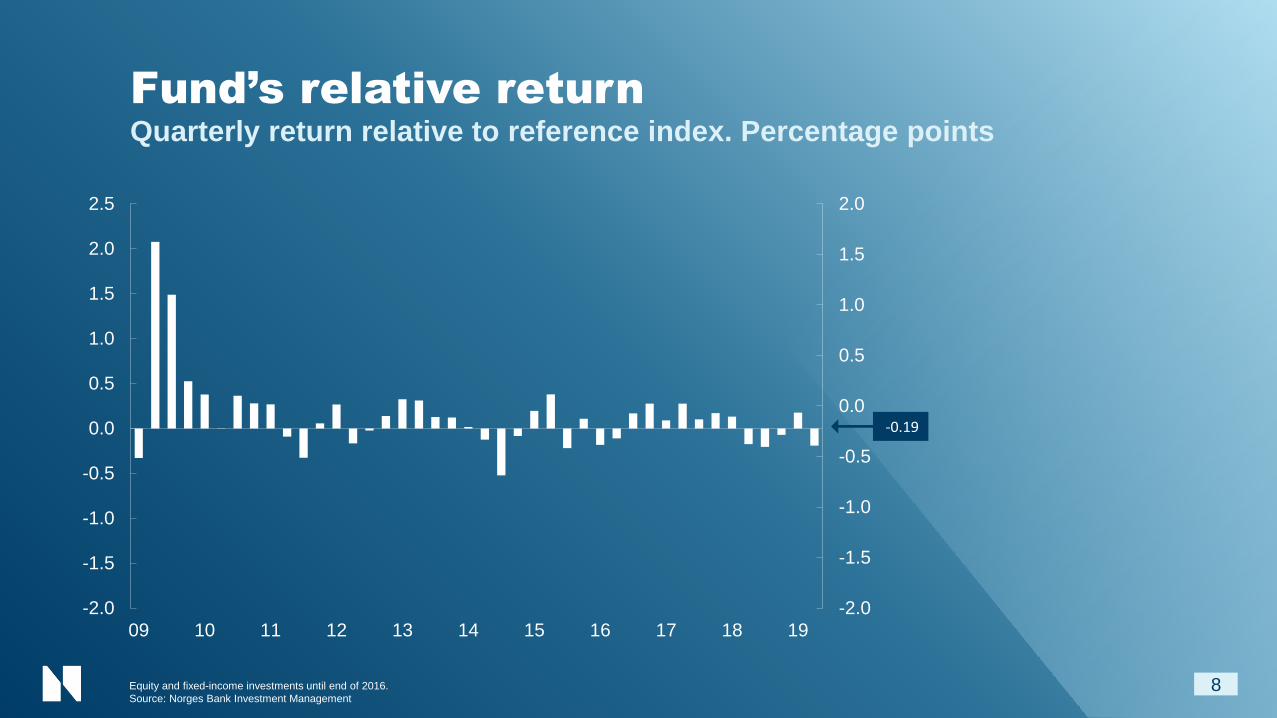
Fund’s relative returnQuarterly return relative to reference index. Percentage points
8Equity and fixed-income investments until end of 2016.
Source: Norges Bank Investment Management
-2.0
-1.5
-1.0
-0.5
0.0
0.5
1.0
1.5
2.0
-2.0
-1.5
-1.0
-0.5
0.0
0.5
1.0
1.5
2.0
2.5
09 10 11 12 13 14 15 16 17 18 19
-0.19

Changes in value since 1996Billions of kroner
9
30.06.2019 31.03.2019 31.12.2018
Total inflow of capital* 3,382 3,376 3,371
Total return on fund 4,660 4,404 3,666
Total management fees -46 -45 -44
Changes due to fluctuations in krone 1,165 1,203 1,263
Market value of the fund 9,162 8,938 8,256
Source: Norges Bank Investment Management
*Total inflow of capital is adjusted for accrued, not paid, management fees.

Key figures per second quarterMeasured in the fund’s currency basket. Annualised. Percent
10
Since 1.1.1998 Last 10 years
Return on fund 5.91 8.83
Annual inflation 1.79 1.73
Annual management costs 0.08 0.07
Annual net real return on fund 3.97 6.91
Source: Norges Bank Investment Management
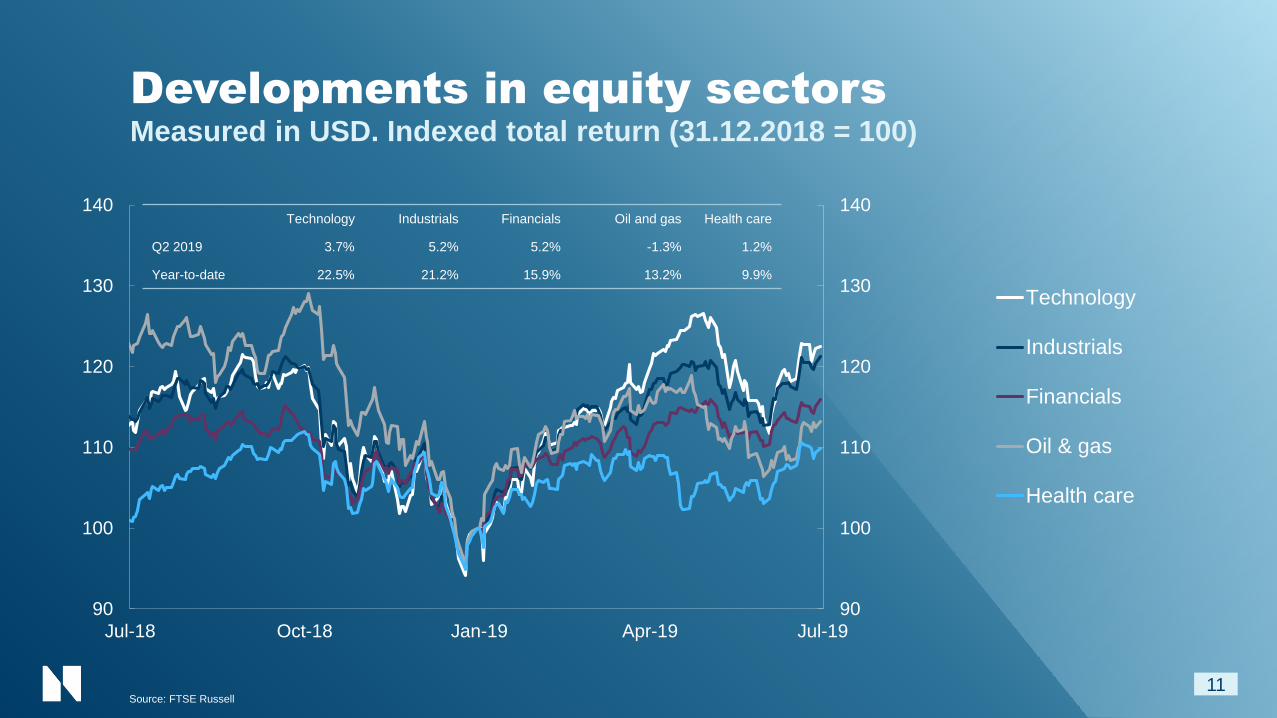
Developments in equity sectorsMeasured in USD. Indexed total return (31.12.2018 = 100)
11
90
100
110
120
130
140
90
100
110
120
130
140
Jul-18 Oct-18 Jan-19 Apr-19 Jul-19
Technology
Industrials
Financials
Oil & gas
Health care
Technology Industrials Financials Oil and gas Health care
Q2 2019 3.7% 5.2% 5.2% -1.3% 1.2%
Year-to-date 22.5% 21.2% 15.9% 13.2% 9.9%
Source: FTSE Russell

90
100
110
120
130
140
90
100
110
120
130
140
Jul-18 Oct-18 Jan-19 Apr-19 Jul-19
FTSE Global All Cap index*
Equity part of the fund'sreference index
S&P 500 (US)
Stoxx Europe 600 (Europe)
MSCI Asia Pacific (Asia)
Developments in equity marketsMeasured in the fund’s currency basket (S&P 500 and MSCI Asia Pacific in
USD, Stoxx Europe 600 in EUR). Indexed total return (31.12.2018 = 100)
12
FTSE Global
All Cap index*
Equity part of the fund’s
benchmark index S&P 500
Stoxx
Europe 600
MSCI Asia
Pacific
Q2 2019 3.1% 3.2% 4.3% 3.4% 0.9%
Year-to-date 16.2% 15.5% 18.5% 17.1% 10.7%
Source: Bloomberg
* Excluding Norway

10-year government bond yieldsPercent
13
-0.5
0.0
0.5
1.0
1.5
2.0
2.5
3.0
3.5
4.0
-0.5
0.0
0.5
1.0
1.5
2.0
2.5
3.0
3.5
4.0
Jul-18 Oct-18 Jan-19 Apr-19 Jul-19
Germany
US
Japan
UK
Spain
Italy
Source: Bloomberg

Large holdings with negative yieldPercent of fixed-income investments
14
0
5
10
15
20
25
0
5
10
15
20
25
Dec-14 Sep-15 Jun-16 Mar-17 Dec-17 Sep-18 Jun-19

10-year government bond yieldsPercent
15
0
2
4
6
8
10
12
14
16
18
20
22
0
2
4
6
8
10
12
14
16
18
20
22
Jul-18 Oct-18 Jan-19 Apr-19 Jul-19
Turkey
Brazil
South Africa
Indonesia
Mexico
Source: Bloomberg

Real estate acquisitions and disposals
ACQUISITIONS
DISPOSALS
Announced in the second quarter of 2019. Unlisted real estate
16
Location Sector Purchase price Share
Extended partnership 12 assets in Hudson
Square-area, New York, US
Office 831 million kroner 48 percent
Logistics properties in US/ Spain and the
Netherlands
Logistics 1.2 billion kroner 45/50 percent
Location Sector Sale price Share
«Die Welle» in An der Welle, Frankfurt, Germany Office 3.0 billion kroner 50 percent

Peak season for voting
▪ The second quarter accounts for around two-thirds of our voting in a year
• Voted at 6,918 meetings
• Evaluated and voted at 81,237 proposals
▪ We published three voting intentions during the quarter
• Voting at board members on regular intervals
• Board candidates for voting should be made public
• Reporting on water management
17

Observation and exclusions
18
▪ June: Revokal of exclusion of seven companies
▪ March: Exclusion of one company
▪ January: Exclusion of three companies
Announced in first half 2019

Highlights
19
▪ The market value of the fund increased by 224 billion kroner to 9,162 billion kroner
▪ The fund returned 3.0 percent in the second quarter of 2019
▪ The return on the fund was 0.19 percentage point lower than the return on the
reference index
▪ At the end of the quarter, the fund was invested as follows:
• Equity investments 69.3 percent
• Unlisted real estate investments 2.7 percent
• Fixed-income investments 28.0 percent

Government
Pension Fund
Global
Second quarter 2019
Oslo, 21 August 2019