Embed Size (px)
Citation preview

Government of the People’s Republic of BangladeshMinistry of Communications
Roads and Highways Department
ROAD ROUGHNESS SURVEY MANUAL
OCTOBER 2001
Ministry of Communication Road RoughnessRoads and Highways Department Survey Manual
E:\Documents\Roughness Manual\Road Roughness Survey Manual.docPage 2 (11)
TABLE OF CONTENTS
1. INTRODUCTION ................................................................................................... 3
2. TIMING OF ROUGHNESS MEASUREMENT....................................................... 3
3. EQUIPMENT NEEDED ......................................................................................... 3
3.1 DESCRIPTION OF EQUIPMENT ................................................................... 33.1.1 Vehicles .................................................................................................... 33.1.2 Bump Integrator ........................................................................................ 43.1.3 Distance Measurement Equipment .......................................................... 53.1.4 Merlin ........................................................................................................ 5
4. ACTIVITIES INVOLVED........................................................................................ 6
4.1 CALIBRATION OF CNS FARNELL DISTANCE ODOMETER ..................................... 64.2 DOING THE MERLIN EXERCISE ........................................................................... 6
4.2.1 Selection of site ........................................................................................ 74.2.2 Doing the MERLIN Survey ....................................................................... 74.2.3 Running Vehicles on Merlin Sites............................................................. 74.2.4 Doing the Regression Analysis................................................................. 8
5. DOING THE ACTUAL ROUGHNESS SURVEY................................................... 9
5.1.1 Survey team.............................................................................................. 95.1.2 Survey Methodology ............................................................................... 10
6. DATA ENTRY...................................................................................................... 11
Picture 1 Bump Integrator ........................................................................................... 4Picture 2 Counter Unit Bump Integrator...................................................................... 4Picture 3 Distance Meter............................................................................................. 5Picture 4 Merlin in use................................................................................................. 5Picture 5 Merlin Worksheet ......................................................................................... 8Picture 6 Regression analysis chart............................................................................ 9
Appendix 1 CNS Farnell Distance Odometer
Appendix 2 Merlin Manual

Ministry of Communication Road RoughnessRoads and Highways Department Survey Manual
E:\Documents\Roughness Manual\Road Roughness Survey Manual.docPage 3 (11)
1. INTRODUCTION
Maintenance of road is dependent on several factors, one of which is the condition ofthe pavement surface. To determine what treatment is necessary the condition of thesurface is to be known. Roughness is the measurement of riding quality, which inturn is the effect of total surface deterioration.
In Roads and Highways Department (RHD) the HDM Circle has the responsibility toproduce the priority list of the Annual Road Maintenance Programme using HDM-4software. Roughness of roads in terms of IRI has the greatest influence in the HDManalysis. So correct measurement of Roughness is a prerequisite for doing thecorrect HDM analysis.
In addition the HDM Circle of RHD is responsible to do the roughness measurementof all paved roads within the RHD Road Network. This instruction manual has beenprepared solely for use within RHD and describes the measurement methods thatare being adopted for the road roughness measurement.
This guide is accessible on the RHD Intranet:
2. TIMING OF ROUGHNESS MEASUREMENT
Roughness measurement is done annually preferably from October to December. Tomeasure the roughness of all paved roads takes about three months if 3 nos. ofvehicles are used for the survey.
3. EQUIPMENT NEEDED
Following equipment are needed for the roughness measurement:
• Vehicles (Pickup or Jeep)• Bump Integrator• Distance Measurement Equipment (CSN Farnell)• TRL MERLIN
Other materials and stationers required are:
• Paint and brush• Graph papers (cm scale)• Wooden pencils• Jute ropes
3.1 DESCRIPTION OF EQUIPMENT
3.1.1 Vehicles
Generally pickup and Jeep are well suited for the survey. Bump integrator is fitted onthe vehicle just above the rear axle. A steel hook is welded to the differential so that a

Ministry of Communication Road RoughnessRoads and Highways Department Survey Manual
E:\Documents\Roughness Manual\Road Roughness Survey Manual.docPage 4 (11)
steel wire can be connected tightly between the hook and the spring-loaded pulley ofthe bump integrator by passing the wire through a hole made in the body of thevehicle. There are many factors concerning the vehicle that will affect the readingsfrom the bump integrator:
• Stiffness of the vehicle suspension• Condition of the shock absorbers• Vehicle tyre pressure• Gross vehicle weight• General condition of the vehicle and engine• Speed of the vehicle• Driver behavior
RHD 3 nos. of pickups are being used since last few years for the roughnessmeasurement.
3.1.2 Bump Integrator
The unit works by sensing the movement between the body of the vehicle, to whichthe bump integrator (BI) is mounted, and the rear axle. A cable to a counter unitconnects the BI unit. This has two digital displays which can be switched on and offalternatively by a two-way switch. Each display has a clear button.
Picture 1 Bump Integrator
Picture 2 Counter Unit Bump Integrator

Ministry of Communication Road RoughnessRoads and Highways Department Survey Manual
E:\Documents\Roughness Manual\Road Roughness Survey Manual.docPage 5 (11)
3.1.3 Distance Measurement Equipment
For measuring the distance in kilometer, a CNS Farnell Distance Odometer is beingused. The manual is enclosed with this instruction guide for reference (Appendix -1).
Picture 3 Distance Odometer
3.1.4 Merlin
The MERLIN is a Machine for Evaluating Roughness using Low-costINstrumentation. The Transport Research Laboratory (TRL) of United Kingdomdevised this equipment. The Merlin manual of TRL is enclosed herewith for reference(Appendix -2).
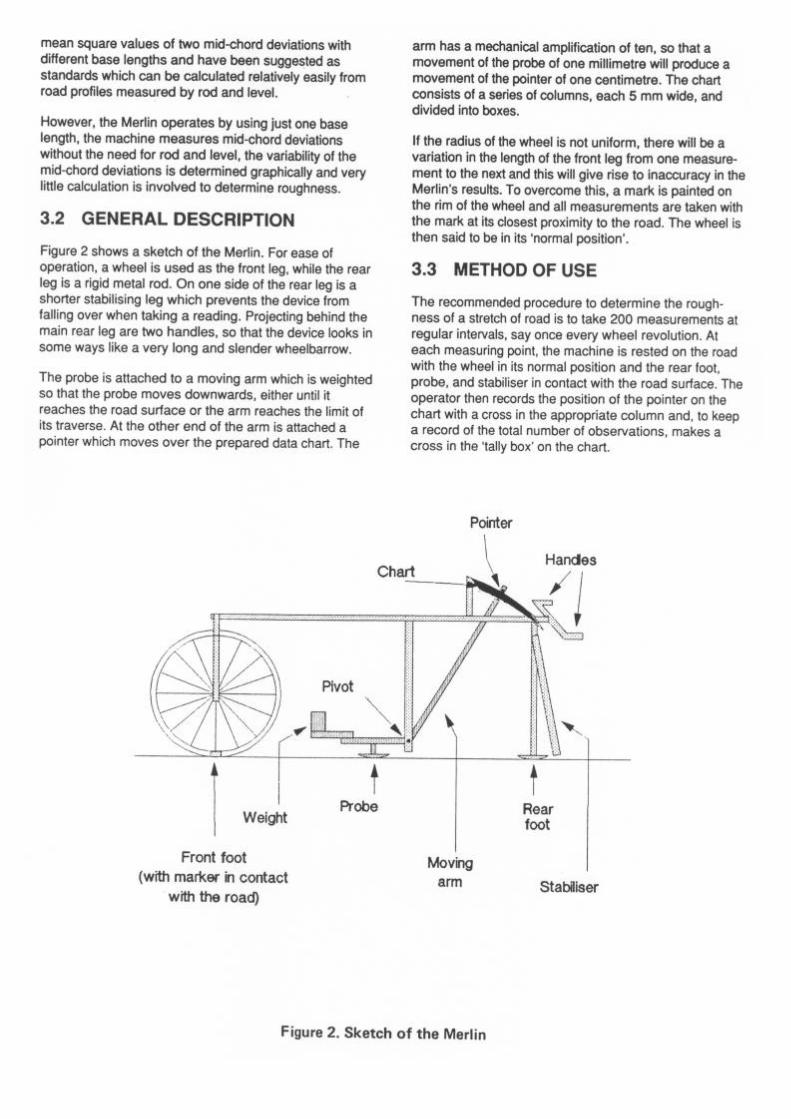
Merlin is simple low-cost roughness measurement instrument that can bemanufactured locally. The instrument can be used for direct roughness measurementor for calibrating other equipment like Bump Integrator. In RHD Merlin is used forcalibrating purpose. It consists of a metal frame 1.8 meters long with a wheel at thefront, a foot at the rear and a probe midway between them which rests on the roadsurface. The probe is attached to a moving arm, at the other end of, which is apointer that moves over a chart. The Merlin is wheeled on the road and at every turnof the wheel the position of the pointer is recorded on the chart to build up ahistogram. The width of the histogram can be used to give a good estimate ofroughness in terms of International Roughness Index (IRI).
The critical measurements are the ratio of the long and short sections of the movingarm that must be 10. If there is any deviation from this ratio, a correction factor mustbe used to obtain the correct roughness from the Merlin measurement. As anexample, if the ratio of the sections of the moving arm is 9.75 then the movement ofthe pointer will be less by a factor of 0.975 (9.75/10). Therefore, the width of thehistogram (D) will have to be increased by a multiplying factor of 1.03 (10/9.75) toget the correct roughness
Picture 4 Merlin in use

Ministry of Communication Road RoughnessRoads and Highways Department Survey Manual
E:\Documents\Roughness Manual\Road Roughness Survey Manual.docPage 6 (11)
4. ACTIVITIES INVOLVED
The roughness survey requires several activities of which each one has the effect onthe other. The activities are as follows.
4.1 Calibration of CNS Farnell Distance Odometer
During the actual survey bump readings are noted after travelling every 0.5-km ofroad. Therefore a correct calibration of the distance odometer is required.
See the enclosed CNS Farnell Distance Odometer Manual for instructions.
4.2 Doing the Merlin Exercise
This is done to get the correct roughness of a particular portion of a road so that if avehicle fitted with a Bump Integrator is run over that portion, the relative bump countsfor the known roughness could be known. In this way if the relative roughness andbump counts of say 10 sites of different roughness are known, then a relationshipbetween the roughness and bumps can be established by doing a regressionanalysis.
In RHD generally 10 to 11 sites are surveyed with Merlin to obtain the actualroughness of individual site. The sites are initially selected in such a way to givevarying roughness low and high. Each survey vehicle is then run on those sites toobtain the bump counts against the corresponding roughness of sites and lastly theregression analysis is done to get the relationship of roughness and bump counts ofindividual vehicle.

Ministry of Communication Road RoughnessRoads and Highways Department Survey Manual
E:\Documents\Roughness Manual\Road Roughness Survey Manual.docPage 7 (11)
4.2.1 Selection of site
Selection of site is very important because sites should be of varying roughness lowand high. It may be difficult to get the road with low roughness and similar the casewith high roughness. However, from the experience it was seen that roads of lowroughness like 2.00 IRI were available and on the high range 8.00 to 8.50 or 9.00were also available. Use the bump integrator and the distance odometer during siteselection. When driving upon a test site have the bump integrator on and keep thedistance odometer open. Note down the bump counts for every 0.5-km. The more thebump counts the more will be the possible roughness.
4.2.2 Doing the MERLIN Survey
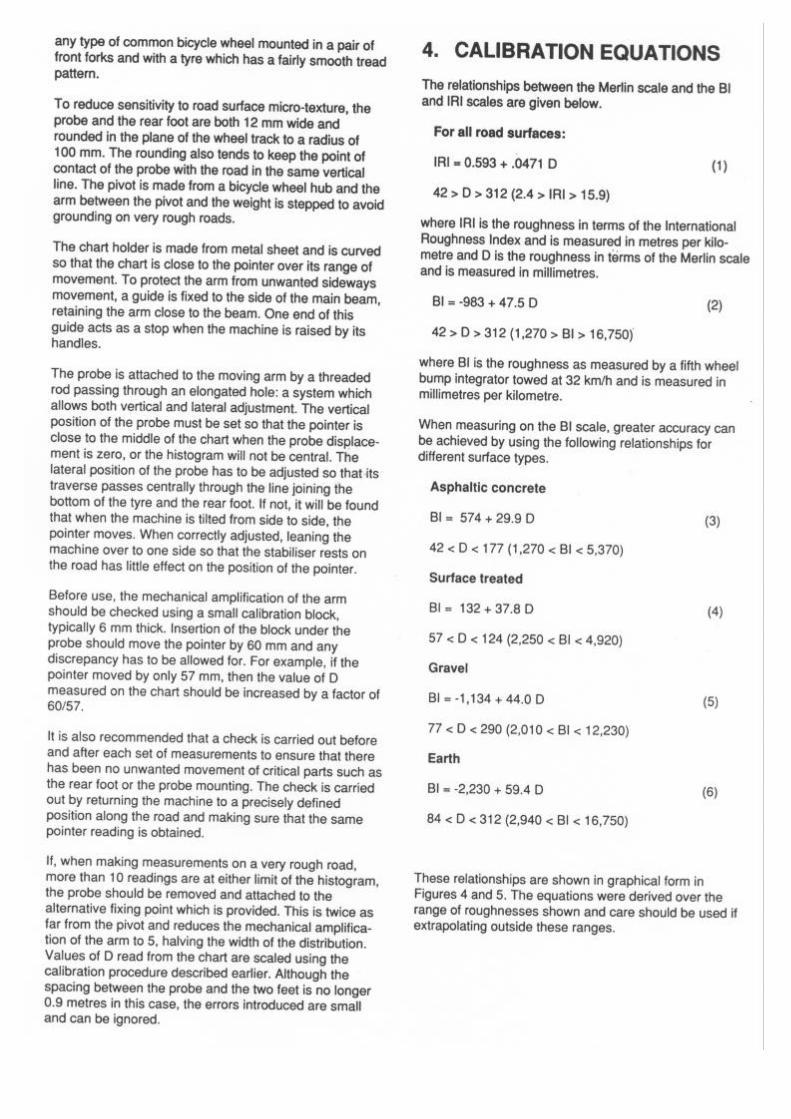
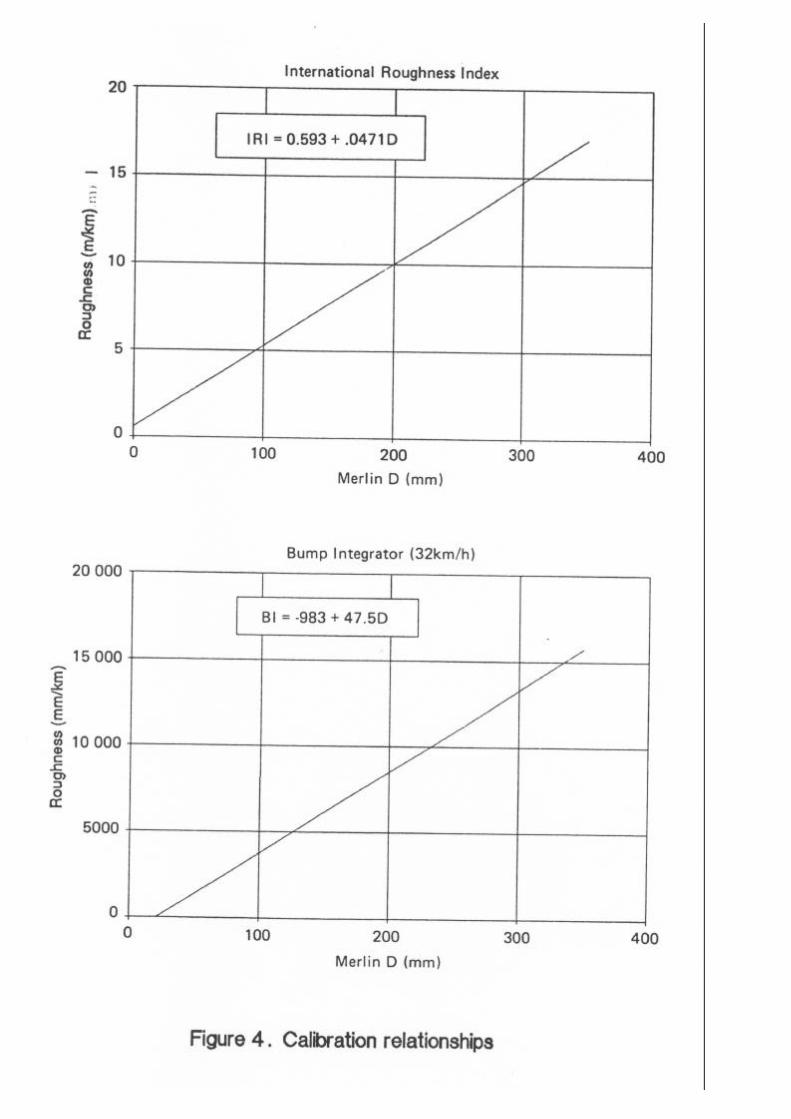
Generally two Merlins are used for the survey. Put a mark on the rod with paint at thestarting. Place the Merlins side by side so that each Merlin is on the wheel track, theouter and the inner. Always follow the left side of the road. One vehicle should be atthe back of the survey team and the other at the front with flags for the safety reason.Fix graph sheets on the steel plates of the Merlins over which the pointer moves.Now move the Merlin forward one complete rotation of the wheel, see the position ofthe pointer and put a cross mark on the graph sheet. In this way after every rotationof the Merlin put a mark on the graph sheet at the position of the pointer. Continuedoing this for 200 rotations of the Merlin wheel and again put a mark on the road bydrawing a line by paint. To keep a correct counting of the no of rotations, a tally boxof 200 small squares of the graph sheet can be utilized. After every rotation onesquare can be marked so that after 200 rotations the 200 squares of the tally box willbe completely marked. When 200 rotations will be completed, a histogram like theone shown below will be built in the graph paper. The positions mid-way between thetenth and the eleventh crosses, counting in from each end of the distribution, aremarked on the chart below the columns. It may be necessary to interpolate betweencolumn boundaries as shown in the figure below. The spacing between the twomarks, D, is then measured in millimeters and this is the roughness on the Merlinscale. It is to be noted that the final D-value will be the average of D-values obtainedfrom two Merlins. Once the final D-value is obtained substitute it the standard formulagiven the Merlin guide to get the roughness in IRI. The formula is as follows.
IRI=0.593+0.0471D
Where,
IRI is the roughness in terms of International Roughness Index in meters perkilometer.D is the roughness in terms of Merlin scale in millimeters (the base of the histogram)
Do the Merlin survey in 10 or 11 sites of varying roughness.
4.2.3 Running Vehicles on Merlin Sites
When the Merlin survey is completed, the vehicles fitted with Bump Integrators are tobe run on the sites to get the bump readings corresponding to the roughness of every

Ministry of Communication Road RoughnessRoads and Highways Department Survey Manual
E:\Documents\Roughness Manual\Road Roughness Survey Manual.docPage 8 (11)
site. Bump readings are to be taken for the distance between the paint marks putduring the survey. Be sure that the vehicle is run at a speed of 20-mph (32 km/h). Toattain the speed, start running the vehicle from at least 100m back of the startingmark. When the vehicle reaches the start mark, make the Bump Integrator on andstop the Bump Integrator at the end mark. Note down the bump count thus obtained.Do this exercise several times to get at least four consistent readings and averagethem. This average bump reading represents the bump count against the roughnessobtained by Merlin. In this way run other survey vehicles in each site and get thecorresponding bump counts against the roughness.
4.2.4 Doing the Regression Analysis
On next page is a worksheet showing the data of nine Merlin sites. The D-value ofeach Merlin has been corrected using the correction factors of Merlins.
Picture 5 Merlin Worksheet
Left Merlin Right MerlinSiteNo
Date ofsurvey
MerlinNo
Dvalue
CorrectedD-value
MerlinNo
Dvalue
CorrectedD-value
AverageD-value
IRIm/km
BumpReading
Car-1
Bumpreading /
Km
4 15/11/2000 2 25 29 1 25 28 29 1.9 44 98
5 15/11/2000 2 28 33 1 27 30 31 2.1 44 98
1 15/11/2000 2 69 80 1 68 76 78 4.3 119 267
9 16/11/2000 2 84 98 1 74 83 90 4.9 133 296
2 15/11/2000 2 86 100 1 73 82 91 4.9 128 287
3 15/11/2000 2 88 103 1 75 84 93 5.0 126 282
8 16/11/2000 2 88 103 1 89 100 101 5.4 155 347
6 16/11/2000 2 99 115 1 90 101 108 5.7 152 339
7 16/11/2000 2 113 132 1 110 123 128 6.6 187 418
Length of every Merlin site = 446.97-m
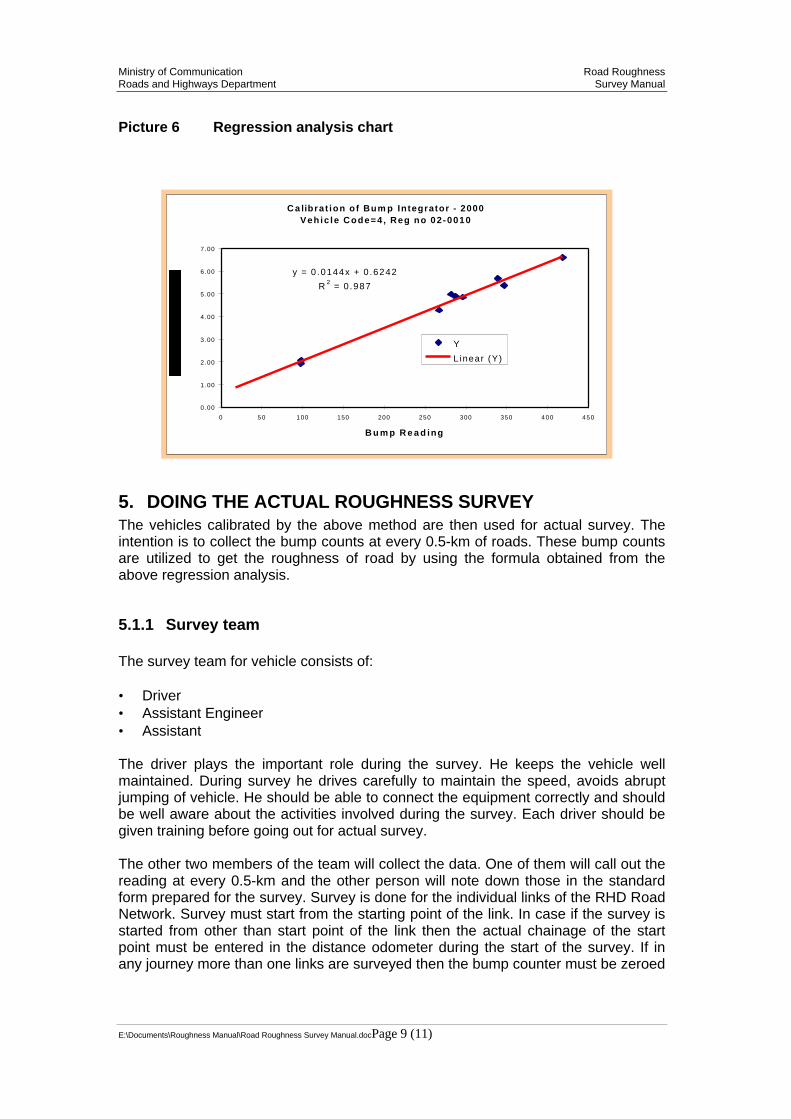
The regression analysis chart with the line fit plot and the formula obtained for theRoughness and Bump-count relationship is shown below.
Ministry of Communication Road RoughnessRoads and Highways Department Survey Manual
E:\Documents\Roughness Manual\Road Roughness Survey Manual.docPage 9 (11)
Picture 6 Regression analysis chart
5. DOING THE ACTUAL ROUGHNESS SURVEYThe vehicles calibrated by the above method are then used for actual survey. Theintention is to collect the bump counts at every 0.5-km of roads. These bump countsare utilized to get the roughness of road by using the formula obtained from theabove regression analysis.
5.1.1 Survey team
The survey team for vehicle consists of:
• Driver• Assistant Engineer• Assistant
The driver plays the important role during the survey. He keeps the vehicle wellmaintained. During survey he drives carefully to maintain the speed, avoids abruptjumping of vehicle. He should be able to connect the equipment correctly and shouldbe well aware about the activities involved during the survey. Each driver should begiven training before going out for actual survey.
The other two members of the team will collect the data. One of them will call out thereading at every 0.5-km and the other person will note down those in the standardform prepared for the survey. Survey is done for the individual links of the RHD RoadNetwork. Survey must start from the starting point of the link. In case if the survey isstarted from other than start point of the link then the actual chainage of the startpoint must be entered in the distance odometer during the start of the survey. If inany journey more than one links are surveyed then the bump counter must be zeroed
C a librat ion of Bum p Integrator - 2000Veh ic le Code=4 , Reg no 02-0010
y = 0 .0144x + 0 .6242
R 2 = 0 .987
0.00
1.00
2.00
3.00
4.00
5.00
6.00
7.00
0 50 100 150 200 250 300 350 400 450
B u m p R e a d ing
Y
L inear (Y)

Ministry of Communication Road RoughnessRoads and Highways Department Survey Manual
E:\Documents\Roughness Manual\Road Roughness Survey Manual.docPage 10 (11)
at the start of each link and similarly the distance odometer should also be zeroed toavoid mistakes in writing the chainage.
5.1.2 Survey Methodology
Prepare the equipment:
• Ensure that the wire of bump integrator is properly suspended with the hookbelow.
• Connect the cables of the bump counters and the distance odometer properly.• Check that Bump counter and distance odometer displays are OK.• Switch on the distance odometer.• Turn the two-way switch of bump counter to counter1. Do not switch on.
The team is now ready to start the survey. Proceed as follows:
1. Position the vehicle about 50 to 100 meters back of the starting point of thesurvey.
2. Start driving the vehicle so that it gains the proper speed (32 km/h) at the startpoint.
3. As soon as the vehicle reaches the start point operate the distance odometer andthe bump integrator simultaneously. Make sure that the distance odometer aswell as the bump integrator is switch on.
4. As the vehicle moves along the road, the bump counter will display the bumpreadings and will continue to increase as the vehicle gets bump during running.The distance odometer will continue to display the actual distance beingtravelling.
5. When the vehicle reaches 0.5 km (as will be seen in the distance odometer) turnthe two-way switch of bump integrator to counter-2. This will cause the counter-2to continue displaying the bump reading and counter-1 will stop recording. Readthe reading of counter-1 and call out so that the assistant can note down thereading in the form.
6. When the vehicle reaches 1.0 km turn the two-way switch towards counter-1.Now counter-1 will again continue to display cumulative readings and counter-2will stop recording bumps. Read the reading on counter-2 and call out. Alsorecord the time.
7. In this way continue driving vehicle and at each 0.5-km read the correspondingbump counts and time and record those on the sheet.
8. Stop the vehicle when the survey for a link is completed.9. Please record the closing distance exactly from the distance odometer. The final
section, which is less than 0.5 km is, called the closing fraction.
At this point please note that if the link you surveyed is a narrow road (single lane say4m) then you do not need to survey back to the start of the link. Otherwise you willhave to collect bump readings of the other side of the road by doing a back surveyfrom the end of the link to the start point. During the back journey, record the bumpcounts against the corresponding chainage already recorded in the sheet whichmeans that you have to start writing bump counts on the sheet from bottom to top.
During back journey repeat step 1 and 2 above. Drive to the distance amounting tothe closing fraction and clear the distance odometer. Read the bump reading and
Ministry of Communication Road RoughnessRoads and Highways Department Survey Manual
E:\Documents\Roughness Manual\Road Roughness Survey Manual.docPage 11 (11)
record it on the form. After that read the bump counts at every 0.5-km and recordaccordingly.
6. DATA ENTRY
The RMMS software of RHD includes standard data entry screen in which thesurveyed bump counts are entered so that data is automatically stored in the RHDserver. Please see the RMMS user manual for detail information about roughnessdata entry, data editing and reports.

Appendix 1
CNS Farnell Distance Odometer

APPENDIX 2
MERLIN MANUAL