Embed Size (px)
Citation preview

The Prospectus has been drawn up in accordance with the rules of the Regional Government Securities Market. The Regional Debt Coordinating Committee and Eastern Caribbean Central Bank accept no responsibility for the content of this Prospectus, make no representations as to its accuracy or completeness and expressly disclaim any liability whatsoever for any loss whatsoever arising from or reliance upon the whole or any part of the contents of this Prospectus. This prospectus is issued for the purpose of giving information to the public. If you are in doubt about the contents of this document or need financial or investment advice you should consult a person licensed under the Securities Act or any other duly qualified person who specializes in advising on the acquisition of government instruments or other securities.
GOVERNMENT OF THE COMMONWEALTH OF DOMINICA
PROSPECTUS
For
EC$80 Million, 91 day Treasury bills (Series A: ECD 20M; Series B: ECD 20M; Series C: ECD 20M; Series D: ECD 20M)
Ministry of Finance Financial Centre Kennedy Avenue
Roseau DOMINICA
Telephone: (767) 266-3221 Fax: (767) 448-0054 Email: [email protected]
PROSPECTUS DATE: NOVEMBER 2018

2

3
TABLE OF CONTENTS Notice to Investors ...............................................................................................................4 Abstract ...............................................................................................................................5 I. General Information .............................................................................................................6 II. Issue Information .................................................................................................................7 III. History .................................................................................................................................9 IV. Demographics………………………………………………………………………………..10 V. Political………………………………………………………………………………………11 VI. Management and Administration of Public Finance………………………………………..11 VII. Public Debt Overview………………………………………………………………………13
VIII.Macro-Economic Performance ........................................................................................ 119
IX. Fiscal Performance ............................................................................................................. 22
X. Prospects……………………………………………………………………………………...27 XI. Security Issuance Procedures, Clearance and Settlement……………………………………28 XII. Appendices…………………………...……………………………………………………..29

4
Notice to Investors
This prospectus is issued for the purposes of giving information to the public. The Government of
the Commonwealth of Dominica (GOCD) affirms the accuracy of the information contained herein
and accepts full responsibility for the same. The GOCD confirms that, having made all reasonable
inquiries, this prospectus contains all information material in the context of the securities being
issued, and to the best of its knowledge there are no other facts, the omission of which would cause
the information in this prospectus to be misleading.
This prospectus and its content are issued for the specific securities described herein. Should you
need advice, you should consult a person licensed under the Securities Act or any other duly
qualified person who specializes on advising on the acquisition of Governments instruments or
other securities.
The ultimate decision and responsibility to proceed with any transaction with respect to this
offering rests solely with you. Therefore, prior to entering into the proposed investment, you
should determine the economic risks and merits, as well as the legal, tax and accounting
characteristics and consequences of this Bill offering, and that you are able to assume those risks.
This Prospectus and its content are issued for the specific securities described.

5
Abstract
The Government of the Commonwealth of Dominica (thereafter referred to as GOCD) proposes
to raise a total of EC$80 Million on the Regional Government Securities Market (RGSM) through
the issue of the following securities:
• Four 91 day Treasury bills:
EC$20 Million, with a maximum bid price of 6%
EC$20 Million, with a maximum bid price of 6%
EC$20 Million, with a maximum bid price of 6%
EC$20 Million, with a maximum bid price of 6%
The securities will be issued under the authority of the Treasury Bills Act No. 5 of 2010 of the
Commonwealth of Dominica.
The securities will be issued on the Regional Government Securities Market (RGSM) in the
months of February 2019, May 2019, August 2019, and November 2019, and traded on the
Secondary Market trading platform of the Eastern Caribbean Securities Exchange (ECSE) as
follows:
Issue amount: EC$80 Million
Auction Date Tenor/Type Amount Trading Symbol Settlement Date Maturity Date
13th February 2019 91 Day T-bill EC$20.0 Million DMB160519 14th February 2018 16th May 2019
17th May 2019 91 day T-bill EC$20.0 Million DMB190819 20th May 2019 19th August 2019
20th August 2019 91 day T-bill EC$20.0 Million DMB201119 21st August 2019 20th November 2019
21st November 2019 91 day T-bill EC$20.0 Million DMB210220 22nd November 2019 February 21 2020
Bidding will commence at 9:00 a.m. and will be closed at 12:00 noon on the auction day.

6
I. General Information
Issuer: Government of the Commonwealth of Dominica (GOCD)
Address: Ministry of Finance
Financial Centre
Roseau
Commonwealth of Dominica
Email: [email protected]
Telephone No.: (767) 266-3221
Facsimile No.: (767) 448-0054
Contact Persons: Hon. Mr. Roosevelt Skerrit, Prime Minister and Minister for
Finance
Mrs. Rosamund Edwards, Financial Secretary
Mrs. Beverly Pinard, Accountant General
Issue Dates: 13th February 2019
17th May 2019
20th August 2019
21st November 2019
Types of Securities: Four 91 day Treasury bills
Amount of Issue: EC$20 million 91 day Treasury bill with a maximum bid
price of 6%
EC$20 million 91 day Treasury bill with a maximum bid
price of 6%
EC$20 million 91 day Treasury bill with a maximum bid
price of 6%
EC$20 million 91 day Treasury bill with a maximum bid
price of 6%

7
Use of Proceeds: The proceeds of this issue will be used to finance part of the
GOCD operational budget and to refinance existing GOCD
debt.
Legislative Authority: The Treasury Bills Act No. 5 of 2010 of the Commonwealth
of Dominica.
II. Information about the Issues
Method of Issue: The price of the issue will be determined by a competitive
uniform price auction with open bidding
Listing: The securities will be issued on the RGSM and traded on the
Eastern Caribbean Securities Exchange (ECSE), the
secondary market trading platform.
Minimum Bid Amount: The minimum bid quantity is EC $5,000.
Bid Multiplier: The bid multiplier will be EC $1,000.
Bidding Period: The bidding period will start at 9:00 a.m. and end at
12:00 noon on the auction day.
Bid Limitation: Each investor is limited to one (1) bid with the option of
increasing the amount being tendered or reducing the interest
rate offered until the close of the bidding period.
Taxation: Yields on these securities will not be subject to any tax, duty
or levy by Eastern Caribbean Currency Union (ECCU)
participating Governments.
Participation: Investors may participate in the auction through licensed
financial intermediaries on the Eastern Caribbean Securities
Exchange (ECSE).

8
List of Intermediaries: The Bank of Nevis Limited
St. Kitts-Nevis-Anguilla National Bank Ltd
Bank of St. Lucia Limited
First Citizens Investment Services Limited
Bank of St Vincent and the Grenadines Limited
Grenada Co-operative Bank Limited
Currency of Issue: All currency references are to Eastern Caribbean Dollars
unless otherwise specified.
Trading Symbol
Amount of Issue
Tenor Max Bid Price
Auction Date Settlement Date
Matuirity Date
DMB160519 EC $20 million
91 days 6.0% 13th February 2019
14th February 2019
16th May 2019
DMB190819 EC $20 million
91 days 6.0% 17th May 2019 20th May 2019
19th August 2019
DMB120219 EC $20 million
91 days 6.0% 20th August, 2019
21st August 2019
20th November 2019
DMB210220 EC $20 million
91 days 6.0% 21st November 2019
22nd November 2019
21th February 2020

9
III. History
Nicknamed the “Nature Island of the Caribbean”, Dominica is reputed as an unspoiled nature
haven and the quintessential eco-tourism destination in the Caribbean. The country’s early
inhabitants, the Kalinago (Island Caribs), named the island Wai'tukubuli, meaning ‘Tall is her
body’; a fitting description of the country’s mountainous interior.
Largely due to Dominica's position between Martinique and Guadeloupe, France eventually
became predominant, and a French settlement was established and grew. The island became a
British possession following the 1763 Treaty of Paris which ended the Seven Years' War between
Britain and France. The French successfully invaded in 1778 with the active cooperation of the
population. The island was subsequently returned to British rule by the1783 Treaty of Paris.
French invasions in 1795 and 1805 ended in failure.
Britain established a legislative assembly, representing only the white population in 1763. With
the liberalization of racial attitudes around 1831 came the Brown Privilege Bill which conferred
political and social rights on free nonwhites. Three Blacks were elected to the legislative assembly
the following year. Slavery was abolished in 1838 and Dominica became the first and only British
Caribbean colony with a Black-controlled legislature in the 19th century.
Dominica became part of the Leeward Island Federation in 1871 and the Crown Colony
government was re-established in 1896. Political rights for the vast majority of the population were
curtailed.
Heightened political consciousness post World War I led to a Representative Government
Association. The group successfully captured one-third of the popularly elected seats of the
legislative assembly in 1924 and one-half in 1936. Dominica subsequently was transferred from
the Leeward Island Administration and was governed as part of the Windward’s until 1958, when
it joined the short-lived West Indies Federation.
After the federation was dissolved, Dominica became an associated state of the United Kingdom
in 1967 and formally took responsibility for its internal affairs. On November 3, 1978, the
Commonwealth of Dominica was granted independence by the United Kingdom. (State, 2010)

10
IV. Demographics
As of 2011 Dominica’s population was estimated at 71,293 with an annual growth rate of -0.6%
and density of 96.5 per square kilometer. Males account for 51.1% of the total population while
females account for 48.9%. GDP per capita was estimated at EC$ 19,997. Life expectancy at birth
is 74.1 years while infant mortality per thousand live births is 13. Adult literacy is 88%. According
to the most recent Country Poverty Assessment (2010), the unemployment rate has declined from
25 to 14 percent.
Table 1 - Age distribution of the Dominican population
Age Group Males Females Total
% of Total
Population
0-4 3,328 3,140 6,468 8.9
5-9 4,046 3,689 7,735 10.6
10-14 3,643 3,631 7,274 10.0
15-19 3,534 3,447 6,981 9.6
20-24 2,496 2,191 4,687 6.4
25-29 2,663 2,580 5,243 7.2
30-34 2,955 2,844 5,799 8.0
35-39 2,908 2,513 5,421 7.4
40-44 2,474 2,108 4,582 6.3
45-49 1,993 1,652 3,645 5.0
50-54 1,502 1,385 2,887 4.0
55-59 1,238 1,210 2,448 3.4
60-64 1,046 1,262 2,308 3.2
65-69 1,117 1,262 2,379 3.3
70-74 891 996 1,887 2.6
75-79 610 754 1,364 1.9
80-84 372 576 948 1.3
85+ 304 567 871 1.2
Total 37,120 35,807 72,927
Source: Central Statistics Office
Ability to influence future growth and demand for services
Education
During the review period the education policy of Government was geared towards improving the
quality and relevance of the education system. Government was primarily focused on changing
the nature, form and content of primary and secondary education, while strengthening and
expanding welfare and support services and developing a quality system for Technical Vocational
11
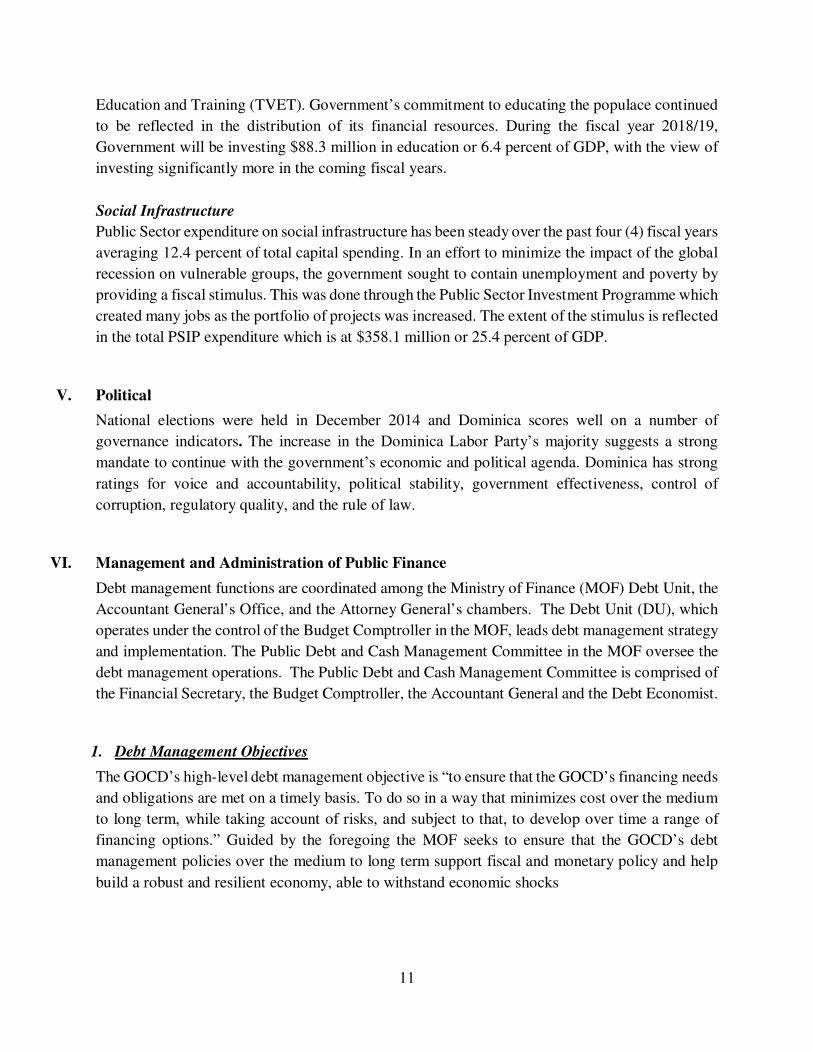
Education and Training (TVET). Government’s commitment to educating the populace continued
to be reflected in the distribution of its financial resources. During the fiscal year 2018/19,
Government will be investing $88.3 million in education or 6.4 percent of GDP, with the view of
investing significantly more in the coming fiscal years.
Social Infrastructure
Public Sector expenditure on social infrastructure has been steady over the past four (4) fiscal years
averaging 12.4 percent of total capital spending. In an effort to minimize the impact of the global
recession on vulnerable groups, the government sought to contain unemployment and poverty by
providing a fiscal stimulus. This was done through the Public Sector Investment Programme which
created many jobs as the portfolio of projects was increased. The extent of the stimulus is reflected
in the total PSIP expenditure which is at $358.1 million or 25.4 percent of GDP.
V. Political
National elections were held in December 2014 and Dominica scores well on a number of
governance indicators. The increase in the Dominica Labor Party’s majority suggests a strong
mandate to continue with the government’s economic and political agenda. Dominica has strong
ratings for voice and accountability, political stability, government effectiveness, control of
corruption, regulatory quality, and the rule of law.
VI. Management and Administration of Public Finance
Debt management functions are coordinated among the Ministry of Finance (MOF) Debt Unit, the
Accountant General’s Office, and the Attorney General’s chambers. The Debt Unit (DU), which
operates under the control of the Budget Comptroller in the MOF, leads debt management strategy
and implementation. The Public Debt and Cash Management Committee in the MOF oversee the
debt management operations. The Public Debt and Cash Management Committee is comprised of
the Financial Secretary, the Budget Comptroller, the Accountant General and the Debt Economist.
1. Debt Management Objectives
The GOCD’s high-level debt management objective is “to ensure that the GOCD’s financing needs
and obligations are met on a timely basis. To do so in a way that minimizes cost over the medium
to long term, while taking account of risks, and subject to that, to develop over time a range of
financing options.” Guided by the foregoing the MOF seeks to ensure that the GOCD’s debt
management policies over the medium to long term support fiscal and monetary policy and help
build a robust and resilient economy, able to withstand economic shocks

12
2. Debt management Strategy
The overall debt management strategy hinges on the objectives of minimizing borrowing costs.
The GOCD recognizes the need to factor the impact of fluctuations in exchange rates on debt
servicing costs and takes this into account in formulating its debt management strategy. The
underlying elements guiding the strategy are:
• Limiting variable interest rate funding to no more than 15% of the public debt portfolio;
• Limiting non-US dollar external financing to a maximum of 20% of the public debt
portfolio;
• Maintaining an Average Time to Maturity (ATM) of 9 years to minimize refinancing risk’
• Maintaining government guaranteed debt at 17% of total debt stock.
The overall debt management strategy also includes the provision of legal borrowing limits. The
issuance of Treasury Bills, for example, is limited to EC$80.0 million. Additionally, the authorities
have capped the overdraft facility at $31.5 million in totality. There are no borrowing limits for
loans and bonds.
3. Transparency and Accountability
The GOCD is continuously seeking ways of improving its systems of accountability and
transparency. As the authorities continue to adopt more prudent and transparent fiscal management
practices, they intend to continue to utilize the Regional Government Securities Market (RGSM).
As a consequence, disclosure of information on the cash flow and debt stock will be made available
bi-annually to all investors, consistent with the rules of the Regional Debt Coordinating Committee
(RDCC).
4. Institutional Framework
The Debt Unit (DU) of the Ministry of Finance (MOF) of the GOCD is charged with the
responsibility of administering the Government’s debt portfolio on a day-to-day basis and
implementing the Government’s borrowing strategy. The unit is directly accountable to the Budget
Comptroller.
5. Risk Management Framework
The establishment of an effective and efficient debt management system as a major element of
economic management is of paramount importance to the government of the Commonwealth of
Dominica. Accordingly, attempts have been made to strengthen the capacity of the debt unit (DU).
Consequently, the DU’s functions have been broadened to include:
• Assisting in the formulation of debt management strategies and policies
• Managing the debt portfolio to minimize cost with an acceptable risk profile
• Conducting risk analysis and developing risk management policies; and
13
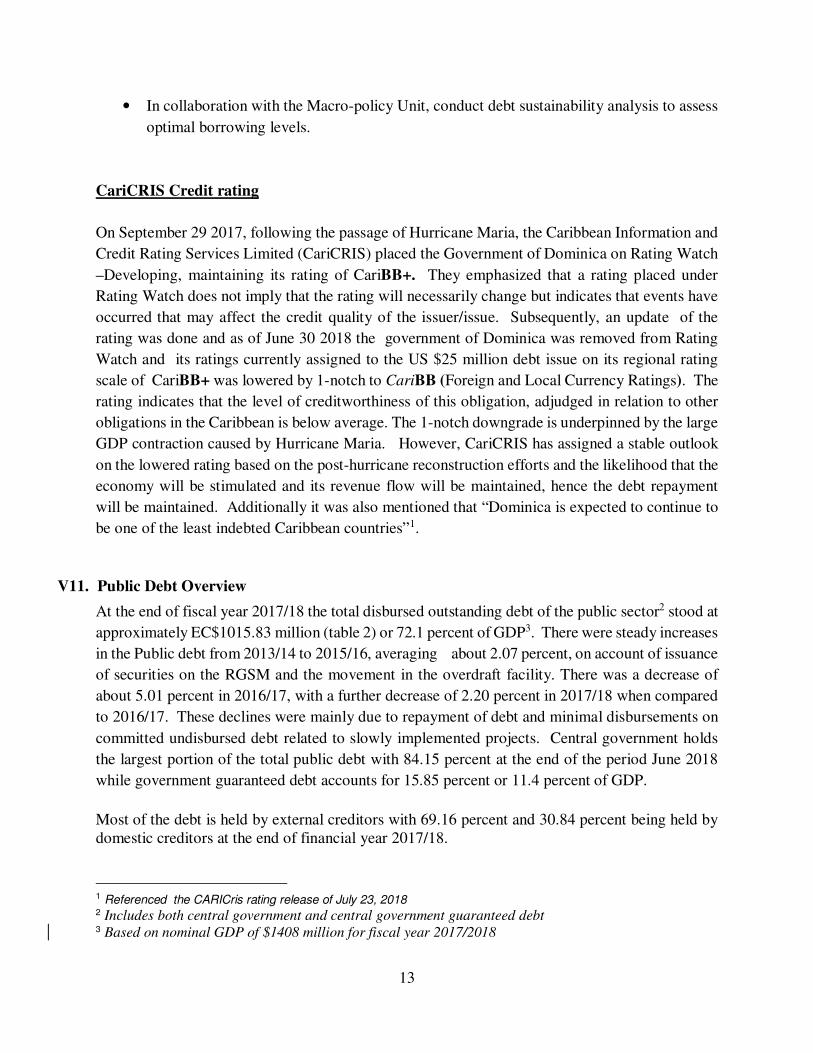
• In collaboration with the Macro-policy Unit, conduct debt sustainability analysis to assess
optimal borrowing levels.
CariCRIS Credit rating
On September 29 2017, following the passage of Hurricane Maria, the Caribbean Information and
Credit Rating Services Limited (CariCRIS) placed the Government of Dominica on Rating Watch
–Developing, maintaining its rating of CariBB+. They emphasized that a rating placed under
Rating Watch does not imply that the rating will necessarily change but indicates that events have
occurred that may affect the credit quality of the issuer/issue. Subsequently, an update of the
rating was done and as of June 30 2018 the government of Dominica was removed from Rating
Watch and its ratings currently assigned to the US $25 million debt issue on its regional rating
scale of CariBB+ was lowered by 1-notch to CariBB (Foreign and Local Currency Ratings). The
rating indicates that the level of creditworthiness of this obligation, adjudged in relation to other
obligations in the Caribbean is below average. The 1-notch downgrade is underpinned by the large
GDP contraction caused by Hurricane Maria. However, CariCRIS has assigned a stable outlook
on the lowered rating based on the post-hurricane reconstruction efforts and the likelihood that the
economy will be stimulated and its revenue flow will be maintained, hence the debt repayment
will be maintained. Additionally it was also mentioned that “Dominica is expected to continue to
be one of the least indebted Caribbean countries”1.
V11. Public Debt Overview
At the end of fiscal year 2017/18 the total disbursed outstanding debt of the public sector2 stood at
approximately EC$1015.83 million (table 2) or 72.1 percent of GDP3. There were steady increases
in the Public debt from 2013/14 to 2015/16, averaging about 2.07 percent, on account of issuance
of securities on the RGSM and the movement in the overdraft facility. There was a decrease of
about 5.01 percent in 2016/17, with a further decrease of 2.20 percent in 2017/18 when compared
to 2016/17. These declines were mainly due to repayment of debt and minimal disbursements on
committed undisbursed debt related to slowly implemented projects. Central government holds
the largest portion of the total public debt with 84.15 percent at the end of the period June 2018
while government guaranteed debt accounts for 15.85 percent or 11.4 percent of GDP.
Most of the debt is held by external creditors with 69.16 percent and 30.84 percent being held by domestic creditors at the end of financial year 2017/18.
1 Referenced the CARICris rating release of July 23, 2018 2 Includes both central government and central government guaranteed debt 3 Based on nominal GDP of $1408 million for fiscal year 2017/2018

14
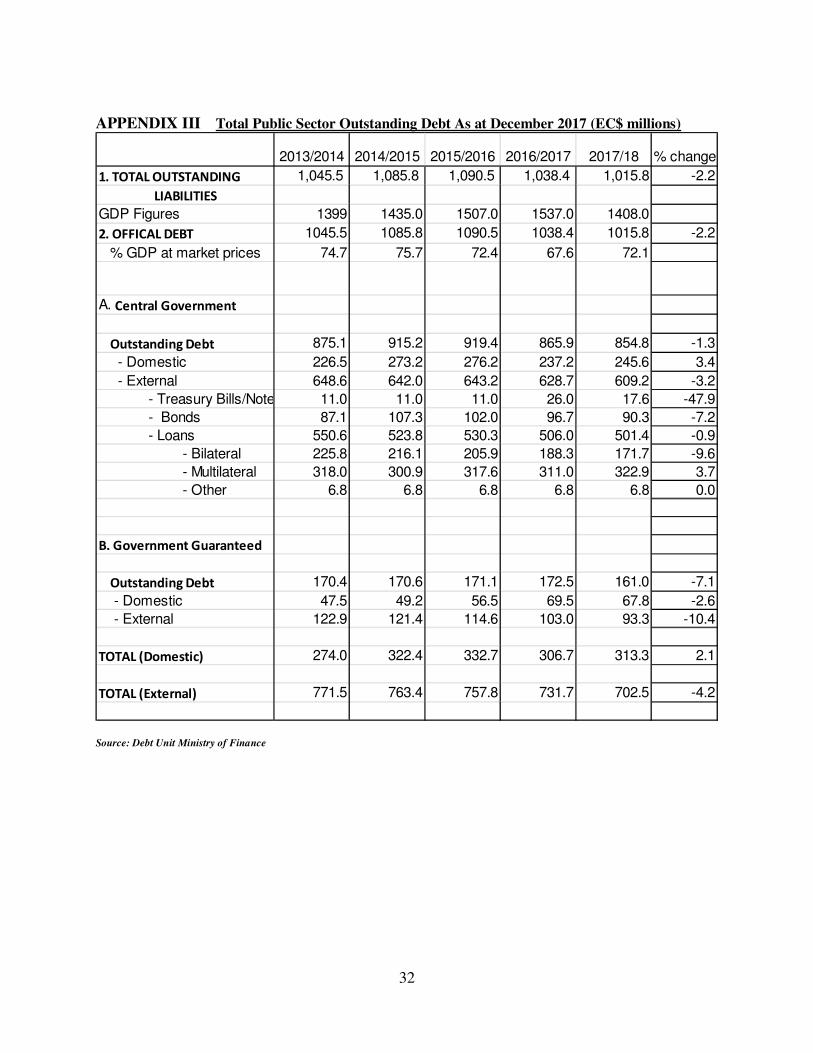
Between fiscal years 2013/14 and 2017/18, the public debt-to GDP ratio averaged about 73.0
percent (see Appendix III), this is 13.0 percent above the 60.0 percent debt to GDP target
established by the Monetary Council of the ECCU, to be achieved by 2030. Also, it is leaning
closely towards the IMF debt burden threshold of 74.0 percent4 for emerging economies. The
impact of Hurricane Maria is likely to cause a significant increase in the stock of debt in the years
ahead due to large drawdowns on committed undisbursed debt which may adversely affect the
ratio. However, it is anticipated that with increased economic activities geared towards building
a more resilient nation, the likelihood of further deterioration will be lessened.
Total Government guaranteed disbursed outstanding debt increased by an average 0.56 percent
over fiscal year 2014/15 to 2016/17; however, there was a sharp decline in 2017/18 by 7.10
percent. The threshold for guaranteed debt of 17.0 percent as a percentage of total debt, being
stipulated in the debt strategy has not been breached, over the review period.
Cost/Risk Characteristics of Public Debt
In an effort to minimize cost and risk in the debt portfolio government continues to borrow
externally, on highly concessionary terms and borrow on the domestic market in local currency.
All this is done in an attempt to operate within the parameters of the Government’s Debt
Management Strategy and the underlying debt management objective.
Table 2: Total Public Sector Debt (EC$ m) as at June 2018
Source: Debt Unit, Ministry of Finance
Size of Public and Publicly Guaranteed External Debt
Table 3 shows the comparative figures for public and publicly guaranteed external debt over
financial year ending June 2017 and June 2018. There was a sharp decline in the debt stock as at
4 Threshold utilized in the IMF Public Debt Sustainability Analysis (DSA) framework for Low Income Countries
Public Sector debt 2013/14 2014/15 2015/16 2016/17 2017/18
External Debt 771.52 763.37 757.82 731.69 702.49
Central government 648.64 641.97 643.22 628.71 609.21
Guaranteed debt 122.88 121.40 114.60 102.98 93.28
Domestic Debt 273.97 322.38 332.66 306.68 313.34
Central government 226.50 273.23 276.15 237.20 245.59
Guaranteed debt 47.47 49.15 56.51 69.48 67.75
Total Debt 1045.49 1085.75 1090.48 1038.37 1015.83
Central government 875.14 915.20 919.37 865.91 854.80
Guaranteed debt 170.35 170.55 171.11 172.46 161.03
Percentage of Debt
Central government 83.71 84.29 84.31 83.39 84.15
Guaranteed debt 16.29 15.71 15.69 16.61 15.85
15
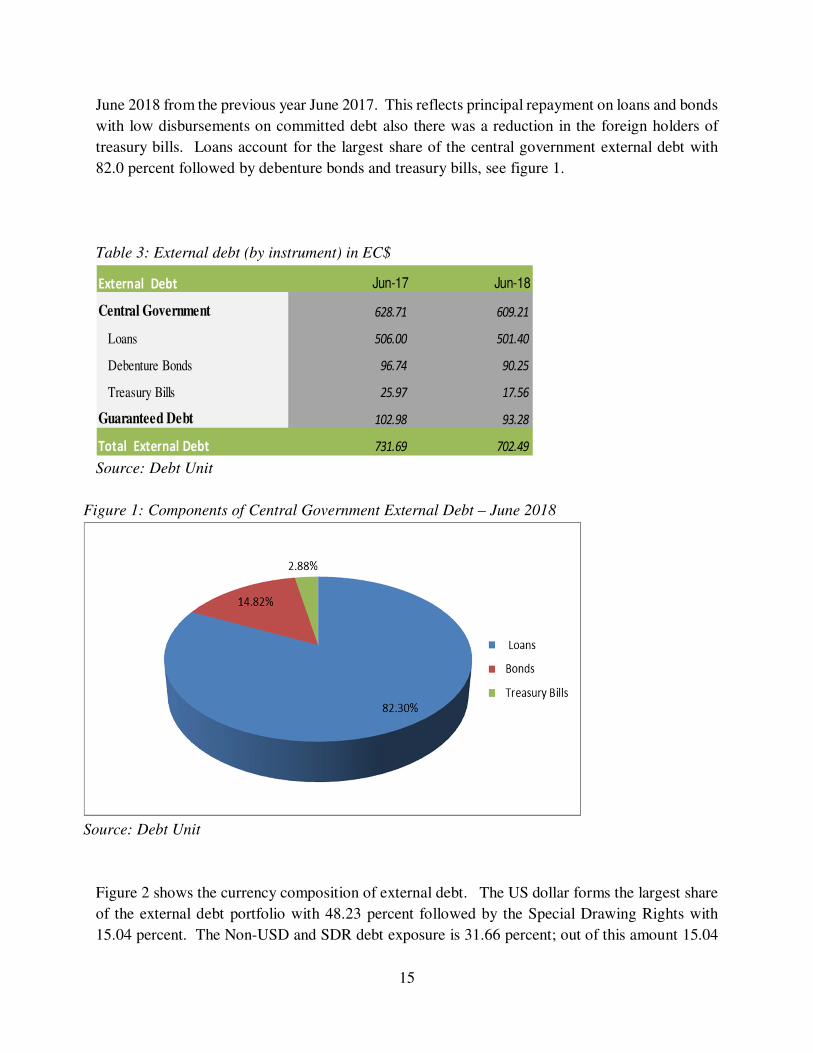
June 2018 from the previous year June 2017. This reflects principal repayment on loans and bonds
with low disbursements on committed debt also there was a reduction in the foreign holders of
treasury bills. Loans account for the largest share of the central government external debt with
82.0 percent followed by debenture bonds and treasury bills, see figure 1.
Table 3: External debt (by instrument) in EC$
Source: Debt Unit
Figure 1: Components of Central Government External Debt – June 2018
Source: Debt Unit
Figure 2 shows the currency composition of external debt. The US dollar forms the largest share
of the external debt portfolio with 48.23 percent followed by the Special Drawing Rights with
15.04 percent. The Non-USD and SDR debt exposure is 31.66 percent; out of this amount 15.04
External Debt Jun-17 Jun-18
Central Government 628.71 609.21
Loans 506.00 501.40
Debenture Bonds 96.74 90.25
Treasury Bills 25.97 17.56
Guaranteed Debt 102.98 93.28
Total External Debt 731.69 702.49

16
percent represents Yuan Renminbi (RMB). Currently, there is no significant foreign exchange
risks to the debt portfolio since majority of the debt is denominated in USD and notably, the ECD
is being pegged to the USD. Also, the RMB has been relatively stable over the years. However,
the debt unit monitors closely the movement of the exchange rates, as part of its mandate to manage
the debt of the Commonwealth of Dominica.
Figure 2: Currency Composition of External Debt at the end of June 2018
Source: Debt Unit, Ministry of Finance
DEBT SERVICE
One of the government’s objectives is to ensure that debt service payment is done in a timely
manner. Government maintains a Sinking Fund at the Eastern Caribbean Bank for debt serving in
the event of cash flow constraints. An amount of EC$0.5 million is deposited into the account
annually; the balance to date is EC$10.9 million.
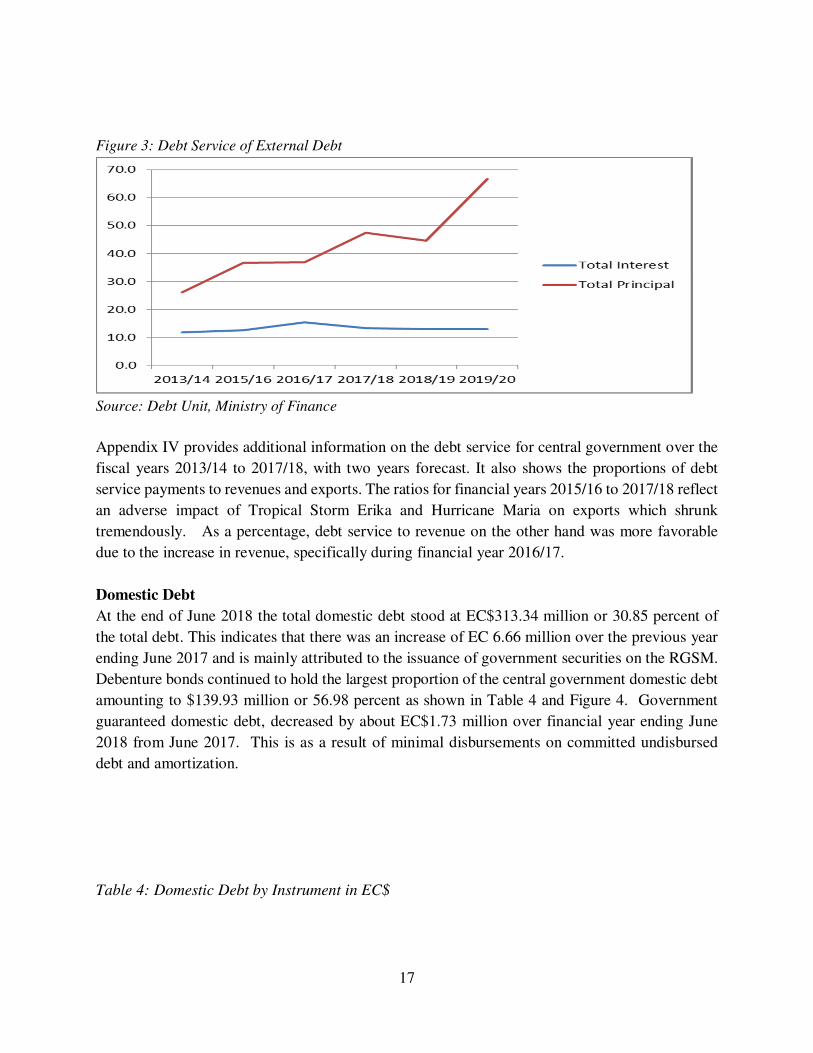
Figure 3 below gives a synopsis of the trend of debt service with regards to central government
external debt over the five years and includes two years forecast. The principal repayment
maintained an upward trajectory over the period while the interest remained relatively flat. The
forecast shows a peak in the principal repayment and is mainly attributed to the commencement
of the repayment of the 30 year restructured bonds, in addition to other loans that will begin or
increase repayments during that period. The forecast of interest payments will maintain the current
trend. However, in response to the impact of Hurricane Maria, the trend is likely to change based
on the drawdowns on committed undisbursed debt.
17
Figure 3: Debt Service of External Debt
Source: Debt Unit, Ministry of Finance
Appendix IV provides additional information on the debt service for central government over the
fiscal years 2013/14 to 2017/18, with two years forecast. It also shows the proportions of debt
service payments to revenues and exports. The ratios for financial years 2015/16 to 2017/18 reflect
an adverse impact of Tropical Storm Erika and Hurricane Maria on exports which shrunk
tremendously. As a percentage, debt service to revenue on the other hand was more favorable
due to the increase in revenue, specifically during financial year 2016/17.
Domestic Debt
At the end of June 2018 the total domestic debt stood at EC$313.34 million or 30.85 percent of
the total debt. This indicates that there was an increase of EC 6.66 million over the previous year
ending June 2017 and is mainly attributed to the issuance of government securities on the RGSM.
Debenture bonds continued to hold the largest proportion of the central government domestic debt
amounting to $139.93 million or 56.98 percent as shown in Table 4 and Figure 4. Government
guaranteed domestic debt, decreased by about EC$1.73 million over financial year ending June
2018 from June 2017. This is as a result of minimal disbursements on committed undisbursed
debt and amortization.
Table 4: Domestic Debt by Instrument in EC$

18
Source: Debt Unit, Ministry of Finance
Figure 4: Central Government Domestic Debt- June 2018 in percentage
Source: Debt Unit, Ministry of Finance
Developments on the Regional Government Securities Market (RGSM)
There has been a strong appetite for the Government of Dominica’s short term securities on the
RGSM over the years. This is evident based on the over-subscription and the price of those
securities auctioned. The Government of Dominica continues to rollover a ninety-one day $20.0
million treasury bill and during the financial year 2017/18 the yield ranged between 1.99 percent
and the reserve price of 6.00 percent. The two issues subsequent to Hurricane Maria were adversely
impacted, being driven to the reserve price of 6.0 percent. This pattern resembles what occurred
Domestic Debt Jun-17 Jun-18
Central Government 237.20 245.59
Overdrafts 25.16 24.80
Loans 36.31 36.17
Debenture Bonds 139.45 139.93
Treasury Bills Central government 36.27 44.68
Guaranteed Debt 69.48 67.75
Total Domestic Debt 306.68 313.34

19
in financial 2015/2016 after the passage of Tropical Storm Erika and subsequently bounced back
in financial year 2016/17 with yield averaging about 1.95 percent. Additionally, there are
currently three (3) five year bonds totaling $65.1 million and were issued at the rate of 7.0 percent.
They mature in 2019, 2020 and 2022 respectively as shown in table 5. One of the bonds, with
symbol DMG051122 represents the reissuance of a bond which matured just two months after
the hurricane and was fully subscribed.
Table 4: SECURITIES ISSUED ON THE RGSM
VIII. Macro-Economic Performance
On September 18, 2017, Dominica was hit by category five hurricane Maria which resulted in loss
of life as well as widespread damage to agricultural crops, physical infrastructure, and significantly
altered the natural landscape. The passage of the hurricane resulted in an estimated damage and
loss of about EC$3.54 billion, equivalent to 226.0 percent of GDP. Most economic sectors
sustained significant damage and losses with public infrastructure carrying the brunt. As a result,
real GDP is estimated to have declined of 4.7 percent during 2017 with a further decline of 14.1
percent projected for 2018. The Agriculture, livestock and fisheries sectors were devastated with
output estimated at about ¼ of pre-hurricane levels due to loss of crops, substantial destruction to
trees and livestock, and significant equipment loss. Output in the manufacturing sector is estimated
to have sustained a 32.7 percent decline due to damage caused to several manufacturing entities,
which were forced to temporarily or permanently cut back or cease operations following the
hurricane. Tourism room capacity was reduced by roughly 50 percent, also affecting services such
as transport, restaurants, and wholesale and retail trade. Public services and transport were severely
affected by damage to electricity, water and sanitation infrastructure. Construction, on the other
hand, had a positive contribution to growth, reflecting pre-hurricane investments and rehabilitation
and reconstruction.
Preliminary estimates indicate that economic activity remained below pre-Maria levels in the
first half of 2018, relative to the corresponding period of 2017.
Activity in the tourism industry is estimated to have decreased in the six months of 2018, evidenced
by a lower level of total arrivals. This outcome was largely influenced by significant damage to
Symbol Term Date of IssueDate of
Maturity
Issue
Amount
Allotted
AmountSubscriptions
No. of
BidsYield
DMB251017 91 days 25/07/2017 25/10/2017 20,000,000 20,000,000 30,053,000 12 1.99
DMB300118 91 days 30/10/2017 30/01/2018 20,000,000 20,000,000 20,566,000 9 6.00
DMB040518 91 days 01/02/2018 04/05/2018 20,000,000 20,000,000 21,024,000 14 6.00
DMB080818 91 days 07/05/2018 08/08/2018 20,000,000 20,000,000 29,535,200 14 2.00
DMG051122 5 years 11/15/2017 05/11/2022 25,000,000 25,000,000 25,000,000 4 7.00
DMG050220 5 years 02/26/2015 05/02/2020 25,000,000 25,000,000 25,232,000 18 7.00
DMG050719 5 years 07/28/2014 05/07/2019 15,000,000 15,065,000 15,065,000 6 7.00

20
the tourism infrastructure, particularly in the accommodation sector. Preliminary estimates for the
period January to June 2018 indicate that total arrivals decreased by 77.3 percent to 47,024
compared with a slighter decline of 3.0 percent in corresponding period of 2017. This outturn was
attributed to a reduction in both stay-over and cruise passenger arrivals. The number of stay-over
visitors fell by 36.2 percent to 26,458, influenced by a fall in visitor arrivals from all major source
markets, namely, the Caribbean (35.0 percent); the United Kingdom (35.0 percent); Canada (26.2
percent) and the USA (20.7 percent). Likewise, the number of cruise passengers fell by 88.4
percent to 18,059, consistent with the decline in the number of cruise calls by 75 to 27. Further
supporting the contraction in total arrivals, the number of yacht passengers and excursionists
decreased by 75.0 percent and 65.5 percent respectively.
Output in the agricultural sector is estimated to have decreased in the period January to June 2018,
relative to the same period last year. The production of bananas was severely affected due to
damage to farming infrastructure and crops. The output of non-banana crops and livestock was
also declined. The performance of the manufacturing sector was mixed registering a 58.3 percent
increase in the production of paints. However, the production of beverages decreased by 74.3
percent, reflecting a substantial reduction in productive capacity following hurricane Maria.
Construction activity is preliminarily estimated to have accelerated in the first half of 2018,
partially offsetting the falloff in activity in most sectors. This expansion reflects developments in
both the public and private sectors. Capital spending by the government increased by $65.4m to
$232.4m associated with reconstruction and rehabilitation activities as well as other infrastructural
improvements. Public sector construction was complemented by ongoing private sector projects,
most notably the construction of Range Developments’ Cabrits Resort Kempinski and Jungle Bay
Villas. Additionally, initial estimates suggest that private sector construction was further supported
by an upsurge in residential construction as residents continue to rebuild and repair homes that
were damaged during the passage of hurricane Maria.
The consumer price index is estimated to have risen by 0.9 percent during the first half of 2018,
compared with a 0.5 percent increase during the corresponding period of 2017. The inflationary
pressures were largely attributable to a 6.7 percent upturn in the price of food and non-alcoholic
beverages.
Preliminary projections point to a dramatic turnaround with a significant growth increase of 9.4
percent expected by 2019. The construction sector is expected to contribute to this growth largely
due to the ongoing rebuilding and new construction in the aftermath of Hurricane Maria.
Figure 5 below shows Real GDP Growth for the period 2016 - 2022.
Figure 5: Real GDP growth rate

21
Source: IMF Economic Outlook for Dominica after Hurricane Maria
Balance of Payments
The current account surplus for 2018 is estimated to be 15.1 percent of GDP. This follows a
current account surplus of 29.2 percent of GDP in 2017. The 2017 surplus was largely because of
the improvement on the capital account owing to inflows associated with the Citizenship by
Investment Programme. Preliminary estimates indicate that the merchandise trade deficit narrowed
to $478.0m (31.5 percent of GDP) during 2017, relative to a deficit of $515.7m (34.0
percent of GDP) recorded in the corresponding period of 2016. This development was mainly
attributed to a decline in the value of imports, supported by an estimated decrease in the value of
exports.
Import payments fell by 7.5 percent to $533.4m, largely on account of the disruption to the official
supply chain and business activities following the hurricane in September 2017. Export receipts
also declined, partially attributable to the disruption in domestic production following hurricane
Maria. Banana exports declined by 4.4 tonnes. Additionally, receipts from
beverages and paints decreased by $8.3m and $0.9m respectively. The decline in export receipts
was however moderated by a 2.2 percent uptick in re-exports. Going forward, large construction
related imports associated with reconstruction efforts, coupled with a decline in exports from
reduced agricultural and manufacturing output, are projected to cause a further deterioration of the
current account to approximately.
IX. Fiscal performance
-20
-15
-10
-5
0
5
10
15
2015 2016 2017 2018 2019 2020 2021 2022
REAL GDP Growth Rate

22
Revenue
The outturn for fiscal year 2017/18 improved significantly compared to the first half performance
although total revenue inclusive of grants were approximately 18 percent less than that of
2016/2017. Collections of both tax and non-tax revenue fell short of expectations by about 23
percent. Revenue collections for the period, July to December 2017, were 62.0 percent lower than
the corresponding period of the previous financial year; however by year end revenue collections
were only down by 23 percent indicated above.
Tax revenue
As anticipated Tax revenue for the 2017/18 period fell slightly below the previous year’s
performance by 7.3 percent and similarly fell short of budget expectations by 6.7 percent.
Collections in all tax categories were lower than what was projected with the exception of the taxes
on domestic goods and services category due to better than expected VAT collections
Collections of tax revenue for the first six months of the 2017/18 fiscal year have not performed
as well with collections falling below that of the first half of the 2016/17 period. This
underperformance was anticipated based on the concessions provided to citizens as a relief
measure following Hurricane Maria. As anticipated, the second half of the 2017/18 fiscal year tax
revenue collections outperformed the last six months of the 2016/17 period as the earlier
concessions were reduced and the rebuilding process meant that tax collections had improved
significantly.
Figure 6 below shows a comparison between the budget for 2017/18, actual for 2017/18, and
actuals for Fiscal year2016/2017 for the major tax categories.
Figure 6: Major tax categories

23
Source: Macroeconomic Policy Unit, Ministry of Finance
Non-Tax Revenue
Supported largely by revenues from the Economic Citizenship Programme (ECP), non-tax
revenues continued to be a major contributor to government’s fiscal operations during the 2017/18
period. ECP collections for the 2017/18 period fell below budget. The fiscal year ending 2018
period saw a significant shortfall over the corresponding period of the previous financial year, with
ECP receipts accounting for the greatest proportion of non-tax revenues.
Figure 7 below shows the composition of total non-tax revenue for fiscal year 2016/17, 2017/18.
Figure 7: Composition of Non-tax revenue
Source: Macroeconomic Policy Unit, Ministry of Finance
Tax Revenue
Taxes in
Incomes and
Profit
Taxes on
Property
Taxes on
Domestic Goods
& Services
Taxes
International
Trade &
Transaction
Budget Estimate 358.7 68.8 9.0 201.2 79.6
Actual 336.2 51.7 6.0 206.5 72.0
2016/2017 362.8 67.4 9.7 207.0 78.7
0.0
50.0
100.0
150.0
200.0
250.0
300.0
350.0
400.0
-
100,000,000
200,000,000
300,000,000
400,000,000
500,000,000
600,000,000
2016/17 2017/18
Other Non Tax -Revenue
ECP

24
Expenditure
Total expenditure for fiscal year 2017/18 was below the budgeted amount, but above the amount
spent for the previous year 2016/17
Current expenditure
Current Expenditure was 15.4 percent below the budget estimates. The largest contributor to
current expenditure during the 2017/18 period was that of personal emoluments. This expenditure
item was 17.9 percent higher than the previous year. This was as a result of the one off double
salary payments as well as retroactive payments associated with the recent salary increase. Most
of the current expenditure figures were similar to the previous year 2016/17 with the exception of
the personal emoluments expenditure due to the reason explained above.
Figure 8 shows the components of current expenditure for the period under review.
Figure 8: Components of Current expenditure
Source: Macroeconomic
Policy Unit, Ministry of Finance
Capital Expenditure
Expenditure for fiscal year 2017/18 as reported by the PSIP Unit was $358.1 million with $71.8
million being grant financed. This compares to $263.3 million and $33.8 million for the previous
financial year. While the 2017/18 capital expenditure was 2.7 percent higher than budgeted, the
performance was good given historical performance and implementation capacity. The first half
of the 2017/18 period has seen capital expenditure of $91.3 million which was 16.0 percent higher
than what was expensed during the corresponding period of the previous year. The damage caused
Recurrent
Expenditure
Personal
Emolunents
Goods &
Services
Interest
Payments
Transfers &
Subsidies
Budget Estimate 526.6 165.0 238.9 26.5 96.3
Actual 456.4 181.6 145.1 29.7 99.9
2016/2017 421.2 154.0 135.8 24.2 107.2
0.0
100.0
200.0
300.0
400.0
500.0
600.0

25
by the passage of Hurricane Maria necessitated a revision of the PSIP with expenditure at the end
of the 2017/18 period surpassing what was originally budgeted. GoCD funds continue to be the
major source of funding for capital projects.
Figure 9 shows the financing breakdown for fiscal year 2016/17 and 2017/18
Figure 9: PSIP financing for 2016/17 and 2017/18
Source: Macroeconomic Policy Unit, Ministry of Finance
Fiscal operations of central government for the period July 2017 to June 2018 has resulted in a
current account surplus of $213.2 million or 15.1 percent of GDP. During the same period of the
previous year a surplus of $448.0 million was realized. The overall balance inclusive of grants is
in deficit of $73.0 million or 5.2 percent of GDP. The primary balance, the main fiscal indicator,
is in deficit of $43.3 million or 3.1 percent of GDP. For the corresponding period of the previous
fiscal year, the outturn reflected a primary surplus of 15.8 percent of GDP. As anticipated at the
end of the 2017/18 period there was a surplus on the current account, while the overall and primary
balances will be in deficit. The same is estimated for the 2018/19 period.
Financial Sector Analysis
0
50000000
100000000
150000000
200000000
250000000
300000000
2016/17 2017/18
GOCD
LOANS
GRANTS

26
Monetary liabilities (M2) expanded by 18.4 percent to $1,628.7m at the end of 2017, compared
with growth of 6.0 percent at the end of 2016. Growth in M2 reflected increases in both quasi
money, the larger component of M2, and narrow money. Quasi money rose by 10.9 percent to
$1,190.6m, reflecting a 16.2 percent upsurge in private sector savings deposits. This increase was
however moderated by declines in private sector foreign currency deposits (21.8 percent) and
private sector time deposits (3.8 percent). The growth in monetary liabilities was also supported
by a 44.9 percent expansion in narrow money. This outturn was associated with a more than
doubling of Cheques and Drafts and upticks in private sector demand deposits (44.3 percent) and
currency with the public (38.9 percent).
Domestic credit fell by 10.5 percent to $360.0m during the period under review, driven by a
reduction in private sector credit and an increase in the net deposit positions of central government
and nonfinancial public enterprises. Private sector credit, which constitutes the largest proportion
of credit in the economy, decreased by 1.6 percent to $785.0m, reflecting declines in credit to
households (2.1 percent); non-bank financial institutions (1.4 percent); and businesses (1.0
percent). Also supporting the fall in domestic credit, the net deposit position of central government
improved to $322.6m as credit extended to the government contracted whilst its deposits grew.
Similarly, an upturn in the net deposit position of non-financial public enterprises to $102.5m was
observed in 2017 on account of growth in deposits and a decrease in credit extended.
An analysis of the distribution of commercial bank credit by economic activity revealed that total
outstanding loans and advances decreased in 2017. Contractions in lending were observed in all
major sectors with the exception of distributive trades which recorded a 4.2 percent increase in
credit. More specifically, there were declines in credit extended to most productive sectors
including agriculture and fisheries (28.0 percent); manufacturing and mining and quarrying (12.6
percent); tourism (3.2 percent) and construction (1.5 percent). Downturns in credit were also
recorded for other sectors including transportation and storage (25.8 percent); professional and
other services (14.7 percent); public administration (14.2 percent); utilities, electricity, water (11.9
percent); entertainment and catering (9.4 percent); and financial institutions (1.6
percent). A 0.1 percent decline in credit extended for personal use was also observed.
The net foreign assets position of the banking system stood at $1,437.2m at the end of December
2017, registering an increase of 31.8 percent from the end of December 2016. This development
was mainly the result of a 75.7 percent expansion in the net foreign assets position of commercial
banks, associated with growth in their net assets position with institutions outside of the ECCU
territories and in other ECCU territories. The overall upsurge in net foreign assets was however
moderated by a 4.5 percent decline in Dominica’s imputed share of the Central Bank’s reserves.
The commercial banking system remained highly liquid in 2017. The ratio of liquid

27
assets to total deposits plus liquid liabilities rose by 8.4 percentage points to 65.7 percent at the
end of December 2017. However, the loans and advances to total deposits ratio fell by 6.6
percentage points to 41.3 percent, still considerably below the ECCB’s benchmark of 75.0 to
85.0 percent.
The weighted average total deposits rate fell by 10 basis points to 1.60 percent at the end of
December 2017. Concomitantly, the weighted average lending rate declined by 15
basis points to 7.97 percent in the period under review. Consequently, the weighted average
interest rate spread narrowed to 6.3percentage points at the end of December 2017 from 6.42
percentage points at the end of December 2016.
X. Prospects
The overall level of economic activity is expected to be subdued in the remainder of 2018. This
assessment is based on the devastation of the productive sectors by Hurricane Maria. While
interventions are being made to aid in the recovery of the agricultural sector, this recovery is
expected to be slow owing to the significant damage to farming infrastructure, crop and livestock
production. Similarly, activity in the tourism industry will take some time to recover as many
hotel plants were largely affected by the passage of the hurricane. Additionally, the number of
cruise ship passengers will be lower than projections made prior to the hurricane, on account of
cancellation of cruise calls following the devastation caused by the hurricane. In the construction
sector, activity is expected to expand as the government, private sector, and individuals undertake
reconstruction activities. Private sector projects such as the continuation of the Range
Developments and Jungle Bay resorts in addition to the repair and reconstruction of residential
homes is expected to contribute to the acceleration in construction activity. Manufacturing output
is expected to remain subdued for the remainder of 2018.
The overall fiscal balance as anticipated deteriorated in 2018 and will continue into the first half
of the 2019 fiscal period mainly as a consequence of continued expenditure on the reconstruction
effort; coupled with lower tax revenue, influenced by a decline in economic activity. In the external
sector, the merchandise trade deficit is expected to widen, reflecting increased imports of
construction materials in addition to depressed exports. Additionally, Dominica remains
vulnerable to external shocks such as adverse weather, which could hinder the economic recovery.
XI. Security Issuance Procedures, Clearance and Settlement
The series of Securities will be listed on the ECSE. This market operates on the ECSE trading
platform for both primary issuance and secondary trading. The pricing methodology to be used
for selling the securities will be a Competitive Uniform Price Auction. The ECSE is responsible

28
for disseminating market information, providing intermediaries with market access, administering
the auction process and monitoring the auctions.
The ECSE, through the Eastern Caribbean Central Securities Depository (ECCSD), will be
responsible for facilitating clearance and settlement for the securities allotted. The ECCSD will
ensure that funds are deposited to the account of the Government of the Commonwealth of
Dominica.
The ECSE, through the Eastern Caribbean Central Securities Registry (ECCSR), will record and
maintain ownership of the government securities in electronic book-entry form. The ECCSR will
mail confirmation of proof of ownership letters to all investors who were successful in the auction.
The ECCSR will also process corporate action on behalf of issuing governments.
Intermediaries will be responsible for interfacing with prospective investors, collecting
applications for subscription and processing the same for bidding on the ECSE platform. Investors
must provide the intermediaries with funds to cover the cost of the transaction. For this particular
offering, investors will pay the applicable brokerage fees to the intermediaries. A list of licensed
intermediaries who are members of the ECSE is provided (Appendix 1).
Successful clients will be informed of their payment obligations and the funds provided to the
intermediary will be used to purchase the allotted amount.
As an issuer on the RGSM, the Government of the Commonwealth of Dominica will be subject to
the rules, guidelines and procedures developed by the Regional Debt Coordinating Committee
(RDCC) for the operation of the market, including ongoing reporting and disclosure requirements.
XII. Appendices
i. Listing of Licensed intermediaries
ii. Summary of Government Fiscal Operations (EC$ Millions)
iii. Total Public Sector Outstanding Debt As at December 2015 (EC$ millions)
iv. Debt Service
v. Balance of Payments (millions EC$

APPENDIX I Listing of Licensed ECSE Member Broker Dealers
INSTITUTION
CONTACT INFORMATION
ASSOCIATED PERSONS
Grenada
Grenada Co-operative Bank Limited
No. 8 Church Street St. George’s
Tel: 473 440 2111
Fax: 473 440 6600 Email: [email protected]
Principal Aaron Logie Allana Joseph Representatives Carla Sylvester Keisha Greenidge Kishel Francis
St Kitts and Nevis
St Kitts Nevis Anguilla National Bank Ltd
P O Box 343 Central Street Basseterre
Tel: 869 465 2204
Fax: 869 465 1050 Email: [email protected]
Principals Anthony Galloway Representatives Petronella Edmeade-Crooke Angelica Lewis Marlene Nisbett
The Bank of Nevis Ltd
P O Box 450 Main Street Charlestown
Tel: 869 469 5564 / 5796
Fax: 869 469 5798 E mail: [email protected]
Principals Brian Carey Monique Williams Representatives Judy Claxton Denicia Small
St Lucia
Bank of Saint Lucia
5th Floor, Financial Centre Building 1 Bridge Street Castries
Tel: 758 456 6826 / 457 7233
Fax: 758 456 6733
Principals Medford Francis Lawrence Jean Representatives Deesha Lewis Cedric Charles Mervin Simeon

30
INSTITUTION
CONTACT INFORMATION
ASSOCIATED PERSONS
First Citizens Investment Services Limited
P.O. Box 1294 John Compton Highway Sans Souci Castries Tel: 758 450 2662 Fax: 758 451 7984 Website: www.firstcitizenstt.com/fcis E-mail : [email protected]
Principals Omar Burch-Smith Temelia Providence Carole Eleuthere-Jn Marie Norlann Gabriel
Representative
Samuel Agiste Shaka St Ange
St Vincent and the Grenadines
Bank of St Vincent and the Grenadines Ltd
P O Box 880 Cnr. Bedford and Grenville Streets Kingstown
Tel: 784 457 1844
Fax: 784 456 2612/ 451 2589 Email: [email protected]
Principal Monifa Latham Laurent Hadley Representatives Patricia John Chez Quow

APPENDIX II Summary of Government Fiscal Operations (EC$ Millions)
Source: Ministry of Finance
2015/2016 2016/2017 2017/2018
2018-2019
Proj
2019-2020
Proj
2020-2021
Proj
Total Revenue + Grants 467.7 903.3 741.5 923.9 1,086.1 895.0
Total Revenue 437.0 869.5 669.7 793.8 878.3 751.0
Recurrent Revenue 436.9 869.5 669.6 789 873 746
Tax Revenue 342.0 362.8 336.2 359.9 372.9 382.7
Taxes on Incomes and Profit 72.3 67.4 51.7 57.8 64 66.3
Taxes on Property 6.8 9.7 6.0 7.8 8.3 9
Taxes on Domestic Goods & Services 193.2 207.0 206.5 212.2 214 217
Taxes International Trade & Transaction 69.7 78.7 72.0 82.1 87 90
Non Tax Revenue 94.9 506.6 333.4 428.8 500.3 363.2
CBI 490.7 315.4 406.6 477.6 339.7
Other 15.9 18.0 22.2 22.7 23.5
Capital Revenue 0.1 0.1 0.1 5.1 5.1 5.1
Grants 30.9 33.8 71.8 130.1 207.8 144
Total Expenditure 488.4 684.5 814.5 999.0 1,258 1,003
Recurrent Expenditure 375.5 421.2 456.4 545.0 537.1 533.1
PE 152.9 154.0 181.6 171.4 173 172.2
Goods & Services 105.9 135.8 145.1 239.0 234.4 233.8
Interest 28.4 24.2 29.7 25.7 25.0 22.1
Transfers & Subsidies 88.3 107.2 99.9 108.9 104.5 105.0
Capital Expenditure+ net lending 111.1 262.9 357.8 454 721 469
Current Account Balance 61.4 448.3 213.2 244 336 213
Overall Balance after grants (70.9) 218.8 (73.0) (75) (172) (108)
Primary Balance (48.1) 243.1 (43.3) (49) (147) (86)
Nominal GDP 1,429.0 1,537 1,408 1,383 1,520 1,627
Current Account Balance as % of GDP 4.30 29.17 15.14 17.62 22.11 13.08
Overall Balance as % of GDP
Primary Balance as %GDP (3) 15.8 (3.1) (3.6) (9.7) (5.3)
32
APPENDIX III Total Public Sector Outstanding Debt As at December 2017 (EC$ millions)
Source: Debt Unit Ministry of Finance
2013/2014 2014/2015 2015/2016 2016/2017 2017/18 % change
1. TOTAL OUTSTANDING 1,045.5 1,085.8 1,090.5 1,038.4 1,015.8 -2.2
LIABILITIES
GDP Figures 1399 1435.0 1507.0 1537.0 1408.0
2. OFFICAL DEBT 1045.5 1085.8 1090.5 1038.4 1015.8 -2.2
% GDP at market prices 74.7 75.7 72.4 67.6 72.1
A. Central Government
Outstanding Debt 875.1 915.2 919.4 865.9 854.8 -1.3
- Domestic 226.5 273.2 276.2 237.2 245.6 3.4
- External 648.6 642.0 643.2 628.7 609.2 -3.2
- Treasury Bills/Notes 11.0 11.0 11.0 26.0 17.6 -47.9
- Bonds 87.1 107.3 102.0 96.7 90.3 -7.2
- Loans 550.6 523.8 530.3 506.0 501.4 -0.9
- Bilateral 225.8 216.1 205.9 188.3 171.7 -9.6
- Multilateral 318.0 300.9 317.6 311.0 322.9 3.7
- Other 6.8 6.8 6.8 6.8 6.8 0.0
B. Government Guaranteed
Outstanding Debt 170.4 170.6 171.1 172.5 161.0 -7.1
- Domestic 47.5 49.2 56.5 69.5 67.8 -2.6
- External 122.9 121.4 114.6 103.0 93.3 -10.4
TOTAL (Domestic) 274.0 322.4 332.7 306.7 313.3 2.1
TOTAL (External) 771.5 763.4 757.8 731.7 702.5 -4.2

APPENDIX IV Central Government Debt Service
Source: Debt Unit/Dominica Authorities
EXTERNAL 2013/14 2014/15 2015/16 2016/17 2017/18 2018/19 2019/20
BILATERAL 13.30 14.93 18.77 22.66 24.84 24.06 22.13
Principal 3.80 4.93 3.50 6.45 20.31 19.91 18.36
Interest 9.50 10.01 15.27 16.21 4.53 4.15 3.77
MULTILATERAL 16.40 19.98 21.45 20.56 22.80 24.83 26.36
Principal 5.50 5.42 5.27 5.23 17.66 19.38 20.01
Interest 10.90 14.56 16.17 15.33 5.15 5.45 6.36
OTHER 5.20 5.02 5.77 5.72 6.90 5.44 20.44
Principal 1.60 1.58 2.33 2.28 4.58 3.37 18.83
Interest 3.60 3.44 3.44 3.44 2.32 2.07 1.61
PRIVATE 0.30 0.02 0.07 0.07 0.07 0.07 0.86
Principal 0.00 0.00 0.06 0.06 0.01 0.01 0.80
Interest 0.30 0.01 0.01 0.01 0.06 0.06 0.06
COMMERCIAL 2.90 3.24 3.28 3.14 6.15 3.09 9.71
Principal 1.00 1.42 1.45 1.32 4.83 1.83 8.61
Interest 1.90 1.83 1.83 1.83 1.32 1.26 1.10
TOTAL 38.10 43.20 49.34 52.16 60.77 57.49 79.50
Principal 11.90 13.35 12.61 15.33 47.39 44.50 66.60
Interest 26.20 29.85 36.73 36.83 13.37 12.98 12.90
DOMESTIC
COMMERCIAL 11.54 7.61 10.02 7.79 13.90 3.85 14.93
Principal 7.85 2.81 4.38 2.08 10.69 0.69 12.02
Interest 3.69 4.80 5.64 5.71 3.21 3.16 2.91
Pension Fund 4.44 3.97 4.99 4.90 14.67 5.06 23.11
Principal 0.70 0.00 0.06 0.13 9.83 0.14 18.59
Interest 3.74 3.97 4.92 4.77 4.84 4.91 4.52
FINANCIAL INSTITUTION 0.04 0.04 0.04 0.04 0.42 0.01 0.01
Principal 0.01 0.01 0.01 0.01 0.41 0.01 0.01
Interest 0.03 0.03 0.03 0.03 0.02 0.00 0.00
INSURANCE FUND 0.08 0.08 0.57 0.57 0.57 0.57 7.73
Principal 0.02 0.02 0.02 0.02 0.02 0.02 7.18
Interest 0.06 0.06 0.55 0.55 0.55 0.55 0.55
PRIVATE 0.10 0.09 0.09 0.09 0.73 0.01 0.02
Principal 0.05 0.05 0.05 0.05 0.70 0.00 0.01
Interest 0.05 0.05 0.05 0.05 0.03 0.01 0.01
OTHER 5.44 6.39 2.78 2.78 1.93 2.06 2.17
Principal 2.57 3.53 0.02 0.02 0.02 0.02 0.46
Interest 2.87 2.86 2.76 2.76 1.92 2.04 1.70
TOTAL 21.64 18.18 18.48 16.17 32.23 11.56 47.98
Principal 11.20 6.41 4.53 2.30 21.66 0.88 38.28
Interest 10.44 11.77 13.95 13.88 10.57 10.68 9.69
DEBT RATIOS
Total Debt service/Revenue % 15.89 16.99 15.45 7.86 17.62 N/A N/A
Ext Debt Service /Revenue % 10.13 11.96 11.24 6.00 11.52 N/A N/A
Dom Debt Service/Revenue % 5.76 5.03 4.21 1.86 6.11 N/A N/A
Ext.Debt service/Exports % 34.52 38.34 59.38 87.89 170.84 N/A N/A

34
APPENDIX V Dominica Balance of Payments
Dominica Balance of Payments in EC$M 2014 to 2019
1. Current account (99.07) (99.48) (131.13) 544.05 (379.91) (360.34)
1.A Goods and services (167.12) (182.42) (186.94) (199.11) (503.91) (467.92)
1.A.a Goods (443.15) (433.30) (438.92) (410.56) (484.29) (502.24)
1.A.b Services 276.03 250.87 251.98 211.45 (19.62) 34.32
1.A.b.1 Manufacturing services on physical inputs owned by others - - - - - -
1.A.b.2 Maintenance and repair services n.i.e. - - - - - -
1.A.b.3 Transport (83.43) (80.62) (74.92) (71.87) (81.26) (87.66)
1.A.b.4 Travel 512.23 484.78 469.84 440.30 153.46 233.94
1.A.b.5 Construction (5.70) (6.17) (4.26) (4.05) (6.08) (7.90)
1.A.b.6 Insurance and pension services (24.28) (25.11) (15.95) (21.84) (25.58) (29.10)
1.A.b.7 Financial services (10.00) (10.65) (7.80) (6.08) (5.14) (6.40)
1.A.b.8 Charges for the use of intellectual property n.i.e. (1.58) (1.82) (1.82) (1.57) (1.48) (1.72)
1.A.b.9 Telecommunications, computer, and information services 16.34 16.08 15.49 17.06 16.30 14.37
1.A.b.10 Other business services (128.21) (127.24) (129.13) (142.28) (70.89) (82.44)
1.A.b.11 Personal, cultural, and recreational services - - (4.19) (4.19) (3.95) (4.60)
1.A.b.12 Government goods and services n.i.e. 0.66 1.64 4.71 5.98 5.01 5.82
1.B Primary income (59.51) (58.95) (45.36) (30.18) 1.99 (5.43)
1.B.1 Compensation of employees (28.23) (21.47) (17.94) (20.05) 7.52 8.75
1.B.2 Investment income (31.29) (37.48) (27.42) (10.14) (5.54) (14.18)
1.B.2.1 Direct investment (15.50) (33.27) (22.49) (1.97) 1.52 (9.85)
1.B.2.2 Portfolio investment (0.83) 7.61 9.44 7.70 7.64 9.37
1.B.2.3 Other investment (14.95) (11.81) (14.38) (15.86) (14.70) (13.69)
1.C Secondary income 127.56 141.89 101.17 773.34 122.01 113.01
1.C.1 General government 37.85 48.69 32.07 40.39 49.25 57.12
1.C.2 Financial corporations, nonfinancial corporations, households, and NPISHs 91.30 94.06 69.88 733.63 73.39 56.63
2. Capital account 107.94 149.08 396.78 341.28 146.36 190.21
2.1 Gross acquisitions (DR.) / disposals (CR.) of nonproduced nonfinancial assets - - - - - -
2.2 Capital transfers 107.94 149.08 396.78 341.28 146.36 190.21
2.2.1 General government 106.10 148.62 396.25 340.82 145.93 189.70
2.2.2 Financial corporations, nonfinancial corporations, households, and NPISHs 1.84 0.46 0.53 0.46 0.43 0.51
Net lending (+) / net borrowing (-) (balance from current and capital account) 8.87 49.60 265.65 885.33 (233.55) (170.13)
3. Financial account
Net lending (+) / net borrowing (-) (balance from financial account) 34.01 69.80 252.22 884.72 (201.55) (196.24)
3.1 Direct investment (43.40) (60.92) (108.75) 7.74 102.31 68.96
3.2 Portfolio investment 74.54 (58.46) (12.69) 17.96 9.73 7.51
3.2.A.1 Equity and investment fund shares - (2.16) - (1.77) (1.67) (1.95)
3.2.A.2 Debt securities 74.54 (56.30) (12.69) 19.73 11.41 9.46
3.4 Other investment (36.26) 118.51 115.24 885.15 (358.14) (315.92)
3.4.1 Other equity - - - (0.00) - -
3.4.2 Currency and deposits (0.97) 139.40 68.51 360.23 (13.13) (93.55)
3.4.3 Loans (44.37) (37.73) 43.83 14.17 3.83 (32.30)
3.4.4 Insurance, pension, and standardized guarantee schemes 0.33 11.36 (3.49) 539.79 (341.25) (181.31)
3.4.5 Trade credit and advances 0.28 (2.11) 0.86 1.03 0.70 0.81
3.4.6 Other accounts receivable/payable 8.47 7.60 5.52 (30.06) (8.28) (9.57)
3.4.7 Special drawing rights (Net incurrence of liabilities) - - - - - -
3.5 Reserve assets 39.14 70.66 258.43 (26.13) 44.55 43.21
3.5.1 Monetary gold
3.5.2 Special drawing rights
3.5.3 Reserve position in the IMF
3.5.4 Other reserve assets
Net errors and omissions 25.14 20.19 (13.43) (0.61) 32.00 (26.10)
Net
Source: Eastern Caribbean Central Bank and Central Statistical Office, Dominica
NetDescription 20162014 Rev 2015 Rev 2017 Est 2018 Pj 2019 Pj
NetNet Net Net