Embed Size (px)
Citation preview

Government of RajasthanGovernment of Rajasthan

Reward Scheme
for Recognizing Efforts of The Best Performing States in
Food grain, Coarse Cereals,
Rice, Pulses and Wheat Production
During 2010-11

3
RajasthanRajasthanclimateclimate
v/kZv/kZ 'kq"d 'kq"d (Semi-Arid)(Semi-Arid)
'kq"d 'kq"d (Arid)(Arid)
v/kZv/kZ vkæZ vkæZ (Sub-Humid)(Sub-Humid)
vkæZ vkæZ (Humid)(Humid)
vkævkæZZv/kZv/kZ
vkæZvkæZ
'kq"d'kq"dv/kZv/kZ 'kq"d'kq"d

Production ofProduction ofCerealsCereals
Avg. 05-06 09-10 10-11
to 09-10
KHARIF Rice 2.10 2.28 2.66
Jowar 2.74 1.04 5.09
Bajra 32.39 20.53 60.91
Maize 14.33 11.49 20.53
S.Millets 0.04 0.012 0.08
Total 51.61 35.36 89.27
RABI Wheat 71.07 75.01 104.24
Barley 6.17 6.2 9.55
Total 77.24 81.21 113.79
Total Cereals (R +K)Total Cereals (R +K) 128.85128.85 116.57116.57 203.06203.06
Prod. in Lac Prod. in Lac MTMT

Production of PulsesProduction of Pulses& Foodgrains& Foodgrains
Avg. 05-06 to 09-10
09-10 10-11
KHARIF K.Pulses 5.50 1.26 15.87
Arhar 0.12 0.067 0.16
TOTAL 5.62 1.33 16.03
RABI Gram 6.88 5.35 16.01
R.Pulses 0.42 0.34 0.28
TOTAL 7.30 5.69 16.29
Total Pulses 12.92 7.02 32.32
Foodgrains
KHARIF 57.23 36.69 105.3
RABI 84.54 86.9 130.08
Total Foodgrains (R+K) 141.77 123.59 235.38
Prod. in Lac Prod. in Lac MTMT
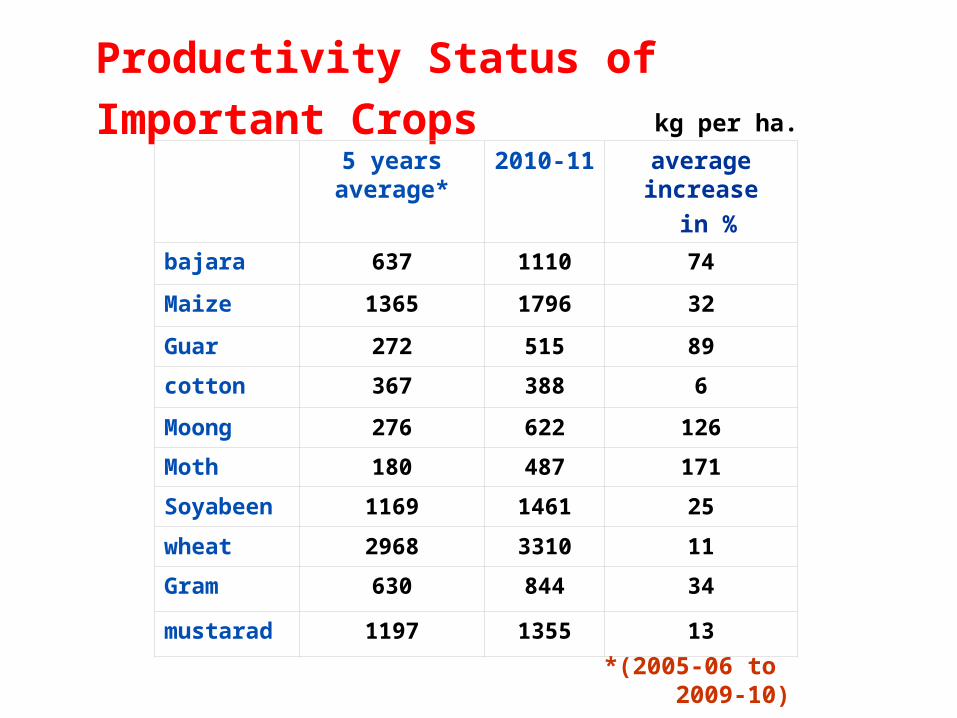
Productivity Status of Important Crops
5 years average* 2010-11 average increase
in %
bajara 637 1110 74
Maize 1365 1796 32
Guar 272 515 89
cotton 367 388 6
Moong 276 622 126
Moth 180 487 171
Soyabeen 1169 1461 25
wheat 2968 3310 11
Gram 630 844 34
mustarad 1197 1355 13
*(2005-06 to 2009-10)
kg per ha.

Ranks in India 2008-09
India Rajasthan % to India Rank
Coarse Cereals 27.45 7.10 25.88 1st
Bajra 8.75 5.17 59.12 1st
Mustard 6.30 2.83 45.06 1st
Maize 8.17 1.05 12.88 2nd
Gram 7.89 1.26 15.96 2nd
Oilseed 27.56 4.65 16.87 2nd
Pulses 22.09 3.67 16.62 3rd
Food grain 122.83 13.21 10.75 4th
Wheat 27.75 2.29 8.27 4th
In million ha.AreaArea

India Rajasthan % to India Position
Coarse Cereals 40.04 7.33 18.30 1st
Bajra 8.89 4.28 48.20 1st
Mustard 7.20 3.50 48.64 1st
Maize 19.73 1.83 9.27 3rd
Gram 7.06 0.98 13.90 2nd
Oilseed 27.72 5.18 18.68 2nd
Pulses 14.57 1.83 12.54 3rd
Food grain 234.47 16.68 7.11 4th
Wheat 80.68 7.29 9.03 4th
Ranks in India 2008-09in million tonesProduction Production

in MT
Crops Marketing Year
Year 2010-11 2011-12
Wheat 474123 1087917
Bajra - 1.80
Gram - 6345
TOTAL 474123 1094264
Food Grains Procurement During 2010-11

Expenditure Incurred 2007-08 2008-09 2009-10 2010-11
Name of the Scheme Allot. Exp. % Allot. Exp. % Allot. Exp. % Allot. Exp. %
ISOPOM 56.99 52.67 92.42 45.79 43.84 95.74 42.31 37.81 89.35 72.13 65.11 90.26
Work Plan 26.90 22.36 83.12 23.91 23.10 96.62 18.52 17.11 92.36 20.59 18.57 90.21
State Plan 113.39 108.61 95.79 112.34 116.76 103.94 173.28 172.28 99.42 883.55 882.21 99.85
RKVY Agri. Deptt. 0.00 0.00 27.65 24.13 87.27 132.64 124.21 93.64 307.65 303.08 98.51
NFSM 24.59 4.08 16.59 39.33 27.23 69.22 51.27 41.47 80.89 53.14 46.14 86.84
A3P 0.00 0.00 0.00 0.00 0.00 0.00 32.80 20.29 61.87
ATMA 14.70 8.77 59.65 12.88 8.40 65.19 17.54 12.41 70.73 17.57 14.95 85.08
ICDP Cotton 3.55 2.36 66.52 2.38 1.96 82.50 2.14 0.00 1.06 0.71 66.75
Soil health & Fertility 0.00 0.00 4.15 0.00 0.00 6.83 0.00 0.00 13.71 2.23 16.23
AGRISNET 0.00 0.00 0.05 0.05 98.00 5.60 1.85 32.98 5.60 2.30 41.04
N P on Organic Farming 0.14 0.06 44.39 0.08 0.01 17.44 0.34 0.12 34.62 0.22 0.22 99.64
Agri. Mach. Through Trg. & Demno.
0.01 0.00 0.00 0.00 0.00 0.00 0.00 0.01 0.01 100.00
Total 240.27 198.91 82.79 268.55 245.47 91.41 450.48 407.24 90.40 1408.03 1355.82 96.29
Allotment indicates available funds including unspent balance
Rs. In Crore

Allotment & expenditure2007-08 to 2010-11
Budget provisions increased by about 5 times from 2007-08 to 2010-11
Expenditure during 2010-11 : 96%. Expenditure under ISOPOM, Work Plan, State Plan,
RKVY was more than 90% while under NFSM it was 87%, ATMA 85%.

vfHkuo vfHkuo dk;ZØe dk;ZØe
RKVYjk"Vªh; d`f"k fodkl ;kstuk

Seed Distribution & Replacement Rate %
Seed Distribution: Lac Qtls.
Seed Replacement Rate %

“REWARD SCHEME”
FOR RECOGNIZING EFFORTS
OF THE BEST PERFORMING STATES
INFOODGRAIN, COARSE CEREALS,
RICE, PULSES AND WHEAT PRODUCTION
DURING 2010-11

NEW INNOVATIONS / INITIATIVES ADOPTED FOR ENHANCING
PRODUCTION Programme Golden Rays executed in Tribal,
Saharia and Mada area on PPP Mode. Special programme increasing SRR of
Bajra for higher Productivity in 8 desert Districts.
Need based publication of farmers friendly package & practices and other technical literature.
Organization of Kharif & RabiCamps.

Intervention for efficient use of Water
Construction of 5248 diggies with expenditure Rs.10237.21 lac. Rain water harvest: 1229 Farm Pond in 15 districts.
In well irrigated areas, construction of 1293 Water storage tank .
Installed drip & sprinkler sets in 23000 ha. and 15000 ha. respectively.Use of drip in Paddy crop : 35 Bigha, Kota district.

Integrated Nutrient Management Programme. 33 soil testing laboratories. 14 Mobile soil testing laboratories on PPP mode.In next three years soil testing of all “Khsra” will be done.
Weather Based Crop Insurance Scheme in all districts.
Arrangement of Advance stocking of fertilizers to ensure availability.

yxkrkj---
• 5248 diggies in canal area• 1238 Water Tank• 1229 Farm Pond in heavy soils.
Innovative Programme
• Farmers share of Rs. 111 crore against subsidy of Rs. 102 crore
OOptimum utilisation of waterptimum utilisation of water

130 ha. modal farm establish at Jaisalmer and Bikaner. plants developed by tissue culture - 300 ha. plantation at
farmers fields. Tissue culture lab at Jodhpur.
Date Plam cultivationDate Plam cultivation
IInnovative nnovative PProgrammerogramme

Solar Pump Pilot Project
64 Sollar Pump installed. During 2011-12, plan to install 500-1000 solar pumps.
Innovative Programme

Construction of 225 shed net houses. Production of vegetables started.
Innovative Programme

Establishment of centre of excellence at Jaipur.
Hi-tech cultivation of vegetables, fruits and flowers in
green houses.
Innovative Programme
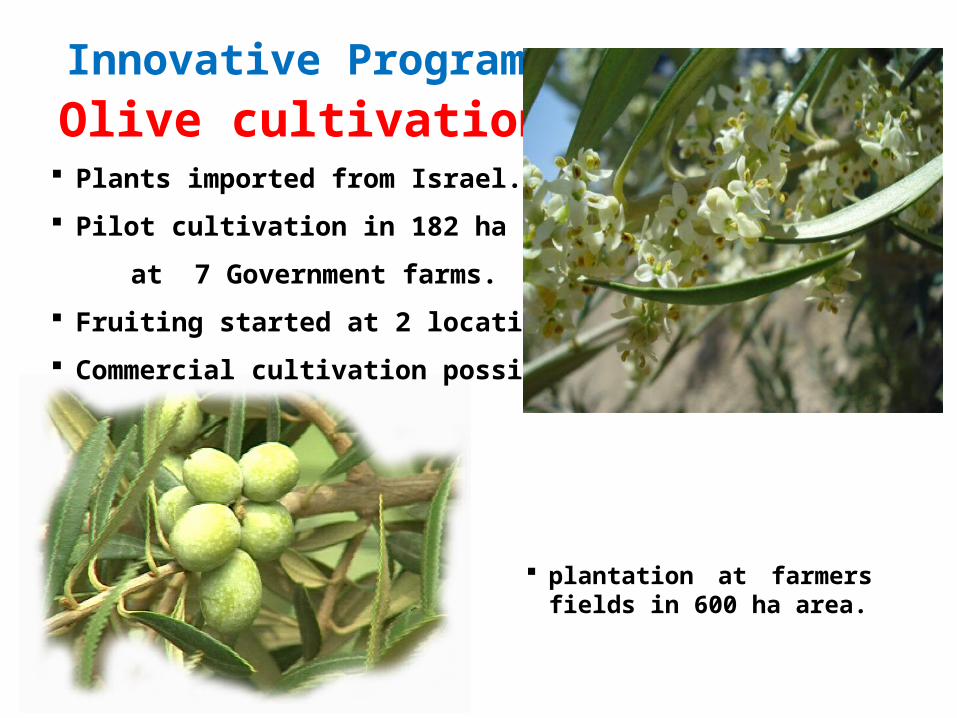
plantation at farmers fields in 600 ha area.
Olive cultivation Plants imported from Israel.
Pilot cultivation in 182 ha area
at 7 Government farms.
Fruiting started at 2 locations.
Commercial cultivation possible.
Innovative Programme

TARGETS FOR 2011-12Crops Area ( lac ha.) Production
(lac MT)Yield (kg/ha.)
KHARIF Rice 1.3 2.36 1815Jowar 7 3.85 550Bajra 50 45.00 900Maize 11 20.90 1900
S.Millets 0.15 0.09 600TOTAL 69.45 72.20 1040
RABI Wheat 25 80.00 3200Barley 3 8.40 2800TOTAL 28 88.40 3157
TOTAL CEREALS (R+K) 97.45 160.60 1648KHARIF K.Pulses 25.8 15.48 600
Arhar 0.2 0.20 1000TOTAL 26 15.68 603
RABI Gram 14 11.20 800R.Pulses 0.2 0.26 1300TOTAL 14.2 11.40 807
PULSES 40.2 27.14 675

TARGETS FOR 2011-12Crops Area (lac ha.) Production
(lac MT)Yield (Kg/ha)
FOODGRAINSKHARIF 95.45 87.88 921RABI 42.20 99.86 2366
TOTAL FOODGRAINS (R+K) 137.65 187.74 1364
OILSEEDSKHARIF Sesamum 4.60 1.84 400
G.Nut 5.00 7.50 1500Soyabean 7.00 10.85 1550Castor Seed 1.20 1.50 1250TOTAL 17.80 21.69 1219
RABI Rape & Must 32.00 38.25 1195Taramira 1.50 0.68 453Linseed 0.04 0.04 1000TOTAL 33.54 38.97 1162
TOTAL OILSEEDS (R+K) 51.34 60.66 1182

“HIGHEST EVER” PRODUCTION : 2010-11
Production of Cereals, Pulses, Foodgrains and Oilseeds during
2010-11 is highest ever.
Production of Cereals is 58% more than average of last five years
and 74% more than last year.
Production of pulses is two and half time higher than average of
last five years.
Production of Foodgrain is 66% more than average of last five years
and nearly double of last year.
Production of oilseed is 32% more than average of last five years.
Production of Guar is double of last five years’ average.
Inter-Departmental Coordination
State Level Coordination Cell is working for purchases of power during shortage.
For timely and smooth availability of water share from the dams of adjoining states interstate coordination cell has been constituted.
For timely availability of fertilizer department make effective coordination with Railway and manufacturing units.
For availability of credit to the farmers, department coordinates with cooperative department and banks.
All inter-departmental issues are discussed in State Level Sanction Committee for RKVY.
Short term loan to farmers increased from Rs. 3200 Cr. in 2009-10 to Rs. 5581 Cr. In 2010-11 ( 56 % increase) in cooperative sector.
Kisan Credit Card to 58 Lac farmers.

ThanksThanks
28