Embed Size (px)
Citation preview
Government of Kerala
AGRICULTURALAGRICULTURALAGRICULTURALAGRICULTURAL
STATISTICSSTATISTICSSTATISTICSSTATISTICS
2016201620162016----17171717
Department of Economics & Statistics Thiruvananthapuram
December 2017
PREFACE
Ministry of Agriculture and Farmers Welfare, Government of India is implementing
the scheme on Improvement of Agriculture Statistics for the purpose of collecting crop statistics
from all states in India. In this connection, in Kerala , the Scheme Establishment of an Agency for
Reporting Agricultural Statistics , a sub component of the main scheme on Improvement of
Agriculture Statistics is implementing for the collection of crop statistics . It is a 100% Central
Sector Scheme. In order to collect crop statistics, two sample surveys viz. Land Utilization
Survey and General Crop Estimation Survey are being conducted under the EARAS Scheme.
The report on ‘Agricultural Statistics’ is one of the important annual publications of
the Department of Economics and Statistics. This report presents the data relating to crop statistics
for the year 2016-17, which is collected under the scheme on Establishment of an Agency for
Reporting Agricultural Statistics (EARAS). The data relating to land use (Thirteen way
classifications), area under crops, crop production, yield rate, irrigation statistics, comparative
study of important crops in Kerala for the year 2001-02 & 2016-17, block-wise area and
production of important crops etc. are included in this report. Farm wholesale prices of important
crops, rainfall during the year 2016-17, district wise value of major agricultural crops for the year
2014-15 & 2015-16 (Provisional) are also included.
This report was prepared by the EARAS Division of the Directorate of Economics and
Statistics. I hope this report will be much useful to those engaged and interested in Agricultural
Sector, Planners, Administrators, Research scholars, etc.
Suggestions for the improvement of the content of the report will be highly appreciated.
Thiruvananthapuram, V.RAMACHANDRAN
18-12-2017 . DIRECTOR GENERAL
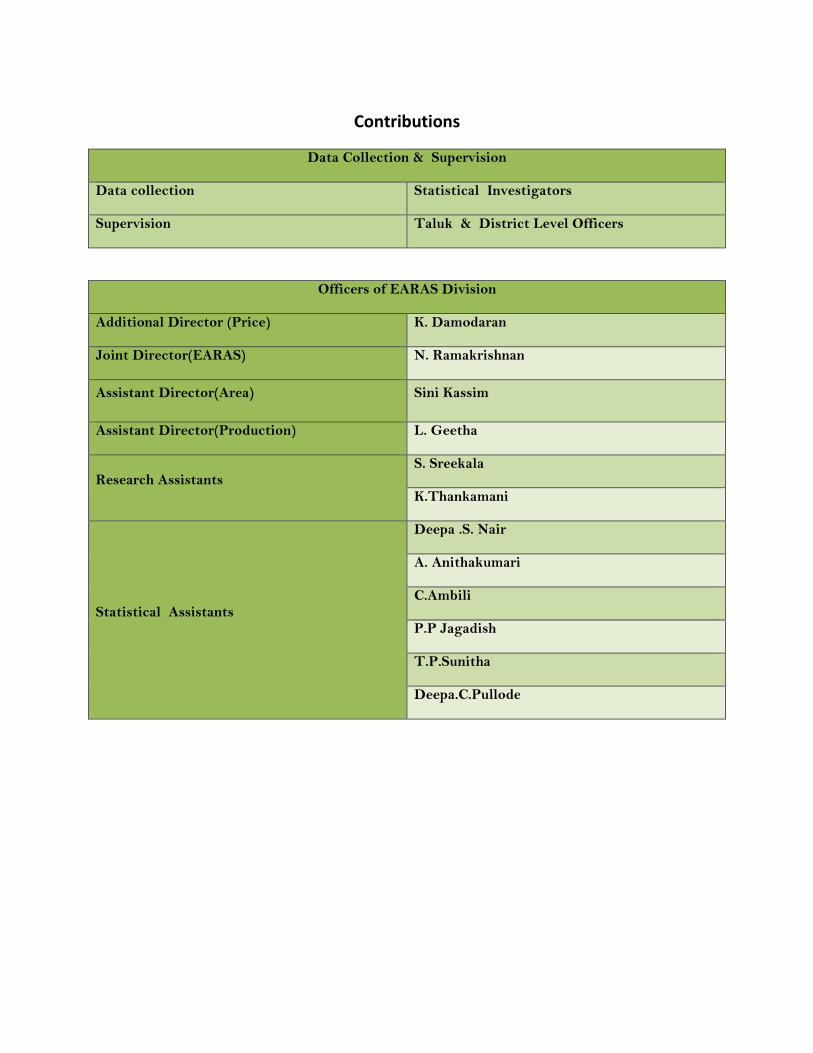
Contributions
Data Collection & Supervision
Data collection Statistical Investigators
Supervision Taluk & District Level Officers
Officers of EARAS Division
Additional Director (Price) K. Damodaran
Joint Director(EARAS) N. Ramakrishnan
Assistant Director(Area) Sini Kassim
Assistant Director(Production) L. Geetha
Research Assistants S. Sreekala
K.Thankamani
Statistical Assistants
Deepa .S. Nair
A. Anithakumari
C.Ambili
P.P Jagadish
T.P.Sunitha
Deepa.C.Pullode
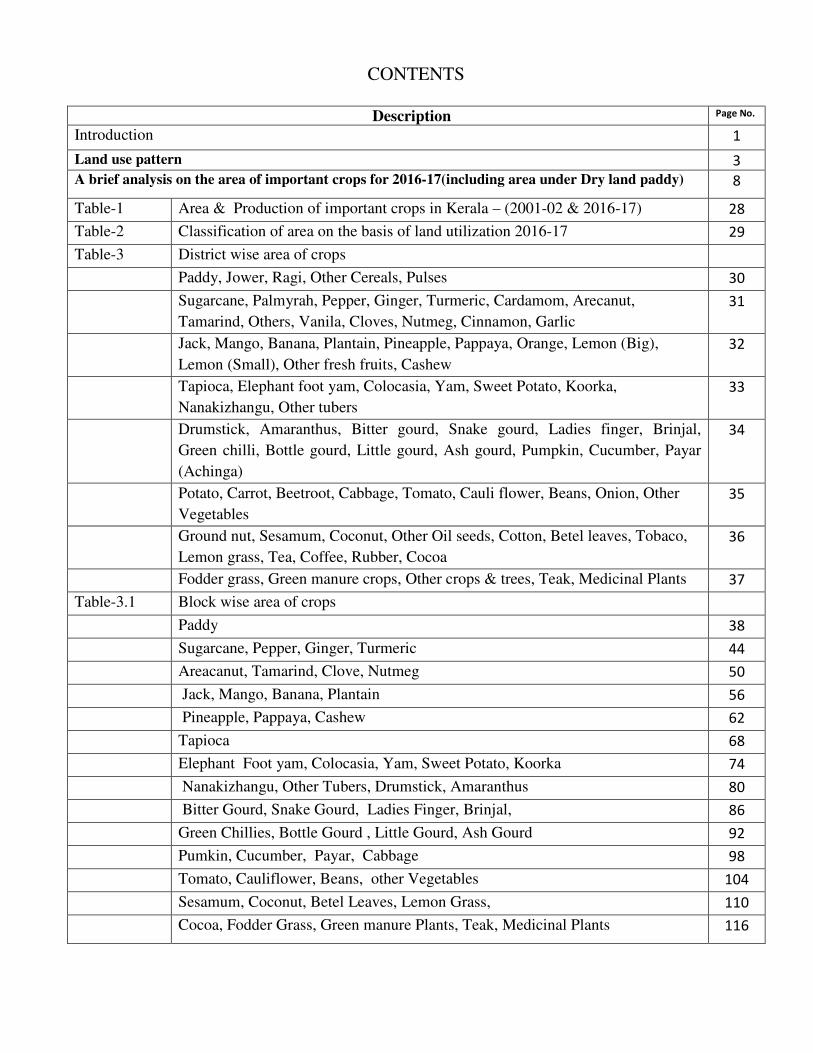
CONTENTS
Description Page No.
Introduction
1
Land use pattern 3
A brief analysis on the area of important crops for 2016-17(including area under Dry land paddy)
8
Table-1 Area & Production of important crops in Kerala – (2001-02 & 2016-17) 28
Table-2 Classification of area on the basis of land utilization 2016-17 29
Table-3 District wise area of crops
Paddy, Jower, Ragi, Other Cereals, Pulses 30
Sugarcane, Palmyrah, Pepper, Ginger, Turmeric, Cardamom, Arecanut,
Tamarind, Others, Vanila, Cloves, Nutmeg, Cinnamon, Garlic
31
Jack, Mango, Banana, Plantain, Pineapple, Pappaya, Orange, Lemon (Big),
Lemon (Small), Other fresh fruits, Cashew
32
Tapioca, Elephant foot yam, Colocasia, Yam, Sweet Potato, Koorka,
Nanakizhangu, Other tubers
33
Drumstick, Amaranthus, Bitter gourd, Snake gourd, Ladies finger, Brinjal,
Green chilli, Bottle gourd, Little gourd, Ash gourd, Pumpkin, Cucumber, Payar
(Achinga)
34
Potato, Carrot, Beetroot, Cabbage, Tomato, Cauli flower, Beans, Onion, Other
Vegetables
35
Ground nut, Sesamum, Coconut, Other Oil seeds, Cotton, Betel leaves, Tobaco,
Lemon grass, Tea, Coffee, Rubber, Cocoa
36
Fodder grass, Green manure crops, Other crops & trees, Teak, Medicinal Plants 37
Table-3.1 Block wise area of crops
Paddy 38
Sugarcane, Pepper, Ginger, Turmeric 44
Areacanut, Tamarind, Clove, Nutmeg 50
Jack, Mango, Banana, Plantain 56
Pineapple, Pappaya, Cashew 62
Tapioca 68
Elephant Foot yam, Colocasia, Yam, Sweet Potato, Koorka 74
Nanakizhangu, Other Tubers, Drumstick, Amaranthus 80
Bitter Gourd, Snake Gourd, Ladies Finger, Brinjal, 86
Green Chillies, Bottle Gourd , Little Gourd, Ash Gourd 92
Pumkin, Cucumber, Payar, Cabbage 98
Tomato, Cauliflower, Beans, other Vegetables 104
Sesamum, Coconut, Betel Leaves, Lemon Grass, 110
Cocoa, Fodder Grass, Green manure Plants, Teak, Medicinal Plants 116
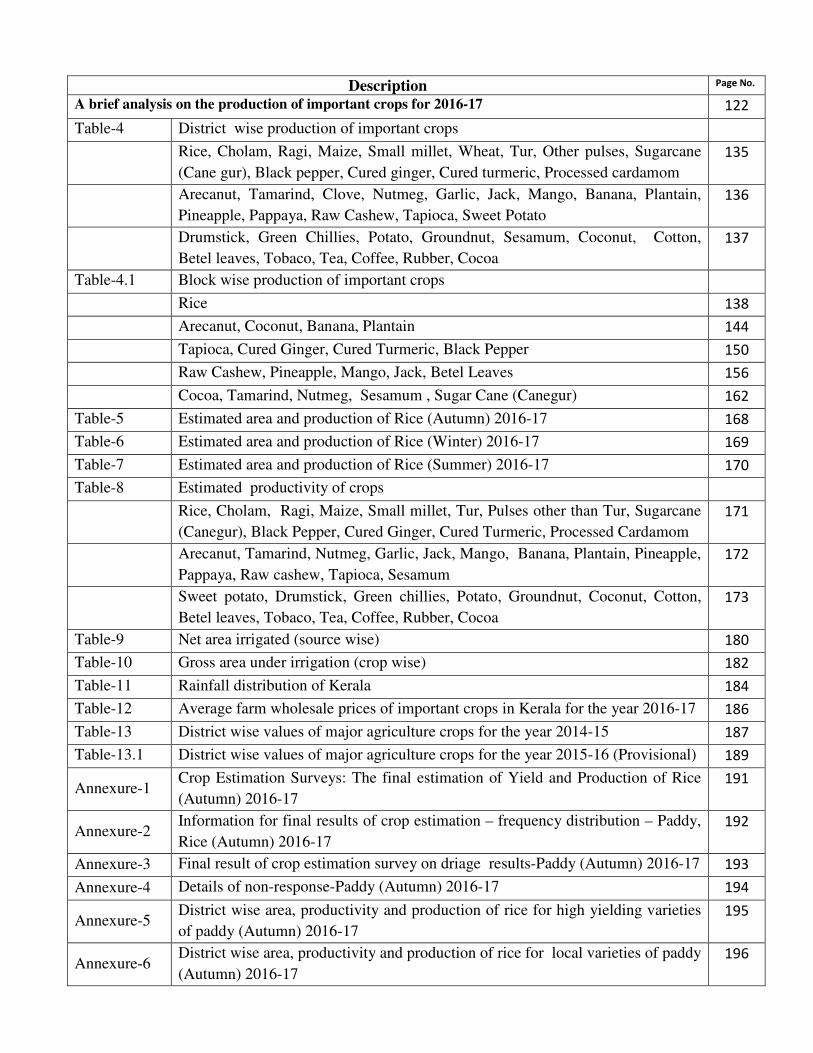
Description Page No.
A brief analysis on the production of important crops for 2016-17 122
Table-4 District wise production of important crops
Rice, Cholam, Ragi, Maize, Small millet, Wheat, Tur, Other pulses, Sugarcane
(Cane gur), Black pepper, Cured ginger, Cured turmeric, Processed cardamom
135
Arecanut, Tamarind, Clove, Nutmeg, Garlic, Jack, Mango, Banana, Plantain,
Pineapple, Pappaya, Raw Cashew, Tapioca, Sweet Potato
136
Drumstick, Green Chillies, Potato, Groundnut, Sesamum, Coconut, Cotton,
Betel leaves, Tobaco, Tea, Coffee, Rubber, Cocoa
137
Table-4.1 Block wise production of important crops
Rice 138
Arecanut, Coconut, Banana, Plantain 144
Tapioca, Cured Ginger, Cured Turmeric, Black Pepper 150
Raw Cashew, Pineapple, Mango, Jack, Betel Leaves 156
Cocoa, Tamarind, Nutmeg, Sesamum , Sugar Cane (Canegur) 162
Table-5 Estimated area and production of Rice (Autumn) 2016-17 168
Table-6 Estimated area and production of Rice (Winter) 2016-17 169
Table-7 Estimated area and production of Rice (Summer) 2016-17 170
Table-8 Estimated productivity of crops
Rice, Cholam, Ragi, Maize, Small millet, Tur, Pulses other than Tur, Sugarcane
(Canegur), Black Pepper, Cured Ginger, Cured Turmeric, Processed Cardamom
171
Arecanut, Tamarind, Nutmeg, Garlic, Jack, Mango, Banana, Plantain, Pineapple,
Pappaya, Raw cashew, Tapioca, Sesamum
172
Sweet potato, Drumstick, Green chillies, Potato, Groundnut, Coconut, Cotton,
Betel leaves, Tobaco, Tea, Coffee, Rubber, Cocoa
173
Table-9 Net area irrigated (source wise) 180
Table-10 Gross area under irrigation (crop wise) 182
Table-11 Rainfall distribution of Kerala 184
Table-12 Average farm wholesale prices of important crops in Kerala for the year 2016-17 186
Table-13 District wise values of major agriculture crops for the year 2014-15 187
Table-13.1 District wise values of major agriculture crops for the year 2015-16 (Provisional) 189
Annexure-1 Crop Estimation Surveys: The final estimation of Yield and Production of Rice
(Autumn) 2016-17
191
Annexure-2 Information for final results of crop estimation – frequency distribution – Paddy,
Rice (Autumn) 2016-17
192
Annexure-3 Final result of crop estimation survey on driage results-Paddy (Autumn) 2016-17 193
Annexure-4 Details of non-response-Paddy (Autumn) 2016-17 194
Annexure-5 District wise area, productivity and production of rice for high yielding varieties
of paddy (Autumn) 2016-17
195
Annexure-6 District wise area, productivity and production of rice for local varieties of paddy
(Autumn) 2016-17
196
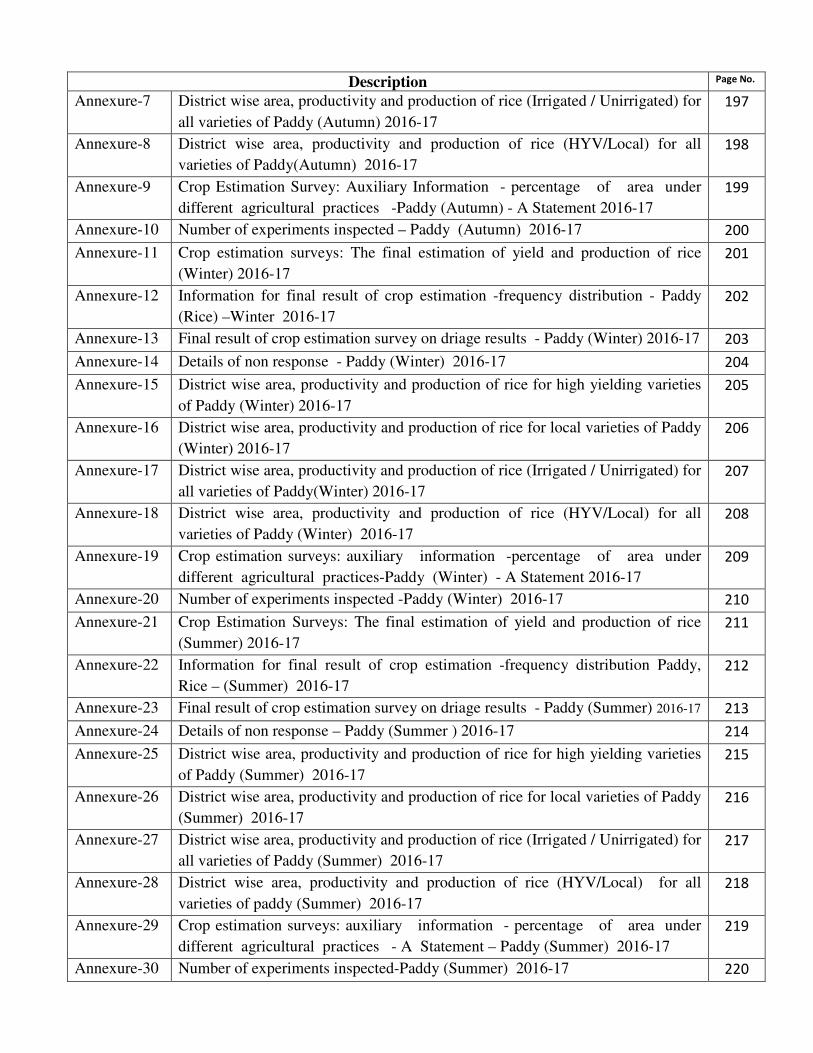
Description Page No.
Annexure-7 District wise area, productivity and production of rice (Irrigated / Unirrigated) for
all varieties of Paddy (Autumn) 2016-17
197
Annexure-8 District wise area, productivity and production of rice (HYV/Local) for all
varieties of Paddy(Autumn) 2016-17
198
Annexure-9 Crop Estimation Survey: Auxiliary Information - percentage of area under
different agricultural practices -Paddy (Autumn) - A Statement 2016-17
199
Annexure-10 Number of experiments inspected – Paddy (Autumn) 2016-17 200
Annexure-11 Crop estimation surveys: The final estimation of yield and production of rice
(Winter) 2016-17
201
Annexure-12 Information for final result of crop estimation -frequency distribution - Paddy
(Rice) –Winter 2016-17
202
Annexure-13 Final result of crop estimation survey on driage results - Paddy (Winter) 2016-17 203
Annexure-14 Details of non response - Paddy (Winter) 2016-17 204
Annexure-15 District wise area, productivity and production of rice for high yielding varieties
of Paddy (Winter) 2016-17
205
Annexure-16 District wise area, productivity and production of rice for local varieties of Paddy
(Winter) 2016-17
206
Annexure-17 District wise area, productivity and production of rice (Irrigated / Unirrigated) for
all varieties of Paddy(Winter) 2016-17
207
Annexure-18 District wise area, productivity and production of rice (HYV/Local) for all
varieties of Paddy (Winter) 2016-17
208
Annexure-19 Crop estimation surveys: auxiliary information -percentage of area under
different agricultural practices-Paddy (Winter) - A Statement 2016-17
209
Annexure-20 Number of experiments inspected -Paddy (Winter) 2016-17 210
Annexure-21 Crop Estimation Surveys: The final estimation of yield and production of rice
(Summer) 2016-17
211
Annexure-22 Information for final result of crop estimation -frequency distribution Paddy,
Rice – (Summer) 2016-17
212
Annexure-23 Final result of crop estimation survey on driage results - Paddy (Summer) 2016-17 213
Annexure-24 Details of non response – Paddy (Summer ) 2016-17 214
Annexure-25 District wise area, productivity and production of rice for high yielding varieties
of Paddy (Summer) 2016-17
215
Annexure-26 District wise area, productivity and production of rice for local varieties of Paddy
(Summer) 2016-17
216
Annexure-27 District wise area, productivity and production of rice (Irrigated / Unirrigated) for
all varieties of Paddy (Summer) 2016-17
217
Annexure-28 District wise area, productivity and production of rice (HYV/Local) for all
varieties of paddy (Summer) 2016-17
218
Annexure-29 Crop estimation surveys: auxiliary information - percentage of area under
different agricultural practices - A Statement – Paddy (Summer) 2016-17
219
Annexure-30 Number of experiments inspected-Paddy (Summer) 2016-17 220
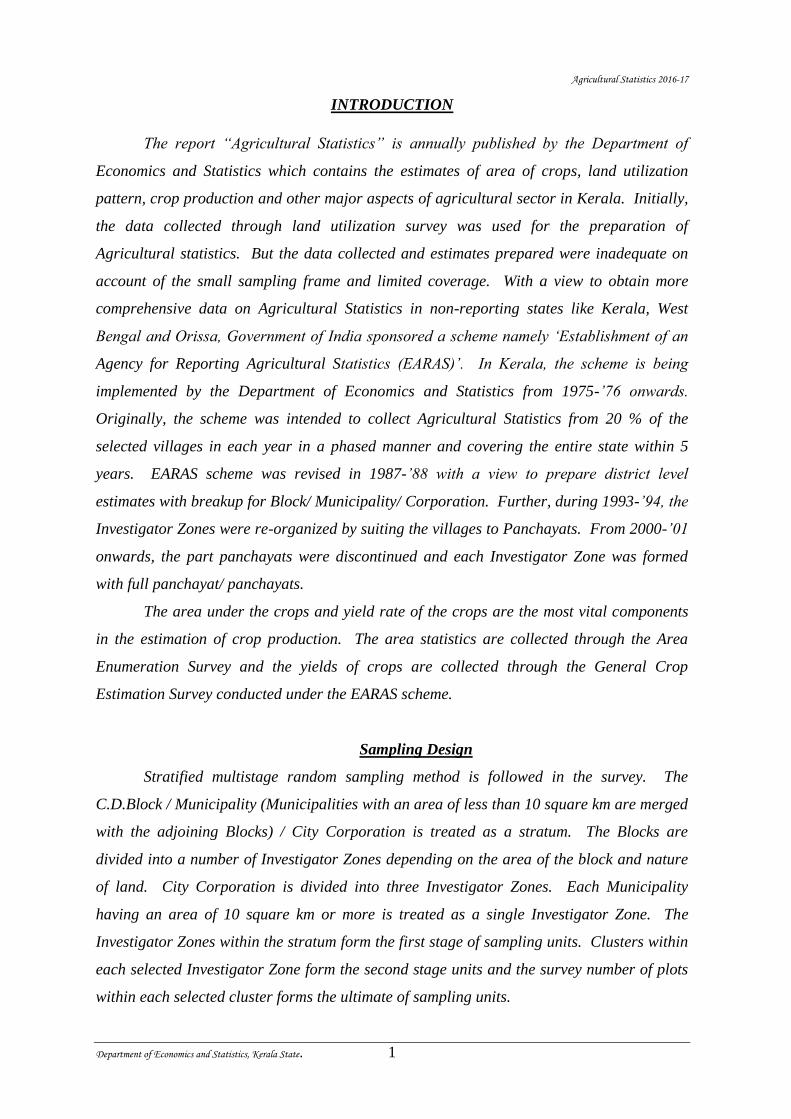
Agricultural Statistics 2016-17
Department of Economics and Statistics, Kerala State. 1
INTRODUCTION
The report “Agricultural Statistics” is annually published by the Department of
Economics and Statistics which contains the estimates of area of crops, land utilization
pattern, crop production and other major aspects of agricultural sector in Kerala. Initially,
the data collected through land utilization survey was used for the preparation of
Agricultural statistics. But the data collected and estimates prepared were inadequate on
account of the small sampling frame and limited coverage. With a view to obtain more
comprehensive data on Agricultural Statistics in non-reporting states like Kerala, West
Bengal and Orissa, Government of India sponsored a scheme namely ‘Establishment of an
Agency for Reporting Agricultural Statistics (EARAS)’. In Kerala, the scheme is being
implemented by the Department of Economics and Statistics from 1975-’76 onwards.
Originally, the scheme was intended to collect Agricultural Statistics from 20 % of the
selected villages in each year in a phased manner and covering the entire state within 5
years. EARAS scheme was revised in 1987-’88 with a view to prepare district level
estimates with breakup for Block/ Municipality/ Corporation. Further, during 1993-’94, the
Investigator Zones were re-organized by suiting the villages to Panchayats. From 2000-’01
onwards, the part panchayats were discontinued and each Investigator Zone was formed
with full panchayat/ panchayats.
The area under the crops and yield rate of the crops are the most vital components
in the estimation of crop production. The area statistics are collected through the Area
Enumeration Survey and the yields of crops are collected through the General Crop
Estimation Survey conducted under the EARAS scheme.
Sampling Design
Stratified multistage random sampling method is followed in the survey. The
C.D.Block / Municipality (Municipalities with an area of less than 10 square km are merged
with the adjoining Blocks) / City Corporation is treated as a stratum. The Blocks are
divided into a number of Investigator Zones depending on the area of the block and nature
of land. City Corporation is divided into three Investigator Zones. Each Municipality
having an area of 10 square km or more is treated as a single Investigator Zone. The
Investigator Zones within the stratum form the first stage of sampling units. Clusters within
each selected Investigator Zone form the second stage units and the survey number of plots
within each selected cluster forms the ultimate of sampling units.
Agricultural Statistics 2016-17
Department of Economics and Statistics, Kerala State. 2
Sampling Size
In each Investigator Zone, 100 clusters are allocated among the dry lands and wet
land in proportion to the area under these categories in the zone. 100 survey / subdivision
numbers are selected from the Basic Tax Register by using circular systematic random
sampling method. These are the key plots for cluster formation.
Investigators identify the survey number of the key plots and 4 or more survey
numbers / subdivision numbers adjacent to the key survey number (clubbed survey numbers,
if the area of survey numbers are small) as per the Instruction Manual of the survey. Wet
and dry land clusters are enumerated separately. Wetland clusters are enumerated in all
three seasons - autumn, winter and summer and dry land plots are enumerated at least two
times for area enumeration during the agriculture year.
The area under the crops of each season, annual, perennial and horticulture crops
etc., land utilization details, irrigation particulars, etc. are collected by the investigators at
the time of area enumeration. Simultaneously, Investigators select and conduct crop-cutting
experiments of all major crops and the selected minor crops for the estimation of yield rates
and production of the respective crops.
The data on mean yield of crops thus obtained are provided to the National
Agriculture Insurance Company for assessing the crop damages of the selected crops in the
respective seasons and to pay compensation to the concerned farmers for the insured crops
under the Modified National Agricultural Insurance Scheme (MNAIS).
Agricultural Statistics 2016-17
Department of Economics and Statistics, Kerala State. 3
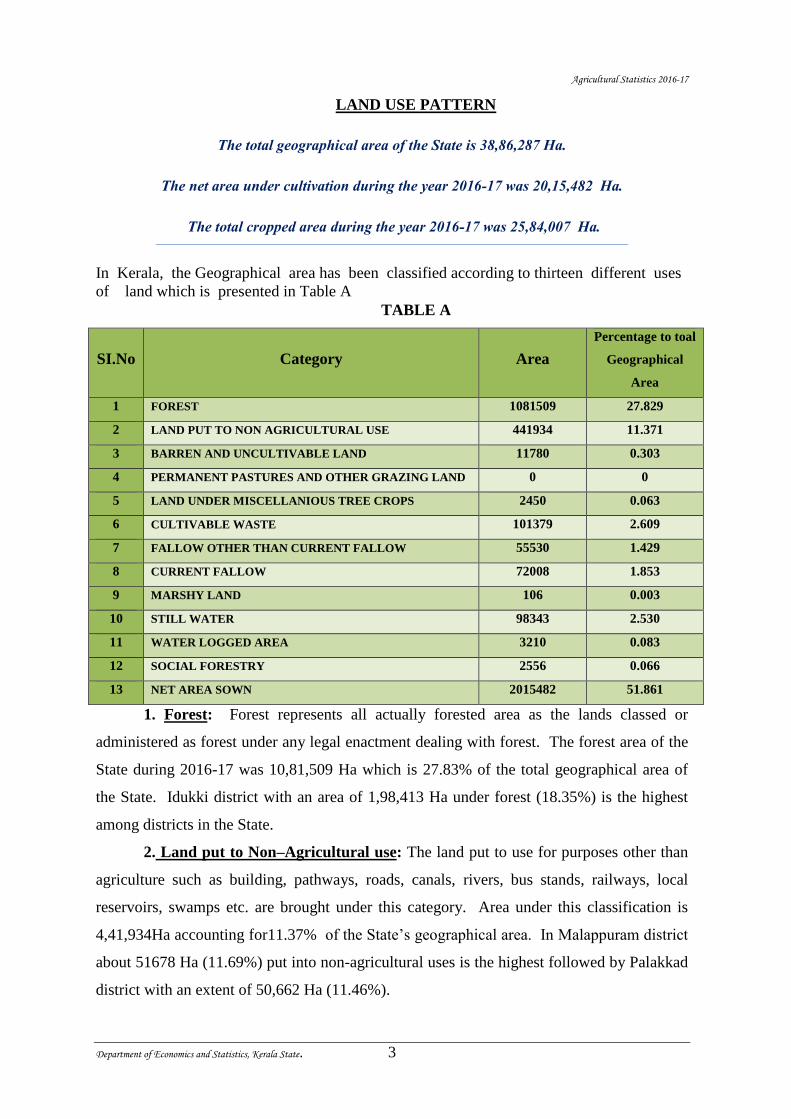
LAND USE PATTERN
The total geographical area of the State is 38,86,287 Ha.
The net area under cultivation during the year 2016-17 was 20,15,482 Ha.
The total cropped area during the year 2016-17 was 25,84,007 Ha.
In Kerala, the Geographical area has been classified according to thirteen different uses
of land which is presented in Table A
TABLE A
SI.No Category Area
Percentage to toal
Geographical
Area
1 FOREST 1081509 27.829
2 LAND PUT TO NON AGRICULTURAL USE 441934 11.371
3 BARREN AND UNCULTIVABLE LAND 11780 0.303
4 PERMANENT PASTURES AND OTHER GRAZING LAND 0 0
5 LAND UNDER MISCELLANIOUS TREE CROPS 2450 0.063
6 CULTIVABLE WASTE 101379 2.609
7 FALLOW OTHER THAN CURRENT FALLOW 55530 1.429
8 CURRENT FALLOW 72008 1.853
9 MARSHY LAND 106 0.003
10 STILL WATER 98343 2.530
11 WATER LOGGED AREA 3210 0.083
12 SOCIAL FORESTRY 2556 0.066
13 NET AREA SOWN 2015482 51.861
1. Forest: Forest represents all actually forested area as the lands classed or
administered as forest under any legal enactment dealing with forest. The forest area of the
State during 2016-17 was 10,81,509 Ha which is 27.83% of the total geographical area of
the State. Idukki district with an area of 1,98,413 Ha under forest (18.35%) is the highest
among districts in the State.
2. Land put to Non–Agricultural use: The land put to use for purposes other than
agriculture such as building, pathways, roads, canals, rivers, bus stands, railways, local
reservoirs, swamps etc. are brought under this category. Area under this classification is
4,41,934Ha accounting for11.37% of the State’s geographical area. In Malappuram district
about 51678 Ha (11.69%) put into non-agricultural uses is the highest followed by Palakkad
district with an extent of 50,662 Ha (11.46%).
Agricultural Statistics 2016-17
Department of Economics and Statistics, Kerala State. 4
3. Barren and uncultivable land: Land which cannot be brought under cultivation
unless at a high cost, whether such a land is in isolated blocks or within cultivated holdings,
such as mountains, deserts, hills etc are classified as barren and uncultivable land.
The total land comes under this category is 11780 Ha which represents 0.30% of the
total geographical area of the State. Kasaragode district alone accounted for 3,556 Ha
which is 30.19% of the state’s barren and uncultivable land.
4. Permanent pastures and other grazing land:- All grazing lands, whether they
are permanent pastures or meadows are considered as permanent pastures and other grazing
lands. No area falls under this category in 2016-17.
5. Land under miscellaneous tree crops :-All cultivable lands, which is not
included under net area sown, but is put to some agricultural use such as land under
casuarina trees, thatching grass bamboo bushes and other groves for fuel etc. come under
this category. Out of the total geographical area, land under miscellaneous tree crops and
groves are not included in the net area sown and it occupies only 2450 Ha (0.06%)
6. Cultivable waste : These include land available for cultivation but not taken up
for cultivation or abandoned after a few years for one reason or the other . Such lands may
be either fallow or covered with shrubs and jungles, which are not put to any use. They may
be assessed or unassessed and may lie in isolated blocks or within cultivate holdings. Lands
once cultivated but remaining uncultivated for five years or more in succession shall also be
included in this category. The total area under cultivable waste during 2016-17 is 101379
Ha ie, 2.61 % of the total geographical area of the State. The area under this category is
highest in Palakkad district accounting 23,284 Ha.
7. Fallow other than current fallow : Land which were taken up for cultivation
but have been temporarily put off cultivation for a period of not less than one year but not
more than five years due to abject poverty of the cultivators, inadequate supply of water,
silting of canals and rivers etc are treated as other fallow land. The total area under other
fallow land during 2016-17 accounts 55,530 Ha which is 1.43% of the total geographical
area. The land under this category was highest in Palakkad district with 16,155 Ha followed
by Ernakulam district with 8,031 Ha.
8. Current fallow : Land that are kept fallow off out of the net area sown during the
previous year are classified as current fallow for the reporting year. The area under this
category during 2016-17 is 72,008 Ha., which is 1.85% of total geographical area.
9. Marshy land : Land which gets permanently or periodically inundated by water
and characterized by vegetation which includes grasses and weeds. Out of the total
Agricultural Statistics 2016-17
Department of Economics and Statistics, Kerala State. 5
geographical area only 106 Ha come under marshy land during the year 2016-17. Kannur
district with 95 Ha ranked first contributing 89.62 % to the total marshy land of the State.
10. Still water: The land under still water is broadly the land occupied by water
bodies like rivers, lakes, ponds, reservoirs, backwater, canals, tanks including nature made
deeps in which water stands still for most part of the period. This is the land on which there
is no vegetative growth of any kind. Out of the total geographical area, 98343 Ha of land is
under still water constituting 2.53 %. The land under still water is highest in Palakkad
district and the area is 15,333 Ha.
11. Water logged area : It is the land where water is at / near the surface and stands
for most part of the year. It is generally found in low -lying areas and it excludes lakes,
ponds and tanks. The total water logged area for the year 2016-17 is 3,210 Ha. It is 0.08%
of the total geographical area of the State.
12. Social Forestry : The land under social forestry is the land in which the trees
are planted by the side of railway lines, road side, river and canal banks with a view to meet
the fuel and the fodder needs of the rural population and to serve the broader goals of soil
conservation and provision of shed and shelter for crops. It also includes village
forests/plantation which is being used by common man. An extend of 2,556 Ha of land
comes under social forestry. The land under social forestry is highest in Idukki district and
it is 1,142 Ha (44.68%) followed by Palakkad district 380 Ha (14.87%).
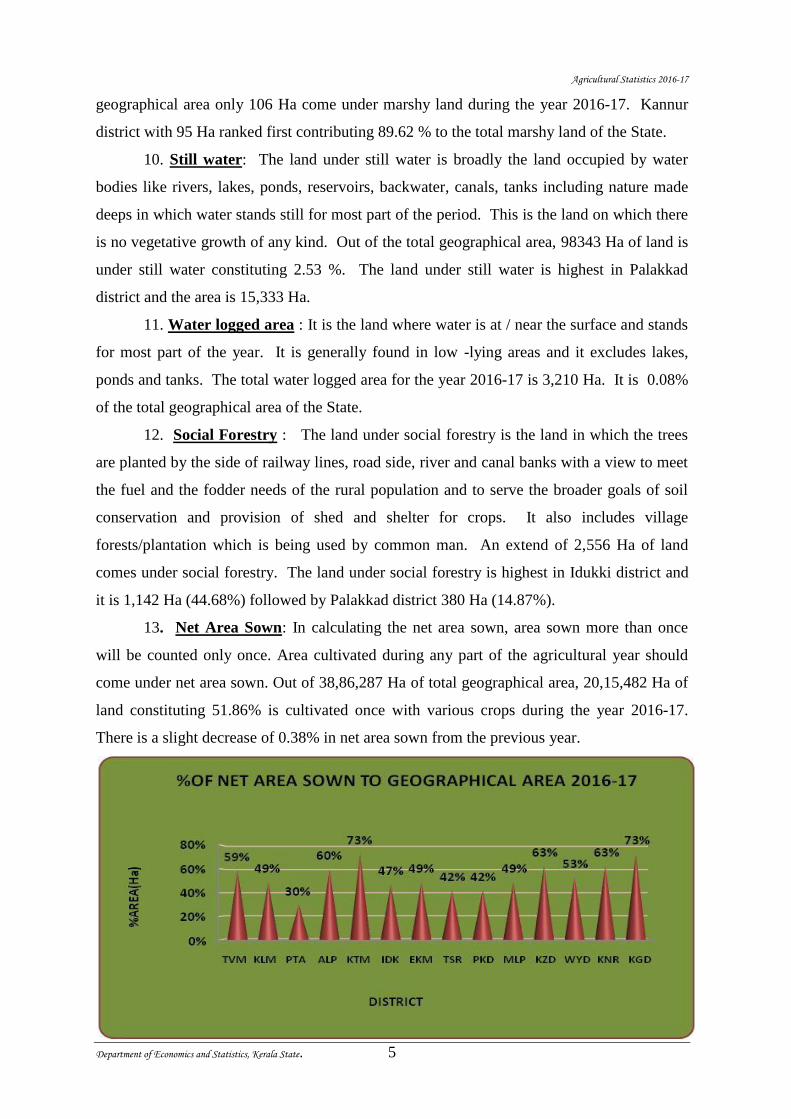
13. Net Area Sown: In calculating the net area sown, area sown more than once
will be counted only once. Area cultivated during any part of the agricultural year should
come under net area sown. Out of 38,86,287 Ha of total geographical area, 20,15,482 Ha of
land constituting 51.86% is cultivated once with various crops during the year 2016-17.
There is a slight decrease of 0.38% in net area sown from the previous year.
Agricultural Statistics 2016-17
Department of Economics and Statistics, Kerala State. 6
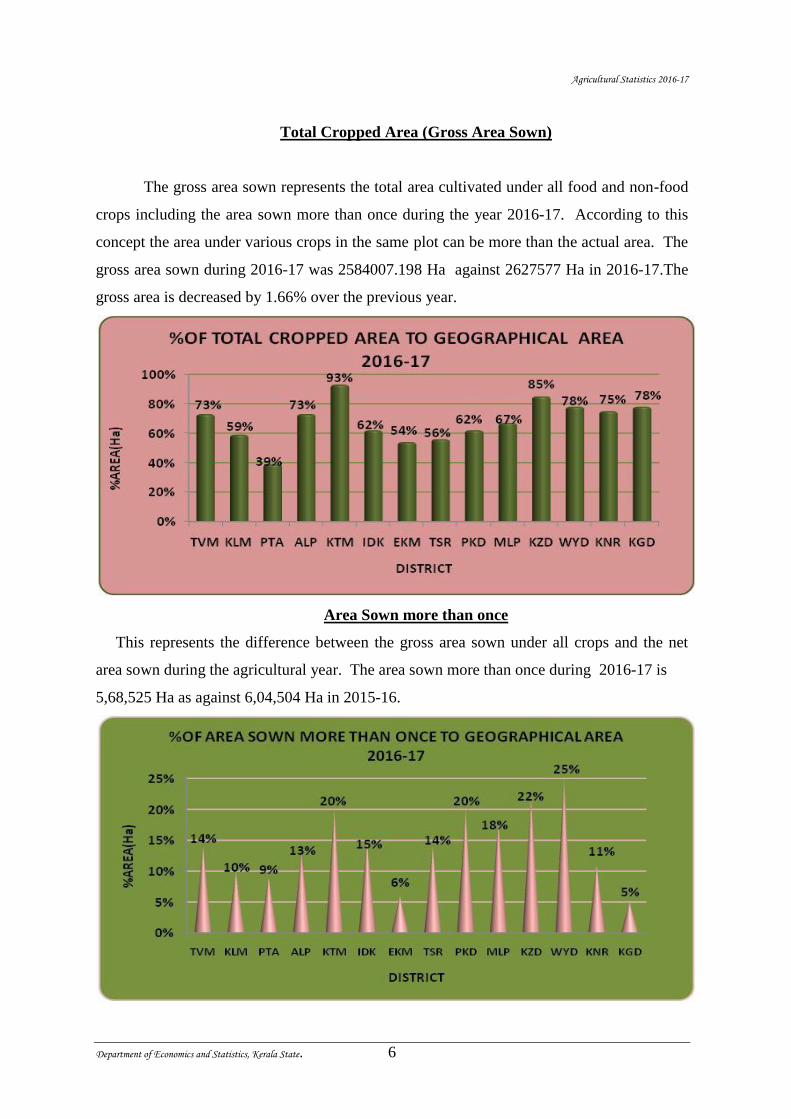
Total Cropped Area (Gross Area Sown)
The gross area sown represents the total area cultivated under all food and non-food
crops including the area sown more than once during the year 2016-17. According to this
concept the area under various crops in the same plot can be more than the actual area. The
gross area sown during 2016-17 was 2584007.198 Ha against 2627577 Ha in 2016-17.The
gross area is decreased by 1.66% over the previous year.
Area Sown more than once
This represents the difference between the gross area sown under all crops and the net
area sown during the agricultural year. The area sown more than once during 2016-17 is
5,68,525 Ha as against 6,04,504 Ha in 2015-16.
Agricultural Statistics 2016-17
Department of Economics and Statistics, Kerala State. 7
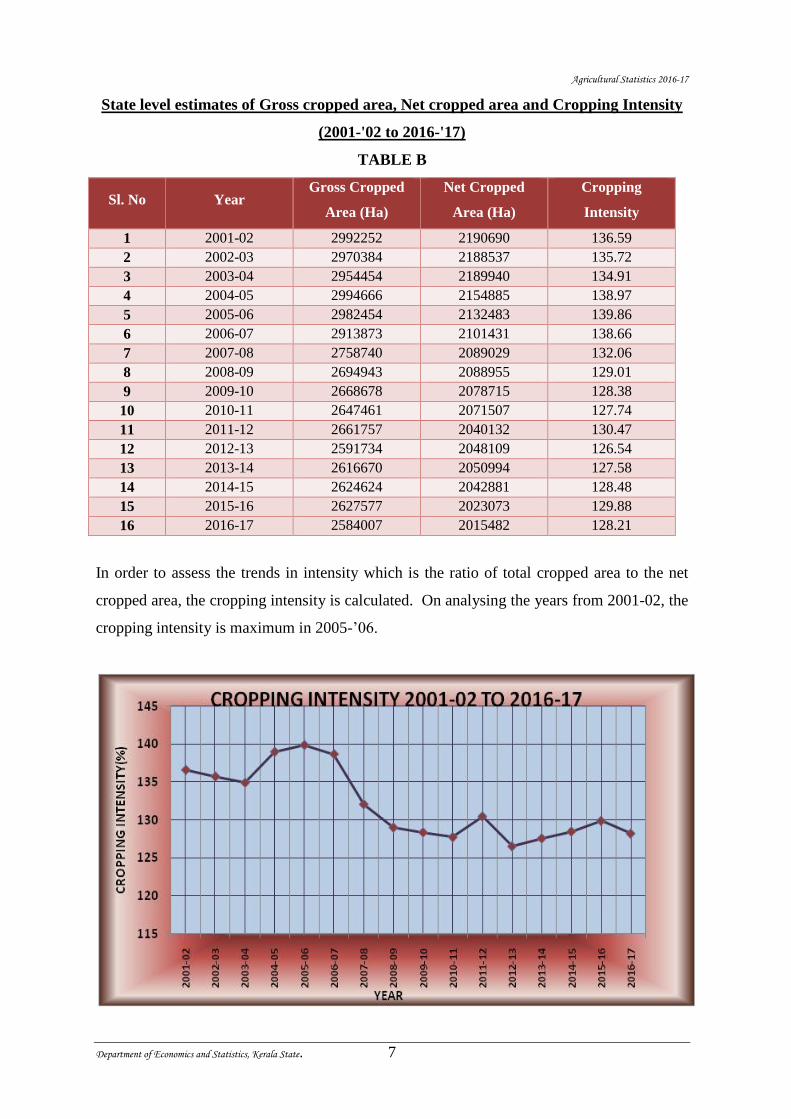
State level estimates of Gross cropped area, Net cropped area and Cropping Intensity
(2001-'02 to 2016-'17)
TABLE B
Sl. No Year Gross Cropped
Area (Ha)
Net Cropped
Area (Ha)
Cropping
Intensity
1 2001-02 2992252 2190690 136.59
2 2002-03 2970384 2188537 135.72
3 2003-04 2954454 2189940 134.91
4 2004-05 2994666 2154885 138.97
5 2005-06 2982454 2132483 139.86
6 2006-07 2913873 2101431 138.66
7 2007-08 2758740 2089029 132.06
8 2008-09 2694943 2088955 129.01
9 2009-10 2668678 2078715 128.38
10 2010-11 2647461 2071507 127.74
11 2011-12 2661757 2040132 130.47
12 2012-13 2591734 2048109 126.54
13 2013-14 2616670 2050994 127.58
14 2014-15 2624624 2042881 128.48
15 2015-16 2627577 2023073 129.88
16 2016-17 2584007 2015482 128.21
In order to assess the trends in intensity which is the ratio of total cropped area to the net
cropped area, the cropping intensity is calculated. On analysing the years from 2001-02, the
cropping intensity is maximum in 2005-’06.
Agricultural Statistics 2016-2017
Department of Economics and Statistics, Kerala State. 8
A BRIEF ANALYSIS OF THE AREA OF IMPORTANT CROPS FOR 2016-17
Agricultural crops in the state are broadly classified as food crops and non-food crops.
Food crops are cereals & millets, pulses, sugar crops, spices & condiments, fresh fruits,
vegetables, etc. The major non-food crops are rubber, betel leaves, lemon grass, etc.
Another classification of crops is seasonal crops, annual crops and perennial crops which are
based on their life time.
Seasonal crops: Paddy, pulses, tapioca, vegetables, sweet potato, tubers,
groundnut, ginger, turmeric, cotton, tobacco, onion, tur, etc.
Annual crops: Sugarcane, banana, plantain, pineapple, betel leaves, etc.
Perennial crops: Coconut, arecanut, cashew, mango, jack, tamarind, pepper,
rubber, tea, coffee, cardamom, cloves, nutmeg, cinnamon, cocoa, papaya, etc.
Food Grains
Paddy, Pulses and Grains include the category of food grains. The total area under
cultivation of food grains during 2016-17 is 1,73,386 Ha. The area of food grains decreased
by 13.72% during 2016-17 from the year 2015-16. Also comparing with 2001-02 total area
under food grains decreased by 49%.
Paddy:
Paddy is cultivated in three seasons in all the districts of Kerala except Wayanad
district. In Wayanad there is no autumn paddy cultivation. The area under paddy cultivation
in the state is decreasing regularly. Area of paddy is collected in three seasons and its area is
estimated even in panchayath level. Upland cultivation of paddy is the new change in kerala.
The total paddy area during the year 1961-’62, was 7.53 lakh hectares and in 1975-’76
it was 8.76 lakh hectares. Thereafter a steady decrease in paddy cultivation and reached to
2.29 lakhs hectares during the agricultural year 2007-08. But in 2008-09, area of paddy
cultivation was increased as 2.34 lakh hectares. On comparing with the year 1975-76, area of
paddy cultivation has decreased 80.43% during the year 2016-17.
Agricultural Statistics 2016-2017
Department of Economics and Statistics, Kerala State. 9
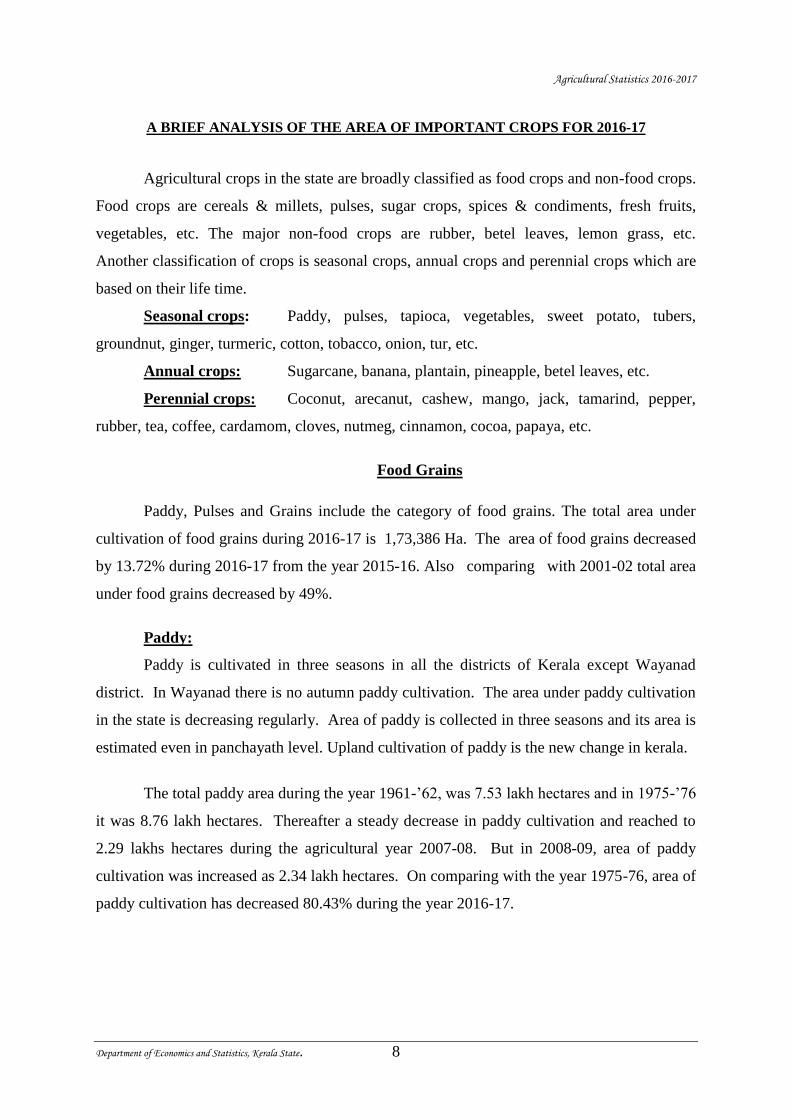
The area under paddy cultivation in Kerala during the agricultural year 2016-17 is
1,71,398 Ha
It is decreased by 25472 Ha (12.94%) than the previous agricultural year 2015-16
where as the variation was only 0.65% in the year 2015-16 comparing with 2014-15.
Besides,the production of rice is very low during 2016-17, since draught has
intensively affected all over the state.
There is 5214.3 Ha dry land paddy cultivation in Kerala during 2016-17.
On comparing with 2001-02, 46.8% of paddy area decreased during 2016-17
On analyzing the area of last 10 years, paddy cultivation is high during the
agricultural year 2008-09 and the area is 2,34,265 Ha.
Paddy accounted 6.63% of the total cropped area in the state during 2016-17.
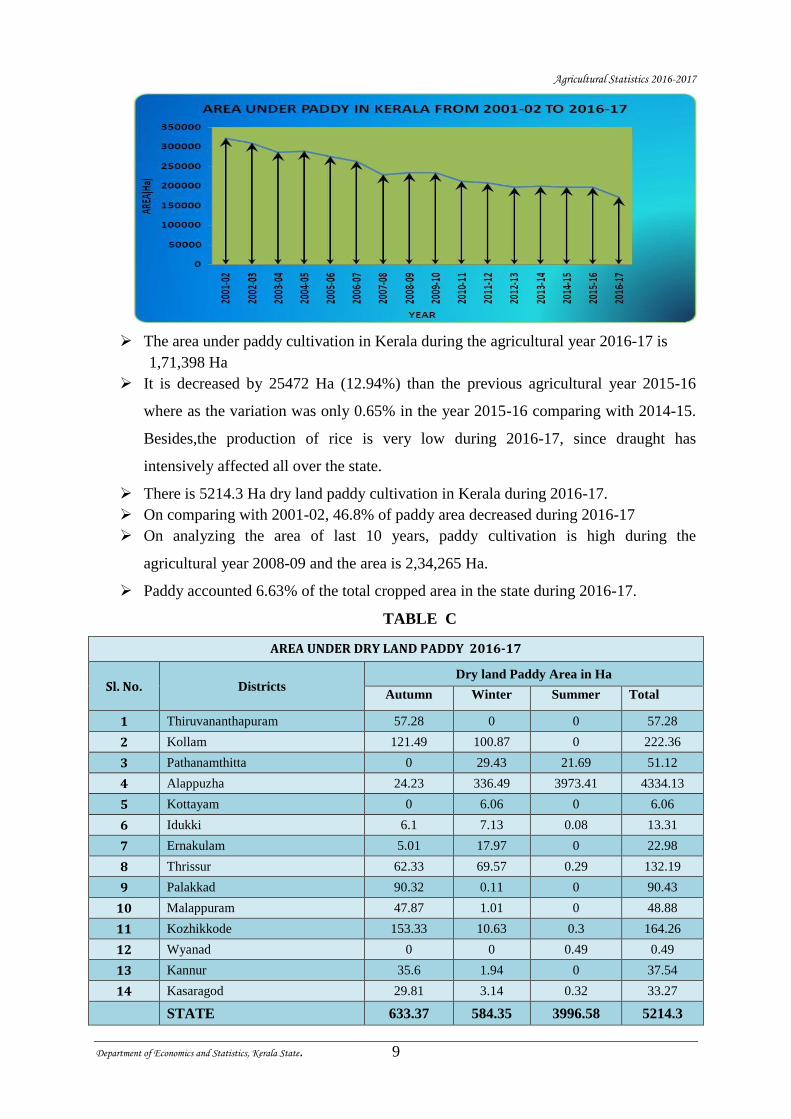
TABLE C
AREA UNDER DRY LAND PADDY 2016-17
Sl. No. Districts Dry land Paddy Area in Ha
Autumn Winter Summer Total
1 Thiruvananthapuram 57.28 0 0 57.28
2 Kollam 121.49 100.87 0 222.36
3 Pathanamthitta 0 29.43 21.69 51.12
4 Alappuzha 24.23 336.49 3973.41 4334.13
5 Kottayam 0 6.06 0 6.06
6 Idukki 6.1 7.13 0.08 13.31
7 Ernakulam 5.01 17.97 0 22.98
8 Thrissur 62.33 69.57 0.29 132.19
9 Palakkad 90.32 0.11 0 90.43
10 Malappuram 47.87 1.01 0 48.88
11 Kozhikkode 153.33 10.63 0.3 164.26
12 Wyanad 0 0 0.49 0.49
13 Kannur 35.6 1.94 0 37.54
14 Kasaragod 29.81 3.14 0.32 33.27
STATE 633.37 584.35 3996.58 5214.3
Agricultural Statistics 2016-2017
Department of Economics and Statistics, Kerala State. 10
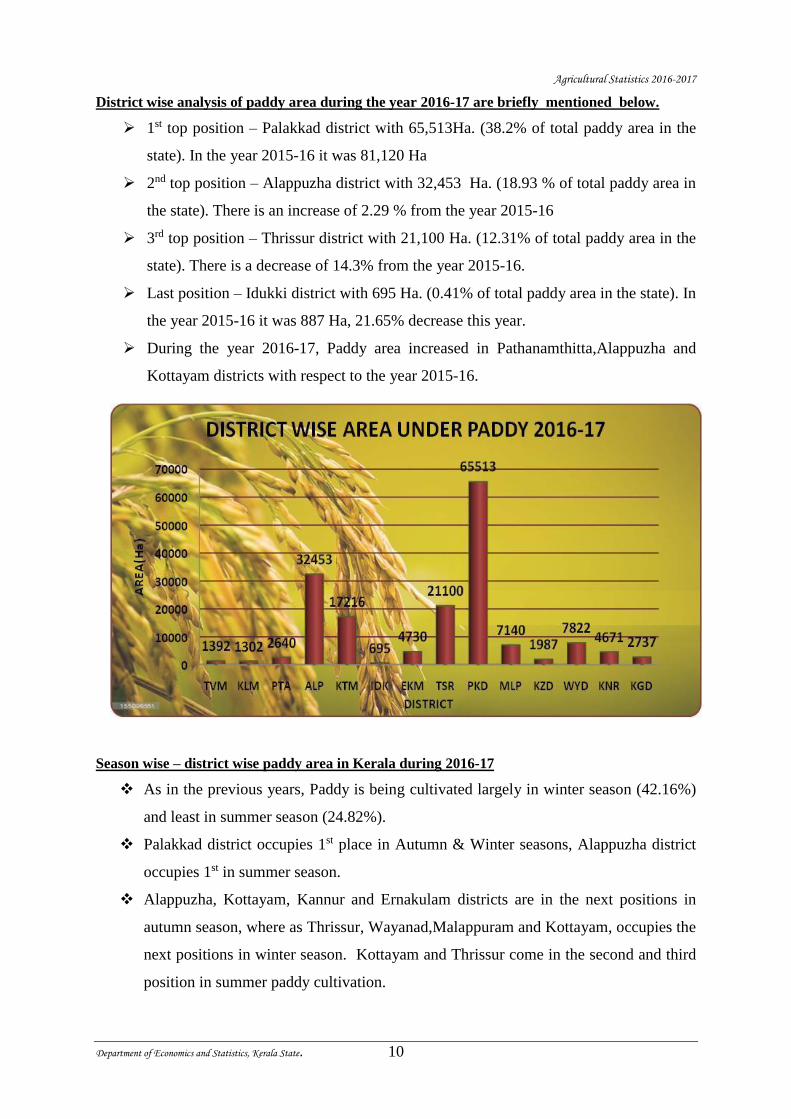
District wise analysis of paddy area during the year 2016-17 are briefly mentioned below.
1st top position – Palakkad district with 65,513Ha. (38.2% of total paddy area in the
state). In the year 2015-16 it was 81,120 Ha
2nd top position – Alappuzha district with 32,453 Ha. (18.93 % of total paddy area in
the state). There is an increase of 2.29 % from the year 2015-16
3rd top position – Thrissur district with 21,100 Ha. (12.31% of total paddy area in the
state). There is a decrease of 14.3% from the year 2015-16.
Last position – Idukki district with 695 Ha. (0.41% of total paddy area in the state). In
the year 2015-16 it was 887 Ha, 21.65% decrease this year.
During the year 2016-17, Paddy area increased in Pathanamthitta,Alappuzha and
Kottayam districts with respect to the year 2015-16.
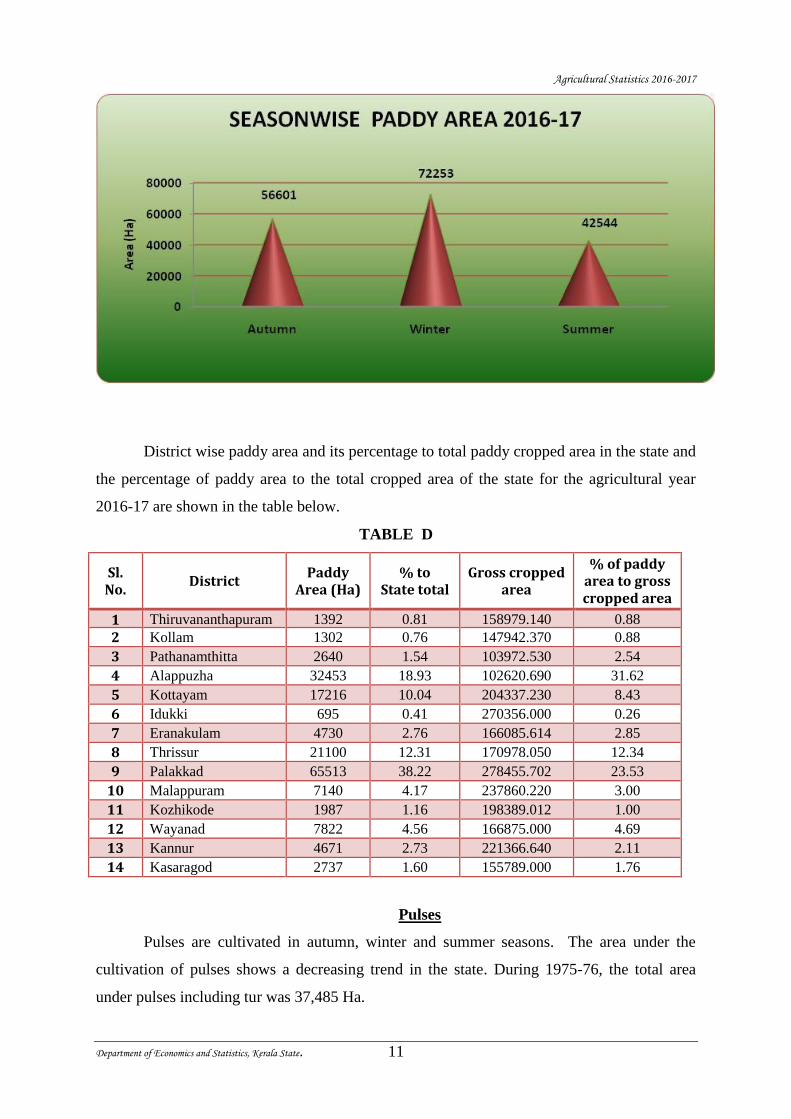
Season wise – district wise paddy area in Kerala during 2016-17
As in the previous years, Paddy is being cultivated largely in winter season (42.16%)
and least in summer season (24.82%).
Palakkad district occupies 1st place in Autumn & Winter seasons, Alappuzha district
occupies 1st in summer season.
Alappuzha, Kottayam, Kannur and Ernakulam districts are in the next positions in
autumn season, where as Thrissur, Wayanad,Malappuram and Kottayam, occupies the
next positions in winter season. Kottayam and Thrissur come in the second and third
position in summer paddy cultivation.
Agricultural Statistics 2016-2017
Department of Economics and Statistics, Kerala State. 11
District wise paddy area and its percentage to total paddy cropped area in the state and
the percentage of paddy area to the total cropped area of the state for the agricultural year
2016-17 are shown in the table below.
TABLE D
Sl. No.
District Paddy
Area (Ha) % to
State total Gross cropped
area
% of paddy area to gross cropped area
1 Thiruvananthapuram 1392 0.81 158979.140 0.88
2 Kollam 1302 0.76 147942.370 0.88
3 Pathanamthitta 2640 1.54 103972.530 2.54
4 Alappuzha 32453 18.93 102620.690 31.62
5 Kottayam 17216 10.04 204337.230 8.43
6 Idukki 695 0.41 270356.000 0.26
7 Eranakulam 4730 2.76 166085.614 2.85
8 Thrissur 21100 12.31 170978.050 12.34
9 Palakkad 65513 38.22 278455.702 23.53
10 Malappuram 7140 4.17 237860.220 3.00
11 Kozhikode 1987 1.16 198389.012 1.00
12 Wayanad 7822 4.56 166875.000 4.69
13 Kannur 4671 2.73 221366.640 2.11
14 Kasaragod 2737 1.60 155789.000 1.76
Pulses
Pulses are cultivated in autumn, winter and summer seasons. The area under the
cultivation of pulses shows a decreasing trend in the state. During 1975-76, the total area
under pulses including tur was 37,485 Ha.
Agricultural Statistics 2016-2017
Department of Economics and Statistics, Kerala State. 12
The total area of pulses including tur during 2016-17 is 1,738 Ha where as it was
3,764 Ha during 2015-16.
Tur is cultivated only in Palakkad District and major cultivation of pulses is in
Wayanad district in 2016-17.
On analyzing the area of last 10 years, pulses is maximum during the agricultural year
2009-10 and the area is 4449Ha.
Sugar Crops
Two important sugar crops cultivated in our state are sugarcane and palmyrah. The
total area of sugar crops during the period 2016-17 is 3,362.502 Ha and is decreased by
13.15% from 2015-16.
Sugarcane
The total area under cultivation of sugarcane during 2016-17 is 1,062.502Ha.
Idukki district stands 1st place with 78.02% area under sugarcane cultivation followed
by Palakkad district with an area of 16.14% during 2016-17. These two districts
stands 1st & 2nd positions from 2005-06 onwards continously.
On analyzing the area of last 10 years, sugarcane is maximum during the agricultural
year 2008-09 and the area is 3,392 Ha. and minimum in the year 2016-17.
Palmyrah
Palmyrah is cultivated in all districts and the contribution of this crop to total area of
sugar crops (sugarcane and palmyrah) is 68.4%. It was largely cultivated in our state in the
past years but now the area has been decreased aggressively. Analysing the cropping pattern
of Kerala, a good portion of land under palmyrah cultivation in the past years has been
shifted to other crops.
The area under cultivation of palmyrah during 2016-17 is 2,300 Ha and it covered
2,510 Ha in 2015-16.
Palakkad has more cultivation of Palmyrah with an area of 1,122 Ha and it is 48.78%
to the total area of palmyrah in the state.
On analyzing the area of last 10 years, palmyrah is maximum during the agricultural
year 2007-08 and the area is 4,468 Ha.
Agricultural Statistics 2016-2017
Department of Economics and Statistics, Kerala State. 13
Spices & Condiments
The important spices and condiments crops being cultivated in our state are pepper,
ginger, turmeric, cardamom, arecanut, tamarind, cloves, nutmeg etc. Major contribution of
spices & condiments is from Idukki district in all the years and is 31.05% during 2016-17.
Arecanut contributes 36.71% and Pepper contributes 32.02% area to the total area of spices.
The total area under the cultivation of spices & condiments during the agricultural year 2016-
17 is 2,66,130 Ha.
A brief analysis of some important spices & condiments is given below.
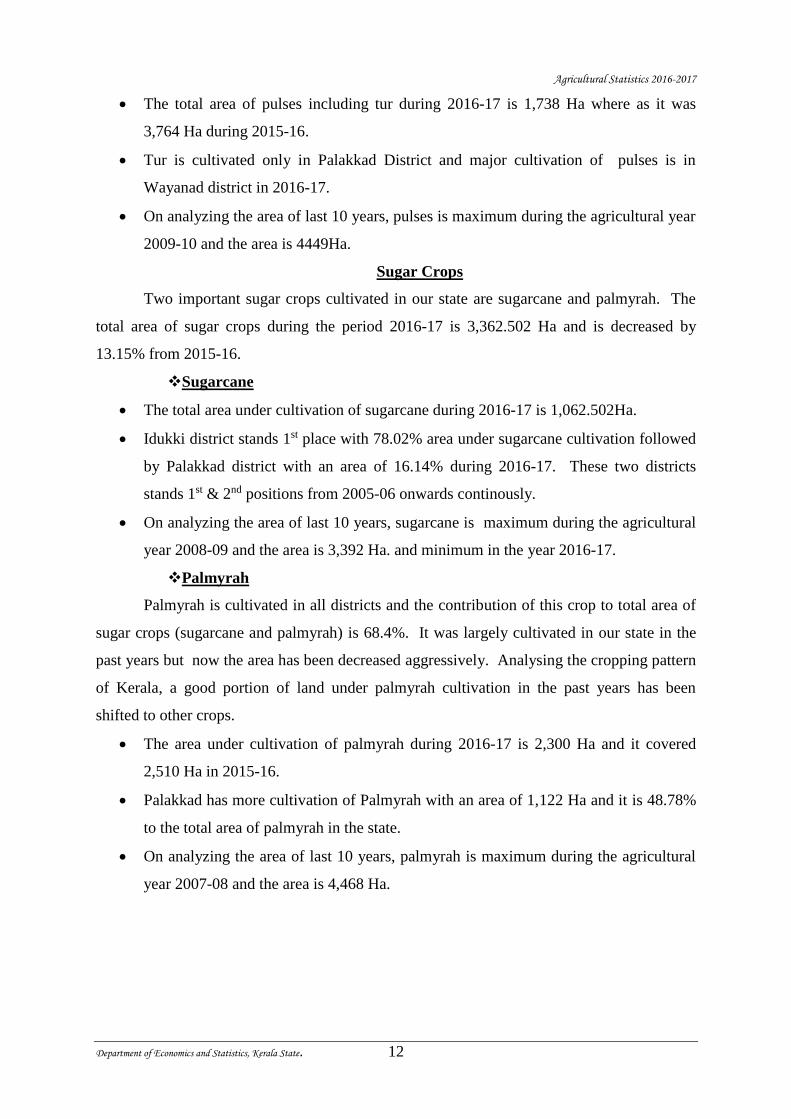
Pepper
The area under cultivation of pepper during the year 2016-17 is 85,207 Ha.
Idukki district stands 1st
position with an area of
43,790 Ha and the
contribution to state total is
51.39%.
Wayanad & Kannur
districts have the next two
top positions in area during
the last 10 years.
Pepper cultivation is least in Alappuzha district and the contribution during the year
2016-17 is only approximately 0.71%.
On analyzing the area of last 10 years, pepper is maximum during the agricultural
year 2007-08 and the area is 1,75,679 Ha.
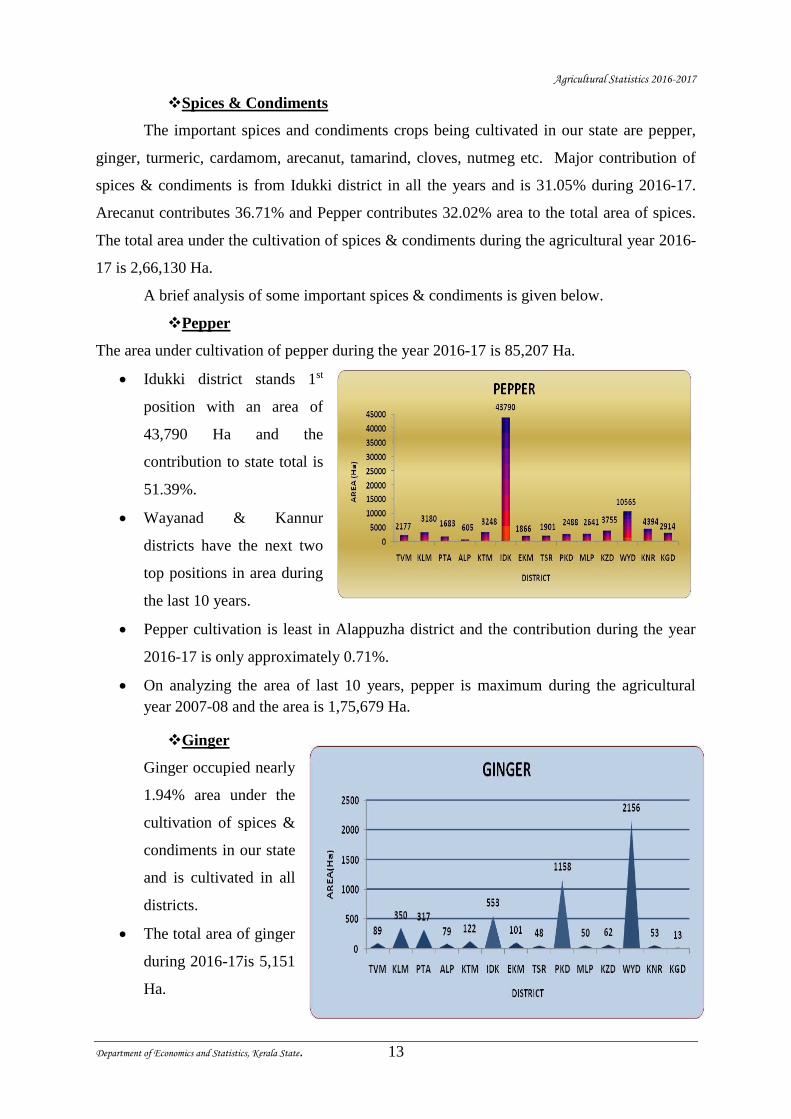
Ginger
Ginger occupied nearly
1.94% area under the
cultivation of spices &
condiments in our state
and is cultivated in all
districts.
The total area of ginger
during 2016-17is 5,151
Ha.
Agricultural Statistics 2016-2017
Department of Economics and Statistics, Kerala State. 14
3.31% area increased during 2016-17 than last year 2015-16 and 51.89% area
decreased than 2001-02.
Wayand has 1st position in the area under cultivation of ginger and the contribution is
41.86% during the year 2016-17
On analyzing the area of last 10 years, ginger is maximum during the agricultural year
2007-08 and the area is 8865 Ha.
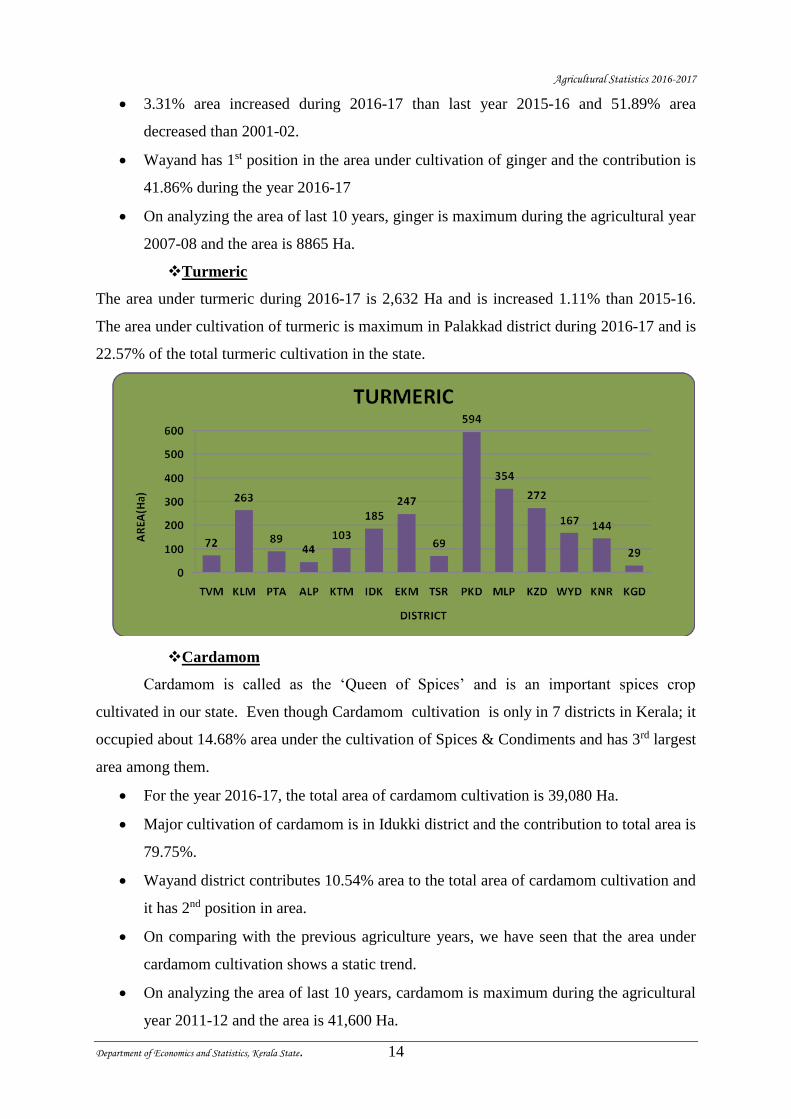
Turmeric
The area under turmeric during 2016-17 is 2,632 Ha and is increased 1.11% than 2015-16.
The area under cultivation of turmeric is maximum in Palakkad district during 2016-17 and is
22.57% of the total turmeric cultivation in the state.
Cardamom
Cardamom is called as the ‘Queen of Spices’ and is an important spices crop
cultivated in our state. Even though Cardamom cultivation is only in 7 districts in Kerala; it
occupied about 14.68% area under the cultivation of Spices & Condiments and has 3rd largest
area among them.
For the year 2016-17, the total area of cardamom cultivation is 39,080 Ha.
Major cultivation of cardamom is in Idukki district and the contribution to total area is
79.75%.
Wayand district contributes 10.54% area to the total area of cardamom cultivation and
it has 2nd position in area.
On comparing with the previous agriculture years, we have seen that the area under
cardamom cultivation shows a static trend.
On analyzing the area of last 10 years, cardamom is maximum during the agricultural
year 2011-12 and the area is 41,600 Ha.
Agricultural Statistics 2016-2017
Department of Economics and Statistics, Kerala State. 15
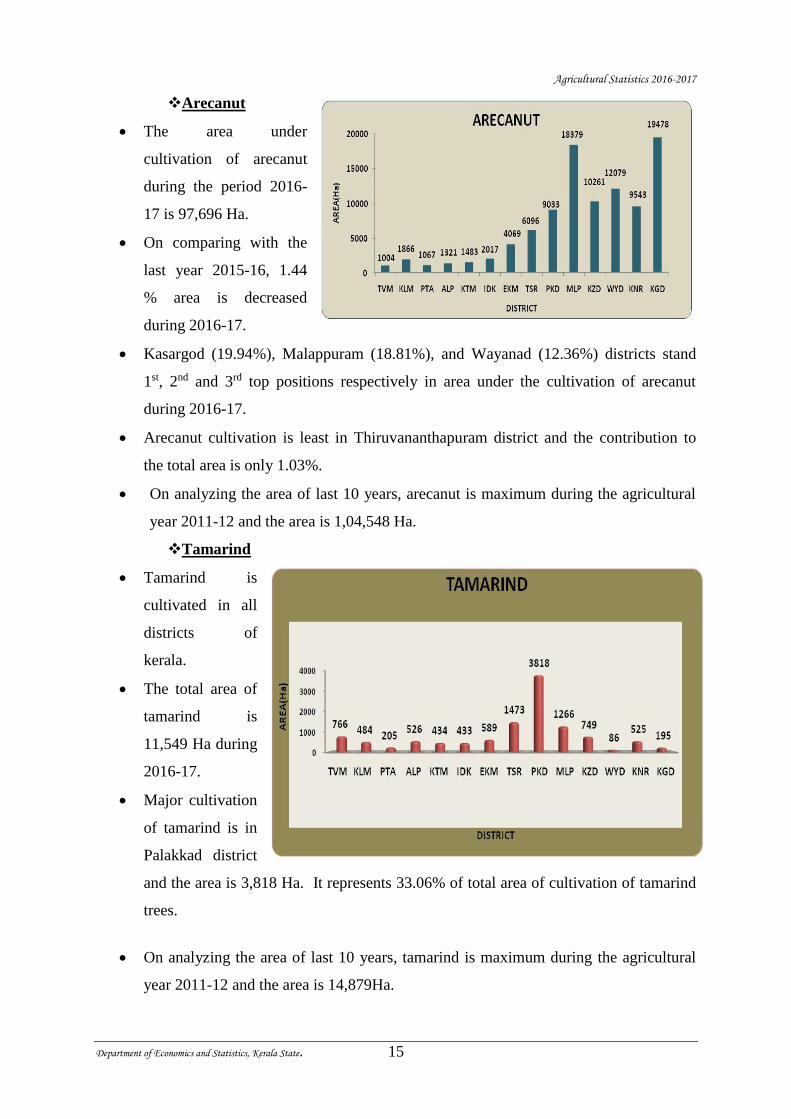
Arecanut
The area under
cultivation of arecanut
during the period 2016-
17 is 97,696 Ha.
On comparing with the
last year 2015-16, 1.44
% area is decreased
during 2016-17.
Kasargod (19.94%), Malappuram (18.81%), and Wayanad (12.36%) districts stand
1st, 2nd and 3rd top positions respectively in area under the cultivation of arecanut
during 2016-17.
Arecanut cultivation is least in Thiruvananthapuram district and the contribution to
the total area is only 1.03%.
On analyzing the area of last 10 years, arecanut is maximum during the agricultural
year 2011-12 and the area is 1,04,548 Ha.
Tamarind
Tamarind is
cultivated in all
districts of
kerala.
The total area of
tamarind is
11,549 Ha during
2016-17.
Major cultivation
of tamarind is in
Palakkad district
and the area is 3,818 Ha. It represents 33.06% of total area of cultivation of tamarind
trees.
On analyzing the area of last 10 years, tamarind is maximum during the agricultural
year 2011-12 and the area is 14,879Ha.
Agricultural Statistics 2016-2017
Department of Economics and Statistics, Kerala State. 16
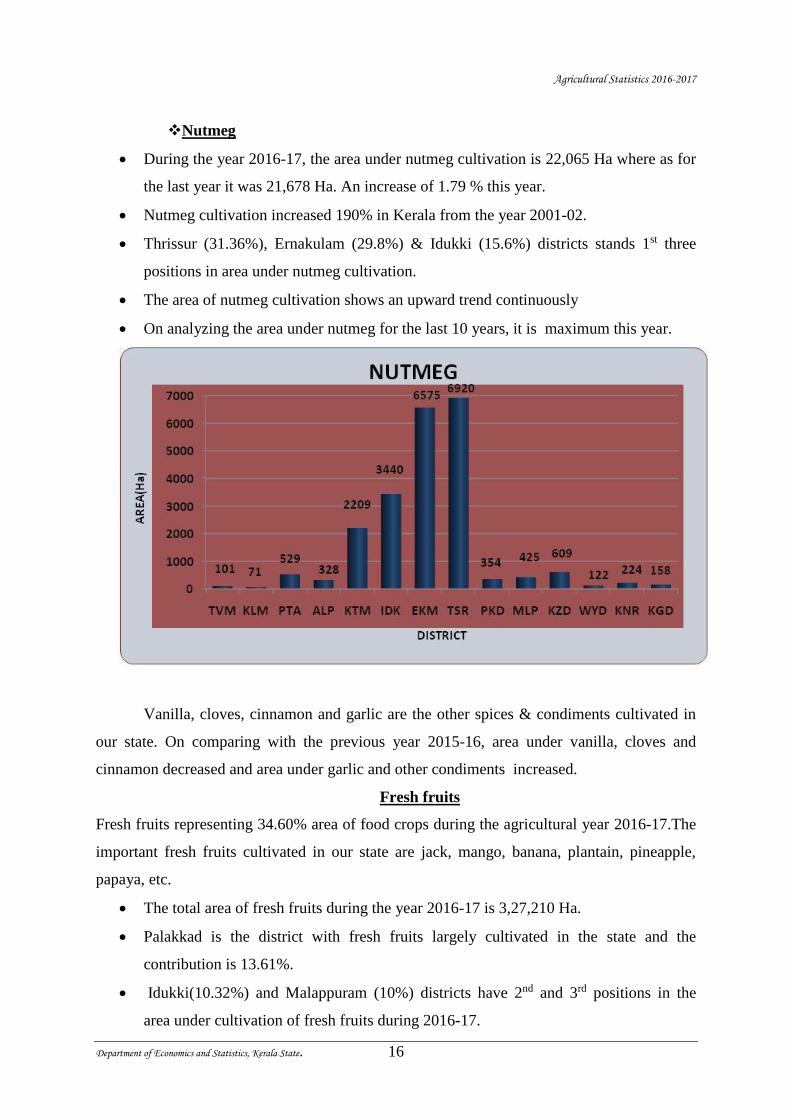
Nutmeg
During the year 2016-17, the area under nutmeg cultivation is 22,065 Ha where as for
the last year it was 21,678 Ha. An increase of 1.79 % this year.
Nutmeg cultivation increased 190% in Kerala from the year 2001-02.
Thrissur (31.36%), Ernakulam (29.8%) & Idukki (15.6%) districts stands 1st three
positions in area under nutmeg cultivation.
The area of nutmeg cultivation shows an upward trend continuously
On analyzing the area under nutmeg for the last 10 years, it is maximum this year.
Vanilla, cloves, cinnamon and garlic are the other spices & condiments cultivated in
our state. On comparing with the previous year 2015-16, area under vanilla, cloves and
cinnamon decreased and area under garlic and other condiments increased.
Fresh fruits
Fresh fruits representing 34.60% area of food crops during the agricultural year 2016-17.The
important fresh fruits cultivated in our state are jack, mango, banana, plantain, pineapple,
papaya, etc.
The total area of fresh fruits during the year 2016-17 is 3,27,210 Ha.
Palakkad is the district with fresh fruits largely cultivated in the state and the
contribution is 13.61%.
Idukki(10.32%) and Malappuram (10%) districts have 2nd and 3rd positions in the
area under cultivation of fresh fruits during 2016-17.
Agricultural Statistics 2016-2017
Department of Economics and Statistics, Kerala State. 17
A brief analysis of fresh fruits is added below:
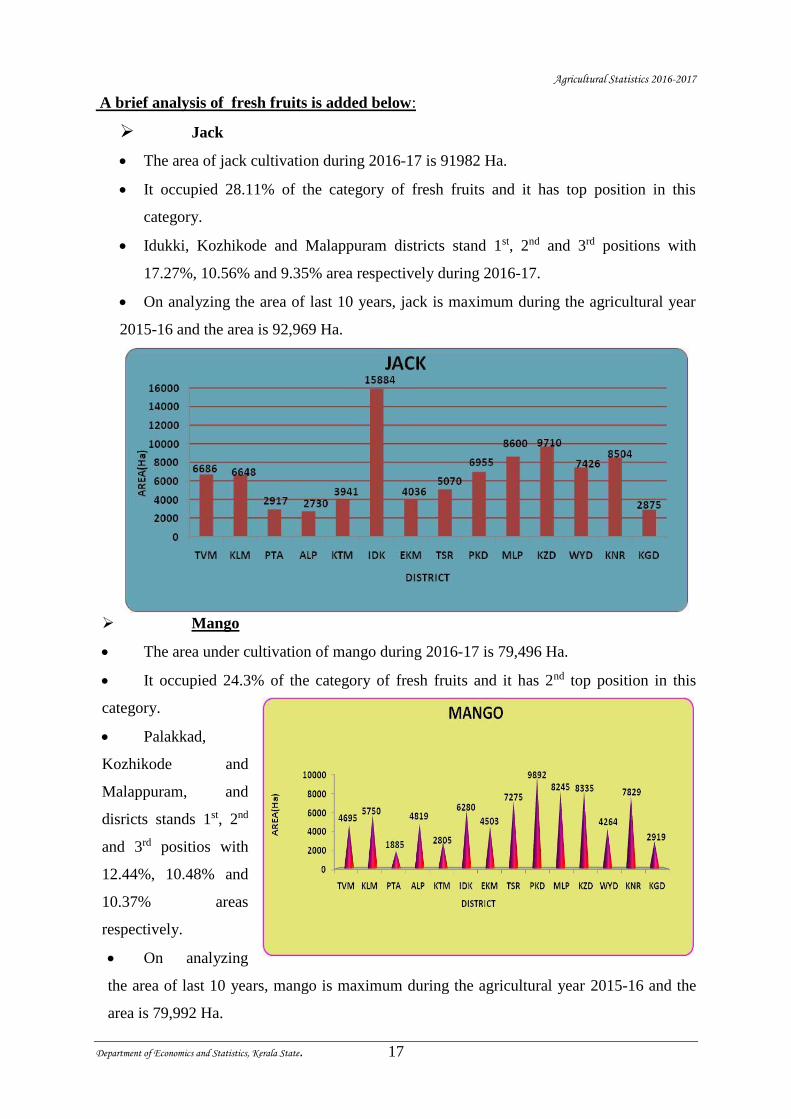
Jack
The area of jack cultivation during 2016-17 is 91982 Ha.
It occupied 28.11% of the category of fresh fruits and it has top position in this
category.
Idukki, Kozhikode and Malappuram districts stand 1st, 2nd and 3rd positions with
17.27%, 10.56% and 9.35% area respectively during 2016-17.
On analyzing the area of last 10 years, jack is maximum during the agricultural year
2015-16 and the area is 92,969 Ha.
Mango
The area under cultivation of mango during 2016-17 is 79,496 Ha.
It occupied 24.3% of the category of fresh fruits and it has 2nd top position in this
category.
Palakkad,
Kozhikode and
Malappuram, and
disricts stands 1st, 2nd
and 3rd positios with
12.44%, 10.48% and
10.37% areas
respectively.
On analyzing
the area of last 10 years, mango is maximum during the agricultural year 2015-16 and the
area is 79,992 Ha.
Agricultural Statistics 2016-2017
Department of Economics and Statistics, Kerala State. 18
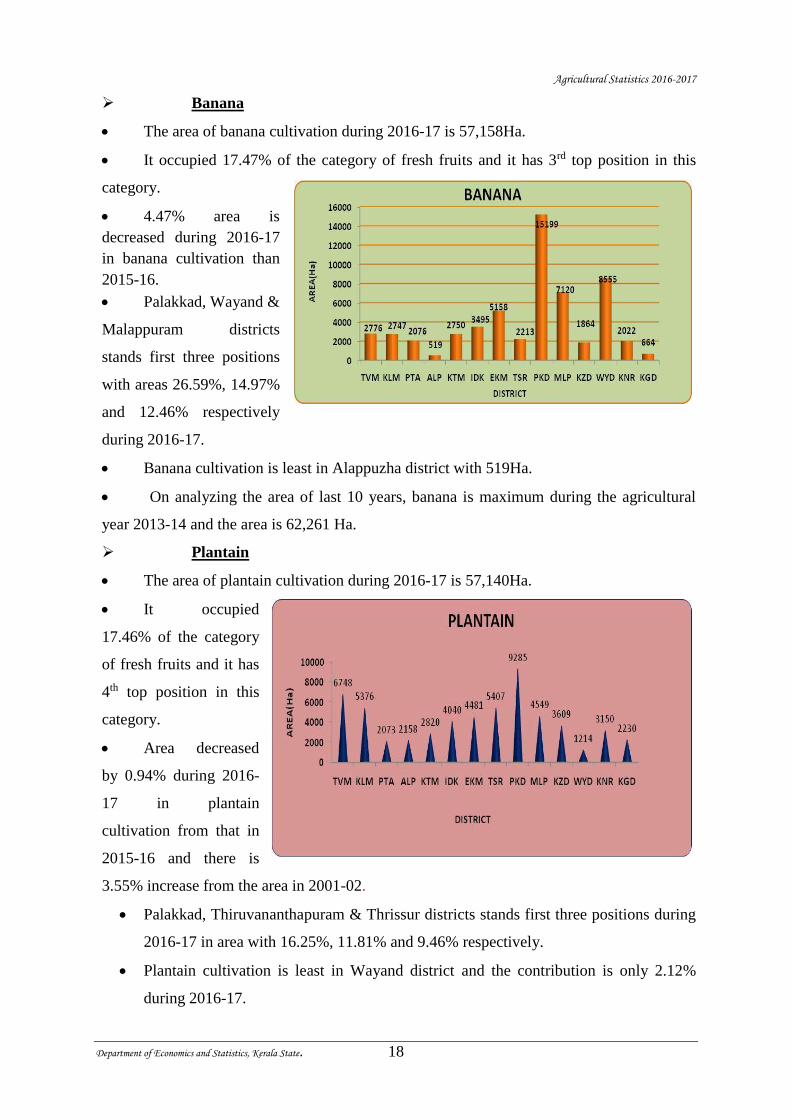
Banana
The area of banana cultivation during 2016-17 is 57,158Ha.
It occupied 17.47% of the category of fresh fruits and it has 3rd top position in this
category.
4.47% area is
decreased during 2016-17
in banana cultivation than
2015-16.
Palakkad, Wayand &
Malappuram districts
stands first three positions
with areas 26.59%, 14.97%
and 12.46% respectively
during 2016-17.
Banana cultivation is least in Alappuzha district with 519Ha.
On analyzing the area of last 10 years, banana is maximum during the agricultural
year 2013-14 and the area is 62,261 Ha.
Plantain
The area of plantain cultivation during 2016-17 is 57,140Ha.
It occupied
17.46% of the category
of fresh fruits and it has
4th top position in this
category.
Area decreased
by 0.94% during 2016-
17 in plantain
cultivation from that in
2015-16 and there is
3.55% increase from the area in 2001-02.
Palakkad, Thiruvananthapuram & Thrissur districts stands first three positions during
2016-17 in area with 16.25%, 11.81% and 9.46% respectively.
Plantain cultivation is least in Wayand district and the contribution is only 2.12%
during 2016-17.
Agricultural Statistics 2016-2017
Department of Economics and Statistics, Kerala State. 19
On analyzing the area of last 10 years, plantain is maximum during the agriculture
year 2015-16 and the area is 57683 Ha.
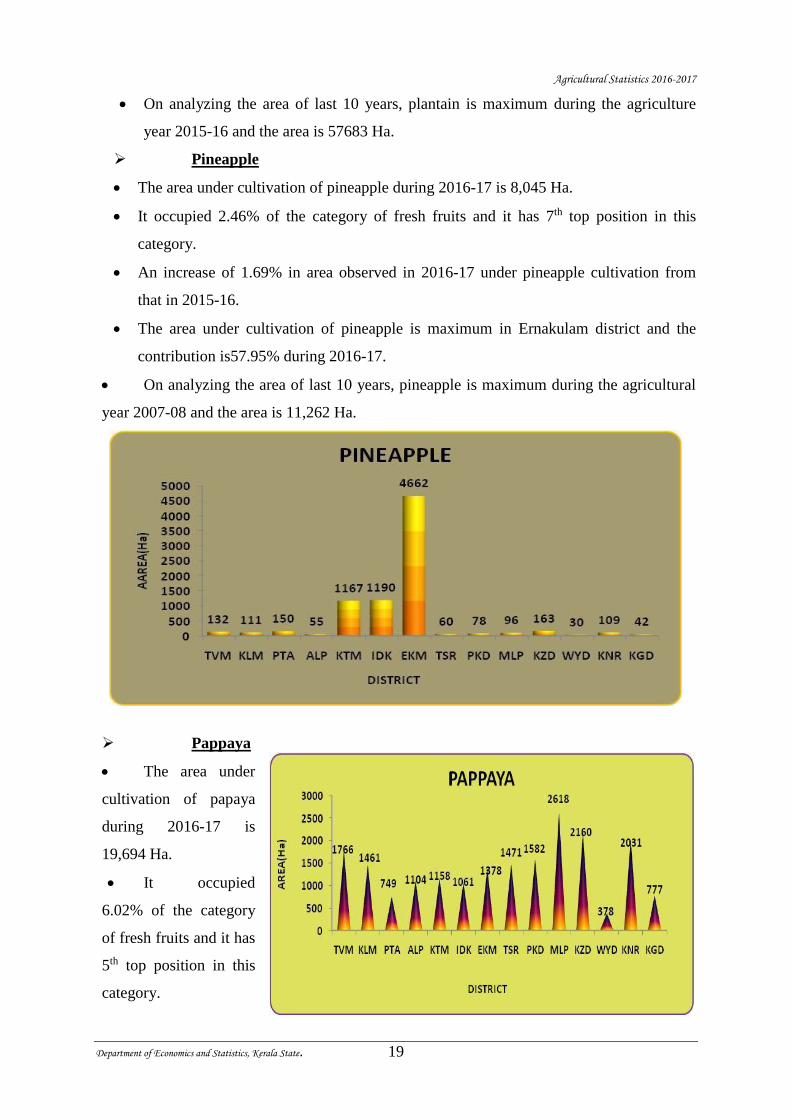
Pineapple
The area under cultivation of pineapple during 2016-17 is 8,045 Ha.
It occupied 2.46% of the category of fresh fruits and it has 7th top position in this
category.
An increase of 1.69% in area observed in 2016-17 under pineapple cultivation from
that in 2015-16.
The area under cultivation of pineapple is maximum in Ernakulam district and the
contribution is57.95% during 2016-17.
On analyzing the area of last 10 years, pineapple is maximum during the agricultural
year 2007-08 and the area is 11,262 Ha.
Pappaya
The area under
cultivation of papaya
during 2016-17 is
19,694 Ha.
It occupied
6.02% of the category
of fresh fruits and it has
5th top position in this
category.
Agricultural Statistics 2016-2017
Department of Economics and Statistics, Kerala State. 20
The cultivation of pappaya increased in the year 2016-17 by 3.24 % from 2015-16
and the same is increased by 22.96% from the year 2001-02.
On analyzing the area of last 10 years, papaya cultivation is maximum during the
agricultural year 2016-17 and the area is 19,694 Ha.
Other fresh fruits
Rambuttan, mangostin, etc are included in other fresh fruits and the area of other fresh
fruits during 2016-17 is 12,105 Ha.
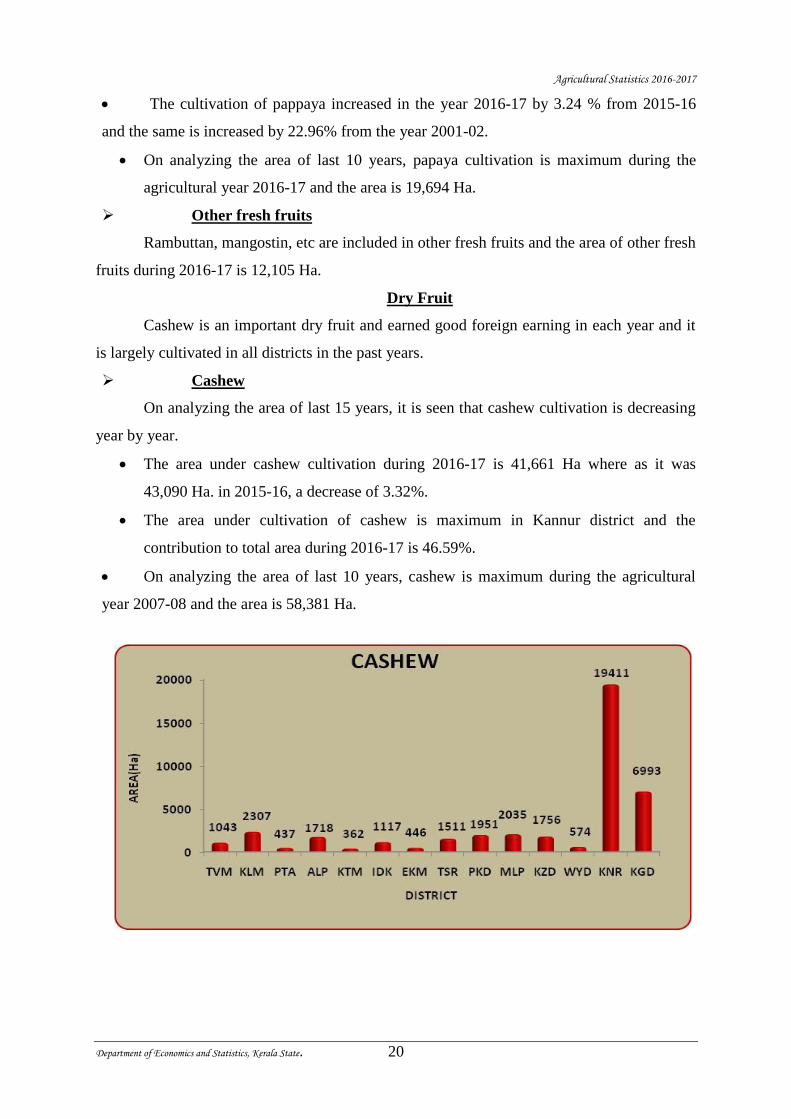
Dry Fruit
Cashew is an important dry fruit and earned good foreign earning in each year and it
is largely cultivated in all districts in the past years.
Cashew
On analyzing the area of last 15 years, it is seen that cashew cultivation is decreasing
year by year.
The area under cashew cultivation during 2016-17 is 41,661 Ha where as it was
43,090 Ha. in 2015-16, a decrease of 3.32%.
The area under cultivation of cashew is maximum in Kannur district and the
contribution to total area during 2016-17 is 46.59%.
On analyzing the area of last 10 years, cashew is maximum during the agricultural
year 2007-08 and the area is 58,381 Ha.
Agricultural Statistics 2016-2017
Department of Economics and Statistics, Kerala State. 21
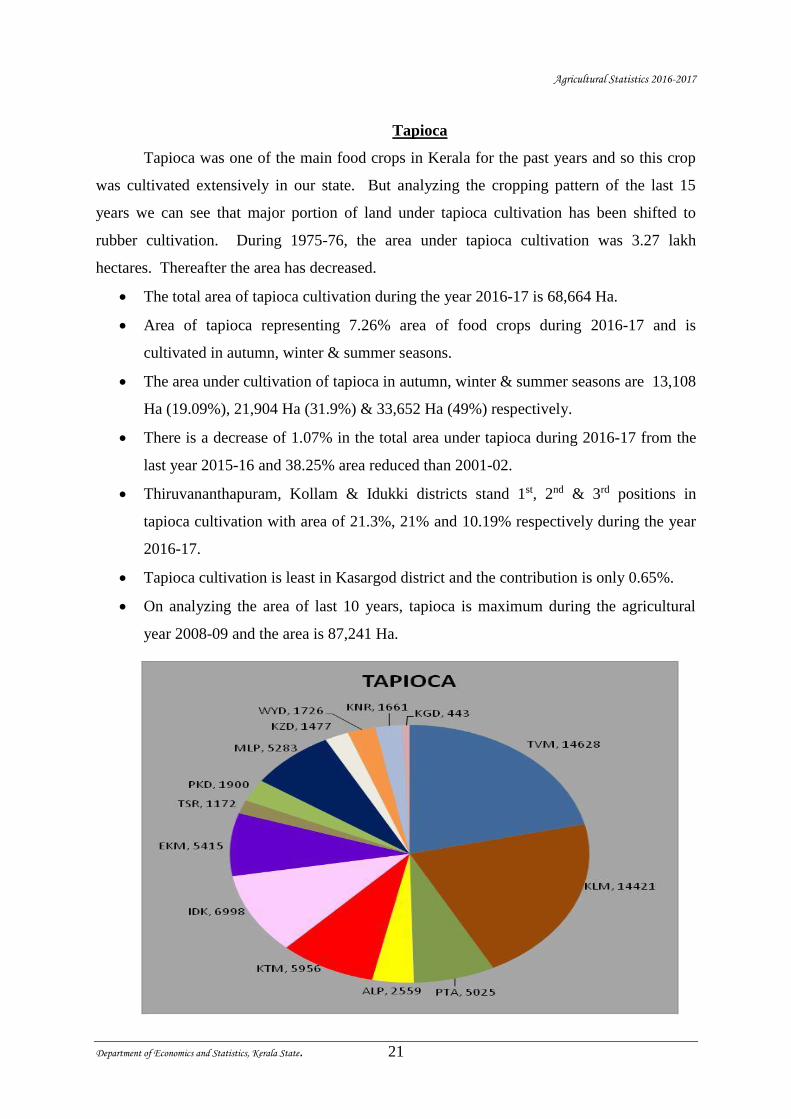
Tapioca
Tapioca was one of the main food crops in Kerala for the past years and so this crop
was cultivated extensively in our state. But analyzing the cropping pattern of the last 15
years we can see that major portion of land under tapioca cultivation has been shifted to
rubber cultivation. During 1975-76, the area under tapioca cultivation was 3.27 lakh
hectares. Thereafter the area has decreased.
The total area of tapioca cultivation during the year 2016-17 is 68,664 Ha.
Area of tapioca representing 7.26% area of food crops during 2016-17 and is
cultivated in autumn, winter & summer seasons.
The area under cultivation of tapioca in autumn, winter & summer seasons are 13,108
Ha (19.09%), 21,904 Ha (31.9%) & 33,652 Ha (49%) respectively.
There is a decrease of 1.07% in the total area under tapioca during 2016-17 from the
last year 2015-16 and 38.25% area reduced than 2001-02.
Thiruvananthapuram, Kollam & Idukki districts stand 1st, 2nd & 3rd positions in
tapioca cultivation with area of 21.3%, 21% and 10.19% respectively during the year
2016-17.
Tapioca cultivation is least in Kasargod district and the contribution is only 0.65%.
On analyzing the area of last 10 years, tapioca is maximum during the agricultural
year 2008-09 and the area is 87,241 Ha.
Agricultural Statistics 2016-2017
Department of Economics and Statistics, Kerala State. 22
Tubers
Tubers representing 1.95% area of food crops during the year 2016-17.
Elephant foot yam, colocasia, yam, sweet potato, etc include the category of tubers.
The total area of tubers during 2016-17 is 18,462 Ha, where as it was 19,392 Ha
during the last year 2015-16.
Major cultivation of tubers is in Kollam district and the contribution to total area of
tubers is 16.94% during 2016-17.
Pathanamthitta (15.25%) and Palakkad (11.21%) districts are 2nd & 3rd positions
under the cultivation of tubers in the state during 2016-17.
Colocasia has 1st position in area under the cultivation of tubers and the percentage of
colocasia to the total area of tubers is 41.66%.
Colocasia
Area during 2016-17 is 7,691 Ha in which Kollam district stands 1st position with an
area of 1,420 Ha (18.46%). Total area decreased by 4.87% with respect to the year 2015-16.
Elephant foot yam
Area during 2016-17 is 6,814 Ha and Pattanamthitta district stands 1st position with an
area of 1,120 Ha (16.44%). Total area decreased by 4.61% from the year 2015-16.
Yam
Area during 2016-17 is 1,595 Ha which is 1.36% less than the previous year. Kollam
district stands 1st position with an area of 481 Ha (30.16%).
Sweet Potato
Area during 2016-17 is 220 Ha and Malappuram district stands 1st with an area of
61Ha (27.73%). There is a decrease of 21.15% in the cultivation of sweet potato this year
from 2015-16.
Koorka
Area during 2016-17 is 1,317 Ha which is 3.73% less than the previous year
cultivation and Palakkad district stands 1st with an area of 966 Ha (73.35%).
Nanakizhangu
Area during 2016-17 is 239 Ha where as in 2015-16 it was 251 Ha.Pathanamthitta
district stands 1st with 66 Ha area (27.62%).
Agricultural Statistics 2016-2017
Department of Economics and Statistics, Kerala State. 23
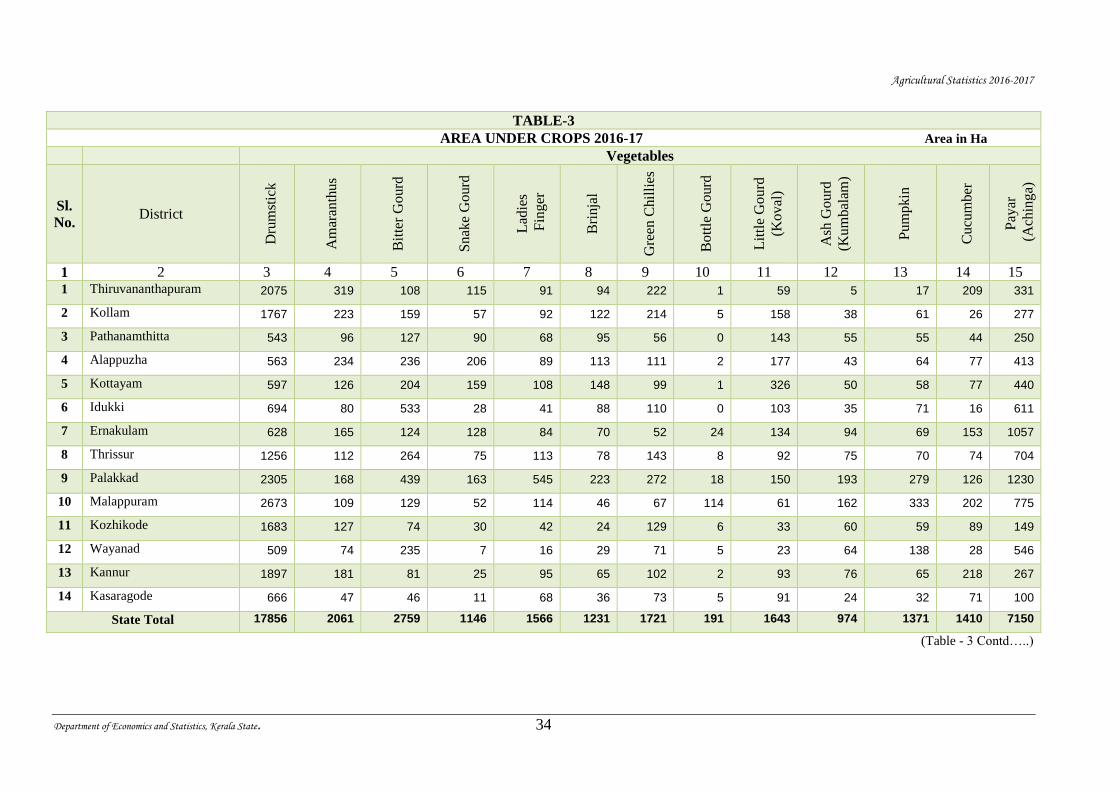
Vegetables
Drumstick, amaranthus, bitter gourd, snake gourd, ladies finger, brinjal, green chillies,
bottle gourd, little gourd (koval), ash gourd, pumpkin, cucumber, payar. are the important
vegetables cultivated in our state.
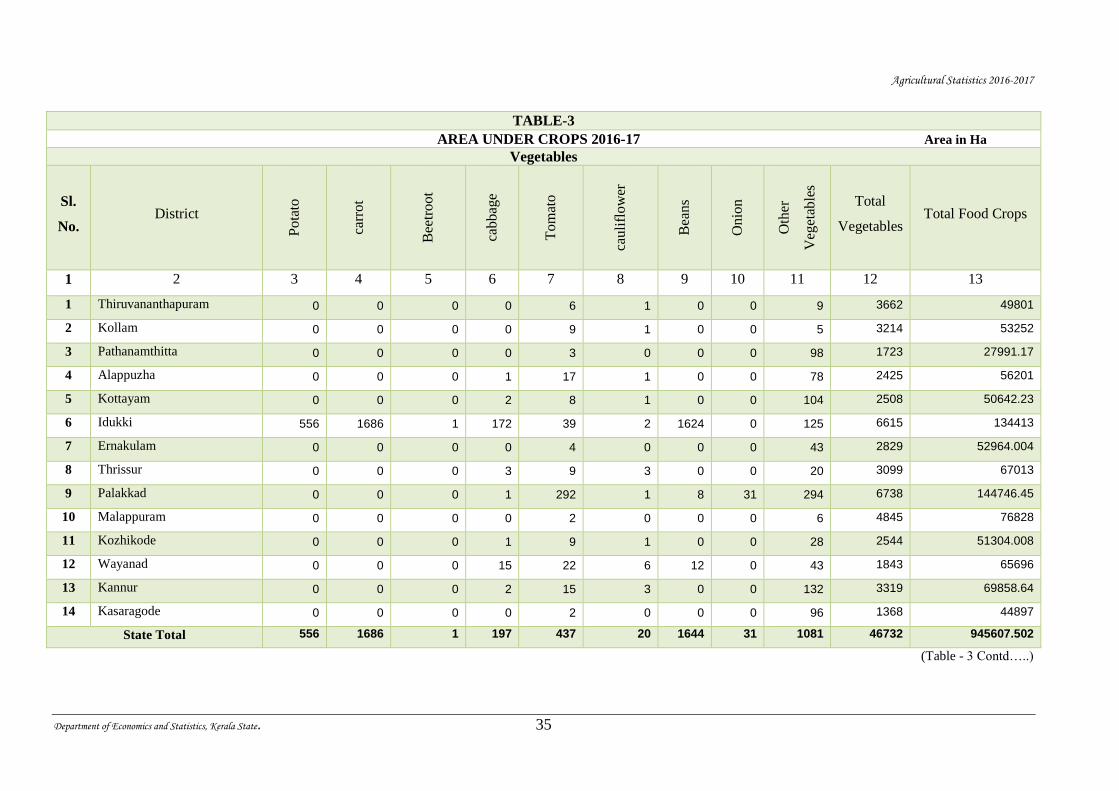
The total area under the cultivation of vegetables during 2016-17 is 46,732 Ha.
It represents 4.94% area of total food crops.
Total area under vegetables has an increase of 0.02% in the year 2016-17 than the
previous year 2015-16.
Palakkad (14.42%), Idukki (14.16%) and Malappuram (10.37%) districts have 1st, 2nd
and 3rd positions in area under the cultivation of vegetables during 2016-17.
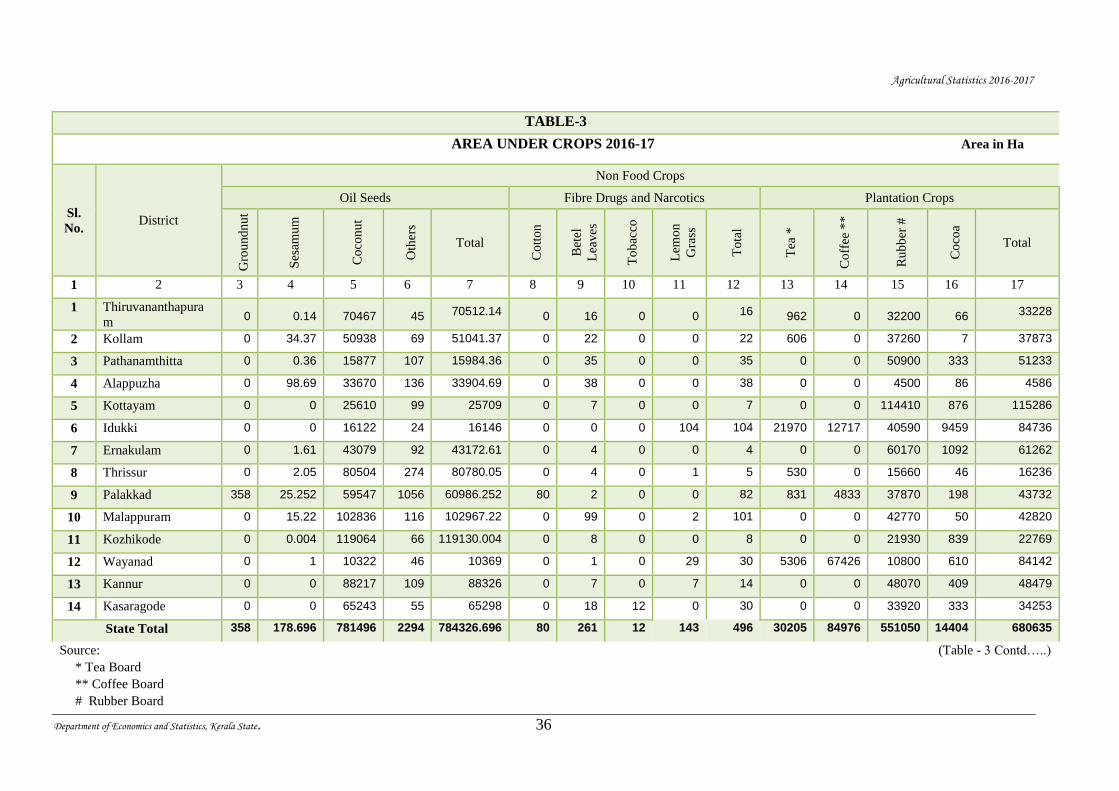
Oil Seeds
The important oil seeds being cultivated in our state are coconut, groundnut,
sesamum, etc. Coconut represents 99.64% of the category of oil seeds. The total area under
the cultivation of oil seeds during the agricultural year 2016-17 is 7,84,326.696 Ha. On
comparing with 2015-16, a decrease of 0.92% can be seen in this category during the year
2016-17.
A brief analysis of important oil seeds is given below.
Coconut
Considering the area under cultivation of crops, coconut occupied the 1st place among
them. Area under coconut cultivation was 6.93 lakhs Ha during 1975-76 and 7.2 lakh
hectares during 1985-86. The area under coconut cultivation was reached maximum during
2000-01 i.e., 9,25,783 Ha. Thereafter, a decreasing tendency is seen in the area under the
cultivation of coconut in Kerala.
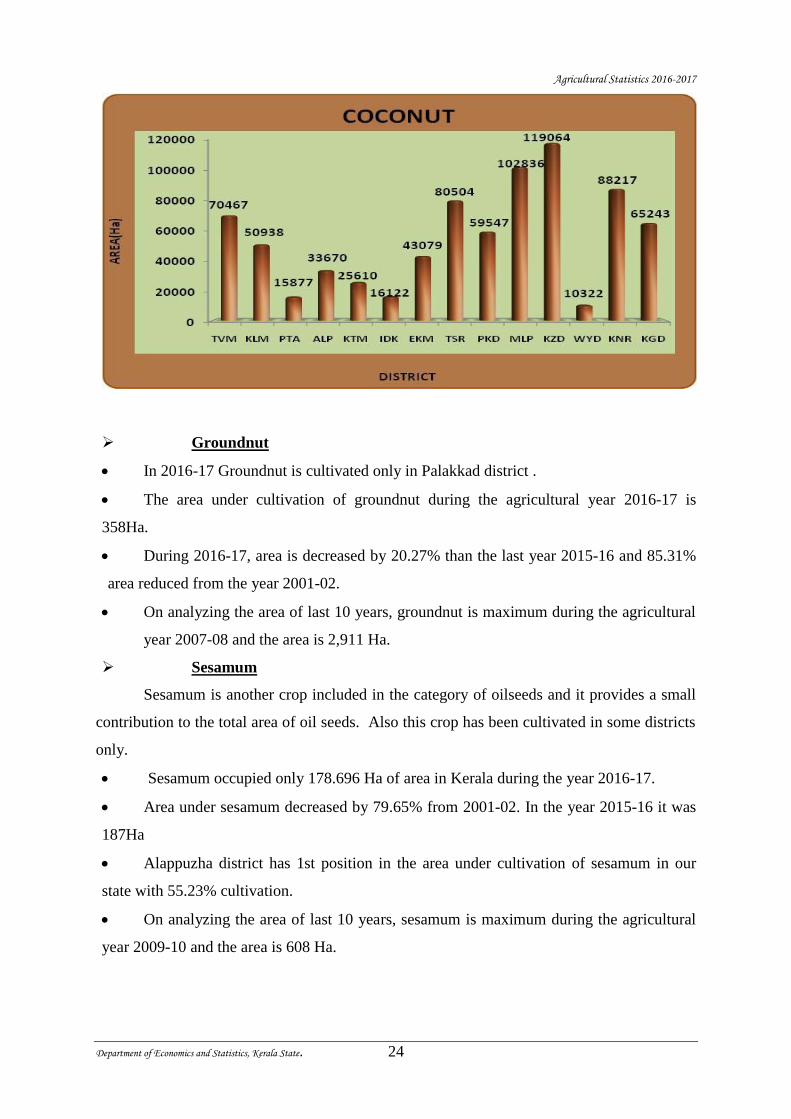
The area of coconut cultivation during 2016-17 is 7,81,496Ha.
During 2016-17, coconut cultivation decreased by 1.1% from the previous year 2015-
16 and 13.72% area decreased from 2001-02.
Kozhikode district stands 1st in the cultivation of coconut with an area of 1,19,064 Ha
and it represents 15.24% of the total area.
Malappuram and Kannur districts stand at 2nd and 3rd positions with areas 13.16% and
11.29% respectively.
On analyzing the area of last 10 years, coconut is maximum during the agricultural
year 2011-12 and the area is 8,20,867 Ha.
Agricultural Statistics 2016-2017
Department of Economics and Statistics, Kerala State. 24
Groundnut
In 2016-17 Groundnut is cultivated only in Palakkad district .
The area under cultivation of groundnut during the agricultural year 2016-17 is
358Ha.
During 2016-17, area is decreased by 20.27% than the last year 2015-16 and 85.31%
area reduced from the year 2001-02.
On analyzing the area of last 10 years, groundnut is maximum during the agricultural
year 2007-08 and the area is 2,911 Ha.
Sesamum
Sesamum is another crop included in the category of oilseeds and it provides a small
contribution to the total area of oil seeds. Also this crop has been cultivated in some districts
only.
Sesamum occupied only 178.696 Ha of area in Kerala during the year 2016-17.
Area under sesamum decreased by 79.65% from 2001-02. In the year 2015-16 it was
187Ha
Alappuzha district has 1st position in the area under cultivation of sesamum in our
state with 55.23% cultivation.
On analyzing the area of last 10 years, sesamum is maximum during the agricultural
year 2009-10 and the area is 608 Ha.
Agricultural Statistics 2016-2017
Department of Economics and Statistics, Kerala State. 25
Fibre, Drugs and Narcotics
Crops like Cotton, betel leaves, tobacco and lemon grass are included in this category.
The total area under the category of fibre, drugs & narcotics during 2016-17 is 496 Ha, where
as it was 580 Ha during the last year 2015-16. Betel Leaves has 1st position in area (52.62%)
under the cultivation of this category during 2016-17 followed by lemon grass (28.83%)
Cotton
Area during 2016-17 is 80 Ha and is cultivated only in Palakkad district. Cotton
cultivation has been decreasing year by year. This year it is reduced by 26.61% from the
previous year 2015-16. During 2001-02, there was 3760 Ha of cotton cultivation in Kerala.
Betel leaves
Area during 2016-17 is 261 Ha and Malappuram stands 1st with 37.93% area. The
area under betel leaves decreased by 21.62% this year from the previous year 2015-16.
Lemon grass
Area during 2016-17 is 143 Ha and Idukki stands 1st with 72.73% area. Area of
lemon grass increased by 10.85% from the previous year 2015-16.
Tobacco
. During 2016-17 there is 12 Ha of Tobacco cultivated in Kerala and that is in
Kasargod district. As compared to 2015-16 ,in 2016-17 there is a slight increase in the area of
Tobaco. There was an area of 9 Ha in 2015-16.
Plantation Crops
The important plantation crops cultivated in the state are tea, coffee, rubber and
cocoa.
The total area of plantation crops during 2016-17 is 6,80,635 Ha, where as it was
6,79,956 Ha during the last year 2015-16.There is an increase of 0.1% in the area of
plantation crops in 2016-17 from 2015-16
Major cultivation of plantation crops is in Kottayam district and the representation to
total area of plantation crops is 16.94%.
Rubber has 1st position in area under the cultivation of plantation crops and the
representation is 80.96%.
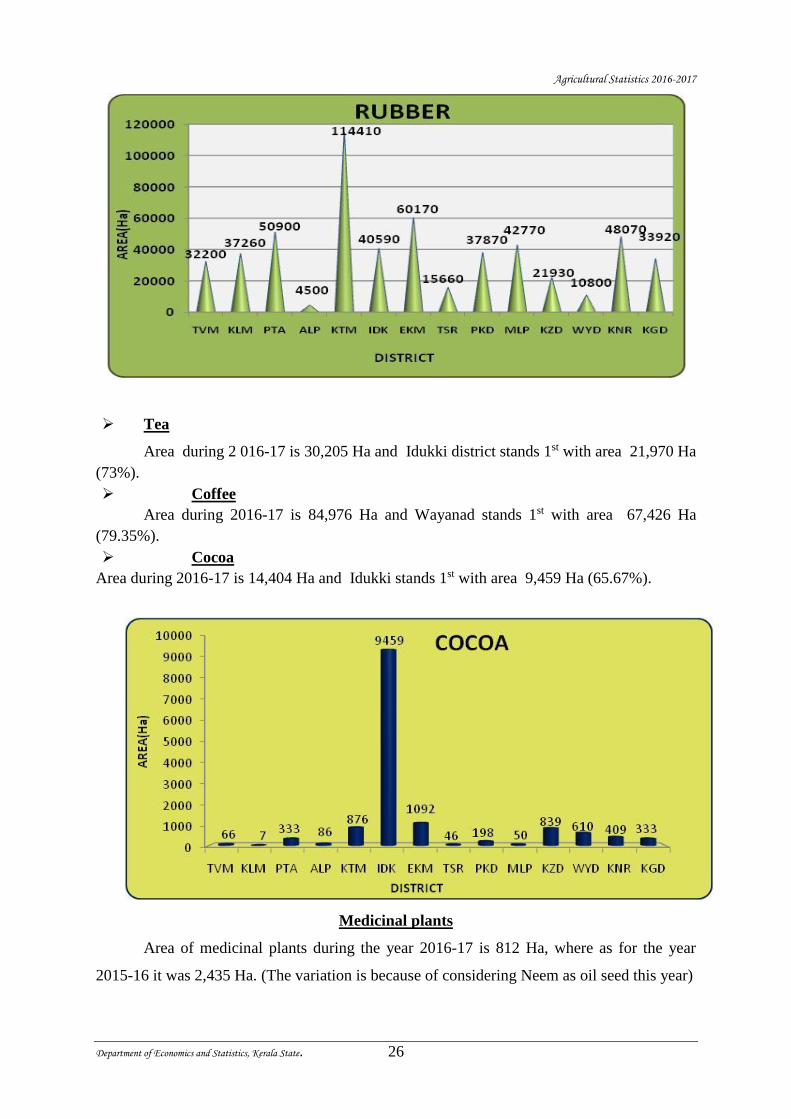
Rubber
Area during 2016-17 is 5,51,050 Ha and Kottayam stands 1st with 20.76% area.
Ernakulam (10.92%) and Pathanamthitta (9.24%) districts stand 2nd and 3rd positions
in area under the cultivation of rubber during 2016-17.
Agricultural Statistics 2016-2017
Department of Economics and Statistics, Kerala State. 26
Tea
Area during 2 016-17 is 30,205 Ha and Idukki district stands 1st with area 21,970 Ha
(73%).
Coffee
Area during 2016-17 is 84,976 Ha and Wayanad stands 1st with area 67,426 Ha
(79.35%).
Cocoa
Area during 2016-17 is 14,404 Ha and Idukki stands 1st with area 9,459 Ha (65.67%).
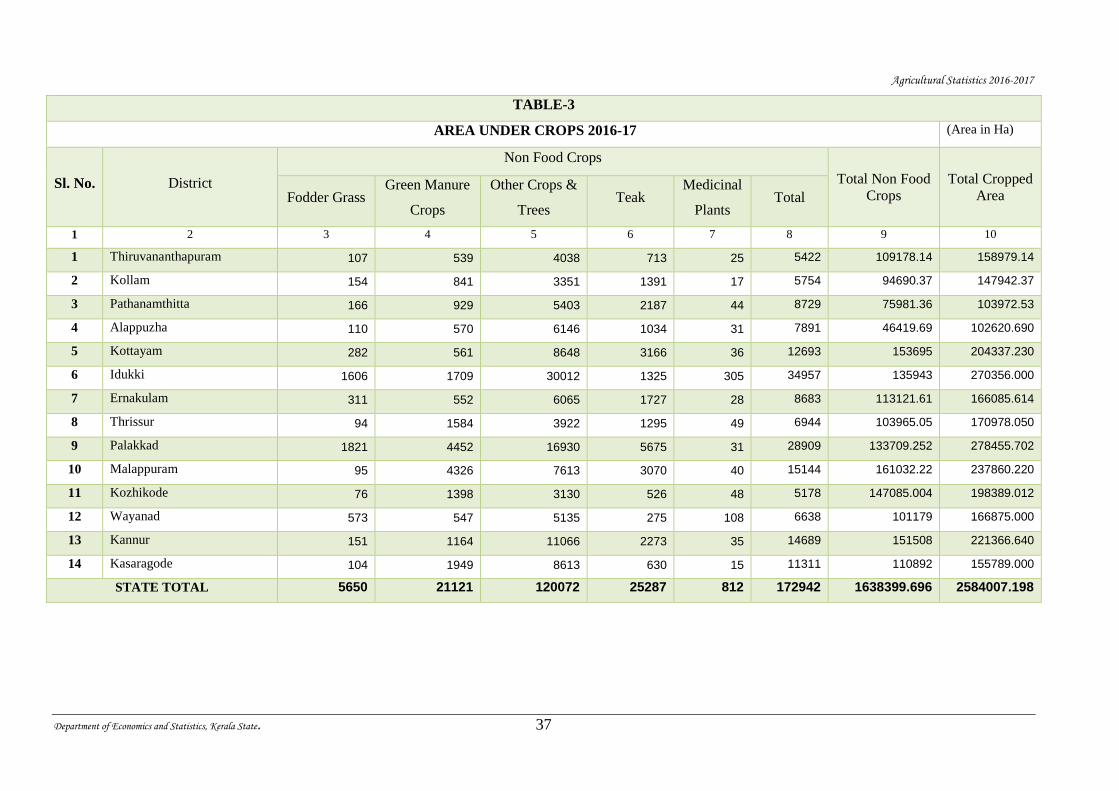
Medicinal plants
Area of medicinal plants during the year 2016-17 is 812 Ha, where as for the year
2015-16 it was 2,435 Ha. (The variation is because of considering Neem as oil seed this year)
Agricultural Statistics 2016-2017
Department of Economics and Statistics, Kerala State. 27
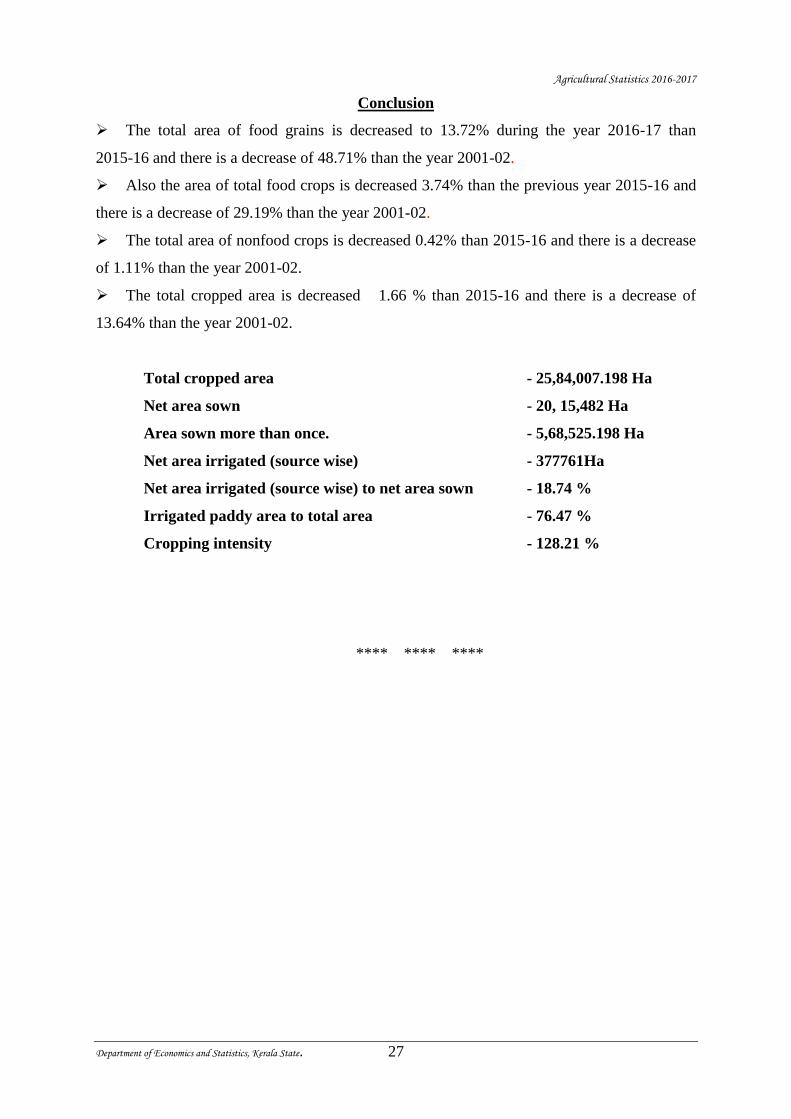
Conclusion
The total area of food grains is decreased to 13.72% during the year 2016-17 than
2015-16 and there is a decrease of 48.71% than the year 2001-02.
Also the area of total food crops is decreased 3.74% than the previous year 2015-16 and
there is a decrease of 29.19% than the year 2001-02.
The total area of nonfood crops is decreased 0.42% than 2015-16 and there is a decrease
of 1.11% than the year 2001-02.
The total cropped area is decreased 1.66 % than 2015-16 and there is a decrease of
13.64% than the year 2001-02.
Total cropped area - 25,84,007.198 Ha
Net area sown - 20, 15,482 Ha
Area sown more than once. - 5,68,525.198 Ha
Net area irrigated (source wise) - 377761Ha
Net area irrigated (source wise) to net area sown - 18.74 %
Irrigated paddy area to total area - 76.47 %
Cropping intensity - 128.21 %
**** **** ****
Agricultural Statistics 2016-2017
Department of Economics and Statistics, Kerala State. 28
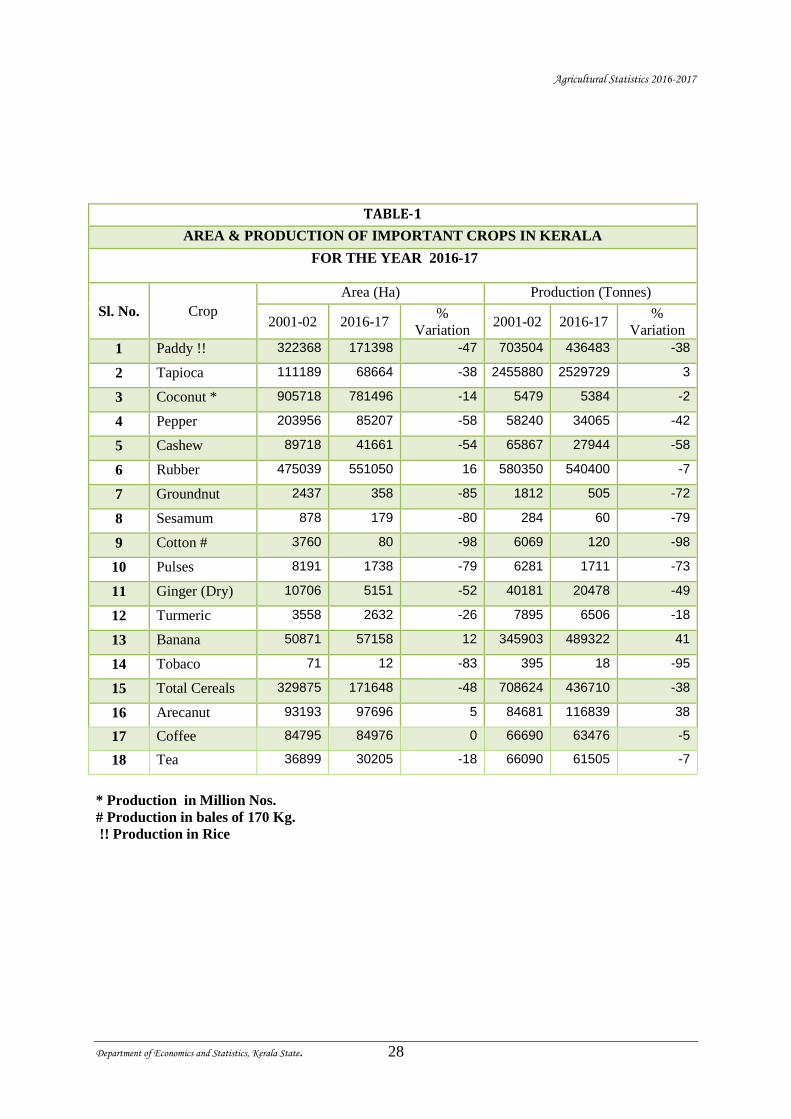
TABLE-1
AREA & PRODUCTION OF IMPORTANT CROPS IN KERALA
FOR THE YEAR 2016-17
Sl. No. Crop
Area (Ha) Production (Tonnes)
2001-02 2016-17 %
Variation 2001-02 2016-17
%
Variation
1 Paddy !! 322368 171398 -47 703504 436483 -38
2 Tapioca 111189 68664 -38 2455880 2529729 3
3 Coconut * 905718 781496 -14 5479 5384 -2
4 Pepper 203956 85207 -58 58240 34065 -42
5 Cashew 89718 41661 -54 65867 27944 -58
6 Rubber 475039 551050 16 580350 540400 -7
7 Groundnut 2437 358 -85 1812 505 -72
8 Sesamum 878 179 -80 284 60 -79
9 Cotton # 3760 80 -98 6069 120 -98
10 Pulses 8191 1738 -79 6281 1711 -73
11 Ginger (Dry) 10706 5151 -52 40181 20478 -49
12 Turmeric 3558 2632 -26 7895 6506 -18
13 Banana 50871 57158 12 345903 489322 41
14 Tobaco 71 12 -83 395 18 -95
15 Total Cereals 329875 171648 -48 708624 436710 -38
16 Arecanut 93193 97696 5 84681 116839 38
17 Coffee 84795 84976 0 66690 63476 -5
18 Tea 36899 30205 -18 66090 61505 -7
* Production in Million Nos.
# Production in bales of 170 Kg.
!! Production in Rice
Agricultural Statistics 2016-2017
Department of Economics and Statistics, Kerala State. 29
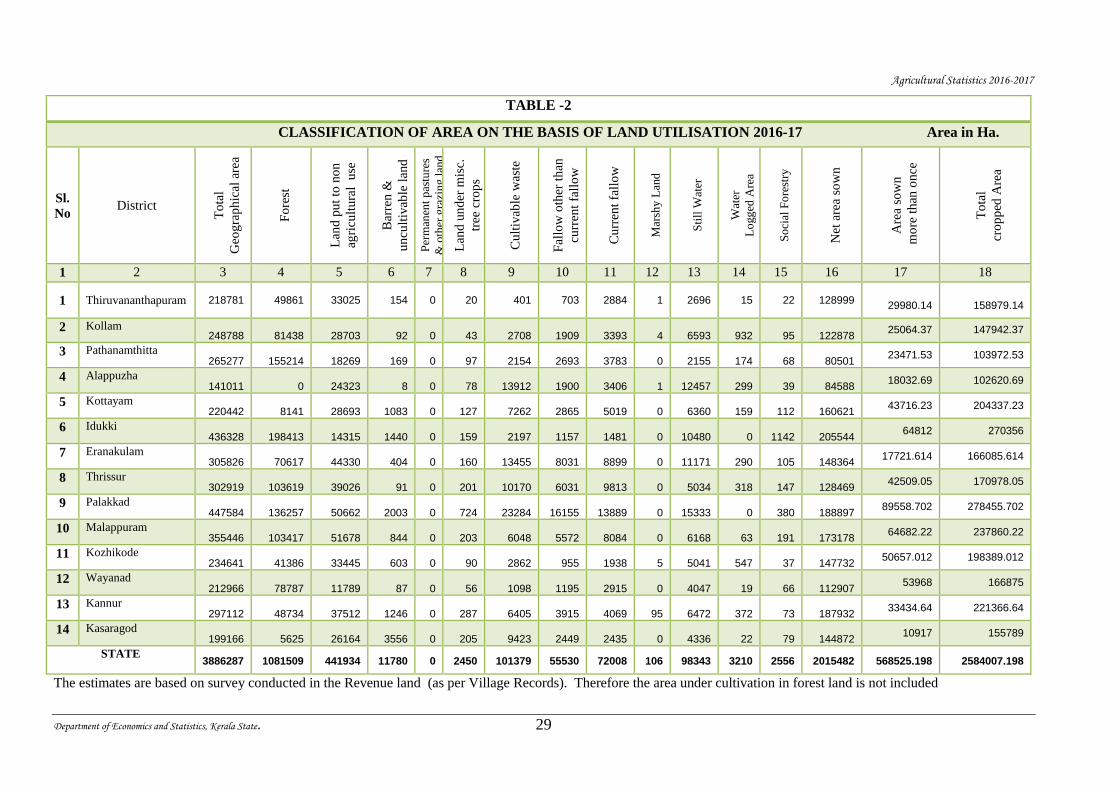
TABLE -2
CLASSIFICATION OF AREA ON THE BASIS OF LAND UTILISATION 2016-17 Area in Ha.
Sl.
No District
To
tal
Geo
gra
ph
ical
are
a
Fo
rest
Lan
d p
ut
to n
on
agri
cult
ura
l u
se
Bar
ren
&
un
cult
ivab
le l
and
Per
man
ent
pas
ture
s
& o
ther
gra
zin
g l
and
Lan
d u
nd
er m
isc.
tree
cro
ps
Cu
ltiv
able
was
te
Fal
low
oth
er t
han
curr
ent
fall
ow
Cu
rren
t fa
llo
w
Mar
shy
Lan
d
Sti
ll W
ater
Wat
er
Lo
gg
ed A
rea
So
cial
Fo
rest
ry
Net
are
a so
wn
Are
a so
wn
mo
re t
han
on
ce
To
tal
cro
pp
ed A
rea
1 2 3 4 5 6 7 8 9 10 11 12 13 14 15 16 17 18
1 Thiruvananthapuram 218781 49861 33025 154 0 20 401 703 2884 1 2696 15 22 128999 29980.14 158979.14
2 Kollam 248788 81438 28703 92 0 43 2708 1909 3393 4 6593 932 95 122878
25064.37 147942.37
3 Pathanamthitta 265277 155214 18269 169 0 97 2154 2693 3783 0 2155 174 68 80501
23471.53 103972.53
4 Alappuzha 141011 0 24323 8 0 78 13912 1900 3406 1 12457 299 39 84588
18032.69 102620.69
5 Kottayam 220442 8141 28693 1083 0 127 7262 2865 5019 0 6360 159 112 160621
43716.23 204337.23
6 Idukki 436328 198413 14315 1440 0 159 2197 1157 1481 0 10480 0 1142 205544
64812 270356
7 Eranakulam 305826 70617 44330 404 0 160 13455 8031 8899 0 11171 290 105 148364
17721.614 166085.614
8 Thrissur 302919 103619 39026 91 0 201 10170 6031 9813 0 5034 318 147 128469
42509.05 170978.05
9 Palakkad 447584 136257 50662 2003 0 724 23284 16155 13889 0 15333 0 380 188897
89558.702 278455.702
10 Malappuram 355446 103417 51678 844 0 203 6048 5572 8084 0 6168 63 191 173178
64682.22 237860.22
11 Kozhikode 234641 41386 33445 603 0 90 2862 955 1938 5 5041 547 37 147732
50657.012 198389.012
12 Wayanad 212966 78787 11789 87 0 56 1098 1195 2915 0 4047 19 66 112907
53968 166875
13 Kannur 297112 48734 37512 1246 0 287 6405 3915 4069 95 6472 372 73 187932
33434.64 221366.64
14 Kasaragod 199166 5625 26164 3556 0 205 9423 2449 2435 0 4336 22 79 144872
10917 155789
STATE 3886287 1081509 441934 11780 0 2450 101379 55530 72008 106 98343 3210 2556 2015482 568525.198 2584007.198
The estimates are based on survey conducted in the Revenue land (as per Village Records). Therefore the area under cultivation in forest land is not included
Agricultural Statistics 2016-2017
Department of Economics and Statistics, Kerala State. 30
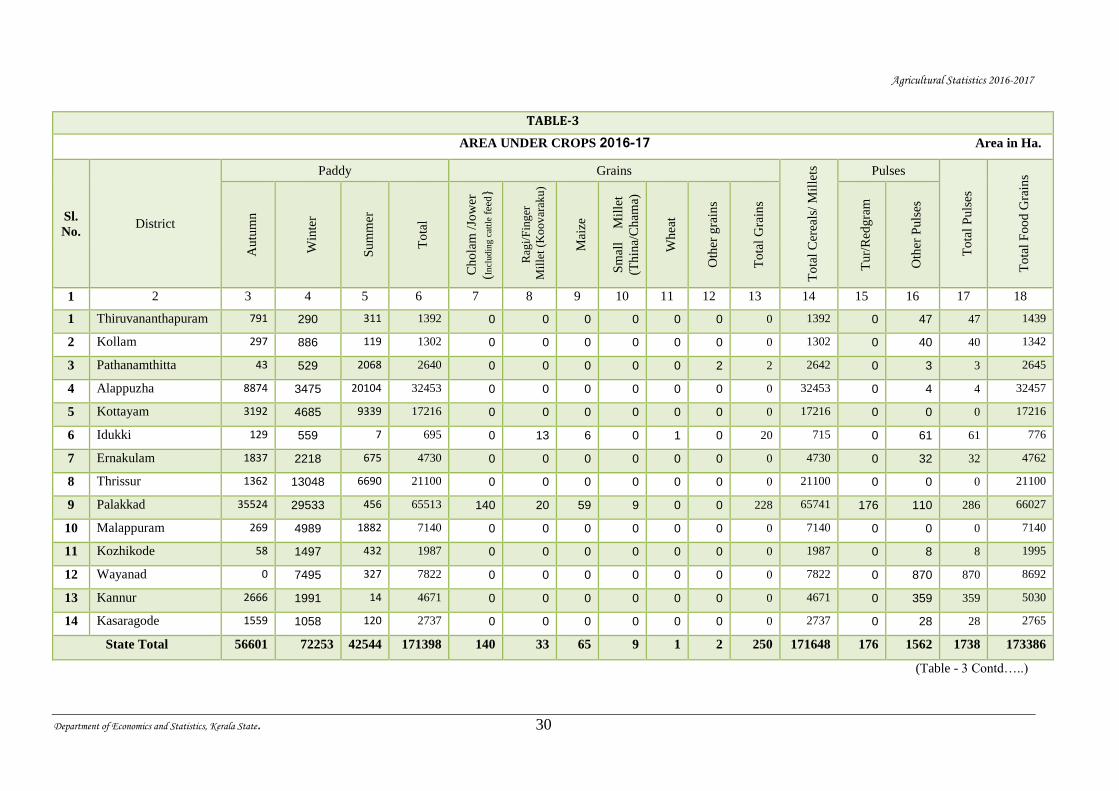
TABLE-3
AREA UNDER CROPS 2016-17 Area in Ha.
Sl.
No. District
Paddy Grains
To
tal
Cer
eals
/ M
ille
ts
Pulses
To
tal
Pu
lses
To
tal
Fo
od
Gra
ins
Au
tum
n
Win
ter
Su
mm
er
To
tal
Ch
ola
m /
Jow
er
(In
clu
din
g c
attl
e fe
ed}
Rag
i/F
ing
er
Mil
let
(Ko
ov
arak
u)
Mai
ze
Sm
all
Mil
let
(Th
ina/
Ch
ama)
Wh
eat
Oth
er g
rain
s
To
tal
Gra
ins
Tu
r/R
edg
ram
Oth
er P
uls
es
1 2 3 4 5 6 7 8 9 10 11 12 13 14 15 16 17 18
1 Thiruvananthapuram 791 290 311 1392 0 0 0 0 0 0 0 1392 0 47 47 1439
2 Kollam 297 886 119 1302 0 0 0 0 0 0 0 1302 0 40 40 1342
3 Pathanamthitta 43 529 2068 2640 0 0 0 0 0 2 2 2642 0 3 3 2645
4 Alappuzha 8874 3475 20104 32453 0 0 0 0 0 0 0 32453 0 4 4 32457
5 Kottayam 3192 4685 9339 17216 0 0 0 0 0 0 0 17216 0 0 0 17216
6 Idukki 129 559 7 695 0 13 6 0 1 0 20 715 0 61 61 776
7 Ernakulam 1837 2218 675 4730 0 0 0 0 0 0 0 4730 0 32 32 4762
8 Thrissur 1362 13048 6690 21100 0 0 0 0 0 0 0 21100 0 0 0 21100
9 Palakkad 35524 29533 456 65513 140 20 59 9 0 0 228 65741 176 110 286 66027
10 Malappuram 269 4989 1882 7140 0 0 0 0 0 0 0 7140 0 0 0 7140
11 Kozhikode 58 1497 432 1987 0 0 0 0 0 0 0 1987 0 8 8 1995
12 Wayanad 0 7495 327 7822 0 0 0 0 0 0 0 7822 0 870 870 8692
13 Kannur 2666 1991 14 4671 0 0 0 0 0 0 0 4671 0 359 359 5030
14 Kasaragode 1559 1058 120 2737 0 0 0 0 0 0 0 2737 0 28 28 2765
State Total 56601 72253 42544 171398 140 33 65 9 1 2 250 171648 176 1562 1738 173386
(Table - 3 Contd…..)
Agricultural Statistics 2016-2017
Department of Economics and Statistics, Kerala State. 31
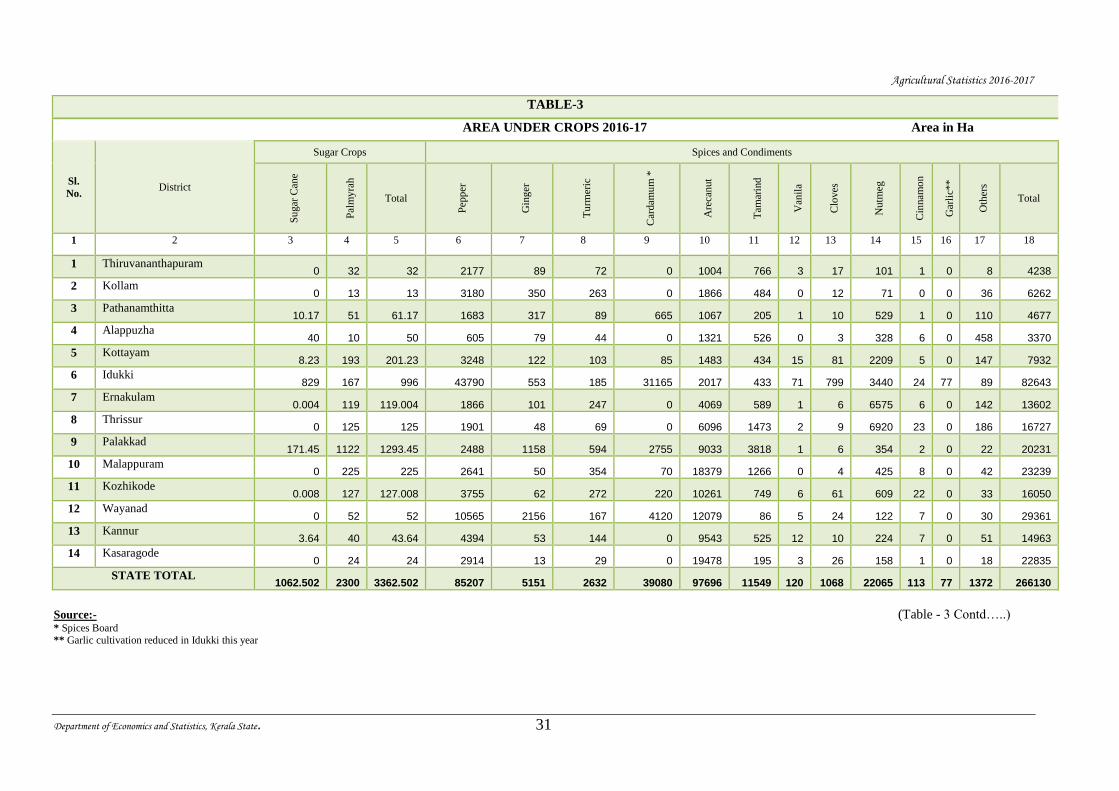
TABLE-3
AREA UNDER CROPS 2016-17 Area in Ha
Sl.
No. District
Sugar Crops Spices and Condiments
Su
gar
Can
e
Pal
my
rah
Total
Pep
per
Gin
ger
Tu
rmer
ic
Car
dam
um
*
Are
can
ut
Tam
arin
d
Van
ila
Clo
ves
Nu
tmeg
Cin
nam
on
Gar
lic*
*
Oth
ers
Total
1 2 3 4 5 6 7 8 9 10 11 12 13 14 15 16 17 18
1 Thiruvananthapuram 0 32 32 2177 89 72 0 1004 766 3 17 101 1 0 8 4238
2 Kollam 0 13 13 3180 350 263 0 1866 484 0 12 71 0 0 36 6262
3 Pathanamthitta 10.17 51 61.17 1683 317 89 665 1067 205 1 10 529 1 0 110 4677
4 Alappuzha 40 10 50 605 79 44 0 1321 526 0 3 328 6 0 458 3370
5 Kottayam 8.23 193 201.23 3248 122 103 85 1483 434 15 81 2209 5 0 147 7932
6 Idukki 829 167 996 43790 553 185 31165 2017 433 71 799 3440 24 77 89 82643
7 Ernakulam 0.004 119 119.004 1866 101 247 0 4069 589 1 6 6575 6 0 142 13602
8 Thrissur 0 125 125 1901 48 69 0 6096 1473 2 9 6920 23 0 186 16727
9 Palakkad 171.45 1122 1293.45 2488 1158 594 2755 9033 3818 1 6 354 2 0 22 20231
10 Malappuram 0 225 225 2641 50 354 70 18379 1266 0 4 425 8 0 42 23239
11 Kozhikode 0.008 127 127.008 3755 62 272 220 10261 749 6 61 609 22 0 33 16050
12 Wayanad 0 52 52 10565 2156 167 4120 12079 86 5 24 122 7 0 30 29361
13 Kannur 3.64 40 43.64 4394 53 144 0 9543 525 12 10 224 7 0 51 14963
14 Kasaragode 0 24 24 2914 13 29 0 19478 195 3 26 158 1 0 18 22835
STATE TOTAL 1062.502 2300 3362.502 85207 5151 2632 39080 97696 11549 120 1068 22065 113 77 1372 266130
Source:- (Table - 3 Contd…..)
* Spices Board ** Garlic cultivation reduced in Idukki this year
Agricultural Statistics 2016-2017
Department of Economics and Statistics, Kerala State. 32
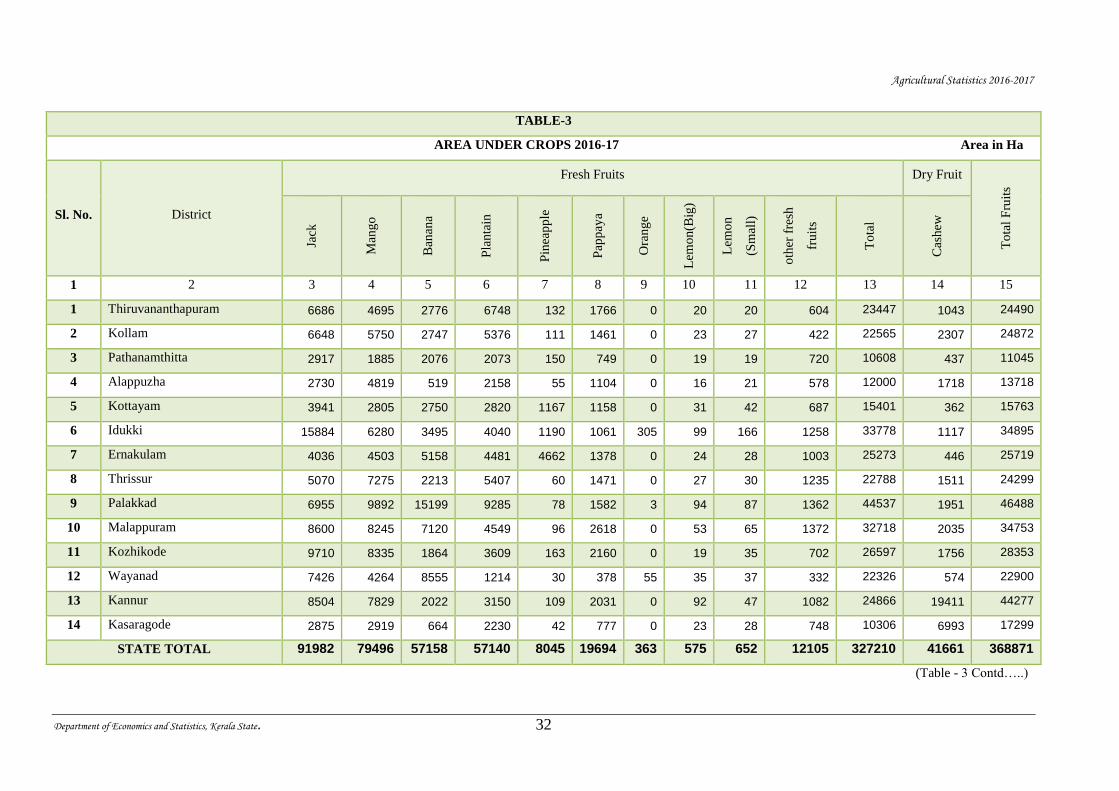
TABLE-3
AREA UNDER CROPS 2016-17 Area in Ha
Sl. No. District
Fresh Fruits Dry Fruit
To
tal
Fru
its
Jack
Man
go
Ban
ana
Pla
nta
in
Pin
eap
ple
Pap
pay
a
Ora
ng
e
Lem
on
(Big
)
Lem
on
(Sm
all)
oth
er f
resh
fru
its
To
tal
Cas
hew
1 2 3 4 5 6 7 8 9 10 11 12 13 14 15
1 Thiruvananthapuram 6686 4695 2776 6748 132 1766 0 20 20 604 23447 1043 24490
2 Kollam 6648 5750 2747 5376 111 1461 0 23 27 422 22565 2307 24872
3 Pathanamthitta 2917 1885 2076 2073 150 749 0 19 19 720 10608 437 11045
4 Alappuzha 2730 4819 519 2158 55 1104 0 16 21 578 12000 1718 13718
5 Kottayam 3941 2805 2750 2820 1167 1158 0 31 42 687 15401 362 15763
6 Idukki 15884 6280 3495 4040 1190 1061 305 99 166 1258 33778 1117 34895
7 Ernakulam 4036 4503 5158 4481 4662 1378 0 24 28 1003 25273 446 25719
8 Thrissur 5070 7275 2213 5407 60 1471 0 27 30 1235 22788 1511 24299
9 Palakkad 6955 9892 15199 9285 78 1582 3 94 87 1362 44537 1951 46488
10 Malappuram 8600 8245 7120 4549 96 2618 0 53 65 1372 32718 2035 34753
11 Kozhikode 9710 8335 1864 3609 163 2160 0 19 35 702 26597 1756 28353
12 Wayanad 7426 4264 8555 1214 30 378 55 35 37 332 22326 574 22900
13 Kannur 8504 7829 2022 3150 109 2031 0 92 47 1082 24866 19411 44277
14 Kasaragode 2875 2919 664 2230 42 777 0 23 28 748 10306 6993 17299
STATE TOTAL 91982 79496 57158 57140 8045 19694 363 575 652 12105 327210 41661 368871
(Table - 3 Contd…..)
Agricultural Statistics 2016-2017
Department of Economics and Statistics, Kerala State. 33
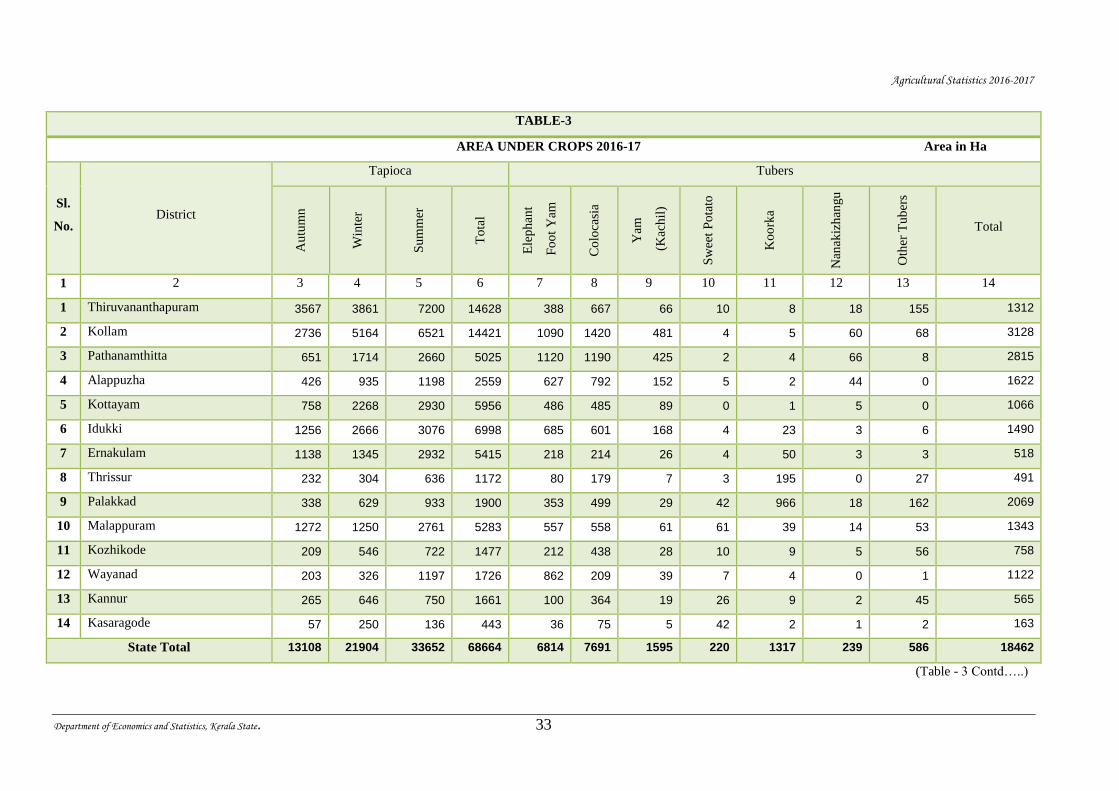
TABLE-3
AREA UNDER CROPS 2016-17 Area in Ha
Sl.
No. District
Tapioca Tubers
Au
tum
n
Win
ter
Su
mm
er
To
tal
Ele
ph
ant
Fo
ot
Yam
Co
loca
sia
Yam
(K
ach
il)
Sw
eet
Po
tato
Ko
ork
a
Nan
akiz
han
gu
Oth
er T
ub
ers
Total
1 2 3 4 5 6 7 8 9 10 11 12 13 14
1 Thiruvananthapuram 3567 3861 7200 14628 388 667 66 10 8 18 155 1312
2 Kollam 2736 5164 6521 14421 1090 1420 481 4 5 60 68 3128
3 Pathanamthitta 651 1714 2660 5025 1120 1190 425 2 4 66 8 2815
4 Alappuzha 426 935 1198 2559 627 792 152 5 2 44 0 1622
5 Kottayam 758 2268 2930 5956 486 485 89 0 1 5 0 1066
6 Idukki 1256 2666 3076 6998 685 601 168 4 23 3 6 1490
7 Ernakulam 1138 1345 2932 5415 218 214 26 4 50 3 3 518
8 Thrissur 232 304 636 1172 80 179 7 3 195 0 27 491
9 Palakkad 338 629 933 1900 353 499 29 42 966 18 162 2069
10 Malappuram 1272 1250 2761 5283 557 558 61 61 39 14 53 1343
11 Kozhikode 209 546 722 1477 212 438 28 10 9 5 56 758
12 Wayanad 203 326 1197 1726 862 209 39 7 4 0 1 1122
13 Kannur 265 646 750 1661 100 364 19 26 9 2 45 565
14 Kasaragode 57 250 136 443 36 75 5 42 2 1 2 163
State Total 13108 21904 33652 68664 6814 7691 1595 220 1317 239 586 18462
(Table - 3 Contd…..)
Agricultural Statistics 2016-2017
Department of Economics and Statistics, Kerala State. 34
TABLE-3
AREA UNDER CROPS 2016-17 Area in Ha
Vegetables
Sl.
No. District
Dru
mst
ick
Am
aran
thus
Bit
ter
Gourd
Snak
e G
ourd
Lad
ies
Fin
ger
Bri
nja
l
Gre
en C
hil
lies
Bott
le G
ourd
Lit
tle
Gourd
(Koval
)
Ash
Gourd
(Kum
bal
am)
Pum
pkin
Cucu
mber
Pay
ar
(A
chin
ga)
1 2 3 4 5 6 7 8 9 10 11 12 13 14 15 1 Thiruvananthapuram 2075 319 108 115 91 94 222 1 59 5 17 209 331
2 Kollam 1767 223 159 57 92 122 214 5 158 38 61 26 277
3 Pathanamthitta 543 96 127 90 68 95 56 0 143 55 55 44 250
4 Alappuzha 563 234 236 206 89 113 111 2 177 43 64 77 413
5 Kottayam 597 126 204 159 108 148 99 1 326 50 58 77 440
6 Idukki 694 80 533 28 41 88 110 0 103 35 71 16 611
7 Ernakulam 628 165 124 128 84 70 52 24 134 94 69 153 1057
8 Thrissur 1256 112 264 75 113 78 143 8 92 75 70 74 704
9 Palakkad 2305 168 439 163 545 223 272 18 150 193 279 126 1230
10 Malappuram 2673 109 129 52 114 46 67 114 61 162 333 202 775
11 Kozhikode 1683 127 74 30 42 24 129 6 33 60 59 89 149
12 Wayanad 509 74 235 7 16 29 71 5 23 64 138 28 546
13 Kannur 1897 181 81 25 95 65 102 2 93 76 65 218 267
14 Kasaragode 666 47 46 11 68 36 73 5 91 24 32 71 100
State Total 17856 2061 2759 1146 1566 1231 1721 191 1643 974 1371 1410 7150
(Table - 3 Contd…..)
Agricultural Statistics 2016-2017
Department of Economics and Statistics, Kerala State. 35
TABLE-3
AREA UNDER CROPS 2016-17 Area in Ha
Vegetables
Sl.
No. District
Pota
to
carr
ot
Bee
troot
cabbag
e
Tom
ato
cauli
flow
er
Bea
ns
Onio
n
Oth
er
Veg
etab
les
Total
Vegetables Total Food Crops
1 2 3 4 5 6 7 8 9 10 11 12 13
1 Thiruvananthapuram 0 0 0 0 6 1 0 0 9 3662 49801
2 Kollam 0 0 0 0 9 1 0 0 5 3214 53252
3 Pathanamthitta 0 0 0 0 3 0 0 0 98 1723 27991.17
4 Alappuzha 0 0 0 1 17 1 0 0 78 2425 56201
5 Kottayam 0 0 0 2 8 1 0 0 104 2508 50642.23
6 Idukki 556 1686 1 172 39 2 1624 0 125 6615 134413
7 Ernakulam 0 0 0 0 4 0 0 0 43 2829 52964.004
8 Thrissur 0 0 0 3 9 3 0 0 20 3099 67013
9 Palakkad 0 0 0 1 292 1 8 31 294 6738 144746.45
10 Malappuram 0 0 0 0 2 0 0 0 6 4845 76828
11 Kozhikode 0 0 0 1 9 1 0 0 28 2544 51304.008
12 Wayanad 0 0 0 15 22 6 12 0 43 1843 65696
13 Kannur 0 0 0 2 15 3 0 0 132 3319 69858.64
14 Kasaragode 0 0 0 0 2 0 0 0 96 1368 44897
State Total 556 1686 1 197 437 20 1644 31 1081 46732 945607.502
(Table - 3 Contd…..)
Agricultural Statistics 2016-2017
Department of Economics and Statistics, Kerala State. 36
TABLE-3
AREA UNDER CROPS 2016-17 Area in Ha
Sl.
No. District
Non Food Crops
Oil Seeds Fibre Drugs and Narcotics Plantation Crops
Gro
un
dn
ut
Ses
amu
m
Co
con
ut
Oth
ers
Total
Co
tto
n
Bet
el
Lea
ves
To
bac
co
Lem
on
Gra
ss
To
tal
Tea
*
Co
ffee
**
Ru
bb
er #
Co
coa
Total
1 2 3 4 5 6 7 8 9 10 11 12 13 14 15 16 17
1 Thiruvananthapura
m 0 0.14 70467 45 70512.14 0 16 0 0 16 962 0 32200 66 33228
2 Kollam 0 34.37 50938 69 51041.37 0 22 0 0 22 606 0 37260 7 37873
3 Pathanamthitta 0 0.36 15877 107 15984.36 0 35 0 0 35 0 0 50900 333 51233
4 Alappuzha 0 98.69 33670 136 33904.69 0 38 0 0 38 0 0 4500 86 4586
5 Kottayam 0 0 25610 99 25709 0 7 0 0 7 0 0 114410 876 115286
6 Idukki 0 0 16122 24 16146 0 0 0 104 104 21970 12717 40590 9459 84736
7 Ernakulam 0 1.61 43079 92 43172.61 0 4 0 0 4 0 0 60170 1092 61262
8 Thrissur 0 2.05 80504 274 80780.05 0 4 0 1 5 530 0 15660 46 16236
9 Palakkad 358 25.252 59547 1056 60986.252 80 2 0 0 82 831 4833 37870 198 43732
10 Malappuram 0 15.22 102836 116 102967.22 0 99 0 2 101 0 0 42770 50 42820
11 Kozhikode 0 0.004 119064 66 119130.004 0 8 0 0 8 0 0 21930 839 22769
12 Wayanad 0 1 10322 46 10369 0 1 0 29 30 5306 67426 10800 610 84142
13 Kannur 0 0 88217 109 88326 0 7 0 7 14 0 0 48070 409 48479
14 Kasaragode 0 0 65243 55 65298 0 18 12 0 30 0 0 33920 333 34253
State Total 358 178.696 781496 2294 784326.696 80 261 12 143 496 30205 84976 551050 14404 680635
Source: (Table - 3 Contd…..)
* Tea Board
** Coffee Board
# Rubber Board
Agricultural Statistics 2016-2017
Department of Economics and Statistics, Kerala State. 37
TABLE-3
AREA UNDER CROPS 2016-17 (Area in Ha)
Sl. No. District
Non Food Crops
Total Non Food
Crops
Total Cropped
Area Fodder Grass Green Manure
Crops
Other Crops &
Trees Teak
Medicinal
Plants Total
1 2 3 4 5 6 7 8 9 10
1 Thiruvananthapuram 107 539 4038 713 25 5422 109178.14 158979.14
2 Kollam 154 841 3351 1391 17 5754 94690.37 147942.37
3 Pathanamthitta 166 929 5403 2187 44 8729 75981.36 103972.53
4 Alappuzha 110 570 6146 1034 31 7891 46419.69 102620.690
5 Kottayam 282 561 8648 3166 36 12693 153695 204337.230
6 Idukki 1606 1709 30012 1325 305 34957 135943 270356.000
7 Ernakulam 311 552 6065 1727 28 8683 113121.61 166085.614
8 Thrissur 94 1584 3922 1295 49 6944 103965.05 170978.050
9 Palakkad 1821 4452 16930 5675 31 28909 133709.252 278455.702
10 Malappuram 95 4326 7613 3070 40 15144 161032.22 237860.220
11 Kozhikode 76 1398 3130 526 48 5178 147085.004 198389.012
12 Wayanad 573 547 5135 275 108 6638 101179 166875.000
13 Kannur 151 1164 11066 2273 35 14689 151508 221366.640
14 Kasaragode 104 1949 8613 630 15 11311 110892 155789.000
STATE TOTAL 5650 21121 120072 25287 812 172942 1638399.696 2584007.198
Agricultural Statistics 2016-2017
Department of Economics and Statistics, Kerala State. 38
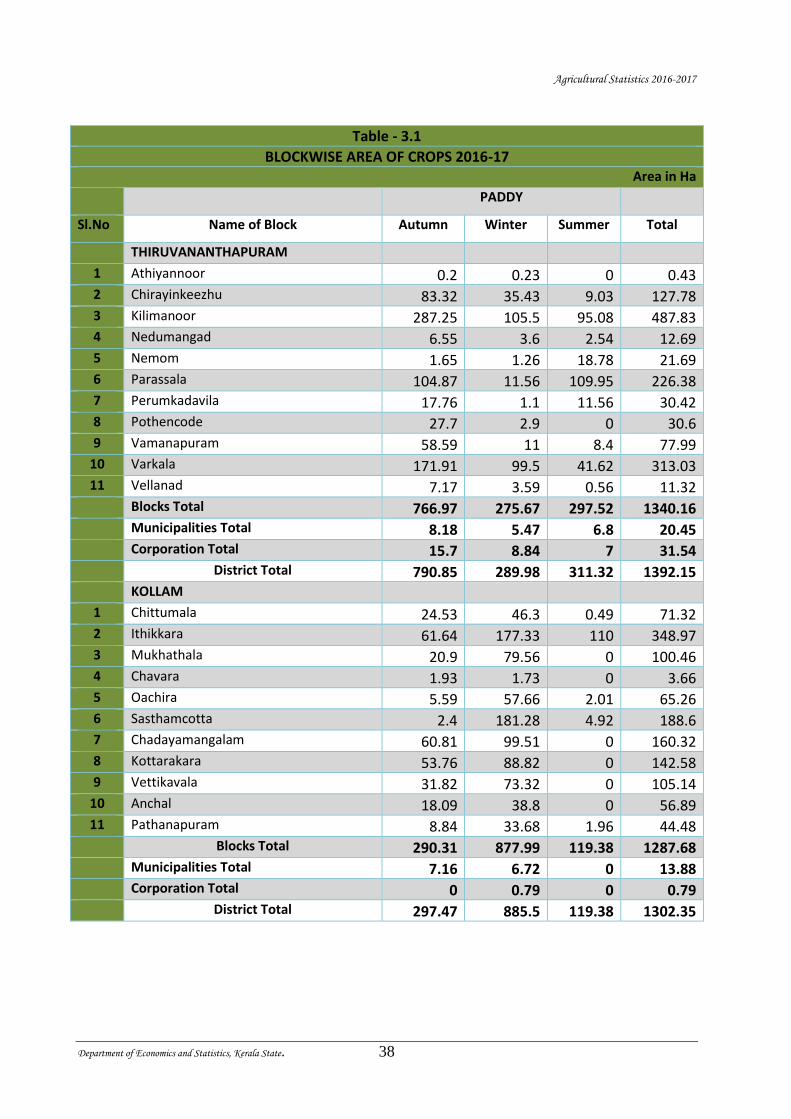
Table - 3.1
BLOCKWISE AREA OF CROPS 2016-17 Area in Ha
PADDY
Sl.No Name of Block Autumn Winter Summer Total
THIRUVANANTHAPURAM
1 Athiyannoor 0.2 0.23 0 0.43 2 Chirayinkeezhu 83.32 35.43 9.03 127.78 3 Kilimanoor 287.25 105.5 95.08 487.83 4 Nedumangad 6.55 3.6 2.54 12.69 5 Nemom 1.65 1.26 18.78 21.69 6 Parassala 104.87 11.56 109.95 226.38 7 Perumkadavila 17.76 1.1 11.56 30.42 8 Pothencode 27.7 2.9 0 30.6 9 Vamanapuram 58.59 11 8.4 77.99
10 Varkala 171.91 99.5 41.62 313.03 11 Vellanad 7.17 3.59 0.56 11.32 Blocks Total 766.97 275.67 297.52 1340.16 Municipalities Total 8.18 5.47 6.8 20.45 Corporation Total 15.7 8.84 7 31.54 District Total 790.85 289.98 311.32 1392.15 KOLLAM
1 Chittumala 24.53 46.3 0.49 71.32 2 Ithikkara 61.64 177.33 110 348.97 3 Mukhathala 20.9 79.56 0 100.46 4 Chavara 1.93 1.73 0 3.66 5 Oachira 5.59 57.66 2.01 65.26 6 Sasthamcotta 2.4 181.28 4.92 188.6 7 Chadayamangalam 60.81 99.51 0 160.32 8 Kottarakara 53.76 88.82 0 142.58 9 Vettikavala 31.82 73.32 0 105.14
10 Anchal 18.09 38.8 0 56.89 11 Pathanapuram 8.84 33.68 1.96 44.48 Blocks Total 290.31 877.99 119.38 1287.68 Municipalities Total 7.16 6.72 0 13.88 Corporation Total 0 0.79 0 0.79 District Total 297.47 885.5 119.38 1302.35
Agricultural Statistics 2016-2017
Department of Economics and Statistics, Kerala State. 39
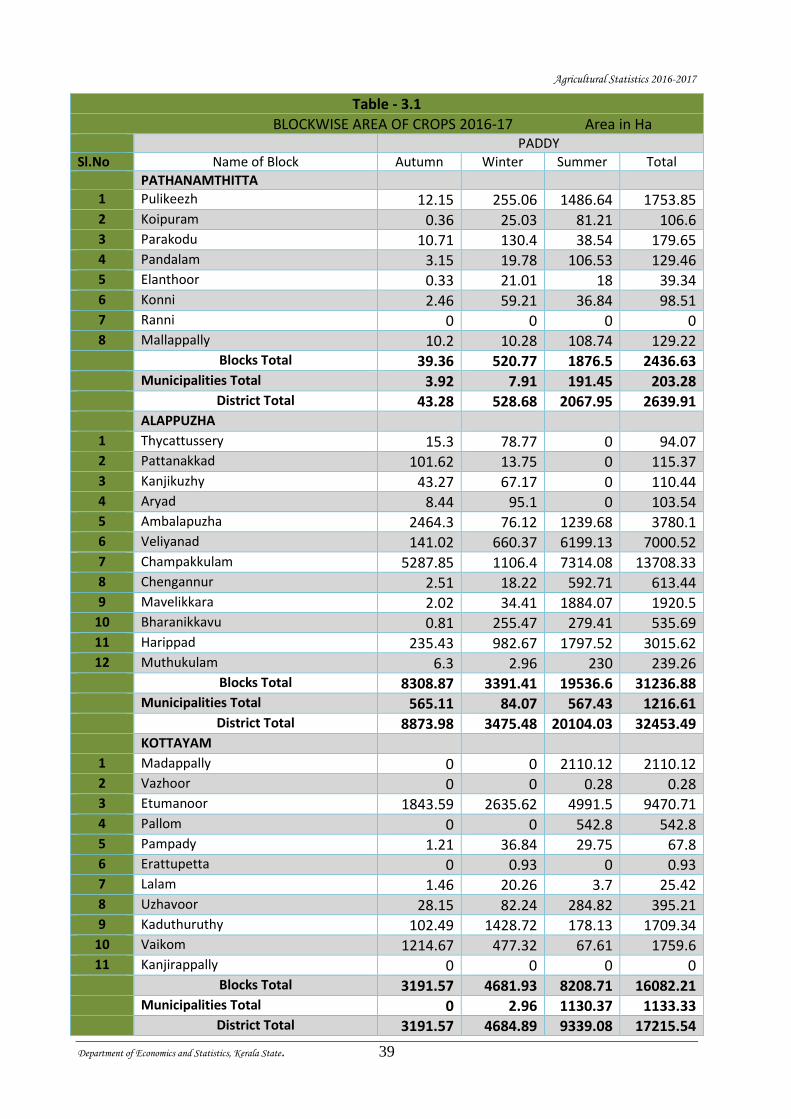
Table - 3.1
BLOCKWISE AREA OF CROPS 2016-17 Area in Ha PADDY
Sl.No Name of Block Autumn Winter Summer Total
PATHANAMTHITTA
1 Pulikeezh 12.15 255.06 1486.64 1753.85 2 Koipuram 0.36 25.03 81.21 106.6 3 Parakodu 10.71 130.4 38.54 179.65 4 Pandalam 3.15 19.78 106.53 129.46 5 Elanthoor 0.33 21.01 18 39.34 6 Konni 2.46 59.21 36.84 98.51 7 Ranni 0 0 0 0 8 Mallappally 10.2 10.28 108.74 129.22 Blocks Total 39.36 520.77 1876.5 2436.63 Municipalities Total 3.92 7.91 191.45 203.28 District Total 43.28 528.68 2067.95 2639.91
ALAPPUZHA 1 Thycattussery 15.3 78.77 0 94.07 2 Pattanakkad 101.62 13.75 0 115.37 3 Kanjikuzhy 43.27 67.17 0 110.44 4 Aryad 8.44 95.1 0 103.54 5 Ambalapuzha 2464.3 76.12 1239.68 3780.1 6 Veliyanad 141.02 660.37 6199.13 7000.52 7 Champakkulam 5287.85 1106.4 7314.08 13708.33 8 Chengannur 2.51 18.22 592.71 613.44 9 Mavelikkara 2.02 34.41 1884.07 1920.5
10 Bharanikkavu 0.81 255.47 279.41 535.69 11 Harippad 235.43 982.67 1797.52 3015.62 12 Muthukulam 6.3 2.96 230 239.26 Blocks Total 8308.87 3391.41 19536.6 31236.88 Municipalities Total 565.11 84.07 567.43 1216.61 District Total 8873.98 3475.48 20104.03 32453.49
KOTTAYAM 1 Madappally 0 0 2110.12 2110.12 2 Vazhoor 0 0 0.28 0.28 3 Etumanoor 1843.59 2635.62 4991.5 9470.71 4 Pallom 0 0 542.8 542.8 5 Pampady 1.21 36.84 29.75 67.8 6 Erattupetta 0 0.93 0 0.93 7 Lalam 1.46 20.26 3.7 25.42 8 Uzhavoor 28.15 82.24 284.82 395.21 9 Kaduthuruthy 102.49 1428.72 178.13 1709.34
10 Vaikom 1214.67 477.32 67.61 1759.6 11 Kanjirappally 0 0 0 0 Blocks Total 3191.57 4681.93 8208.71 16082.21 Municipalities Total 0 2.96 1130.37 1133.33 District Total 3191.57 4684.89 9339.08 17215.54
Agricultural Statistics 2016-2017
Department of Economics and Statistics, Kerala State. 40
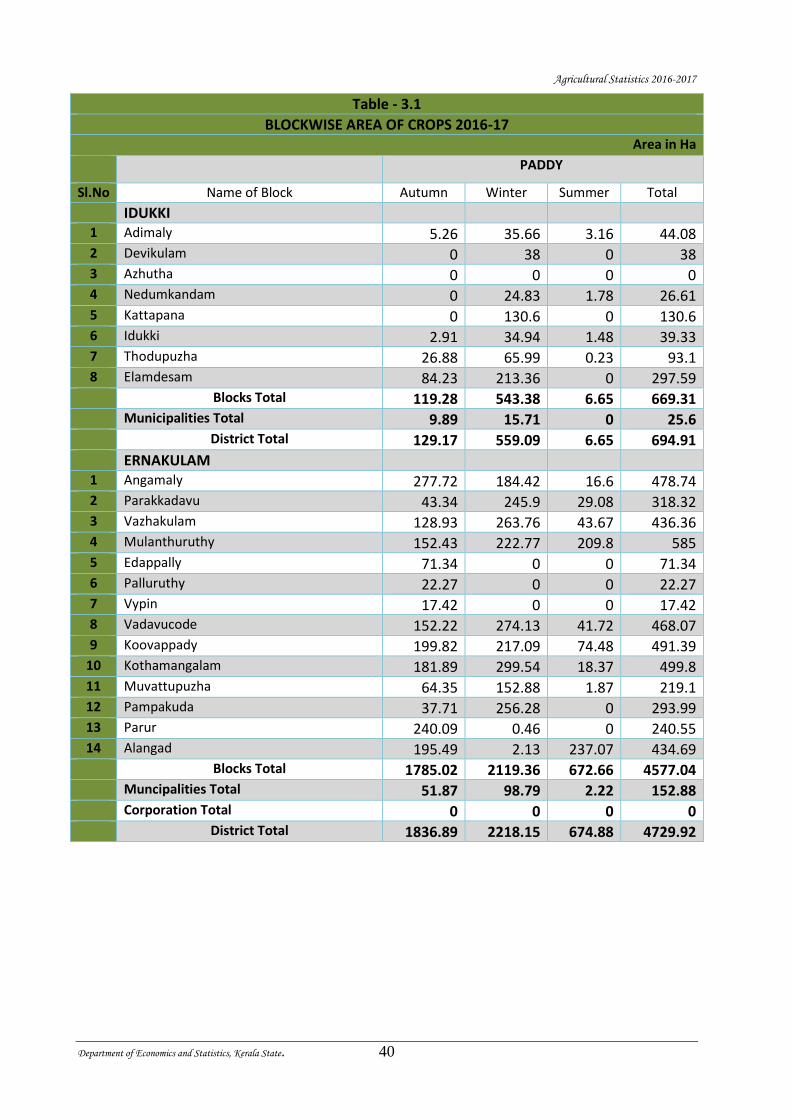
Table - 3.1
BLOCKWISE AREA OF CROPS 2016-17 Area in Ha
PADDY
Sl.No Name of Block Autumn Winter Summer Total
IDUKKI 1 Adimaly 5.26 35.66 3.16 44.08 2 Devikulam 0 38 0 38 3 Azhutha 0 0 0 0 4 Nedumkandam 0 24.83 1.78 26.61 5 Kattapana 0 130.6 0 130.6 6 Idukki 2.91 34.94 1.48 39.33 7 Thodupuzha 26.88 65.99 0.23 93.1 8 Elamdesam 84.23 213.36 0 297.59 Blocks Total 119.28 543.38 6.65 669.31 Municipalities Total 9.89 15.71 0 25.6 District Total 129.17 559.09 6.65 694.91
ERNAKULAM 1 Angamaly 277.72 184.42 16.6 478.74 2 Parakkadavu 43.34 245.9 29.08 318.32 3 Vazhakulam 128.93 263.76 43.67 436.36 4 Mulanthuruthy 152.43 222.77 209.8 585 5 Edappally 71.34 0 0 71.34 6 Palluruthy 22.27 0 0 22.27 7 Vypin 17.42 0 0 17.42 8 Vadavucode 152.22 274.13 41.72 468.07 9 Koovappady 199.82 217.09 74.48 491.39
10 Kothamangalam 181.89 299.54 18.37 499.8 11 Muvattupuzha 64.35 152.88 1.87 219.1 12 Pampakuda 37.71 256.28 0 293.99 13 Parur 240.09 0.46 0 240.55 14 Alangad 195.49 2.13 237.07 434.69 Blocks Total 1785.02 2119.36 672.66 4577.04 Muncipalities Total 51.87 98.79 2.22 152.88 Corporation Total 0 0 0 0 District Total 1836.89 2218.15 674.88 4729.92
Agricultural Statistics 2016-2017
Department of Economics and Statistics, Kerala State. 41
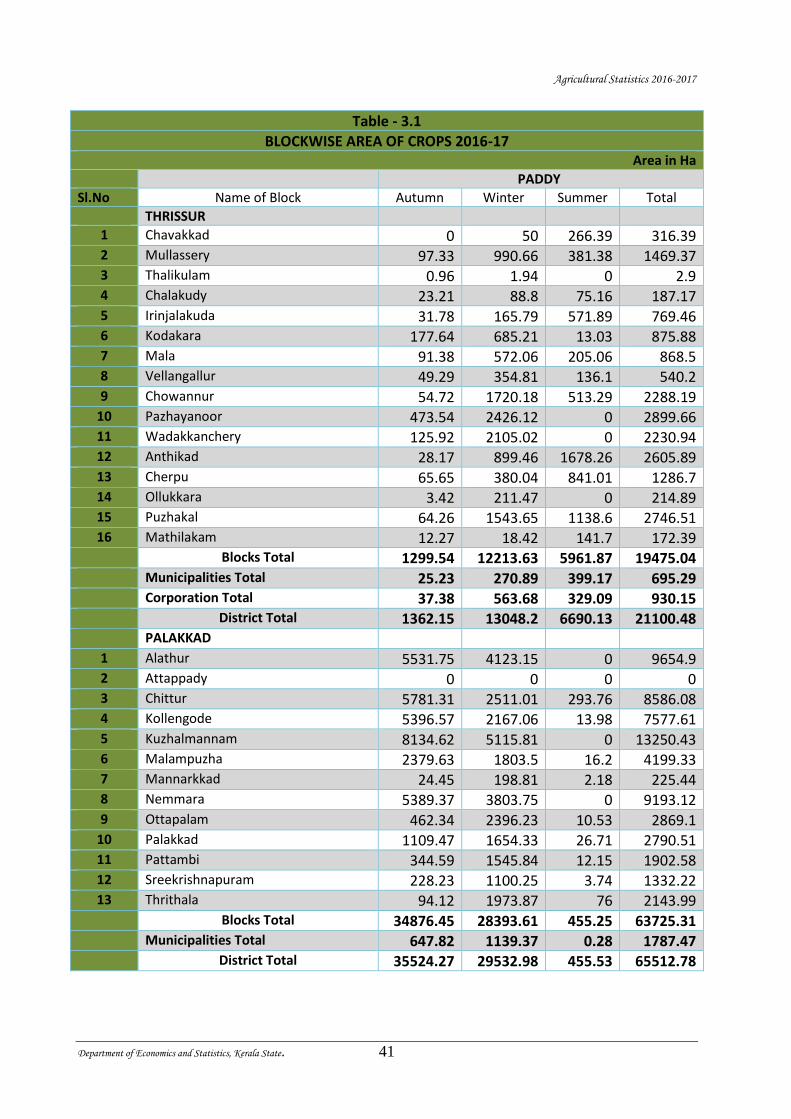
Table - 3.1
BLOCKWISE AREA OF CROPS 2016-17 Area in Ha
PADDY
Sl.No Name of Block Autumn Winter Summer Total
THRISSUR
1 Chavakkad 0 50 266.39 316.39 2 Mullassery 97.33 990.66 381.38 1469.37 3 Thalikulam 0.96 1.94 0 2.9 4 Chalakudy 23.21 88.8 75.16 187.17 5 Irinjalakuda 31.78 165.79 571.89 769.46 6 Kodakara 177.64 685.21 13.03 875.88 7 Mala 91.38 572.06 205.06 868.5 8 Vellangallur 49.29 354.81 136.1 540.2 9 Chowannur 54.72 1720.18 513.29 2288.19
10 Pazhayanoor 473.54 2426.12 0 2899.66 11 Wadakkanchery 125.92 2105.02 0 2230.94 12 Anthikad 28.17 899.46 1678.26 2605.89 13 Cherpu 65.65 380.04 841.01 1286.7 14 Ollukkara 3.42 211.47 0 214.89 15 Puzhakal 64.26 1543.65 1138.6 2746.51 16 Mathilakam 12.27 18.42 141.7 172.39 Blocks Total 1299.54 12213.63 5961.87 19475.04 Municipalities Total 25.23 270.89 399.17 695.29 Corporation Total 37.38 563.68 329.09 930.15 District Total 1362.15 13048.2 6690.13 21100.48
PALAKKAD 1 Alathur 5531.75 4123.15 0 9654.9 2 Attappady 0 0 0 0 3 Chittur 5781.31 2511.01 293.76 8586.08 4 Kollengode 5396.57 2167.06 13.98 7577.61 5 Kuzhalmannam 8134.62 5115.81 0 13250.43 6 Malampuzha 2379.63 1803.5 16.2 4199.33 7 Mannarkkad 24.45 198.81 2.18 225.44 8 Nemmara 5389.37 3803.75 0 9193.12 9 Ottapalam 462.34 2396.23 10.53 2869.1
10 Palakkad 1109.47 1654.33 26.71 2790.51 11 Pattambi 344.59 1545.84 12.15 1902.58 12 Sreekrishnapuram 228.23 1100.25 3.74 1332.22 13 Thrithala 94.12 1973.87 76 2143.99 Blocks Total 34876.45 28393.61 455.25 63725.31 Municipalities Total 647.82 1139.37 0.28 1787.47 District Total 35524.27 29532.98 455.53 65512.78
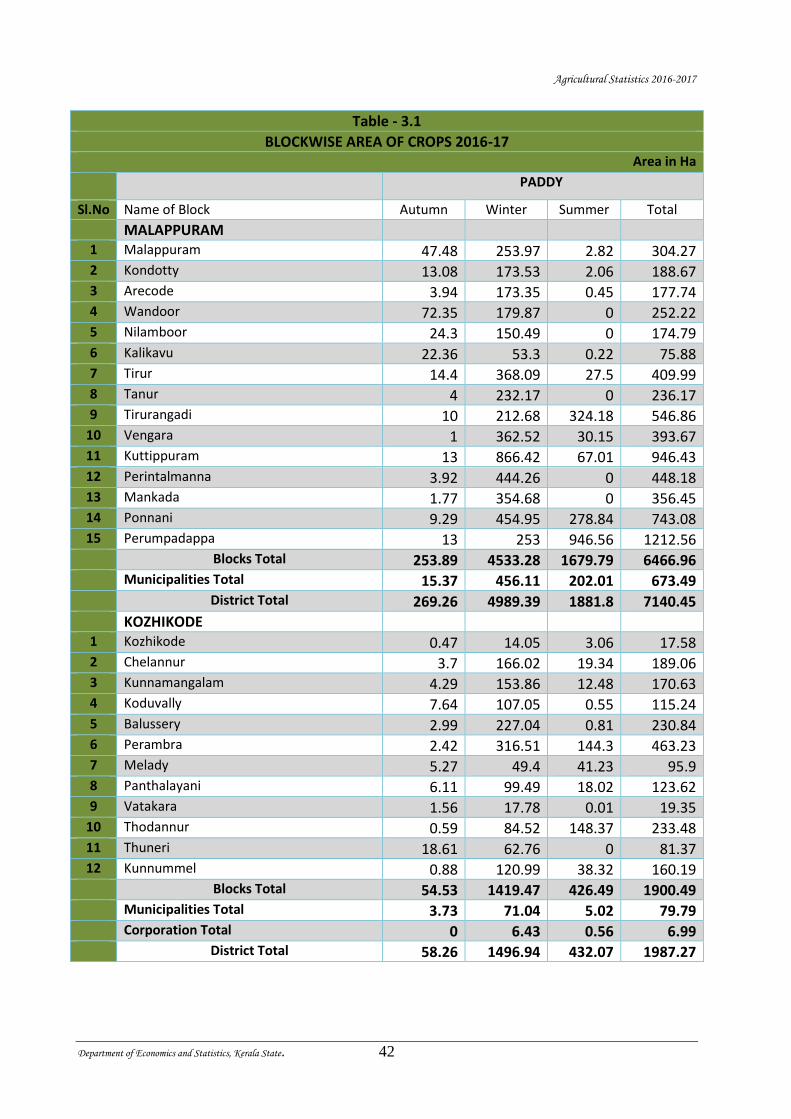
Agricultural Statistics 2016-2017
Department of Economics and Statistics, Kerala State. 42
Table - 3.1
BLOCKWISE AREA OF CROPS 2016-17 Area in Ha
PADDY
Sl.No Name of Block Autumn Winter Summer Total
MALAPPURAM 1 Malappuram 47.48 253.97 2.82 304.27 2 Kondotty 13.08 173.53 2.06 188.67 3 Arecode 3.94 173.35 0.45 177.74 4 Wandoor 72.35 179.87 0 252.22 5 Nilamboor 24.3 150.49 0 174.79 6 Kalikavu 22.36 53.3 0.22 75.88 7 Tirur 14.4 368.09 27.5 409.99 8 Tanur 4 232.17 0 236.17 9 Tirurangadi 10 212.68 324.18 546.86
10 Vengara 1 362.52 30.15 393.67 11 Kuttippuram 13 866.42 67.01 946.43 12 Perintalmanna 3.92 444.26 0 448.18 13 Mankada 1.77 354.68 0 356.45 14 Ponnani 9.29 454.95 278.84 743.08 15 Perumpadappa 13 253 946.56 1212.56 Blocks Total 253.89 4533.28 1679.79 6466.96 Municipalities Total 15.37 456.11 202.01 673.49 District Total 269.26 4989.39 1881.8 7140.45
KOZHIKODE 1 Kozhikode 0.47 14.05 3.06 17.58 2 Chelannur 3.7 166.02 19.34 189.06 3 Kunnamangalam 4.29 153.86 12.48 170.63 4 Koduvally 7.64 107.05 0.55 115.24 5 Balussery 2.99 227.04 0.81 230.84 6 Perambra 2.42 316.51 144.3 463.23 7 Melady 5.27 49.4 41.23 95.9 8 Panthalayani 6.11 99.49 18.02 123.62 9 Vatakara 1.56 17.78 0.01 19.35
10 Thodannur 0.59 84.52 148.37 233.48 11 Thuneri 18.61 62.76 0 81.37 12 Kunnummel 0.88 120.99 38.32 160.19 Blocks Total 54.53 1419.47 426.49 1900.49 Municipalities Total 3.73 71.04 5.02 79.79 Corporation Total 0 6.43 0.56 6.99 District Total 58.26 1496.94 432.07 1987.27
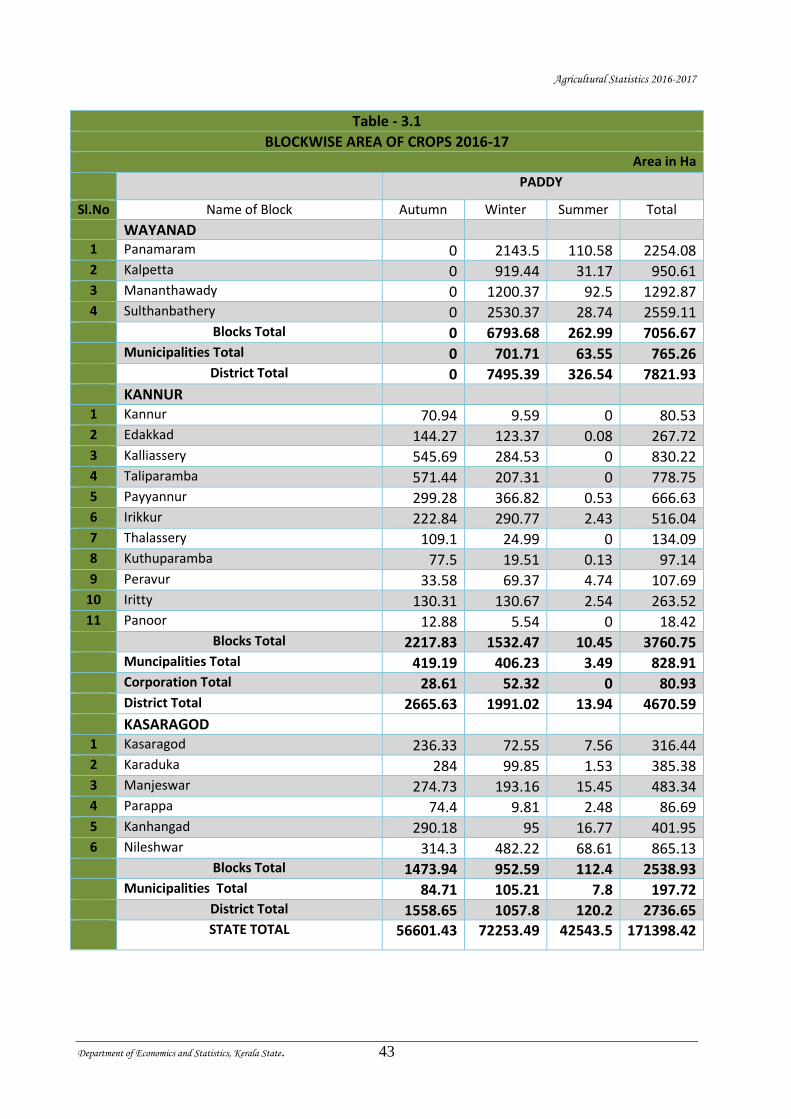
Agricultural Statistics 2016-2017
Department of Economics and Statistics, Kerala State. 43
Table - 3.1
BLOCKWISE AREA OF CROPS 2016-17 Area in Ha
PADDY
Sl.No Name of Block Autumn Winter Summer Total
WAYANAD 1 Panamaram 0 2143.5 110.58 2254.08 2 Kalpetta 0 919.44 31.17 950.61 3 Mananthawady 0 1200.37 92.5 1292.87 4 Sulthanbathery 0 2530.37 28.74 2559.11 Blocks Total 0 6793.68 262.99 7056.67 Municipalities Total 0 701.71 63.55 765.26 District Total 0 7495.39 326.54 7821.93
KANNUR 1 Kannur 70.94 9.59 0 80.53 2 Edakkad 144.27 123.37 0.08 267.72 3 Kalliassery 545.69 284.53 0 830.22 4 Taliparamba 571.44 207.31 0 778.75 5 Payyannur 299.28 366.82 0.53 666.63 6 Irikkur 222.84 290.77 2.43 516.04 7 Thalassery 109.1 24.99 0 134.09 8 Kuthuparamba 77.5 19.51 0.13 97.14 9 Peravur 33.58 69.37 4.74 107.69
10 Iritty 130.31 130.67 2.54 263.52 11 Panoor 12.88 5.54 0 18.42 Blocks Total 2217.83 1532.47 10.45 3760.75 Muncipalities Total 419.19 406.23 3.49 828.91 Corporation Total 28.61 52.32 0 80.93
District Total 2665.63 1991.02 13.94 4670.59
KASARAGOD 1 Kasaragod 236.33 72.55 7.56 316.44
2 Karaduka 284 99.85 1.53 385.38 3 Manjeswar 274.73 193.16 15.45 483.34 4 Parappa 74.4 9.81 2.48 86.69 5 Kanhangad 290.18 95 16.77 401.95 6 Nileshwar 314.3 482.22 68.61 865.13 Blocks Total 1473.94 952.59 112.4 2538.93 Municipalities Total 84.71 105.21 7.8 197.72 District Total 1558.65 1057.8 120.2 2736.65
STATE TOTAL 56601.43 72253.49 42543.5 171398.42
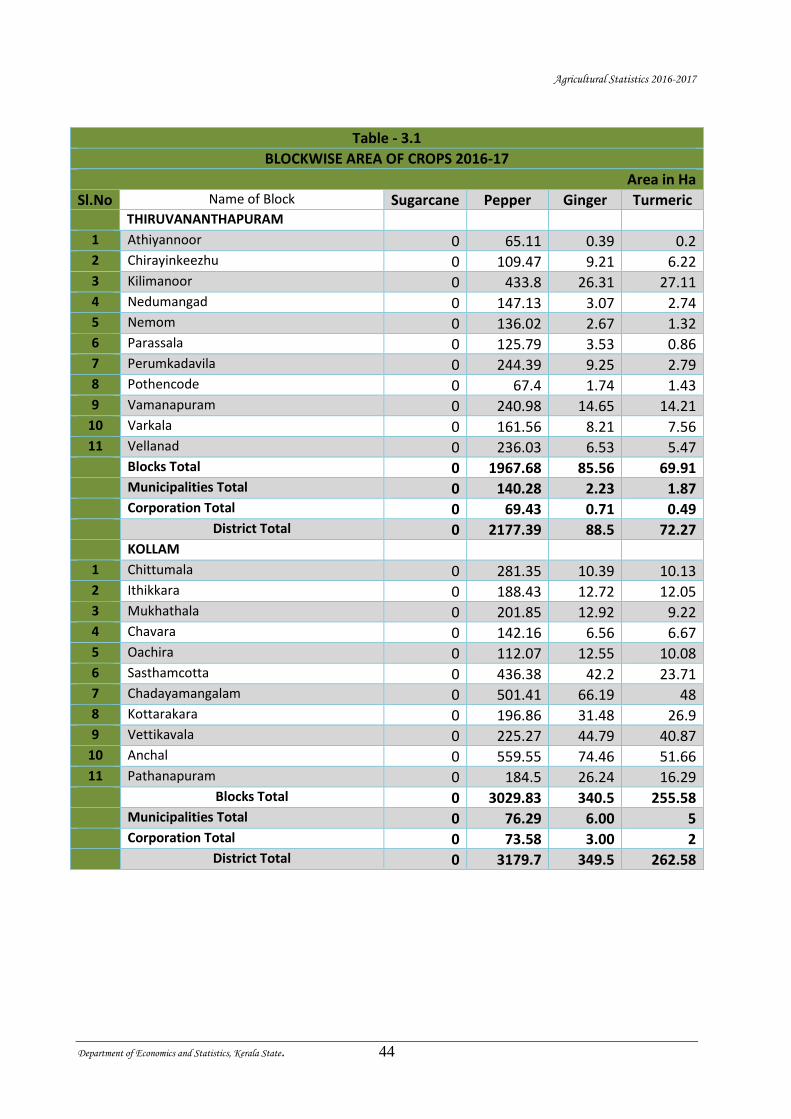
Agricultural Statistics 2016-2017
Department of Economics and Statistics, Kerala State. 44
Table - 3.1
BLOCKWISE AREA OF CROPS 2016-17
Area in Ha
Sl.No Name of Block Sugarcane Pepper Ginger Turmeric THIRUVANANTHAPURAM
1 Athiyannoor 0 65.11 0.39 0.2 2 Chirayinkeezhu 0 109.47 9.21 6.22 3 Kilimanoor 0 433.8 26.31 27.11 4 Nedumangad 0 147.13 3.07 2.74 5 Nemom 0 136.02 2.67 1.32 6 Parassala 0 125.79 3.53 0.86 7 Perumkadavila 0 244.39 9.25 2.79 8 Pothencode 0 67.4 1.74 1.43 9 Vamanapuram 0 240.98 14.65 14.21
10 Varkala 0 161.56 8.21 7.56 11 Vellanad 0 236.03 6.53 5.47 Blocks Total 0 1967.68 85.56 69.91 Municipalities Total 0 140.28 2.23 1.87 Corporation Total 0 69.43 0.71 0.49 District Total 0 2177.39 88.5 72.27 KOLLAM
1 Chittumala 0 281.35 10.39 10.13 2 Ithikkara 0 188.43 12.72 12.05 3 Mukhathala 0 201.85 12.92 9.22 4 Chavara 0 142.16 6.56 6.67 5 Oachira 0 112.07 12.55 10.08 6 Sasthamcotta 0 436.38 42.2 23.71 7 Chadayamangalam 0 501.41 66.19 48 8 Kottarakara 0 196.86 31.48 26.9 9 Vettikavala 0 225.27 44.79 40.87
10 Anchal 0 559.55 74.46 51.66 11 Pathanapuram 0 184.5 26.24 16.29 Blocks Total 0 3029.83 340.5 255.58 Municipalities Total 0 76.29 6.00 5 Corporation Total 0 73.58 3.00 2 District Total 0 3179.7 349.5 262.58
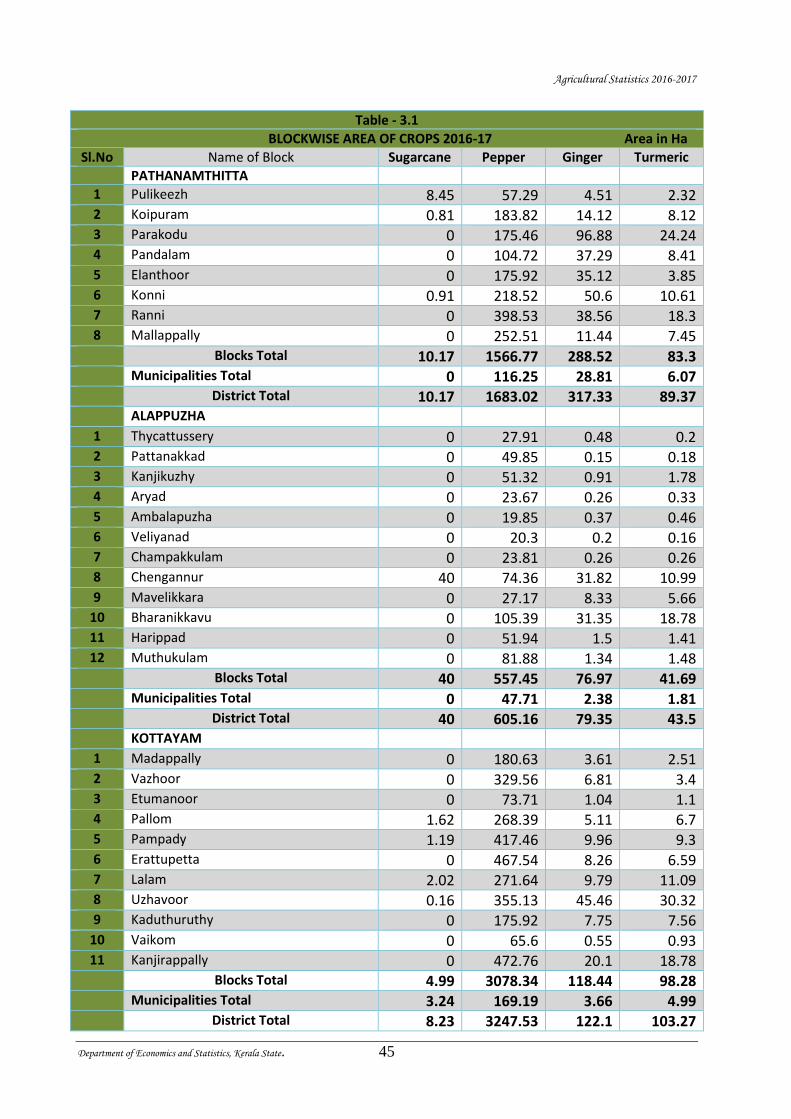
Agricultural Statistics 2016-2017
Department of Economics and Statistics, Kerala State. 45
Table - 3.1
BLOCKWISE AREA OF CROPS 2016-17 Area in Ha
Sl.No Name of Block Sugarcane Pepper Ginger Turmeric
PATHANAMTHITTA
1 Pulikeezh 8.45 57.29 4.51 2.32 2 Koipuram 0.81 183.82 14.12 8.12 3 Parakodu 0 175.46 96.88 24.24 4 Pandalam 0 104.72 37.29 8.41 5 Elanthoor 0 175.92 35.12 3.85 6 Konni 0.91 218.52 50.6 10.61 7 Ranni 0 398.53 38.56 18.3 8 Mallappally 0 252.51 11.44 7.45 Blocks Total 10.17 1566.77 288.52 83.3 Municipalities Total 0 116.25 28.81 6.07 District Total 10.17 1683.02 317.33 89.37 ALAPPUZHA
1 Thycattussery 0 27.91 0.48 0.2 2 Pattanakkad 0 49.85 0.15 0.18 3 Kanjikuzhy 0 51.32 0.91 1.78 4 Aryad 0 23.67 0.26 0.33 5 Ambalapuzha 0 19.85 0.37 0.46 6 Veliyanad 0 20.3 0.2 0.16 7 Champakkulam 0 23.81 0.26 0.26 8 Chengannur 40 74.36 31.82 10.99 9 Mavelikkara 0 27.17 8.33 5.66
10 Bharanikkavu 0 105.39 31.35 18.78 11 Harippad 0 51.94 1.5 1.41 12 Muthukulam 0 81.88 1.34 1.48
Blocks Total 40 557.45 76.97 41.69 Municipalities Total 0 47.71 2.38 1.81 District Total 40 605.16 79.35 43.5 KOTTAYAM
1 Madappally 0 180.63 3.61 2.51 2 Vazhoor 0 329.56 6.81 3.4 3 Etumanoor 0 73.71 1.04 1.1 4 Pallom 1.62 268.39 5.11 6.7 5 Pampady 1.19 417.46 9.96 9.3 6 Erattupetta 0 467.54 8.26 6.59 7 Lalam 2.02 271.64 9.79 11.09 8 Uzhavoor 0.16 355.13 45.46 30.32 9 Kaduthuruthy 0 175.92 7.75 7.56
10 Vaikom 0 65.6 0.55 0.93 11 Kanjirappally 0 472.76 20.1 18.78
Blocks Total 4.99 3078.34 118.44 98.28 Municipalities Total 3.24 169.19 3.66 4.99 District Total 8.23 3247.53 122.1 103.27
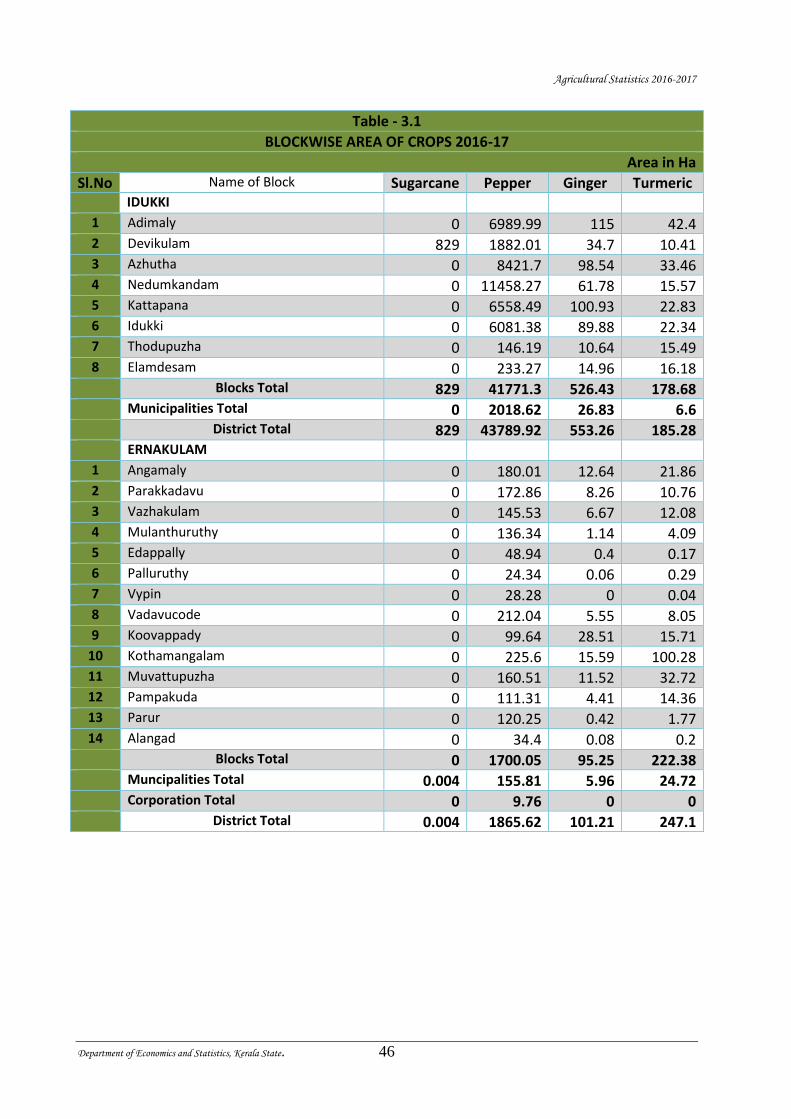
Agricultural Statistics 2016-2017
Department of Economics and Statistics, Kerala State. 46
Table - 3.1
BLOCKWISE AREA OF CROPS 2016-17
Area in Ha
Sl.No Name of Block Sugarcane Pepper Ginger Turmeric IDUKKI
1 Adimaly 0 6989.99 115 42.4 2 Devikulam 829 1882.01 34.7 10.41 3 Azhutha 0 8421.7 98.54 33.46 4 Nedumkandam 0 11458.27 61.78 15.57 5 Kattapana 0 6558.49 100.93 22.83 6 Idukki 0 6081.38 89.88 22.34 7 Thodupuzha 0 146.19 10.64 15.49 8 Elamdesam 0 233.27 14.96 16.18 Blocks Total 829 41771.3 526.43 178.68 Municipalities Total 0 2018.62 26.83 6.6 District Total 829 43789.92 553.26 185.28 ERNAKULAM
1 Angamaly 0 180.01 12.64 21.86 2 Parakkadavu 0 172.86 8.26 10.76 3 Vazhakulam 0 145.53 6.67 12.08 4 Mulanthuruthy 0 136.34 1.14 4.09 5 Edappally 0 48.94 0.4 0.17 6 Palluruthy 0 24.34 0.06 0.29 7 Vypin 0 28.28 0 0.04 8 Vadavucode 0 212.04 5.55 8.05 9 Koovappady 0 99.64 28.51 15.71
10 Kothamangalam 0 225.6 15.59 100.28 11 Muvattupuzha 0 160.51 11.52 32.72 12 Pampakuda 0 111.31 4.41 14.36 13 Parur 0 120.25 0.42 1.77 14 Alangad 0 34.4 0.08 0.2 Blocks Total 0 1700.05 95.25 222.38 Muncipalities Total 0.004 155.81 5.96 24.72 Corporation Total 0 9.76 0 0 District Total 0.004 1865.62 101.21 247.1
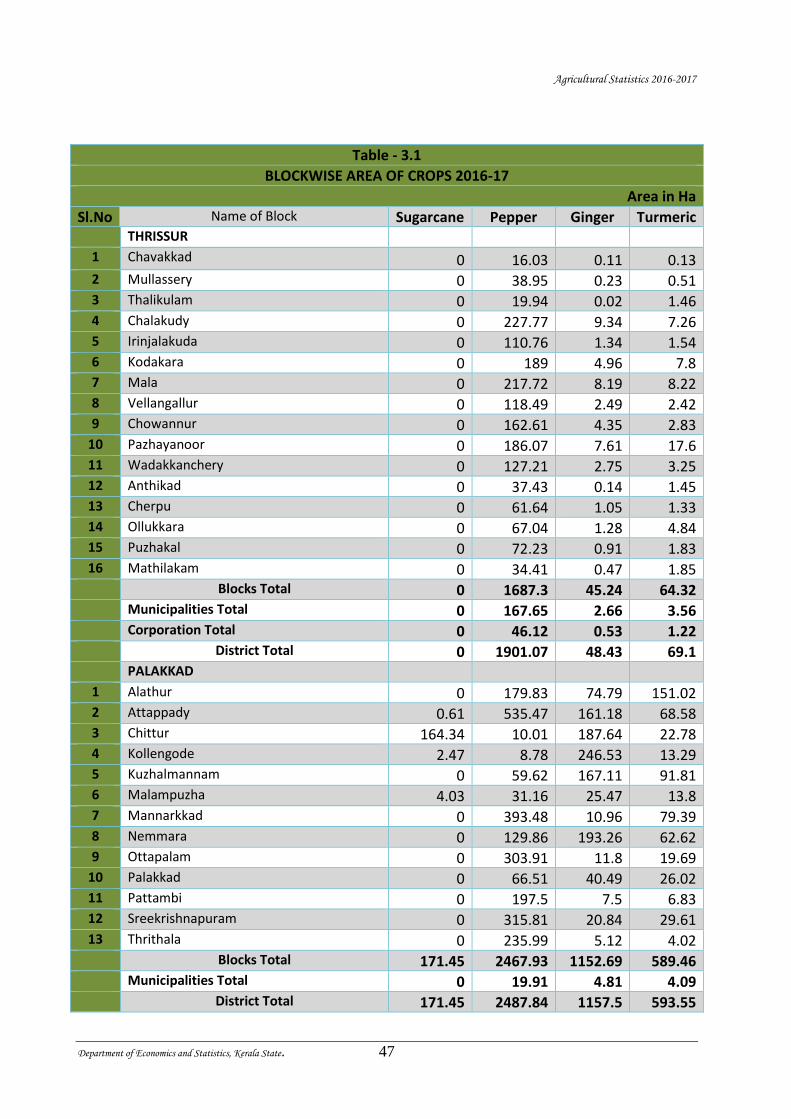
Agricultural Statistics 2016-2017
Department of Economics and Statistics, Kerala State. 47
Table - 3.1
BLOCKWISE AREA OF CROPS 2016-17
Area in Ha
Sl.No Name of Block Sugarcane Pepper Ginger Turmeric THRISSUR
1 Chavakkad 0 16.03 0.11 0.13 2 Mullassery 0 38.95 0.23 0.51 3 Thalikulam 0 19.94 0.02 1.46 4 Chalakudy 0 227.77 9.34 7.26 5 Irinjalakuda 0 110.76 1.34 1.54 6 Kodakara 0 189 4.96 7.8 7 Mala 0 217.72 8.19 8.22 8 Vellangallur 0 118.49 2.49 2.42 9 Chowannur 0 162.61 4.35 2.83
10 Pazhayanoor 0 186.07 7.61 17.6 11 Wadakkanchery 0 127.21 2.75 3.25 12 Anthikad 0 37.43 0.14 1.45 13 Cherpu 0 61.64 1.05 1.33 14 Ollukkara 0 67.04 1.28 4.84 15 Puzhakal 0 72.23 0.91 1.83 16 Mathilakam 0 34.41 0.47 1.85 Blocks Total 0 1687.3 45.24 64.32 Municipalities Total 0 167.65 2.66 3.56 Corporation Total 0 46.12 0.53 1.22 District Total 0 1901.07 48.43 69.1 PALAKKAD
1 Alathur 0 179.83 74.79 151.02 2 Attappady 0.61 535.47 161.18 68.58 3 Chittur 164.34 10.01 187.64 22.78 4 Kollengode 2.47 8.78 246.53 13.29 5 Kuzhalmannam 0 59.62 167.11 91.81 6 Malampuzha 4.03 31.16 25.47 13.8 7 Mannarkkad 0 393.48 10.96 79.39 8 Nemmara 0 129.86 193.26 62.62 9 Ottapalam 0 303.91 11.8 19.69
10 Palakkad 0 66.51 40.49 26.02 11 Pattambi 0 197.5 7.5 6.83 12 Sreekrishnapuram 0 315.81 20.84 29.61 13 Thrithala 0 235.99 5.12 4.02 Blocks Total 171.45 2467.93 1152.69 589.46 Municipalities Total 0 19.91 4.81 4.09 District Total 171.45 2487.84 1157.5 593.55
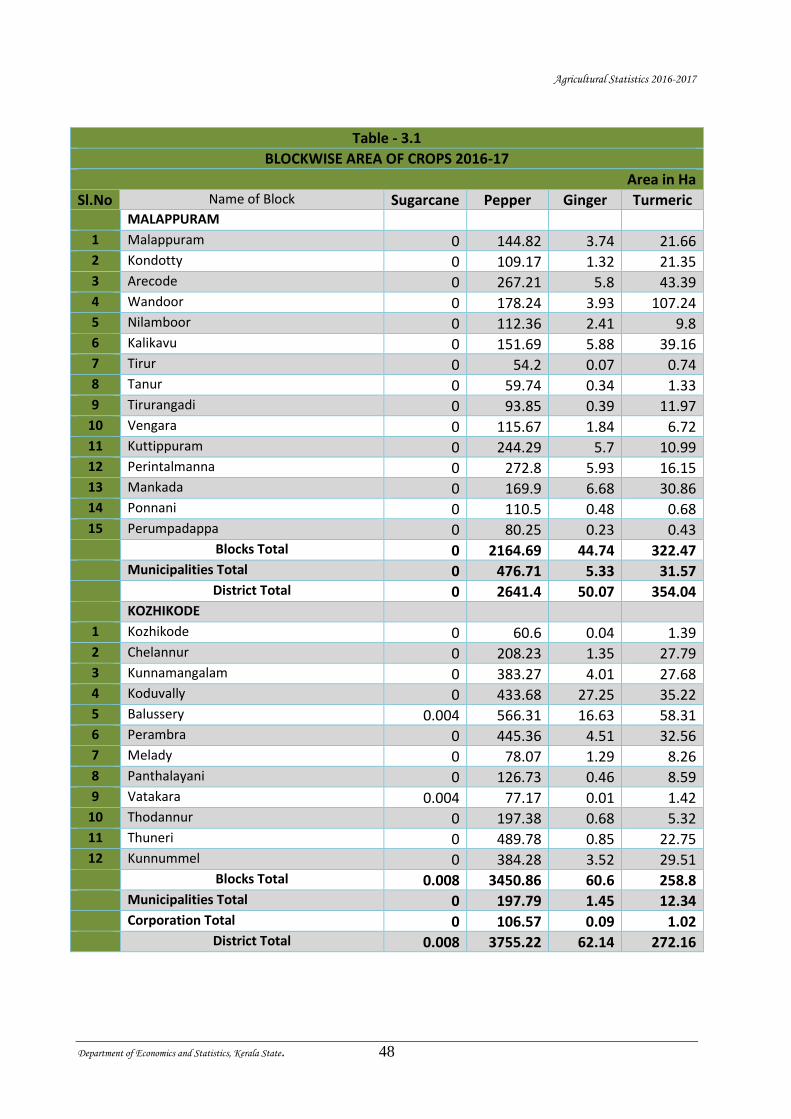
Agricultural Statistics 2016-2017
Department of Economics and Statistics, Kerala State. 48
Table - 3.1
BLOCKWISE AREA OF CROPS 2016-17
Area in Ha
Sl.No Name of Block Sugarcane Pepper Ginger Turmeric MALAPPURAM
1 Malappuram 0 144.82 3.74 21.66 2 Kondotty 0 109.17 1.32 21.35 3 Arecode 0 267.21 5.8 43.39 4 Wandoor 0 178.24 3.93 107.24 5 Nilamboor 0 112.36 2.41 9.8 6 Kalikavu 0 151.69 5.88 39.16 7 Tirur 0 54.2 0.07 0.74 8 Tanur 0 59.74 0.34 1.33 9 Tirurangadi 0 93.85 0.39 11.97
10 Vengara 0 115.67 1.84 6.72 11 Kuttippuram 0 244.29 5.7 10.99 12 Perintalmanna 0 272.8 5.93 16.15 13 Mankada 0 169.9 6.68 30.86 14 Ponnani 0 110.5 0.48 0.68 15 Perumpadappa 0 80.25 0.23 0.43 Blocks Total 0 2164.69 44.74 322.47 Municipalities Total 0 476.71 5.33 31.57 District Total 0 2641.4 50.07 354.04 KOZHIKODE
1 Kozhikode 0 60.6 0.04 1.39 2 Chelannur 0 208.23 1.35 27.79 3 Kunnamangalam 0 383.27 4.01 27.68 4 Koduvally 0 433.68 27.25 35.22 5 Balussery 0.004 566.31 16.63 58.31 6 Perambra 0 445.36 4.51 32.56 7 Melady 0 78.07 1.29 8.26 8 Panthalayani 0 126.73 0.46 8.59 9 Vatakara 0.004 77.17 0.01 1.42
10 Thodannur 0 197.38 0.68 5.32 11 Thuneri 0 489.78 0.85 22.75 12 Kunnummel 0 384.28 3.52 29.51 Blocks Total 0.008 3450.86 60.6 258.8 Municipalities Total 0 197.79 1.45 12.34 Corporation Total 0 106.57 0.09 1.02 District Total 0.008 3755.22 62.14 272.16
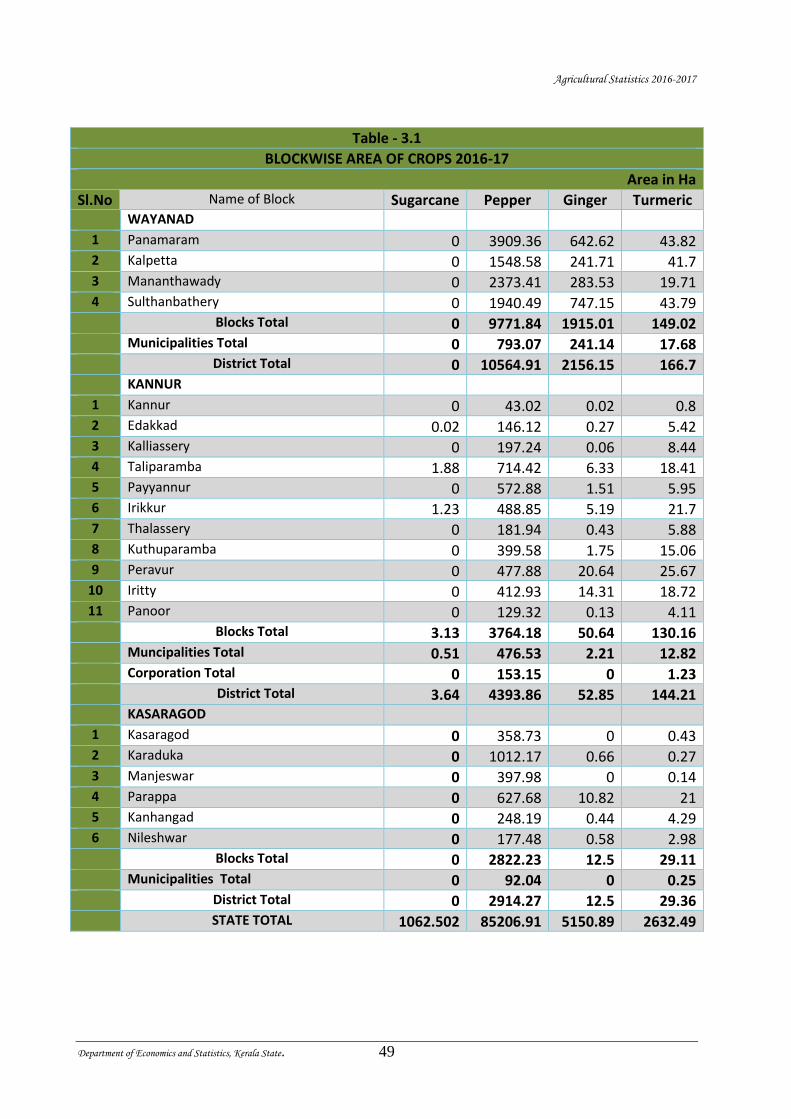
Agricultural Statistics 2016-2017
Department of Economics and Statistics, Kerala State. 49
Table - 3.1
BLOCKWISE AREA OF CROPS 2016-17
Area in Ha
Sl.No Name of Block Sugarcane Pepper Ginger Turmeric WAYANAD
1 Panamaram 0 3909.36 642.62 43.82 2 Kalpetta 0 1548.58 241.71 41.7 3 Mananthawady 0 2373.41 283.53 19.71 4 Sulthanbathery 0 1940.49 747.15 43.79 Blocks Total 0 9771.84 1915.01 149.02 Municipalities Total 0 793.07 241.14 17.68 District Total 0 10564.91 2156.15 166.7 KANNUR
1 Kannur 0 43.02 0.02 0.8 2 Edakkad 0.02 146.12 0.27 5.42 3 Kalliassery 0 197.24 0.06 8.44 4 Taliparamba 1.88 714.42 6.33 18.41 5 Payyannur 0 572.88 1.51 5.95 6 Irikkur 1.23 488.85 5.19 21.7 7 Thalassery 0 181.94 0.43 5.88 8 Kuthuparamba 0 399.58 1.75 15.06 9 Peravur 0 477.88 20.64 25.67
10 Iritty 0 412.93 14.31 18.72 11 Panoor 0 129.32 0.13 4.11 Blocks Total 3.13 3764.18 50.64 130.16 Muncipalities Total 0.51 476.53 2.21 12.82 Corporation Total 0 153.15 0 1.23 District Total 3.64 4393.86 52.85 144.21 KASARAGOD
1 Kasaragod 0 358.73 0 0.43 2 Karaduka 0 1012.17 0.66 0.27 3 Manjeswar 0 397.98 0 0.14 4 Parappa 0 627.68 10.82 21 5 Kanhangad 0 248.19 0.44 4.29 6 Nileshwar 0 177.48 0.58 2.98 Blocks Total 0 2822.23 12.5 29.11 Municipalities Total 0 92.04 0 0.25 District Total 0 2914.27 12.5 29.36
STATE TOTAL 1062.502 85206.91 5150.89 2632.49
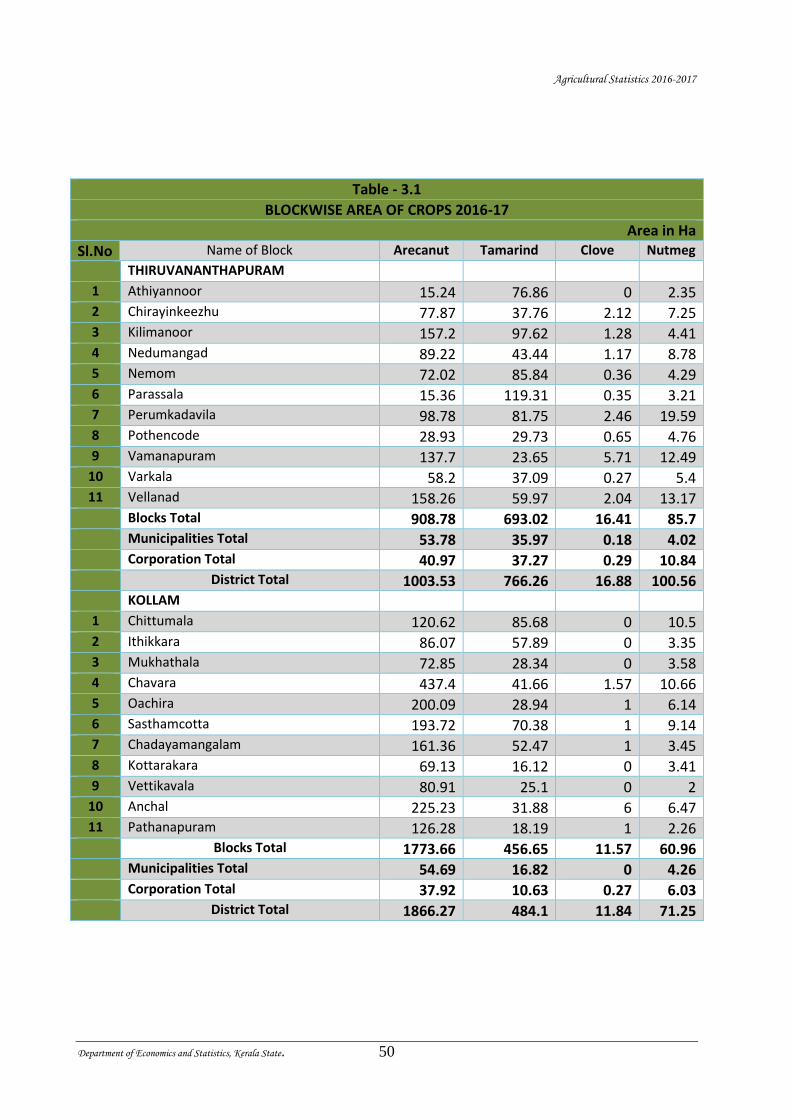
Agricultural Statistics 2016-2017
Department of Economics and Statistics, Kerala State. 50
Table - 3.1
BLOCKWISE AREA OF CROPS 2016-17
Area in Ha
Sl.No Name of Block Arecanut Tamarind Clove Nutmeg
THIRUVANANTHAPURAM
1 Athiyannoor 15.24 76.86 0 2.35 2 Chirayinkeezhu 77.87 37.76 2.12 7.25 3 Kilimanoor 157.2 97.62 1.28 4.41 4 Nedumangad 89.22 43.44 1.17 8.78 5 Nemom 72.02 85.84 0.36 4.29 6 Parassala 15.36 119.31 0.35 3.21 7 Perumkadavila 98.78 81.75 2.46 19.59 8 Pothencode 28.93 29.73 0.65 4.76 9 Vamanapuram 137.7 23.65 5.71 12.49
10 Varkala 58.2 37.09 0.27 5.4 11 Vellanad 158.26 59.97 2.04 13.17 Blocks Total 908.78 693.02 16.41 85.7 Municipalities Total 53.78 35.97 0.18 4.02 Corporation Total 40.97 37.27 0.29 10.84 District Total 1003.53 766.26 16.88 100.56 KOLLAM
1 Chittumala 120.62 85.68 0 10.5 2 Ithikkara 86.07 57.89 0 3.35 3 Mukhathala 72.85 28.34 0 3.58 4 Chavara 437.4 41.66 1.57 10.66 5 Oachira 200.09 28.94 1 6.14 6 Sasthamcotta 193.72 70.38 1 9.14 7 Chadayamangalam 161.36 52.47 1 3.45 8 Kottarakara 69.13 16.12 0 3.41 9 Vettikavala 80.91 25.1 0 2
10 Anchal 225.23 31.88 6 6.47 11 Pathanapuram 126.28 18.19 1 2.26 Blocks Total 1773.66 456.65 11.57 60.96 Municipalities Total 54.69 16.82 0 4.26 Corporation Total 37.92 10.63 0.27 6.03 District Total 1866.27 484.1 11.84 71.25
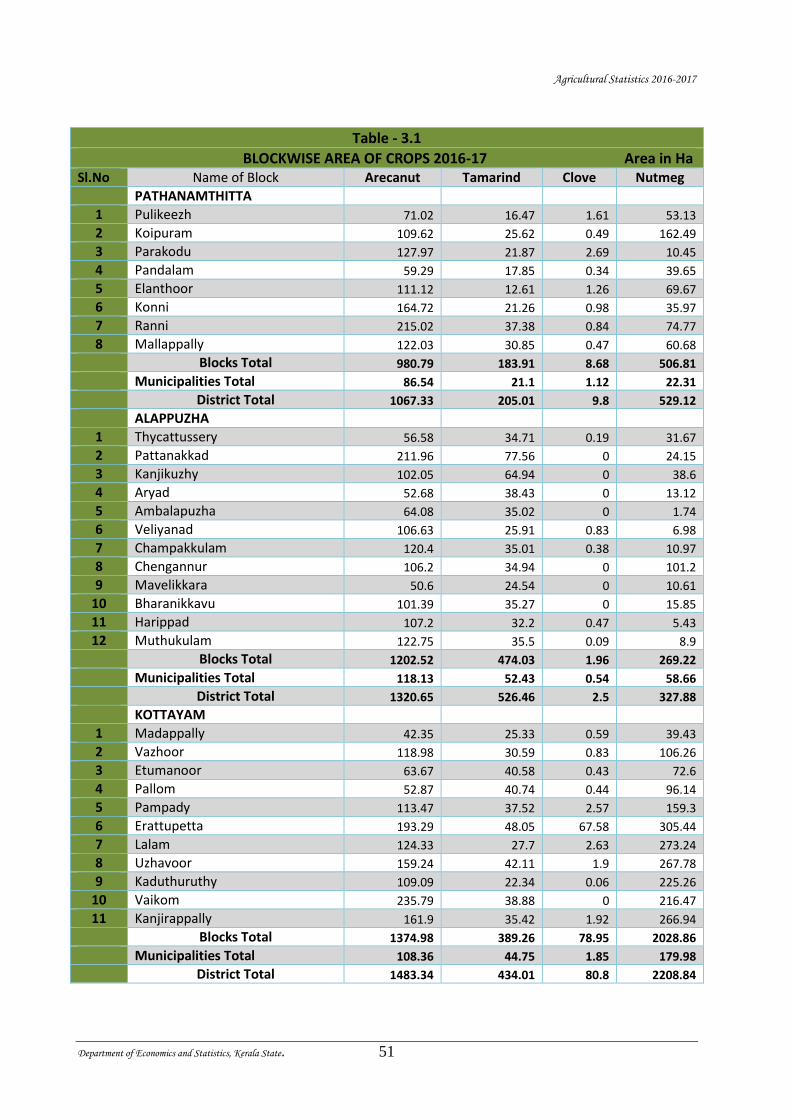
Agricultural Statistics 2016-2017
Department of Economics and Statistics, Kerala State. 51
Table - 3.1
BLOCKWISE AREA OF CROPS 2016-17 Area in Ha Sl.No Name of Block Arecanut Tamarind Clove Nutmeg
PATHANAMTHITTA
1 Pulikeezh 71.02 16.47 1.61 53.13
2 Koipuram 109.62 25.62 0.49 162.49
3 Parakodu 127.97 21.87 2.69 10.45
4 Pandalam 59.29 17.85 0.34 39.65
5 Elanthoor 111.12 12.61 1.26 69.67
6 Konni 164.72 21.26 0.98 35.97
7 Ranni 215.02 37.38 0.84 74.77
8 Mallappally 122.03 30.85 0.47 60.68
Blocks Total 980.79 183.91 8.68 506.81
Municipalities Total 86.54 21.1 1.12 22.31
District Total 1067.33 205.01 9.8 529.12
ALAPPUZHA
1 Thycattussery 56.58 34.71 0.19 31.67
2 Pattanakkad 211.96 77.56 0 24.15
3 Kanjikuzhy 102.05 64.94 0 38.6
4 Aryad 52.68 38.43 0 13.12
5 Ambalapuzha 64.08 35.02 0 1.74
6 Veliyanad 106.63 25.91 0.83 6.98
7 Champakkulam 120.4 35.01 0.38 10.97
8 Chengannur 106.2 34.94 0 101.2
9 Mavelikkara 50.6 24.54 0 10.61
10 Bharanikkavu 101.39 35.27 0 15.85
11 Harippad 107.2 32.2 0.47 5.43
12 Muthukulam 122.75 35.5 0.09 8.9
Blocks Total 1202.52 474.03 1.96 269.22
Municipalities Total 118.13 52.43 0.54 58.66
District Total 1320.65 526.46 2.5 327.88
KOTTAYAM
1 Madappally 42.35 25.33 0.59 39.43
2 Vazhoor 118.98 30.59 0.83 106.26
3 Etumanoor 63.67 40.58 0.43 72.6
4 Pallom 52.87 40.74 0.44 96.14
5 Pampady 113.47 37.52 2.57 159.3
6 Erattupetta 193.29 48.05 67.58 305.44
7 Lalam 124.33 27.7 2.63 273.24
8 Uzhavoor 159.24 42.11 1.9 267.78
9 Kaduthuruthy 109.09 22.34 0.06 225.26
10 Vaikom 235.79 38.88 0 216.47
11 Kanjirappally 161.9 35.42 1.92 266.94
Blocks Total 1374.98 389.26 78.95 2028.86
Municipalities Total 108.36 44.75 1.85 179.98
District Total 1483.34 434.01 80.8 2208.84
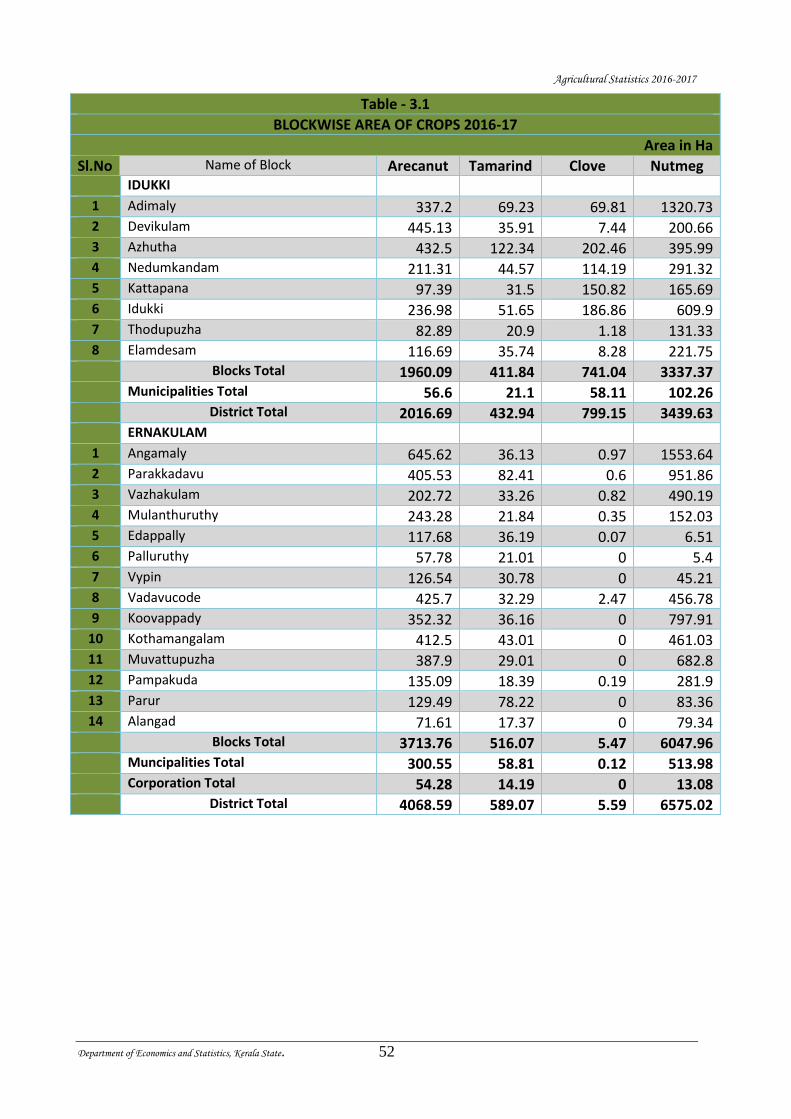
Agricultural Statistics 2016-2017
Department of Economics and Statistics, Kerala State. 52
Table - 3.1
BLOCKWISE AREA OF CROPS 2016-17
Area in Ha
Sl.No Name of Block Arecanut Tamarind Clove Nutmeg IDUKKI
1 Adimaly 337.2 69.23 69.81 1320.73 2 Devikulam 445.13 35.91 7.44 200.66 3 Azhutha 432.5 122.34 202.46 395.99 4 Nedumkandam 211.31 44.57 114.19 291.32 5 Kattapana 97.39 31.5 150.82 165.69 6 Idukki 236.98 51.65 186.86 609.9 7 Thodupuzha 82.89 20.9 1.18 131.33 8 Elamdesam 116.69 35.74 8.28 221.75 Blocks Total 1960.09 411.84 741.04 3337.37 Municipalities Total 56.6 21.1 58.11 102.26 District Total 2016.69 432.94 799.15 3439.63 ERNAKULAM
1 Angamaly 645.62 36.13 0.97 1553.64 2 Parakkadavu 405.53 82.41 0.6 951.86 3 Vazhakulam 202.72 33.26 0.82 490.19 4 Mulanthuruthy 243.28 21.84 0.35 152.03 5 Edappally 117.68 36.19 0.07 6.51 6 Palluruthy 57.78 21.01 0 5.4 7 Vypin 126.54 30.78 0 45.21 8 Vadavucode 425.7 32.29 2.47 456.78 9 Koovappady 352.32 36.16 0 797.91
10 Kothamangalam 412.5 43.01 0 461.03 11 Muvattupuzha 387.9 29.01 0 682.8 12 Pampakuda 135.09 18.39 0.19 281.9 13 Parur 129.49 78.22 0 83.36 14 Alangad 71.61 17.37 0 79.34 Blocks Total 3713.76 516.07 5.47 6047.96 Muncipalities Total 300.55 58.81 0.12 513.98 Corporation Total 54.28 14.19 0 13.08 District Total 4068.59 589.07 5.59 6575.02
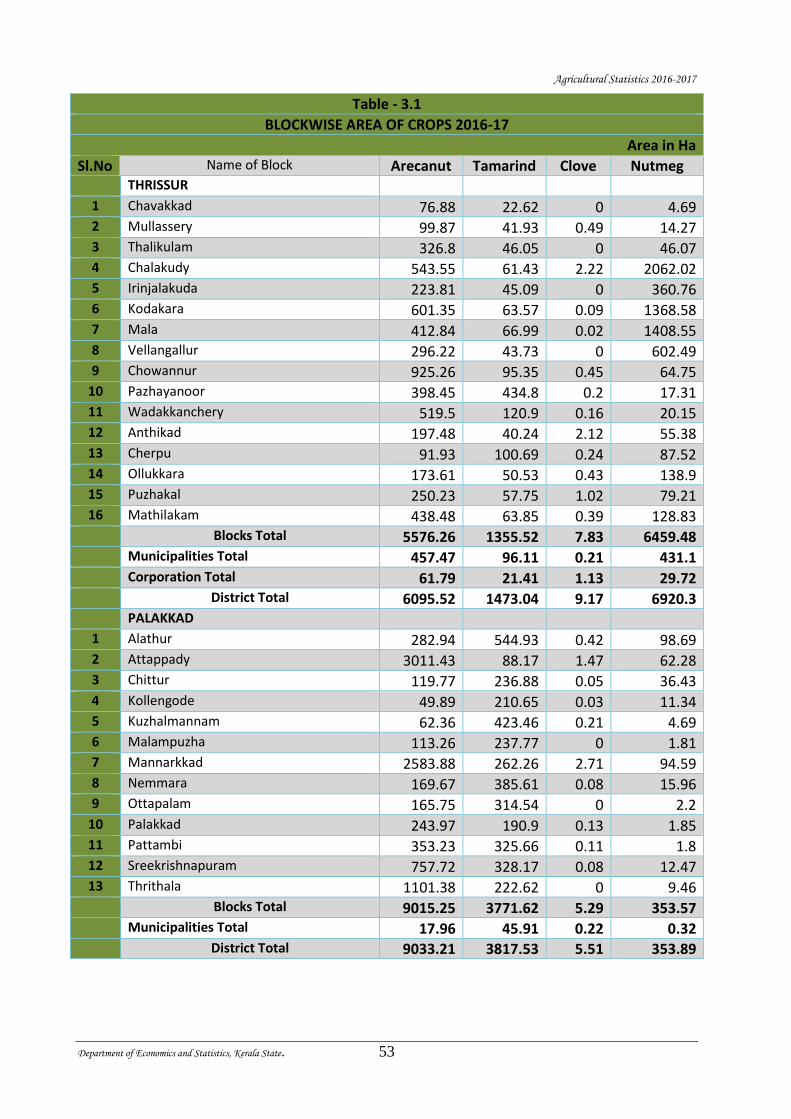
Agricultural Statistics 2016-2017
Department of Economics and Statistics, Kerala State. 53
Table - 3.1
BLOCKWISE AREA OF CROPS 2016-17
Area in Ha
Sl.No Name of Block Arecanut Tamarind Clove Nutmeg THRISSUR
1 Chavakkad 76.88 22.62 0 4.69 2 Mullassery 99.87 41.93 0.49 14.27 3 Thalikulam 326.8 46.05 0 46.07 4 Chalakudy 543.55 61.43 2.22 2062.02 5 Irinjalakuda 223.81 45.09 0 360.76 6 Kodakara 601.35 63.57 0.09 1368.58 7 Mala 412.84 66.99 0.02 1408.55 8 Vellangallur 296.22 43.73 0 602.49 9 Chowannur 925.26 95.35 0.45 64.75
10 Pazhayanoor 398.45 434.8 0.2 17.31 11 Wadakkanchery 519.5 120.9 0.16 20.15 12 Anthikad 197.48 40.24 2.12 55.38 13 Cherpu 91.93 100.69 0.24 87.52 14 Ollukkara 173.61 50.53 0.43 138.9 15 Puzhakal 250.23 57.75 1.02 79.21 16 Mathilakam 438.48 63.85 0.39 128.83 Blocks Total 5576.26 1355.52 7.83 6459.48 Municipalities Total 457.47 96.11 0.21 431.1 Corporation Total 61.79 21.41 1.13 29.72 District Total 6095.52 1473.04 9.17 6920.3 PALAKKAD
1 Alathur 282.94 544.93 0.42 98.69 2 Attappady 3011.43 88.17 1.47 62.28 3 Chittur 119.77 236.88 0.05 36.43 4 Kollengode 49.89 210.65 0.03 11.34 5 Kuzhalmannam 62.36 423.46 0.21 4.69 6 Malampuzha 113.26 237.77 0 1.81 7 Mannarkkad 2583.88 262.26 2.71 94.59 8 Nemmara 169.67 385.61 0.08 15.96 9 Ottapalam 165.75 314.54 0 2.2
10 Palakkad 243.97 190.9 0.13 1.85 11 Pattambi 353.23 325.66 0.11 1.8 12 Sreekrishnapuram 757.72 328.17 0.08 12.47 13 Thrithala 1101.38 222.62 0 9.46 Blocks Total 9015.25 3771.62 5.29 353.57 Municipalities Total 17.96 45.91 0.22 0.32 District Total 9033.21 3817.53 5.51 353.89
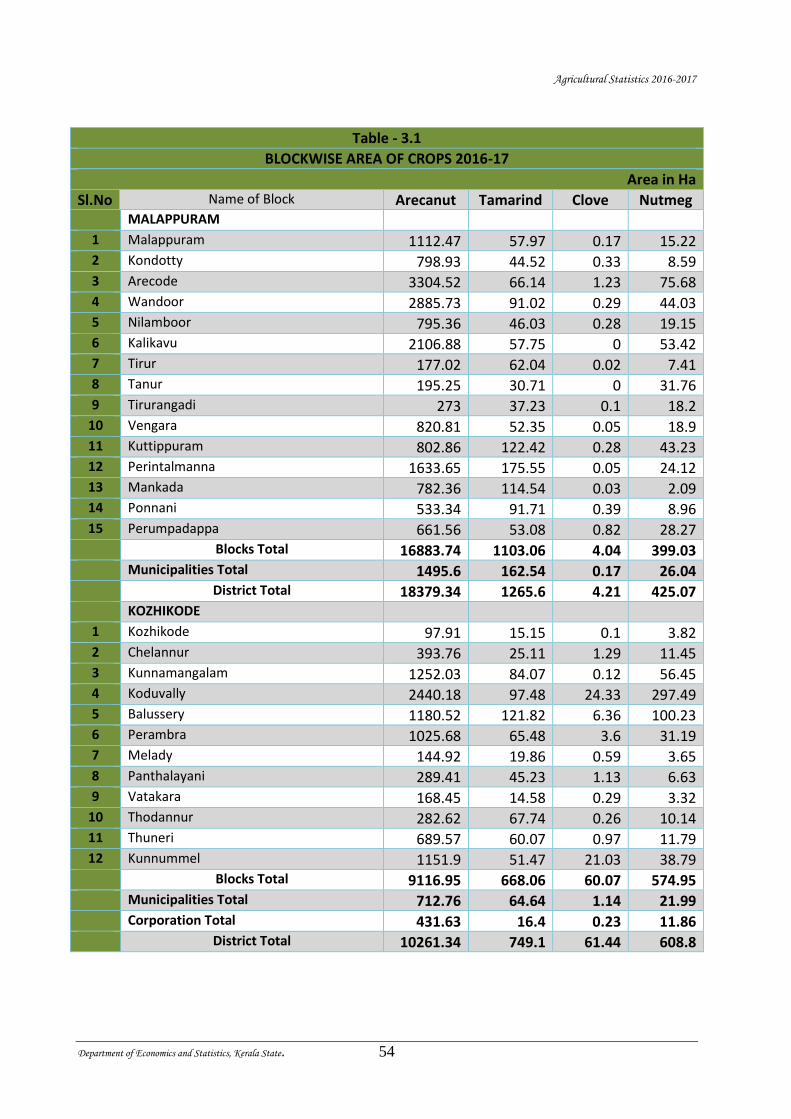
Agricultural Statistics 2016-2017
Department of Economics and Statistics, Kerala State. 54
Table - 3.1
BLOCKWISE AREA OF CROPS 2016-17
Area in Ha
Sl.No Name of Block Arecanut Tamarind Clove Nutmeg MALAPPURAM
1 Malappuram 1112.47 57.97 0.17 15.22 2 Kondotty 798.93 44.52 0.33 8.59 3 Arecode 3304.52 66.14 1.23 75.68 4 Wandoor 2885.73 91.02 0.29 44.03 5 Nilamboor 795.36 46.03 0.28 19.15 6 Kalikavu 2106.88 57.75 0 53.42 7 Tirur 177.02 62.04 0.02 7.41 8 Tanur 195.25 30.71 0 31.76 9 Tirurangadi 273 37.23 0.1 18.2
10 Vengara 820.81 52.35 0.05 18.9 11 Kuttippuram 802.86 122.42 0.28 43.23 12 Perintalmanna 1633.65 175.55 0.05 24.12 13 Mankada 782.36 114.54 0.03 2.09 14 Ponnani 533.34 91.71 0.39 8.96 15 Perumpadappa 661.56 53.08 0.82 28.27 Blocks Total 16883.74 1103.06 4.04 399.03 Municipalities Total 1495.6 162.54 0.17 26.04 District Total 18379.34 1265.6 4.21 425.07 KOZHIKODE
1 Kozhikode 97.91 15.15 0.1 3.82 2 Chelannur 393.76 25.11 1.29 11.45 3 Kunnamangalam 1252.03 84.07 0.12 56.45 4 Koduvally 2440.18 97.48 24.33 297.49 5 Balussery 1180.52 121.82 6.36 100.23 6 Perambra 1025.68 65.48 3.6 31.19 7 Melady 144.92 19.86 0.59 3.65 8 Panthalayani 289.41 45.23 1.13 6.63 9 Vatakara 168.45 14.58 0.29 3.32
10 Thodannur 282.62 67.74 0.26 10.14 11 Thuneri 689.57 60.07 0.97 11.79 12 Kunnummel 1151.9 51.47 21.03 38.79 Blocks Total 9116.95 668.06 60.07 574.95 Municipalities Total 712.76 64.64 1.14 21.99 Corporation Total 431.63 16.4 0.23 11.86 District Total 10261.34 749.1 61.44 608.8
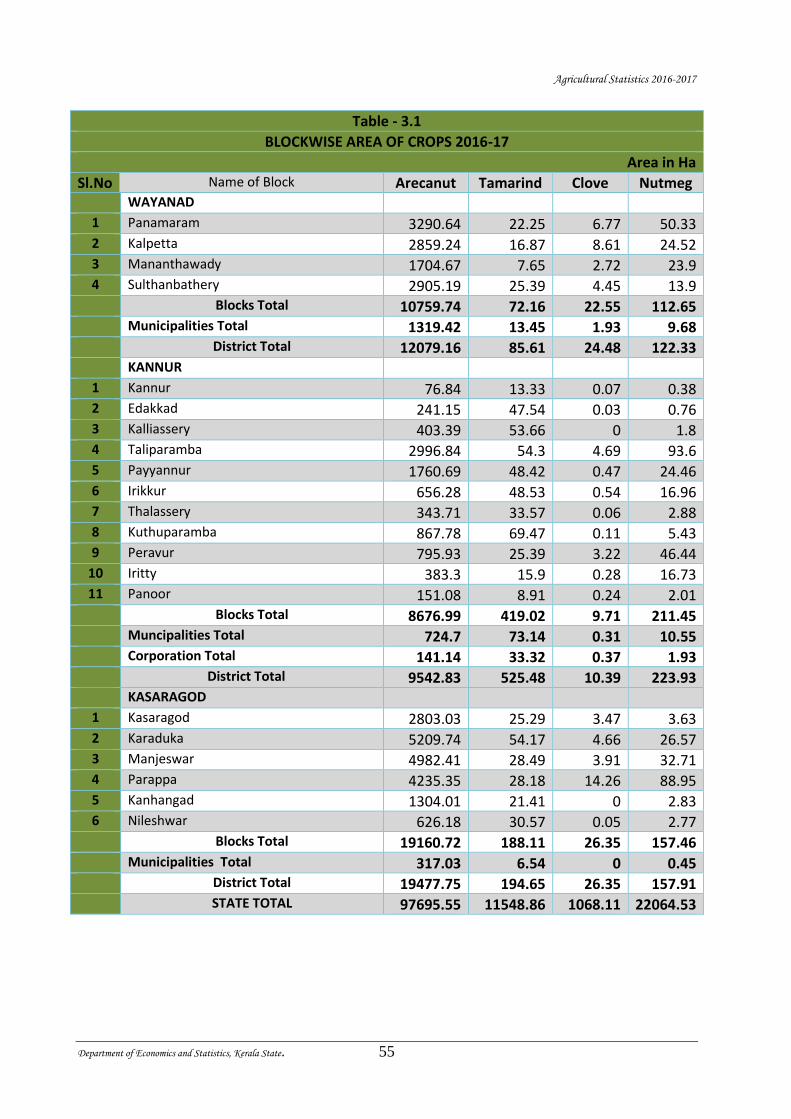
Agricultural Statistics 2016-2017
Department of Economics and Statistics, Kerala State. 55
Table - 3.1
BLOCKWISE AREA OF CROPS 2016-17
Area in Ha
Sl.No Name of Block Arecanut Tamarind Clove Nutmeg WAYANAD
1 Panamaram 3290.64 22.25 6.77 50.33 2 Kalpetta 2859.24 16.87 8.61 24.52 3 Mananthawady 1704.67 7.65 2.72 23.9 4 Sulthanbathery 2905.19 25.39 4.45 13.9 Blocks Total 10759.74 72.16 22.55 112.65 Municipalities Total 1319.42 13.45 1.93 9.68 District Total 12079.16 85.61 24.48 122.33 KANNUR
1 Kannur 76.84 13.33 0.07 0.38 2 Edakkad 241.15 47.54 0.03 0.76 3 Kalliassery 403.39 53.66 0 1.8 4 Taliparamba 2996.84 54.3 4.69 93.6 5 Payyannur 1760.69 48.42 0.47 24.46 6 Irikkur 656.28 48.53 0.54 16.96 7 Thalassery 343.71 33.57 0.06 2.88 8 Kuthuparamba 867.78 69.47 0.11 5.43 9 Peravur 795.93 25.39 3.22 46.44
10 Iritty 383.3 15.9 0.28 16.73 11 Panoor 151.08 8.91 0.24 2.01 Blocks Total 8676.99 419.02 9.71 211.45 Muncipalities Total 724.7 73.14 0.31 10.55 Corporation Total 141.14 33.32 0.37 1.93 District Total 9542.83 525.48 10.39 223.93 KASARAGOD
1 Kasaragod 2803.03 25.29 3.47 3.63 2 Karaduka 5209.74 54.17 4.66 26.57 3 Manjeswar 4982.41 28.49 3.91 32.71 4 Parappa 4235.35 28.18 14.26 88.95 5 Kanhangad 1304.01 21.41 0 2.83 6 Nileshwar 626.18 30.57 0.05 2.77 Blocks Total 19160.72 188.11 26.35 157.46 Municipalities Total 317.03 6.54 0 0.45 District Total 19477.75 194.65 26.35 157.91
STATE TOTAL 97695.55 11548.86 1068.11 22064.53
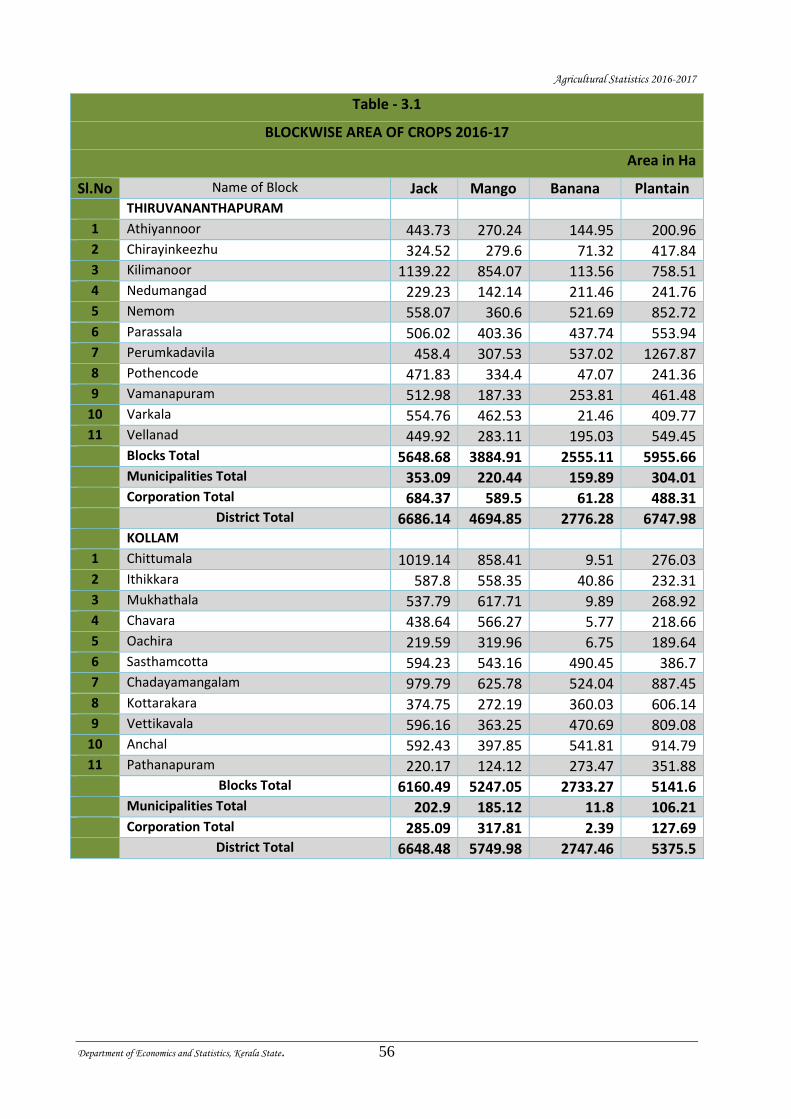
Agricultural Statistics 2016-2017
Department of Economics and Statistics, Kerala State. 56
Table - 3.1
BLOCKWISE AREA OF CROPS 2016-17
Area in Ha
Sl.No Name of Block Jack Mango Banana Plantain THIRUVANANTHAPURAM
1 Athiyannoor 443.73 270.24 144.95 200.96 2 Chirayinkeezhu 324.52 279.6 71.32 417.84 3 Kilimanoor 1139.22 854.07 113.56 758.51 4 Nedumangad 229.23 142.14 211.46 241.76 5 Nemom 558.07 360.6 521.69 852.72 6 Parassala 506.02 403.36 437.74 553.94 7 Perumkadavila 458.4 307.53 537.02 1267.87 8 Pothencode 471.83 334.4 47.07 241.36 9 Vamanapuram 512.98 187.33 253.81 461.48
10 Varkala 554.76 462.53 21.46 409.77 11 Vellanad 449.92 283.11 195.03 549.45 Blocks Total 5648.68 3884.91 2555.11 5955.66 Municipalities Total 353.09 220.44 159.89 304.01 Corporation Total 684.37 589.5 61.28 488.31 District Total 6686.14 4694.85 2776.28 6747.98 KOLLAM
1 Chittumala 1019.14 858.41 9.51 276.03 2 Ithikkara 587.8 558.35 40.86 232.31 3 Mukhathala 537.79 617.71 9.89 268.92 4 Chavara 438.64 566.27 5.77 218.66 5 Oachira 219.59 319.96 6.75 189.64 6 Sasthamcotta 594.23 543.16 490.45 386.7 7 Chadayamangalam 979.79 625.78 524.04 887.45 8 Kottarakara 374.75 272.19 360.03 606.14 9 Vettikavala 596.16 363.25 470.69 809.08
10 Anchal 592.43 397.85 541.81 914.79 11 Pathanapuram 220.17 124.12 273.47 351.88 Blocks Total 6160.49 5247.05 2733.27 5141.6 Municipalities Total 202.9 185.12 11.8 106.21 Corporation Total 285.09 317.81 2.39 127.69 District Total 6648.48 5749.98 2747.46 5375.5

Agricultural Statistics 2016-2017
Department of Economics and Statistics, Kerala State. 57
Table - 3.1
BLOCKWISE AREA OF CROPS 2016-17
Area in Ha
Sl.No Name of Block Jack Mango Banana Plantain PATHANAMTHITTA
1 Pulikeezh 224.94 187.07 73.24 125.21
2 Koipuram 377.38 290.01 193.49 224.55
3 Parakodu 360.36 216.62 621.85 359.29
4 Pandalam 295.47 196.47 146.86 125.2
5 Elanthoor 223.61 169.55 155.7 260.06
6 Konni 295.23 119.52 218.35 220.19
7 Ranni 446.87 249.14 387.59 290.74
8 Mallappally 323.91 193.7 151.26 200.5
Blocks Total 2547.77 1622.08 1948.34 1805.74
Municipalities Total 368.87 262.58 127.6 267.44
District Total 2916.64 1884.66 2075.94 2073.18
ALAPPUZHA
1 Thycattussery 63.13 138.13 3.97 74.98
2 Pattanakkad 198.52 382.95 1.51 196.67
3 Kanjikuzhy 152.01 311.77 4.63 220.84
4 Aryad 141.91 327.98 1.15 67.61
5 Ambalapuzha 140.29 225.31 2.15 52.22
6 Veliyanad 115.82 483.86 9.14 278.55
7 Champakkulam 166.96 444.65 5.23 266.31
8 Chengannur 349.26 415.01 223.81 143.76
9 Mavelikkara 204.01 263.4 22.33 168.09
10 Bharanikkavu 402.6 284.47 208.96 261.05
11 Harippad 242.33 617.97 3.2 157.81
12 Muthukulam 201.18 428.13 1.23 112.86
Blocks Total 2378.02 4323.63 487.31 2000.75
Municipalities Total 352.38 495.05 31.48 157.38
District Total 2730.4 4818.68 518.79 2158.13
KOTTAYAM
1 Madappally 352.64 214.69 193.3 154.63
2 Vazhoor 251.12 122.29 113.74 203.16
3 Etumanoor 206.75 243.15 79.79 272.82
4 Pallom 333.66 266.38 181.87 249.65
5 Pampady 343.75 232.15 234.82 286.17
6 Erattupetta 398.34 215.62 394.46 290.23
7 Lalam 276.38 183.99 297.77 231.69
8 Uzhavoor 362.16 230.14 486.77 303.61
9 Kaduthuruthy 310.61 210.81 304.6 263.22
10 Vaikom 226.3 275.51 41.72 132.55
11 Kanjirappally 453.66 228.2 321.88 236.33
Blocks Total 3515.37 2422.93 2650.72 2624.06
Municipalities Total 425.49 382.47 99.65 195.89
District Total 3940.86 2805.4 2750.37 2819.95
(Table – 3.1 Contd….)
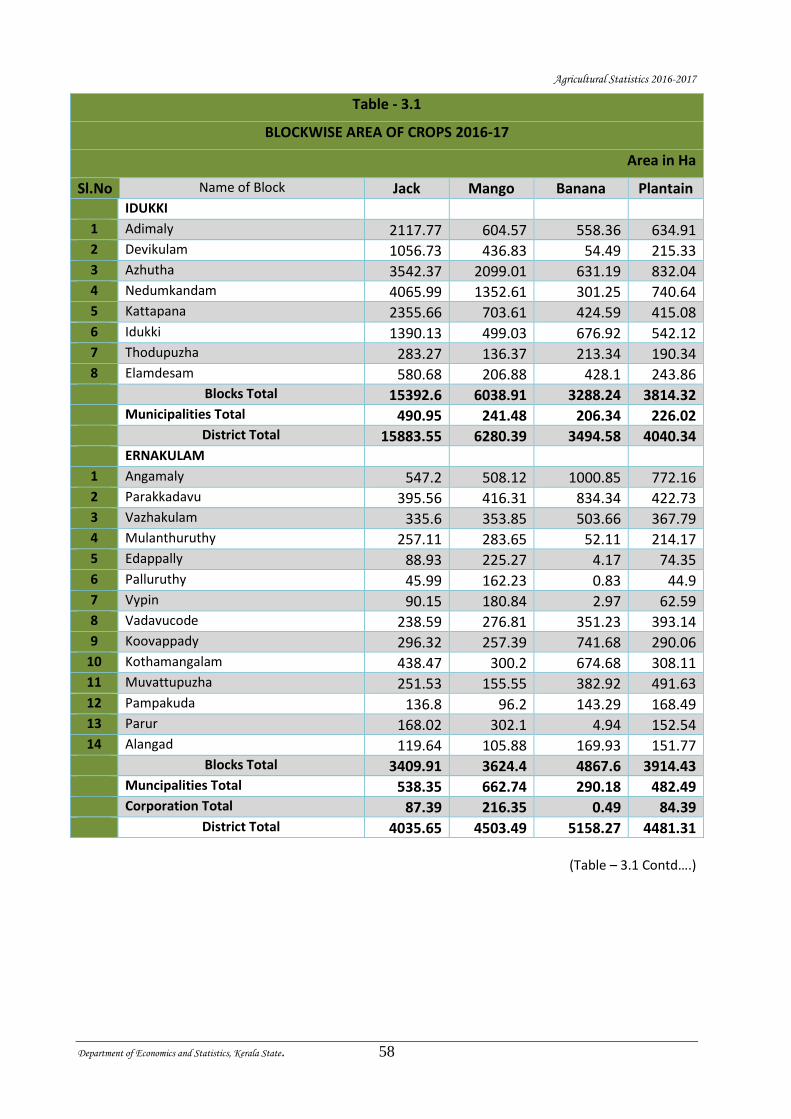
Agricultural Statistics 2016-2017
Department of Economics and Statistics, Kerala State. 58
Table - 3.1
BLOCKWISE AREA OF CROPS 2016-17
Area in Ha
Sl.No Name of Block Jack Mango Banana Plantain IDUKKI
1 Adimaly 2117.77 604.57 558.36 634.91 2 Devikulam 1056.73 436.83 54.49 215.33 3 Azhutha 3542.37 2099.01 631.19 832.04 4 Nedumkandam 4065.99 1352.61 301.25 740.64 5 Kattapana 2355.66 703.61 424.59 415.08 6 Idukki 1390.13 499.03 676.92 542.12 7 Thodupuzha 283.27 136.37 213.34 190.34 8 Elamdesam 580.68 206.88 428.1 243.86 Blocks Total 15392.6 6038.91 3288.24 3814.32 Municipalities Total 490.95 241.48 206.34 226.02 District Total 15883.55 6280.39 3494.58 4040.34 ERNAKULAM
1 Angamaly 547.2 508.12 1000.85 772.16 2 Parakkadavu 395.56 416.31 834.34 422.73 3 Vazhakulam 335.6 353.85 503.66 367.79 4 Mulanthuruthy 257.11 283.65 52.11 214.17 5 Edappally 88.93 225.27 4.17 74.35 6 Palluruthy 45.99 162.23 0.83 44.9 7 Vypin 90.15 180.84 2.97 62.59 8 Vadavucode 238.59 276.81 351.23 393.14 9 Koovappady 296.32 257.39 741.68 290.06
10 Kothamangalam 438.47 300.2 674.68 308.11 11 Muvattupuzha 251.53 155.55 382.92 491.63 12 Pampakuda 136.8 96.2 143.29 168.49 13 Parur 168.02 302.1 4.94 152.54 14 Alangad 119.64 105.88 169.93 151.77 Blocks Total 3409.91 3624.4 4867.6 3914.43 Muncipalities Total 538.35 662.74 290.18 482.49 Corporation Total 87.39 216.35 0.49 84.39 District Total 4035.65 4503.49 5158.27 4481.31
(Table – 3.1 Contd….)
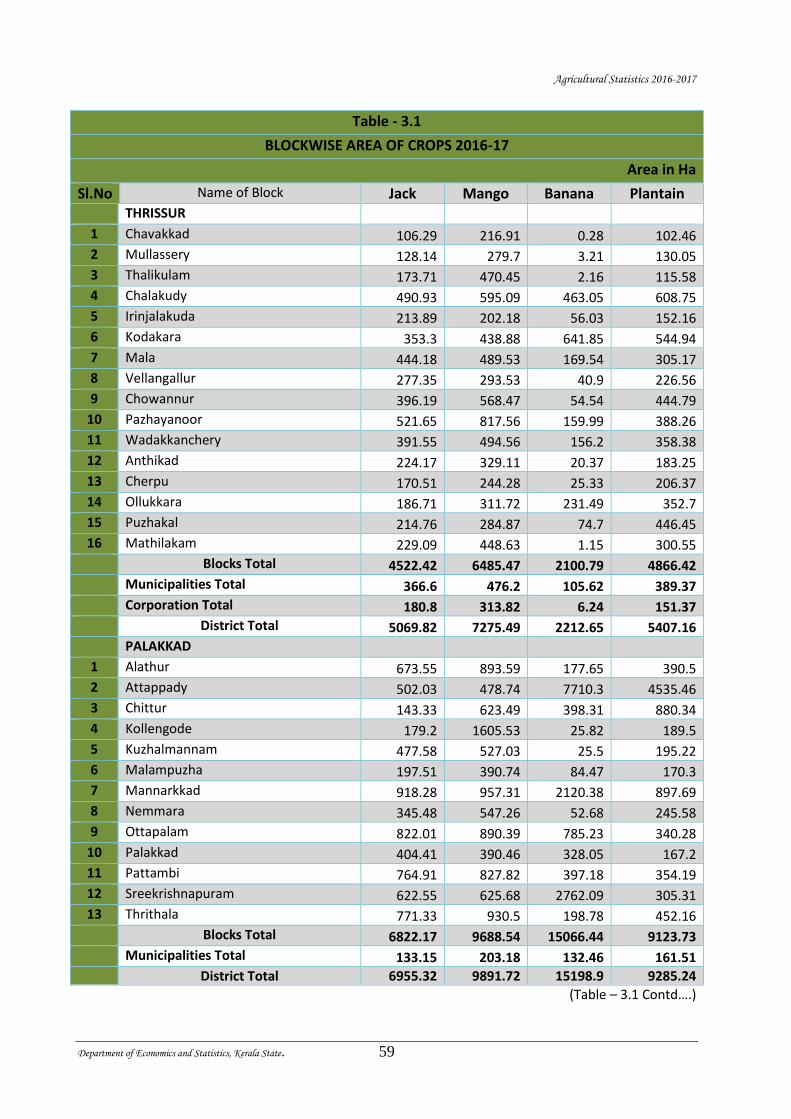
Agricultural Statistics 2016-2017
Department of Economics and Statistics, Kerala State. 59
Table - 3.1
BLOCKWISE AREA OF CROPS 2016-17
Area in Ha
Sl.No Name of Block Jack Mango Banana Plantain THRISSUR
1 Chavakkad 106.29 216.91 0.28 102.46
2 Mullassery 128.14 279.7 3.21 130.05
3 Thalikulam 173.71 470.45 2.16 115.58
4 Chalakudy 490.93 595.09 463.05 608.75
5 Irinjalakuda 213.89 202.18 56.03 152.16
6 Kodakara 353.3 438.88 641.85 544.94
7 Mala 444.18 489.53 169.54 305.17
8 Vellangallur 277.35 293.53 40.9 226.56
9 Chowannur 396.19 568.47 54.54 444.79
10 Pazhayanoor 521.65 817.56 159.99 388.26
11 Wadakkanchery 391.55 494.56 156.2 358.38
12 Anthikad 224.17 329.11 20.37 183.25
13 Cherpu 170.51 244.28 25.33 206.37
14 Ollukkara 186.71 311.72 231.49 352.7
15 Puzhakal 214.76 284.87 74.7 446.45
16 Mathilakam 229.09 448.63 1.15 300.55
Blocks Total 4522.42 6485.47 2100.79 4866.42
Municipalities Total 366.6 476.2 105.62 389.37
Corporation Total 180.8 313.82 6.24 151.37
District Total 5069.82 7275.49 2212.65 5407.16
PALAKKAD
1 Alathur 673.55 893.59 177.65 390.5
2 Attappady 502.03 478.74 7710.3 4535.46
3 Chittur 143.33 623.49 398.31 880.34
4 Kollengode 179.2 1605.53 25.82 189.5
5 Kuzhalmannam 477.58 527.03 25.5 195.22
6 Malampuzha 197.51 390.74 84.47 170.3
7 Mannarkkad 918.28 957.31 2120.38 897.69
8 Nemmara 345.48 547.26 52.68 245.58
9 Ottapalam 822.01 890.39 785.23 340.28
10 Palakkad 404.41 390.46 328.05 167.2
11 Pattambi 764.91 827.82 397.18 354.19
12 Sreekrishnapuram 622.55 625.68 2762.09 305.31
13 Thrithala 771.33 930.5 198.78 452.16
Blocks Total 6822.17 9688.54 15066.44 9123.73
Municipalities Total 133.15 203.18 132.46 161.51
District Total 6955.32 9891.72 15198.9 9285.24
(Table – 3.1 Contd….)
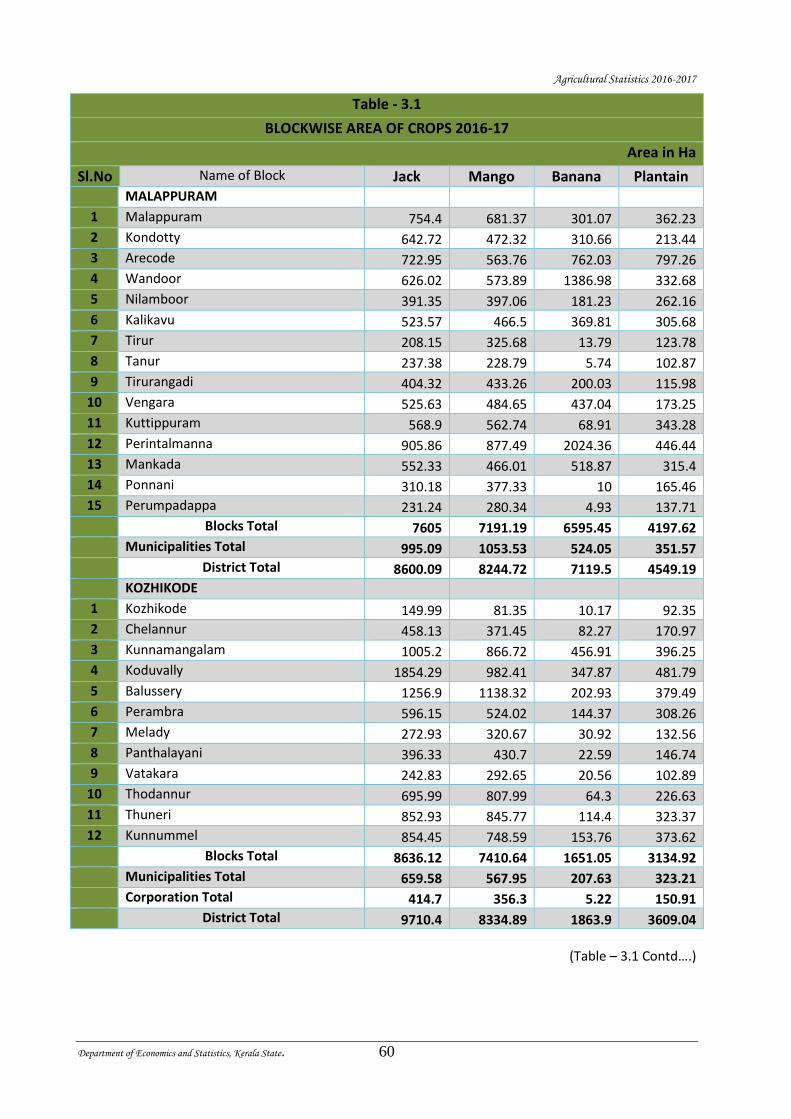
Agricultural Statistics 2016-2017
Department of Economics and Statistics, Kerala State. 60
Table - 3.1
BLOCKWISE AREA OF CROPS 2016-17
Area in Ha
Sl.No Name of Block Jack Mango Banana Plantain MALAPPURAM
1 Malappuram 754.4 681.37 301.07 362.23
2 Kondotty 642.72 472.32 310.66 213.44
3 Arecode 722.95 563.76 762.03 797.26
4 Wandoor 626.02 573.89 1386.98 332.68
5 Nilamboor 391.35 397.06 181.23 262.16
6 Kalikavu 523.57 466.5 369.81 305.68
7 Tirur 208.15 325.68 13.79 123.78
8 Tanur 237.38 228.79 5.74 102.87
9 Tirurangadi 404.32 433.26 200.03 115.98
10 Vengara 525.63 484.65 437.04 173.25
11 Kuttippuram 568.9 562.74 68.91 343.28
12 Perintalmanna 905.86 877.49 2024.36 446.44
13 Mankada 552.33 466.01 518.87 315.4
14 Ponnani 310.18 377.33 10 165.46
15 Perumpadappa 231.24 280.34 4.93 137.71
Blocks Total 7605 7191.19 6595.45 4197.62
Municipalities Total 995.09 1053.53 524.05 351.57
District Total 8600.09 8244.72 7119.5 4549.19
KOZHIKODE
1 Kozhikode 149.99 81.35 10.17 92.35
2 Chelannur 458.13 371.45 82.27 170.97
3 Kunnamangalam 1005.2 866.72 456.91 396.25
4 Koduvally 1854.29 982.41 347.87 481.79
5 Balussery 1256.9 1138.32 202.93 379.49
6 Perambra 596.15 524.02 144.37 308.26
7 Melady 272.93 320.67 30.92 132.56
8 Panthalayani 396.33 430.7 22.59 146.74
9 Vatakara 242.83 292.65 20.56 102.89
10 Thodannur 695.99 807.99 64.3 226.63
11 Thuneri 852.93 845.77 114.4 323.37
12 Kunnummel 854.45 748.59 153.76 373.62
Blocks Total 8636.12 7410.64 1651.05 3134.92
Municipalities Total 659.58 567.95 207.63 323.21
Corporation Total 414.7 356.3 5.22 150.91
District Total 9710.4 8334.89 1863.9 3609.04
(Table – 3.1 Contd….)
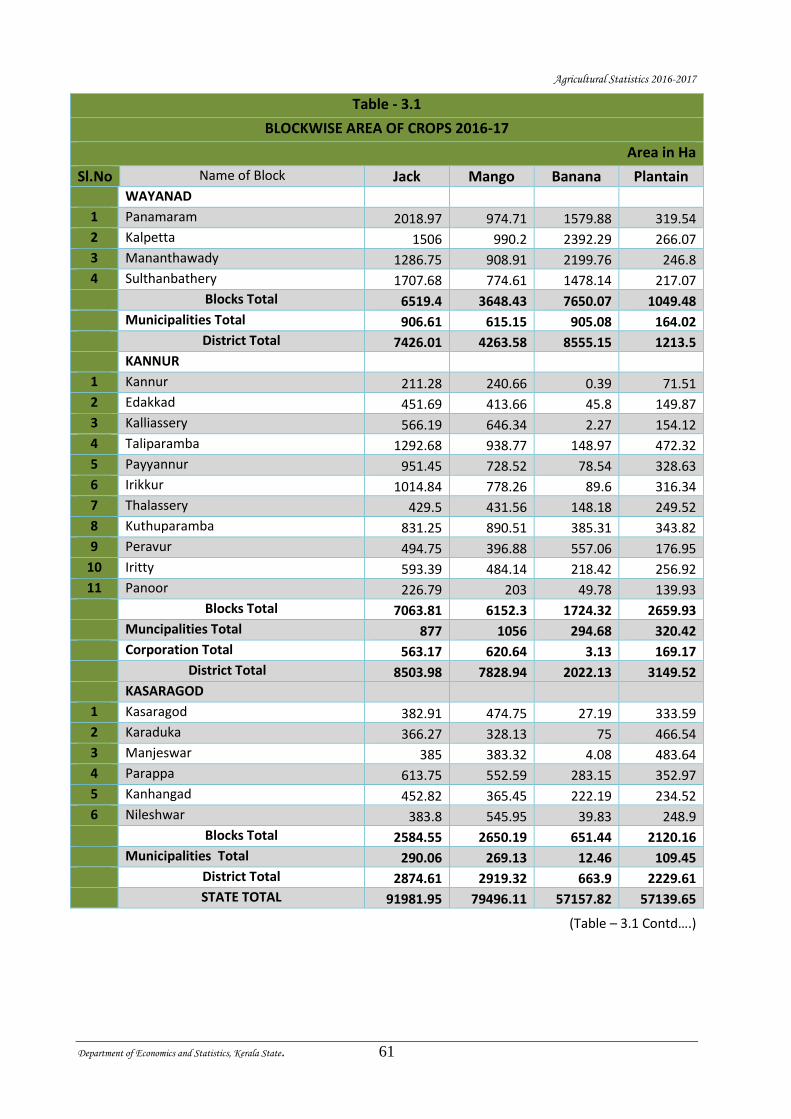
Agricultural Statistics 2016-2017
Department of Economics and Statistics, Kerala State. 61
Table - 3.1
BLOCKWISE AREA OF CROPS 2016-17
Area in Ha
Sl.No Name of Block Jack Mango Banana Plantain WAYANAD
1 Panamaram 2018.97 974.71 1579.88 319.54
2 Kalpetta 1506 990.2 2392.29 266.07
3 Mananthawady 1286.75 908.91 2199.76 246.8
4 Sulthanbathery 1707.68 774.61 1478.14 217.07
Blocks Total 6519.4 3648.43 7650.07 1049.48
Municipalities Total 906.61 615.15 905.08 164.02
District Total 7426.01 4263.58 8555.15 1213.5
KANNUR
1 Kannur 211.28 240.66 0.39 71.51
2 Edakkad 451.69 413.66 45.8 149.87
3 Kalliassery 566.19 646.34 2.27 154.12
4 Taliparamba 1292.68 938.77 148.97 472.32
5 Payyannur 951.45 728.52 78.54 328.63
6 Irikkur 1014.84 778.26 89.6 316.34
7 Thalassery 429.5 431.56 148.18 249.52
8 Kuthuparamba 831.25 890.51 385.31 343.82
9 Peravur 494.75 396.88 557.06 176.95
10 Iritty 593.39 484.14 218.42 256.92
11 Panoor 226.79 203 49.78 139.93
Blocks Total 7063.81 6152.3 1724.32 2659.93
Muncipalities Total 877 1056 294.68 320.42
Corporation Total 563.17 620.64 3.13 169.17
District Total 8503.98 7828.94 2022.13 3149.52
KASARAGOD
1 Kasaragod 382.91 474.75 27.19 333.59
2 Karaduka 366.27 328.13 75 466.54
3 Manjeswar 385 383.32 4.08 483.64
4 Parappa 613.75 552.59 283.15 352.97
5 Kanhangad 452.82 365.45 222.19 234.52
6 Nileshwar 383.8 545.95 39.83 248.9
Blocks Total 2584.55 2650.19 651.44 2120.16
Municipalities Total 290.06 269.13 12.46 109.45
District Total 2874.61 2919.32 663.9 2229.61
STATE TOTAL 91981.95 79496.11 57157.82 57139.65
(Table – 3.1 Contd….)
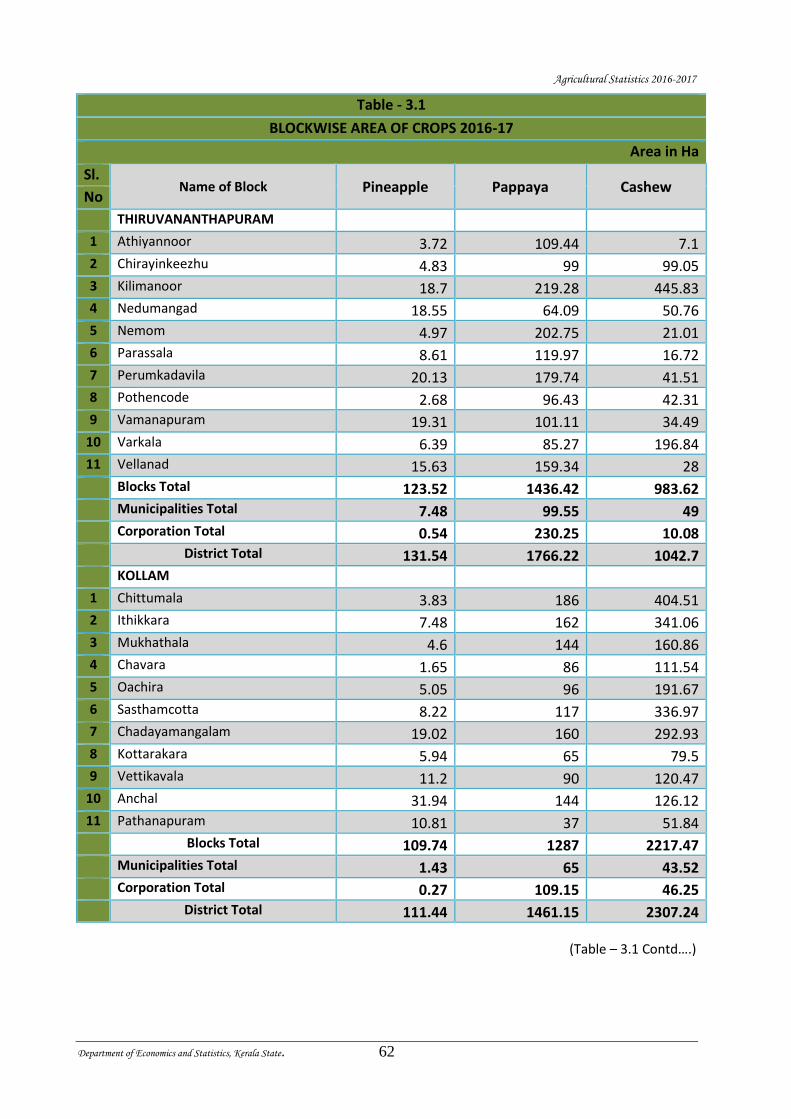
Agricultural Statistics 2016-2017
Department of Economics and Statistics, Kerala State. 62
Table - 3.1
BLOCKWISE AREA OF CROPS 2016-17
Area in Ha
Sl. Name of Block Pineapple Pappaya Cashew
No
THIRUVANANTHAPURAM
1 Athiyannoor 3.72 109.44 7.1 2 Chirayinkeezhu 4.83 99 99.05 3 Kilimanoor 18.7 219.28 445.83 4 Nedumangad 18.55 64.09 50.76 5 Nemom 4.97 202.75 21.01 6 Parassala 8.61 119.97 16.72 7 Perumkadavila 20.13 179.74 41.51 8 Pothencode 2.68 96.43 42.31 9 Vamanapuram 19.31 101.11 34.49
10 Varkala 6.39 85.27 196.84 11 Vellanad 15.63 159.34 28 Blocks Total 123.52 1436.42 983.62 Municipalities Total 7.48 99.55 49 Corporation Total 0.54 230.25 10.08 District Total 131.54 1766.22 1042.7
KOLLAM 1 Chittumala 3.83 186 404.51 2 Ithikkara 7.48 162 341.06 3 Mukhathala 4.6 144 160.86 4 Chavara 1.65 86 111.54 5 Oachira 5.05 96 191.67 6 Sasthamcotta 8.22 117 336.97 7 Chadayamangalam 19.02 160 292.93 8 Kottarakara 5.94 65 79.5 9 Vettikavala 11.2 90 120.47
10 Anchal 31.94 144 126.12 11 Pathanapuram 10.81 37 51.84 Blocks Total 109.74 1287 2217.47 Municipalities Total 1.43 65 43.52 Corporation Total 0.27 109.15 46.25 District Total 111.44 1461.15 2307.24
(Table – 3.1 Contd….)
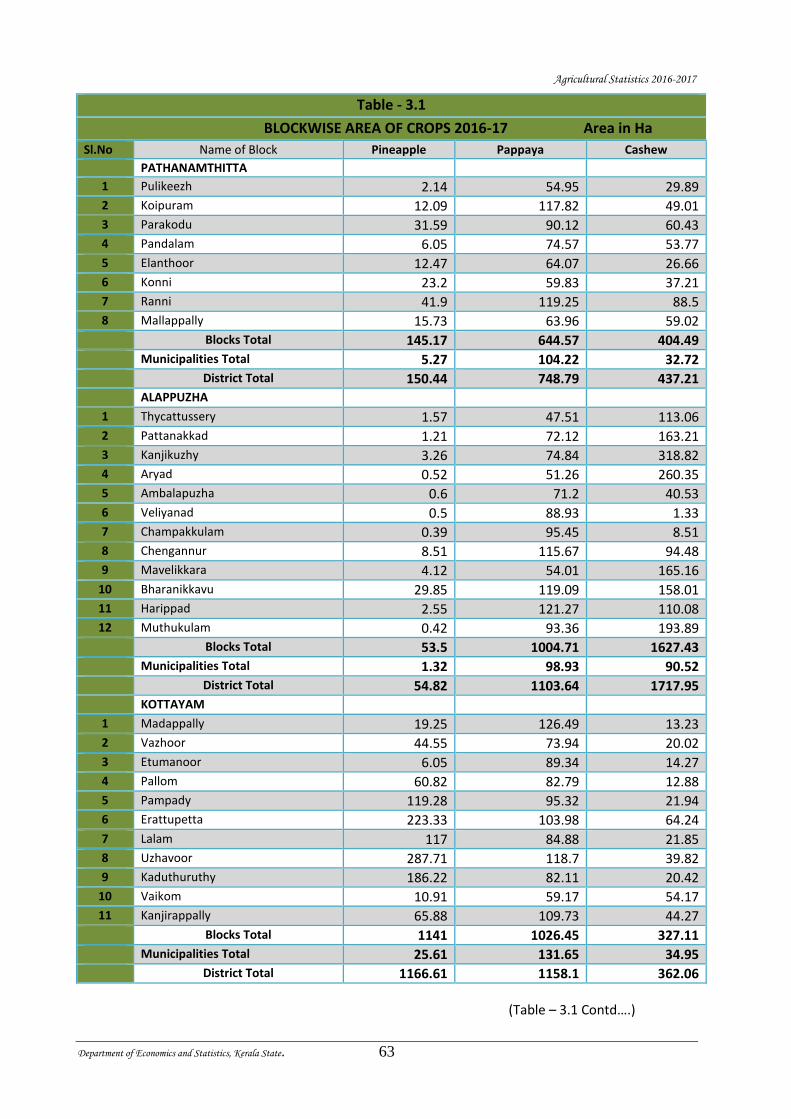
Agricultural Statistics 2016-2017
Department of Economics and Statistics, Kerala State. 63
Table - 3.1
BLOCKWISE AREA OF CROPS 2016-17 Area in Ha
Sl.No Name of Block Pineapple Pappaya Cashew
PATHANAMTHITTA
1 Pulikeezh 2.14 54.95 29.89 2 Koipuram 12.09 117.82 49.01 3 Parakodu 31.59 90.12 60.43 4 Pandalam 6.05 74.57 53.77 5 Elanthoor 12.47 64.07 26.66 6 Konni 23.2 59.83 37.21 7 Ranni 41.9 119.25 88.5 8 Mallappally 15.73 63.96 59.02 Blocks Total 145.17 644.57 404.49 Municipalities Total 5.27 104.22 32.72 District Total 150.44 748.79 437.21
ALAPPUZHA 1 Thycattussery 1.57 47.51 113.06 2 Pattanakkad 1.21 72.12 163.21 3 Kanjikuzhy 3.26 74.84 318.82 4 Aryad 0.52 51.26 260.35 5 Ambalapuzha 0.6 71.2 40.53 6 Veliyanad 0.5 88.93 1.33 7 Champakkulam 0.39 95.45 8.51 8 Chengannur 8.51 115.67 94.48 9 Mavelikkara 4.12 54.01 165.16
10 Bharanikkavu 29.85 119.09 158.01 11 Harippad 2.55 121.27 110.08 12 Muthukulam 0.42 93.36 193.89 Blocks Total 53.5 1004.71 1627.43 Municipalities Total 1.32 98.93 90.52 District Total 54.82 1103.64 1717.95
KOTTAYAM 1 Madappally 19.25 126.49 13.23 2 Vazhoor 44.55 73.94 20.02 3 Etumanoor 6.05 89.34 14.27 4 Pallom 60.82 82.79 12.88 5 Pampady 119.28 95.32 21.94 6 Erattupetta 223.33 103.98 64.24 7 Lalam 117 84.88 21.85 8 Uzhavoor 287.71 118.7 39.82 9 Kaduthuruthy 186.22 82.11 20.42
10 Vaikom 10.91 59.17 54.17 11 Kanjirappally 65.88 109.73 44.27 Blocks Total 1141 1026.45 327.11 Municipalities Total 25.61 131.65 34.95 District Total 1166.61 1158.1 362.06
(Table – 3.1 Contd….)
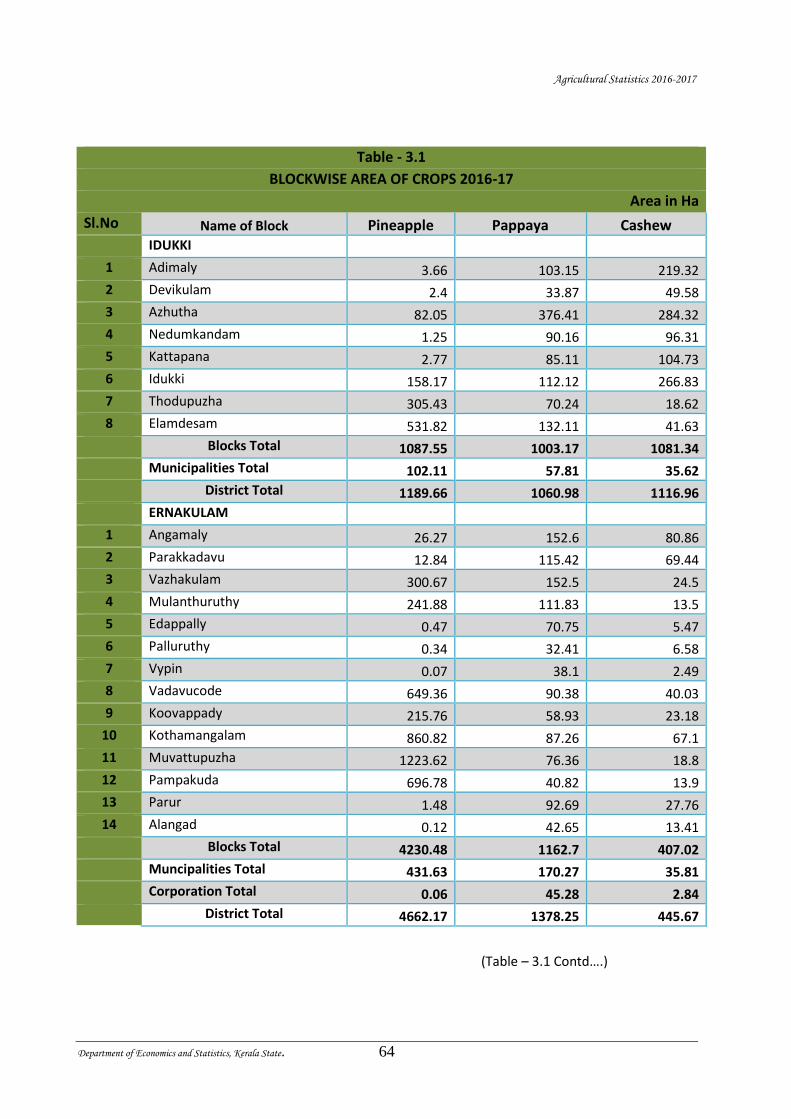
Agricultural Statistics 2016-2017
Department of Economics and Statistics, Kerala State. 64
Table - 3.1
BLOCKWISE AREA OF CROPS 2016-17
Area in Ha
Sl.No Name of Block Pineapple Pappaya Cashew IDUKKI
1 Adimaly 3.66 103.15 219.32
2 Devikulam 2.4 33.87 49.58
3 Azhutha 82.05 376.41 284.32
4 Nedumkandam 1.25 90.16 96.31
5 Kattapana 2.77 85.11 104.73
6 Idukki 158.17 112.12 266.83
7 Thodupuzha 305.43 70.24 18.62
8 Elamdesam 531.82 132.11 41.63
Blocks Total 1087.55 1003.17 1081.34
Municipalities Total 102.11 57.81 35.62
District Total 1189.66 1060.98 1116.96 ERNAKULAM
1 Angamaly 26.27 152.6 80.86
2 Parakkadavu 12.84 115.42 69.44
3 Vazhakulam 300.67 152.5 24.5
4 Mulanthuruthy 241.88 111.83 13.5
5 Edappally 0.47 70.75 5.47
6 Palluruthy 0.34 32.41 6.58
7 Vypin 0.07 38.1 2.49
8 Vadavucode 649.36 90.38 40.03
9 Koovappady 215.76 58.93 23.18
10 Kothamangalam 860.82 87.26 67.1
11 Muvattupuzha 1223.62 76.36 18.8
12 Pampakuda 696.78 40.82 13.9
13 Parur 1.48 92.69 27.76
14 Alangad 0.12 42.65 13.41
Blocks Total 4230.48 1162.7 407.02
Muncipalities Total 431.63 170.27 35.81
Corporation Total 0.06 45.28 2.84
District Total 4662.17 1378.25 445.67
(Table – 3.1 Contd….)
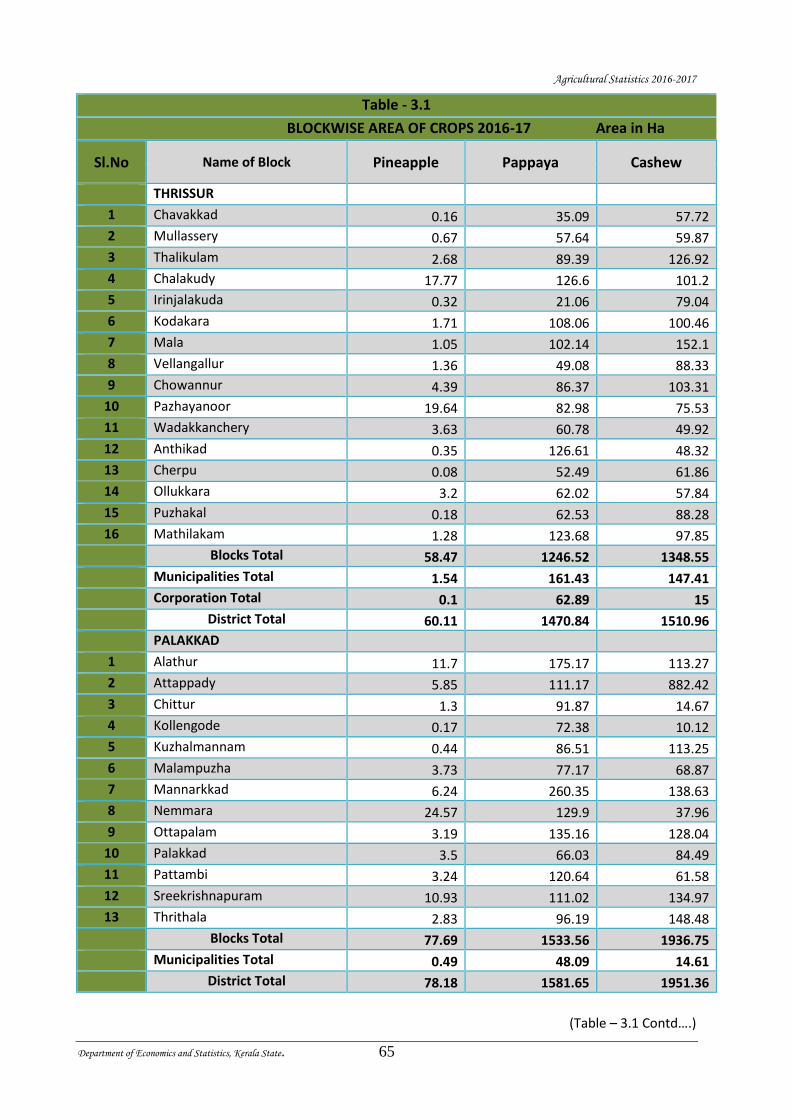
Agricultural Statistics 2016-2017
Department of Economics and Statistics, Kerala State. 65
Table - 3.1
BLOCKWISE AREA OF CROPS 2016-17 Area in Ha
Sl.No Name of Block Pineapple Pappaya Cashew
THRISSUR
1 Chavakkad 0.16 35.09 57.72
2 Mullassery 0.67 57.64 59.87
3 Thalikulam 2.68 89.39 126.92
4 Chalakudy 17.77 126.6 101.2
5 Irinjalakuda 0.32 21.06 79.04
6 Kodakara 1.71 108.06 100.46
7 Mala 1.05 102.14 152.1
8 Vellangallur 1.36 49.08 88.33
9 Chowannur 4.39 86.37 103.31
10 Pazhayanoor 19.64 82.98 75.53
11 Wadakkanchery 3.63 60.78 49.92
12 Anthikad 0.35 126.61 48.32
13 Cherpu 0.08 52.49 61.86
14 Ollukkara 3.2 62.02 57.84
15 Puzhakal 0.18 62.53 88.28
16 Mathilakam 1.28 123.68 97.85
Blocks Total 58.47 1246.52 1348.55
Municipalities Total 1.54 161.43 147.41
Corporation Total 0.1 62.89 15
District Total 60.11 1470.84 1510.96 PALAKKAD
1 Alathur 11.7 175.17 113.27
2 Attappady 5.85 111.17 882.42
3 Chittur 1.3 91.87 14.67
4 Kollengode 0.17 72.38 10.12
5 Kuzhalmannam 0.44 86.51 113.25
6 Malampuzha 3.73 77.17 68.87
7 Mannarkkad 6.24 260.35 138.63
8 Nemmara 24.57 129.9 37.96
9 Ottapalam 3.19 135.16 128.04
10 Palakkad 3.5 66.03 84.49
11 Pattambi 3.24 120.64 61.58
12 Sreekrishnapuram 10.93 111.02 134.97
13 Thrithala 2.83 96.19 148.48
Blocks Total 77.69 1533.56 1936.75
Municipalities Total 0.49 48.09 14.61
District Total 78.18 1581.65 1951.36
(Table – 3.1 Contd….)
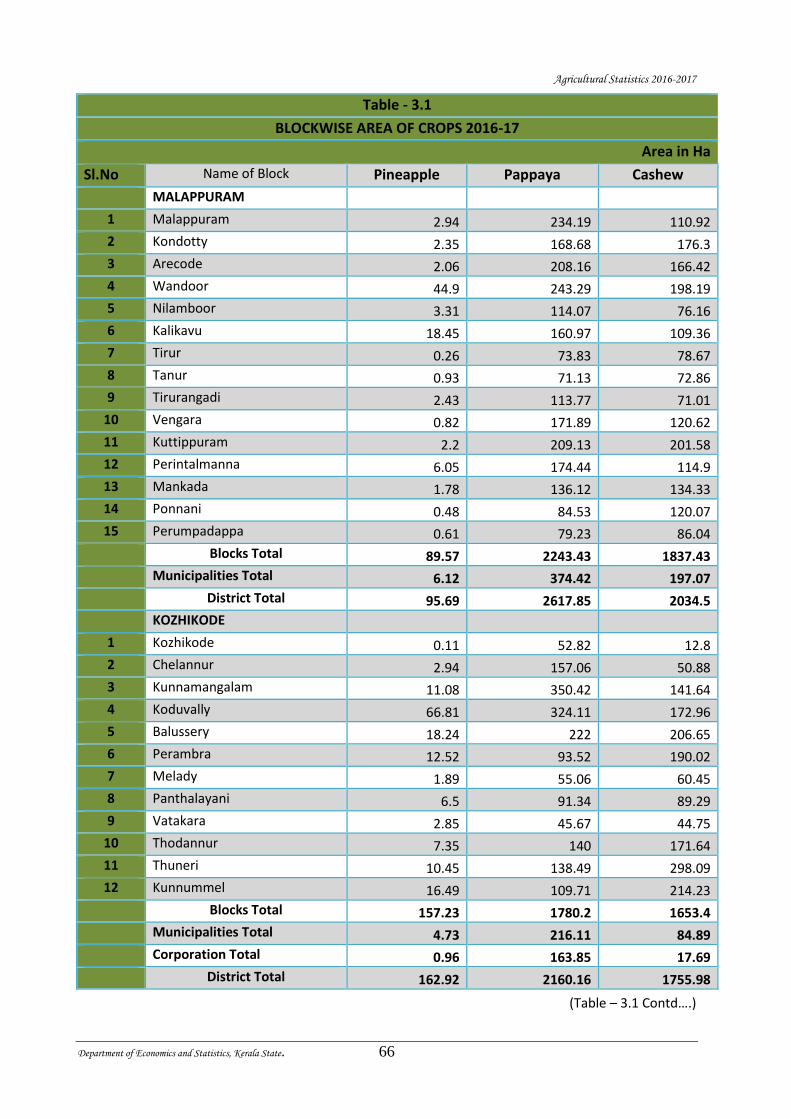
Agricultural Statistics 2016-2017
Department of Economics and Statistics, Kerala State. 66
Table - 3.1
BLOCKWISE AREA OF CROPS 2016-17
Area in Ha
Sl.No Name of Block Pineapple Pappaya Cashew
MALAPPURAM
1 Malappuram 2.94 234.19 110.92
2 Kondotty 2.35 168.68 176.3
3 Arecode 2.06 208.16 166.42
4 Wandoor 44.9 243.29 198.19
5 Nilamboor 3.31 114.07 76.16
6 Kalikavu 18.45 160.97 109.36
7 Tirur 0.26 73.83 78.67
8 Tanur 0.93 71.13 72.86
9 Tirurangadi 2.43 113.77 71.01
10 Vengara 0.82 171.89 120.62
11 Kuttippuram 2.2 209.13 201.58
12 Perintalmanna 6.05 174.44 114.9
13 Mankada 1.78 136.12 134.33
14 Ponnani 0.48 84.53 120.07
15 Perumpadappa 0.61 79.23 86.04
Blocks Total 89.57 2243.43 1837.43
Municipalities Total 6.12 374.42 197.07
District Total 95.69 2617.85 2034.5 KOZHIKODE
1 Kozhikode 0.11 52.82 12.8
2 Chelannur 2.94 157.06 50.88
3 Kunnamangalam 11.08 350.42 141.64
4 Koduvally 66.81 324.11 172.96
5 Balussery 18.24 222 206.65
6 Perambra 12.52 93.52 190.02
7 Melady 1.89 55.06 60.45
8 Panthalayani 6.5 91.34 89.29
9 Vatakara 2.85 45.67 44.75
10 Thodannur 7.35 140 171.64
11 Thuneri 10.45 138.49 298.09
12 Kunnummel 16.49 109.71 214.23
Blocks Total 157.23 1780.2 1653.4
Municipalities Total 4.73 216.11 84.89
Corporation Total 0.96 163.85 17.69
District Total 162.92 2160.16 1755.98
(Table – 3.1 Contd….)
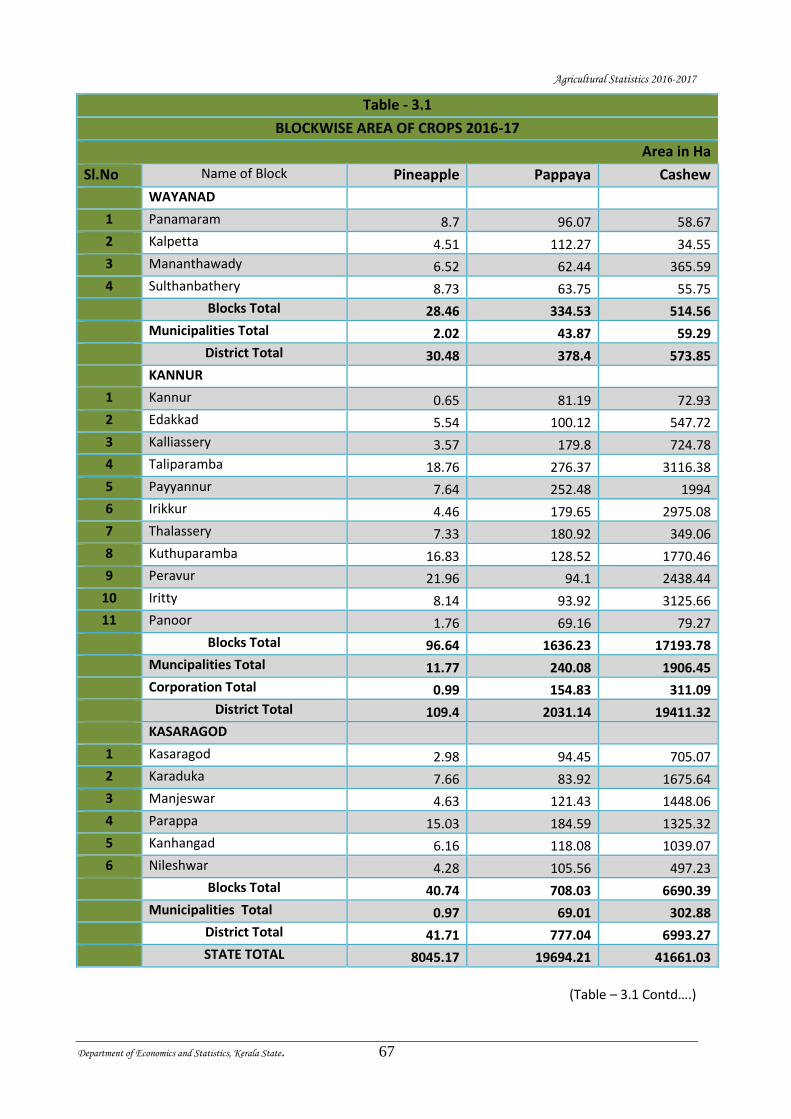
Agricultural Statistics 2016-2017
Department of Economics and Statistics, Kerala State. 67
Table - 3.1
BLOCKWISE AREA OF CROPS 2016-17
Area in Ha
Sl.No Name of Block Pineapple Pappaya Cashew
WAYANAD
1 Panamaram 8.7 96.07 58.67
2 Kalpetta 4.51 112.27 34.55
3 Mananthawady 6.52 62.44 365.59
4 Sulthanbathery 8.73 63.75 55.75
Blocks Total 28.46 334.53 514.56
Municipalities Total 2.02 43.87 59.29
District Total 30.48 378.4 573.85 KANNUR
1 Kannur 0.65 81.19 72.93
2 Edakkad 5.54 100.12 547.72
3 Kalliassery 3.57 179.8 724.78
4 Taliparamba 18.76 276.37 3116.38
5 Payyannur 7.64 252.48 1994
6 Irikkur 4.46 179.65 2975.08
7 Thalassery 7.33 180.92 349.06
8 Kuthuparamba 16.83 128.52 1770.46
9 Peravur 21.96 94.1 2438.44
10 Iritty 8.14 93.92 3125.66
11 Panoor 1.76 69.16 79.27
Blocks Total 96.64 1636.23 17193.78
Muncipalities Total 11.77 240.08 1906.45
Corporation Total 0.99 154.83 311.09 District Total 109.4 2031.14 19411.32 KASARAGOD
1 Kasaragod 2.98 94.45 705.07
2 Karaduka 7.66 83.92 1675.64
3 Manjeswar 4.63 121.43 1448.06
4 Parappa 15.03 184.59 1325.32
5 Kanhangad 6.16 118.08 1039.07
6 Nileshwar 4.28 105.56 497.23
Blocks Total 40.74 708.03 6690.39
Municipalities Total 0.97 69.01 302.88
District Total 41.71 777.04 6993.27
STATE TOTAL 8045.17 19694.21 41661.03
(Table – 3.1 Contd….)

Agricultural Statistics 2016-2017
Department of Economics and Statistics, Kerala State. 68
Table - 3.1
BLOCKWISE AREA OF CROPS 2016-17
Area in Ha
TAPIOCA
Sl.No. Name of Block Autumn Winter Summer Total THIRUVANANTHAPURAM
1 Athiyannoor 92.58 112 227.34 431.92
2 Chirayinkeezhu 332.38 313.22 686.11 1331.71
3 Kilimanoor 659.61 942.43 1566.34 3168.38
4 Nedumangad 144.19 139.27 248.98 532.44
5 Nemom 242.77 232.89 873.17 1348.83
6 Parassala 177.58 140.91 331.22 649.71
7 Perumkadavila 273.71 241.33 532.41 1047.45
8 Pothencode 153.64 170.64 339.28 663.56
9 Vamanapuram 308.2 370.13 635.97 1314.3
10 Varkala 430.65 502.29 694.09 1627.03
11 Vellanad 274.77 299.58 397.67 972.02
Blocks Total 3090.08 3464.69 6532.58 13087.35
Municipalities Total 363.77 279.15 404.88 1047.8
Corporation Total 112.69 117.08 262.66 492.43
District Total 3566.54 3860.92 7200.12 14627.58
KOLLAM
1 Chittumala 127 314.47 171.91 613.38
2 Ithikkara 278.83 506.03 413.62 1198.48
3 Mukhathala 186 291.52 248.13 725.65
4 Chavara 25 252.33 253.48 530.81
5 Oachira 12.27 448.85 368.09 829.21
6 Sasthamcotta 210.23 809.23 1095.63 2115.09
7 Chadayamangalam 484.92 545.6 934.2 1964.72
8 Kottarakara 221.72 329.16 475.8 1026.68
9 Vettikavala 496.73 524.63 888.43 1909.79
10 Anchal 362.29 570.68 794.32 1727.29
11 Pathanapuram 260.54 429.62 679.74 1369.9
Blocks Total 2665.53 5022.12 6323.35 14011
Municipalities Total 46.29 97.58 147.55 291.42
Corporation Total 23.77 44.78 50.46 119.01
District Total 2735.59 5164.48 6521.36 14421.43
(Table – 3.1 Contd….)
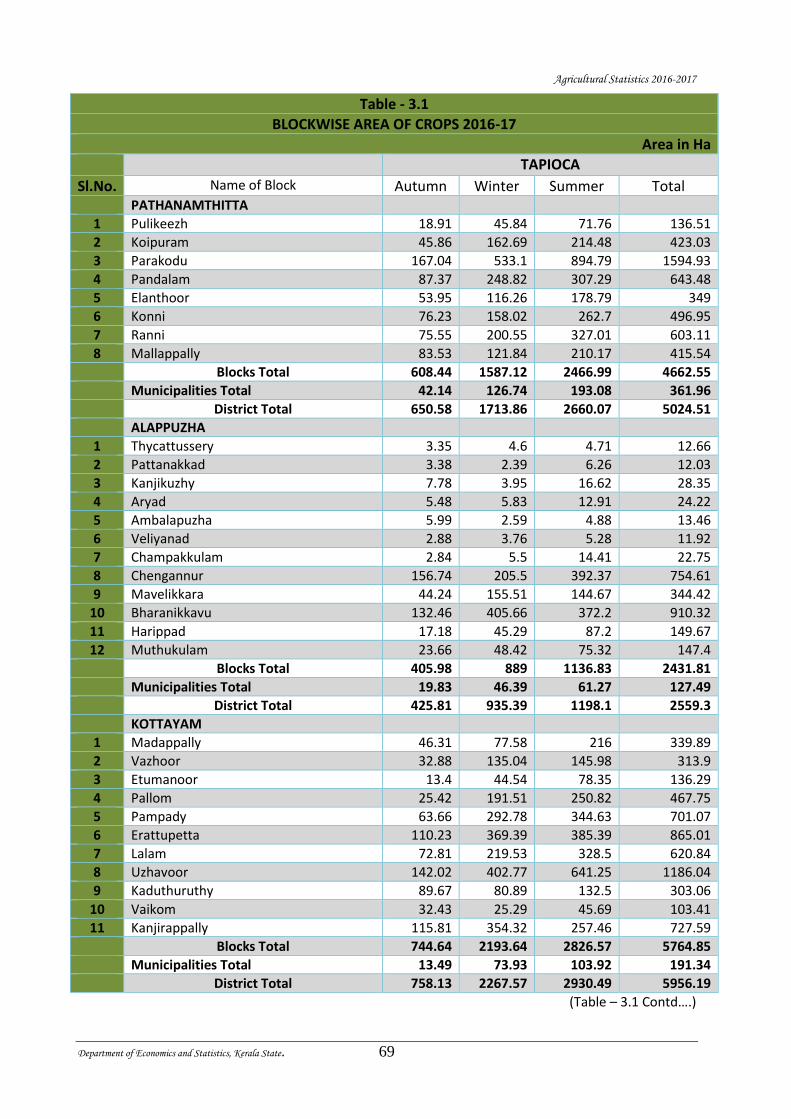
Agricultural Statistics 2016-2017
Department of Economics and Statistics, Kerala State. 69
Table - 3.1
BLOCKWISE AREA OF CROPS 2016-17
Area in Ha
TAPIOCA
Sl.No. Name of Block Autumn Winter Summer Total PATHANAMTHITTA
1 Pulikeezh 18.91 45.84 71.76 136.51
2 Koipuram 45.86 162.69 214.48 423.03
3 Parakodu 167.04 533.1 894.79 1594.93
4 Pandalam 87.37 248.82 307.29 643.48
5 Elanthoor 53.95 116.26 178.79 349
6 Konni 76.23 158.02 262.7 496.95
7 Ranni 75.55 200.55 327.01 603.11
8 Mallappally 83.53 121.84 210.17 415.54
Blocks Total 608.44 1587.12 2466.99 4662.55
Municipalities Total 42.14 126.74 193.08 361.96
District Total 650.58 1713.86 2660.07 5024.51
ALAPPUZHA
1 Thycattussery 3.35 4.6 4.71 12.66
2 Pattanakkad 3.38 2.39 6.26 12.03
3 Kanjikuzhy 7.78 3.95 16.62 28.35
4 Aryad 5.48 5.83 12.91 24.22
5 Ambalapuzha 5.99 2.59 4.88 13.46
6 Veliyanad 2.88 3.76 5.28 11.92
7 Champakkulam 2.84 5.5 14.41 22.75
8 Chengannur 156.74 205.5 392.37 754.61
9 Mavelikkara 44.24 155.51 144.67 344.42
10 Bharanikkavu 132.46 405.66 372.2 910.32
11 Harippad 17.18 45.29 87.2 149.67
12 Muthukulam 23.66 48.42 75.32 147.4
Blocks Total 405.98 889 1136.83 2431.81
Municipalities Total 19.83 46.39 61.27 127.49
District Total 425.81 935.39 1198.1 2559.3
KOTTAYAM
1 Madappally 46.31 77.58 216 339.89
2 Vazhoor 32.88 135.04 145.98 313.9
3 Etumanoor 13.4 44.54 78.35 136.29
4 Pallom 25.42 191.51 250.82 467.75
5 Pampady 63.66 292.78 344.63 701.07
6 Erattupetta 110.23 369.39 385.39 865.01
7 Lalam 72.81 219.53 328.5 620.84
8 Uzhavoor 142.02 402.77 641.25 1186.04
9 Kaduthuruthy 89.67 80.89 132.5 303.06
10 Vaikom 32.43 25.29 45.69 103.41
11 Kanjirappally 115.81 354.32 257.46 727.59
Blocks Total 744.64 2193.64 2826.57 5764.85
Municipalities Total 13.49 73.93 103.92 191.34
District Total 758.13 2267.57 2930.49 5956.19
(Table – 3.1 Contd….)
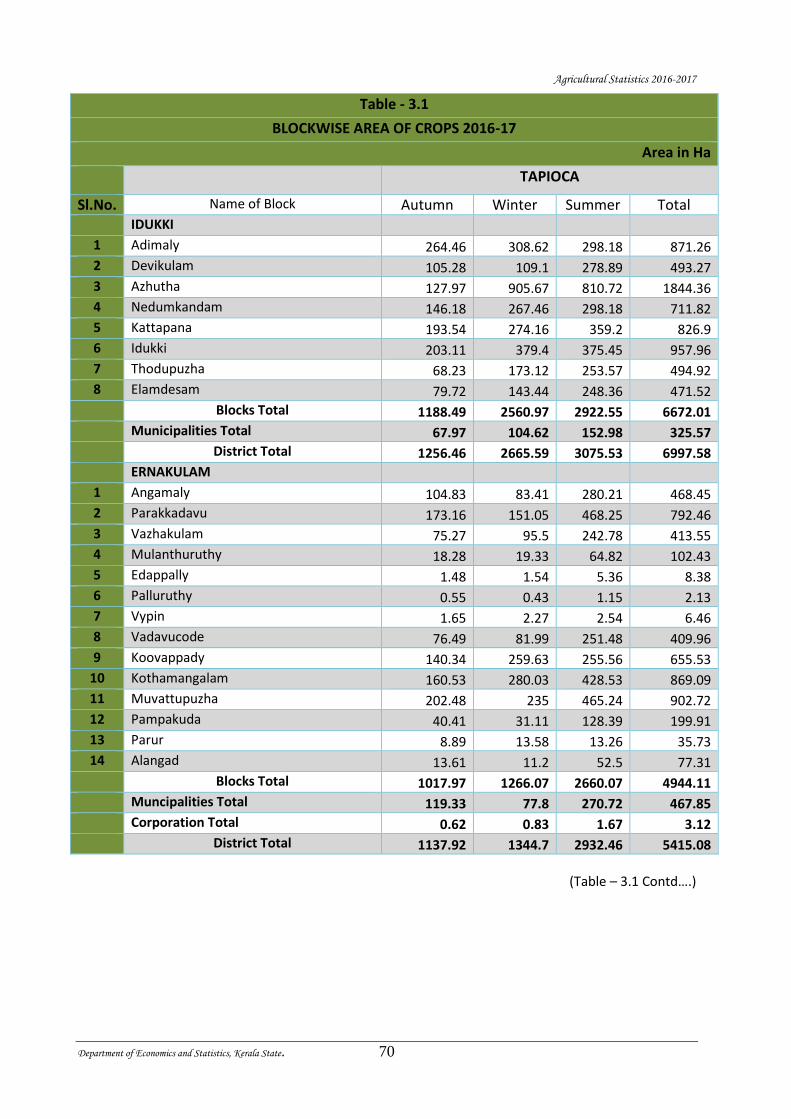
Agricultural Statistics 2016-2017
Department of Economics and Statistics, Kerala State. 70
Table - 3.1
BLOCKWISE AREA OF CROPS 2016-17
Area in Ha
TAPIOCA
Sl.No. Name of Block Autumn Winter Summer Total IDUKKI
1 Adimaly 264.46 308.62 298.18 871.26
2 Devikulam 105.28 109.1 278.89 493.27
3 Azhutha 127.97 905.67 810.72 1844.36
4 Nedumkandam 146.18 267.46 298.18 711.82
5 Kattapana 193.54 274.16 359.2 826.9
6 Idukki 203.11 379.4 375.45 957.96
7 Thodupuzha 68.23 173.12 253.57 494.92
8 Elamdesam 79.72 143.44 248.36 471.52
Blocks Total 1188.49 2560.97 2922.55 6672.01
Municipalities Total 67.97 104.62 152.98 325.57
District Total 1256.46 2665.59 3075.53 6997.58
ERNAKULAM
1 Angamaly 104.83 83.41 280.21 468.45
2 Parakkadavu 173.16 151.05 468.25 792.46
3 Vazhakulam 75.27 95.5 242.78 413.55
4 Mulanthuruthy 18.28 19.33 64.82 102.43
5 Edappally 1.48 1.54 5.36 8.38
6 Palluruthy 0.55 0.43 1.15 2.13
7 Vypin 1.65 2.27 2.54 6.46
8 Vadavucode 76.49 81.99 251.48 409.96
9 Koovappady 140.34 259.63 255.56 655.53
10 Kothamangalam 160.53 280.03 428.53 869.09
11 Muvattupuzha 202.48 235 465.24 902.72
12 Pampakuda 40.41 31.11 128.39 199.91
13 Parur 8.89 13.58 13.26 35.73
14 Alangad 13.61 11.2 52.5 77.31
Blocks Total 1017.97 1266.07 2660.07 4944.11
Muncipalities Total 119.33 77.8 270.72 467.85
Corporation Total 0.62 0.83 1.67 3.12
District Total 1137.92 1344.7 2932.46 5415.08
(Table – 3.1 Contd….)
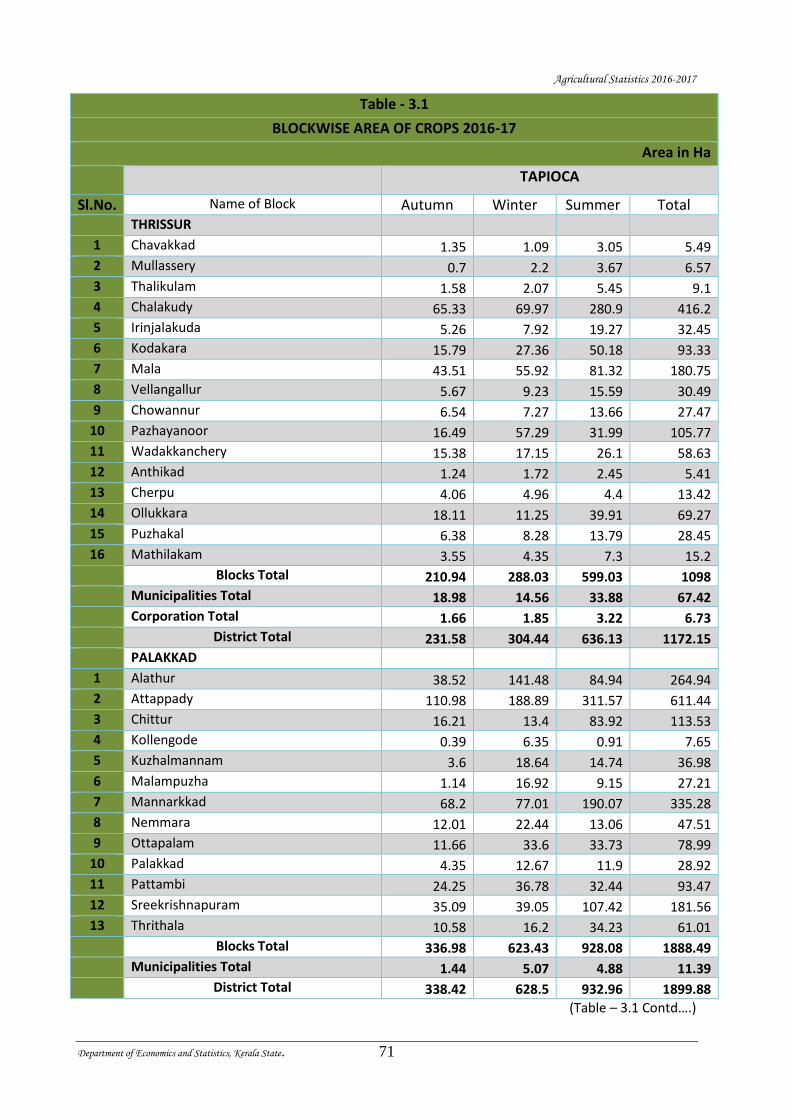
Agricultural Statistics 2016-2017
Department of Economics and Statistics, Kerala State. 71
Table - 3.1
BLOCKWISE AREA OF CROPS 2016-17
Area in Ha
TAPIOCA
Sl.No. Name of Block Autumn Winter Summer Total THRISSUR
1 Chavakkad 1.35 1.09 3.05 5.49
2 Mullassery 0.7 2.2 3.67 6.57
3 Thalikulam 1.58 2.07 5.45 9.1
4 Chalakudy 65.33 69.97 280.9 416.2
5 Irinjalakuda 5.26 7.92 19.27 32.45
6 Kodakara 15.79 27.36 50.18 93.33
7 Mala 43.51 55.92 81.32 180.75
8 Vellangallur 5.67 9.23 15.59 30.49
9 Chowannur 6.54 7.27 13.66 27.47
10 Pazhayanoor 16.49 57.29 31.99 105.77
11 Wadakkanchery 15.38 17.15 26.1 58.63
12 Anthikad 1.24 1.72 2.45 5.41
13 Cherpu 4.06 4.96 4.4 13.42
14 Ollukkara 18.11 11.25 39.91 69.27
15 Puzhakal 6.38 8.28 13.79 28.45
16 Mathilakam 3.55 4.35 7.3 15.2
Blocks Total 210.94 288.03 599.03 1098
Municipalities Total 18.98 14.56 33.88 67.42
Corporation Total 1.66 1.85 3.22 6.73
District Total 231.58 304.44 636.13 1172.15
PALAKKAD
1 Alathur 38.52 141.48 84.94 264.94
2 Attappady 110.98 188.89 311.57 611.44
3 Chittur 16.21 13.4 83.92 113.53
4 Kollengode 0.39 6.35 0.91 7.65
5 Kuzhalmannam 3.6 18.64 14.74 36.98
6 Malampuzha 1.14 16.92 9.15 27.21
7 Mannarkkad 68.2 77.01 190.07 335.28
8 Nemmara 12.01 22.44 13.06 47.51
9 Ottapalam 11.66 33.6 33.73 78.99
10 Palakkad 4.35 12.67 11.9 28.92
11 Pattambi 24.25 36.78 32.44 93.47
12 Sreekrishnapuram 35.09 39.05 107.42 181.56
13 Thrithala 10.58 16.2 34.23 61.01
Blocks Total 336.98 623.43 928.08 1888.49
Municipalities Total 1.44 5.07 4.88 11.39
District Total 338.42 628.5 932.96 1899.88
(Table – 3.1 Contd….)
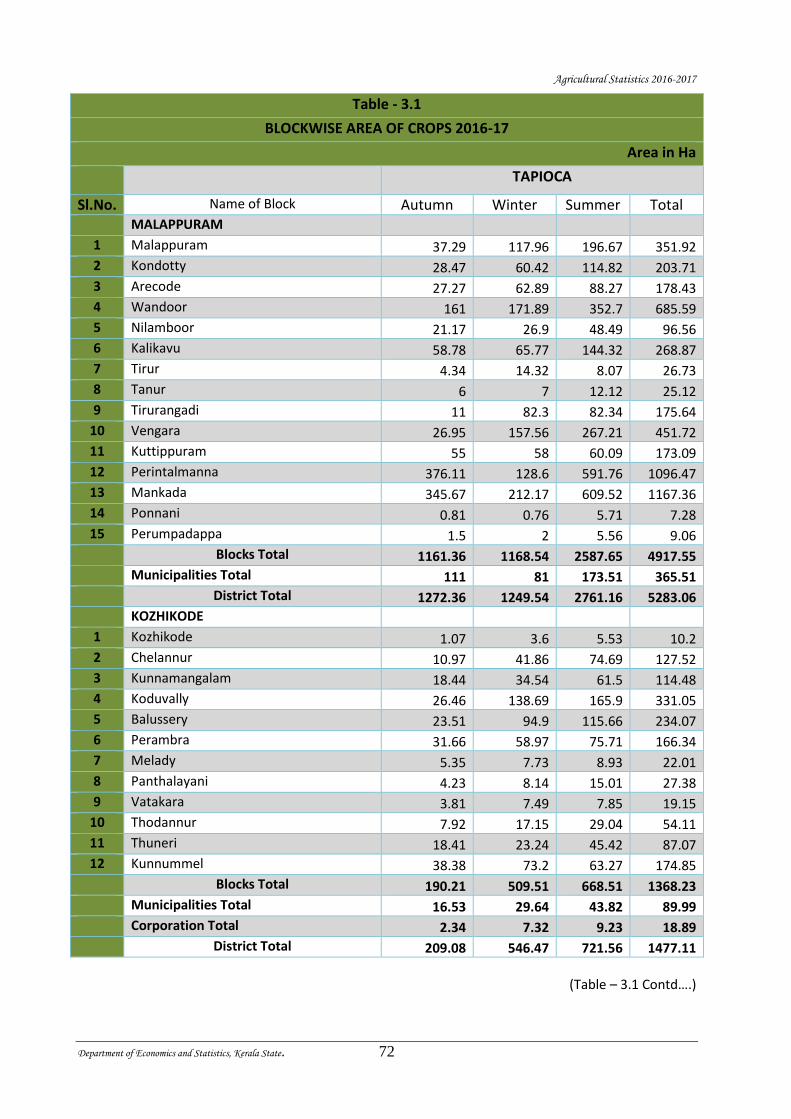
Agricultural Statistics 2016-2017
Department of Economics and Statistics, Kerala State. 72
Table - 3.1
BLOCKWISE AREA OF CROPS 2016-17
Area in Ha
TAPIOCA
Sl.No. Name of Block Autumn Winter Summer Total MALAPPURAM
1 Malappuram 37.29 117.96 196.67 351.92
2 Kondotty 28.47 60.42 114.82 203.71
3 Arecode 27.27 62.89 88.27 178.43
4 Wandoor 161 171.89 352.7 685.59
5 Nilamboor 21.17 26.9 48.49 96.56
6 Kalikavu 58.78 65.77 144.32 268.87
7 Tirur 4.34 14.32 8.07 26.73
8 Tanur 6 7 12.12 25.12
9 Tirurangadi 11 82.3 82.34 175.64
10 Vengara 26.95 157.56 267.21 451.72
11 Kuttippuram 55 58 60.09 173.09
12 Perintalmanna 376.11 128.6 591.76 1096.47
13 Mankada 345.67 212.17 609.52 1167.36
14 Ponnani 0.81 0.76 5.71 7.28
15 Perumpadappa 1.5 2 5.56 9.06
Blocks Total 1161.36 1168.54 2587.65 4917.55
Municipalities Total 111 81 173.51 365.51
District Total 1272.36 1249.54 2761.16 5283.06
KOZHIKODE
1 Kozhikode 1.07 3.6 5.53 10.2
2 Chelannur 10.97 41.86 74.69 127.52
3 Kunnamangalam 18.44 34.54 61.5 114.48
4 Koduvally 26.46 138.69 165.9 331.05
5 Balussery 23.51 94.9 115.66 234.07
6 Perambra 31.66 58.97 75.71 166.34
7 Melady 5.35 7.73 8.93 22.01
8 Panthalayani 4.23 8.14 15.01 27.38
9 Vatakara 3.81 7.49 7.85 19.15
10 Thodannur 7.92 17.15 29.04 54.11
11 Thuneri 18.41 23.24 45.42 87.07
12 Kunnummel 38.38 73.2 63.27 174.85
Blocks Total 190.21 509.51 668.51 1368.23
Municipalities Total 16.53 29.64 43.82 89.99
Corporation Total 2.34 7.32 9.23 18.89
District Total 209.08 546.47 721.56 1477.11
(Table – 3.1 Contd….)
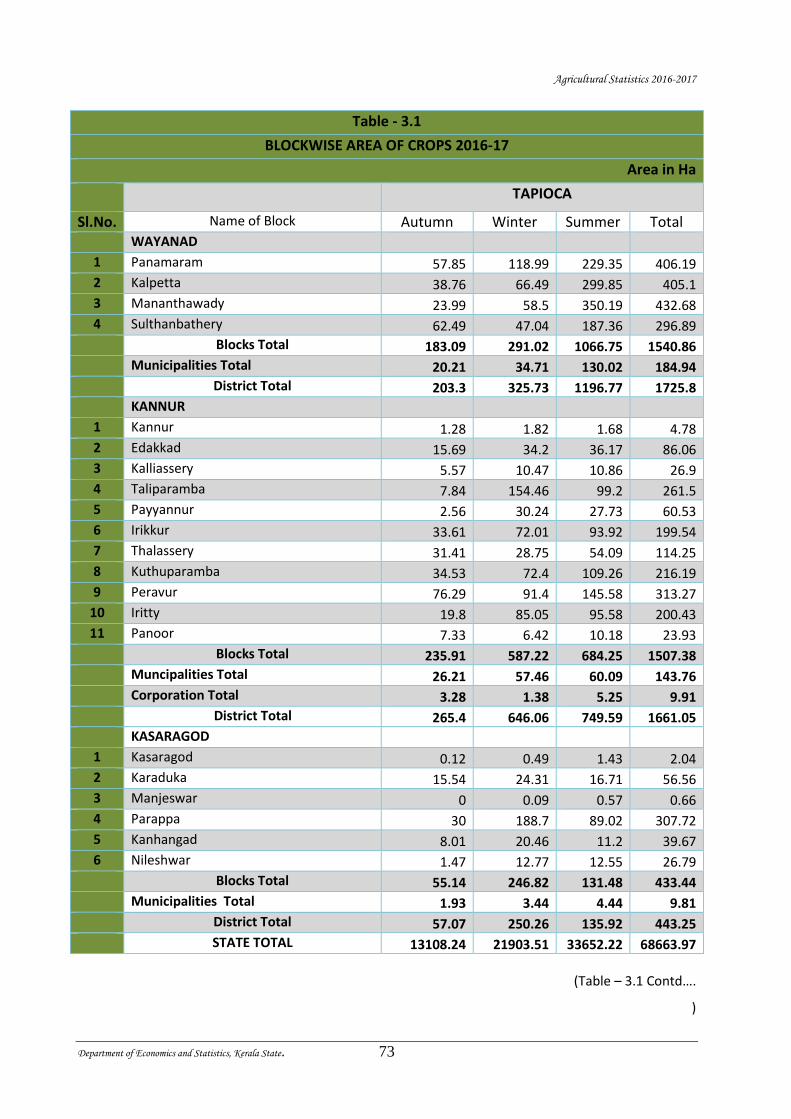
Agricultural Statistics 2016-2017
Department of Economics and Statistics, Kerala State. 73
Table - 3.1
BLOCKWISE AREA OF CROPS 2016-17
Area in Ha
TAPIOCA
Sl.No. Name of Block Autumn Winter Summer Total WAYANAD
1 Panamaram 57.85 118.99 229.35 406.19
2 Kalpetta 38.76 66.49 299.85 405.1
3 Mananthawady 23.99 58.5 350.19 432.68
4 Sulthanbathery 62.49 47.04 187.36 296.89
Blocks Total 183.09 291.02 1066.75 1540.86
Municipalities Total 20.21 34.71 130.02 184.94
District Total 203.3 325.73 1196.77 1725.8
KANNUR
1 Kannur 1.28 1.82 1.68 4.78
2 Edakkad 15.69 34.2 36.17 86.06
3 Kalliassery 5.57 10.47 10.86 26.9
4 Taliparamba 7.84 154.46 99.2 261.5
5 Payyannur 2.56 30.24 27.73 60.53
6 Irikkur 33.61 72.01 93.92 199.54
7 Thalassery 31.41 28.75 54.09 114.25
8 Kuthuparamba 34.53 72.4 109.26 216.19
9 Peravur 76.29 91.4 145.58 313.27
10 Iritty 19.8 85.05 95.58 200.43
11 Panoor 7.33 6.42 10.18 23.93
Blocks Total 235.91 587.22 684.25 1507.38
Muncipalities Total 26.21 57.46 60.09 143.76
Corporation Total 3.28 1.38 5.25 9.91
District Total 265.4 646.06 749.59 1661.05
KASARAGOD
1 Kasaragod 0.12 0.49 1.43 2.04
2 Karaduka 15.54 24.31 16.71 56.56
3 Manjeswar 0 0.09 0.57 0.66
4 Parappa 30 188.7 89.02 307.72
5 Kanhangad 8.01 20.46 11.2 39.67
6 Nileshwar 1.47 12.77 12.55 26.79
Blocks Total 55.14 246.82 131.48 433.44
Municipalities Total 1.93 3.44 4.44 9.81
District Total 57.07 250.26 135.92 443.25
STATE TOTAL 13108.24 21903.51 33652.22 68663.97
(Table – 3.1 Contd….
)

Agricultural Statistics 2016-2017
Department of Economics and Statistics, Kerala State. 74
Table - 3.1
BLOCKWISE AREA OF CROPS 2016-17
Area in Ha
Sl.No. Name of Block
Elephant foot yam
Colocasia (Chembu)
Yam (Kachil)
Sweet Potato
Koorka
THIRUVANANTHAPURAM
1 Athiyannoor 12.12 15.27 2.6 0.07 0.03 2 Chirayinkeezhu 29.8 86.38 2.39 0.4 0 3 Kilimanoor 84.82 147.03 9.19 0.24 0 4 Nedumangad 10.56 11.03 4.41 0.48 0.11 5 Nemom 39.84 34.47 4.57 0.99 0.58 6 Parassala 40.46 80.35 8.24 1.29 6.02 7 Perumkadavila 69.25 125.08 14.69 4.41 0.54 8 Pothencode 5.34 8.65 0.78 0.34 0 9 Vamanapuram 25.69 36.77 8.46 0.8 0.04
10 Varkala 26.12 65.79 2.04 0.05 0 11 Vellanad 24.29 17.04 5.84 0.44 0.13 Blocks Total 368.29 627.86 63.21 9.51 7.45 Municipalities Total 15.06 31.83 1.76 0.06 0.04 Corporation Total 4.69 7.11 0.84 0.17 0.08 District Total 388.04 666.8 65.81 9.74 7.57 KOLLAM
1 Chittumala 25.87 92.23 19.73 0 0.75 2 Ithikkara 38.28 70.31 14.01 0 0.32 3 Mukhathala 21.86 38 7.95 0 0.31 4 Chavara 49.45 120.26 41.63 0 0 5 Oachira 43.47 143.86 40.47 0 0.39 6 Sasthamcotta 265.07 328.41 139.27 1 0 7 Chadayamangalam 137.57 144.52 49.79 0 1.75 8 Kottarakara 116.93 103.94 27.73 0 0.36 9 Vettikavala 111.43 91.09 28.18 1 0.11
10 Anchal 148.23 139.69 39.58 0 0.28 11 Pathanapuram 105.62 98.9 56.88 0 0.72 Blocks Total 1063.78 1371.21 465.22 3 4.99 Municipalities Total 18.54 31.5 11 0 0 Corporation Total 7.73 17.36 5 0 0 District Total 1090.05 1420.07 481.22 4 4.99
(Table – 3.1 Contd….)
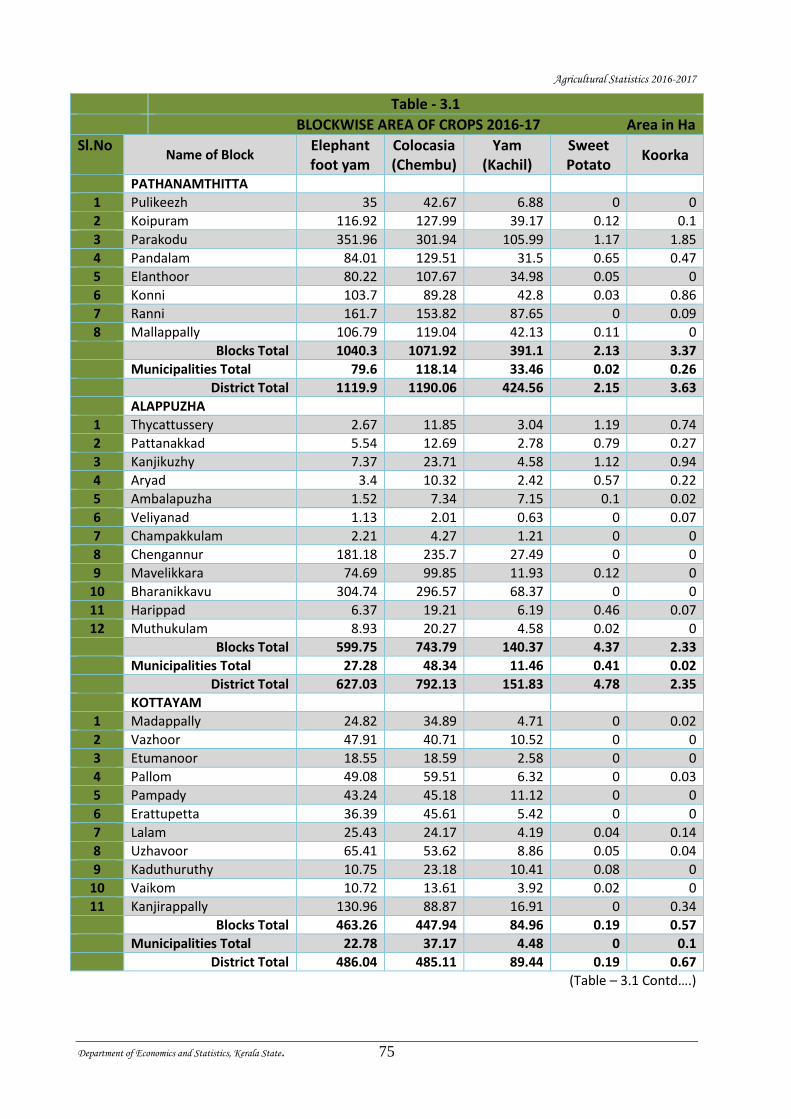
Agricultural Statistics 2016-2017
Department of Economics and Statistics, Kerala State. 75
Table - 3.1
BLOCKWISE AREA OF CROPS 2016-17 Area in Ha
Sl.No Name of Block
Elephant foot yam
Colocasia (Chembu)
Yam (Kachil)
Sweet Potato
Koorka
PATHANAMTHITTA
1 Pulikeezh 35 42.67 6.88 0 0
2 Koipuram 116.92 127.99 39.17 0.12 0.1
3 Parakodu 351.96 301.94 105.99 1.17 1.85
4 Pandalam 84.01 129.51 31.5 0.65 0.47
5 Elanthoor 80.22 107.67 34.98 0.05 0
6 Konni 103.7 89.28 42.8 0.03 0.86
7 Ranni 161.7 153.82 87.65 0 0.09
8 Mallappally 106.79 119.04 42.13 0.11 0
Blocks Total 1040.3 1071.92 391.1 2.13 3.37
Municipalities Total 79.6 118.14 33.46 0.02 0.26
District Total 1119.9 1190.06 424.56 2.15 3.63
ALAPPUZHA
1 Thycattussery 2.67 11.85 3.04 1.19 0.74
2 Pattanakkad 5.54 12.69 2.78 0.79 0.27
3 Kanjikuzhy 7.37 23.71 4.58 1.12 0.94
4 Aryad 3.4 10.32 2.42 0.57 0.22
5 Ambalapuzha 1.52 7.34 7.15 0.1 0.02
6 Veliyanad 1.13 2.01 0.63 0 0.07
7 Champakkulam 2.21 4.27 1.21 0 0
8 Chengannur 181.18 235.7 27.49 0 0
9 Mavelikkara 74.69 99.85 11.93 0.12 0
10 Bharanikkavu 304.74 296.57 68.37 0 0
11 Harippad 6.37 19.21 6.19 0.46 0.07
12 Muthukulam 8.93 20.27 4.58 0.02 0
Blocks Total 599.75 743.79 140.37 4.37 2.33
Municipalities Total 27.28 48.34 11.46 0.41 0.02
District Total 627.03 792.13 151.83 4.78 2.35
KOTTAYAM
1 Madappally 24.82 34.89 4.71 0 0.02
2 Vazhoor 47.91 40.71 10.52 0 0
3 Etumanoor 18.55 18.59 2.58 0 0
4 Pallom 49.08 59.51 6.32 0 0.03
5 Pampady 43.24 45.18 11.12 0 0
6 Erattupetta 36.39 45.61 5.42 0 0
7 Lalam 25.43 24.17 4.19 0.04 0.14
8 Uzhavoor 65.41 53.62 8.86 0.05 0.04
9 Kaduthuruthy 10.75 23.18 10.41 0.08 0
10 Vaikom 10.72 13.61 3.92 0.02 0
11 Kanjirappally 130.96 88.87 16.91 0 0.34
Blocks Total 463.26 447.94 84.96 0.19 0.57
Municipalities Total 22.78 37.17 4.48 0 0.1
District Total 486.04 485.11 89.44 0.19 0.67
(Table – 3.1 Contd….)

Agricultural Statistics 2016-2017
Department of Economics and Statistics, Kerala State. 76
Table - 3.1
BLOCKWISE AREA OF CROPS 2016-17
Area in Ha
Sl.No.
Name of Block Elephant foot yam
Colocasia (Chembu)
Yam (Kachil)
Sweet Potato
Koorka
IDUKKI
1 Adimaly 119.93 111.53 15.55 1.04 5.9 2 Devikulam 8.65 7.48 1.35 0.29 2.89 3 Azhutha 242.57 176.05 68.59 0.14 0 4 Nedumkandam 80.96 107.74 35.4 0.1 7.64 5 Kattapana 94.22 93.83 16.29 0.22 0.96 6 Idukki 57.2 35.89 11.52 0.95 1.42 7 Thodupuzha 22.66 21.71 3.26 0.39 0.62 8 Elamdesam 27.53 17.66 7.84 1.18 3.1 Blocks Total 653.72 571.89 159.8 4.31 22.53 Municipalities Total 31.02 29.44 8.29 0.03 0.03 District Total 684.74 601.33 168.09 4.34 22.56 ERNAKULAM
1 Angamaly 12.81 26.34 1.82 0.09 11.28 2 Parakkadavu 17.87 17.89 1.71 0.62 4.82 3 Vazhakulam 6.59 15.95 3.74 0.56 2.21 4 Mulanthuruthy 9.69 14.64 0.62 0.04 0.02 5 Edappally 1.3 1.79 0.53 0 0 6 Palluruthy 0.68 3.68 1.66 0.14 0.08 7 Vypin 0 1.48 0.45 0 0 8 Vadavucode 17.02 12.16 0.58 0.22 0.95 9 Koovappady 9.14 16.79 0.35 0.26 11.9
10 Kothamangalam 35.32 23.46 3 0.52 9.46 11 Muvattupuzha 60.67 28.19 5.21 0.72 6.55 12 Pampakuda 25.82 18.72 2.52 0.5 0.33 13 Parur 1.02 7.5 1.05 0.06 0.39 14 Alangad 1.04 4.48 0.15 0 0.08 Blocks Total 198.97 193.07 23.39 3.73 48.07 Muncipalities Total 19.1 19.59 2.21 0.13 1.95 Corporation Total 0.25 1 0.04 0 0 District Total 218.32 213.66 25.64 3.86 50.02
(Table – 3.1 Contd….)
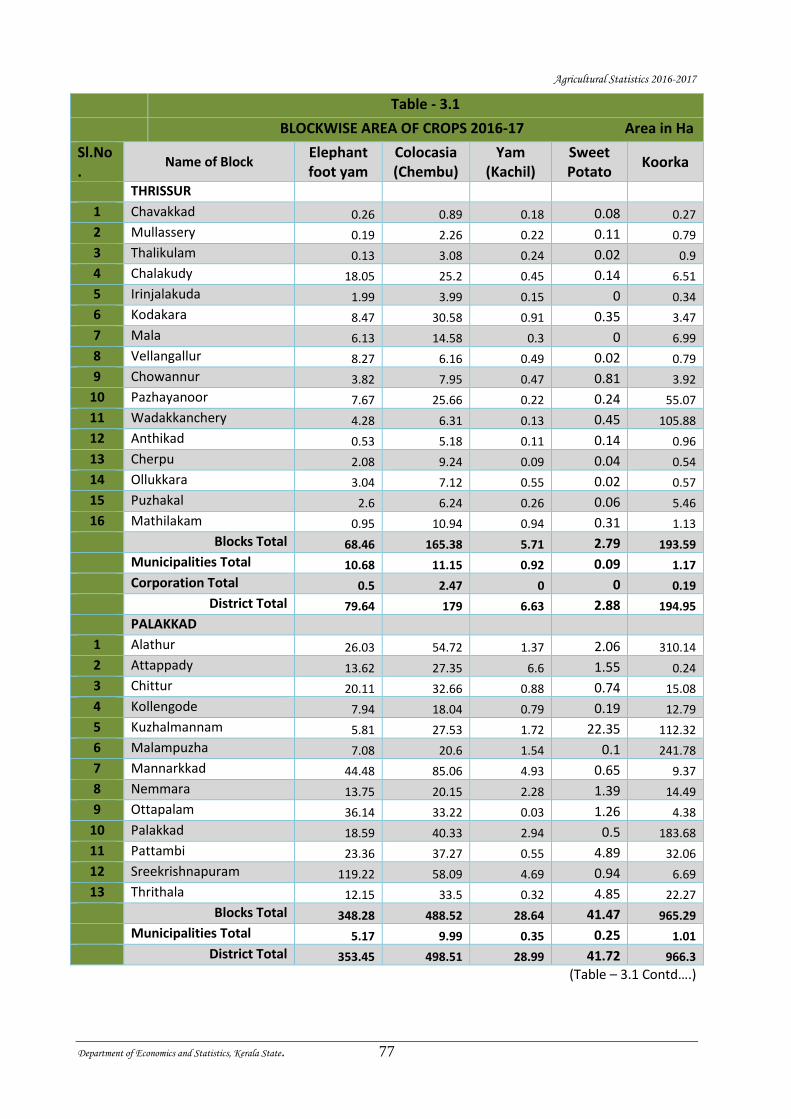
Agricultural Statistics 2016-2017
Department of Economics and Statistics, Kerala State. 77
Table - 3.1
BLOCKWISE AREA OF CROPS 2016-17 Area in Ha
Sl.No.
Name of Block Elephant foot yam
Colocasia (Chembu)
Yam (Kachil)
Sweet Potato
Koorka
THRISSUR
1 Chavakkad 0.26 0.89 0.18 0.08 0.27
2 Mullassery 0.19 2.26 0.22 0.11 0.79
3 Thalikulam 0.13 3.08 0.24 0.02 0.9
4 Chalakudy 18.05 25.2 0.45 0.14 6.51
5 Irinjalakuda 1.99 3.99 0.15 0 0.34
6 Kodakara 8.47 30.58 0.91 0.35 3.47
7 Mala 6.13 14.58 0.3 0 6.99
8 Vellangallur 8.27 6.16 0.49 0.02 0.79
9 Chowannur 3.82 7.95 0.47 0.81 3.92
10 Pazhayanoor 7.67 25.66 0.22 0.24 55.07
11 Wadakkanchery 4.28 6.31 0.13 0.45 105.88
12 Anthikad 0.53 5.18 0.11 0.14 0.96
13 Cherpu 2.08 9.24 0.09 0.04 0.54
14 Ollukkara 3.04 7.12 0.55 0.02 0.57
15 Puzhakal 2.6 6.24 0.26 0.06 5.46
16 Mathilakam 0.95 10.94 0.94 0.31 1.13
Blocks Total 68.46 165.38 5.71 2.79 193.59
Municipalities Total 10.68 11.15 0.92 0.09 1.17
Corporation Total 0.5 2.47 0 0 0.19
District Total 79.64 179 6.63 2.88 194.95
PALAKKAD
1 Alathur 26.03 54.72 1.37 2.06 310.14
2 Attappady 13.62 27.35 6.6 1.55 0.24
3 Chittur 20.11 32.66 0.88 0.74 15.08
4 Kollengode 7.94 18.04 0.79 0.19 12.79
5 Kuzhalmannam 5.81 27.53 1.72 22.35 112.32
6 Malampuzha 7.08 20.6 1.54 0.1 241.78
7 Mannarkkad 44.48 85.06 4.93 0.65 9.37
8 Nemmara 13.75 20.15 2.28 1.39 14.49
9 Ottapalam 36.14 33.22 0.03 1.26 4.38
10 Palakkad 18.59 40.33 2.94 0.5 183.68
11 Pattambi 23.36 37.27 0.55 4.89 32.06
12 Sreekrishnapuram 119.22 58.09 4.69 0.94 6.69
13 Thrithala 12.15 33.5 0.32 4.85 22.27
Blocks Total 348.28 488.52 28.64 41.47 965.29
Municipalities Total 5.17 9.99 0.35 0.25 1.01
District Total 353.45 498.51 28.99 41.72 966.3
(Table – 3.1 Contd….)
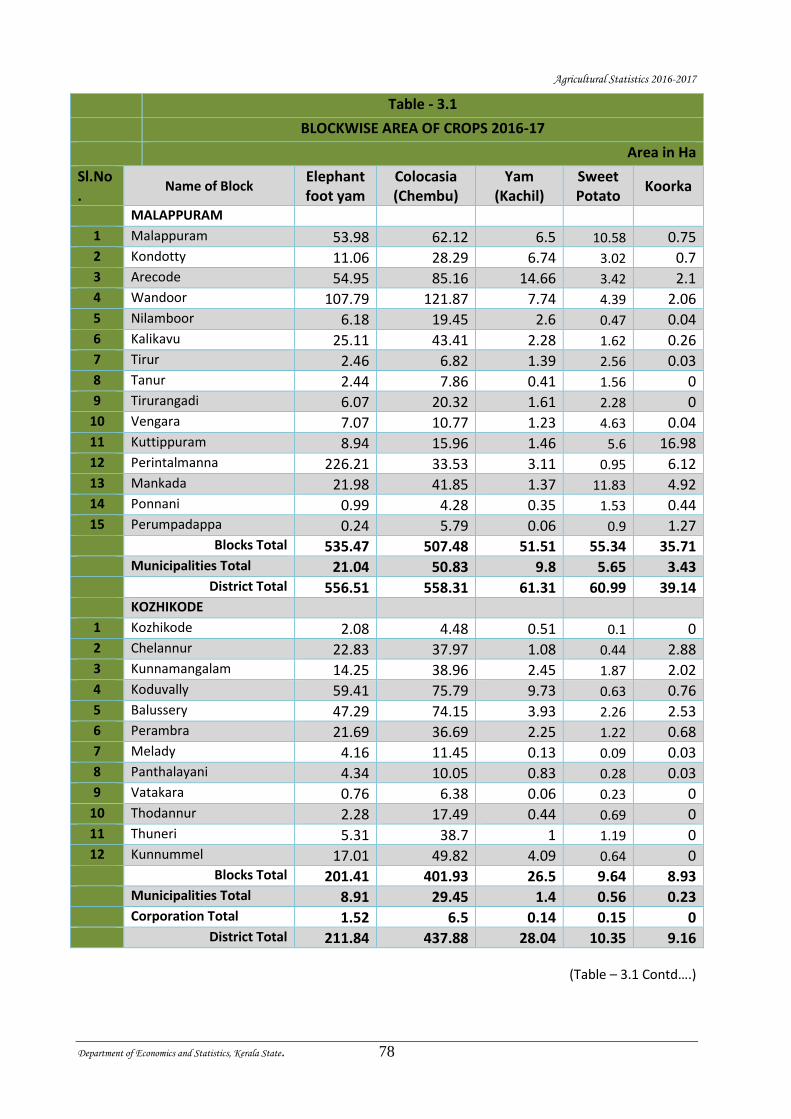
Agricultural Statistics 2016-2017
Department of Economics and Statistics, Kerala State. 78
Table - 3.1
BLOCKWISE AREA OF CROPS 2016-17
Area in Ha
Sl.No.
Name of Block Elephant foot yam
Colocasia (Chembu)
Yam (Kachil)
Sweet Potato
Koorka
MALAPPURAM
1 Malappuram 53.98 62.12 6.5 10.58 0.75 2 Kondotty 11.06 28.29 6.74 3.02 0.7 3 Arecode 54.95 85.16 14.66 3.42 2.1 4 Wandoor 107.79 121.87 7.74 4.39 2.06 5 Nilamboor 6.18 19.45 2.6 0.47 0.04 6 Kalikavu 25.11 43.41 2.28 1.62 0.26 7 Tirur 2.46 6.82 1.39 2.56 0.03 8 Tanur 2.44 7.86 0.41 1.56 0 9 Tirurangadi 6.07 20.32 1.61 2.28 0
10 Vengara 7.07 10.77 1.23 4.63 0.04 11 Kuttippuram 8.94 15.96 1.46 5.6 16.98 12 Perintalmanna 226.21 33.53 3.11 0.95 6.12 13 Mankada 21.98 41.85 1.37 11.83 4.92 14 Ponnani 0.99 4.28 0.35 1.53 0.44 15 Perumpadappa 0.24 5.79 0.06 0.9 1.27 Blocks Total 535.47 507.48 51.51 55.34 35.71 Municipalities Total 21.04 50.83 9.8 5.65 3.43 District Total 556.51 558.31 61.31 60.99 39.14 KOZHIKODE
1 Kozhikode 2.08 4.48 0.51 0.1 0 2 Chelannur 22.83 37.97 1.08 0.44 2.88 3 Kunnamangalam 14.25 38.96 2.45 1.87 2.02 4 Koduvally 59.41 75.79 9.73 0.63 0.76 5 Balussery 47.29 74.15 3.93 2.26 2.53 6 Perambra 21.69 36.69 2.25 1.22 0.68 7 Melady 4.16 11.45 0.13 0.09 0.03 8 Panthalayani 4.34 10.05 0.83 0.28 0.03 9 Vatakara 0.76 6.38 0.06 0.23 0
10 Thodannur 2.28 17.49 0.44 0.69 0 11 Thuneri 5.31 38.7 1 1.19 0 12 Kunnummel 17.01 49.82 4.09 0.64 0 Blocks Total 201.41 401.93 26.5 9.64 8.93 Municipalities Total 8.91 29.45 1.4 0.56 0.23 Corporation Total 1.52 6.5 0.14 0.15 0 District Total 211.84 437.88 28.04 10.35 9.16
(Table – 3.1 Contd….)
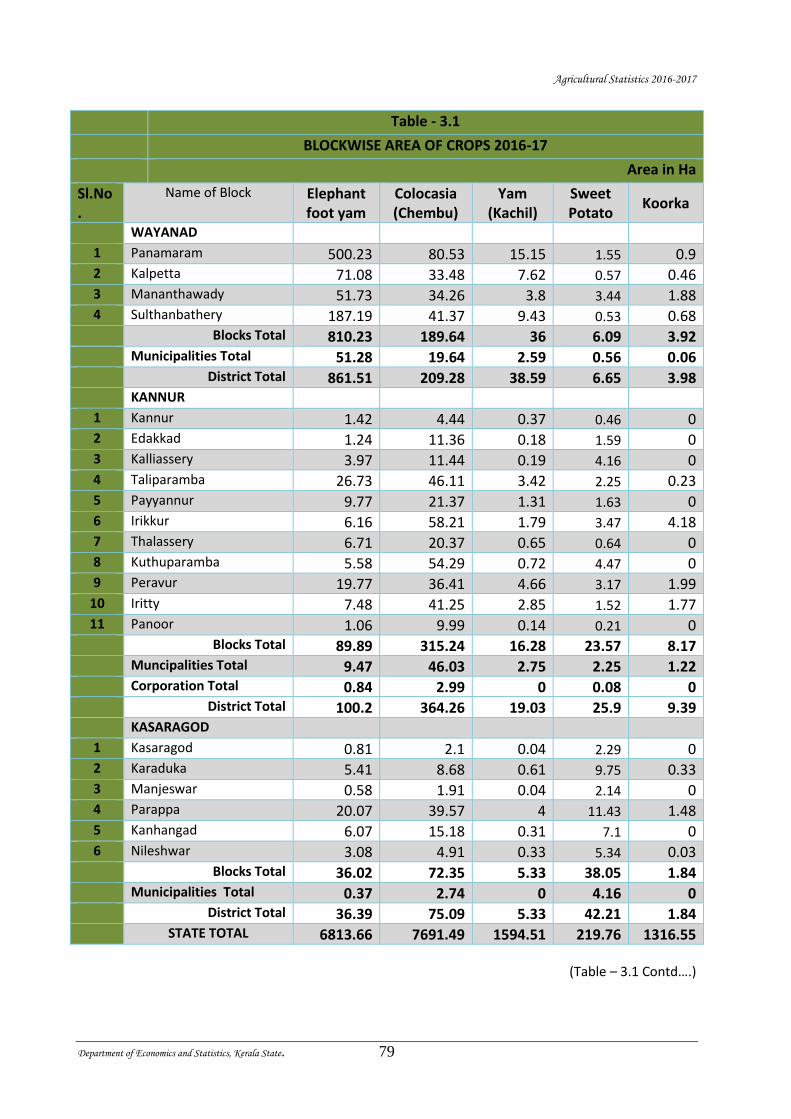
Agricultural Statistics 2016-2017
Department of Economics and Statistics, Kerala State. 79
Table - 3.1
BLOCKWISE AREA OF CROPS 2016-17
Area in Ha
Sl.No.
Name of Block Elephant foot yam
Colocasia (Chembu)
Yam (Kachil)
Sweet Potato
Koorka
WAYANAD
1 Panamaram 500.23 80.53 15.15 1.55 0.9 2 Kalpetta 71.08 33.48 7.62 0.57 0.46 3 Mananthawady 51.73 34.26 3.8 3.44 1.88 4 Sulthanbathery 187.19 41.37 9.43 0.53 0.68 Blocks Total 810.23 189.64 36 6.09 3.92 Municipalities Total 51.28 19.64 2.59 0.56 0.06 District Total 861.51 209.28 38.59 6.65 3.98 KANNUR
1 Kannur 1.42 4.44 0.37 0.46 0 2 Edakkad 1.24 11.36 0.18 1.59 0 3 Kalliassery 3.97 11.44 0.19 4.16 0 4 Taliparamba 26.73 46.11 3.42 2.25 0.23 5 Payyannur 9.77 21.37 1.31 1.63 0 6 Irikkur 6.16 58.21 1.79 3.47 4.18 7 Thalassery 6.71 20.37 0.65 0.64 0 8 Kuthuparamba 5.58 54.29 0.72 4.47 0 9 Peravur 19.77 36.41 4.66 3.17 1.99
10 Iritty 7.48 41.25 2.85 1.52 1.77 11 Panoor 1.06 9.99 0.14 0.21 0 Blocks Total 89.89 315.24 16.28 23.57 8.17 Muncipalities Total 9.47 46.03 2.75 2.25 1.22 Corporation Total 0.84 2.99 0 0.08 0 District Total 100.2 364.26 19.03 25.9 9.39 KASARAGOD
1 Kasaragod 0.81 2.1 0.04 2.29 0 2 Karaduka 5.41 8.68 0.61 9.75 0.33 3 Manjeswar 0.58 1.91 0.04 2.14 0 4 Parappa 20.07 39.57 4 11.43 1.48 5 Kanhangad 6.07 15.18 0.31 7.1 0 6 Nileshwar 3.08 4.91 0.33 5.34 0.03 Blocks Total 36.02 72.35 5.33 38.05 1.84 Municipalities Total 0.37 2.74 0 4.16 0 District Total 36.39 75.09 5.33 42.21 1.84
STATE TOTAL 6813.66 7691.49 1594.51 219.76 1316.55
(Table – 3.1 Contd….)

Agricultural Statistics 2016-2017
Department of Economics and Statistics, Kerala State. 80
Table - 3.1
BLOCKWISE AREA OF CROPS 2016-17
Area in Ha
Sl.No. Name of Block Nanakizhangu Other Tubers Drumstick Amaranthus THIRUVANANTHAPURAM
1 Athiyannoor 0.11 9.88 107.33 28.71 2 Chirayinkeezhu 1.79 5.12 140.63 14.36 3 Kilimanoor 4.02 10.81 344.61 20.5 4 Nedumangad 2.51 2.29 84.51 12.16 5 Nemom 0.49 11.61 235.88 74.56 6 Parassala 1.67 48.48 100.17 42.8 7 Perumkadavila 2.24 38 110.83 46.27 8 Pothencode 0.46 0.91 168.56 9.35 9 Vamanapuram 1.84 11.09 141.89 12.45
10 Varkala 0.69 2.31 149.53 11.08 11 Vellanad 1.03 7.72 150.72 13.46 Blocks Total 16.85 148.22 1734.66 285.7 Municipalities Total 0.71 5.93 103.55 22.85 Corporation Total 0.06 0.5 236.78 10.03 District Total 17.62 154.65 2074.99 318.58 KOLLAM
1 Chittumala 0.74 3.32 267 17.75 2 Ithikkara 1.67 5.98 209.1 14.37 3 Mukhathala 0.79 0.6 174 9.89 4 Chavara 11.28 1.8 84 9.89 5 Oachira 17.36 4.77 98 38.59 6 Sasthamcotta 5.54 5.42 121 16.76 7 Chadayamangalam 8.39 26.07 210 25.34 8 Kottarakara 6.25 5.45 63 14.13 9 Vettikavala 4.65 12.64 93 13.94
10 Anchal 0.36 0.05 191 26.52 11 Pathanapuram 0.73 0.04 47 19.28 Blocks Total 57.76 66.14 1557.1 206.46 Municipalities Total 2 0 81 7.68 Corporation Total 0 2 128.4 9.13 District Total 59.76 68.14 1766.5 223.27
(Table – 3.1 Contd….)
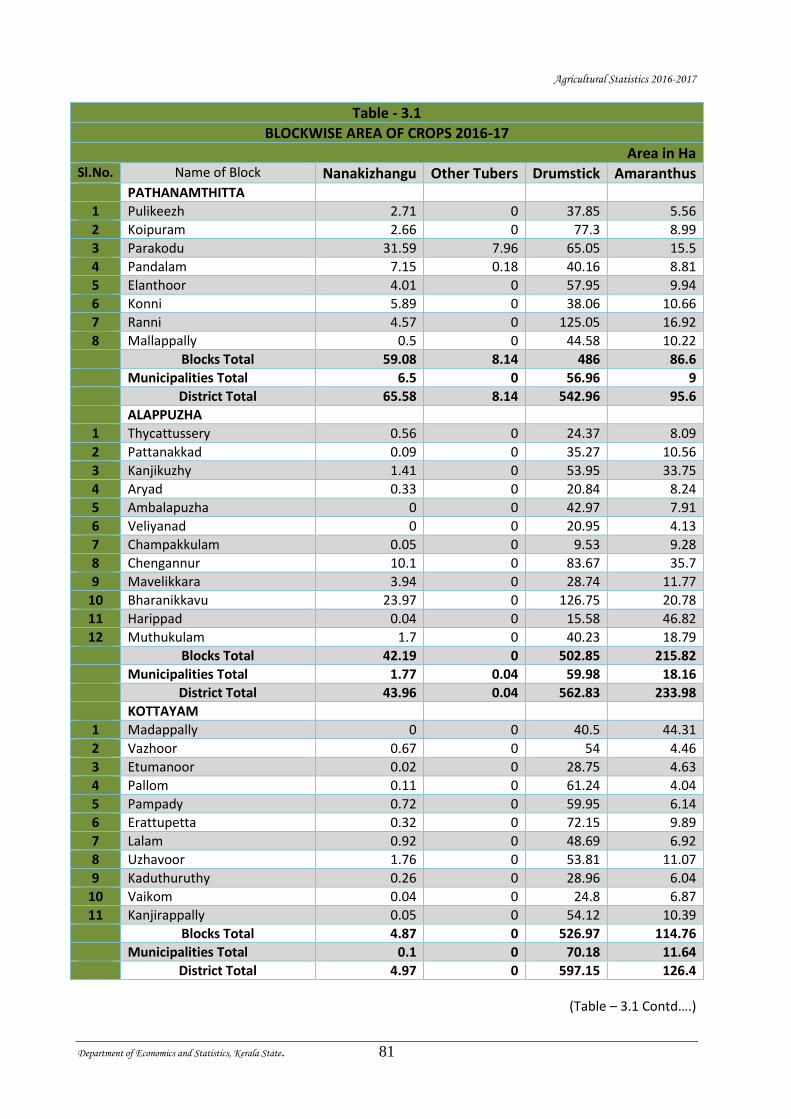
Agricultural Statistics 2016-2017
Department of Economics and Statistics, Kerala State. 81
Table - 3.1
BLOCKWISE AREA OF CROPS 2016-17
Area in Ha Sl.No. Name of Block Nanakizhangu Other Tubers Drumstick Amaranthus PATHANAMTHITTA
1 Pulikeezh 2.71 0 37.85 5.56
2 Koipuram 2.66 0 77.3 8.99
3 Parakodu 31.59 7.96 65.05 15.5
4 Pandalam 7.15 0.18 40.16 8.81
5 Elanthoor 4.01 0 57.95 9.94
6 Konni 5.89 0 38.06 10.66
7 Ranni 4.57 0 125.05 16.92
8 Mallappally 0.5 0 44.58 10.22
Blocks Total 59.08 8.14 486 86.6
Municipalities Total 6.5 0 56.96 9
District Total 65.58 8.14 542.96 95.6
ALAPPUZHA
1 Thycattussery 0.56 0 24.37 8.09
2 Pattanakkad 0.09 0 35.27 10.56
3 Kanjikuzhy 1.41 0 53.95 33.75
4 Aryad 0.33 0 20.84 8.24
5 Ambalapuzha 0 0 42.97 7.91
6 Veliyanad 0 0 20.95 4.13
7 Champakkulam 0.05 0 9.53 9.28
8 Chengannur 10.1 0 83.67 35.7
9 Mavelikkara 3.94 0 28.74 11.77
10 Bharanikkavu 23.97 0 126.75 20.78
11 Harippad 0.04 0 15.58 46.82
12 Muthukulam 1.7 0 40.23 18.79
Blocks Total 42.19 0 502.85 215.82
Municipalities Total 1.77 0.04 59.98 18.16
District Total 43.96 0.04 562.83 233.98
KOTTAYAM
1 Madappally 0 0 40.5 44.31
2 Vazhoor 0.67 0 54 4.46
3 Etumanoor 0.02 0 28.75 4.63
4 Pallom 0.11 0 61.24 4.04
5 Pampady 0.72 0 59.95 6.14
6 Erattupetta 0.32 0 72.15 9.89
7 Lalam 0.92 0 48.69 6.92
8 Uzhavoor 1.76 0 53.81 11.07
9 Kaduthuruthy 0.26 0 28.96 6.04
10 Vaikom 0.04 0 24.8 6.87
11 Kanjirappally 0.05 0 54.12 10.39
Blocks Total 4.87 0 526.97 114.76
Municipalities Total 0.1 0 70.18 11.64
District Total 4.97 0 597.15 126.4
(Table – 3.1 Contd….)

Agricultural Statistics 2016-2017
Department of Economics and Statistics, Kerala State. 82
Table - 3.1
BLOCKWISE AREA OF CROPS 2016-17
Area in Ha
Sl.No. Name of Block Nanakizhangu Other Tubers Drumstick Amaranthus IDUKKI
1 Adimaly 0.09 5.37 76.78 6.29 2 Devikulam 0 0.06 49.5 4.45 3 Azhutha 0 0.09 227.73 16.12 4 Nedumkandam 0 0 42.33 8.71 5 Kattapana 0 0 53.38 9.53 6 Idukki 0.06 0 104.67 12.11 7 Thodupuzha 0.61 0 31.91 6.41 8 Elamdesam 1.87 0 61.82 12.36 Blocks Total 2.63 5.52 648.12 75.98 Municipalities Total 0.12 0 46.13 4.37 District Total 2.75 5.52 694.25 80.35 ERNAKULAM
1 Angamaly 0 0 41.07 25.62 2 Parakkadavu 0 0.04 48.52 48.63 3 Vazhakulam 0.35 0.46 103.34 12.27 4 Mulanthuruthy 0.08 0 57.32 3.37 5 Edappally 0 0 6.23 2.16 6 Palluruthy 0 0 12.85 2.59 7 Vypin 0 0 15.68 2.84 8 Vadavucode 0.04 0.5 47.27 2.74 9 Koovappady 0.04 0.81 33.85 4.83
10 Kothamangalam 0.56 0.24 40.89 4.38 11 Muvattupuzha 1.2 0.36 39.15 8.77 12 Pampakuda 0.38 0 18.23 4.36 13 Parur 0 0.08 23.55 7.29 14 Alangad 0 0 11.56 26.63 Blocks Total 2.65 2.49 499.51 156.48 Muncipalities Total 0.08 0.13 92.81 7.95 Corporation Total 0 0 35.77 0.44 District Total 2.73 2.62 628.09 164.87
(Table – 3.1 Contd….)
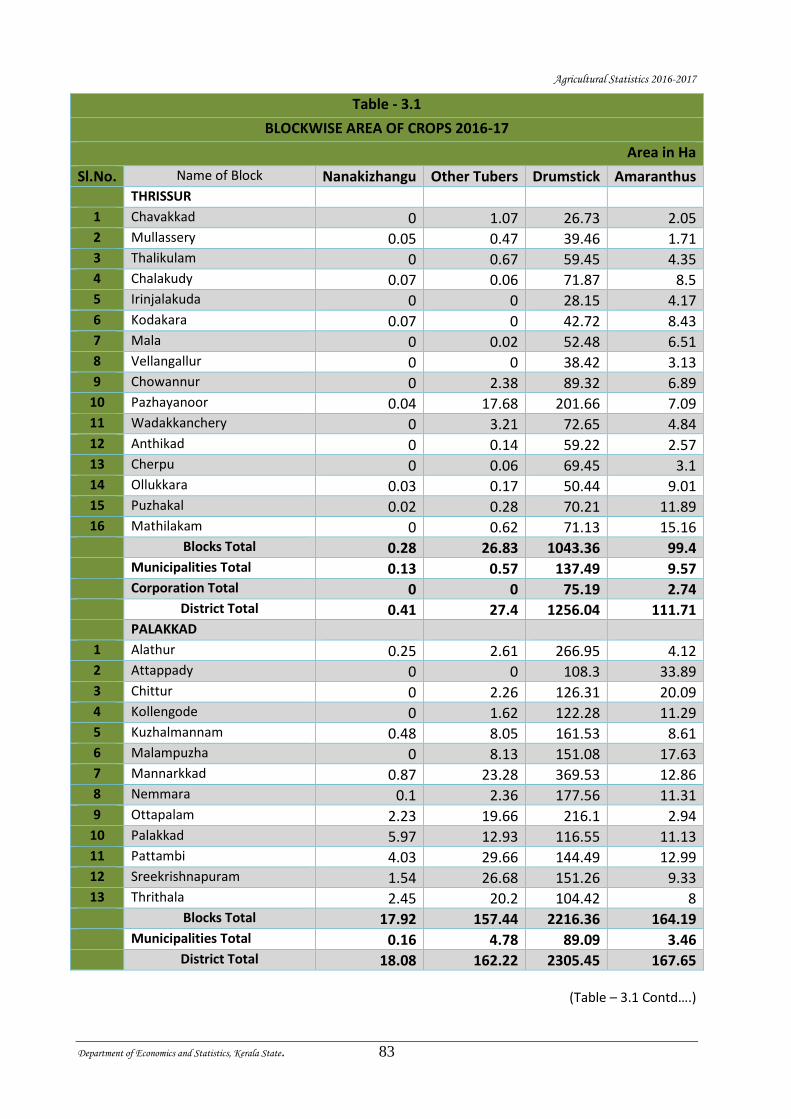
Agricultural Statistics 2016-2017
Department of Economics and Statistics, Kerala State. 83
Table - 3.1
BLOCKWISE AREA OF CROPS 2016-17
Area in Ha
Sl.No. Name of Block Nanakizhangu Other Tubers Drumstick Amaranthus THRISSUR
1 Chavakkad 0 1.07 26.73 2.05 2 Mullassery 0.05 0.47 39.46 1.71 3 Thalikulam 0 0.67 59.45 4.35 4 Chalakudy 0.07 0.06 71.87 8.5 5 Irinjalakuda 0 0 28.15 4.17 6 Kodakara 0.07 0 42.72 8.43 7 Mala 0 0.02 52.48 6.51 8 Vellangallur 0 0 38.42 3.13 9 Chowannur 0 2.38 89.32 6.89
10 Pazhayanoor 0.04 17.68 201.66 7.09 11 Wadakkanchery 0 3.21 72.65 4.84 12 Anthikad 0 0.14 59.22 2.57 13 Cherpu 0 0.06 69.45 3.1 14 Ollukkara 0.03 0.17 50.44 9.01 15 Puzhakal 0.02 0.28 70.21 11.89 16 Mathilakam 0 0.62 71.13 15.16 Blocks Total 0.28 26.83 1043.36 99.4 Municipalities Total 0.13 0.57 137.49 9.57 Corporation Total 0 0 75.19 2.74 District Total 0.41 27.4 1256.04 111.71 PALAKKAD
1 Alathur 0.25 2.61 266.95 4.12 2 Attappady 0 0 108.3 33.89 3 Chittur 0 2.26 126.31 20.09 4 Kollengode 0 1.62 122.28 11.29 5 Kuzhalmannam 0.48 8.05 161.53 8.61 6 Malampuzha 0 8.13 151.08 17.63 7 Mannarkkad 0.87 23.28 369.53 12.86 8 Nemmara 0.1 2.36 177.56 11.31 9 Ottapalam 2.23 19.66 216.1 2.94
10 Palakkad 5.97 12.93 116.55 11.13 11 Pattambi 4.03 29.66 144.49 12.99 12 Sreekrishnapuram 1.54 26.68 151.26 9.33 13 Thrithala 2.45 20.2 104.42 8 Blocks Total 17.92 157.44 2216.36 164.19 Municipalities Total 0.16 4.78 89.09 3.46 District Total 18.08 162.22 2305.45 167.65
(Table – 3.1 Contd….)
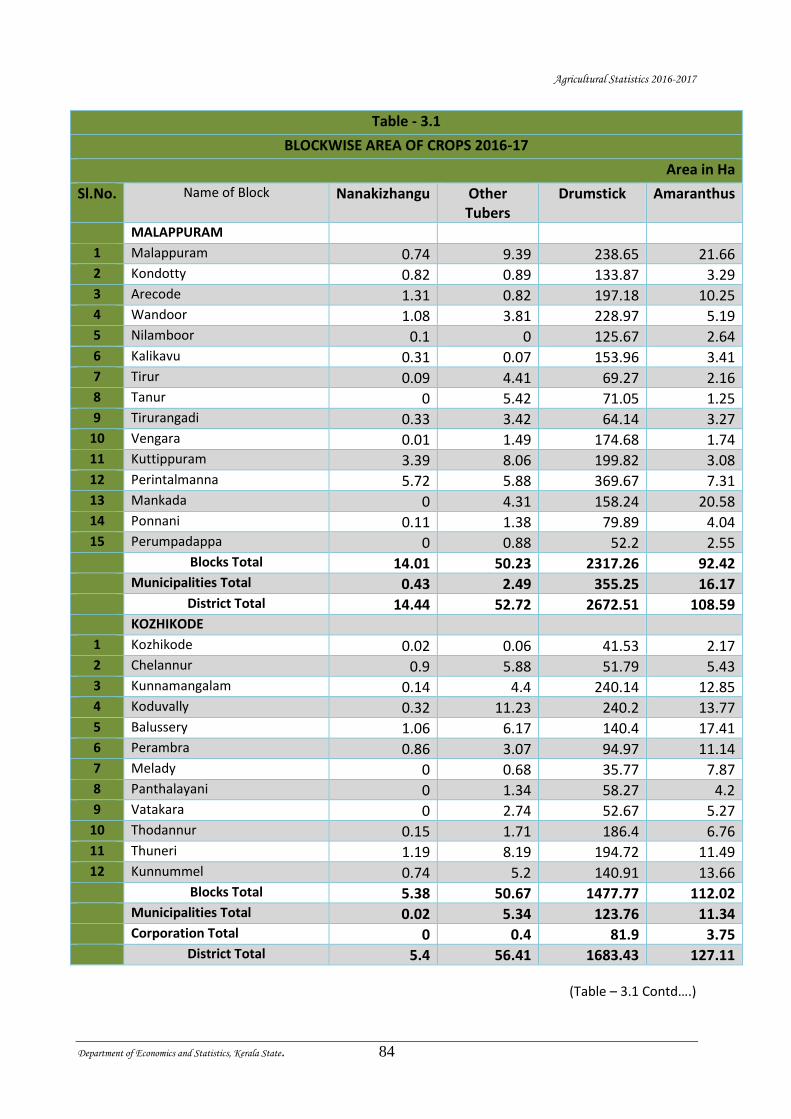
Agricultural Statistics 2016-2017
Department of Economics and Statistics, Kerala State. 84
Table - 3.1
BLOCKWISE AREA OF CROPS 2016-17
Area in Ha
Sl.No. Name of Block Nanakizhangu Other Tubers
Drumstick Amaranthus
MALAPPURAM
1 Malappuram 0.74 9.39 238.65 21.66 2 Kondotty 0.82 0.89 133.87 3.29 3 Arecode 1.31 0.82 197.18 10.25 4 Wandoor 1.08 3.81 228.97 5.19 5 Nilamboor 0.1 0 125.67 2.64 6 Kalikavu 0.31 0.07 153.96 3.41 7 Tirur 0.09 4.41 69.27 2.16 8 Tanur 0 5.42 71.05 1.25 9 Tirurangadi 0.33 3.42 64.14 3.27
10 Vengara 0.01 1.49 174.68 1.74 11 Kuttippuram 3.39 8.06 199.82 3.08 12 Perintalmanna 5.72 5.88 369.67 7.31 13 Mankada 0 4.31 158.24 20.58 14 Ponnani 0.11 1.38 79.89 4.04 15 Perumpadappa 0 0.88 52.2 2.55 Blocks Total 14.01 50.23 2317.26 92.42 Municipalities Total 0.43 2.49 355.25 16.17 District Total 14.44 52.72 2672.51 108.59 KOZHIKODE
1 Kozhikode 0.02 0.06 41.53 2.17 2 Chelannur 0.9 5.88 51.79 5.43 3 Kunnamangalam 0.14 4.4 240.14 12.85 4 Koduvally 0.32 11.23 240.2 13.77 5 Balussery 1.06 6.17 140.4 17.41 6 Perambra 0.86 3.07 94.97 11.14 7 Melady 0 0.68 35.77 7.87 8 Panthalayani 0 1.34 58.27 4.2 9 Vatakara 0 2.74 52.67 5.27
10 Thodannur 0.15 1.71 186.4 6.76 11 Thuneri 1.19 8.19 194.72 11.49 12 Kunnummel 0.74 5.2 140.91 13.66 Blocks Total 5.38 50.67 1477.77 112.02 Municipalities Total 0.02 5.34 123.76 11.34 Corporation Total 0 0.4 81.9 3.75 District Total 5.4 56.41 1683.43 127.11
(Table – 3.1 Contd….)
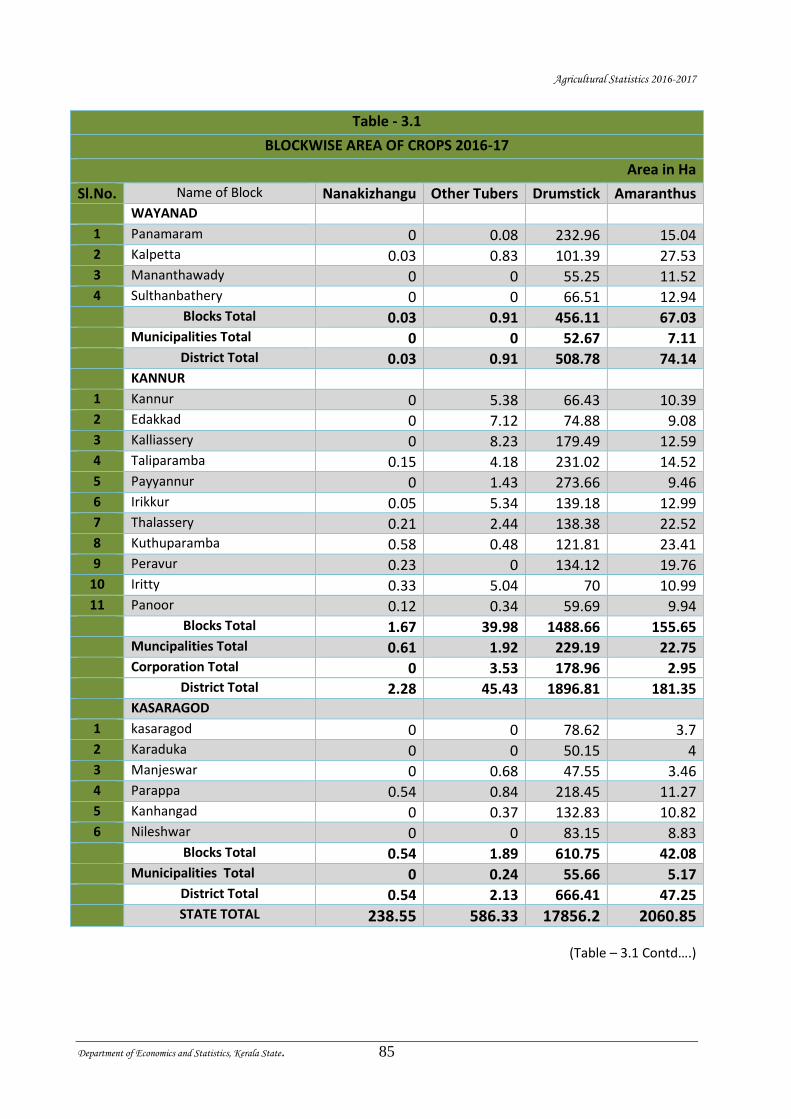
Agricultural Statistics 2016-2017
Department of Economics and Statistics, Kerala State. 85
Table - 3.1
BLOCKWISE AREA OF CROPS 2016-17
Area in Ha
Sl.No. Name of Block Nanakizhangu Other Tubers Drumstick Amaranthus WAYANAD
1 Panamaram 0 0.08 232.96 15.04 2 Kalpetta 0.03 0.83 101.39 27.53 3 Mananthawady 0 0 55.25 11.52 4 Sulthanbathery 0 0 66.51 12.94 Blocks Total 0.03 0.91 456.11 67.03 Municipalities Total 0 0 52.67 7.11 District Total 0.03 0.91 508.78 74.14 KANNUR
1 Kannur 0 5.38 66.43 10.39 2 Edakkad 0 7.12 74.88 9.08 3 Kalliassery 0 8.23 179.49 12.59 4 Taliparamba 0.15 4.18 231.02 14.52 5 Payyannur 0 1.43 273.66 9.46 6 Irikkur 0.05 5.34 139.18 12.99 7 Thalassery 0.21 2.44 138.38 22.52 8 Kuthuparamba 0.58 0.48 121.81 23.41 9 Peravur 0.23 0 134.12 19.76
10 Iritty 0.33 5.04 70 10.99 11 Panoor 0.12 0.34 59.69 9.94 Blocks Total 1.67 39.98 1488.66 155.65 Muncipalities Total 0.61 1.92 229.19 22.75 Corporation Total 0 3.53 178.96 2.95 District Total 2.28 45.43 1896.81 181.35 KASARAGOD
1 kasaragod 0 0 78.62 3.7 2 Karaduka 0 0 50.15 4 3 Manjeswar 0 0.68 47.55 3.46 4 Parappa 0.54 0.84 218.45 11.27 5 Kanhangad 0 0.37 132.83 10.82 6 Nileshwar 0 0 83.15 8.83 Blocks Total 0.54 1.89 610.75 42.08 Municipalities Total 0 0.24 55.66 5.17 District Total 0.54 2.13 666.41 47.25
STATE TOTAL 238.55 586.33 17856.2 2060.85
(Table – 3.1 Contd….)
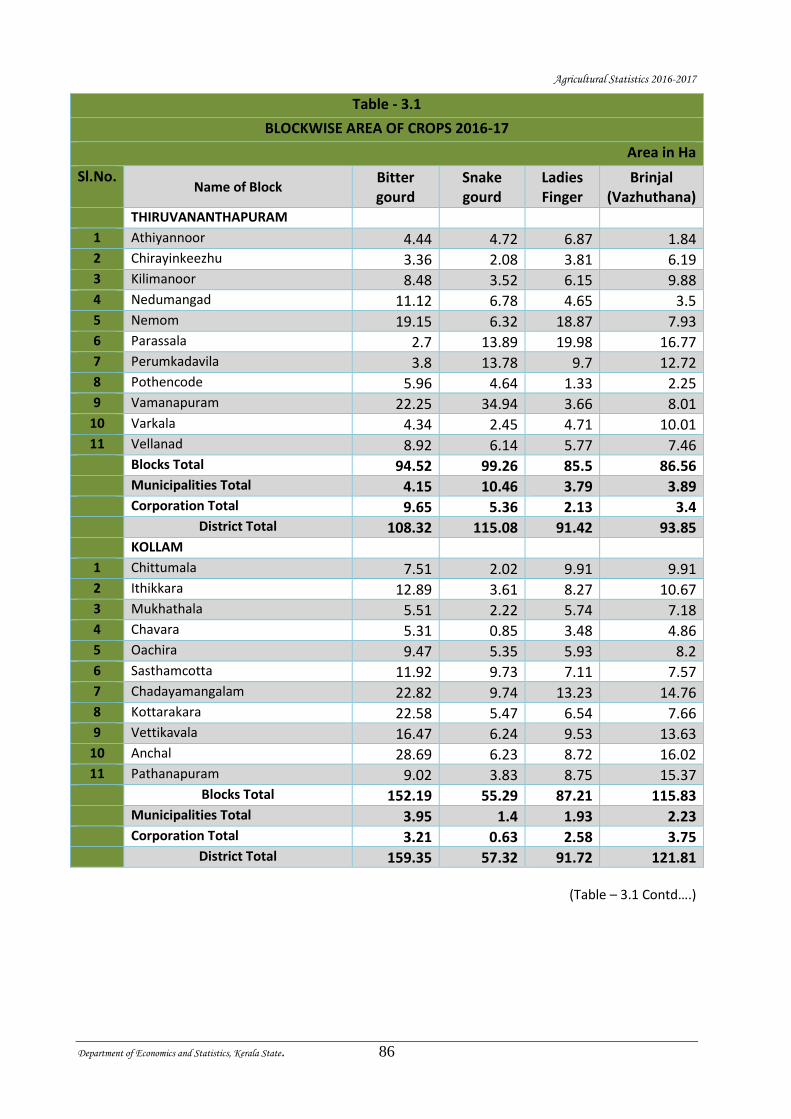
Agricultural Statistics 2016-2017
Department of Economics and Statistics, Kerala State. 86
Table - 3.1
BLOCKWISE AREA OF CROPS 2016-17
Area in Ha
Sl.No. Name of Block
Bitter gourd
Snake gourd
Ladies Finger
Brinjal (Vazhuthana)
THIRUVANANTHAPURAM
1 Athiyannoor 4.44 4.72 6.87 1.84 2 Chirayinkeezhu 3.36 2.08 3.81 6.19 3 Kilimanoor 8.48 3.52 6.15 9.88 4 Nedumangad 11.12 6.78 4.65 3.5 5 Nemom 19.15 6.32 18.87 7.93 6 Parassala 2.7 13.89 19.98 16.77 7 Perumkadavila 3.8 13.78 9.7 12.72 8 Pothencode 5.96 4.64 1.33 2.25 9 Vamanapuram 22.25 34.94 3.66 8.01
10 Varkala 4.34 2.45 4.71 10.01 11 Vellanad 8.92 6.14 5.77 7.46 Blocks Total 94.52 99.26 85.5 86.56 Municipalities Total 4.15 10.46 3.79 3.89 Corporation Total 9.65 5.36 2.13 3.4 District Total 108.32 115.08 91.42 93.85 KOLLAM
1 Chittumala 7.51 2.02 9.91 9.91 2 Ithikkara 12.89 3.61 8.27 10.67 3 Mukhathala 5.51 2.22 5.74 7.18 4 Chavara 5.31 0.85 3.48 4.86 5 Oachira 9.47 5.35 5.93 8.2 6 Sasthamcotta 11.92 9.73 7.11 7.57 7 Chadayamangalam 22.82 9.74 13.23 14.76 8 Kottarakara 22.58 5.47 6.54 7.66 9 Vettikavala 16.47 6.24 9.53 13.63
10 Anchal 28.69 6.23 8.72 16.02 11 Pathanapuram 9.02 3.83 8.75 15.37 Blocks Total 152.19 55.29 87.21 115.83 Municipalities Total 3.95 1.4 1.93 2.23 Corporation Total 3.21 0.63 2.58 3.75 District Total 159.35 57.32 91.72 121.81
(Table – 3.1 Contd….)
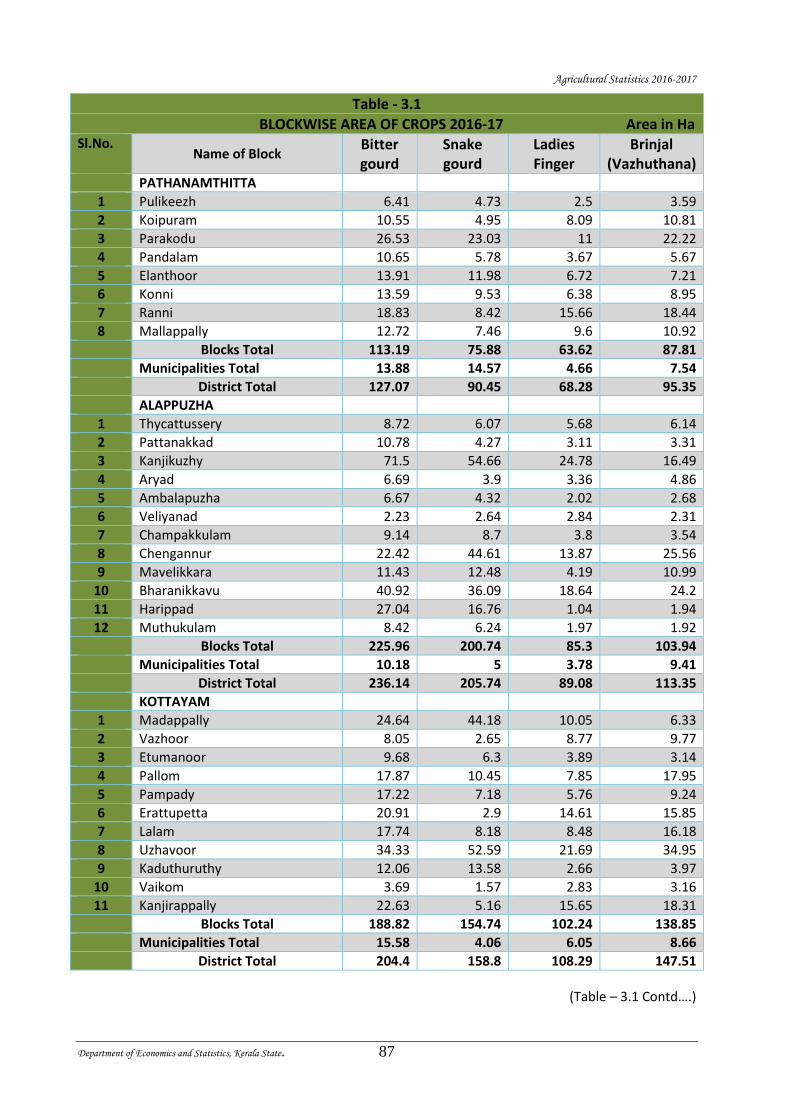
Agricultural Statistics 2016-2017
Department of Economics and Statistics, Kerala State. 87
Table - 3.1
BLOCKWISE AREA OF CROPS 2016-17 Area in Ha Sl.No.
Name of Block Bitter gourd
Snake gourd
Ladies Finger
Brinjal (Vazhuthana)
PATHANAMTHITTA
1 Pulikeezh 6.41 4.73 2.5 3.59
2 Koipuram 10.55 4.95 8.09 10.81
3 Parakodu 26.53 23.03 11 22.22
4 Pandalam 10.65 5.78 3.67 5.67
5 Elanthoor 13.91 11.98 6.72 7.21
6 Konni 13.59 9.53 6.38 8.95
7 Ranni 18.83 8.42 15.66 18.44
8 Mallappally 12.72 7.46 9.6 10.92
Blocks Total 113.19 75.88 63.62 87.81
Municipalities Total 13.88 14.57 4.66 7.54
District Total 127.07 90.45 68.28 95.35
ALAPPUZHA
1 Thycattussery 8.72 6.07 5.68 6.14
2 Pattanakkad 10.78 4.27 3.11 3.31
3 Kanjikuzhy 71.5 54.66 24.78 16.49
4 Aryad 6.69 3.9 3.36 4.86
5 Ambalapuzha 6.67 4.32 2.02 2.68
6 Veliyanad 2.23 2.64 2.84 2.31
7 Champakkulam 9.14 8.7 3.8 3.54
8 Chengannur 22.42 44.61 13.87 25.56
9 Mavelikkara 11.43 12.48 4.19 10.99
10 Bharanikkavu 40.92 36.09 18.64 24.2
11 Harippad 27.04 16.76 1.04 1.94
12 Muthukulam 8.42 6.24 1.97 1.92
Blocks Total 225.96 200.74 85.3 103.94
Municipalities Total 10.18 5 3.78 9.41
District Total 236.14 205.74 89.08 113.35
KOTTAYAM
1 Madappally 24.64 44.18 10.05 6.33
2 Vazhoor 8.05 2.65 8.77 9.77
3 Etumanoor 9.68 6.3 3.89 3.14
4 Pallom 17.87 10.45 7.85 17.95
5 Pampady 17.22 7.18 5.76 9.24
6 Erattupetta 20.91 2.9 14.61 15.85
7 Lalam 17.74 8.18 8.48 16.18
8 Uzhavoor 34.33 52.59 21.69 34.95
9 Kaduthuruthy 12.06 13.58 2.66 3.97
10 Vaikom 3.69 1.57 2.83 3.16
11 Kanjirappally 22.63 5.16 15.65 18.31
Blocks Total 188.82 154.74 102.24 138.85
Municipalities Total 15.58 4.06 6.05 8.66
District Total 204.4 158.8 108.29 147.51
(Table – 3.1 Contd….)
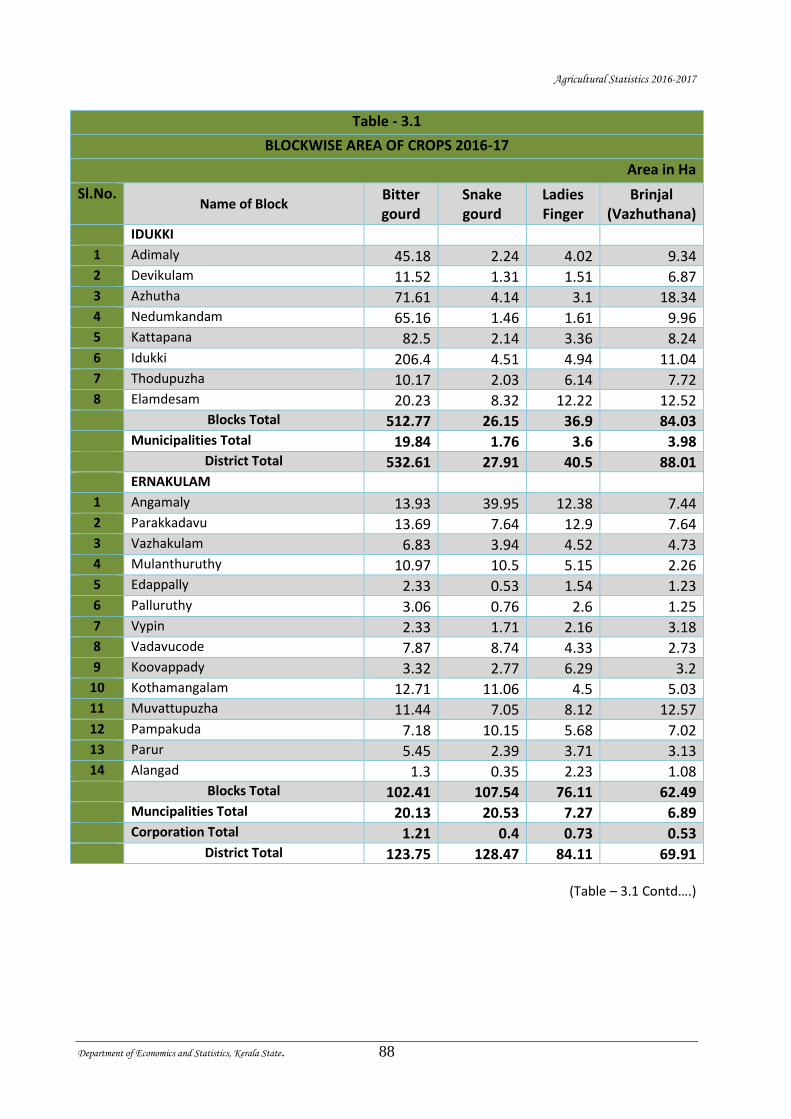
Agricultural Statistics 2016-2017
Department of Economics and Statistics, Kerala State. 88
Table - 3.1
BLOCKWISE AREA OF CROPS 2016-17
Area in Ha
Sl.No. Name of Block
Bitter gourd
Snake gourd
Ladies Finger
Brinjal (Vazhuthana)
IDUKKI
1 Adimaly 45.18 2.24 4.02 9.34 2 Devikulam 11.52 1.31 1.51 6.87 3 Azhutha 71.61 4.14 3.1 18.34 4 Nedumkandam 65.16 1.46 1.61 9.96 5 Kattapana 82.5 2.14 3.36 8.24 6 Idukki 206.4 4.51 4.94 11.04 7 Thodupuzha 10.17 2.03 6.14 7.72 8 Elamdesam 20.23 8.32 12.22 12.52 Blocks Total 512.77 26.15 36.9 84.03 Municipalities Total 19.84 1.76 3.6 3.98 District Total 532.61 27.91 40.5 88.01 ERNAKULAM
1 Angamaly 13.93 39.95 12.38 7.44 2 Parakkadavu 13.69 7.64 12.9 7.64 3 Vazhakulam 6.83 3.94 4.52 4.73 4 Mulanthuruthy 10.97 10.5 5.15 2.26 5 Edappally 2.33 0.53 1.54 1.23 6 Palluruthy 3.06 0.76 2.6 1.25 7 Vypin 2.33 1.71 2.16 3.18 8 Vadavucode 7.87 8.74 4.33 2.73 9 Koovappady 3.32 2.77 6.29 3.2
10 Kothamangalam 12.71 11.06 4.5 5.03 11 Muvattupuzha 11.44 7.05 8.12 12.57 12 Pampakuda 7.18 10.15 5.68 7.02 13 Parur 5.45 2.39 3.71 3.13 14 Alangad 1.3 0.35 2.23 1.08 Blocks Total 102.41 107.54 76.11 62.49 Muncipalities Total 20.13 20.53 7.27 6.89 Corporation Total 1.21 0.4 0.73 0.53 District Total 123.75 128.47 84.11 69.91
(Table – 3.1 Contd….)
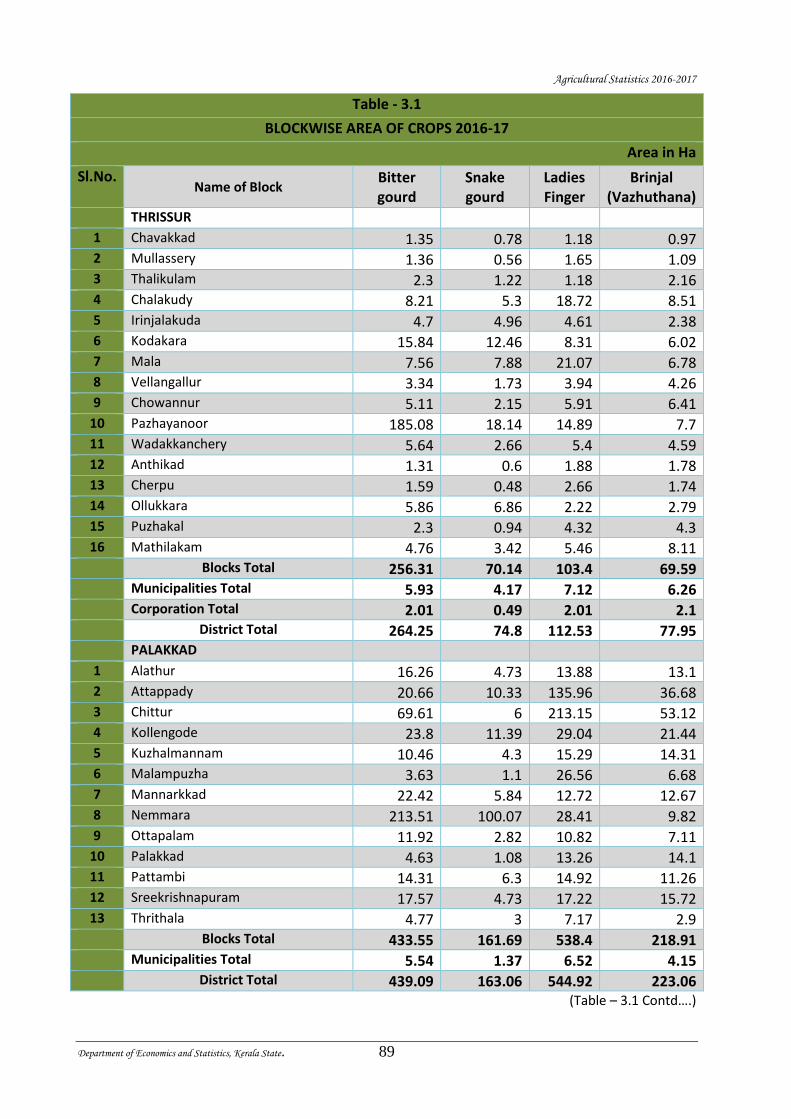
Agricultural Statistics 2016-2017
Department of Economics and Statistics, Kerala State. 89
Table - 3.1
BLOCKWISE AREA OF CROPS 2016-17
Area in Ha
Sl.No. Name of Block
Bitter gourd
Snake gourd
Ladies Finger
Brinjal (Vazhuthana)
THRISSUR
1 Chavakkad 1.35 0.78 1.18 0.97 2 Mullassery 1.36 0.56 1.65 1.09 3 Thalikulam 2.3 1.22 1.18 2.16 4 Chalakudy 8.21 5.3 18.72 8.51 5 Irinjalakuda 4.7 4.96 4.61 2.38 6 Kodakara 15.84 12.46 8.31 6.02 7 Mala 7.56 7.88 21.07 6.78 8 Vellangallur 3.34 1.73 3.94 4.26 9 Chowannur 5.11 2.15 5.91 6.41
10 Pazhayanoor 185.08 18.14 14.89 7.7 11 Wadakkanchery 5.64 2.66 5.4 4.59 12 Anthikad 1.31 0.6 1.88 1.78 13 Cherpu 1.59 0.48 2.66 1.74 14 Ollukkara 5.86 6.86 2.22 2.79 15 Puzhakal 2.3 0.94 4.32 4.3 16 Mathilakam 4.76 3.42 5.46 8.11 Blocks Total 256.31 70.14 103.4 69.59 Municipalities Total 5.93 4.17 7.12 6.26 Corporation Total 2.01 0.49 2.01 2.1 District Total 264.25 74.8 112.53 77.95 PALAKKAD
1 Alathur 16.26 4.73 13.88 13.1 2 Attappady 20.66 10.33 135.96 36.68 3 Chittur 69.61 6 213.15 53.12 4 Kollengode 23.8 11.39 29.04 21.44 5 Kuzhalmannam 10.46 4.3 15.29 14.31 6 Malampuzha 3.63 1.1 26.56 6.68 7 Mannarkkad 22.42 5.84 12.72 12.67 8 Nemmara 213.51 100.07 28.41 9.82 9 Ottapalam 11.92 2.82 10.82 7.11
10 Palakkad 4.63 1.08 13.26 14.1 11 Pattambi 14.31 6.3 14.92 11.26 12 Sreekrishnapuram 17.57 4.73 17.22 15.72 13 Thrithala 4.77 3 7.17 2.9 Blocks Total 433.55 161.69 538.4 218.91 Municipalities Total 5.54 1.37 6.52 4.15 District Total 439.09 163.06 544.92 223.06
(Table – 3.1 Contd….)
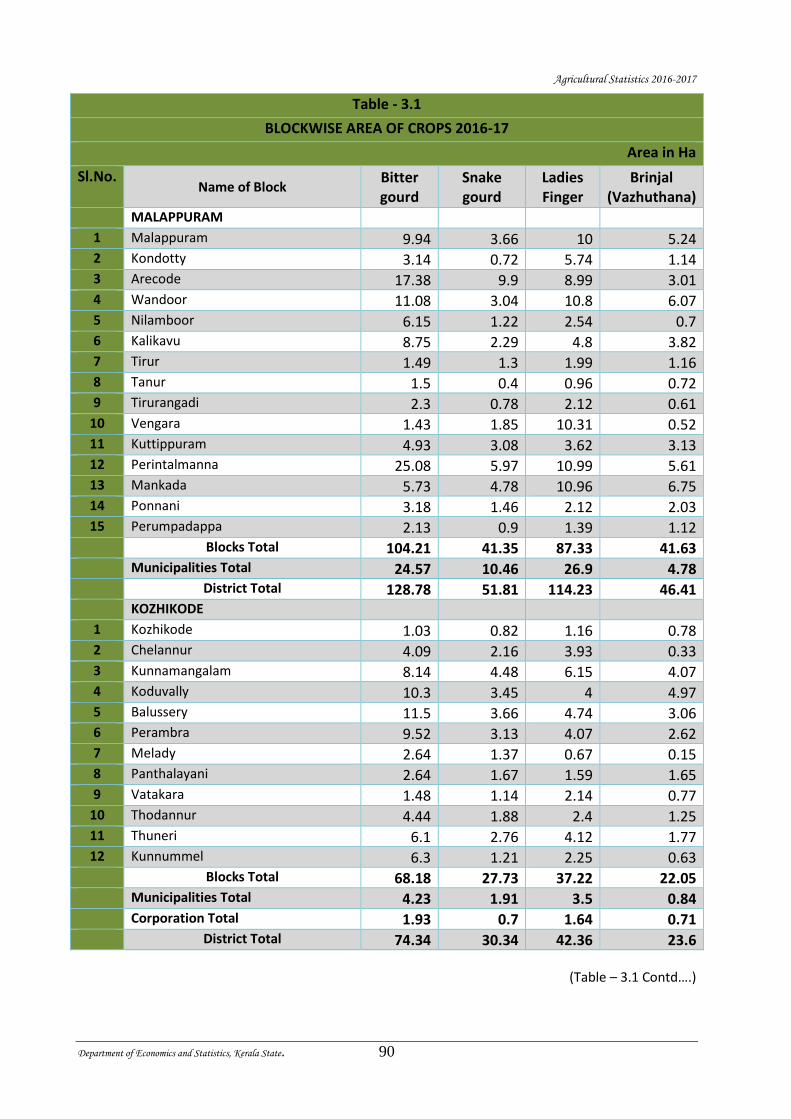
Agricultural Statistics 2016-2017
Department of Economics and Statistics, Kerala State. 90
Table - 3.1
BLOCKWISE AREA OF CROPS 2016-17
Area in Ha
Sl.No. Name of Block
Bitter gourd
Snake gourd
Ladies Finger
Brinjal (Vazhuthana)
MALAPPURAM
1 Malappuram 9.94 3.66 10 5.24 2 Kondotty 3.14 0.72 5.74 1.14 3 Arecode 17.38 9.9 8.99 3.01 4 Wandoor 11.08 3.04 10.8 6.07 5 Nilamboor 6.15 1.22 2.54 0.7 6 Kalikavu 8.75 2.29 4.8 3.82 7 Tirur 1.49 1.3 1.99 1.16 8 Tanur 1.5 0.4 0.96 0.72 9 Tirurangadi 2.3 0.78 2.12 0.61
10 Vengara 1.43 1.85 10.31 0.52 11 Kuttippuram 4.93 3.08 3.62 3.13 12 Perintalmanna 25.08 5.97 10.99 5.61 13 Mankada 5.73 4.78 10.96 6.75 14 Ponnani 3.18 1.46 2.12 2.03 15 Perumpadappa 2.13 0.9 1.39 1.12 Blocks Total 104.21 41.35 87.33 41.63 Municipalities Total 24.57 10.46 26.9 4.78 District Total 128.78 51.81 114.23 46.41 KOZHIKODE
1 Kozhikode 1.03 0.82 1.16 0.78 2 Chelannur 4.09 2.16 3.93 0.33 3 Kunnamangalam 8.14 4.48 6.15 4.07 4 Koduvally 10.3 3.45 4 4.97 5 Balussery 11.5 3.66 4.74 3.06 6 Perambra 9.52 3.13 4.07 2.62 7 Melady 2.64 1.37 0.67 0.15 8 Panthalayani 2.64 1.67 1.59 1.65 9 Vatakara 1.48 1.14 2.14 0.77
10 Thodannur 4.44 1.88 2.4 1.25 11 Thuneri 6.1 2.76 4.12 1.77 12 Kunnummel 6.3 1.21 2.25 0.63 Blocks Total 68.18 27.73 37.22 22.05 Municipalities Total 4.23 1.91 3.5 0.84 Corporation Total 1.93 0.7 1.64 0.71 District Total 74.34 30.34 42.36 23.6
(Table – 3.1 Contd….)
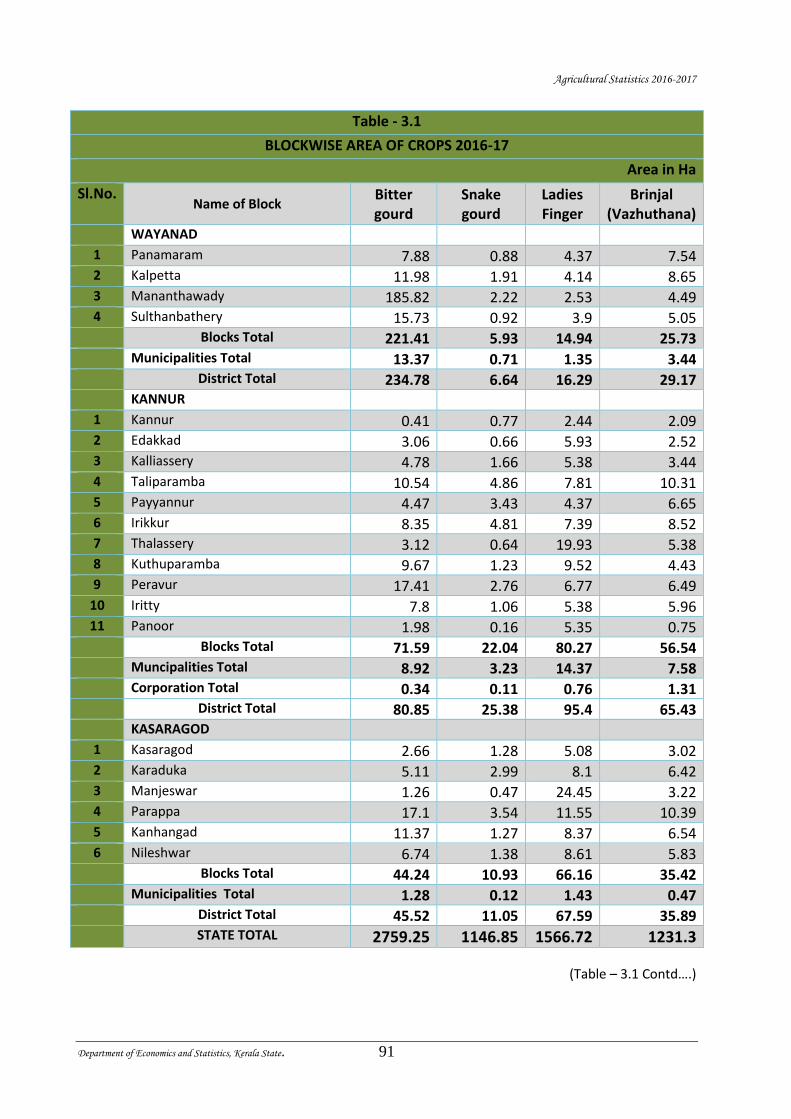
Agricultural Statistics 2016-2017
Department of Economics and Statistics, Kerala State. 91
Table - 3.1
BLOCKWISE AREA OF CROPS 2016-17
Area in Ha
Sl.No. Name of Block
Bitter gourd
Snake gourd
Ladies Finger
Brinjal (Vazhuthana)
WAYANAD
1 Panamaram 7.88 0.88 4.37 7.54 2 Kalpetta 11.98 1.91 4.14 8.65 3 Mananthawady 185.82 2.22 2.53 4.49 4 Sulthanbathery 15.73 0.92 3.9 5.05 Blocks Total 221.41 5.93 14.94 25.73 Municipalities Total 13.37 0.71 1.35 3.44 District Total 234.78 6.64 16.29 29.17 KANNUR
1 Kannur 0.41 0.77 2.44 2.09 2 Edakkad 3.06 0.66 5.93 2.52 3 Kalliassery 4.78 1.66 5.38 3.44 4 Taliparamba 10.54 4.86 7.81 10.31 5 Payyannur 4.47 3.43 4.37 6.65 6 Irikkur 8.35 4.81 7.39 8.52 7 Thalassery 3.12 0.64 19.93 5.38 8 Kuthuparamba 9.67 1.23 9.52 4.43 9 Peravur 17.41 2.76 6.77 6.49
10 Iritty 7.8 1.06 5.38 5.96 11 Panoor 1.98 0.16 5.35 0.75 Blocks Total 71.59 22.04 80.27 56.54 Muncipalities Total 8.92 3.23 14.37 7.58 Corporation Total 0.34 0.11 0.76 1.31 District Total 80.85 25.38 95.4 65.43 KASARAGOD
1 Kasaragod 2.66 1.28 5.08 3.02 2 Karaduka 5.11 2.99 8.1 6.42 3 Manjeswar 1.26 0.47 24.45 3.22 4 Parappa 17.1 3.54 11.55 10.39 5 Kanhangad 11.37 1.27 8.37 6.54 6 Nileshwar 6.74 1.38 8.61 5.83 Blocks Total 44.24 10.93 66.16 35.42 Municipalities Total 1.28 0.12 1.43 0.47 District Total 45.52 11.05 67.59 35.89
STATE TOTAL 2759.25 1146.85 1566.72 1231.3
(Table – 3.1 Contd….)
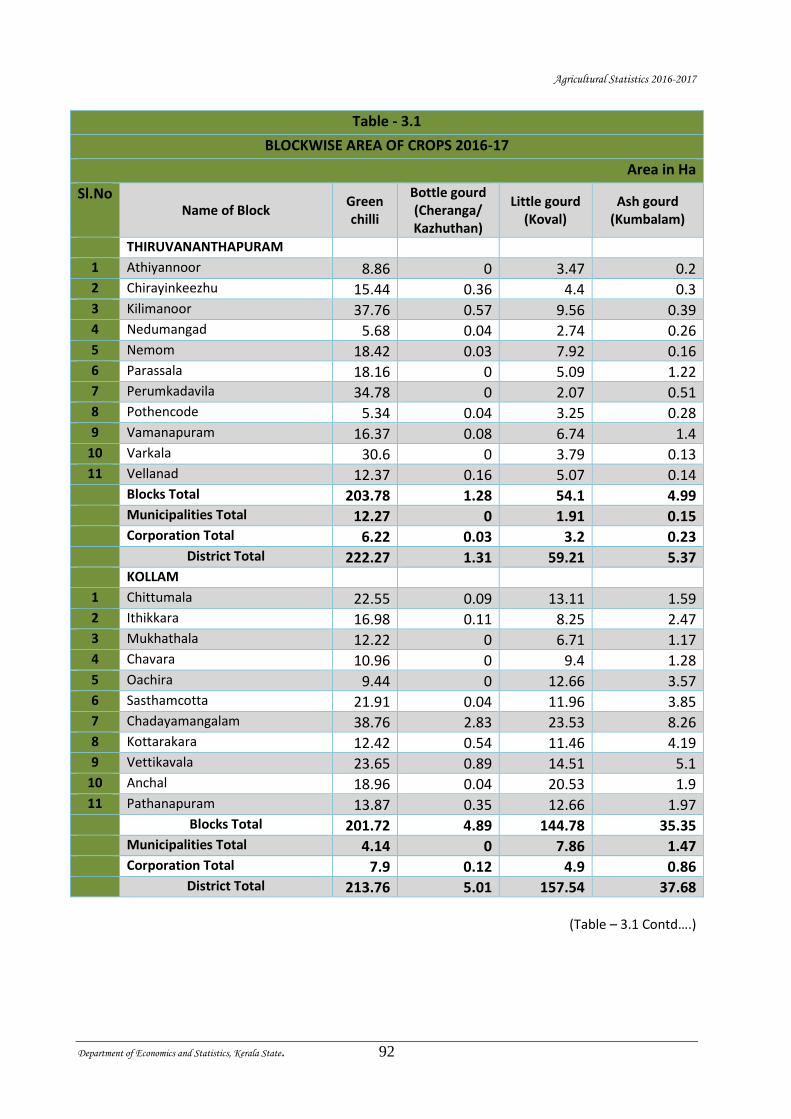
Agricultural Statistics 2016-2017
Department of Economics and Statistics, Kerala State. 92
Table - 3.1
BLOCKWISE AREA OF CROPS 2016-17
Area in Ha
Sl.No Name of Block
Green chilli
Bottle gourd (Cheranga/ Kazhuthan)
Little gourd (Koval)
Ash gourd (Kumbalam)
THIRUVANANTHAPURAM
1 Athiyannoor 8.86 0 3.47 0.2 2 Chirayinkeezhu 15.44 0.36 4.4 0.3 3 Kilimanoor 37.76 0.57 9.56 0.39 4 Nedumangad 5.68 0.04 2.74 0.26 5 Nemom 18.42 0.03 7.92 0.16 6 Parassala 18.16 0 5.09 1.22 7 Perumkadavila 34.78 0 2.07 0.51 8 Pothencode 5.34 0.04 3.25 0.28 9 Vamanapuram 16.37 0.08 6.74 1.4
10 Varkala 30.6 0 3.79 0.13 11 Vellanad 12.37 0.16 5.07 0.14 Blocks Total 203.78 1.28 54.1 4.99 Municipalities Total 12.27 0 1.91 0.15 Corporation Total 6.22 0.03 3.2 0.23 District Total 222.27 1.31 59.21 5.37 KOLLAM
1 Chittumala 22.55 0.09 13.11 1.59 2 Ithikkara 16.98 0.11 8.25 2.47 3 Mukhathala 12.22 0 6.71 1.17 4 Chavara 10.96 0 9.4 1.28 5 Oachira 9.44 0 12.66 3.57 6 Sasthamcotta 21.91 0.04 11.96 3.85 7 Chadayamangalam 38.76 2.83 23.53 8.26 8 Kottarakara 12.42 0.54 11.46 4.19 9 Vettikavala 23.65 0.89 14.51 5.1
10 Anchal 18.96 0.04 20.53 1.9 11 Pathanapuram 13.87 0.35 12.66 1.97 Blocks Total 201.72 4.89 144.78 35.35 Municipalities Total 4.14 0 7.86 1.47 Corporation Total 7.9 0.12 4.9 0.86 District Total 213.76 5.01 157.54 37.68
(Table – 3.1 Contd….)
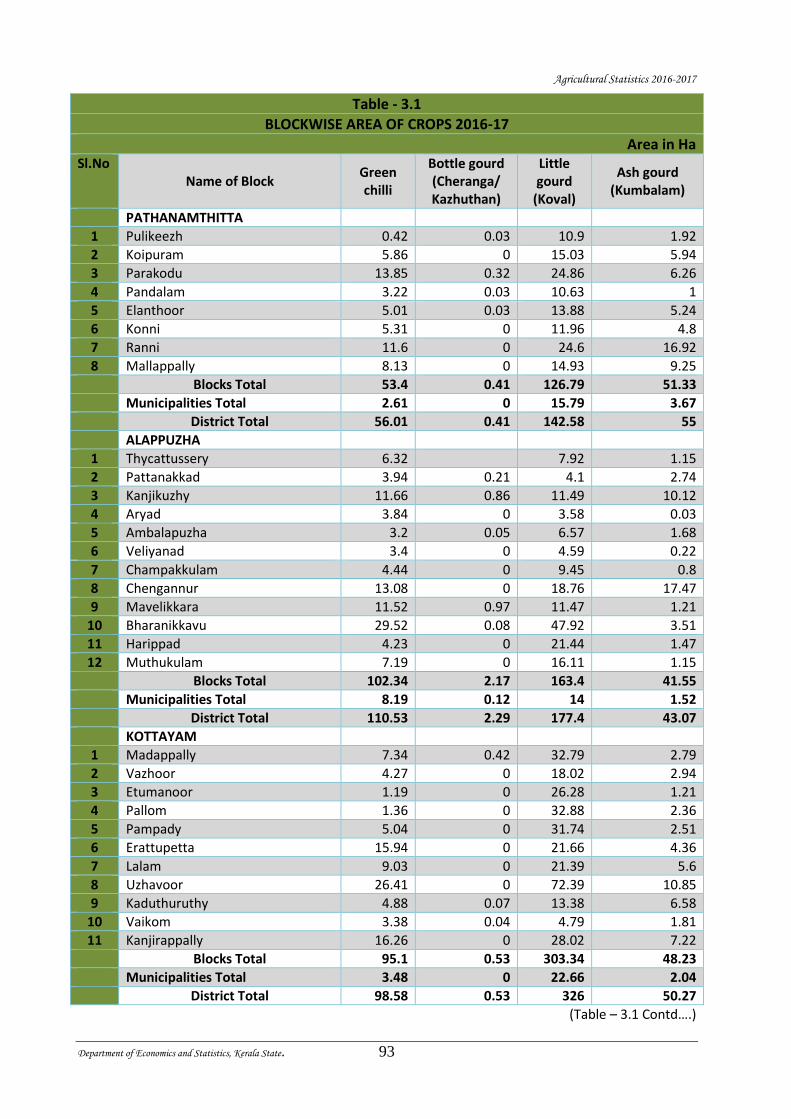
Agricultural Statistics 2016-2017
Department of Economics and Statistics, Kerala State. 93
Table - 3.1
BLOCKWISE AREA OF CROPS 2016-17
Area in Ha Sl.No
Name of Block Green chilli
Bottle gourd (Cheranga/ Kazhuthan)
Little gourd
(Koval)
Ash gourd (Kumbalam)
PATHANAMTHITTA
1 Pulikeezh 0.42 0.03 10.9 1.92
2 Koipuram 5.86 0 15.03 5.94
3 Parakodu 13.85 0.32 24.86 6.26
4 Pandalam 3.22 0.03 10.63 1
5 Elanthoor 5.01 0.03 13.88 5.24
6 Konni 5.31 0 11.96 4.8
7 Ranni 11.6 0 24.6 16.92
8 Mallappally 8.13 0 14.93 9.25
Blocks Total 53.4 0.41 126.79 51.33
Municipalities Total 2.61 0 15.79 3.67
District Total 56.01 0.41 142.58 55
ALAPPUZHA
1 Thycattussery 6.32 7.92 1.15
2 Pattanakkad 3.94 0.21 4.1 2.74
3 Kanjikuzhy 11.66 0.86 11.49 10.12
4 Aryad 3.84 0 3.58 0.03
5 Ambalapuzha 3.2 0.05 6.57 1.68
6 Veliyanad 3.4 0 4.59 0.22
7 Champakkulam 4.44 0 9.45 0.8
8 Chengannur 13.08 0 18.76 17.47
9 Mavelikkara 11.52 0.97 11.47 1.21
10 Bharanikkavu 29.52 0.08 47.92 3.51
11 Harippad 4.23 0 21.44 1.47
12 Muthukulam 7.19 0 16.11 1.15
Blocks Total 102.34 2.17 163.4 41.55
Municipalities Total 8.19 0.12 14 1.52
District Total 110.53 2.29 177.4 43.07
KOTTAYAM
1 Madappally 7.34 0.42 32.79 2.79
2 Vazhoor 4.27 0 18.02 2.94
3 Etumanoor 1.19 0 26.28 1.21
4 Pallom 1.36 0 32.88 2.36
5 Pampady 5.04 0 31.74 2.51
6 Erattupetta 15.94 0 21.66 4.36
7 Lalam 9.03 0 21.39 5.6
8 Uzhavoor 26.41 0 72.39 10.85
9 Kaduthuruthy 4.88 0.07 13.38 6.58
10 Vaikom 3.38 0.04 4.79 1.81
11 Kanjirappally 16.26 0 28.02 7.22
Blocks Total 95.1 0.53 303.34 48.23
Municipalities Total 3.48 0 22.66 2.04
District Total 98.58 0.53 326 50.27
(Table – 3.1 Contd….)
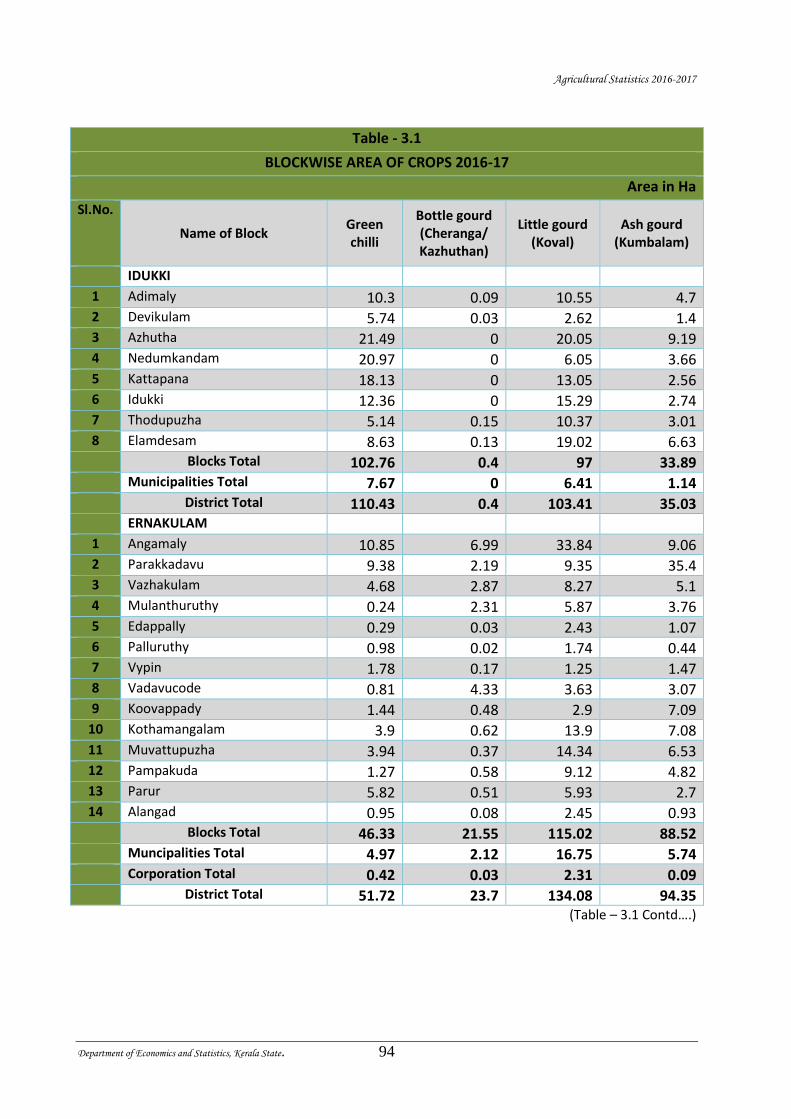
Agricultural Statistics 2016-2017
Department of Economics and Statistics, Kerala State. 94
Table - 3.1
BLOCKWISE AREA OF CROPS 2016-17
Area in Ha
Sl.No.
Name of Block Green chilli
Bottle gourd (Cheranga/ Kazhuthan)
Little gourd (Koval)
Ash gourd (Kumbalam)
IDUKKI
1 Adimaly 10.3 0.09 10.55 4.7 2 Devikulam 5.74 0.03 2.62 1.4 3 Azhutha 21.49 0 20.05 9.19 4 Nedumkandam 20.97 0 6.05 3.66 5 Kattapana 18.13 0 13.05 2.56 6 Idukki 12.36 0 15.29 2.74 7 Thodupuzha 5.14 0.15 10.37 3.01 8 Elamdesam 8.63 0.13 19.02 6.63 Blocks Total 102.76 0.4 97 33.89 Municipalities Total 7.67 0 6.41 1.14 District Total 110.43 0.4 103.41 35.03 ERNAKULAM
1 Angamaly 10.85 6.99 33.84 9.06 2 Parakkadavu 9.38 2.19 9.35 35.4 3 Vazhakulam 4.68 2.87 8.27 5.1 4 Mulanthuruthy 0.24 2.31 5.87 3.76 5 Edappally 0.29 0.03 2.43 1.07 6 Palluruthy 0.98 0.02 1.74 0.44 7 Vypin 1.78 0.17 1.25 1.47 8 Vadavucode 0.81 4.33 3.63 3.07 9 Koovappady 1.44 0.48 2.9 7.09
10 Kothamangalam 3.9 0.62 13.9 7.08 11 Muvattupuzha 3.94 0.37 14.34 6.53 12 Pampakuda 1.27 0.58 9.12 4.82 13 Parur 5.82 0.51 5.93 2.7 14 Alangad 0.95 0.08 2.45 0.93 Blocks Total 46.33 21.55 115.02 88.52 Muncipalities Total 4.97 2.12 16.75 5.74 Corporation Total 0.42 0.03 2.31 0.09 District Total 51.72 23.7 134.08 94.35
(Table – 3.1 Contd….)
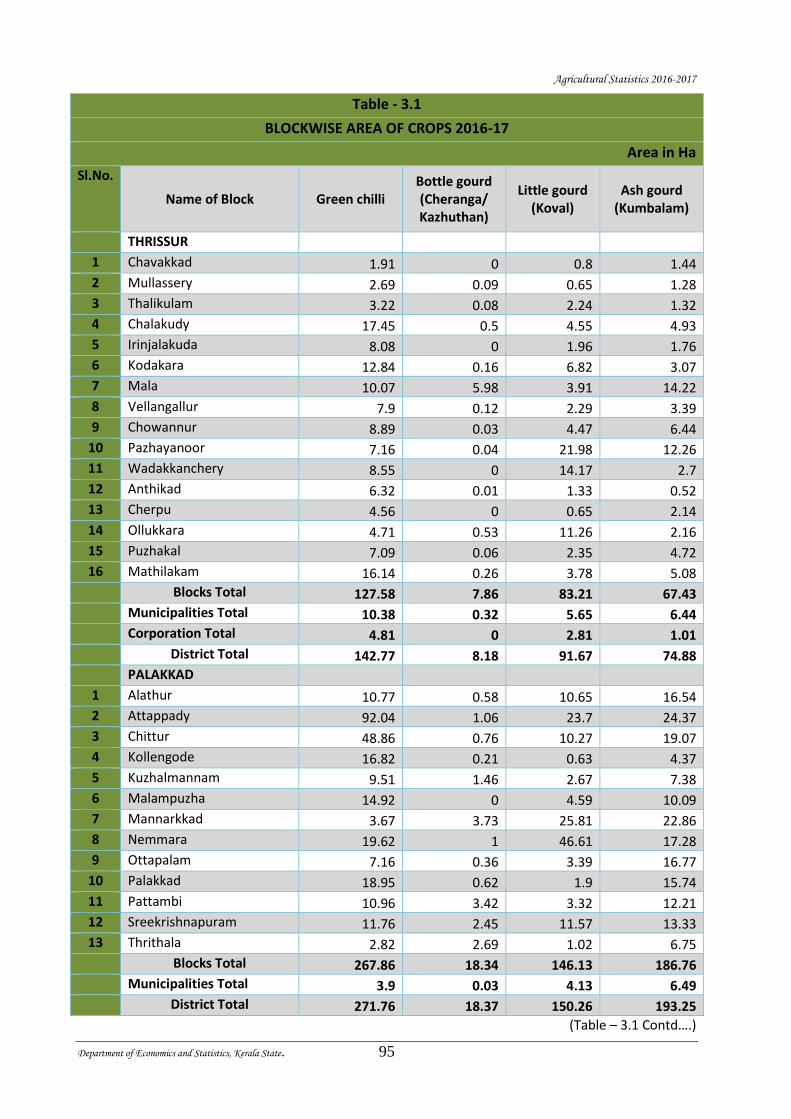
Agricultural Statistics 2016-2017
Department of Economics and Statistics, Kerala State. 95
Table - 3.1
BLOCKWISE AREA OF CROPS 2016-17
Area in Ha
Sl.No.
Name of Block Green chilli Bottle gourd (Cheranga/ Kazhuthan)
Little gourd (Koval)
Ash gourd (Kumbalam)
THRISSUR
1 Chavakkad 1.91 0 0.8 1.44
2 Mullassery 2.69 0.09 0.65 1.28
3 Thalikulam 3.22 0.08 2.24 1.32
4 Chalakudy 17.45 0.5 4.55 4.93
5 Irinjalakuda 8.08 0 1.96 1.76
6 Kodakara 12.84 0.16 6.82 3.07
7 Mala 10.07 5.98 3.91 14.22
8 Vellangallur 7.9 0.12 2.29 3.39
9 Chowannur 8.89 0.03 4.47 6.44
10 Pazhayanoor 7.16 0.04 21.98 12.26
11 Wadakkanchery 8.55 0 14.17 2.7
12 Anthikad 6.32 0.01 1.33 0.52
13 Cherpu 4.56 0 0.65 2.14
14 Ollukkara 4.71 0.53 11.26 2.16
15 Puzhakal 7.09 0.06 2.35 4.72
16 Mathilakam 16.14 0.26 3.78 5.08
Blocks Total 127.58 7.86 83.21 67.43
Municipalities Total 10.38 0.32 5.65 6.44
Corporation Total 4.81 0 2.81 1.01
District Total 142.77 8.18 91.67 74.88
PALAKKAD
1 Alathur 10.77 0.58 10.65 16.54
2 Attappady 92.04 1.06 23.7 24.37
3 Chittur 48.86 0.76 10.27 19.07
4 Kollengode 16.82 0.21 0.63 4.37
5 Kuzhalmannam 9.51 1.46 2.67 7.38
6 Malampuzha 14.92 0 4.59 10.09
7 Mannarkkad 3.67 3.73 25.81 22.86
8 Nemmara 19.62 1 46.61 17.28
9 Ottapalam 7.16 0.36 3.39 16.77
10 Palakkad 18.95 0.62 1.9 15.74
11 Pattambi 10.96 3.42 3.32 12.21
12 Sreekrishnapuram 11.76 2.45 11.57 13.33
13 Thrithala 2.82 2.69 1.02 6.75
Blocks Total 267.86 18.34 146.13 186.76
Municipalities Total 3.9 0.03 4.13 6.49
District Total 271.76 18.37 150.26 193.25
(Table – 3.1 Contd….)
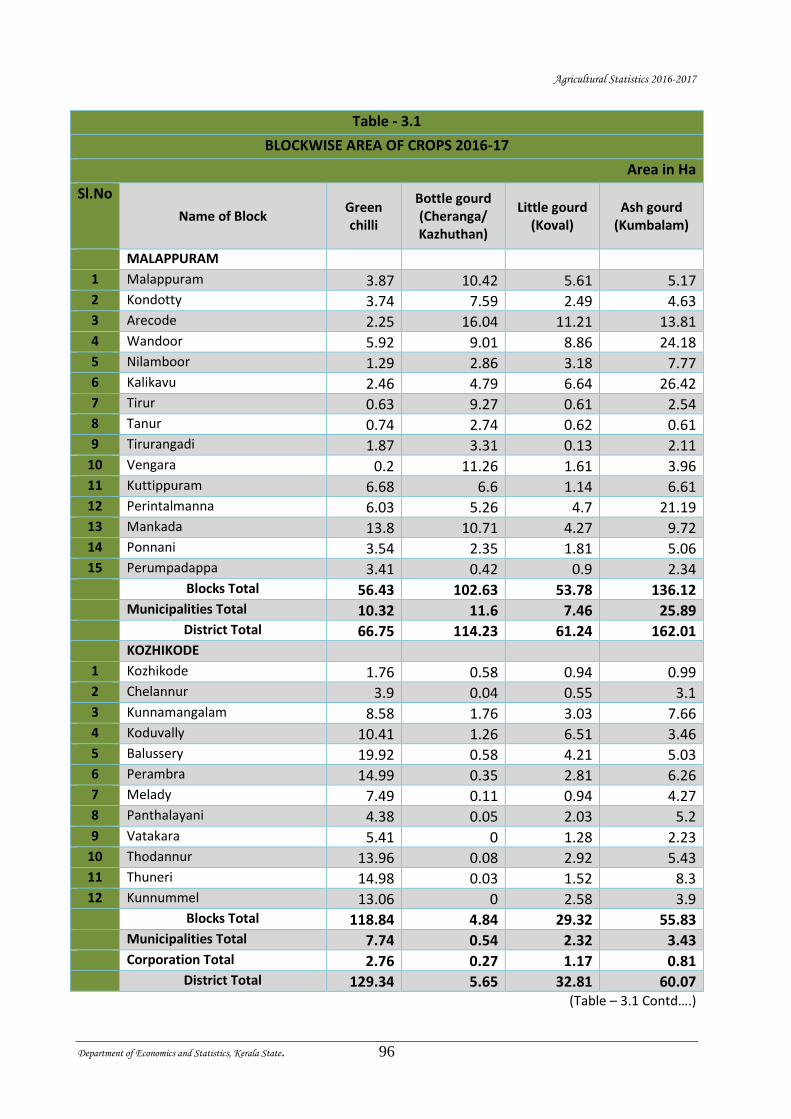
Agricultural Statistics 2016-2017
Department of Economics and Statistics, Kerala State. 96
Table - 3.1
BLOCKWISE AREA OF CROPS 2016-17
Area in Ha
Sl.No
Name of Block Green chilli
Bottle gourd (Cheranga/ Kazhuthan)
Little gourd (Koval)
Ash gourd (Kumbalam)
MALAPPURAM
1 Malappuram 3.87 10.42 5.61 5.17 2 Kondotty 3.74 7.59 2.49 4.63 3 Arecode 2.25 16.04 11.21 13.81 4 Wandoor 5.92 9.01 8.86 24.18 5 Nilamboor 1.29 2.86 3.18 7.77 6 Kalikavu 2.46 4.79 6.64 26.42 7 Tirur 0.63 9.27 0.61 2.54 8 Tanur 0.74 2.74 0.62 0.61 9 Tirurangadi 1.87 3.31 0.13 2.11
10 Vengara 0.2 11.26 1.61 3.96 11 Kuttippuram 6.68 6.6 1.14 6.61 12 Perintalmanna 6.03 5.26 4.7 21.19 13 Mankada 13.8 10.71 4.27 9.72 14 Ponnani 3.54 2.35 1.81 5.06 15 Perumpadappa 3.41 0.42 0.9 2.34 Blocks Total 56.43 102.63 53.78 136.12 Municipalities Total 10.32 11.6 7.46 25.89 District Total 66.75 114.23 61.24 162.01 KOZHIKODE
1 Kozhikode 1.76 0.58 0.94 0.99 2 Chelannur 3.9 0.04 0.55 3.1 3 Kunnamangalam 8.58 1.76 3.03 7.66 4 Koduvally 10.41 1.26 6.51 3.46 5 Balussery 19.92 0.58 4.21 5.03 6 Perambra 14.99 0.35 2.81 6.26 7 Melady 7.49 0.11 0.94 4.27 8 Panthalayani 4.38 0.05 2.03 5.2 9 Vatakara 5.41 0 1.28 2.23
10 Thodannur 13.96 0.08 2.92 5.43 11 Thuneri 14.98 0.03 1.52 8.3 12 Kunnummel 13.06 0 2.58 3.9 Blocks Total 118.84 4.84 29.32 55.83 Municipalities Total 7.74 0.54 2.32 3.43 Corporation Total 2.76 0.27 1.17 0.81 District Total 129.34 5.65 32.81 60.07
(Table – 3.1 Contd….)
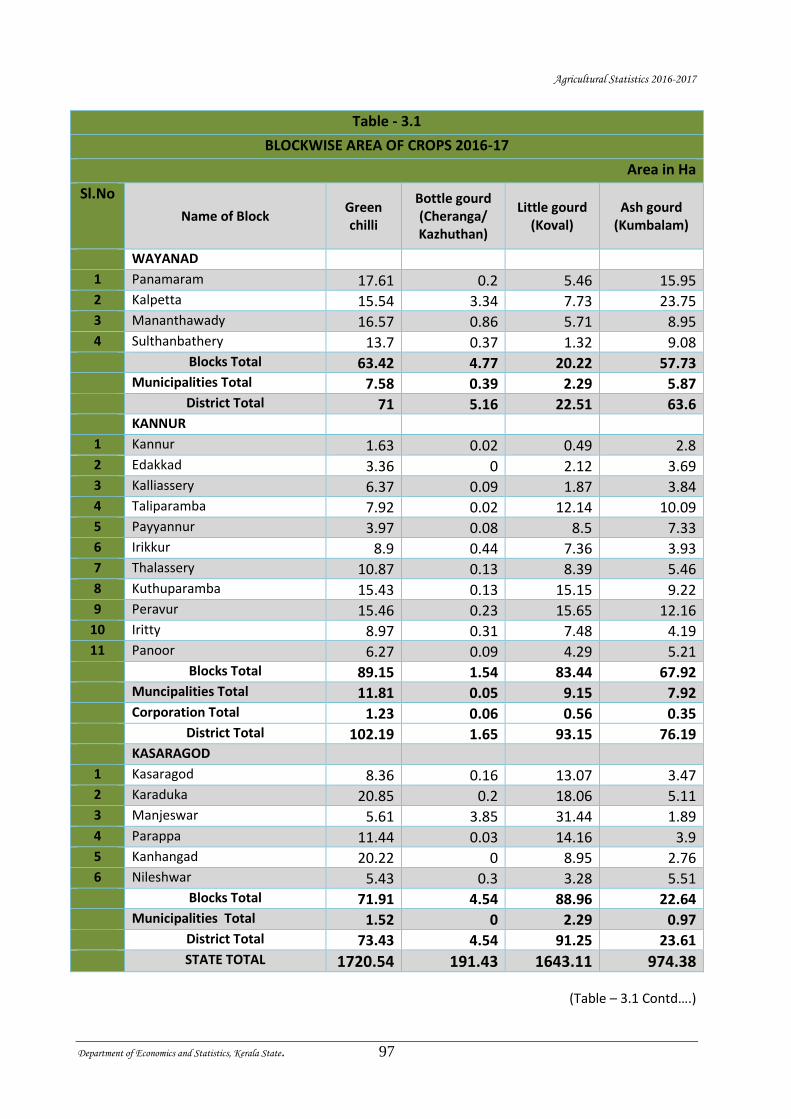
Agricultural Statistics 2016-2017
Department of Economics and Statistics, Kerala State. 97
Table - 3.1
BLOCKWISE AREA OF CROPS 2016-17
Area in Ha
Sl.No
Name of Block Green chilli
Bottle gourd (Cheranga/ Kazhuthan)
Little gourd (Koval)
Ash gourd (Kumbalam)
WAYANAD
1 Panamaram 17.61 0.2 5.46 15.95 2 Kalpetta 15.54 3.34 7.73 23.75 3 Mananthawady 16.57 0.86 5.71 8.95 4 Sulthanbathery 13.7 0.37 1.32 9.08 Blocks Total 63.42 4.77 20.22 57.73 Municipalities Total 7.58 0.39 2.29 5.87 District Total 71 5.16 22.51 63.6 KANNUR
1 Kannur 1.63 0.02 0.49 2.8 2 Edakkad 3.36 0 2.12 3.69 3 Kalliassery 6.37 0.09 1.87 3.84 4 Taliparamba 7.92 0.02 12.14 10.09 5 Payyannur 3.97 0.08 8.5 7.33 6 Irikkur 8.9 0.44 7.36 3.93 7 Thalassery 10.87 0.13 8.39 5.46 8 Kuthuparamba 15.43 0.13 15.15 9.22 9 Peravur 15.46 0.23 15.65 12.16
10 Iritty 8.97 0.31 7.48 4.19 11 Panoor 6.27 0.09 4.29 5.21 Blocks Total 89.15 1.54 83.44 67.92 Muncipalities Total 11.81 0.05 9.15 7.92 Corporation Total 1.23 0.06 0.56 0.35 District Total 102.19 1.65 93.15 76.19 KASARAGOD
1 Kasaragod 8.36 0.16 13.07 3.47 2 Karaduka 20.85 0.2 18.06 5.11 3 Manjeswar 5.61 3.85 31.44 1.89 4 Parappa 11.44 0.03 14.16 3.9 5 Kanhangad 20.22 0 8.95 2.76 6 Nileshwar 5.43 0.3 3.28 5.51 Blocks Total 71.91 4.54 88.96 22.64 Municipalities Total 1.52 0 2.29 0.97 District Total 73.43 4.54 91.25 23.61
STATE TOTAL 1720.54 191.43 1643.11 974.38
(Table – 3.1 Contd….)

Agricultural Statistics 2016-2017
Department of Economics and Statistics, Kerala State. 98
Table - 3.1
BLOCKWISE AREA OF CROPS 2016-17
Area in Ha
Sl.No Name of Block
Pumpkin (Mathan)
Cucumber (Vellari)
Payar (Achinga)
Cabbage
THIRUVANANTHAPURAM
1 Athiyannoor 0.87 14.92 15.44 0 2 Chirayinkeezhu 1.7 1.19 17.82 0 3 Kilimanoor 1.56 1.61 28.1 0 4 Nedumangad 1.37 9.43 19.38 0.07 5 Nemom 0.45 43.93 65.72 0 6 Parassala 0.7 41.85 27.26 0 7 Perumkadavila 1.59 34.96 29.89 0 8 Pothencode 0.81 6.9 11.24 0 9 Vamanapuram 3.34 17.12 37.68 0
10 Varkala 0.92 1.06 14.87 0.02 11 Vellanad 1.21 6.8 26.98 0.03 Blocks Total 14.52 179.77 294.38 0.12 Municipalities Total 1.18 22.96 25.38 0 Corporation Total 1.29 5.94 11.33 0 District Total 16.99 208.67 331.09 0.12 KOLLAM
1 Chittumala 3.17 1.14 15.42 0.06 2 Ithikkara 4.25 3.08 13.19 0 3 Mukhathala 2.02 1.4 11.19 0 4 Chavara 3.77 0.49 9 0 5 Oachira 4.18 3.13 15.02 0.07 6 Sasthamcotta 6.15 2.02 25.47 0 7 Chadayamangalam 12.23 6.67 40.12 0 8 Kottarakara 6.28 1.22 26.14 0.04 9 Vettikavala 5.69 3.27 29.58 0
10 Anchal 5.49 1.96 41.32 0 11 Pathanapuram 4.6 0.85 34.7 0 Blocks Total 57.83 25.23 261.15 0.17 Municipalities Total 1.3 0.67 7.01 0.12 Corporation Total 1.51 0.27 8.74 0 District Total 60.64 26.17 276.9 0.29
(Table – 3.1 Contd….)
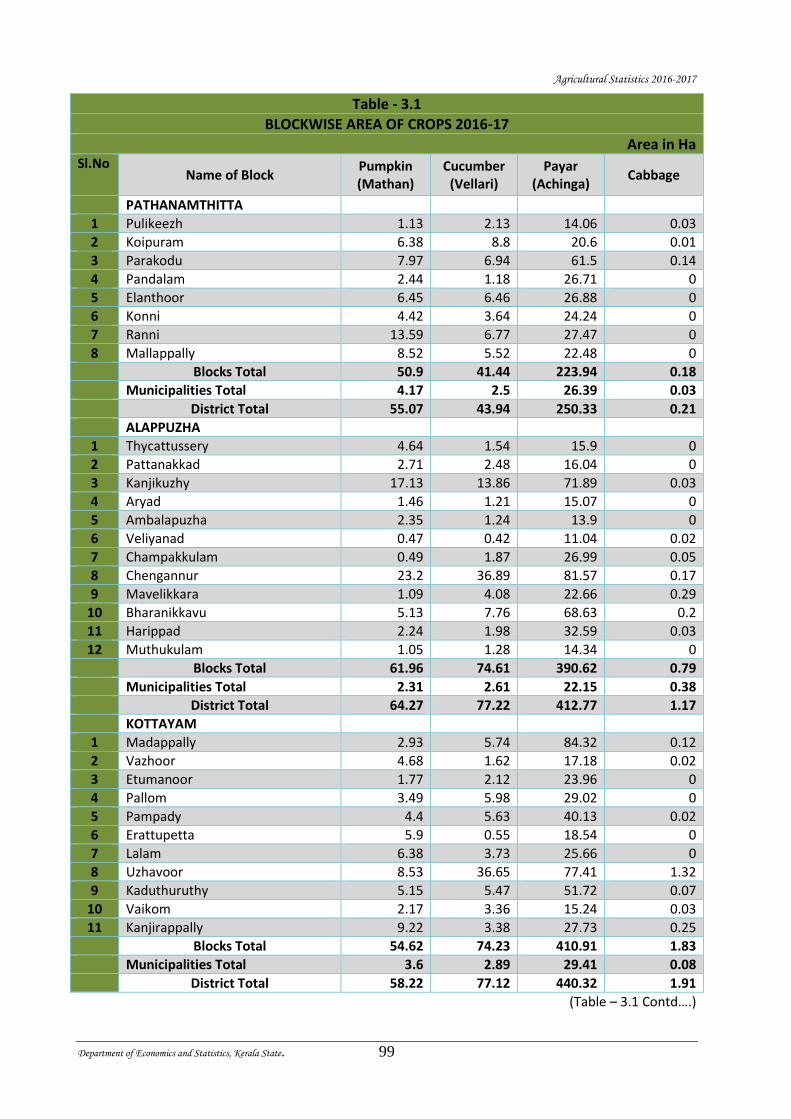
Agricultural Statistics 2016-2017
Department of Economics and Statistics, Kerala State. 99
Table - 3.1
BLOCKWISE AREA OF CROPS 2016-17
Area in Ha Sl.No
Name of Block Pumpkin (Mathan)
Cucumber (Vellari)
Payar (Achinga)
Cabbage
PATHANAMTHITTA
1 Pulikeezh 1.13 2.13 14.06 0.03
2 Koipuram 6.38 8.8 20.6 0.01
3 Parakodu 7.97 6.94 61.5 0.14
4 Pandalam 2.44 1.18 26.71 0
5 Elanthoor 6.45 6.46 26.88 0
6 Konni 4.42 3.64 24.24 0
7 Ranni 13.59 6.77 27.47 0
8 Mallappally 8.52 5.52 22.48 0
Blocks Total 50.9 41.44 223.94 0.18
Municipalities Total 4.17 2.5 26.39 0.03
District Total 55.07 43.94 250.33 0.21
ALAPPUZHA
1 Thycattussery 4.64 1.54 15.9 0
2 Pattanakkad 2.71 2.48 16.04 0
3 Kanjikuzhy 17.13 13.86 71.89 0.03
4 Aryad 1.46 1.21 15.07 0
5 Ambalapuzha 2.35 1.24 13.9 0
6 Veliyanad 0.47 0.42 11.04 0.02
7 Champakkulam 0.49 1.87 26.99 0.05
8 Chengannur 23.2 36.89 81.57 0.17
9 Mavelikkara 1.09 4.08 22.66 0.29
10 Bharanikkavu 5.13 7.76 68.63 0.2
11 Harippad 2.24 1.98 32.59 0.03
12 Muthukulam 1.05 1.28 14.34 0
Blocks Total 61.96 74.61 390.62 0.79
Municipalities Total 2.31 2.61 22.15 0.38
District Total 64.27 77.22 412.77 1.17
KOTTAYAM
1 Madappally 2.93 5.74 84.32 0.12
2 Vazhoor 4.68 1.62 17.18 0.02
3 Etumanoor 1.77 2.12 23.96 0
4 Pallom 3.49 5.98 29.02 0
5 Pampady 4.4 5.63 40.13 0.02
6 Erattupetta 5.9 0.55 18.54 0
7 Lalam 6.38 3.73 25.66 0
8 Uzhavoor 8.53 36.65 77.41 1.32
9 Kaduthuruthy 5.15 5.47 51.72 0.07
10 Vaikom 2.17 3.36 15.24 0.03
11 Kanjirappally 9.22 3.38 27.73 0.25
Blocks Total 54.62 74.23 410.91 1.83
Municipalities Total 3.6 2.89 29.41 0.08
District Total 58.22 77.12 440.32 1.91
(Table – 3.1 Contd….)
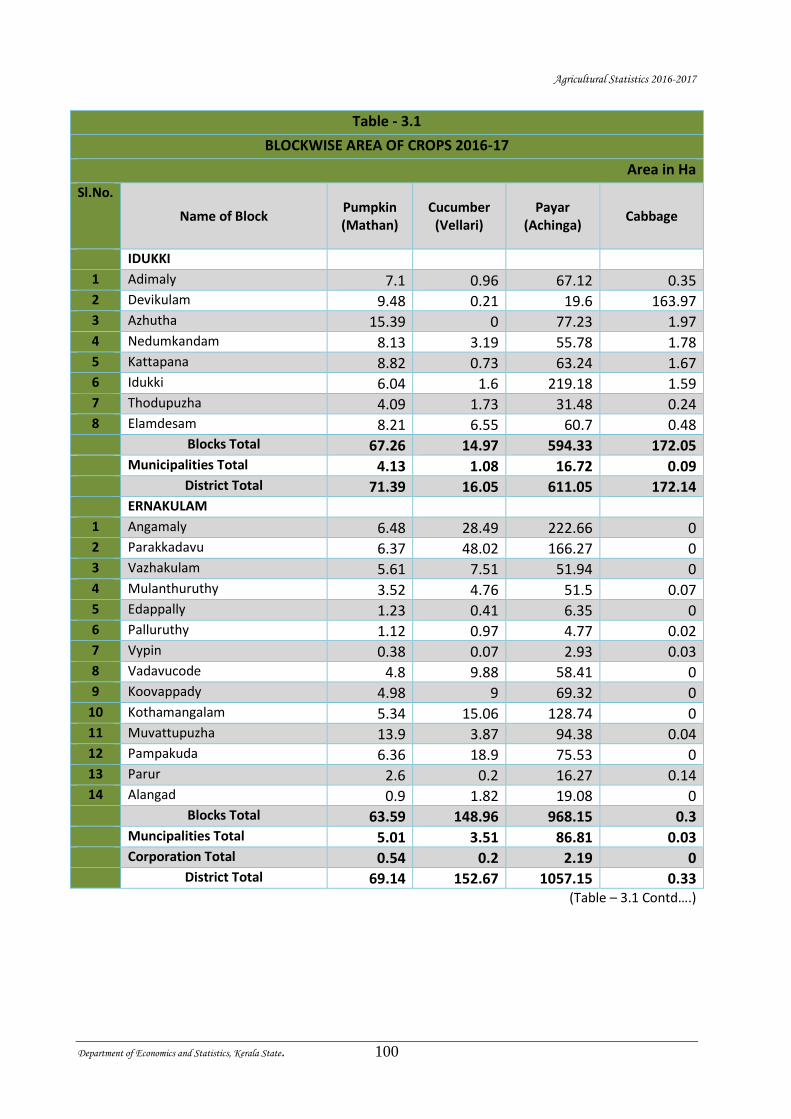
Agricultural Statistics 2016-2017
Department of Economics and Statistics, Kerala State. 100
Table - 3.1
BLOCKWISE AREA OF CROPS 2016-17
Area in Ha
Sl.No.
Name of Block Pumpkin (Mathan)
Cucumber (Vellari)
Payar (Achinga)
Cabbage
IDUKKI
1 Adimaly 7.1 0.96 67.12 0.35 2 Devikulam 9.48 0.21 19.6 163.97 3 Azhutha 15.39 0 77.23 1.97 4 Nedumkandam 8.13 3.19 55.78 1.78 5 Kattapana 8.82 0.73 63.24 1.67 6 Idukki 6.04 1.6 219.18 1.59 7 Thodupuzha 4.09 1.73 31.48 0.24 8 Elamdesam 8.21 6.55 60.7 0.48 Blocks Total 67.26 14.97 594.33 172.05 Municipalities Total 4.13 1.08 16.72 0.09 District Total 71.39 16.05 611.05 172.14 ERNAKULAM
1 Angamaly 6.48 28.49 222.66 0 2 Parakkadavu 6.37 48.02 166.27 0 3 Vazhakulam 5.61 7.51 51.94 0 4 Mulanthuruthy 3.52 4.76 51.5 0.07 5 Edappally 1.23 0.41 6.35 0 6 Palluruthy 1.12 0.97 4.77 0.02 7 Vypin 0.38 0.07 2.93 0.03 8 Vadavucode 4.8 9.88 58.41 0 9 Koovappady 4.98 9 69.32 0
10 Kothamangalam 5.34 15.06 128.74 0 11 Muvattupuzha 13.9 3.87 94.38 0.04 12 Pampakuda 6.36 18.9 75.53 0 13 Parur 2.6 0.2 16.27 0.14 14 Alangad 0.9 1.82 19.08 0 Blocks Total 63.59 148.96 968.15 0.3 Muncipalities Total 5.01 3.51 86.81 0.03 Corporation Total 0.54 0.2 2.19 0 District Total 69.14 152.67 1057.15 0.33
(Table – 3.1 Contd….)
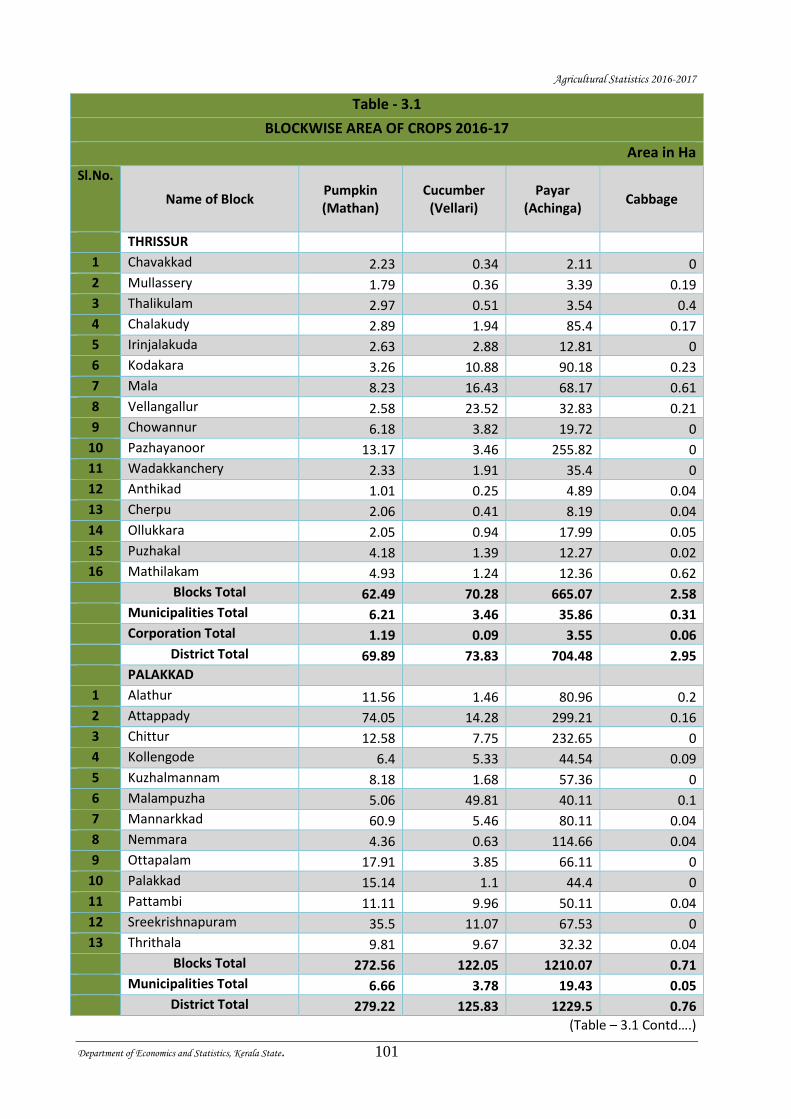
Agricultural Statistics 2016-2017
Department of Economics and Statistics, Kerala State. 101
Table - 3.1
BLOCKWISE AREA OF CROPS 2016-17
Area in Ha
Sl.No.
Name of Block Pumpkin (Mathan)
Cucumber (Vellari)
Payar (Achinga)
Cabbage
THRISSUR
1 Chavakkad 2.23 0.34 2.11 0
2 Mullassery 1.79 0.36 3.39 0.19
3 Thalikulam 2.97 0.51 3.54 0.4
4 Chalakudy 2.89 1.94 85.4 0.17
5 Irinjalakuda 2.63 2.88 12.81 0
6 Kodakara 3.26 10.88 90.18 0.23
7 Mala 8.23 16.43 68.17 0.61
8 Vellangallur 2.58 23.52 32.83 0.21
9 Chowannur 6.18 3.82 19.72 0
10 Pazhayanoor 13.17 3.46 255.82 0
11 Wadakkanchery 2.33 1.91 35.4 0
12 Anthikad 1.01 0.25 4.89 0.04
13 Cherpu 2.06 0.41 8.19 0.04
14 Ollukkara 2.05 0.94 17.99 0.05
15 Puzhakal 4.18 1.39 12.27 0.02
16 Mathilakam 4.93 1.24 12.36 0.62
Blocks Total 62.49 70.28 665.07 2.58
Municipalities Total 6.21 3.46 35.86 0.31
Corporation Total 1.19 0.09 3.55 0.06
District Total 69.89 73.83 704.48 2.95
PALAKKAD
1 Alathur 11.56 1.46 80.96 0.2
2 Attappady 74.05 14.28 299.21 0.16
3 Chittur 12.58 7.75 232.65 0
4 Kollengode 6.4 5.33 44.54 0.09
5 Kuzhalmannam 8.18 1.68 57.36 0
6 Malampuzha 5.06 49.81 40.11 0.1
7 Mannarkkad 60.9 5.46 80.11 0.04
8 Nemmara 4.36 0.63 114.66 0.04
9 Ottapalam 17.91 3.85 66.11 0
10 Palakkad 15.14 1.1 44.4 0
11 Pattambi 11.11 9.96 50.11 0.04
12 Sreekrishnapuram 35.5 11.07 67.53 0
13 Thrithala 9.81 9.67 32.32 0.04
Blocks Total 272.56 122.05 1210.07 0.71
Municipalities Total 6.66 3.78 19.43 0.05
District Total 279.22 125.83 1229.5 0.76
(Table – 3.1 Contd….)

Agricultural Statistics 2016-2017
Department of Economics and Statistics, Kerala State. 102
Table - 3.1
BLOCKWISE AREA OF CROPS 2016-17
Area in Ha
Sl.No
Name of Block Pumpkin (Mathan)
Cucumber (Vellari)
Payar (Achinga)
Cabbage
MALAPPURAM
1 Malappuram 17.57 12.12 57.77 0.02 2 Kondotty 11.04 2.18 31.52 0 3 Arecode 34.11 20.86 78.73 0 4 Wandoor 55.25 33.14 142.12 0 5 Nilamboor 15.21 6.84 43.5 0 6 Kalikavu 57.41 6.75 61.08 0 7 Tirur 14.39 4.42 6.63 0.04 8 Tanur 7.6 1.54 7.34 0.02 9 Tirurangadi 9.34 2.5 19.03 0
10 Vengara 15.67 2.67 16.72 0 11 Kuttippuram 14.64 3.43 23.54 0 12 Perintalmanna 21.67 42.56 88.95 0 13 Mankada 12.76 42.17 84.32 0 14 Ponnani 5.98 4.46 8.94 0 15 Perumpadappa 4.27 2.48 5.77 0.04 Blocks Total 296.91 188.12 675.96 0.12 Municipalities Total 35.65 13.93 99.28 0.11 District Total 332.56 202.05 775.24 0.23 KOZHIKODE
1 Kozhikode 1.51 1.09 3.75 0.04 2 Chelannur 5.63 2.93 6.23 0.11 3 Kunnamangalam 13.41 18.04 14.99 0.08 4 Koduvally 5.1 4.3 34.46 0 5 Balussery 6.34 9.62 11.21 0.36 6 Perambra 5.08 7.41 10.79 0.4 7 Melady 1.4 5.8 4.44 0 8 Panthalayani 3.48 3.35 3.71 0 9 Vatakara 1.21 2.85 5.96 0
10 Thodannur 2.39 5.02 8.11 0.02 11 Thuneri 3.25 13.32 23.25 0 12 Kunnummel 4.47 10.62 11.26 0.03 Blocks Total 53.27 84.35 138.16 1.04 Municipalities Total 3.35 4.42 7.83 0.4 Corporation Total 2.42 0.59 2.58 0 District Total 59.04 89.36 148.57 1.44
(Table – 3.1 Contd….)
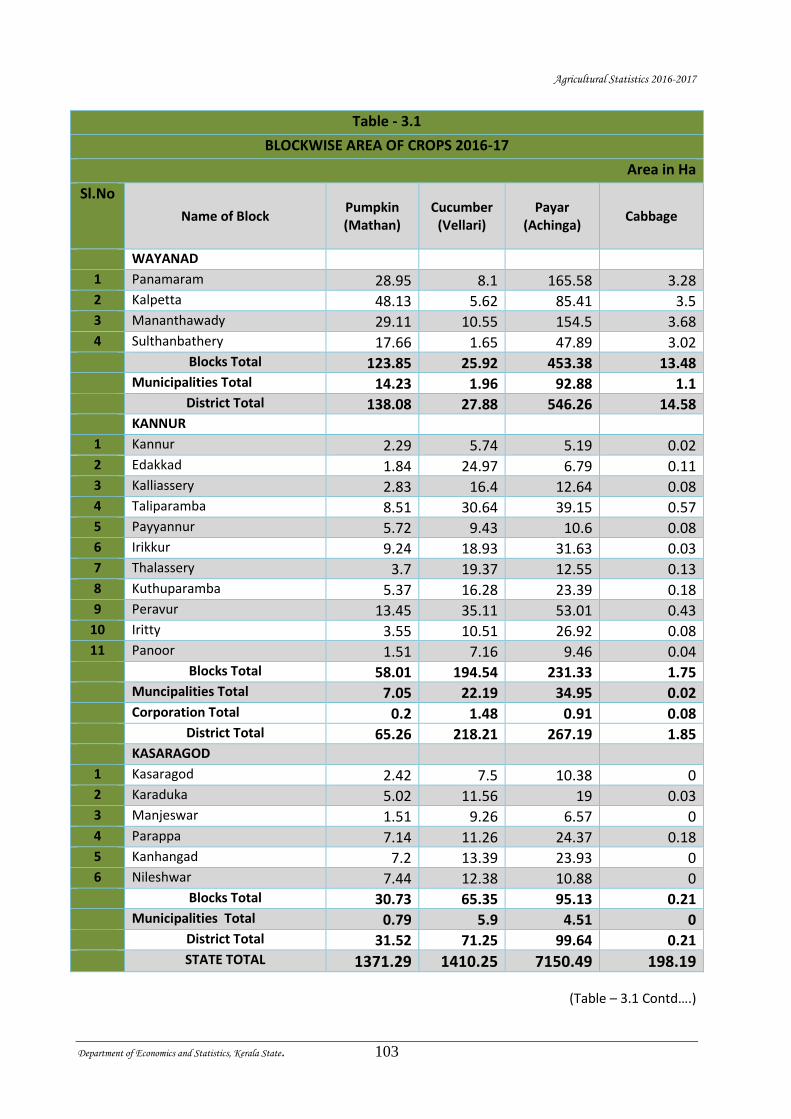
Agricultural Statistics 2016-2017
Department of Economics and Statistics, Kerala State. 103
Table - 3.1
BLOCKWISE AREA OF CROPS 2016-17
Area in Ha
Sl.No
Name of Block Pumpkin (Mathan)
Cucumber (Vellari)
Payar (Achinga)
Cabbage
WAYANAD
1 Panamaram 28.95 8.1 165.58 3.28 2 Kalpetta 48.13 5.62 85.41 3.5 3 Mananthawady 29.11 10.55 154.5 3.68 4 Sulthanbathery 17.66 1.65 47.89 3.02 Blocks Total 123.85 25.92 453.38 13.48 Municipalities Total 14.23 1.96 92.88 1.1 District Total 138.08 27.88 546.26 14.58 KANNUR
1 Kannur 2.29 5.74 5.19 0.02 2 Edakkad 1.84 24.97 6.79 0.11 3 Kalliassery 2.83 16.4 12.64 0.08 4 Taliparamba 8.51 30.64 39.15 0.57 5 Payyannur 5.72 9.43 10.6 0.08 6 Irikkur 9.24 18.93 31.63 0.03 7 Thalassery 3.7 19.37 12.55 0.13 8 Kuthuparamba 5.37 16.28 23.39 0.18 9 Peravur 13.45 35.11 53.01 0.43
10 Iritty 3.55 10.51 26.92 0.08 11 Panoor 1.51 7.16 9.46 0.04 Blocks Total 58.01 194.54 231.33 1.75 Muncipalities Total 7.05 22.19 34.95 0.02 Corporation Total 0.2 1.48 0.91 0.08 District Total 65.26 218.21 267.19 1.85 KASARAGOD
1 Kasaragod 2.42 7.5 10.38 0 2 Karaduka 5.02 11.56 19 0.03 3 Manjeswar 1.51 9.26 6.57 0 4 Parappa 7.14 11.26 24.37 0.18 5 Kanhangad 7.2 13.39 23.93 0 6 Nileshwar 7.44 12.38 10.88 0 Blocks Total 30.73 65.35 95.13 0.21 Municipalities Total 0.79 5.9 4.51 0 District Total 31.52 71.25 99.64 0.21
STATE TOTAL 1371.29 1410.25 7150.49 198.19
(Table – 3.1 Contd….)
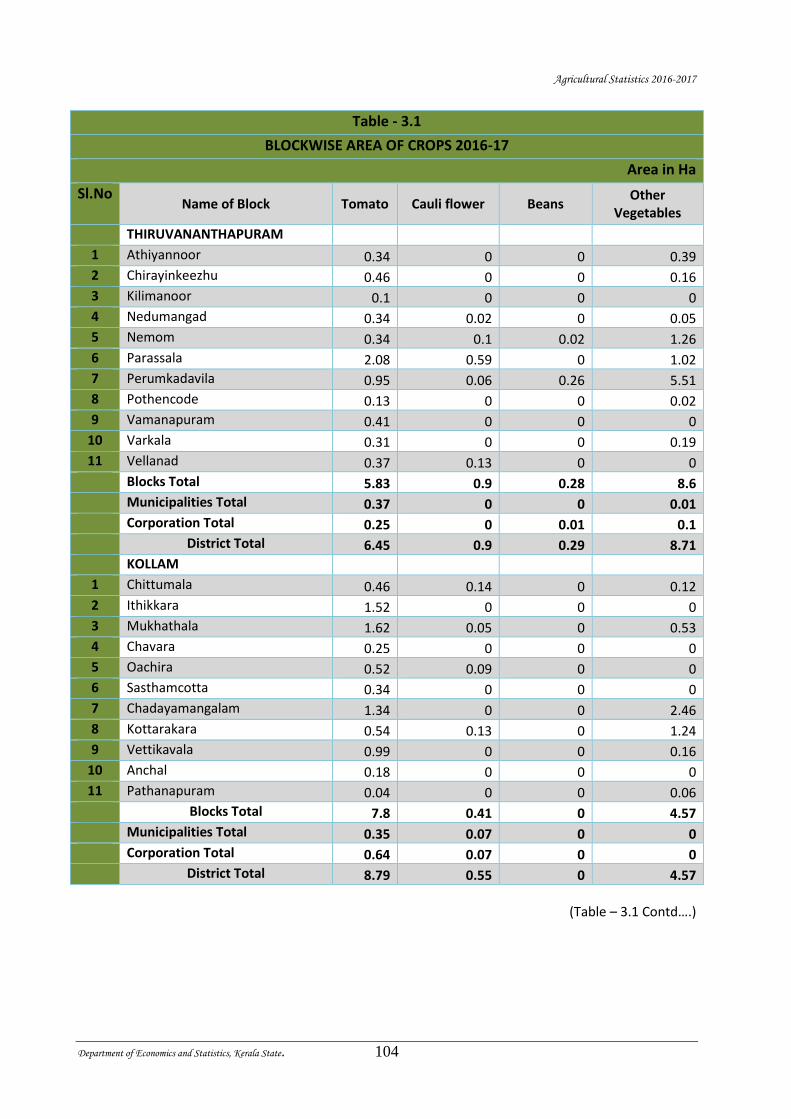
Agricultural Statistics 2016-2017
Department of Economics and Statistics, Kerala State. 104
Table - 3.1
BLOCKWISE AREA OF CROPS 2016-17
Area in Ha
Sl.No Name of Block Tomato Cauli flower Beans
Other Vegetables
THIRUVANANTHAPURAM
1 Athiyannoor 0.34 0 0 0.39
2 Chirayinkeezhu 0.46 0 0 0.16
3 Kilimanoor 0.1 0 0 0
4 Nedumangad 0.34 0.02 0 0.05
5 Nemom 0.34 0.1 0.02 1.26
6 Parassala 2.08 0.59 0 1.02
7 Perumkadavila 0.95 0.06 0.26 5.51
8 Pothencode 0.13 0 0 0.02
9 Vamanapuram 0.41 0 0 0
10 Varkala 0.31 0 0 0.19
11 Vellanad 0.37 0.13 0 0
Blocks Total 5.83 0.9 0.28 8.6
Municipalities Total 0.37 0 0 0.01
Corporation Total 0.25 0 0.01 0.1
District Total 6.45 0.9 0.29 8.71
KOLLAM
1 Chittumala 0.46 0.14 0 0.12
2 Ithikkara 1.52 0 0 0
3 Mukhathala 1.62 0.05 0 0.53
4 Chavara 0.25 0 0 0
5 Oachira 0.52 0.09 0 0
6 Sasthamcotta 0.34 0 0 0
7 Chadayamangalam 1.34 0 0 2.46
8 Kottarakara 0.54 0.13 0 1.24
9 Vettikavala 0.99 0 0 0.16
10 Anchal 0.18 0 0 0
11 Pathanapuram 0.04 0 0 0.06
Blocks Total 7.8 0.41 0 4.57
Municipalities Total 0.35 0.07 0 0
Corporation Total 0.64 0.07 0 0
District Total 8.79 0.55 0 4.57
(Table – 3.1 Contd….)
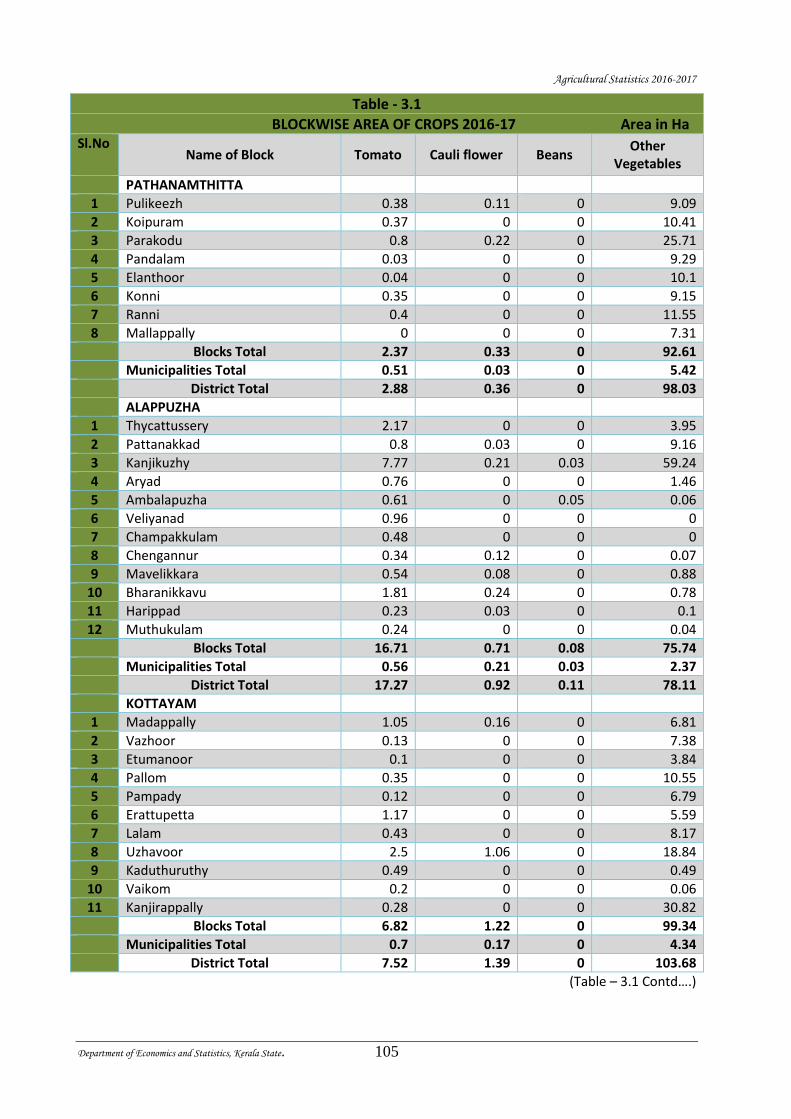
Agricultural Statistics 2016-2017
Department of Economics and Statistics, Kerala State. 105
Table - 3.1
BLOCKWISE AREA OF CROPS 2016-17 Area in Ha Sl.No
Name of Block Tomato Cauli flower Beans Other
Vegetables
PATHANAMTHITTA
1 Pulikeezh 0.38 0.11 0 9.09
2 Koipuram 0.37 0 0 10.41
3 Parakodu 0.8 0.22 0 25.71
4 Pandalam 0.03 0 0 9.29
5 Elanthoor 0.04 0 0 10.1
6 Konni 0.35 0 0 9.15
7 Ranni 0.4 0 0 11.55
8 Mallappally 0 0 0 7.31
Blocks Total 2.37 0.33 0 92.61
Municipalities Total 0.51 0.03 0 5.42
District Total 2.88 0.36 0 98.03
ALAPPUZHA
1 Thycattussery 2.17 0 0 3.95
2 Pattanakkad 0.8 0.03 0 9.16
3 Kanjikuzhy 7.77 0.21 0.03 59.24
4 Aryad 0.76 0 0 1.46
5 Ambalapuzha 0.61 0 0.05 0.06
6 Veliyanad 0.96 0 0 0
7 Champakkulam 0.48 0 0 0
8 Chengannur 0.34 0.12 0 0.07
9 Mavelikkara 0.54 0.08 0 0.88
10 Bharanikkavu 1.81 0.24 0 0.78
11 Harippad 0.23 0.03 0 0.1
12 Muthukulam 0.24 0 0 0.04
Blocks Total 16.71 0.71 0.08 75.74
Municipalities Total 0.56 0.21 0.03 2.37
District Total 17.27 0.92 0.11 78.11
KOTTAYAM
1 Madappally 1.05 0.16 0 6.81
2 Vazhoor 0.13 0 0 7.38
3 Etumanoor 0.1 0 0 3.84
4 Pallom 0.35 0 0 10.55
5 Pampady 0.12 0 0 6.79
6 Erattupetta 1.17 0 0 5.59
7 Lalam 0.43 0 0 8.17
8 Uzhavoor 2.5 1.06 0 18.84
9 Kaduthuruthy 0.49 0 0 0.49
10 Vaikom 0.2 0 0 0.06
11 Kanjirappally 0.28 0 0 30.82
Blocks Total 6.82 1.22 0 99.34
Municipalities Total 0.7 0.17 0 4.34
District Total 7.52 1.39 0 103.68
(Table – 3.1 Contd….)
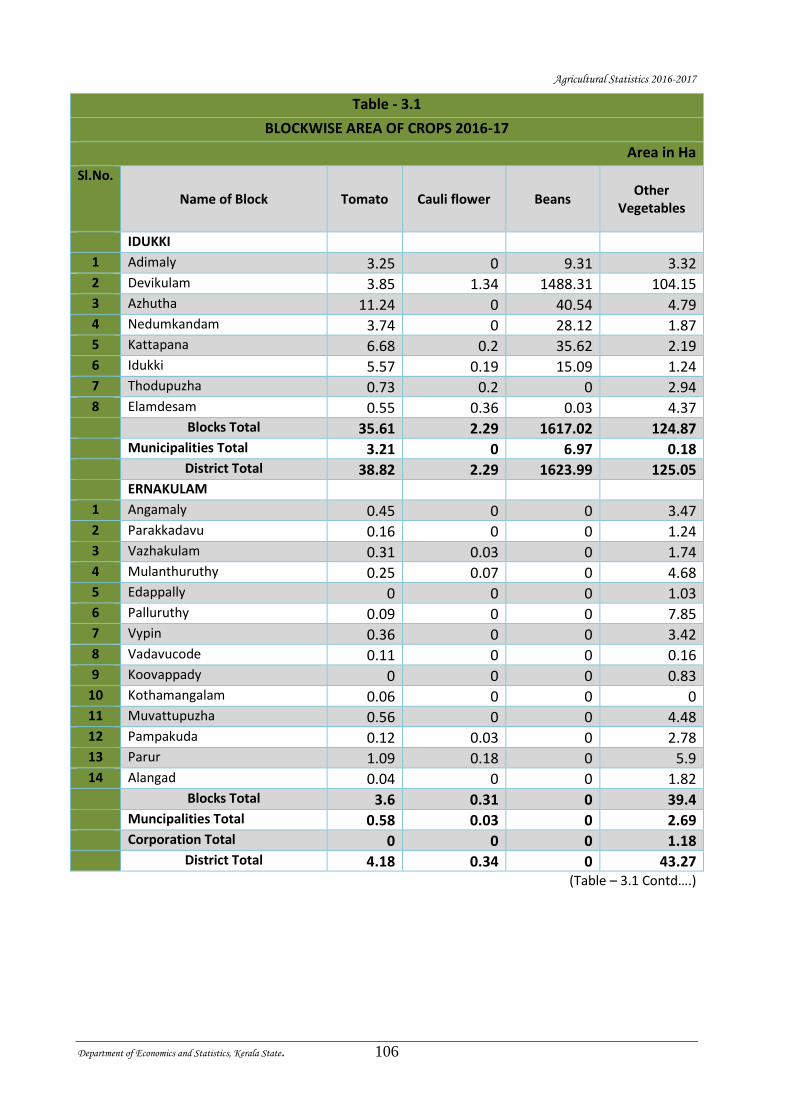
Agricultural Statistics 2016-2017
Department of Economics and Statistics, Kerala State. 106
Table - 3.1
BLOCKWISE AREA OF CROPS 2016-17
Area in Ha
Sl.No.
Name of Block Tomato Cauli flower Beans Other
Vegetables
IDUKKI
1 Adimaly 3.25 0 9.31 3.32 2 Devikulam 3.85 1.34 1488.31 104.15 3 Azhutha 11.24 0 40.54 4.79 4 Nedumkandam 3.74 0 28.12 1.87 5 Kattapana 6.68 0.2 35.62 2.19 6 Idukki 5.57 0.19 15.09 1.24 7 Thodupuzha 0.73 0.2 0 2.94 8 Elamdesam 0.55 0.36 0.03 4.37 Blocks Total 35.61 2.29 1617.02 124.87 Municipalities Total 3.21 0 6.97 0.18 District Total 38.82 2.29 1623.99 125.05 ERNAKULAM
1 Angamaly 0.45 0 0 3.47 2 Parakkadavu 0.16 0 0 1.24 3 Vazhakulam 0.31 0.03 0 1.74 4 Mulanthuruthy 0.25 0.07 0 4.68 5 Edappally 0 0 0 1.03 6 Palluruthy 0.09 0 0 7.85 7 Vypin 0.36 0 0 3.42 8 Vadavucode 0.11 0 0 0.16 9 Koovappady 0 0 0 0.83
10 Kothamangalam 0.06 0 0 0 11 Muvattupuzha 0.56 0 0 4.48 12 Pampakuda 0.12 0.03 0 2.78 13 Parur 1.09 0.18 0 5.9 14 Alangad 0.04 0 0 1.82 Blocks Total 3.6 0.31 0 39.4 Muncipalities Total 0.58 0.03 0 2.69 Corporation Total 0 0 0 1.18 District Total 4.18 0.34 0 43.27
(Table – 3.1 Contd….)
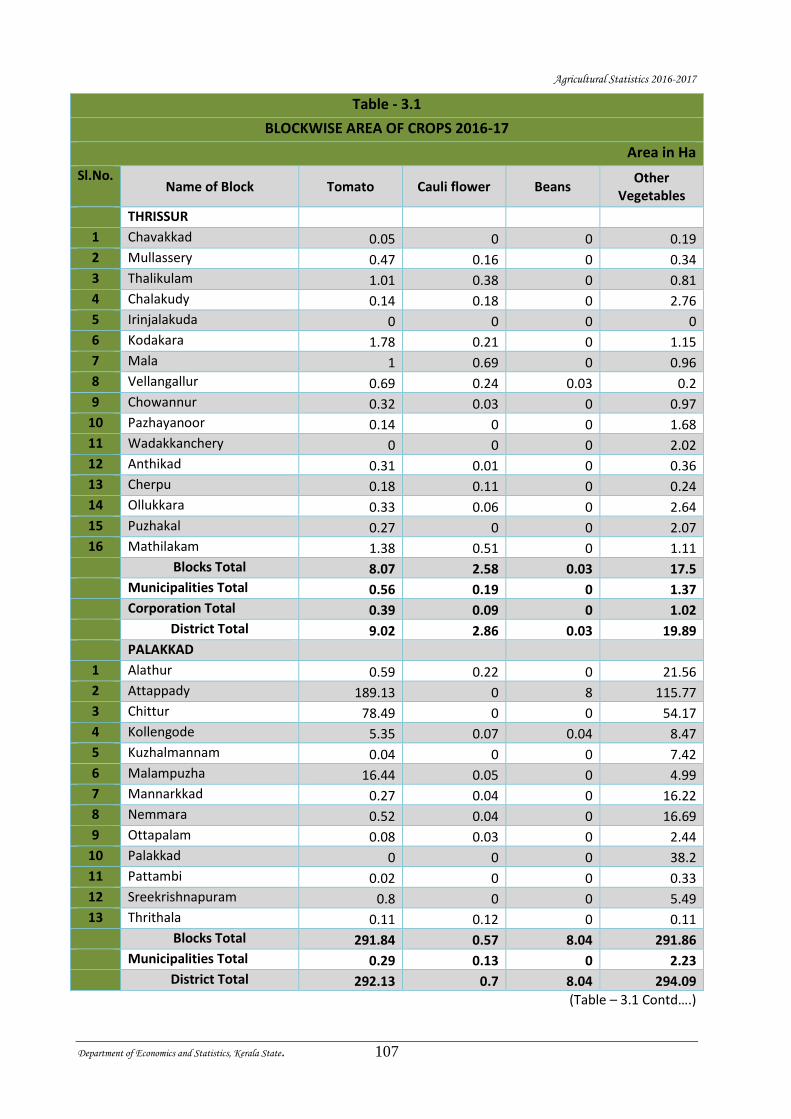
Agricultural Statistics 2016-2017
Department of Economics and Statistics, Kerala State. 107
Table - 3.1
BLOCKWISE AREA OF CROPS 2016-17
Area in Ha
Sl.No. Name of Block Tomato Cauli flower Beans
Other Vegetables
THRISSUR
1 Chavakkad 0.05 0 0 0.19
2 Mullassery 0.47 0.16 0 0.34
3 Thalikulam 1.01 0.38 0 0.81
4 Chalakudy 0.14 0.18 0 2.76
5 Irinjalakuda 0 0 0 0
6 Kodakara 1.78 0.21 0 1.15
7 Mala 1 0.69 0 0.96
8 Vellangallur 0.69 0.24 0.03 0.2
9 Chowannur 0.32 0.03 0 0.97
10 Pazhayanoor 0.14 0 0 1.68
11 Wadakkanchery 0 0 0 2.02
12 Anthikad 0.31 0.01 0 0.36
13 Cherpu 0.18 0.11 0 0.24
14 Ollukkara 0.33 0.06 0 2.64
15 Puzhakal 0.27 0 0 2.07
16 Mathilakam 1.38 0.51 0 1.11
Blocks Total 8.07 2.58 0.03 17.5
Municipalities Total 0.56 0.19 0 1.37
Corporation Total 0.39 0.09 0 1.02
District Total 9.02 2.86 0.03 19.89
PALAKKAD
1 Alathur 0.59 0.22 0 21.56
2 Attappady 189.13 0 8 115.77
3 Chittur 78.49 0 0 54.17
4 Kollengode 5.35 0.07 0.04 8.47
5 Kuzhalmannam 0.04 0 0 7.42
6 Malampuzha 16.44 0.05 0 4.99
7 Mannarkkad 0.27 0.04 0 16.22
8 Nemmara 0.52 0.04 0 16.69
9 Ottapalam 0.08 0.03 0 2.44
10 Palakkad 0 0 0 38.2
11 Pattambi 0.02 0 0 0.33
12 Sreekrishnapuram 0.8 0 0 5.49
13 Thrithala 0.11 0.12 0 0.11
Blocks Total 291.84 0.57 8.04 291.86
Municipalities Total 0.29 0.13 0 2.23
District Total 292.13 0.7 8.04 294.09
(Table – 3.1 Contd….)
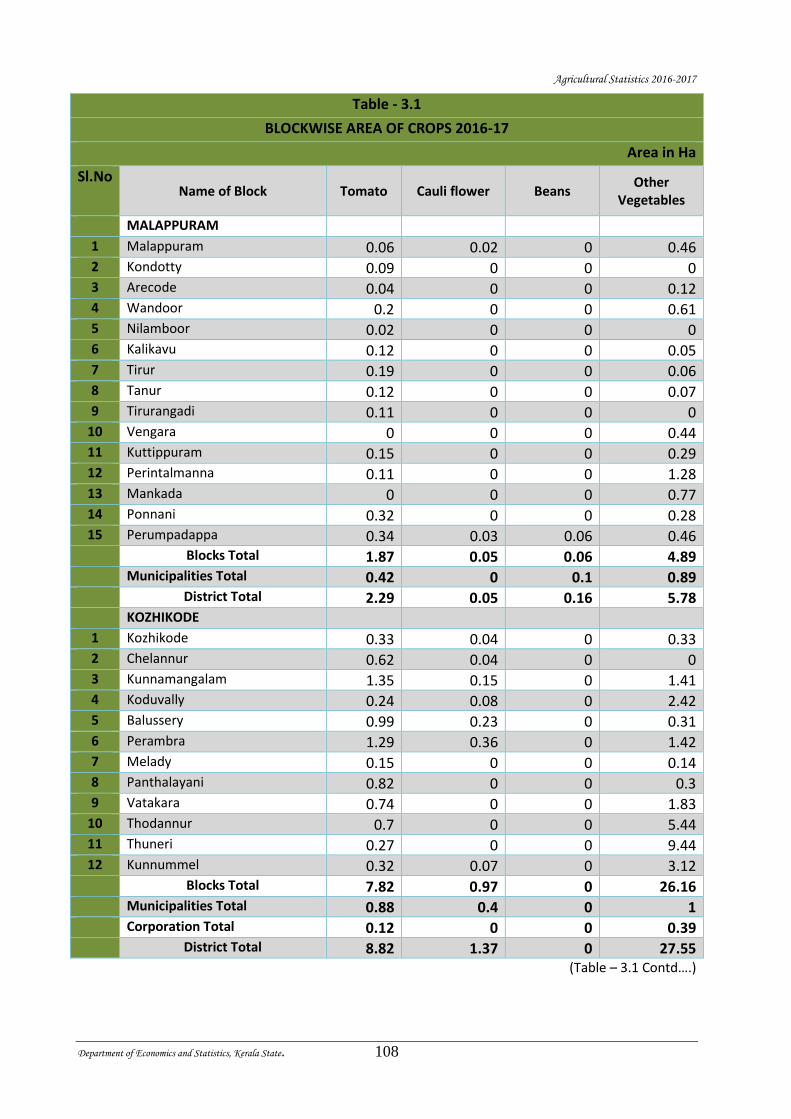
Agricultural Statistics 2016-2017
Department of Economics and Statistics, Kerala State. 108
Table - 3.1
BLOCKWISE AREA OF CROPS 2016-17
Area in Ha
Sl.No Name of Block Tomato Cauli flower Beans
Other Vegetables
MALAPPURAM
1 Malappuram 0.06 0.02 0 0.46 2 Kondotty 0.09 0 0 0 3 Arecode 0.04 0 0 0.12 4 Wandoor 0.2 0 0 0.61 5 Nilamboor 0.02 0 0 0 6 Kalikavu 0.12 0 0 0.05 7 Tirur 0.19 0 0 0.06 8 Tanur 0.12 0 0 0.07 9 Tirurangadi 0.11 0 0 0
10 Vengara 0 0 0 0.44 11 Kuttippuram 0.15 0 0 0.29 12 Perintalmanna 0.11 0 0 1.28 13 Mankada 0 0 0 0.77 14 Ponnani 0.32 0 0 0.28 15 Perumpadappa 0.34 0.03 0.06 0.46 Blocks Total 1.87 0.05 0.06 4.89 Municipalities Total 0.42 0 0.1 0.89 District Total 2.29 0.05 0.16 5.78 KOZHIKODE
1 Kozhikode 0.33 0.04 0 0.33 2 Chelannur 0.62 0.04 0 0 3 Kunnamangalam 1.35 0.15 0 1.41 4 Koduvally 0.24 0.08 0 2.42 5 Balussery 0.99 0.23 0 0.31 6 Perambra 1.29 0.36 0 1.42 7 Melady 0.15 0 0 0.14 8 Panthalayani 0.82 0 0 0.3 9 Vatakara 0.74 0 0 1.83
10 Thodannur 0.7 0 0 5.44 11 Thuneri 0.27 0 0 9.44 12 Kunnummel 0.32 0.07 0 3.12 Blocks Total 7.82 0.97 0 26.16 Municipalities Total 0.88 0.4 0 1 Corporation Total 0.12 0 0 0.39 District Total 8.82 1.37 0 27.55
(Table – 3.1 Contd….)
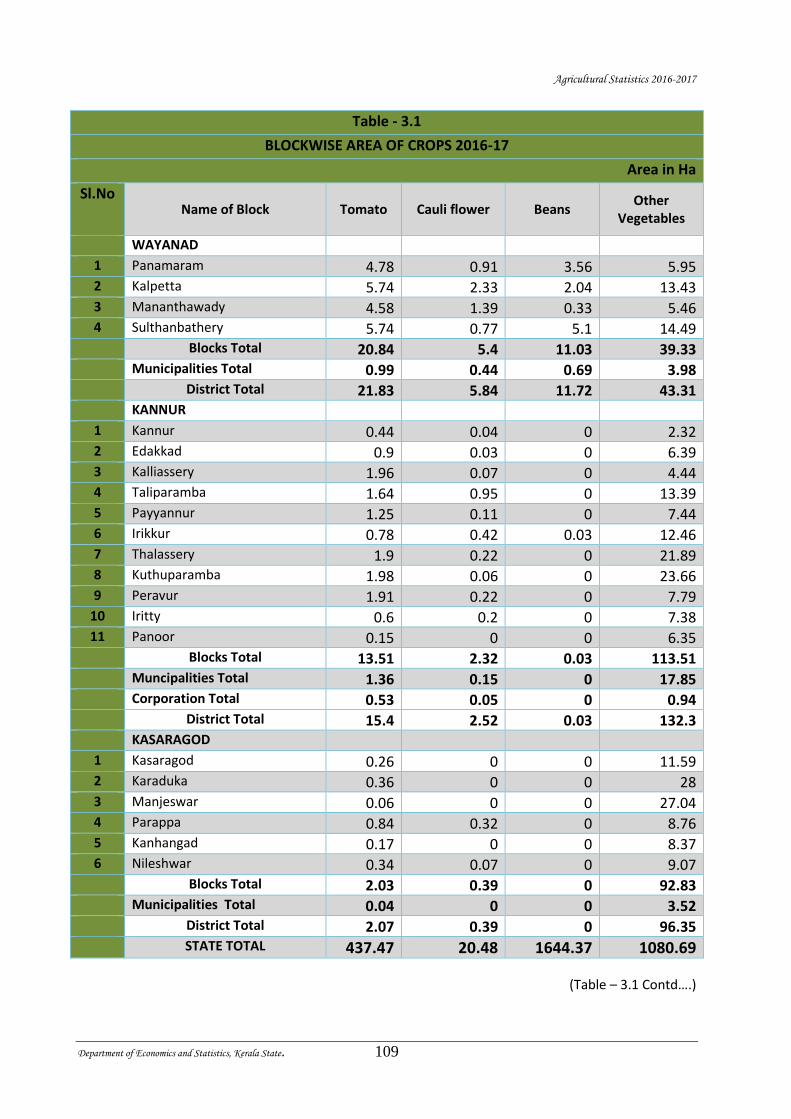
Agricultural Statistics 2016-2017
Department of Economics and Statistics, Kerala State. 109
Table - 3.1
BLOCKWISE AREA OF CROPS 2016-17
Area in Ha
Sl.No Name of Block Tomato Cauli flower Beans
Other Vegetables
WAYANAD
1 Panamaram 4.78 0.91 3.56 5.95 2 Kalpetta 5.74 2.33 2.04 13.43 3 Mananthawady 4.58 1.39 0.33 5.46 4 Sulthanbathery 5.74 0.77 5.1 14.49 Blocks Total 20.84 5.4 11.03 39.33 Municipalities Total 0.99 0.44 0.69 3.98 District Total 21.83 5.84 11.72 43.31 KANNUR
1 Kannur 0.44 0.04 0 2.32 2 Edakkad 0.9 0.03 0 6.39 3 Kalliassery 1.96 0.07 0 4.44 4 Taliparamba 1.64 0.95 0 13.39 5 Payyannur 1.25 0.11 0 7.44 6 Irikkur 0.78 0.42 0.03 12.46 7 Thalassery 1.9 0.22 0 21.89 8 Kuthuparamba 1.98 0.06 0 23.66 9 Peravur 1.91 0.22 0 7.79
10 Iritty 0.6 0.2 0 7.38 11 Panoor 0.15 0 0 6.35 Blocks Total 13.51 2.32 0.03 113.51 Muncipalities Total 1.36 0.15 0 17.85 Corporation Total 0.53 0.05 0 0.94 District Total 15.4 2.52 0.03 132.3 KASARAGOD
1 Kasaragod 0.26 0 0 11.59 2 Karaduka 0.36 0 0 28 3 Manjeswar 0.06 0 0 27.04 4 Parappa 0.84 0.32 0 8.76 5 Kanhangad 0.17 0 0 8.37 6 Nileshwar 0.34 0.07 0 9.07 Blocks Total 2.03 0.39 0 92.83 Municipalities Total 0.04 0 0 3.52 District Total 2.07 0.39 0 96.35
STATE TOTAL 437.47 20.48 1644.37 1080.69
(Table – 3.1 Contd….)
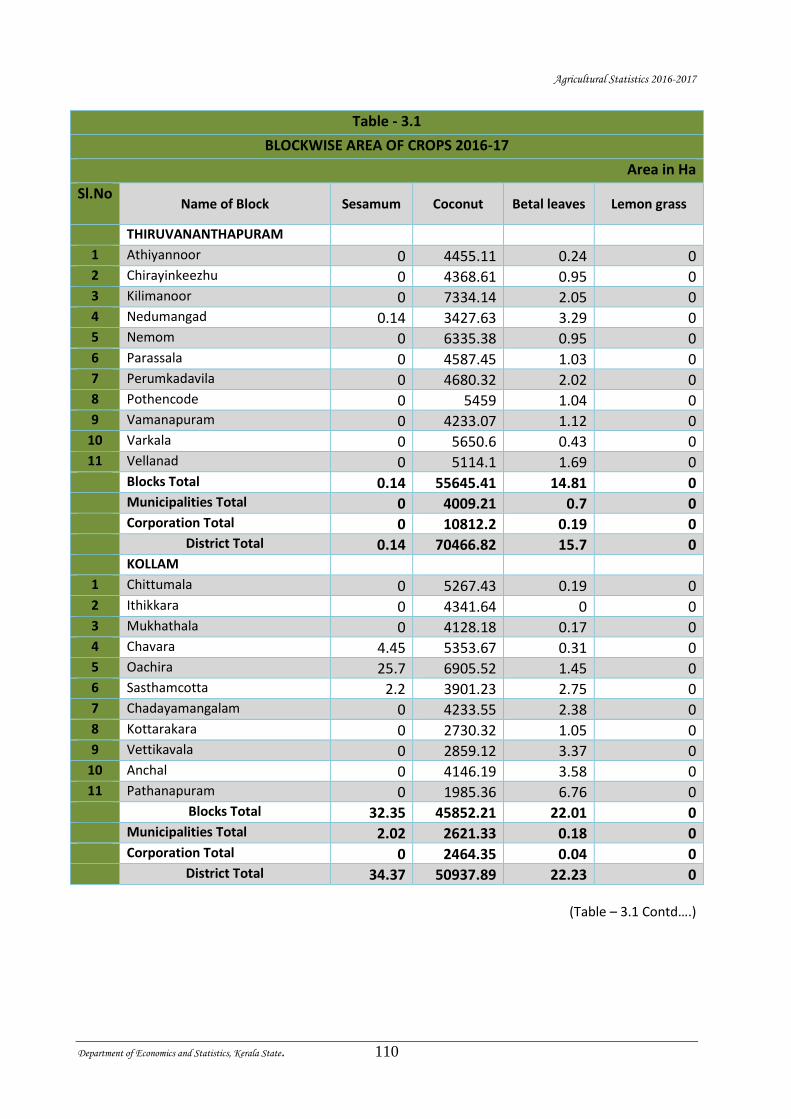
Agricultural Statistics 2016-2017
Department of Economics and Statistics, Kerala State. 110
Table - 3.1
BLOCKWISE AREA OF CROPS 2016-17
Area in Ha
Sl.No Name of Block Sesamum Coconut Betal leaves Lemon grass
THIRUVANANTHAPURAM
1 Athiyannoor 0 4455.11 0.24 0 2 Chirayinkeezhu 0 4368.61 0.95 0 3 Kilimanoor 0 7334.14 2.05 0 4 Nedumangad 0.14 3427.63 3.29 0 5 Nemom 0 6335.38 0.95 0 6 Parassala 0 4587.45 1.03 0 7 Perumkadavila 0 4680.32 2.02 0 8 Pothencode 0 5459 1.04 0 9 Vamanapuram 0 4233.07 1.12 0
10 Varkala 0 5650.6 0.43 0 11 Vellanad 0 5114.1 1.69 0 Blocks Total 0.14 55645.41 14.81 0 Municipalities Total 0 4009.21 0.7 0 Corporation Total 0 10812.2 0.19 0 District Total 0.14 70466.82 15.7 0 KOLLAM
1 Chittumala 0 5267.43 0.19 0 2 Ithikkara 0 4341.64 0 0 3 Mukhathala 0 4128.18 0.17 0 4 Chavara 4.45 5353.67 0.31 0 5 Oachira 25.7 6905.52 1.45 0 6 Sasthamcotta 2.2 3901.23 2.75 0 7 Chadayamangalam 0 4233.55 2.38 0 8 Kottarakara 0 2730.32 1.05 0 9 Vettikavala 0 2859.12 3.37 0
10 Anchal 0 4146.19 3.58 0 11 Pathanapuram 0 1985.36 6.76 0 Blocks Total 32.35 45852.21 22.01 0 Municipalities Total 2.02 2621.33 0.18 0 Corporation Total 0 2464.35 0.04 0 District Total 34.37 50937.89 22.23 0
(Table – 3.1 Contd….)
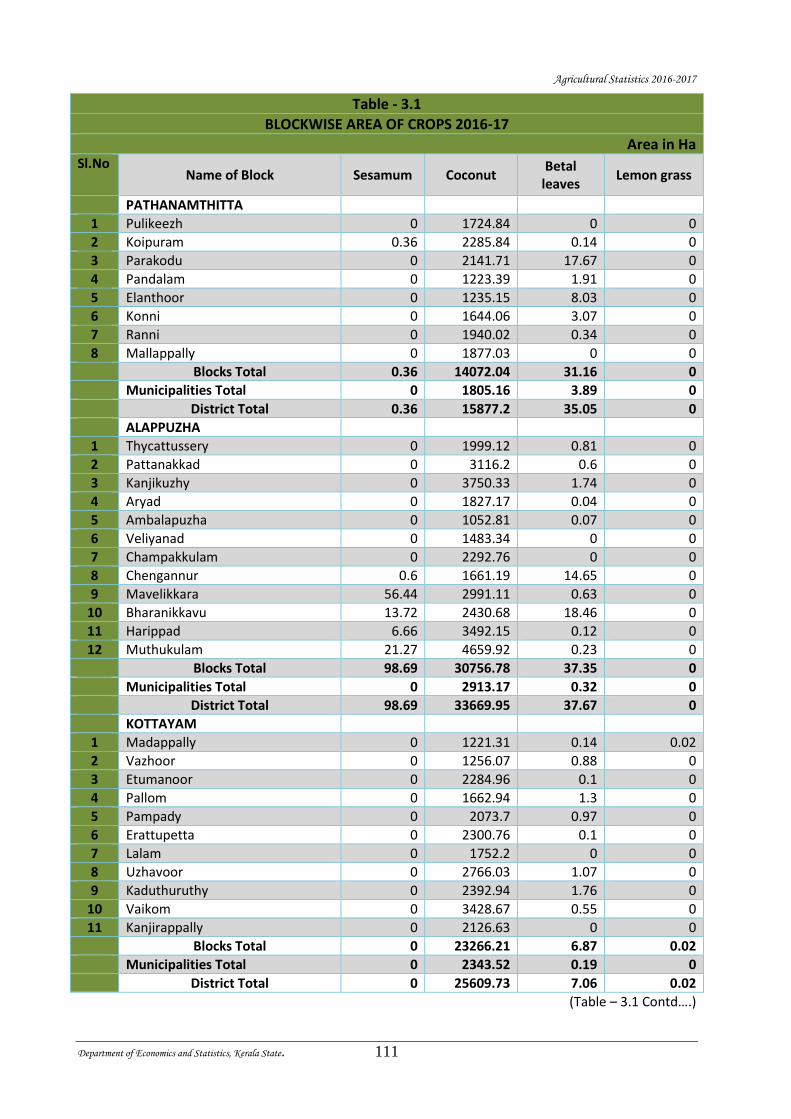
Agricultural Statistics 2016-2017
Department of Economics and Statistics, Kerala State. 111
Table - 3.1
BLOCKWISE AREA OF CROPS 2016-17
Area in Ha Sl.No
Name of Block Sesamum Coconut Betal
leaves Lemon grass
PATHANAMTHITTA
1 Pulikeezh 0 1724.84 0 0
2 Koipuram 0.36 2285.84 0.14 0
3 Parakodu 0 2141.71 17.67 0
4 Pandalam 0 1223.39 1.91 0
5 Elanthoor 0 1235.15 8.03 0
6 Konni 0 1644.06 3.07 0
7 Ranni 0 1940.02 0.34 0
8 Mallappally 0 1877.03 0 0
Blocks Total 0.36 14072.04 31.16 0
Municipalities Total 0 1805.16 3.89 0
District Total 0.36 15877.2 35.05 0
ALAPPUZHA
1 Thycattussery 0 1999.12 0.81 0
2 Pattanakkad 0 3116.2 0.6 0
3 Kanjikuzhy 0 3750.33 1.74 0
4 Aryad 0 1827.17 0.04 0
5 Ambalapuzha 0 1052.81 0.07 0
6 Veliyanad 0 1483.34 0 0
7 Champakkulam 0 2292.76 0 0
8 Chengannur 0.6 1661.19 14.65 0
9 Mavelikkara 56.44 2991.11 0.63 0
10 Bharanikkavu 13.72 2430.68 18.46 0
11 Harippad 6.66 3492.15 0.12 0
12 Muthukulam 21.27 4659.92 0.23 0
Blocks Total 98.69 30756.78 37.35 0
Municipalities Total 0 2913.17 0.32 0
District Total 98.69 33669.95 37.67 0
KOTTAYAM
1 Madappally 0 1221.31 0.14 0.02
2 Vazhoor 0 1256.07 0.88 0
3 Etumanoor 0 2284.96 0.1 0
4 Pallom 0 1662.94 1.3 0
5 Pampady 0 2073.7 0.97 0
6 Erattupetta 0 2300.76 0.1 0
7 Lalam 0 1752.2 0 0
8 Uzhavoor 0 2766.03 1.07 0
9 Kaduthuruthy 0 2392.94 1.76 0
10 Vaikom 0 3428.67 0.55 0
11 Kanjirappally 0 2126.63 0 0
Blocks Total 0 23266.21 6.87 0.02
Municipalities Total 0 2343.52 0.19 0
District Total 0 25609.73 7.06 0.02
(Table – 3.1 Contd….)
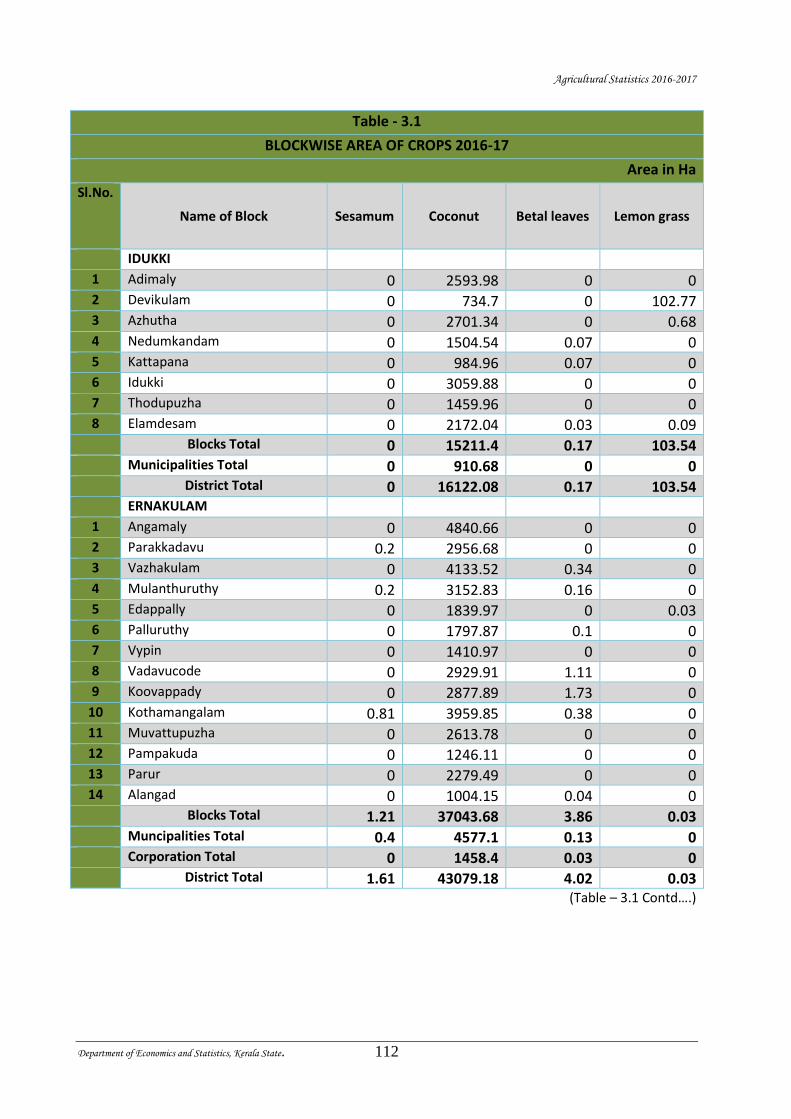
Agricultural Statistics 2016-2017
Department of Economics and Statistics, Kerala State. 112
Table - 3.1
BLOCKWISE AREA OF CROPS 2016-17
Area in Ha
Sl.No.
Name of Block Sesamum Coconut Betal leaves Lemon grass
IDUKKI
1 Adimaly 0 2593.98 0 0 2 Devikulam 0 734.7 0 102.77 3 Azhutha 0 2701.34 0 0.68 4 Nedumkandam 0 1504.54 0.07 0 5 Kattapana 0 984.96 0.07 0 6 Idukki 0 3059.88 0 0 7 Thodupuzha 0 1459.96 0 0 8 Elamdesam 0 2172.04 0.03 0.09 Blocks Total 0 15211.4 0.17 103.54 Municipalities Total 0 910.68 0 0 District Total 0 16122.08 0.17 103.54 ERNAKULAM
1 Angamaly 0 4840.66 0 0 2 Parakkadavu 0.2 2956.68 0 0 3 Vazhakulam 0 4133.52 0.34 0 4 Mulanthuruthy 0.2 3152.83 0.16 0 5 Edappally 0 1839.97 0 0.03 6 Palluruthy 0 1797.87 0.1 0 7 Vypin 0 1410.97 0 0 8 Vadavucode 0 2929.91 1.11 0 9 Koovappady 0 2877.89 1.73 0
10 Kothamangalam 0.81 3959.85 0.38 0 11 Muvattupuzha 0 2613.78 0 0 12 Pampakuda 0 1246.11 0 0 13 Parur 0 2279.49 0 0 14 Alangad 0 1004.15 0.04 0 Blocks Total 1.21 37043.68 3.86 0.03 Muncipalities Total 0.4 4577.1 0.13 0 Corporation Total 0 1458.4 0.03 0 District Total 1.61 43079.18 4.02 0.03
(Table – 3.1 Contd….)
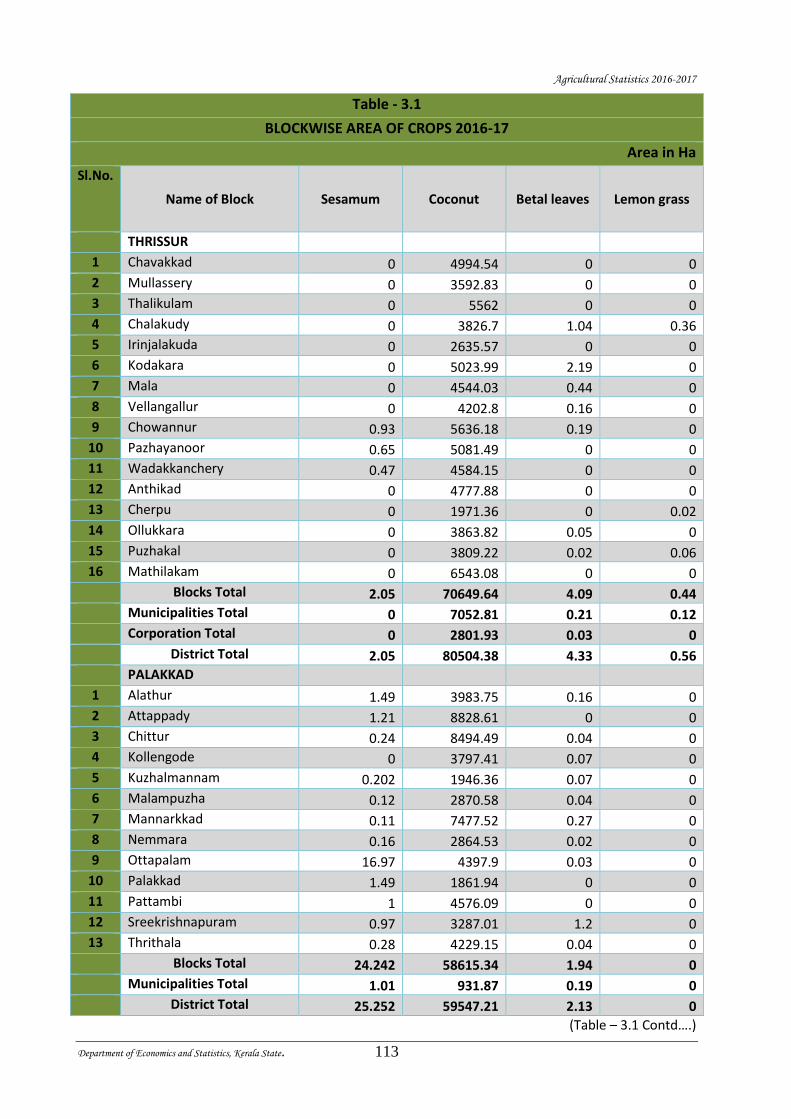
Agricultural Statistics 2016-2017
Department of Economics and Statistics, Kerala State. 113
Table - 3.1
BLOCKWISE AREA OF CROPS 2016-17
Area in Ha
Sl.No.
Name of Block Sesamum Coconut Betal leaves Lemon grass
THRISSUR
1 Chavakkad 0 4994.54 0 0
2 Mullassery 0 3592.83 0 0
3 Thalikulam 0 5562 0 0
4 Chalakudy 0 3826.7 1.04 0.36
5 Irinjalakuda 0 2635.57 0 0
6 Kodakara 0 5023.99 2.19 0
7 Mala 0 4544.03 0.44 0
8 Vellangallur 0 4202.8 0.16 0
9 Chowannur 0.93 5636.18 0.19 0
10 Pazhayanoor 0.65 5081.49 0 0
11 Wadakkanchery 0.47 4584.15 0 0
12 Anthikad 0 4777.88 0 0
13 Cherpu 0 1971.36 0 0.02
14 Ollukkara 0 3863.82 0.05 0
15 Puzhakal 0 3809.22 0.02 0.06
16 Mathilakam 0 6543.08 0 0
Blocks Total 2.05 70649.64 4.09 0.44
Municipalities Total 0 7052.81 0.21 0.12
Corporation Total 0 2801.93 0.03 0
District Total 2.05 80504.38 4.33 0.56
PALAKKAD
1 Alathur 1.49 3983.75 0.16 0
2 Attappady 1.21 8828.61 0 0
3 Chittur 0.24 8494.49 0.04 0
4 Kollengode 0 3797.41 0.07 0
5 Kuzhalmannam 0.202 1946.36 0.07 0
6 Malampuzha 0.12 2870.58 0.04 0
7 Mannarkkad 0.11 7477.52 0.27 0
8 Nemmara 0.16 2864.53 0.02 0
9 Ottapalam 16.97 4397.9 0.03 0
10 Palakkad 1.49 1861.94 0 0
11 Pattambi 1 4576.09 0 0
12 Sreekrishnapuram 0.97 3287.01 1.2 0
13 Thrithala 0.28 4229.15 0.04 0
Blocks Total 24.242 58615.34 1.94 0
Municipalities Total 1.01 931.87 0.19 0
District Total 25.252 59547.21 2.13 0
(Table – 3.1 Contd….)
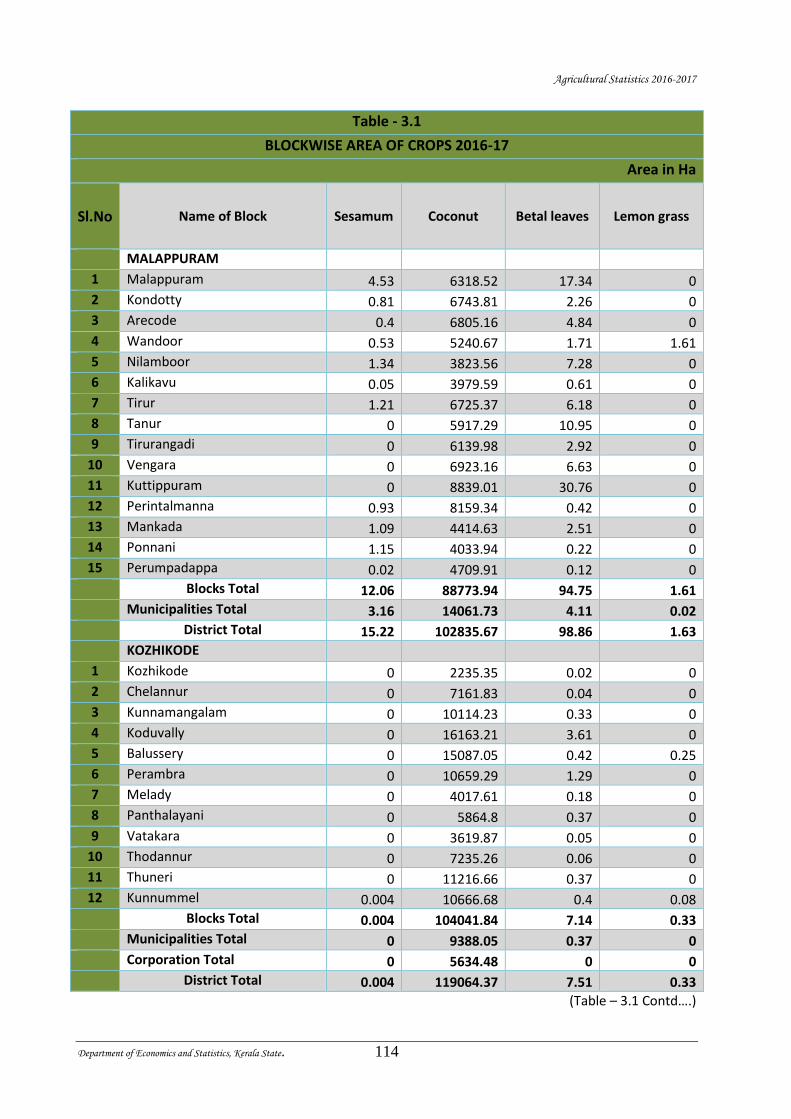
Agricultural Statistics 2016-2017
Department of Economics and Statistics, Kerala State. 114
Table - 3.1
BLOCKWISE AREA OF CROPS 2016-17
Area in Ha
Sl.No Name of Block Sesamum Coconut Betal leaves Lemon grass
MALAPPURAM
1 Malappuram 4.53 6318.52 17.34 0
2 Kondotty 0.81 6743.81 2.26 0
3 Arecode 0.4 6805.16 4.84 0
4 Wandoor 0.53 5240.67 1.71 1.61
5 Nilamboor 1.34 3823.56 7.28 0
6 Kalikavu 0.05 3979.59 0.61 0
7 Tirur 1.21 6725.37 6.18 0
8 Tanur 0 5917.29 10.95 0
9 Tirurangadi 0 6139.98 2.92 0
10 Vengara 0 6923.16 6.63 0
11 Kuttippuram 0 8839.01 30.76 0
12 Perintalmanna 0.93 8159.34 0.42 0
13 Mankada 1.09 4414.63 2.51 0
14 Ponnani 1.15 4033.94 0.22 0
15 Perumpadappa 0.02 4709.91 0.12 0
Blocks Total 12.06 88773.94 94.75 1.61
Municipalities Total 3.16 14061.73 4.11 0.02
District Total 15.22 102835.67 98.86 1.63
KOZHIKODE
1 Kozhikode 0 2235.35 0.02 0
2 Chelannur 0 7161.83 0.04 0
3 Kunnamangalam 0 10114.23 0.33 0
4 Koduvally 0 16163.21 3.61 0
5 Balussery 0 15087.05 0.42 0.25
6 Perambra 0 10659.29 1.29 0
7 Melady 0 4017.61 0.18 0
8 Panthalayani 0 5864.8 0.37 0
9 Vatakara 0 3619.87 0.05 0
10 Thodannur 0 7235.26 0.06 0
11 Thuneri 0 11216.66 0.37 0
12 Kunnummel 0.004 10666.68 0.4 0.08
Blocks Total 0.004 104041.84 7.14 0.33
Municipalities Total 0 9388.05 0.37 0
Corporation Total 0 5634.48 0 0
District Total 0.004 119064.37 7.51 0.33
(Table – 3.1 Contd….)
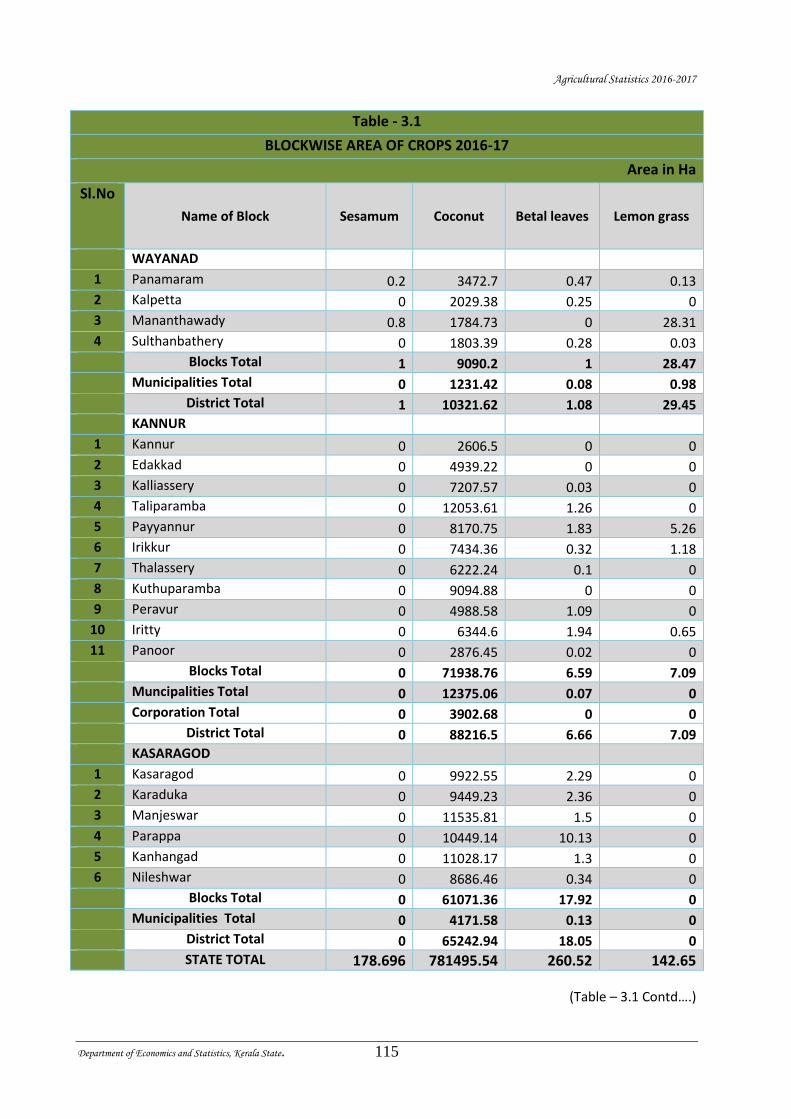
Agricultural Statistics 2016-2017
Department of Economics and Statistics, Kerala State. 115
Table - 3.1
BLOCKWISE AREA OF CROPS 2016-17
Area in Ha
Sl.No
Name of Block Sesamum Coconut Betal leaves Lemon grass
WAYANAD
1 Panamaram 0.2 3472.7 0.47 0.13
2 Kalpetta 0 2029.38 0.25 0
3 Mananthawady 0.8 1784.73 0 28.31
4 Sulthanbathery 0 1803.39 0.28 0.03
Blocks Total 1 9090.2 1 28.47
Municipalities Total 0 1231.42 0.08 0.98
District Total 1 10321.62 1.08 29.45
KANNUR
1 Kannur 0 2606.5 0 0
2 Edakkad 0 4939.22 0 0
3 Kalliassery 0 7207.57 0.03 0
4 Taliparamba 0 12053.61 1.26 0
5 Payyannur 0 8170.75 1.83 5.26
6 Irikkur 0 7434.36 0.32 1.18
7 Thalassery 0 6222.24 0.1 0
8 Kuthuparamba 0 9094.88 0 0
9 Peravur 0 4988.58 1.09 0
10 Iritty 0 6344.6 1.94 0.65
11 Panoor 0 2876.45 0.02 0
Blocks Total 0 71938.76 6.59 7.09
Muncipalities Total 0 12375.06 0.07 0
Corporation Total 0 3902.68 0 0
District Total 0 88216.5 6.66 7.09
KASARAGOD
1 Kasaragod 0 9922.55 2.29 0
2 Karaduka 0 9449.23 2.36 0
3 Manjeswar 0 11535.81 1.5 0
4 Parappa 0 10449.14 10.13 0
5 Kanhangad 0 11028.17 1.3 0
6 Nileshwar 0 8686.46 0.34 0
Blocks Total 0 61071.36 17.92 0
Municipalities Total 0 4171.58 0.13 0
District Total 0 65242.94 18.05 0
STATE TOTAL 178.696 781495.54 260.52 142.65
(Table – 3.1 Contd….)
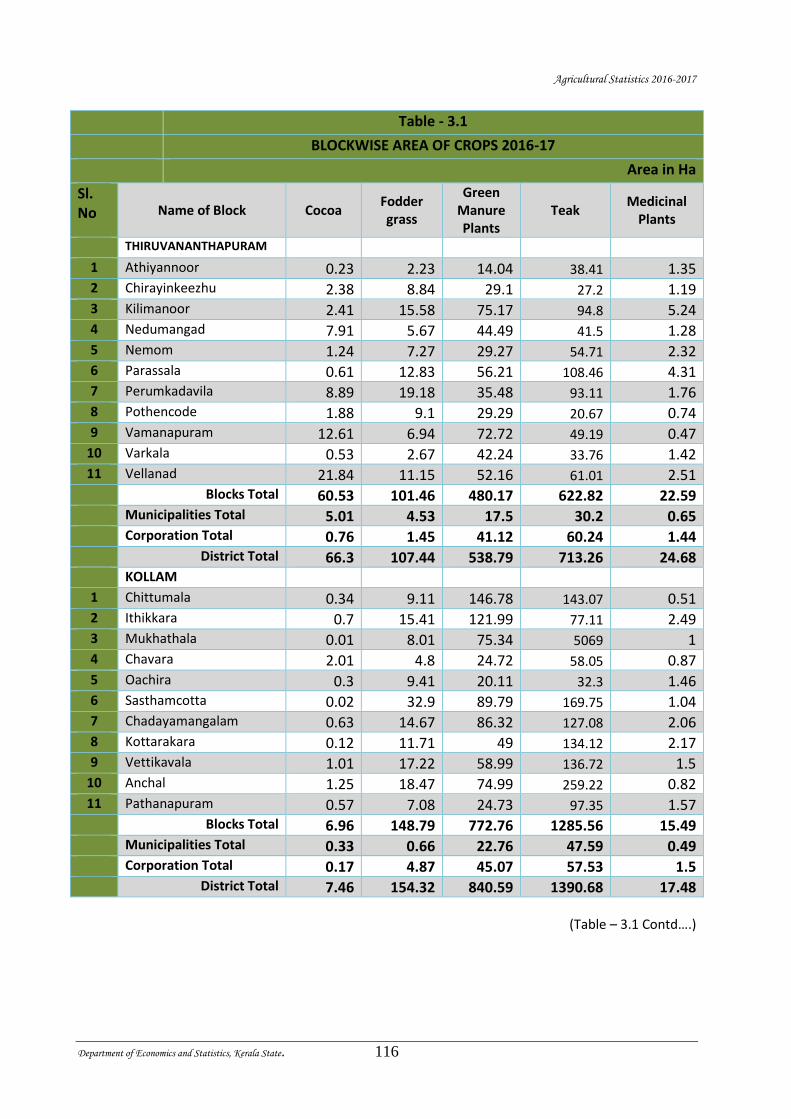
Agricultural Statistics 2016-2017
Department of Economics and Statistics, Kerala State. 116
Table - 3.1
BLOCKWISE AREA OF CROPS 2016-17
Area in Ha
Sl. No Name of Block Cocoa
Fodder grass
Green Manure Plants
Teak Medicinal
Plants
THIRUVANANTHAPURAM
1 Athiyannoor 0.23 2.23 14.04 38.41 1.35 2 Chirayinkeezhu 2.38 8.84 29.1 27.2 1.19 3 Kilimanoor 2.41 15.58 75.17 94.8 5.24 4 Nedumangad 7.91 5.67 44.49 41.5 1.28 5 Nemom 1.24 7.27 29.27 54.71 2.32 6 Parassala 0.61 12.83 56.21 108.46 4.31 7 Perumkadavila 8.89 19.18 35.48 93.11 1.76 8 Pothencode 1.88 9.1 29.29 20.67 0.74 9 Vamanapuram 12.61 6.94 72.72 49.19 0.47
10 Varkala 0.53 2.67 42.24 33.76 1.42 11 Vellanad 21.84 11.15 52.16 61.01 2.51 Blocks Total 60.53 101.46 480.17 622.82 22.59 Municipalities Total 5.01 4.53 17.5 30.2 0.65 Corporation Total 0.76 1.45 41.12 60.24 1.44 District Total 66.3 107.44 538.79 713.26 24.68 KOLLAM
1 Chittumala 0.34 9.11 146.78 143.07 0.51 2 Ithikkara 0.7 15.41 121.99 77.11 2.49 3 Mukhathala 0.01 8.01 75.34 5069 1 4 Chavara 2.01 4.8 24.72 58.05 0.87 5 Oachira 0.3 9.41 20.11 32.3 1.46 6 Sasthamcotta 0.02 32.9 89.79 169.75 1.04 7 Chadayamangalam 0.63 14.67 86.32 127.08 2.06 8 Kottarakara 0.12 11.71 49 134.12 2.17 9 Vettikavala 1.01 17.22 58.99 136.72 1.5
10 Anchal 1.25 18.47 74.99 259.22 0.82 11 Pathanapuram 0.57 7.08 24.73 97.35 1.57 Blocks Total 6.96 148.79 772.76 1285.56 15.49 Municipalities Total 0.33 0.66 22.76 47.59 0.49 Corporation Total 0.17 4.87 45.07 57.53 1.5 District Total 7.46 154.32 840.59 1390.68 17.48
(Table – 3.1 Contd….)
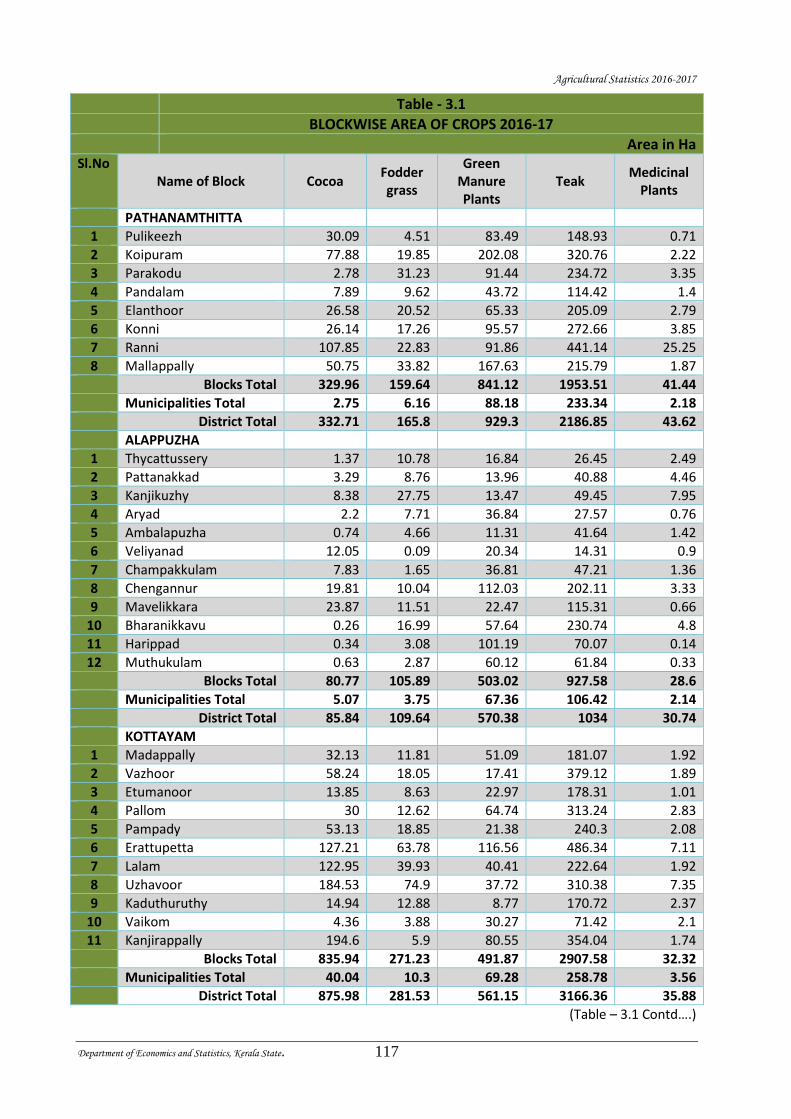
Agricultural Statistics 2016-2017
Department of Economics and Statistics, Kerala State. 117
Table - 3.1
BLOCKWISE AREA OF CROPS 2016-17
Area in Ha Sl.No
Name of Block Cocoa Fodder grass
Green Manure Plants
Teak Medicinal
Plants
PATHANAMTHITTA
1 Pulikeezh 30.09 4.51 83.49 148.93 0.71
2 Koipuram 77.88 19.85 202.08 320.76 2.22
3 Parakodu 2.78 31.23 91.44 234.72 3.35
4 Pandalam 7.89 9.62 43.72 114.42 1.4
5 Elanthoor 26.58 20.52 65.33 205.09 2.79
6 Konni 26.14 17.26 95.57 272.66 3.85
7 Ranni 107.85 22.83 91.86 441.14 25.25
8 Mallappally 50.75 33.82 167.63 215.79 1.87
Blocks Total 329.96 159.64 841.12 1953.51 41.44
Municipalities Total 2.75 6.16 88.18 233.34 2.18
District Total 332.71 165.8 929.3 2186.85 43.62
ALAPPUZHA
1 Thycattussery 1.37 10.78 16.84 26.45 2.49
2 Pattanakkad 3.29 8.76 13.96 40.88 4.46
3 Kanjikuzhy 8.38 27.75 13.47 49.45 7.95
4 Aryad 2.2 7.71 36.84 27.57 0.76
5 Ambalapuzha 0.74 4.66 11.31 41.64 1.42
6 Veliyanad 12.05 0.09 20.34 14.31 0.9
7 Champakkulam 7.83 1.65 36.81 47.21 1.36
8 Chengannur 19.81 10.04 112.03 202.11 3.33
9 Mavelikkara 23.87 11.51 22.47 115.31 0.66
10 Bharanikkavu 0.26 16.99 57.64 230.74 4.8
11 Harippad 0.34 3.08 101.19 70.07 0.14
12 Muthukulam 0.63 2.87 60.12 61.84 0.33
Blocks Total 80.77 105.89 503.02 927.58 28.6
Municipalities Total 5.07 3.75 67.36 106.42 2.14
District Total 85.84 109.64 570.38 1034 30.74
KOTTAYAM
1 Madappally 32.13 11.81 51.09 181.07 1.92
2 Vazhoor 58.24 18.05 17.41 379.12 1.89
3 Etumanoor 13.85 8.63 22.97 178.31 1.01
4 Pallom 30 12.62 64.74 313.24 2.83
5 Pampady 53.13 18.85 21.38 240.3 2.08
6 Erattupetta 127.21 63.78 116.56 486.34 7.11
7 Lalam 122.95 39.93 40.41 222.64 1.92
8 Uzhavoor 184.53 74.9 37.72 310.38 7.35
9 Kaduthuruthy 14.94 12.88 8.77 170.72 2.37
10 Vaikom 4.36 3.88 30.27 71.42 2.1
11 Kanjirappally 194.6 5.9 80.55 354.04 1.74
Blocks Total 835.94 271.23 491.87 2907.58 32.32
Municipalities Total 40.04 10.3 69.28 258.78 3.56
District Total 875.98 281.53 561.15 3166.36 35.88
(Table – 3.1 Contd….)
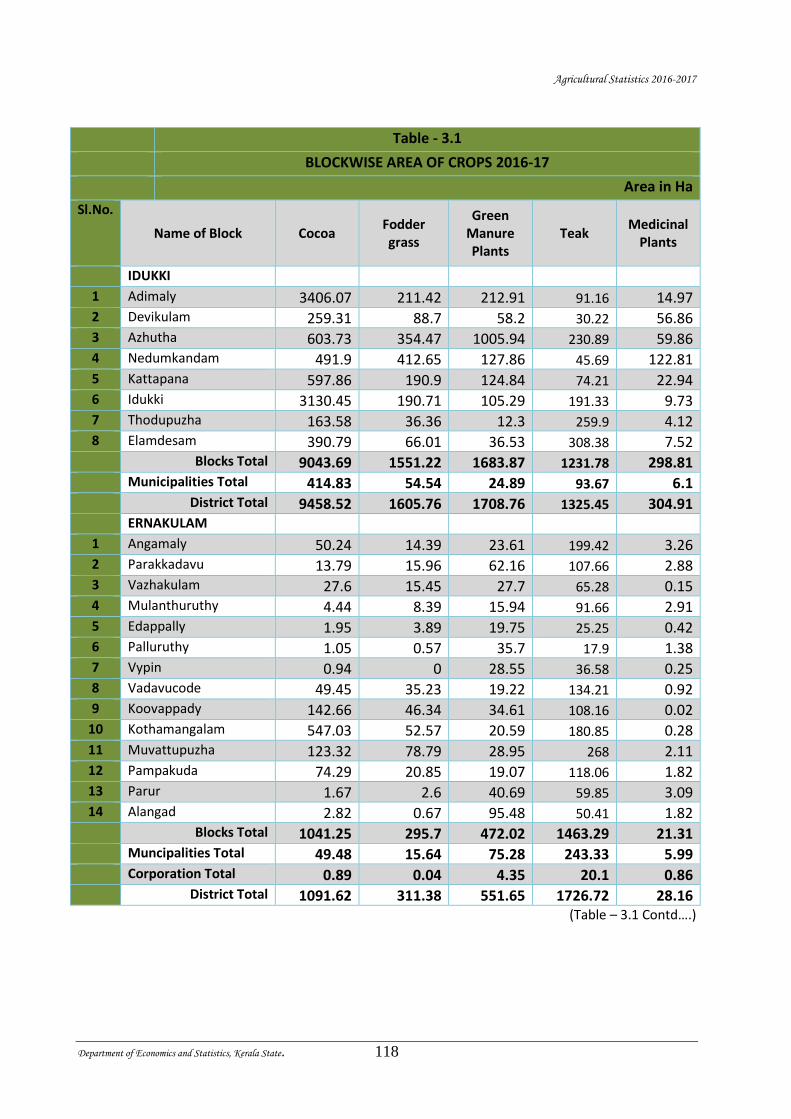
Agricultural Statistics 2016-2017
Department of Economics and Statistics, Kerala State. 118
Table - 3.1
BLOCKWISE AREA OF CROPS 2016-17
Area in Ha
Sl.No.
Name of Block Cocoa Fodder grass
Green Manure Plants
Teak Medicinal
Plants
IDUKKI
1 Adimaly 3406.07 211.42 212.91 91.16 14.97 2 Devikulam 259.31 88.7 58.2 30.22 56.86 3 Azhutha 603.73 354.47 1005.94 230.89 59.86 4 Nedumkandam 491.9 412.65 127.86 45.69 122.81 5 Kattapana 597.86 190.9 124.84 74.21 22.94 6 Idukki 3130.45 190.71 105.29 191.33 9.73 7 Thodupuzha 163.58 36.36 12.3 259.9 4.12 8 Elamdesam 390.79 66.01 36.53 308.38 7.52 Blocks Total 9043.69 1551.22 1683.87 1231.78 298.81 Municipalities Total 414.83 54.54 24.89 93.67 6.1 District Total 9458.52 1605.76 1708.76 1325.45 304.91 ERNAKULAM
1 Angamaly 50.24 14.39 23.61 199.42 3.26 2 Parakkadavu 13.79 15.96 62.16 107.66 2.88 3 Vazhakulam 27.6 15.45 27.7 65.28 0.15 4 Mulanthuruthy 4.44 8.39 15.94 91.66 2.91 5 Edappally 1.95 3.89 19.75 25.25 0.42 6 Palluruthy 1.05 0.57 35.7 17.9 1.38 7 Vypin 0.94 0 28.55 36.58 0.25 8 Vadavucode 49.45 35.23 19.22 134.21 0.92 9 Koovappady 142.66 46.34 34.61 108.16 0.02
10 Kothamangalam 547.03 52.57 20.59 180.85 0.28 11 Muvattupuzha 123.32 78.79 28.95 268 2.11 12 Pampakuda 74.29 20.85 19.07 118.06 1.82 13 Parur 1.67 2.6 40.69 59.85 3.09 14 Alangad 2.82 0.67 95.48 50.41 1.82 Blocks Total 1041.25 295.7 472.02 1463.29 21.31 Muncipalities Total 49.48 15.64 75.28 243.33 5.99 Corporation Total 0.89 0.04 4.35 20.1 0.86 District Total 1091.62 311.38 551.65 1726.72 28.16
(Table – 3.1 Contd….)
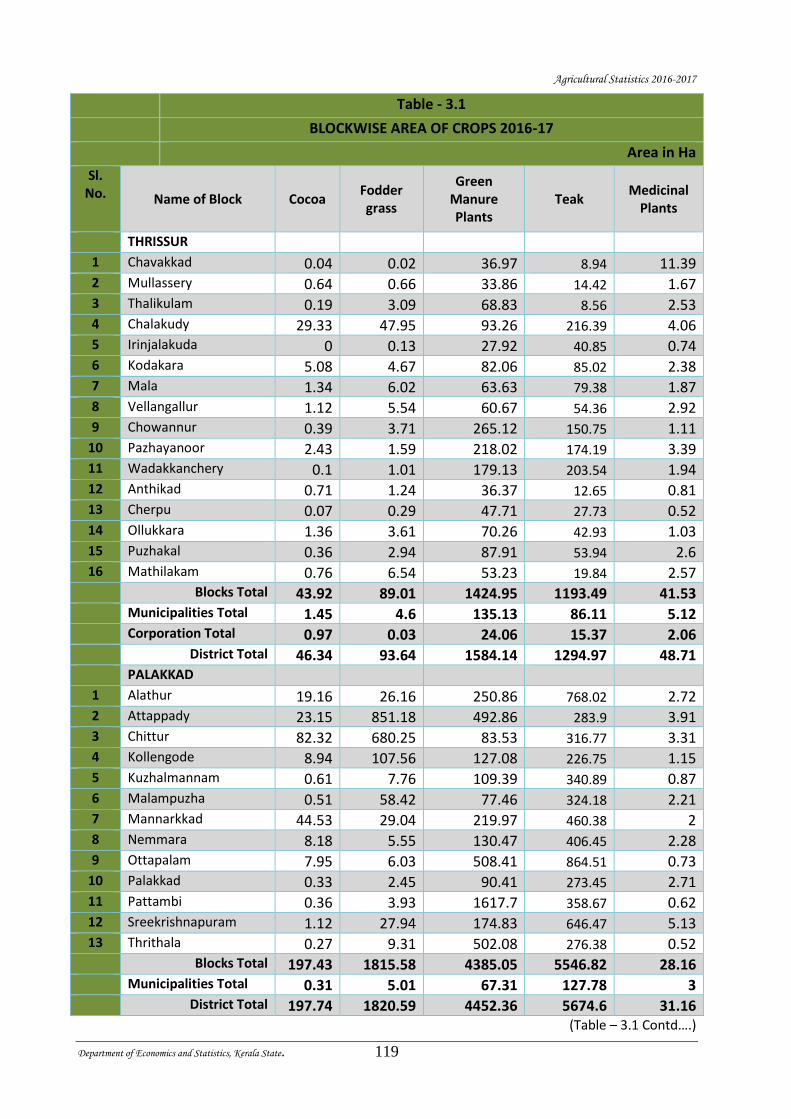
Agricultural Statistics 2016-2017
Department of Economics and Statistics, Kerala State. 119
Table - 3.1
BLOCKWISE AREA OF CROPS 2016-17
Area in Ha
Sl. No. Name of Block Cocoa
Fodder grass
Green Manure Plants
Teak Medicinal
Plants
THRISSUR
1 Chavakkad 0.04 0.02 36.97 8.94 11.39 2 Mullassery 0.64 0.66 33.86 14.42 1.67 3 Thalikulam 0.19 3.09 68.83 8.56 2.53 4 Chalakudy 29.33 47.95 93.26 216.39 4.06 5 Irinjalakuda 0 0.13 27.92 40.85 0.74 6 Kodakara 5.08 4.67 82.06 85.02 2.38 7 Mala 1.34 6.02 63.63 79.38 1.87 8 Vellangallur 1.12 5.54 60.67 54.36 2.92 9 Chowannur 0.39 3.71 265.12 150.75 1.11
10 Pazhayanoor 2.43 1.59 218.02 174.19 3.39 11 Wadakkanchery 0.1 1.01 179.13 203.54 1.94 12 Anthikad 0.71 1.24 36.37 12.65 0.81 13 Cherpu 0.07 0.29 47.71 27.73 0.52 14 Ollukkara 1.36 3.61 70.26 42.93 1.03 15 Puzhakal 0.36 2.94 87.91 53.94 2.6 16 Mathilakam 0.76 6.54 53.23 19.84 2.57 Blocks Total 43.92 89.01 1424.95 1193.49 41.53 Municipalities Total 1.45 4.6 135.13 86.11 5.12 Corporation Total 0.97 0.03 24.06 15.37 2.06 District Total 46.34 93.64 1584.14 1294.97 48.71 PALAKKAD
1 Alathur 19.16 26.16 250.86 768.02 2.72 2 Attappady 23.15 851.18 492.86 283.9 3.91 3 Chittur 82.32 680.25 83.53 316.77 3.31 4 Kollengode 8.94 107.56 127.08 226.75 1.15 5 Kuzhalmannam 0.61 7.76 109.39 340.89 0.87 6 Malampuzha 0.51 58.42 77.46 324.18 2.21 7 Mannarkkad 44.53 29.04 219.97 460.38 2 8 Nemmara 8.18 5.55 130.47 406.45 2.28 9 Ottapalam 7.95 6.03 508.41 864.51 0.73
10 Palakkad 0.33 2.45 90.41 273.45 2.71 11 Pattambi 0.36 3.93 1617.7 358.67 0.62 12 Sreekrishnapuram 1.12 27.94 174.83 646.47 5.13 13 Thrithala 0.27 9.31 502.08 276.38 0.52 Blocks Total 197.43 1815.58 4385.05 5546.82 28.16 Municipalities Total 0.31 5.01 67.31 127.78 3 District Total 197.74 1820.59 4452.36 5674.6 31.16
(Table – 3.1 Contd….)
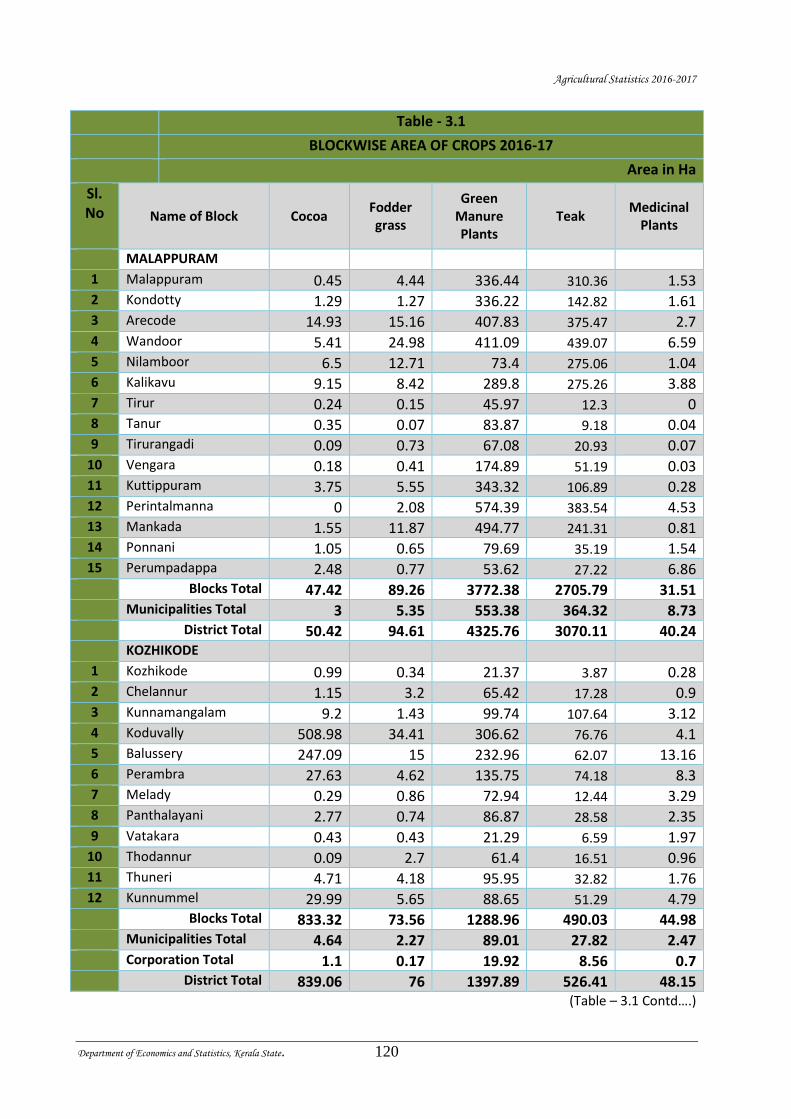
Agricultural Statistics 2016-2017
Department of Economics and Statistics, Kerala State. 120
Table - 3.1
BLOCKWISE AREA OF CROPS 2016-17
Area in Ha
Sl. No Name of Block Cocoa
Fodder grass
Green Manure Plants
Teak Medicinal
Plants
MALAPPURAM
1 Malappuram 0.45 4.44 336.44 310.36 1.53 2 Kondotty 1.29 1.27 336.22 142.82 1.61 3 Arecode 14.93 15.16 407.83 375.47 2.7 4 Wandoor 5.41 24.98 411.09 439.07 6.59 5 Nilamboor 6.5 12.71 73.4 275.06 1.04 6 Kalikavu 9.15 8.42 289.8 275.26 3.88 7 Tirur 0.24 0.15 45.97 12.3 0 8 Tanur 0.35 0.07 83.87 9.18 0.04 9 Tirurangadi 0.09 0.73 67.08 20.93 0.07
10 Vengara 0.18 0.41 174.89 51.19 0.03 11 Kuttippuram 3.75 5.55 343.32 106.89 0.28 12 Perintalmanna 0 2.08 574.39 383.54 4.53 13 Mankada 1.55 11.87 494.77 241.31 0.81 14 Ponnani 1.05 0.65 79.69 35.19 1.54 15 Perumpadappa 2.48 0.77 53.62 27.22 6.86 Blocks Total 47.42 89.26 3772.38 2705.79 31.51 Municipalities Total 3 5.35 553.38 364.32 8.73 District Total 50.42 94.61 4325.76 3070.11 40.24 KOZHIKODE
1 Kozhikode 0.99 0.34 21.37 3.87 0.28 2 Chelannur 1.15 3.2 65.42 17.28 0.9 3 Kunnamangalam 9.2 1.43 99.74 107.64 3.12 4 Koduvally 508.98 34.41 306.62 76.76 4.1 5 Balussery 247.09 15 232.96 62.07 13.16 6 Perambra 27.63 4.62 135.75 74.18 8.3 7 Melady 0.29 0.86 72.94 12.44 3.29 8 Panthalayani 2.77 0.74 86.87 28.58 2.35 9 Vatakara 0.43 0.43 21.29 6.59 1.97
10 Thodannur 0.09 2.7 61.4 16.51 0.96 11 Thuneri 4.71 4.18 95.95 32.82 1.76 12 Kunnummel 29.99 5.65 88.65 51.29 4.79 Blocks Total 833.32 73.56 1288.96 490.03 44.98 Municipalities Total 4.64 2.27 89.01 27.82 2.47 Corporation Total 1.1 0.17 19.92 8.56 0.7 District Total 839.06 76 1397.89 526.41 48.15
(Table – 3.1 Contd….)
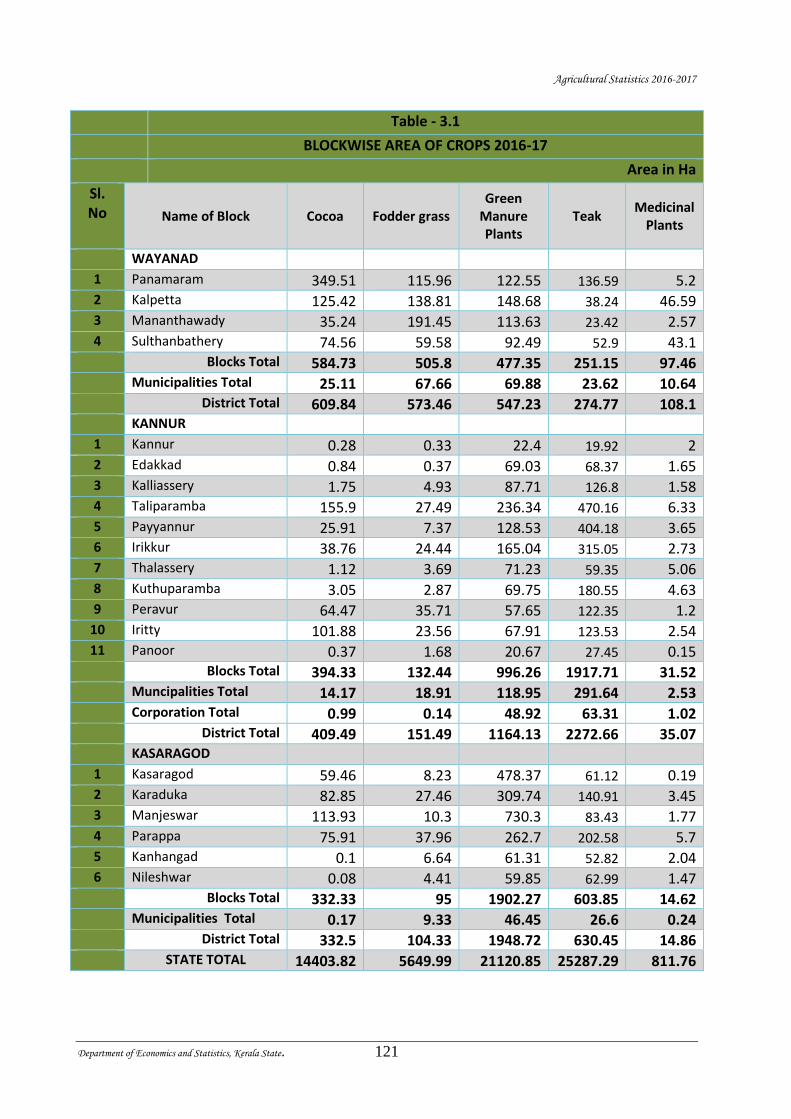
Agricultural Statistics 2016-2017
Department of Economics and Statistics, Kerala State. 121
Table - 3.1
BLOCKWISE AREA OF CROPS 2016-17
Area in Ha
Sl. No Name of Block Cocoa Fodder grass
Green Manure Plants
Teak Medicinal
Plants
WAYANAD
1 Panamaram 349.51 115.96 122.55 136.59 5.2 2 Kalpetta 125.42 138.81 148.68 38.24 46.59 3 Mananthawady 35.24 191.45 113.63 23.42 2.57 4 Sulthanbathery 74.56 59.58 92.49 52.9 43.1 Blocks Total 584.73 505.8 477.35 251.15 97.46 Municipalities Total 25.11 67.66 69.88 23.62 10.64 District Total 609.84 573.46 547.23 274.77 108.1 KANNUR
1 Kannur 0.28 0.33 22.4 19.92 2 2 Edakkad 0.84 0.37 69.03 68.37 1.65 3 Kalliassery 1.75 4.93 87.71 126.8 1.58 4 Taliparamba 155.9 27.49 236.34 470.16 6.33 5 Payyannur 25.91 7.37 128.53 404.18 3.65 6 Irikkur 38.76 24.44 165.04 315.05 2.73 7 Thalassery 1.12 3.69 71.23 59.35 5.06 8 Kuthuparamba 3.05 2.87 69.75 180.55 4.63 9 Peravur 64.47 35.71 57.65 122.35 1.2
10 Iritty 101.88 23.56 67.91 123.53 2.54 11 Panoor 0.37 1.68 20.67 27.45 0.15 Blocks Total 394.33 132.44 996.26 1917.71 31.52 Muncipalities Total 14.17 18.91 118.95 291.64 2.53 Corporation Total 0.99 0.14 48.92 63.31 1.02 District Total 409.49 151.49 1164.13 2272.66 35.07 KASARAGOD
1 Kasaragod 59.46 8.23 478.37 61.12 0.19 2 Karaduka 82.85 27.46 309.74 140.91 3.45 3 Manjeswar 113.93 10.3 730.3 83.43 1.77 4 Parappa 75.91 37.96 262.7 202.58 5.7 5 Kanhangad 0.1 6.64 61.31 52.82 2.04 6 Nileshwar 0.08 4.41 59.85 62.99 1.47 Blocks Total 332.33 95 1902.27 603.85 14.62 Municipalities Total 0.17 9.33 46.45 26.6 0.24 District Total 332.5 104.33 1948.72 630.45 14.86
STATE TOTAL 14403.82 5649.99 21120.85 25287.29 811.76
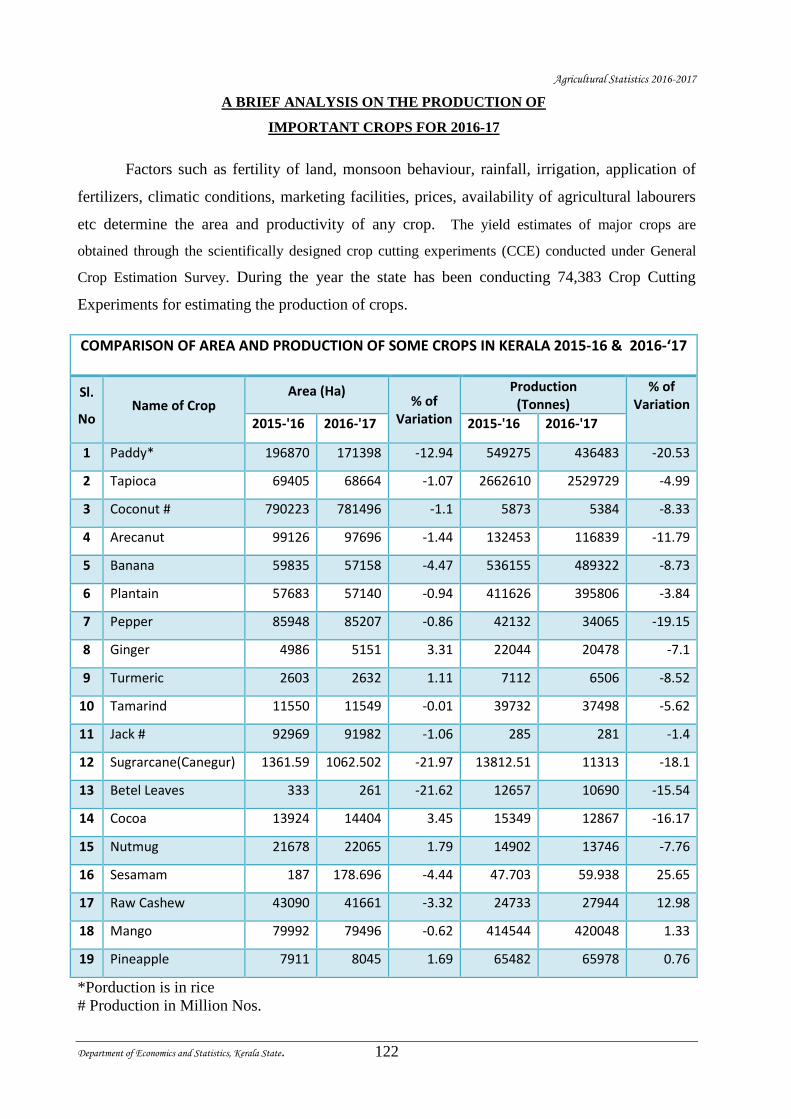
Agricultural Statistics 2016-2017
Department of Economics and Statistics, Kerala State. 122
A BRIEF ANALYSIS ON THE PRODUCTION OF
IMPORTANT CROPS FOR 2016-17
Factors such as fertility of land, monsoon behaviour, rainfall, irrigation, application of
fertilizers, climatic conditions, marketing facilities, prices, availability of agricultural labourers
etc determine the area and productivity of any crop. The yield estimates of major crops are
obtained through the scientifically designed crop cutting experiments (CCE) conducted under General
Crop Estimation Survey. During the year the state has been conducting 74,383 Crop Cutting
Experiments for estimating the production of crops.
COMPARISON OF AREA AND PRODUCTION OF SOME CROPS IN KERALA 2015-16 & 2016-‘17
Sl.
No Name of Crop
Area (Ha) % of
Variation
Production (Tonnes)
% of Variation
2015-'16 2016-'17 2015-'16 2016-'17
1 Paddy* 196870 171398 -12.94 549275 436483 -20.53
2 Tapioca 69405 68664 -1.07 2662610 2529729 -4.99
3 Coconut # 790223 781496 -1.1 5873 5384 -8.33
4 Arecanut 99126 97696 -1.44 132453 116839 -11.79
5 Banana 59835 57158 -4.47 536155 489322 -8.73
6 Plantain 57683 57140 -0.94 411626 395806 -3.84
7 Pepper 85948 85207 -0.86 42132 34065 -19.15
8 Ginger 4986 5151 3.31 22044 20478 -7.1
9 Turmeric 2603 2632 1.11 7112 6506 -8.52
10 Tamarind 11550 11549 -0.01 39732 37498 -5.62
11 Jack # 92969 91982 -1.06 285 281 -1.4
12 Sugrarcane(Canegur) 1361.59 1062.502 -21.97 13812.51 11313 -18.1
13 Betel Leaves 333 261 -21.62 12657 10690 -15.54
14 Cocoa 13924 14404 3.45 15349 12867 -16.17
15 Nutmug 21678 22065 1.79 14902 13746 -7.76
16 Sesamam 187 178.696 -4.44 47.703 59.938 25.65
17 Raw Cashew 43090 41661 -3.32 24733 27944 12.98
18 Mango 79992 79496 -0.62 414544 420048 1.33
19 Pineapple 7911 8045 1.69 65482 65978 0.76
*Porduction is in rice
# Production in Million Nos.
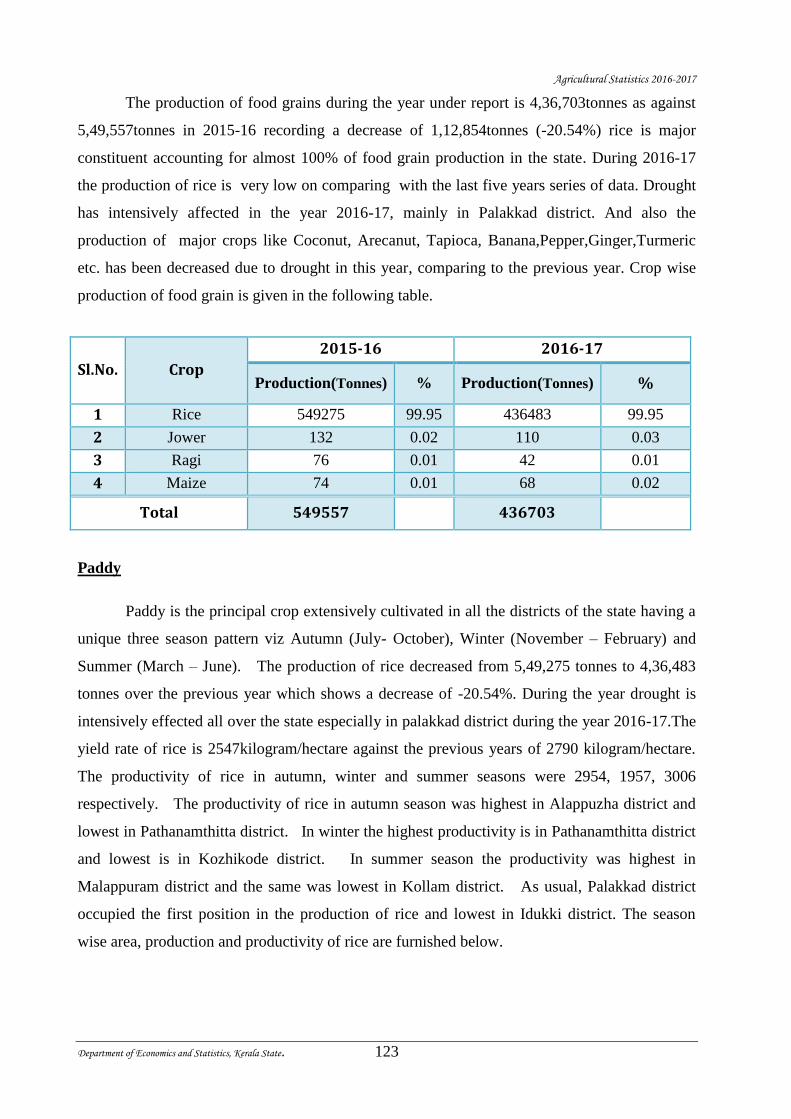
Agricultural Statistics 2016-2017
Department of Economics and Statistics, Kerala State. 123
The production of food grains during the year under report is 4,36,703tonnes as against
5,49,557tonnes in 2015-16 recording a decrease of 1,12,854tonnes (-20.54%) rice is major
constituent accounting for almost 100% of food grain production in the state. During 2016-17
the production of rice is very low on comparing with the last five years series of data. Drought
has intensively affected in the year 2016-17, mainly in Palakkad district. And also the
production of major crops like Coconut, Arecanut, Tapioca, Banana,Pepper,Ginger,Turmeric
etc. has been decreased due to drought in this year, comparing to the previous year. Crop wise
production of food grain is given in the following table.
Sl.No. Crop
2015-16 2016-17
Production(Tonnes) % Production(Tonnes) %
1 Rice 549275 99.95 436483 99.95
2 Jower 132 0.02 110 0.03
3 Ragi 76 0.01 42 0.01
4 Maize 74 0.01 68 0.02
Total 549557 436703
Paddy
Paddy is the principal crop extensively cultivated in all the districts of the state having a
unique three season pattern viz Autumn (July- October), Winter (November – February) and
Summer (March – June). The production of rice decreased from 5,49,275 tonnes to 4,36,483
tonnes over the previous year which shows a decrease of -20.54%. During the year drought is
intensively effected all over the state especially in palakkad district during the year 2016-17.The
yield rate of rice is 2547kilogram/hectare against the previous years of 2790 kilogram/hectare.
The productivity of rice in autumn, winter and summer seasons were 2954, 1957, 3006
respectively. The productivity of rice in autumn season was highest in Alappuzha district and
lowest in Pathanamthitta district. In winter the highest productivity is in Pathanamthitta district
and lowest is in Kozhikode district. In summer season the productivity was highest in
Malappuram district and the same was lowest in Kollam district. As usual, Palakkad district
occupied the first position in the production of rice and lowest in Idukki district. The season
wise area, production and productivity of rice are furnished below.
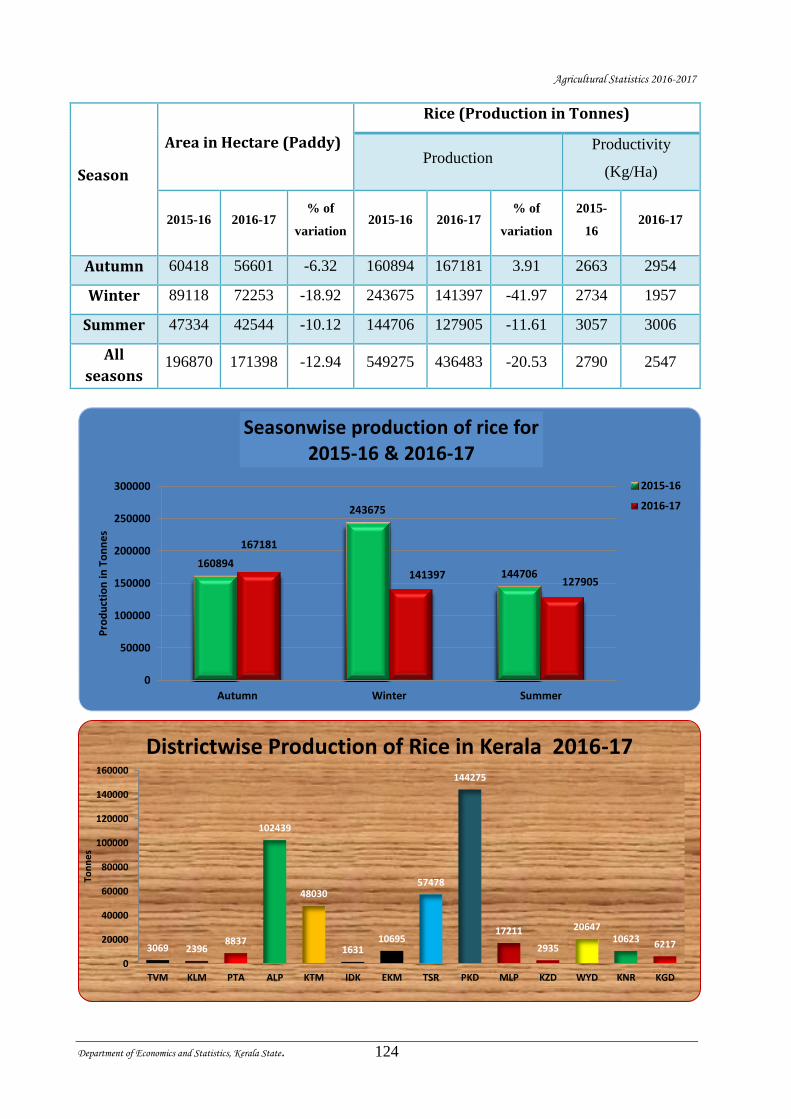
Agricultural Statistics 2016-2017
Department of Economics and Statistics, Kerala State. 124
Season
Area in Hectare (Paddy)
Rice (Production in Tonnes)
Production Productivity
(Kg/Ha)
2015-16 2016-17 % of
variation 2015-16 2016-17
% of
variation
2015-
16 2016-17
Autumn 60418 56601 -6.32 160894 167181 3.91 2663 2954
Winter 89118 72253 -18.92 243675 141397 -41.97 2734 1957
Summer 47334 42544 -10.12 144706 127905 -11.61 3057 3006
All
seasons 196870 171398 -12.94 549275 436483 -20.53 2790 2547
160894
243675
144706
167181
141397127905
0
50000
100000
150000
200000
250000
300000
Autumn Winter Summer
Pro
du
ctio
n in
To
nn
es
Seasonwise production of rice for 2015-16 & 2016-17
2015-16
2016-17
3069 23968837
102439
48030
163110695
57478
144275
17211
2935
2064710623 6217
0
20000
40000
60000
80000
100000
120000
140000
160000
TVM KLM PTA ALP KTM IDK EKM TSR PKD MLP KZD WYD KNR KGD
Ton
ne
s
Districtwise Production of Rice in Kerala 2016-17
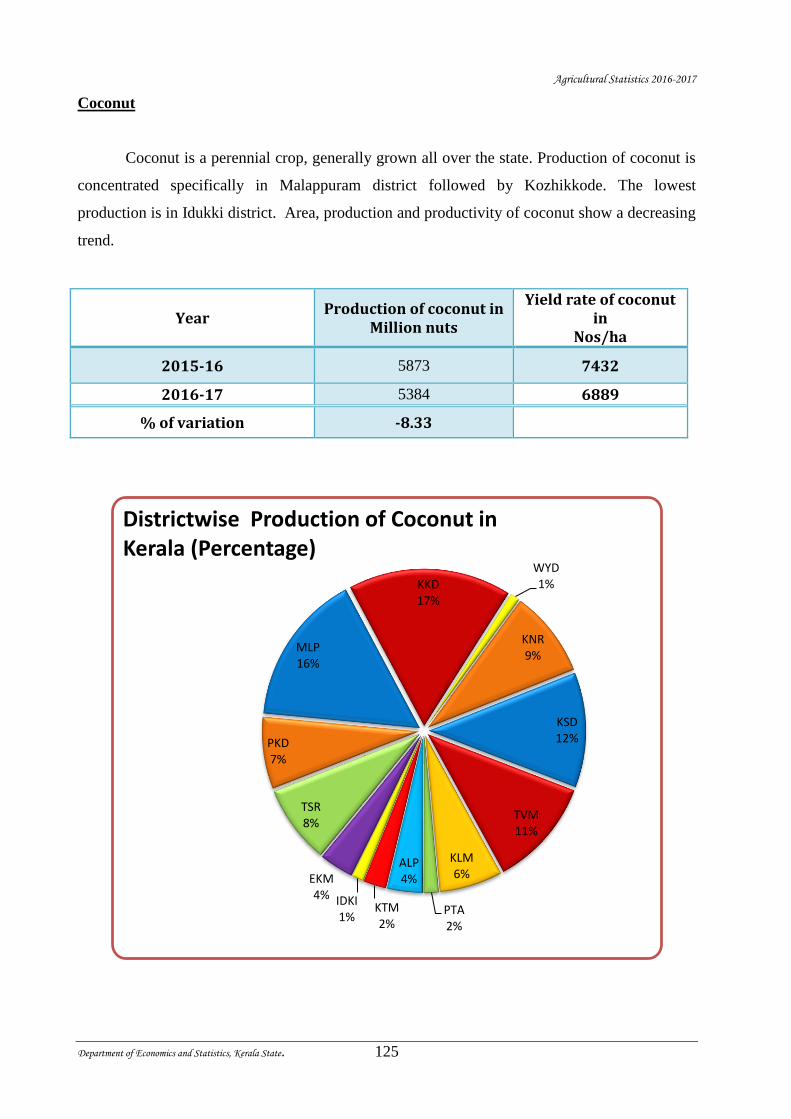
Agricultural Statistics 2016-2017
Department of Economics and Statistics, Kerala State. 125
Coconut
Coconut is a perennial crop, generally grown all over the state. Production of coconut is
concentrated specifically in Malappuram district followed by Kozhikkode. The lowest
production is in Idukki district. Area, production and productivity of coconut show a decreasing
trend.
Year Production of coconut in
Million nuts
Yield rate of coconut in
Nos/ha
2015-16 5873 7432
2016-17 5384 6889
% of variation -8.33
TVM11%
KLM6%
PTA2%
ALP4%
KTM2%
IDKI1%
EKM4%
TSR8%
PKD7%
MLP16%
KKD17%
WYD1%
KNR9%
KSD12%
Districtwise Production of Coconut in Kerala (Percentage)
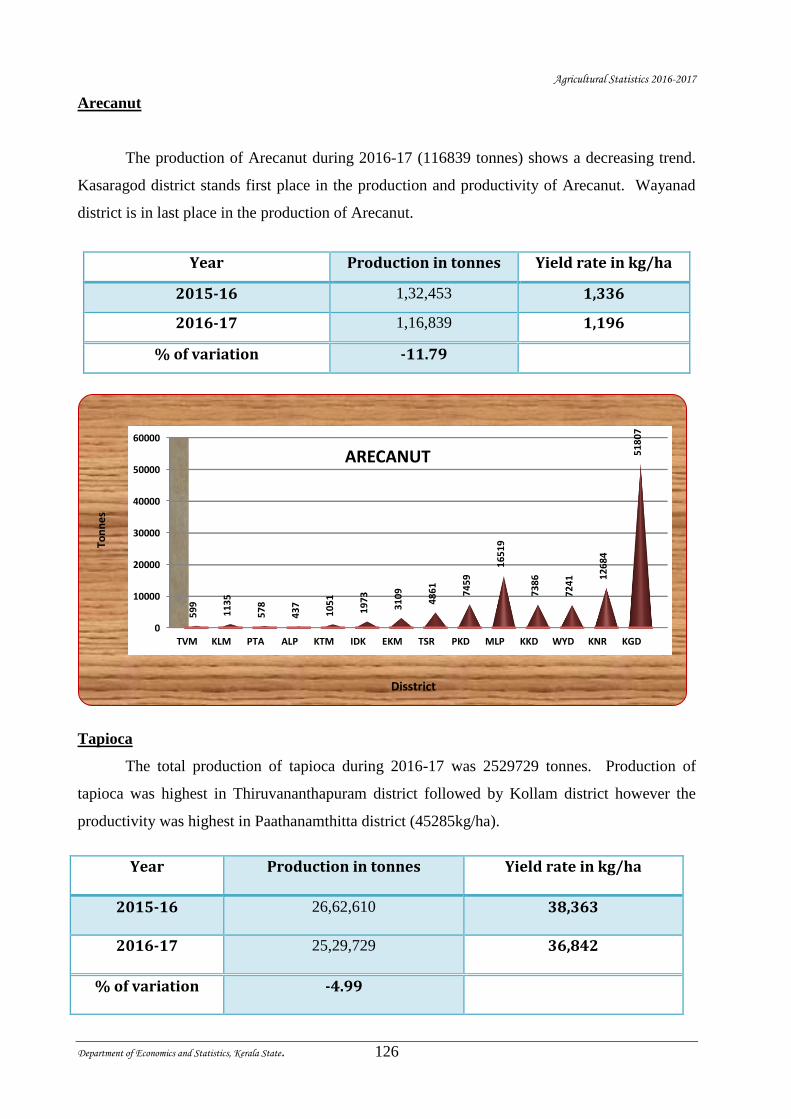
Agricultural Statistics 2016-2017
Department of Economics and Statistics, Kerala State. 126
Arecanut
The production of Arecanut during 2016-17 (116839 tonnes) shows a decreasing trend.
Kasaragod district stands first place in the production and productivity of Arecanut. Wayanad
district is in last place in the production of Arecanut.
Year Production in tonnes Yield rate in kg/ha
2015-16 1,32,453 1,336
2016-17 1,16,839 1,196
% of variation -11.79
Tapioca
The total production of tapioca during 2016-17 was 2529729 tonnes. Production of
tapioca was highest in Thiruvananthapuram district followed by Kollam district however the
productivity was highest in Paathanamthitta district (45285kg/ha).
Year Production in tonnes Yield rate in kg/ha
2015-16 26,62,610 38,363
2016-17 25,29,729 36,842
% of variation -4.99
0
10000
20000
30000
40000
50000
60000
TVM KLM PTA ALP KTM IDK EKM TSR PKD MLP KKD WYD KNR KGD
59
9
11
35
57
8
43
7
10
51
19
73
31
09
48
61
74
59
16
51
9
73
86
72
41 1
26
84
51
80
7
Ton
ne
s
Disstrict
ARECANUT
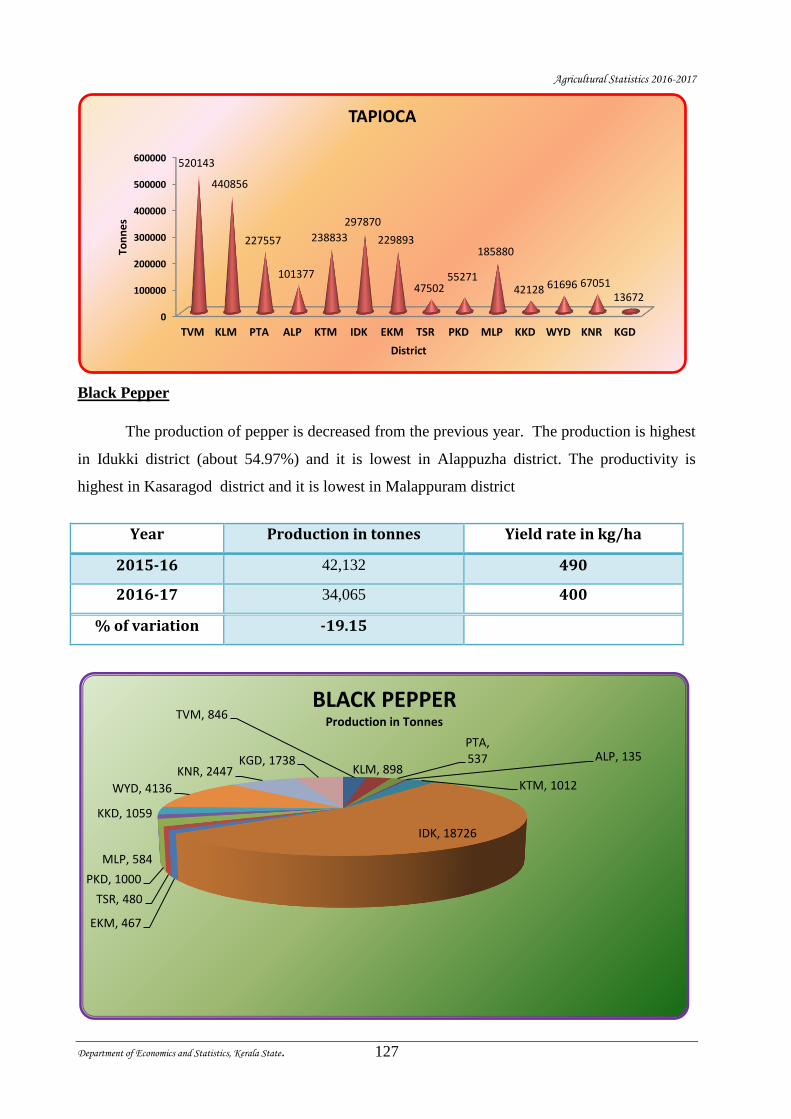
Agricultural Statistics 2016-2017
Department of Economics and Statistics, Kerala State. 127
Black Pepper
The production of pepper is decreased from the previous year. The production is highest
in Idukki district (about 54.97%) and it is lowest in Alappuzha district. The productivity is
highest in Kasaragod district and it is lowest in Malappuram district
Year Production in tonnes Yield rate in kg/ha
2015-16 42,132 490
2016-17 34,065 400
% of variation -19.15
0
100000
200000
300000
400000
500000
600000
TVM KLM PTA ALP KTM IDK EKM TSR PKD MLP KKD WYD KNR KGD
520143
440856
227557
101377
238833
297870
229893
4750255271
185880
42128 61696 6705113672
Ton
ne
s
District
TAPIOCA
TVM, 846
KLM, 898
PTA, 537 ALP, 135
KTM, 1012
IDK, 18726
EKM, 467
TSR, 480
PKD, 1000
MLP, 584
KKD, 1059
WYD, 4136
KNR, 2447KGD, 1738
BLACK PEPPERProduction in Tonnes
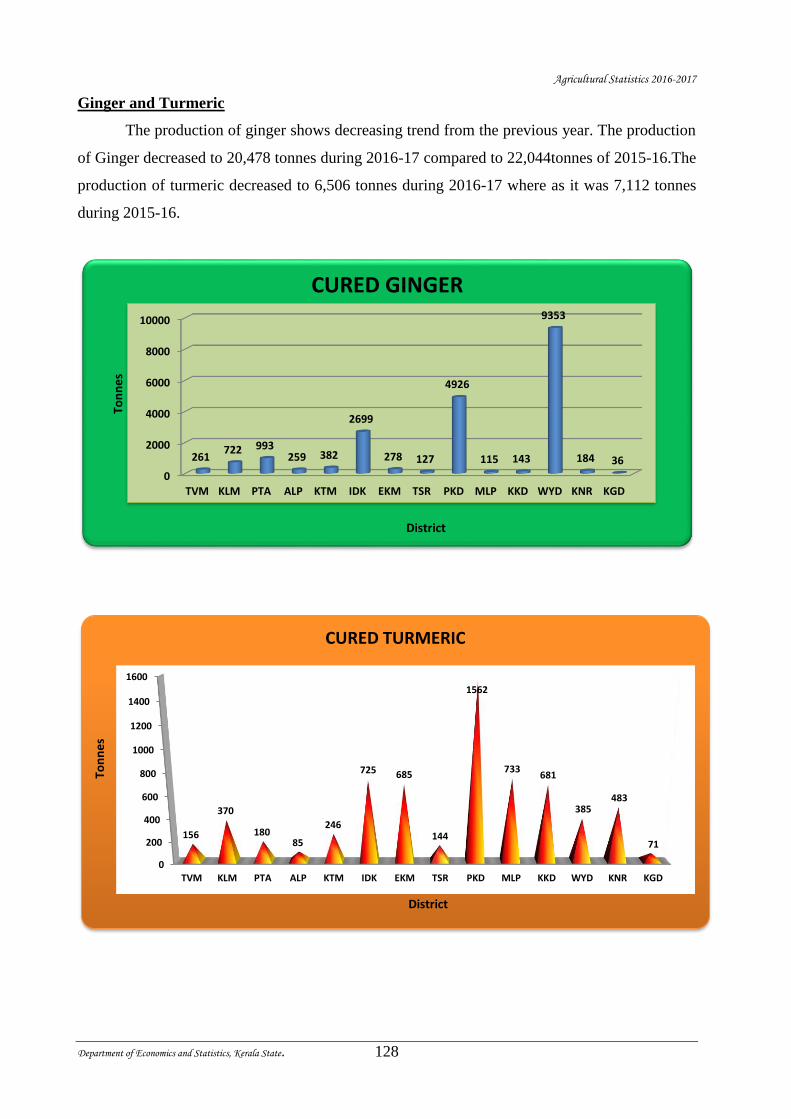
Agricultural Statistics 2016-2017
Department of Economics and Statistics, Kerala State. 128
Ginger and Turmeric
The production of ginger shows decreasing trend from the previous year. The production
of Ginger decreased to 20,478 tonnes during 2016-17 compared to 22,044tonnes of 2015-16.The
production of turmeric decreased to 6,506 tonnes during 2016-17 where as it was 7,112 tonnes
during 2015-16.
0
2000
4000
6000
8000
10000
TVM KLM PTA ALP KTM IDK EKM TSR PKD MLP KKD WYD KNR KGD
261722 993
259 382
2699
278 127
4926
115 143
9353
184 36
Ton
ne
s
District
CURED GINGER
0
200
400
600
800
1000
1200
1400
1600
TVM KLM PTA ALP KTM IDK EKM TSR PKD MLP KKD WYD KNR KGD
156
370
18085
246
725 685
144
1562
733681
385483
71
Ton
ne
s
District
CURED TURMERIC
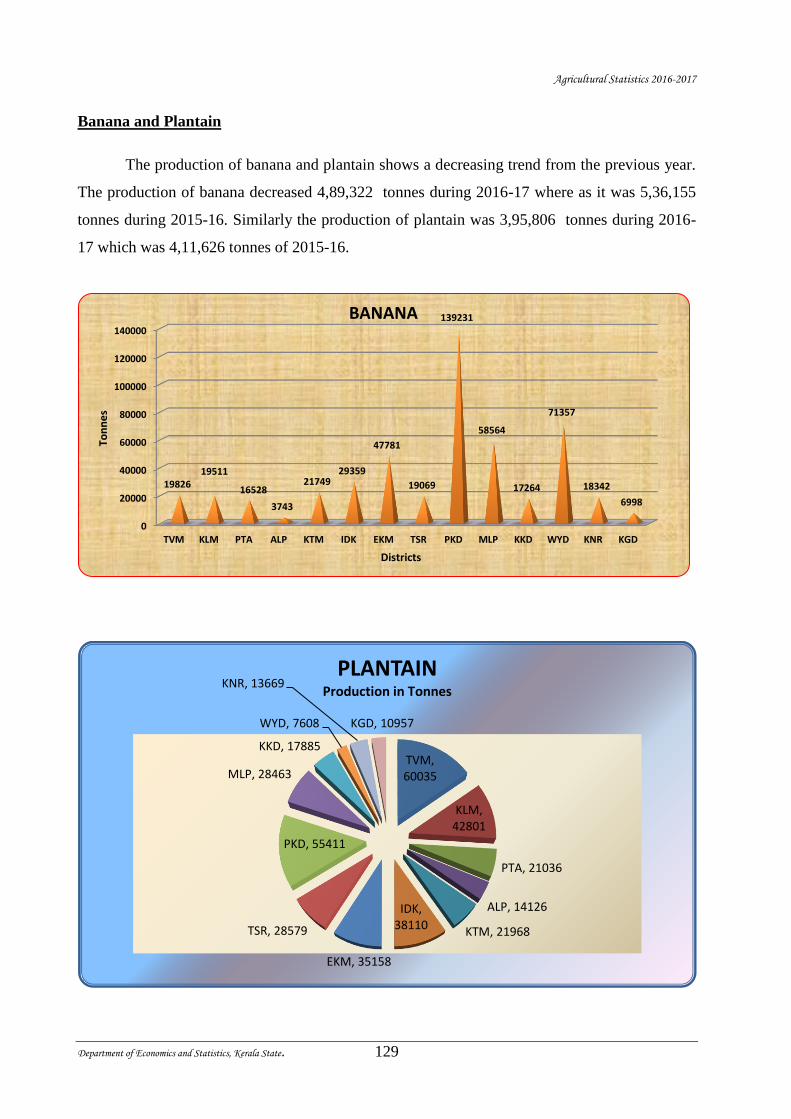
Agricultural Statistics 2016-2017
Department of Economics and Statistics, Kerala State. 129
Banana and Plantain
The production of banana and plantain shows a decreasing trend from the previous year.
The production of banana decreased 4,89,322 tonnes during 2016-17 where as it was 5,36,155
tonnes during 2015-16. Similarly the production of plantain was 3,95,806 tonnes during 2016-
17 which was 4,11,626 tonnes of 2015-16.
0
20000
40000
60000
80000
100000
120000
140000
TVM KLM PTA ALP KTM IDK EKM TSR PKD MLP KKD WYD KNR KGD
1982619511
16528
3743
2174929359
47781
19069
139231
58564
17264
71357
18342
6998
Ton
ne
s
Districts
BANANA
TVM, 60035
KLM, 42801
PTA, 21036
ALP, 14126
KTM, 21968
IDK, 38110
EKM, 35158
TSR, 28579
PKD, 55411
MLP, 28463
KKD, 17885
WYD, 7608
KNR, 13669
KGD, 10957
PLANTAINProduction in Tonnes
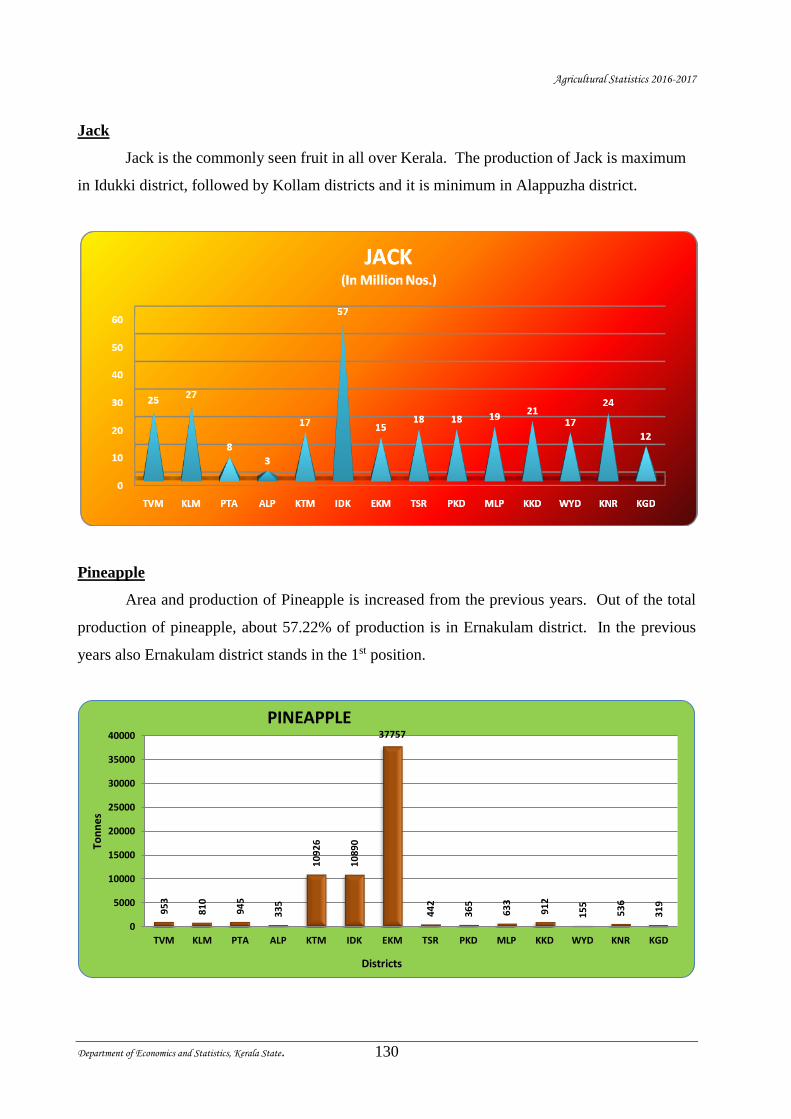
Agricultural Statistics 2016-2017
Department of Economics and Statistics, Kerala State. 130
Jack
Jack is the commonly seen fruit in all over Kerala. The production of Jack is maximum
in Idukki district, followed by Kollam districts and it is minimum in Alappuzha district.
Pineapple
Area and production of Pineapple is increased from the previous years. Out of the total
production of pineapple, about 57.22% of production is in Ernakulam district. In the previous
years also Ernakulam district stands in the 1st position.
95
3
81
0
94
5
33
5
10
92
6
10
89
0
37757
44
2
36
5
63
3
91
2
15
5
53
6
31
9
0
5000
10000
15000
20000
25000
30000
35000
40000
TVM KLM PTA ALP KTM IDK EKM TSR PKD MLP KKD WYD KNR KGD
Ton
ne
s
Districts
PINEAPPLE
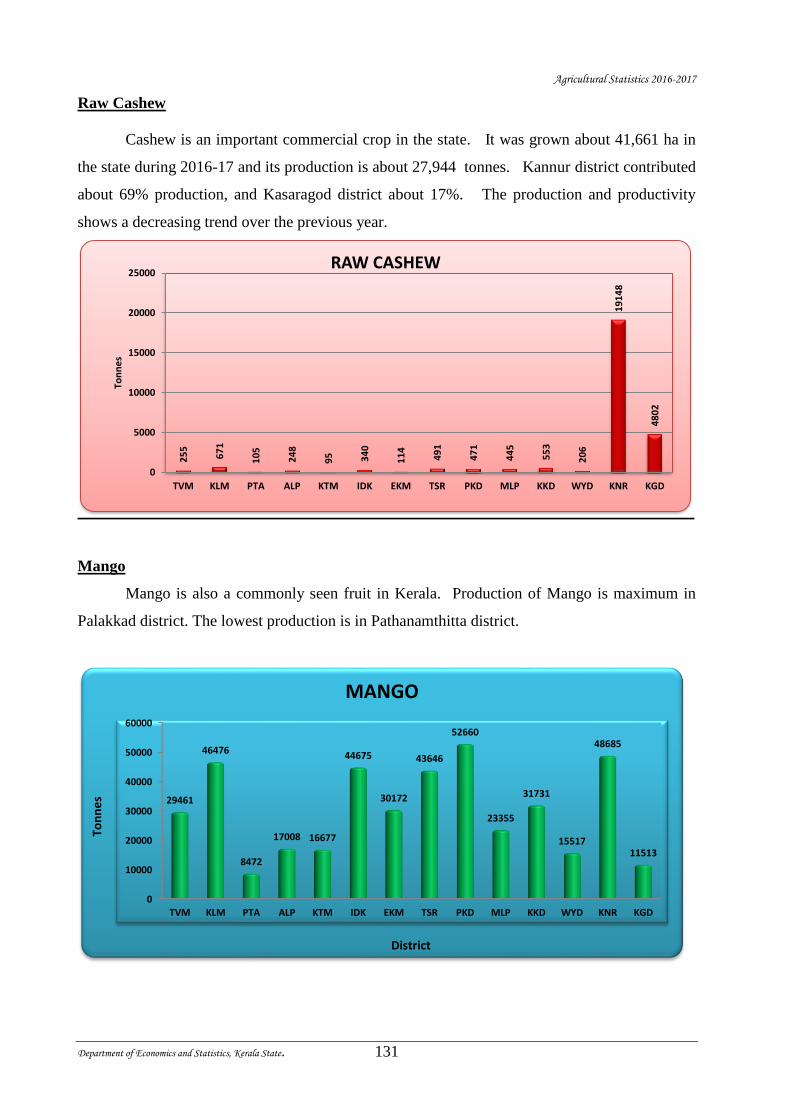
Agricultural Statistics 2016-2017
Department of Economics and Statistics, Kerala State. 131
Raw Cashew
Cashew is an important commercial crop in the state. It was grown about 41,661 ha in
the state during 2016-17 and its production is about 27,944 tonnes. Kannur district contributed
about 69% production, and Kasaragod district about 17%. The production and productivity
shows a decreasing trend over the previous year.
Mango
Mango is also a commonly seen fruit in Kerala. Production of Mango is maximum in
Palakkad district. The lowest production is in Pathanamthitta district.
25
5
67
1
10
5
24
8
95 34
0
11
4
49
1
47
1
44
5
55
3
20
6
19
14
8
48
02
0
5000
10000
15000
20000
25000
TVM KLM PTA ALP KTM IDK EKM TSR PKD MLP KKD WYD KNR KGD
Ton
ne
s
RAW CASHEW
0
10000
20000
30000
40000
50000
60000
TVM KLM PTA ALP KTM IDK EKM TSR PKD MLP KKD WYD KNR KGD
29461
46476
8472
17008 16677
44675
30172
43646
52660
23355
31731
15517
48685
11513
Ton
ne
s
District
MANGO
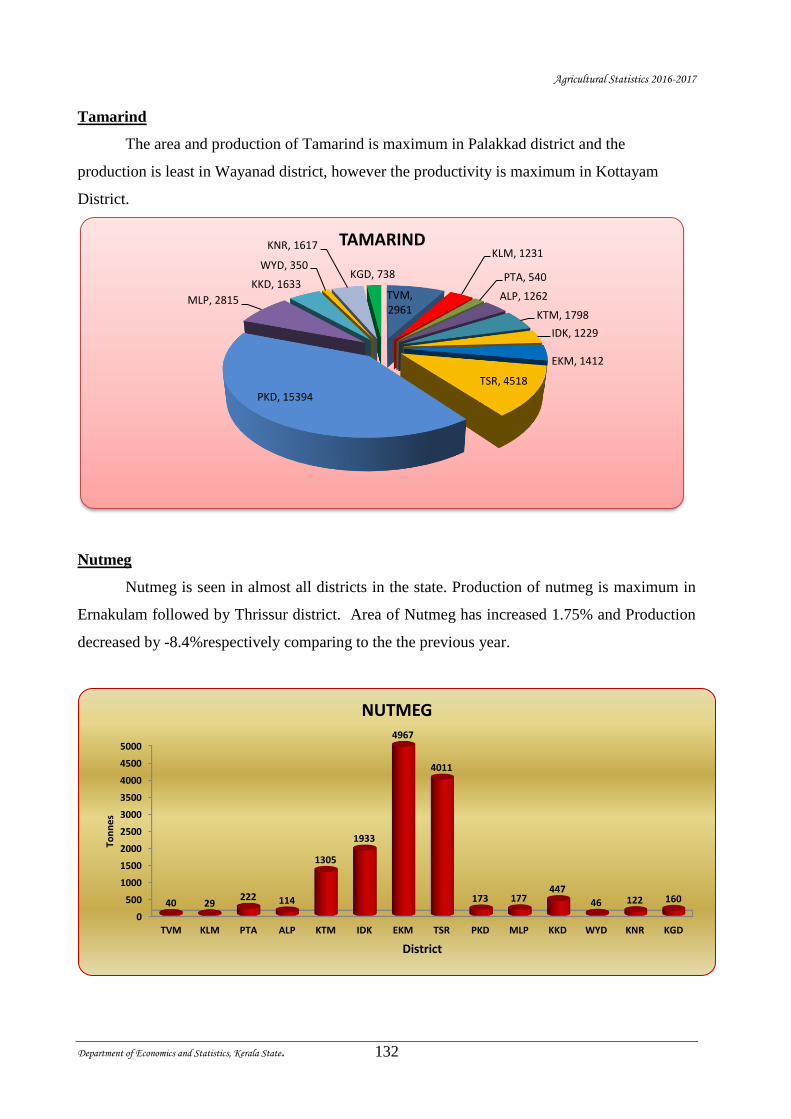
Agricultural Statistics 2016-2017
Department of Economics and Statistics, Kerala State. 132
Tamarind
The area and production of Tamarind is maximum in Palakkad district and the
production is least in Wayanad district, however the productivity is maximum in Kottayam
District.
Nutmeg
Nutmeg is seen in almost all districts in the state. Production of nutmeg is maximum in
Ernakulam followed by Thrissur district. Area of Nutmeg has increased 1.75% and Production
decreased by -8.4%respectively comparing to the the previous year.
TVM, 2961
KLM, 1231
PTA, 540
ALP, 1262
KTM, 1798
IDK, 1229
EKM, 1412
TSR, 4518
PKD, 15394
MLP, 2815
KKD, 1633
WYD, 350
KNR, 1617
KGD, 738
TAMARIND
0
500
1000
1500
2000
2500
3000
3500
4000
4500
5000
TVM KLM PTA ALP KTM IDK EKM TSR PKD MLP KKD WYD KNR KGD
40 29222 114
1305
1933
4967
4011
173 177447
46 122 160
Ton
ne
s
District
NUTMEG
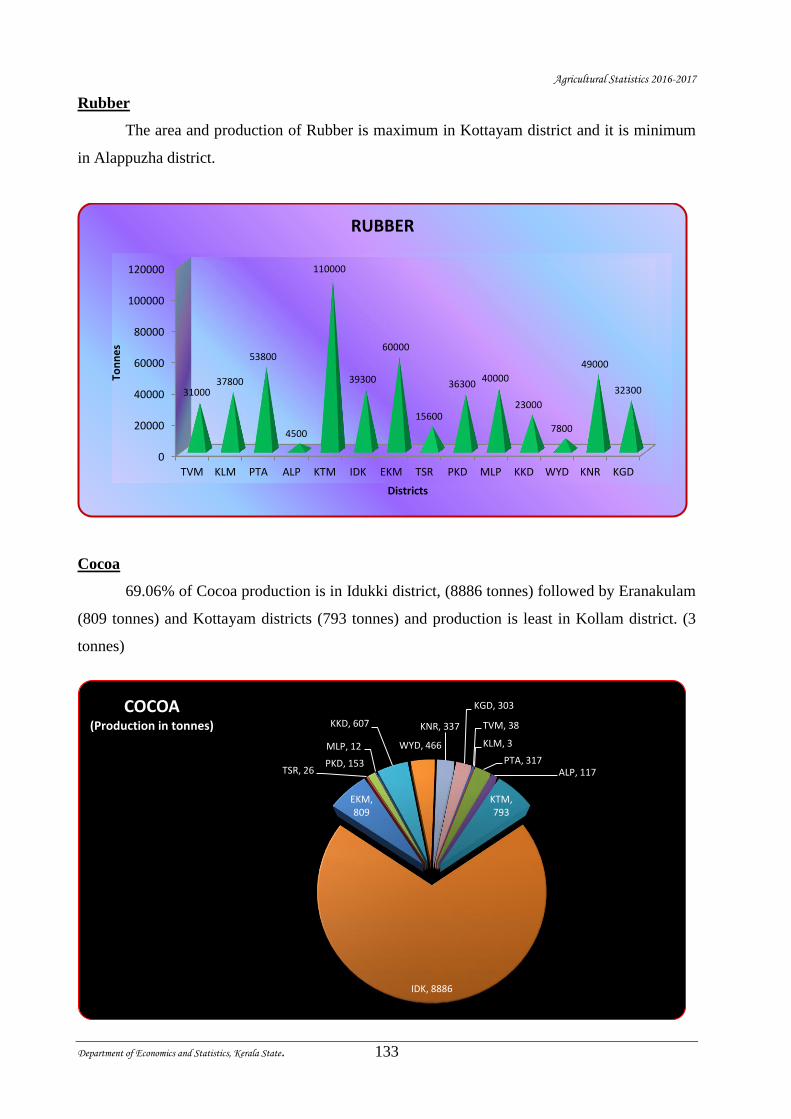
Agricultural Statistics 2016-2017
Department of Economics and Statistics, Kerala State. 133
Rubber
The area and production of Rubber is maximum in Kottayam district and it is minimum
in Alappuzha district.
Cocoa
69.06% of Cocoa production is in Idukki district, (8886 tonnes) followed by Eranakulam
(809 tonnes) and Kottayam districts (793 tonnes) and production is least in Kollam district. (3
tonnes)
0
20000
40000
60000
80000
100000
120000
TVM KLM PTA ALP KTM IDK EKM TSR PKD MLP KKD WYD KNR KGD
3100037800
53800
4500
110000
39300
60000
15600
3630040000
23000
7800
49000
32300
Ton
ne
s
Districts
RUBBER
TVM, 38
KLM, 3
PTA, 317ALP, 117
KTM, 793
IDK, 8886
EKM, 809
TSR, 26PKD, 153
MLP, 12
KKD, 607
WYD, 466
KNR, 337
KGD, 303COCOA(Production in tonnes)
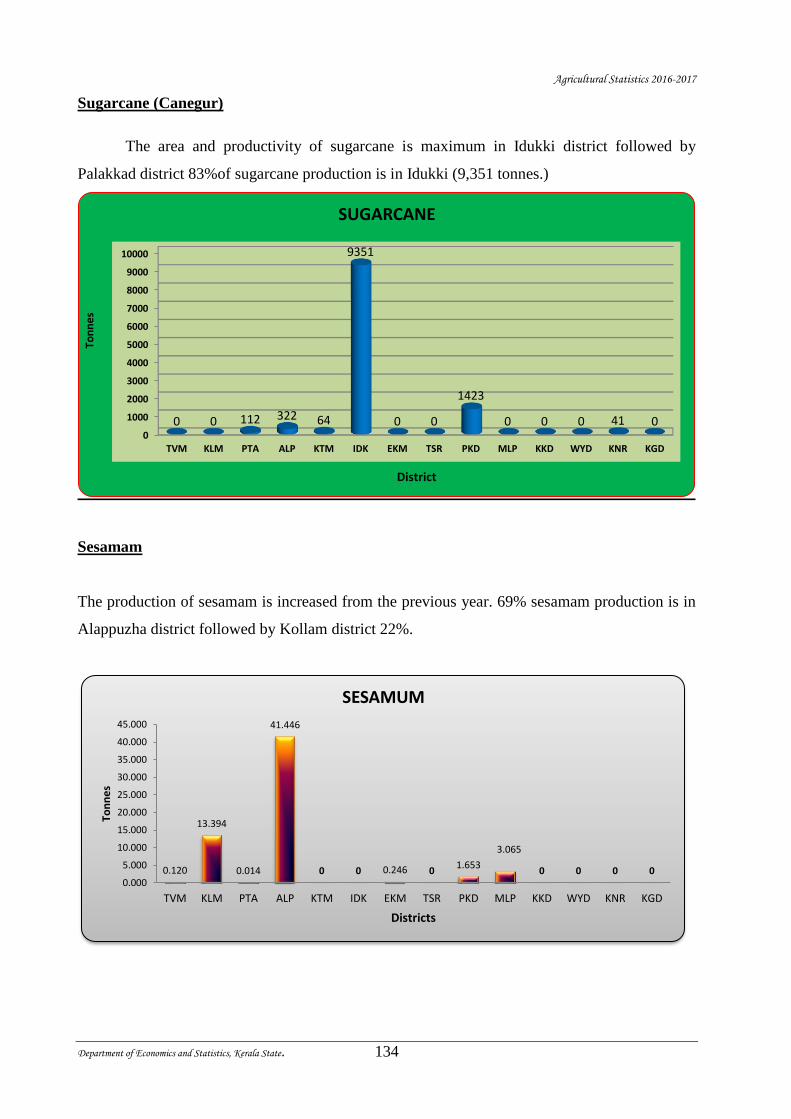
Agricultural Statistics 2016-2017
Department of Economics and Statistics, Kerala State. 134
Sugarcane (Canegur)
The area and productivity of sugarcane is maximum in Idukki district followed by
Palakkad district 83%of sugarcane production is in Idukki (9,351 tonnes.)
Sesamam
The production of sesamam is increased from the previous year. 69% sesamam production is in
Alappuzha district followed by Kollam district 22%.
0
1000
2000
3000
4000
5000
6000
7000
8000
9000
10000
TVM KLM PTA ALP KTM IDK EKM TSR PKD MLP KKD WYD KNR KGD
0 0 112 322 64
9351
0 0
1423
0 0 0 41 0
Ton
ne
s
District
SUGARCANE
0.120
13.394
0.014
41.446
0 0 0.246 01.653
3.065
0 0 0 00.000
5.000
10.000
15.000
20.000
25.000
30.000
35.000
40.000
45.000
TVM KLM PTA ALP KTM IDK EKM TSR PKD MLP KKD WYD KNR KGD
Ton
ne
s
Districts
SESAMUM
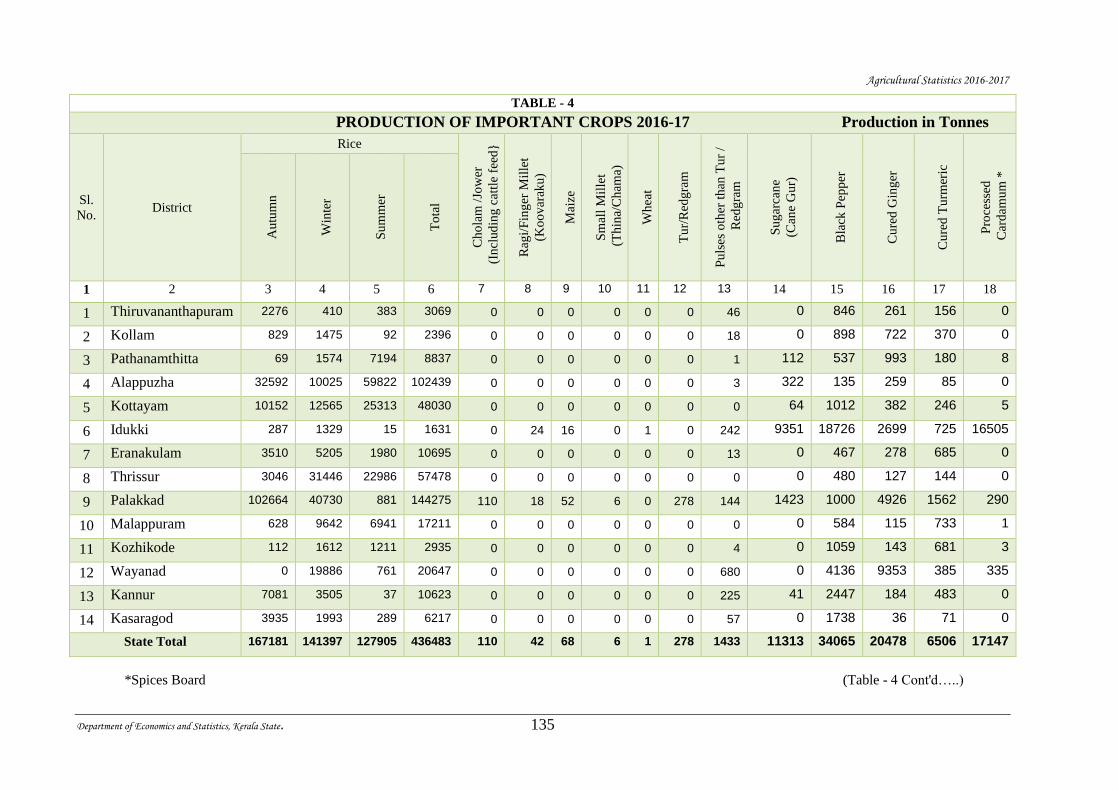
Agricultural Statistics 2016-2017
Department of Economics and Statistics, Kerala State. 135
TABLE - 4
PRODUCTION OF IMPORTANT CROPS 2016-17 Production in Tonnes
Sl.
No. District
Rice
Ch
ola
m /
Jow
er
(I
ncl
ud
ing
cat
tle
feed
}
Rag
i/F
ing
er M
ille
t
(Ko
ov
arak
u)
Mai
ze
Sm
all
Mil
let
(T
hin
a/C
ham
a)
Wh
eat
Tu
r/R
edg
ram
Pu
lses
oth
er t
han
Tu
r /
Red
gra
m
Su
gar
can
e
(Can
e G
ur)
Bla
ck P
epp
er
Cu
red
Gin
ger
Cu
red
Tu
rmer
ic
Pro
cess
ed
Car
dam
um
*
Au
tum
n
Win
ter
Su
mm
er
To
tal
1 2 3 4 5 6 7 8 9 10 11 12 13 14 15 16 17 18
1 Thiruvananthapuram 2276 410 383 3069 0 0 0 0 0 0 46 0 846 261 156 0
2 Kollam 829 1475 92 2396 0 0 0 0 0 0 18 0 898 722 370 0
3 Pathanamthitta 69 1574 7194 8837 0 0 0 0 0 0 1 112 537 993 180 8
4 Alappuzha 32592 10025 59822 102439 0 0 0 0 0 0 3 322 135 259 85 0
5 Kottayam 10152 12565 25313 48030 0 0 0 0 0 0 0 64 1012 382 246 5
6 Idukki 287 1329 15 1631 0 24 16 0 1 0 242 9351 18726 2699 725 16505
7 Eranakulam 3510 5205 1980 10695 0 0 0 0 0 0 13 0 467 278 685 0
8 Thrissur 3046 31446 22986 57478 0 0 0 0 0 0 0 0 480 127 144 0
9 Palakkad 102664 40730 881 144275 110 18 52 6 0 278 144 1423 1000 4926 1562 290
10 Malappuram 628 9642 6941 17211 0 0 0 0 0 0 0 0 584 115 733 1
11 Kozhikode 112 1612 1211 2935 0 0 0 0 0 0 4 0 1059 143 681 3
12 Wayanad 0 19886 761 20647 0 0 0 0 0 0 680 0 4136 9353 385 335
13 Kannur 7081 3505 37 10623 0 0 0 0 0 0 225 41 2447 184 483 0
14 Kasaragod 3935 1993 289 6217 0 0 0 0 0 0 57 0 1738 36 71 0
State Total 167181 141397 127905 436483 110 42 68 6 1 278 1433 11313 34065 20478 6506 17147
*Spices Board (Table - 4 Cont'd…..)
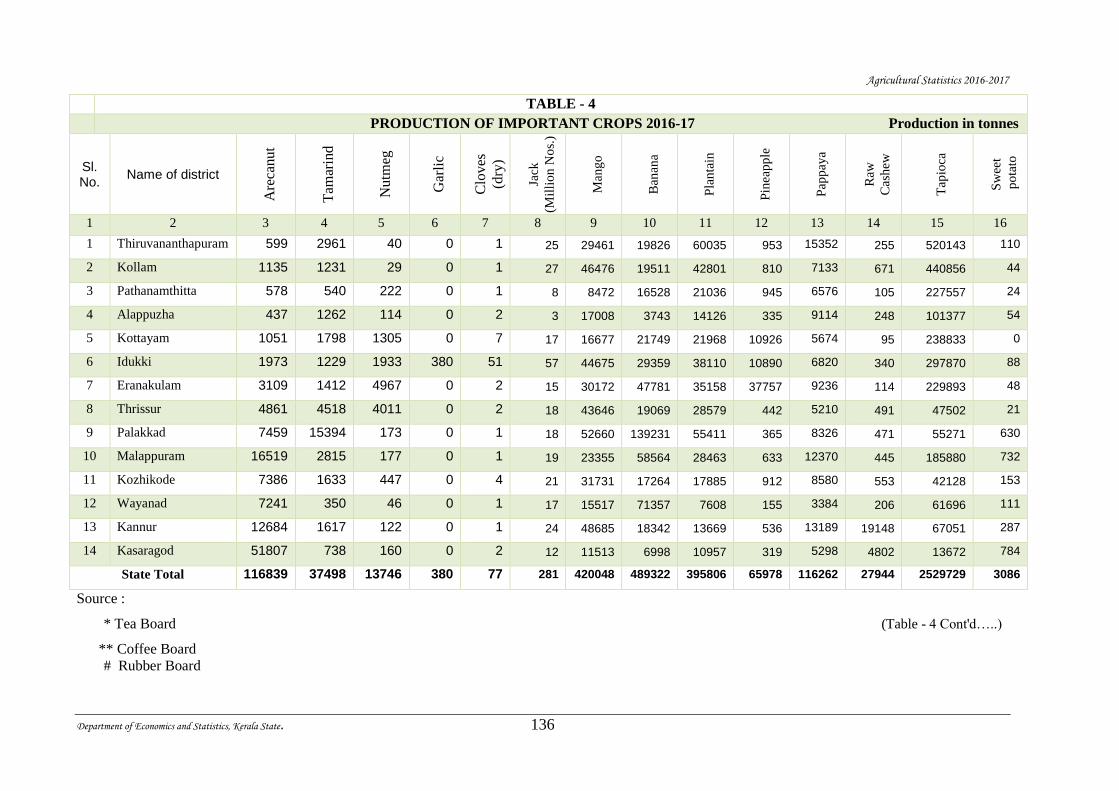
Agricultural Statistics 2016-2017
Department of Economics and Statistics, Kerala State. 136
TABLE - 4
PRODUCTION OF IMPORTANT CROPS 2016-17 Production in tonnes
Sl. No.
Name of district
Are
canut
Tam
arin
d
Nutm
eg
Gar
lic
Clo
ves
(dry
)
Jack
(Mil
lio
n N
os.
)
Man
go
Ban
ana
Pla
nta
in
Pin
eap
ple
Pap
pay
a
Raw
Cas
hew
Tap
ioca
Sw
eet
po
tato
1 2 3 4 5 6 7 8 9 10 11 12 13 14 15 16
1 Thiruvananthapuram 599 2961 40 0 1 25 29461 19826 60035 953 15352 255 520143 110
2 Kollam 1135 1231 29 0 1 27 46476 19511 42801 810 7133 671 440856 44
3 Pathanamthitta 578 540 222 0 1 8 8472 16528 21036 945 6576 105 227557 24
4 Alappuzha 437 1262 114 0 2 3 17008 3743 14126 335 9114 248 101377 54
5 Kottayam 1051 1798 1305 0 7 17 16677 21749 21968 10926 5674 95 238833 0
6 Idukki 1973 1229 1933 380 51 57 44675 29359 38110 10890 6820 340 297870 88
7 Eranakulam 3109 1412 4967 0 2 15 30172 47781 35158 37757 9236 114 229893 48
8 Thrissur 4861 4518 4011 0 2 18 43646 19069 28579 442 5210 491 47502 21
9 Palakkad 7459 15394 173 0 1 18 52660 139231 55411 365 8326 471 55271 630
10 Malappuram 16519 2815 177 0 1 19 23355 58564 28463 633 12370 445 185880 732
11 Kozhikode 7386 1633 447 0 4 21 31731 17264 17885 912 8580 553 42128 153
12 Wayanad 7241 350 46 0 1 17 15517 71357 7608 155 3384 206 61696 111
13 Kannur 12684 1617 122 0 1 24 48685 18342 13669 536 13189 19148 67051 287
14 Kasaragod 51807 738 160 0 2 12 11513 6998 10957 319 5298 4802 13672 784
State Total 116839 37498 13746 380 77 281 420048 489322 395806 65978 116262 27944 2529729 3086
Source :
* Tea Board (Table - 4 Cont'd…..)
** Coffee Board
# Rubber Board
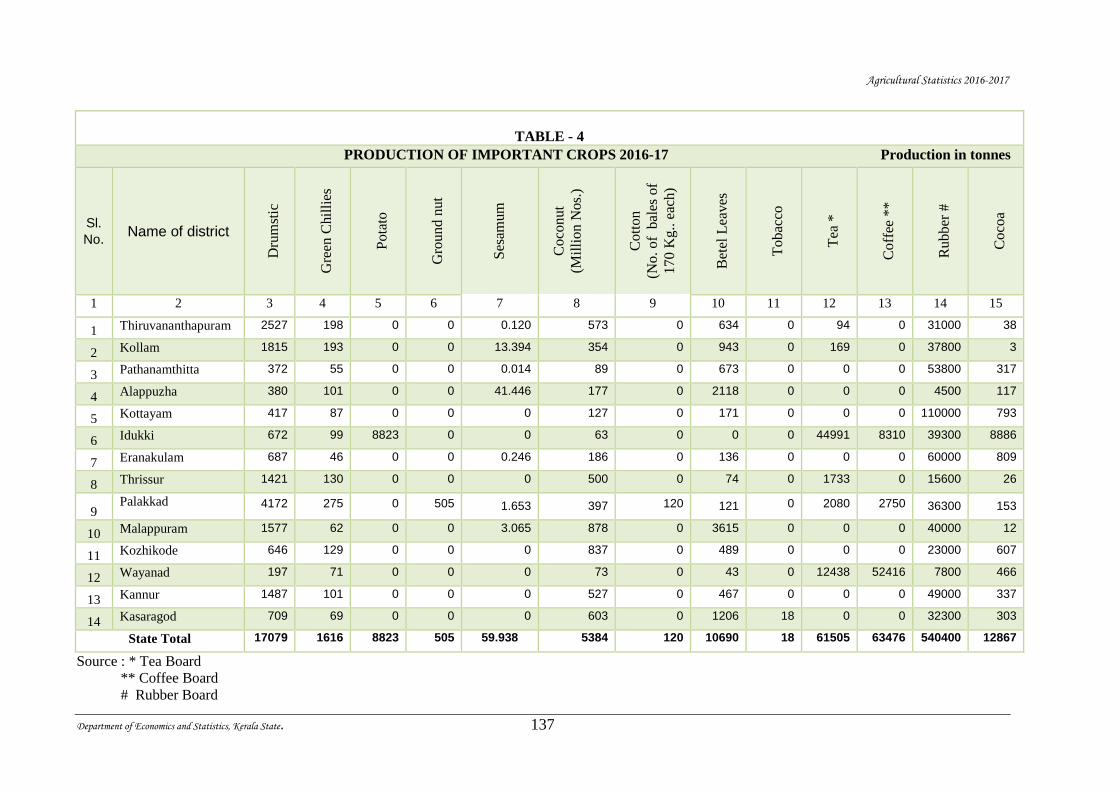
Agricultural Statistics 2016-2017
Department of Economics and Statistics, Kerala State. 137
TABLE - 4
PRODUCTION OF IMPORTANT CROPS 2016-17 Production in tonnes
Sl.
No. Name of district
Dru
mst
ic
Gre
en C
hil
lies
Pota
to
Gro
und n
ut
Ses
amum
Coco
nut
(Mil
lion N
os.
)
Cott
on
(No.
of
bal
es o
f
170 K
g..
eac
h)
Bet
el L
eaves
Tobac
co
Tea
*
Coff
ee *
*
Rubber
#
Coco
a
1 2 3 4 5 6 7 8 9 10 11 12 13 14 15
1 Thiruvananthapuram 2527 198 0 0 0.120 573 0 634 0 94 0 31000 38
2 Kollam 1815 193 0 0 13.394 354 0 943 0 169 0 37800 3
3 Pathanamthitta 372 55 0 0 0.014 89 0 673 0 0 0 53800 317
4 Alappuzha 380 101 0 0 41.446 177 0 2118 0 0 0 4500 117
5 Kottayam 417 87 0 0 0 127 0 171 0 0 0 110000 793
6 Idukki 672 99 8823 0 0 63 0 0 0 44991 8310 39300 8886
7 Eranakulam 687 46 0 0 0.246 186 0 136 0 0 0 60000 809
8 Thrissur 1421 130 0 0 0 500 0 74 0 1733 0 15600 26
9 Palakkad 4172 275 0 505 1.653 397 120 121 0 2080 2750 36300 153
10 Malappuram 1577 62 0 0 3.065 878 0 3615 0 0 0 40000 12
11 Kozhikode 646 129 0 0 0 837 0 489 0 0 0 23000 607
12 Wayanad 197 71 0 0 0 73 0 43 0 12438 52416 7800 466
13 Kannur 1487 101 0 0 0 527 0 467 0 0 0 49000 337
14 Kasaragod 709 69 0 0 0 603 0 1206 18 0 0 32300 303
State Total 17079 1616 8823 505 59.938 5384 120 10690 18 61505 63476 540400 12867
Source : * Tea Board
** Coffee Board
# Rubber Board
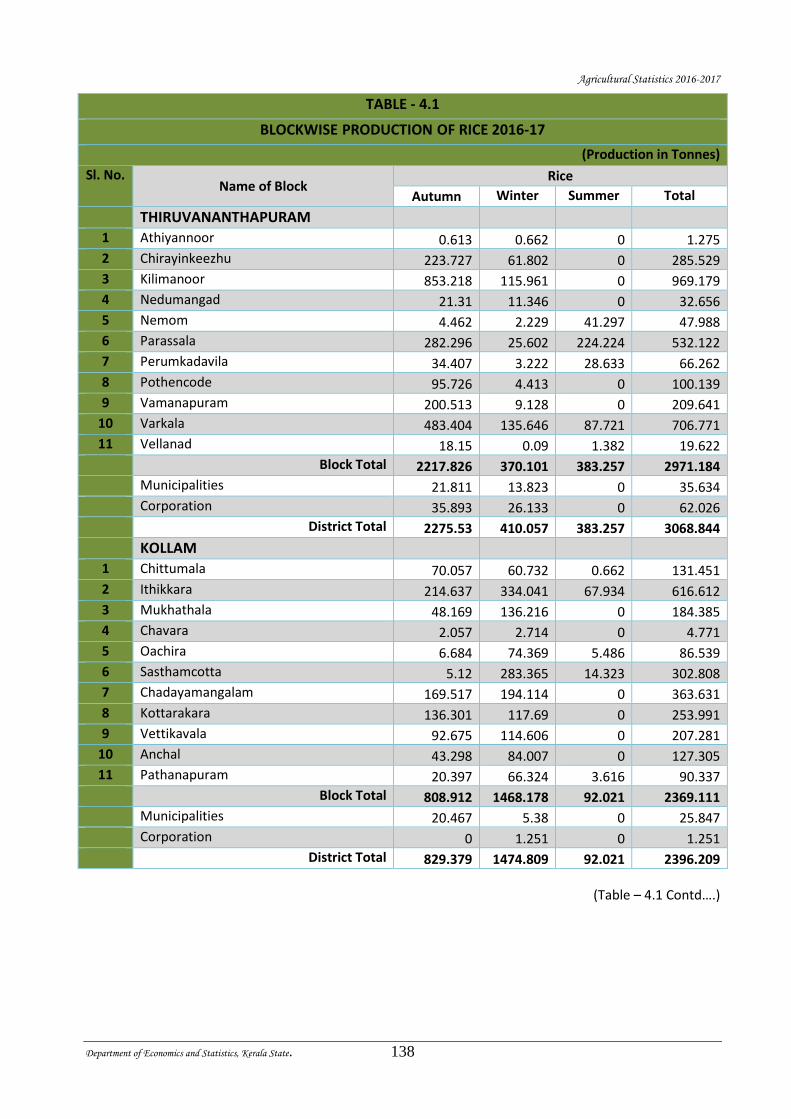
Agricultural Statistics 2016-2017
Department of Economics and Statistics, Kerala State. 138
TABLE - 4.1
BLOCKWISE PRODUCTION OF RICE 2016-17
(Production in Tonnes)
Sl. No. Name of Block
Rice
Autumn Winter Summer Total
THIRUVANANTHAPURAM
1 Athiyannoor 0.613 0.662 0 1.275
2 Chirayinkeezhu 223.727 61.802 0 285.529
3 Kilimanoor 853.218 115.961 0 969.179
4 Nedumangad 21.31 11.346 0 32.656
5 Nemom 4.462 2.229 41.297 47.988
6 Parassala 282.296 25.602 224.224 532.122
7 Perumkadavila 34.407 3.222 28.633 66.262
8 Pothencode 95.726 4.413 0 100.139
9 Vamanapuram 200.513 9.128 0 209.641
10 Varkala 483.404 135.646 87.721 706.771
11 Vellanad 18.15 0.09 1.382 19.622
Block Total 2217.826 370.101 383.257 2971.184
Municipalities 21.811 13.823 0 35.634
Corporation 35.893 26.133 0 62.026
District Total 2275.53 410.057 383.257 3068.844
KOLLAM
1 Chittumala 70.057 60.732 0.662 131.451
2 Ithikkara 214.637 334.041 67.934 616.612
3 Mukhathala 48.169 136.216 0 184.385
4 Chavara 2.057 2.714 0 4.771
5 Oachira 6.684 74.369 5.486 86.539
6 Sasthamcotta 5.12 283.365 14.323 302.808
7 Chadayamangalam 169.517 194.114 0 363.631
8 Kottarakara 136.301 117.69 0 253.991
9 Vettikavala 92.675 114.606 0 207.281
10 Anchal 43.298 84.007 0 127.305
11 Pathanapuram 20.397 66.324 3.616 90.337
Block Total 808.912 1468.178 92.021 2369.111
Municipalities 20.467 5.38 0 25.847
Corporation 0 1.251 0 1.251
District Total 829.379 1474.809 92.021 2396.209
(Table – 4.1 Contd….)
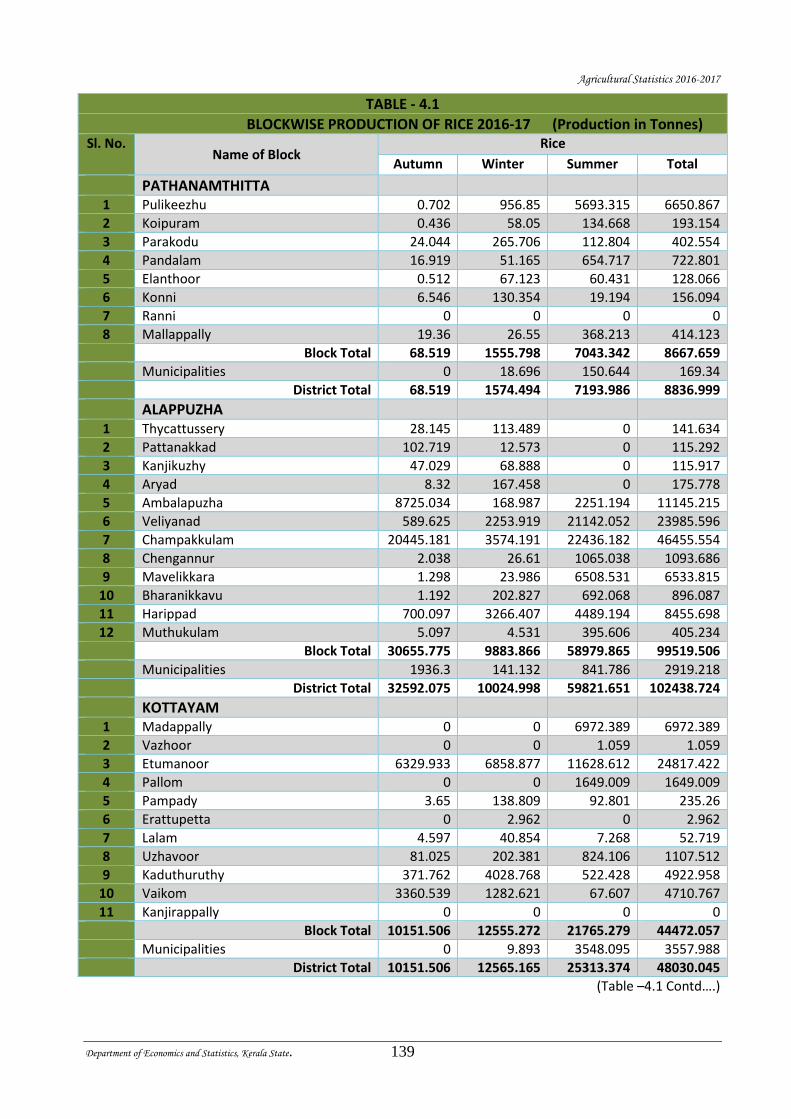
Agricultural Statistics 2016-2017
Department of Economics and Statistics, Kerala State. 139
TABLE - 4.1
BLOCKWISE PRODUCTION OF RICE 2016-17 (Production in Tonnes) Sl. No.
Name of Block Rice
Autumn Winter Summer Total
PATHANAMTHITTA
1 Pulikeezhu 0.702 956.85 5693.315 6650.867
2 Koipuram 0.436 58.05 134.668 193.154
3 Parakodu 24.044 265.706 112.804 402.554
4 Pandalam 16.919 51.165 654.717 722.801
5 Elanthoor 0.512 67.123 60.431 128.066
6 Konni 6.546 130.354 19.194 156.094
7 Ranni 0 0 0 0
8 Mallappally 19.36 26.55 368.213 414.123
Block Total 68.519 1555.798 7043.342 8667.659
Municipalities 0 18.696 150.644 169.34
District Total 68.519 1574.494 7193.986 8836.999
ALAPPUZHA
1 Thycattussery 28.145 113.489 0 141.634
2 Pattanakkad 102.719 12.573 0 115.292
3 Kanjikuzhy 47.029 68.888 0 115.917
4 Aryad 8.32 167.458 0 175.778
5 Ambalapuzha 8725.034 168.987 2251.194 11145.215
6 Veliyanad 589.625 2253.919 21142.052 23985.596
7 Champakkulam 20445.181 3574.191 22436.182 46455.554
8 Chengannur 2.038 26.61 1065.038 1093.686
9 Mavelikkara 1.298 23.986 6508.531 6533.815
10 Bharanikkavu 1.192 202.827 692.068 896.087
11 Harippad 700.097 3266.407 4489.194 8455.698
12 Muthukulam 5.097 4.531 395.606 405.234
Block Total 30655.775 9883.866 58979.865 99519.506
Municipalities 1936.3 141.132 841.786 2919.218
District Total 32592.075 10024.998 59821.651 102438.724
KOTTAYAM
1 Madappally 0 0 6972.389 6972.389
2 Vazhoor 0 0 1.059 1.059
3 Etumanoor 6329.933 6858.877 11628.612 24817.422
4 Pallom 0 0 1649.009 1649.009
5 Pampady 3.65 138.809 92.801 235.26
6 Erattupetta 0 2.962 0 2.962
7 Lalam 4.597 40.854 7.268 52.719
8 Uzhavoor 81.025 202.381 824.106 1107.512
9 Kaduthuruthy 371.762 4028.768 522.428 4922.958
10 Vaikom 3360.539 1282.621 67.607 4710.767
11 Kanjirappally 0 0 0 0
Block Total 10151.506 12555.272 21765.279 44472.057
Municipalities 0 9.893 3548.095 3557.988
District Total 10151.506 12565.165 25313.374 48030.045
(Table –4.1 Contd….)
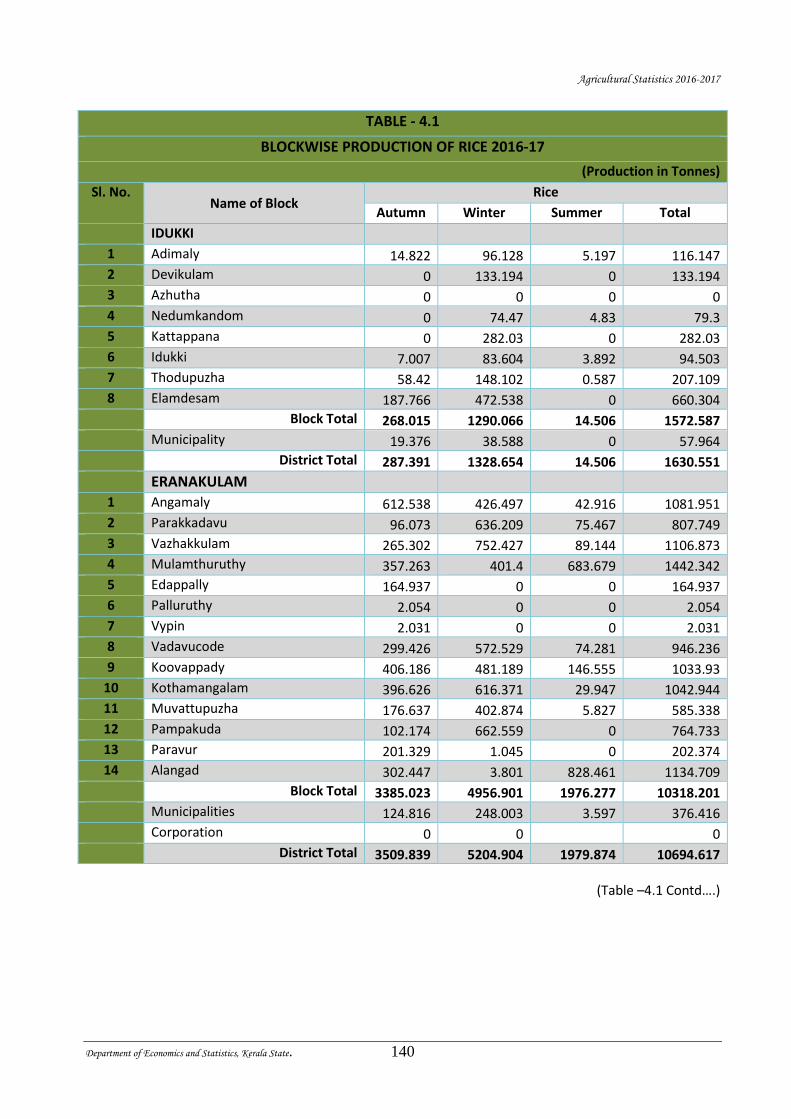
Agricultural Statistics 2016-2017
Department of Economics and Statistics, Kerala State. 140
TABLE - 4.1
BLOCKWISE PRODUCTION OF RICE 2016-17
(Production in Tonnes)
Sl. No. Name of Block
Rice
Autumn Winter Summer Total
IDUKKI
1 Adimaly 14.822 96.128 5.197 116.147
2 Devikulam 0 133.194 0 133.194
3 Azhutha 0 0 0 0
4 Nedumkandom 0 74.47 4.83 79.3
5 Kattappana 0 282.03 0 282.03
6 Idukki 7.007 83.604 3.892 94.503
7 Thodupuzha 58.42 148.102 0.587 207.109
8 Elamdesam 187.766 472.538 0 660.304
Block Total 268.015 1290.066 14.506 1572.587
Municipality 19.376 38.588 0 57.964
District Total 287.391 1328.654 14.506 1630.551
ERANAKULAM
1 Angamaly 612.538 426.497 42.916 1081.951
2 Parakkadavu 96.073 636.209 75.467 807.749
3 Vazhakkulam 265.302 752.427 89.144 1106.873
4 Mulamthuruthy 357.263 401.4 683.679 1442.342
5 Edappally 164.937 0 0 164.937
6 Palluruthy 2.054 0 0 2.054
7 Vypin 2.031 0 0 2.031
8 Vadavucode 299.426 572.529 74.281 946.236
9 Koovappady 406.186 481.189 146.555 1033.93
10 Kothamangalam 396.626 616.371 29.947 1042.944
11 Muvattupuzha 176.637 402.874 5.827 585.338
12 Pampakuda 102.174 662.559 0 764.733
13 Paravur 201.329 1.045 0 202.374
14 Alangad 302.447 3.801 828.461 1134.709
Block Total 3385.023 4956.901 1976.277 10318.201
Municipalities 124.816 248.003 3.597 376.416
Corporation 0 0 0
District Total 3509.839 5204.904 1979.874 10694.617
(Table –4.1 Contd….)
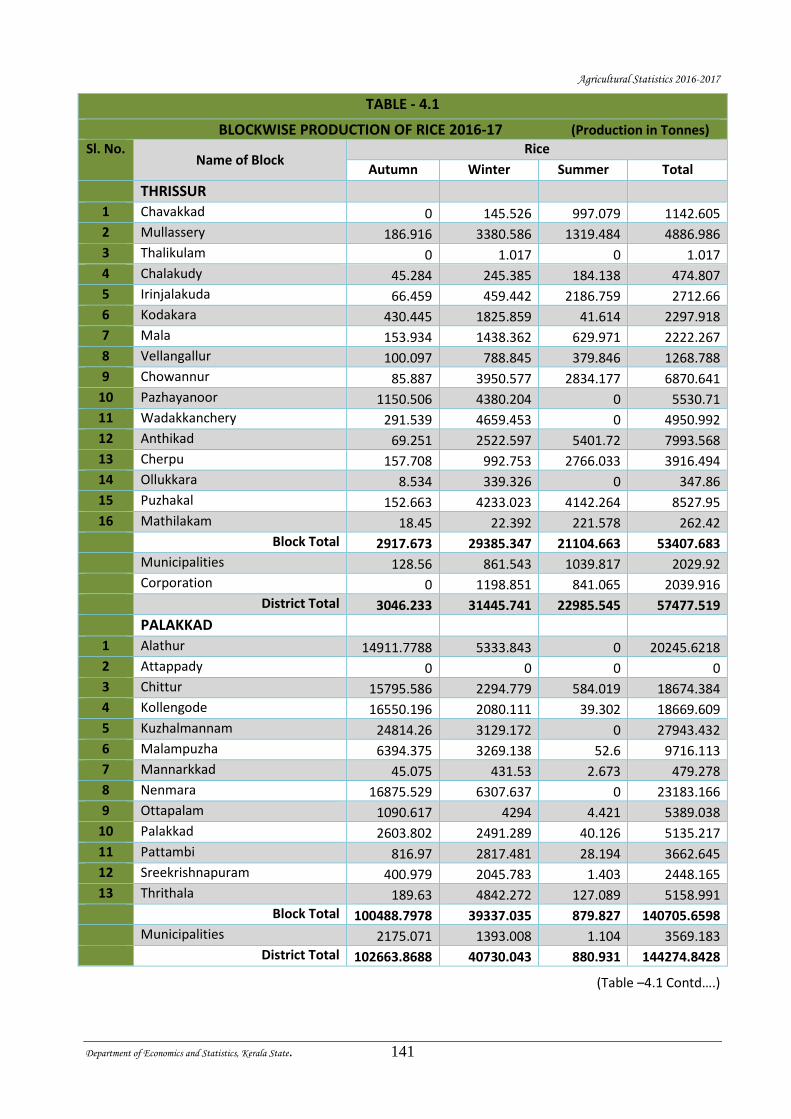
Agricultural Statistics 2016-2017
Department of Economics and Statistics, Kerala State. 141
TABLE - 4.1
BLOCKWISE PRODUCTION OF RICE 2016-17 (Production in Tonnes) Sl. No.
Name of Block Rice
Autumn Winter Summer Total
THRISSUR
1 Chavakkad 0 145.526 997.079 1142.605
2 Mullassery 186.916 3380.586 1319.484 4886.986
3 Thalikulam 0 1.017 0 1.017
4 Chalakudy 45.284 245.385 184.138 474.807
5 Irinjalakuda 66.459 459.442 2186.759 2712.66
6 Kodakara 430.445 1825.859 41.614 2297.918
7 Mala 153.934 1438.362 629.971 2222.267
8 Vellangallur 100.097 788.845 379.846 1268.788
9 Chowannur 85.887 3950.577 2834.177 6870.641
10 Pazhayanoor 1150.506 4380.204 0 5530.71
11 Wadakkanchery 291.539 4659.453 0 4950.992
12 Anthikad 69.251 2522.597 5401.72 7993.568
13 Cherpu 157.708 992.753 2766.033 3916.494
14 Ollukkara 8.534 339.326 0 347.86
15 Puzhakal 152.663 4233.023 4142.264 8527.95
16 Mathilakam 18.45 22.392 221.578 262.42
Block Total 2917.673 29385.347 21104.663 53407.683
Municipalities 128.56 861.543 1039.817 2029.92
Corporation 0 1198.851 841.065 2039.916
District Total 3046.233 31445.741 22985.545 57477.519
PALAKKAD
1 Alathur 14911.7788 5333.843 0 20245.6218
2 Attappady 0 0 0 0
3 Chittur 15795.586 2294.779 584.019 18674.384
4 Kollengode 16550.196 2080.111 39.302 18669.609
5 Kuzhalmannam 24814.26 3129.172 0 27943.432
6 Malampuzha 6394.375 3269.138 52.6 9716.113
7 Mannarkkad 45.075 431.53 2.673 479.278
8 Nenmara 16875.529 6307.637 0 23183.166
9 Ottapalam 1090.617 4294 4.421 5389.038
10 Palakkad 2603.802 2491.289 40.126 5135.217
11 Pattambi 816.97 2817.481 28.194 3662.645
12 Sreekrishnapuram 400.979 2045.783 1.403 2448.165
13 Thrithala 189.63 4842.272 127.089 5158.991
Block Total 100488.7978 39337.035 879.827 140705.6598
Municipalities 2175.071 1393.008 1.104 3569.183
District Total 102663.8688 40730.043 880.931 144274.8428
(Table –4.1 Contd….)
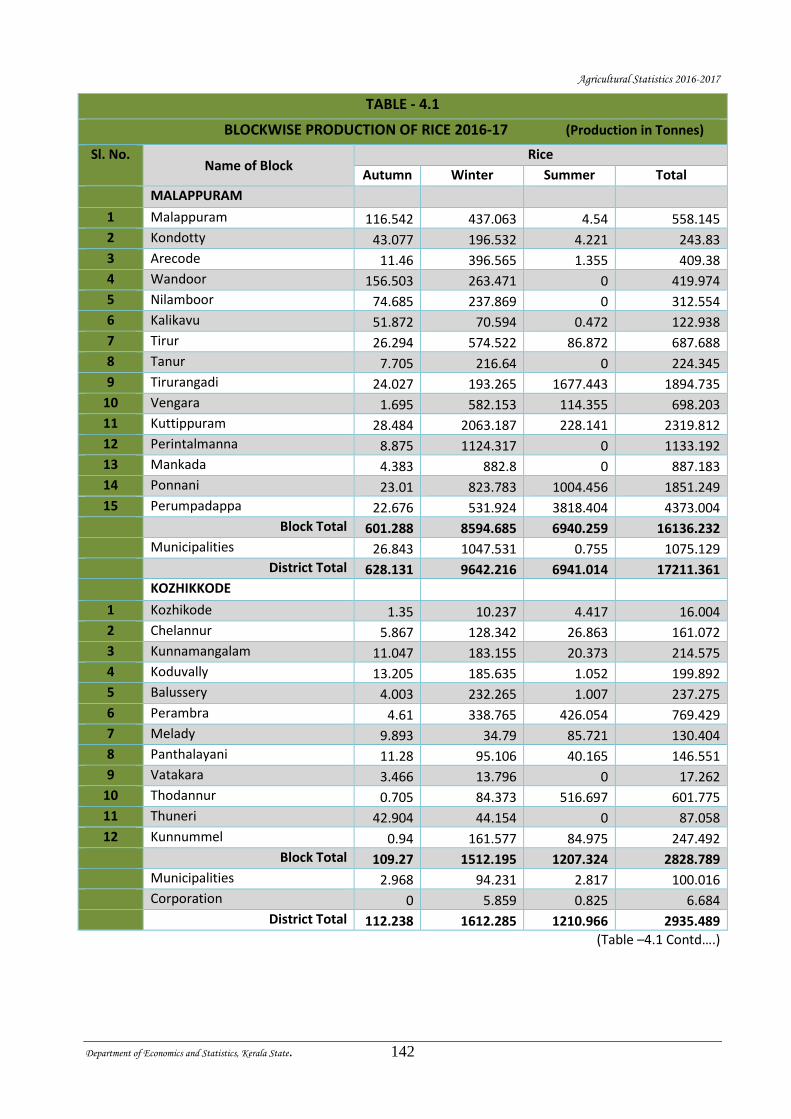
Agricultural Statistics 2016-2017
Department of Economics and Statistics, Kerala State. 142
TABLE - 4.1
BLOCKWISE PRODUCTION OF RICE 2016-17 (Production in Tonnes)
Sl. No. Name of Block
Rice
Autumn Winter Summer Total
MALAPPURAM
1 Malappuram 116.542 437.063 4.54 558.145
2 Kondotty 43.077 196.532 4.221 243.83
3 Arecode 11.46 396.565 1.355 409.38
4 Wandoor 156.503 263.471 0 419.974
5 Nilamboor 74.685 237.869 0 312.554
6 Kalikavu 51.872 70.594 0.472 122.938
7 Tirur 26.294 574.522 86.872 687.688
8 Tanur 7.705 216.64 0 224.345
9 Tirurangadi 24.027 193.265 1677.443 1894.735
10 Vengara 1.695 582.153 114.355 698.203
11 Kuttippuram 28.484 2063.187 228.141 2319.812
12 Perintalmanna 8.875 1124.317 0 1133.192
13 Mankada 4.383 882.8 0 887.183
14 Ponnani 23.01 823.783 1004.456 1851.249
15 Perumpadappa 22.676 531.924 3818.404 4373.004
Block Total 601.288 8594.685 6940.259 16136.232
Municipalities 26.843 1047.531 0.755 1075.129
District Total 628.131 9642.216 6941.014 17211.361
KOZHIKKODE
1 Kozhikode 1.35 10.237 4.417 16.004
2 Chelannur 5.867 128.342 26.863 161.072
3 Kunnamangalam 11.047 183.155 20.373 214.575
4 Koduvally 13.205 185.635 1.052 199.892
5 Balussery 4.003 232.265 1.007 237.275
6 Perambra 4.61 338.765 426.054 769.429
7 Melady 9.893 34.79 85.721 130.404
8 Panthalayani 11.28 95.106 40.165 146.551
9 Vatakara 3.466 13.796 0 17.262
10 Thodannur 0.705 84.373 516.697 601.775
11 Thuneri 42.904 44.154 0 87.058
12 Kunnummel 0.94 161.577 84.975 247.492
Block Total 109.27 1512.195 1207.324 2828.789
Municipalities 2.968 94.231 2.817 100.016
Corporation 0 5.859 0.825 6.684
District Total 112.238 1612.285 1210.966 2935.489
(Table –4.1 Contd….)
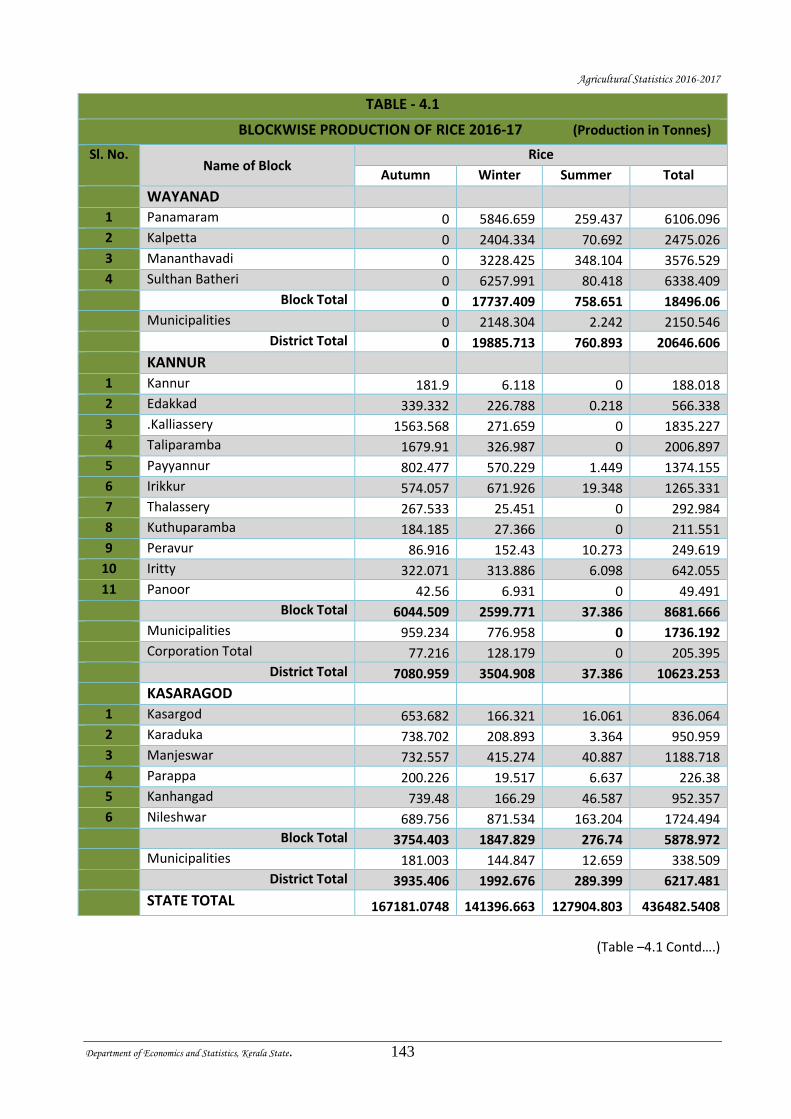
Agricultural Statistics 2016-2017
Department of Economics and Statistics, Kerala State. 143
TABLE - 4.1
BLOCKWISE PRODUCTION OF RICE 2016-17 (Production in Tonnes)
Sl. No. Name of Block
Rice
Autumn Winter Summer Total
WAYANAD
1 Panamaram 0 5846.659 259.437 6106.096
2 Kalpetta 0 2404.334 70.692 2475.026
3 Mananthavadi 0 3228.425 348.104 3576.529
4 Sulthan Batheri 0 6257.991 80.418 6338.409
Block Total 0 17737.409 758.651 18496.06
Municipalities 0 2148.304 2.242 2150.546
District Total 0 19885.713 760.893 20646.606
KANNUR
1 Kannur 181.9 6.118 0 188.018
2 Edakkad 339.332 226.788 0.218 566.338
3 .Kalliassery 1563.568 271.659 0 1835.227
4 Taliparamba 1679.91 326.987 0 2006.897
5 Payyannur 802.477 570.229 1.449 1374.155
6 Irikkur 574.057 671.926 19.348 1265.331
7 Thalassery 267.533 25.451 0 292.984
8 Kuthuparamba 184.185 27.366 0 211.551
9 Peravur 86.916 152.43 10.273 249.619
10 Iritty 322.071 313.886 6.098 642.055
11 Panoor 42.56 6.931 0 49.491
Block Total 6044.509 2599.771 37.386 8681.666
Municipalities 959.234 776.958 0 1736.192
Corporation Total 77.216 128.179 0 205.395
District Total 7080.959 3504.908 37.386 10623.253
KASARAGOD
1 Kasargod 653.682 166.321 16.061 836.064
2 Karaduka 738.702 208.893 3.364 950.959
3 Manjeswar 732.557 415.274 40.887 1188.718
4 Parappa 200.226 19.517 6.637 226.38
5 Kanhangad 739.48 166.29 46.587 952.357
6 Nileshwar 689.756 871.534 163.204 1724.494
Block Total 3754.403 1847.829 276.74 5878.972
Municipalities 181.003 144.847 12.659 338.509
District Total 3935.406 1992.676 289.399 6217.481
STATE TOTAL 167181.0748 141396.663 127904.803 436482.5408
(Table –4.1 Contd….)
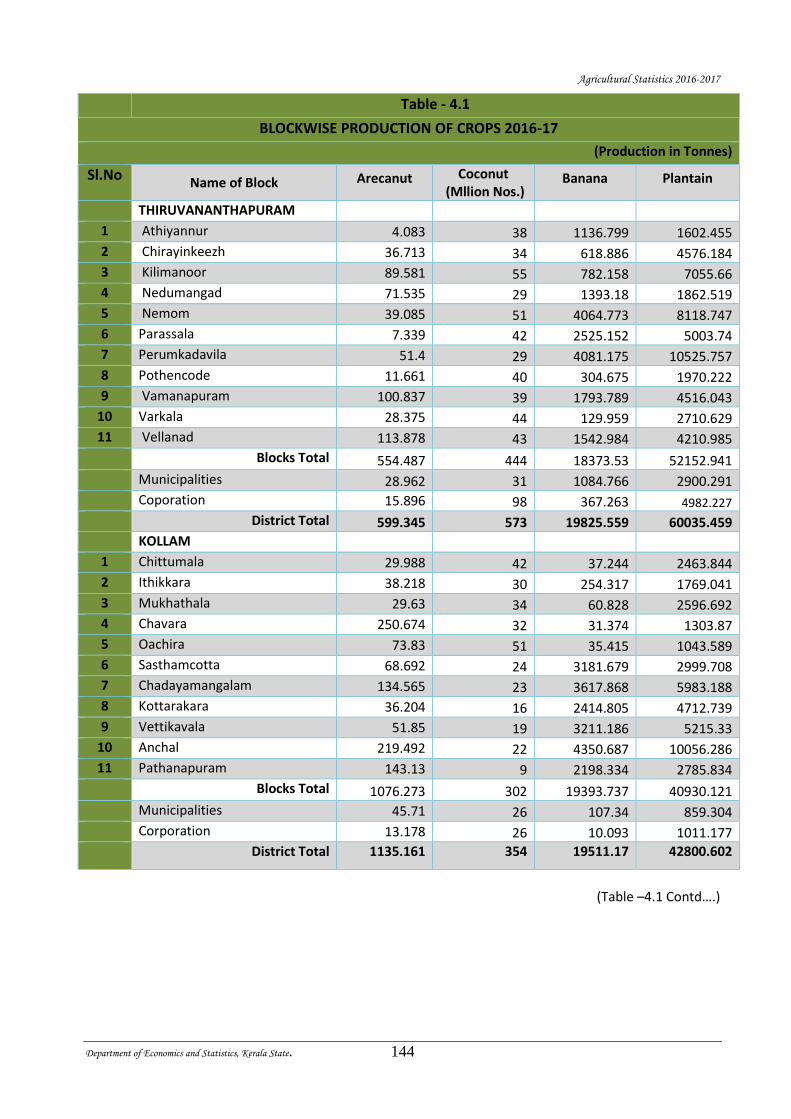
Agricultural Statistics 2016-2017
Department of Economics and Statistics, Kerala State. 144
Table - 4.1
BLOCKWISE PRODUCTION OF CROPS 2016-17
(Production in Tonnes)
Sl.No Name of Block Arecanut Coconut
(Mllion Nos.) Banana Plantain
THIRUVANANTHAPURAM
1 Athiyannur 4.083 38 1136.799 1602.455
2 Chirayinkeezh 36.713 34 618.886 4576.184
3 Kilimanoor 89.581 55 782.158 7055.66
4 Nedumangad 71.535 29 1393.18 1862.519
5 Nemom 39.085 51 4064.773 8118.747
6 Parassala 7.339 42 2525.152 5003.74
7 Perumkadavila 51.4 29 4081.175 10525.757
8 Pothencode 11.661 40 304.675 1970.222
9 Vamanapuram 100.837 39 1793.789 4516.043
10 Varkala 28.375 44 129.959 2710.629
11 Vellanad 113.878 43 1542.984 4210.985
Blocks Total 554.487 444 18373.53 52152.941
Municipalities 28.962 31 1084.766 2900.291
Coporation 15.896 98 367.263 4982.227
District Total 599.345 573 19825.559 60035.459
KOLLAM
1 Chittumala 29.988 42 37.244 2463.844
2 Ithikkara 38.218 30 254.317 1769.041
3 Mukhathala 29.63 34 60.828 2596.692
4 Chavara 250.674 32 31.374 1303.87
5 Oachira 73.83 51 35.415 1043.589
6 Sasthamcotta 68.692 24 3181.679 2999.708
7 Chadayamangalam 134.565 23 3617.868 5983.188
8 Kottarakara 36.204 16 2414.805 4712.739
9 Vettikavala 51.85 19 3211.186 5215.33
10 Anchal 219.492 22 4350.687 10056.286
11 Pathanapuram 143.13 9 2198.334 2785.834
Blocks Total 1076.273 302 19393.737 40930.121
Municipalities 45.71 26 107.34 859.304
Corporation 13.178 26 10.093 1011.177
District Total 1135.161 354 19511.17 42800.602
(Table –4.1 Contd….)
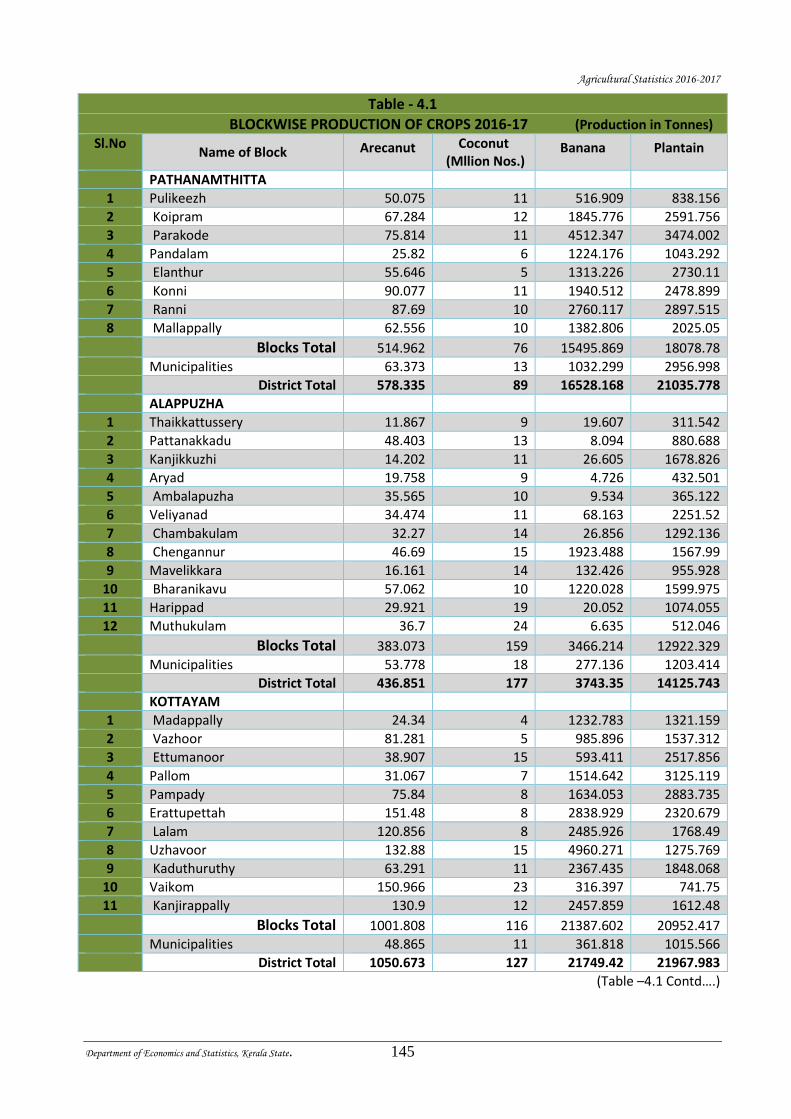
Agricultural Statistics 2016-2017
Department of Economics and Statistics, Kerala State. 145
Table - 4.1
BLOCKWISE PRODUCTION OF CROPS 2016-17 (Production in Tonnes) Sl.No
Name of Block Arecanut Coconut (Mllion Nos.)
Banana Plantain
PATHANAMTHITTA
1 Pulikeezh 50.075 11 516.909 838.156
2 Koipram 67.284 12 1845.776 2591.756
3 Parakode 75.814 11 4512.347 3474.002
4 Pandalam 25.82 6 1224.176 1043.292
5 Elanthur 55.646 5 1313.226 2730.11
6 Konni 90.077 11 1940.512 2478.899
7 Ranni 87.69 10 2760.117 2897.515
8 Mallappally 62.556 10 1382.806 2025.05
Blocks Total 514.962 76 15495.869 18078.78
Municipalities 63.373 13 1032.299 2956.998
District Total 578.335 89 16528.168 21035.778
ALAPPUZHA 1 Thaikkattussery 11.867 9 19.607 311.542
2 Pattanakkadu 48.403 13 8.094 880.688
3 Kanjikkuzhi 14.202 11 26.605 1678.826
4 Aryad 19.758 9 4.726 432.501
5 Ambalapuzha 35.565 10 9.534 365.122
6 Veliyanad 34.474 11 68.163 2251.52
7 Chambakulam 32.27 14 26.856 1292.136
8 Chengannur 46.69 15 1923.488 1567.99
9 Mavelikkara 16.161 14 132.426 955.928
10 Bharanikavu 57.062 10 1220.028 1599.975
11 Harippad 29.921 19 20.052 1074.055
12 Muthukulam 36.7 24 6.635 512.046
Blocks Total 383.073 159 3466.214 12922.329
Municipalities 53.778 18 277.136 1203.414
District Total 436.851 177 3743.35 14125.743
KOTTAYAM 1 Madappally 24.34 4 1232.783 1321.159
2 Vazhoor 81.281 5 985.896 1537.312
3 Ettumanoor 38.907 15 593.411 2517.856
4 Pallom 31.067 7 1514.642 3125.119
5 Pampady 75.84 8 1634.053 2883.735
6 Erattupettah 151.48 8 2838.929 2320.679
7 Lalam 120.856 8 2485.926 1768.49
8 Uzhavoor 132.88 15 4960.271 1275.769
9 Kaduthuruthy 63.291 11 2367.435 1848.068
10 Vaikom 150.966 23 316.397 741.75
11 Kanjirappally 130.9 12 2457.859 1612.48
Blocks Total 1001.808 116 21387.602 20952.417
Municipalities 48.865 11 361.818 1015.566
District Total 1050.673 127 21749.42 21967.983
(Table –4.1 Contd….)
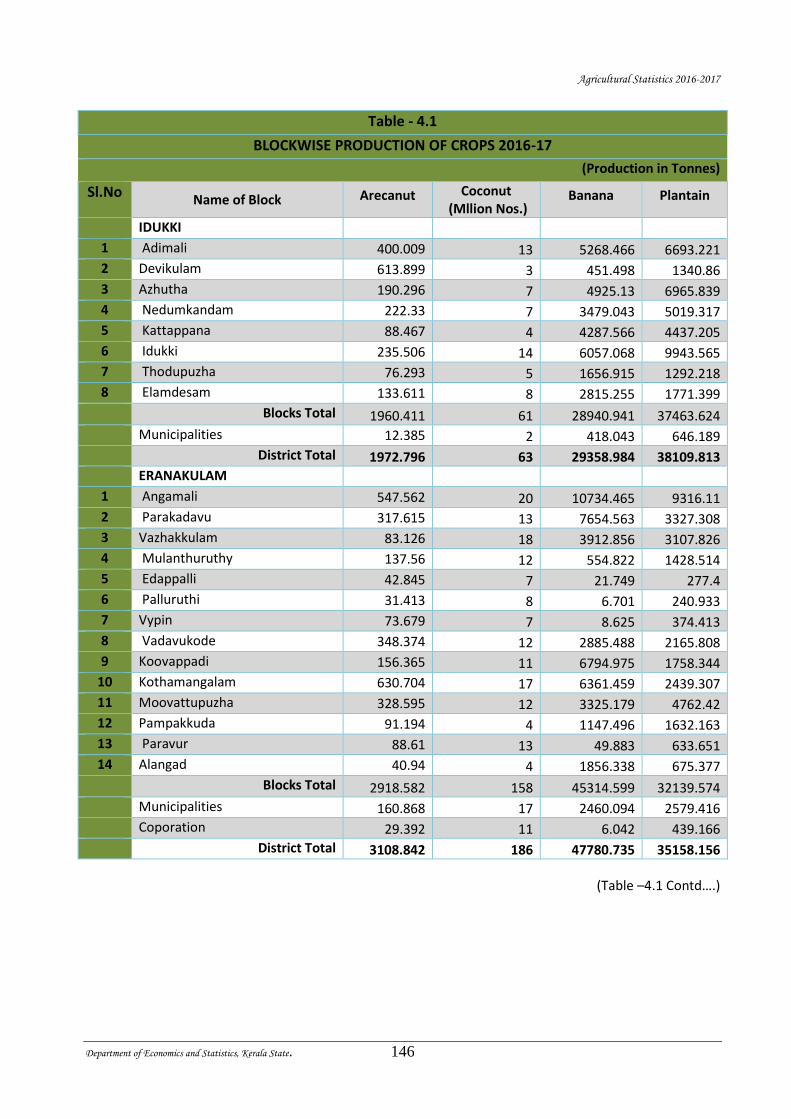
Agricultural Statistics 2016-2017
Department of Economics and Statistics, Kerala State. 146
Table - 4.1
BLOCKWISE PRODUCTION OF CROPS 2016-17
(Production in Tonnes)
Sl.No Name of Block Arecanut Coconut
(Mllion Nos.) Banana Plantain
IDUKKI
1 Adimali 400.009 13 5268.466 6693.221
2 Devikulam 613.899 3 451.498 1340.86
3 Azhutha 190.296 7 4925.13 6965.839
4 Nedumkandam 222.33 7 3479.043 5019.317
5 Kattappana 88.467 4 4287.566 4437.205
6 Idukki 235.506 14 6057.068 9943.565
7 Thodupuzha 76.293 5 1656.915 1292.218
8 Elamdesam 133.611 8 2815.255 1771.399
Blocks Total 1960.411 61 28940.941 37463.624
Municipalities 12.385 2 418.043 646.189
District Total 1972.796 63 29358.984 38109.813
ERANAKULAM
1 Angamali 547.562 20 10734.465 9316.11
2 Parakadavu 317.615 13 7654.563 3327.308
3 Vazhakkulam 83.126 18 3912.856 3107.826
4 Mulanthuruthy 137.56 12 554.822 1428.514
5 Edappalli 42.845 7 21.749 277.4
6 Palluruthi 31.413 8 6.701 240.933
7 Vypin 73.679 7 8.625 374.413
8 Vadavukode 348.374 12 2885.488 2165.808
9 Koovappadi 156.365 11 6794.975 1758.344
10 Kothamangalam 630.704 17 6361.459 2439.307
11 Moovattupuzha 328.595 12 3325.179 4762.42
12 Pampakkuda 91.194 4 1147.496 1632.163
13 Paravur 88.61 13 49.883 633.651
14 Alangad 40.94 4 1856.338 675.377
Blocks Total 2918.582 158 45314.599 32139.574
Municipalities 160.868 17 2460.094 2579.416
Coporation 29.392 11 6.042 439.166
District Total 3108.842 186 47780.735 35158.156
(Table –4.1 Contd….)
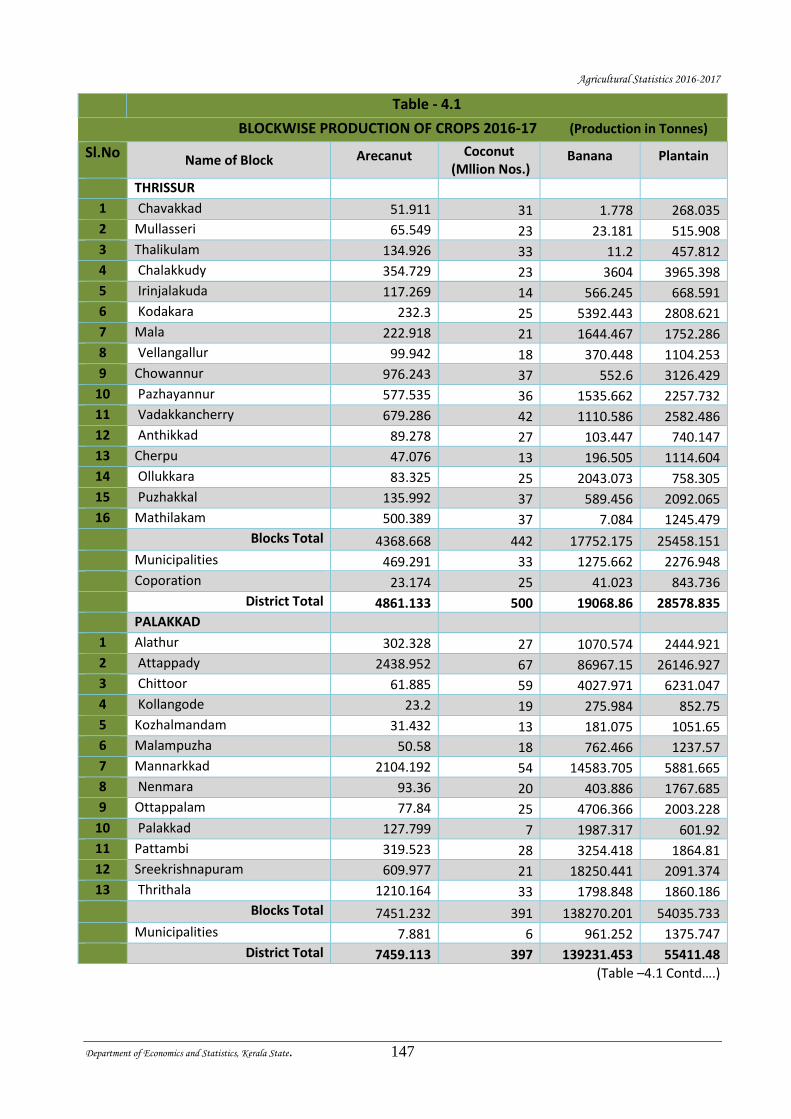
Agricultural Statistics 2016-2017
Department of Economics and Statistics, Kerala State. 147
Table - 4.1
BLOCKWISE PRODUCTION OF CROPS 2016-17 (Production in Tonnes)
Sl.No Name of Block Arecanut Coconut
(Mllion Nos.) Banana Plantain
THRISSUR
1 Chavakkad 51.911 31 1.778 268.035
2 Mullasseri 65.549 23 23.181 515.908
3 Thalikulam 134.926 33 11.2 457.812
4 Chalakkudy 354.729 23 3604 3965.398
5 Irinjalakuda 117.269 14 566.245 668.591
6 Kodakara 232.3 25 5392.443 2808.621
7 Mala 222.918 21 1644.467 1752.286
8 Vellangallur 99.942 18 370.448 1104.253
9 Chowannur 976.243 37 552.6 3126.429
10 Pazhayannur 577.535 36 1535.662 2257.732
11 Vadakkancherry 679.286 42 1110.586 2582.486
12 Anthikkad 89.278 27 103.447 740.147
13 Cherpu 47.076 13 196.505 1114.604
14 Ollukkara 83.325 25 2043.073 758.305
15 Puzhakkal 135.992 37 589.456 2092.065
16 Mathilakam 500.389 37 7.084 1245.479
Blocks Total 4368.668 442 17752.175 25458.151
Municipalities 469.291 33 1275.662 2276.948
Coporation 23.174 25 41.023 843.736
District Total 4861.133 500 19068.86 28578.835
PALAKKAD
1 Alathur 302.328 27 1070.574 2444.921
2 Attappady 2438.952 67 86967.15 26146.927
3 Chittoor 61.885 59 4027.971 6231.047
4 Kollangode 23.2 19 275.984 852.75
5 Kozhalmandam 31.432 13 181.075 1051.65
6 Malampuzha 50.58 18 762.466 1237.57
7 Mannarkkad 2104.192 54 14583.705 5881.665
8 Nenmara 93.36 20 403.886 1767.685
9 Ottappalam 77.84 25 4706.366 2003.228
10 Palakkad 127.799 7 1987.317 601.92
11 Pattambi 319.523 28 3254.418 1864.81
12 Sreekrishnapuram 609.977 21 18250.441 2091.374
13 Thrithala 1210.164 33 1798.848 1860.186
Blocks Total 7451.232 391 138270.201 54035.733
Municipalities 7.881 6 961.252 1375.747
District Total 7459.113 397 139231.453 55411.48
(Table –4.1 Contd….)
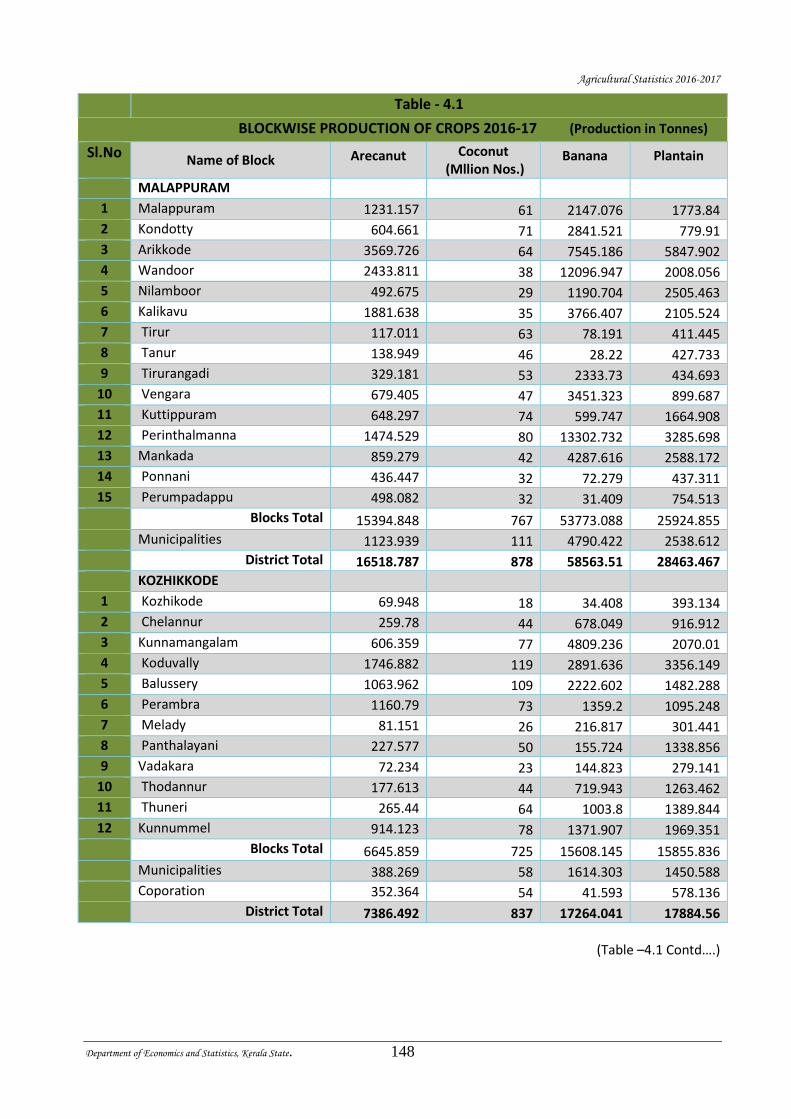
Agricultural Statistics 2016-2017
Department of Economics and Statistics, Kerala State. 148
Table - 4.1
BLOCKWISE PRODUCTION OF CROPS 2016-17 (Production in Tonnes)
Sl.No Name of Block Arecanut Coconut
(Mllion Nos.) Banana Plantain
MALAPPURAM
1 Malappuram 1231.157 61 2147.076 1773.84
2 Kondotty 604.661 71 2841.521 779.91
3 Arikkode 3569.726 64 7545.186 5847.902
4 Wandoor 2433.811 38 12096.947 2008.056
5 Nilamboor 492.675 29 1190.704 2505.463
6 Kalikavu 1881.638 35 3766.407 2105.524
7 Tirur 117.011 63 78.191 411.445
8 Tanur 138.949 46 28.22 427.733
9 Tirurangadi 329.181 53 2333.73 434.693
10 Vengara 679.405 47 3451.323 899.687
11 Kuttippuram 648.297 74 599.747 1664.908
12 Perinthalmanna 1474.529 80 13302.732 3285.698
13 Mankada 859.279 42 4287.616 2588.172
14 Ponnani 436.447 32 72.279 437.311
15 Perumpadappu 498.082 32 31.409 754.513
Blocks Total 15394.848 767 53773.088 25924.855
Municipalities 1123.939 111 4790.422 2538.612
District Total 16518.787 878 58563.51 28463.467
KOZHIKKODE
1 Kozhikode 69.948 18 34.408 393.134
2 Chelannur 259.78 44 678.049 916.912
3 Kunnamangalam 606.359 77 4809.236 2070.01
4 Koduvally 1746.882 119 2891.636 3356.149
5 Balussery 1063.962 109 2222.602 1482.288
6 Perambra 1160.79 73 1359.2 1095.248
7 Melady 81.151 26 216.817 301.441
8 Panthalayani 227.577 50 155.724 1338.856
9 Vadakara 72.234 23 144.823 279.141
10 Thodannur 177.613 44 719.943 1263.462
11 Thuneri 265.44 64 1003.8 1389.844
12 Kunnummel 914.123 78 1371.907 1969.351
Blocks Total 6645.859 725 15608.145 15855.836
Municipalities 388.269 58 1614.303 1450.588
Coporation 352.364 54 41.593 578.136
District Total 7386.492 837 17264.041 17884.56
(Table –4.1 Contd….)
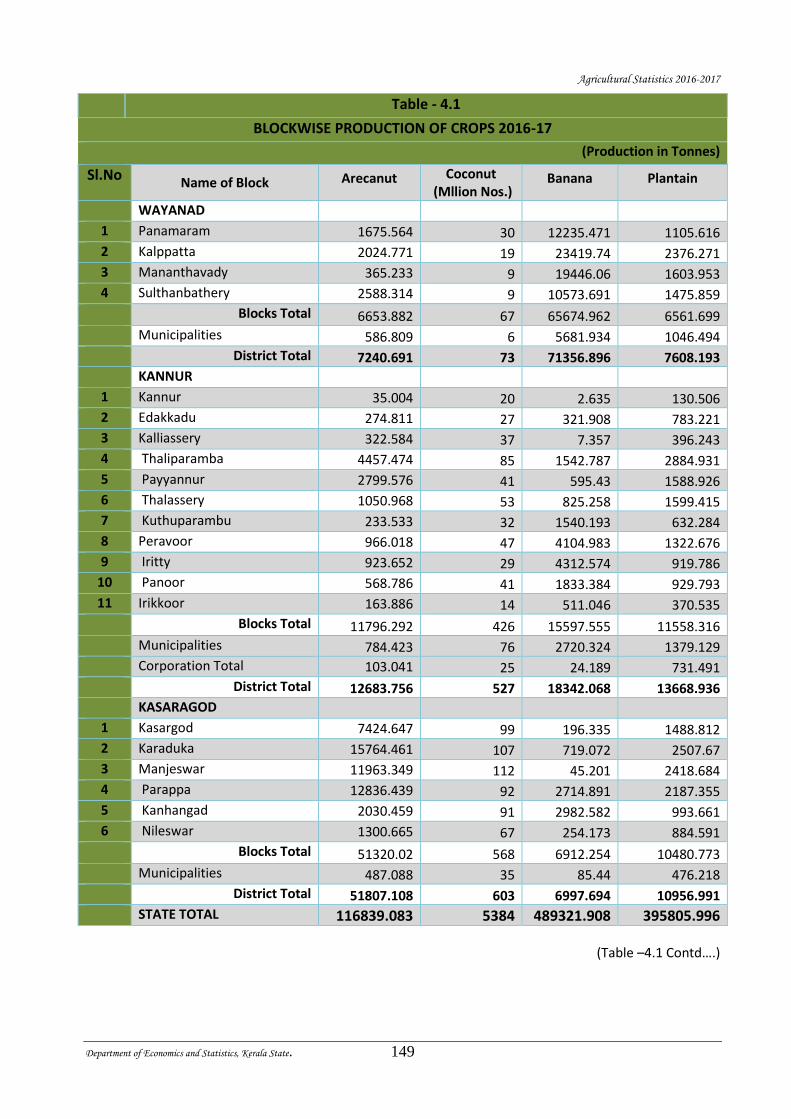
Agricultural Statistics 2016-2017
Department of Economics and Statistics, Kerala State. 149
Table - 4.1
BLOCKWISE PRODUCTION OF CROPS 2016-17
(Production in Tonnes)
Sl.No Name of Block Arecanut Coconut
(Mllion Nos.) Banana Plantain
WAYANAD
1 Panamaram 1675.564 30 12235.471 1105.616
2 Kalppatta 2024.771 19 23419.74 2376.271
3 Mananthavady 365.233 9 19446.06 1603.953
4 Sulthanbathery 2588.314 9 10573.691 1475.859
Blocks Total 6653.882 67 65674.962 6561.699
Municipalities 586.809 6 5681.934 1046.494
District Total 7240.691 73 71356.896 7608.193
KANNUR
1 Kannur 35.004 20 2.635 130.506
2 Edakkadu 274.811 27 321.908 783.221
3 Kalliassery 322.584 37 7.357 396.243
4 Thaliparamba 4457.474 85 1542.787 2884.931
5 Payyannur 2799.576 41 595.43 1588.926
6 Thalassery 1050.968 53 825.258 1599.415
7 Kuthuparambu 233.533 32 1540.193 632.284
8 Peravoor 966.018 47 4104.983 1322.676
9 Iritty 923.652 29 4312.574 919.786
10 Panoor 568.786 41 1833.384 929.793
11 Irikkoor 163.886 14 511.046 370.535
Blocks Total 11796.292 426 15597.555 11558.316
Municipalities 784.423 76 2720.324 1379.129
Corporation Total 103.041 25 24.189 731.491
District Total 12683.756 527 18342.068 13668.936
KASARAGOD
1 Kasargod 7424.647 99 196.335 1488.812
2 Karaduka 15764.461 107 719.072 2507.67
3 Manjeswar 11963.349 112 45.201 2418.684
4 Parappa 12836.439 92 2714.891 2187.355
5 Kanhangad 2030.459 91 2982.582 993.661
6 Nileswar 1300.665 67 254.173 884.591
Blocks Total 51320.02 568 6912.254 10480.773
Municipalities 487.088 35 85.44 476.218
District Total 51807.108 603 6997.694 10956.991
STATE TOTAL 116839.083 5384 489321.908 395805.996
(Table –4.1 Contd….)
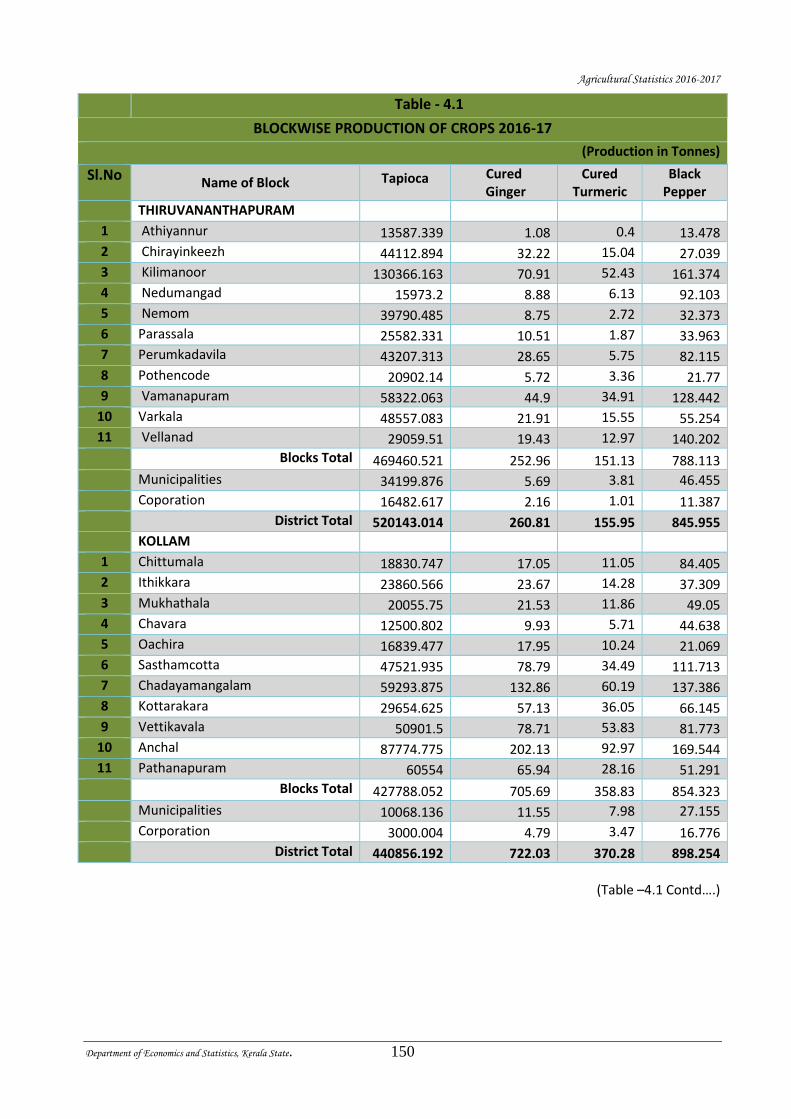
Agricultural Statistics 2016-2017
Department of Economics and Statistics, Kerala State. 150
Table - 4.1
BLOCKWISE PRODUCTION OF CROPS 2016-17
(Production in Tonnes)
Sl.No Name of Block Tapioca Cured
Ginger Cured
Turmeric Black
Pepper
THIRUVANANTHAPURAM
1 Athiyannur 13587.339 1.08 0.4 13.478
2 Chirayinkeezh 44112.894 32.22 15.04 27.039
3 Kilimanoor 130366.163 70.91 52.43 161.374
4 Nedumangad 15973.2 8.88 6.13 92.103
5 Nemom 39790.485 8.75 2.72 32.373
6 Parassala 25582.331 10.51 1.87 33.963
7 Perumkadavila 43207.313 28.65 5.75 82.115
8 Pothencode 20902.14 5.72 3.36 21.77
9 Vamanapuram 58322.063 44.9 34.91 128.442
10 Varkala 48557.083 21.91 15.55 55.254
11 Vellanad 29059.51 19.43 12.97 140.202
Blocks Total 469460.521 252.96 151.13 788.113
Municipalities 34199.876 5.69 3.81 46.455
Coporation 16482.617 2.16 1.01 11.387
District Total 520143.014 260.81 155.95 845.955
KOLLAM
1 Chittumala 18830.747 17.05 11.05 84.405
2 Ithikkara 23860.566 23.67 14.28 37.309
3 Mukhathala 20055.75 21.53 11.86 49.05
4 Chavara 12500.802 9.93 5.71 44.638
5 Oachira 16839.477 17.95 10.24 21.069
6 Sasthamcotta 47521.935 78.79 34.49 111.713
7 Chadayamangalam 59293.875 132.86 60.19 137.386
8 Kottarakara 29654.625 57.13 36.05 66.145
9 Vettikavala 50901.5 78.71 53.83 81.773
10 Anchal 87774.775 202.13 92.97 169.544
11 Pathanapuram 60554 65.94 28.16 51.291
Blocks Total 427788.052 705.69 358.83 854.323
Municipalities 10068.136 11.55 7.98 27.155
Corporation 3000.004 4.79 3.47 16.776
District Total 440856.192 722.03 370.28 898.254
(Table –4.1 Contd….)
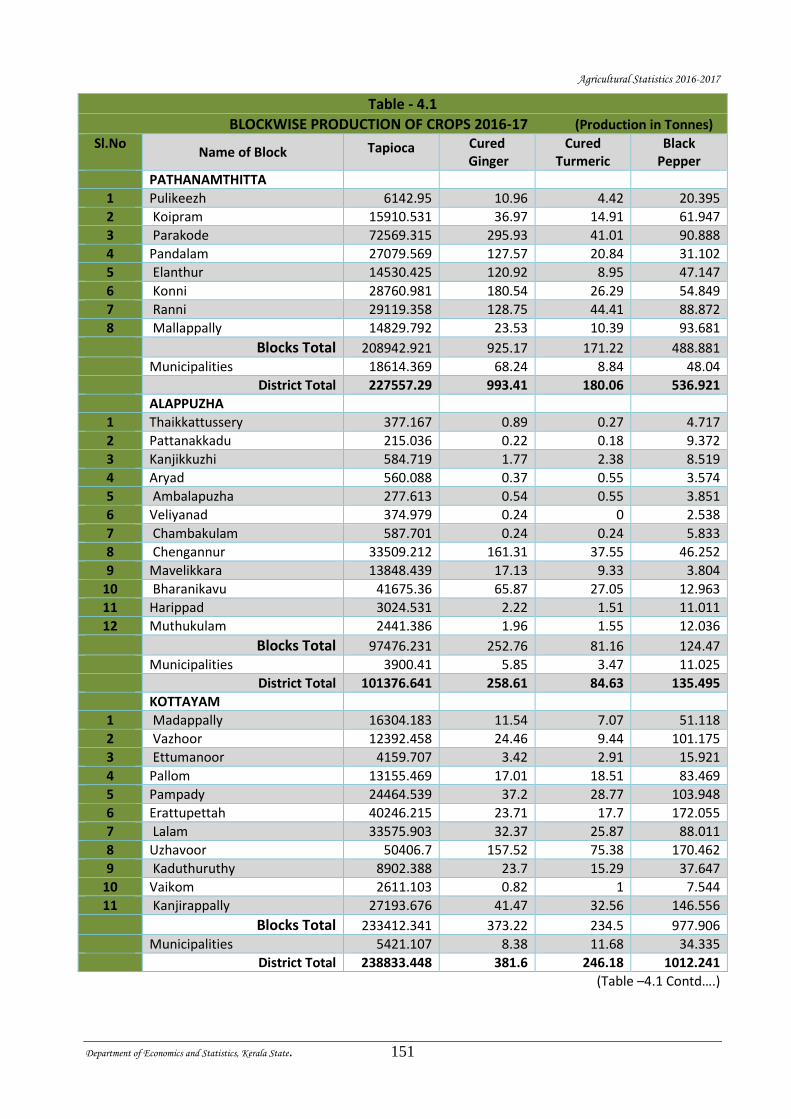
Agricultural Statistics 2016-2017
Department of Economics and Statistics, Kerala State. 151
Table - 4.1
BLOCKWISE PRODUCTION OF CROPS 2016-17 (Production in Tonnes) Sl.No
Name of Block Tapioca Cured Ginger
Cured Turmeric
Black Pepper
PATHANAMTHITTA
1 Pulikeezh 6142.95 10.96 4.42 20.395
2 Koipram 15910.531 36.97 14.91 61.947
3 Parakode 72569.315 295.93 41.01 90.888
4 Pandalam 27079.569 127.57 20.84 31.102
5 Elanthur 14530.425 120.92 8.95 47.147
6 Konni 28760.981 180.54 26.29 54.849
7 Ranni 29119.358 128.75 44.41 88.872
8 Mallappally 14829.792 23.53 10.39 93.681
Blocks Total 208942.921 925.17 171.22 488.881
Municipalities 18614.369 68.24 8.84 48.04
District Total 227557.29 993.41 180.06 536.921
ALAPPUZHA 1 Thaikkattussery 377.167 0.89 0.27 4.717
2 Pattanakkadu 215.036 0.22 0.18 9.372
3 Kanjikkuzhi 584.719 1.77 2.38 8.519
4 Aryad 560.088 0.37 0.55 3.574
5 Ambalapuzha 277.613 0.54 0.55 3.851
6 Veliyanad 374.979 0.24 0 2.538
7 Chambakulam 587.701 0.24 0.24 5.833
8 Chengannur 33509.212 161.31 37.55 46.252
9 Mavelikkara 13848.439 17.13 9.33 3.804
10 Bharanikavu 41675.36 65.87 27.05 12.963
11 Harippad 3024.531 2.22 1.51 11.011
12 Muthukulam 2441.386 1.96 1.55 12.036
Blocks Total 97476.231 252.76 81.16 124.47
Municipalities 3900.41 5.85 3.47 11.025
District Total 101376.641 258.61 84.63 135.495
KOTTAYAM 1 Madappally 16304.183 11.54 7.07 51.118
2 Vazhoor 12392.458 24.46 9.44 101.175
3 Ettumanoor 4159.707 3.42 2.91 15.921
4 Pallom 13155.469 17.01 18.51 83.469
5 Pampady 24464.539 37.2 28.77 103.948
6 Erattupettah 40246.215 23.71 17.7 172.055
7 Lalam 33575.903 32.37 25.87 88.011
8 Uzhavoor 50406.7 157.52 75.38 170.462
9 Kaduthuruthy 8902.388 23.7 15.29 37.647
10 Vaikom 2611.103 0.82 1 7.544
11 Kanjirappally 27193.676 41.47 32.56 146.556
Blocks Total 233412.341 373.22 234.5 977.906
Municipalities 5421.107 8.38 11.68 34.335
District Total 238833.448 381.6 246.18 1012.241
(Table –4.1 Contd….)
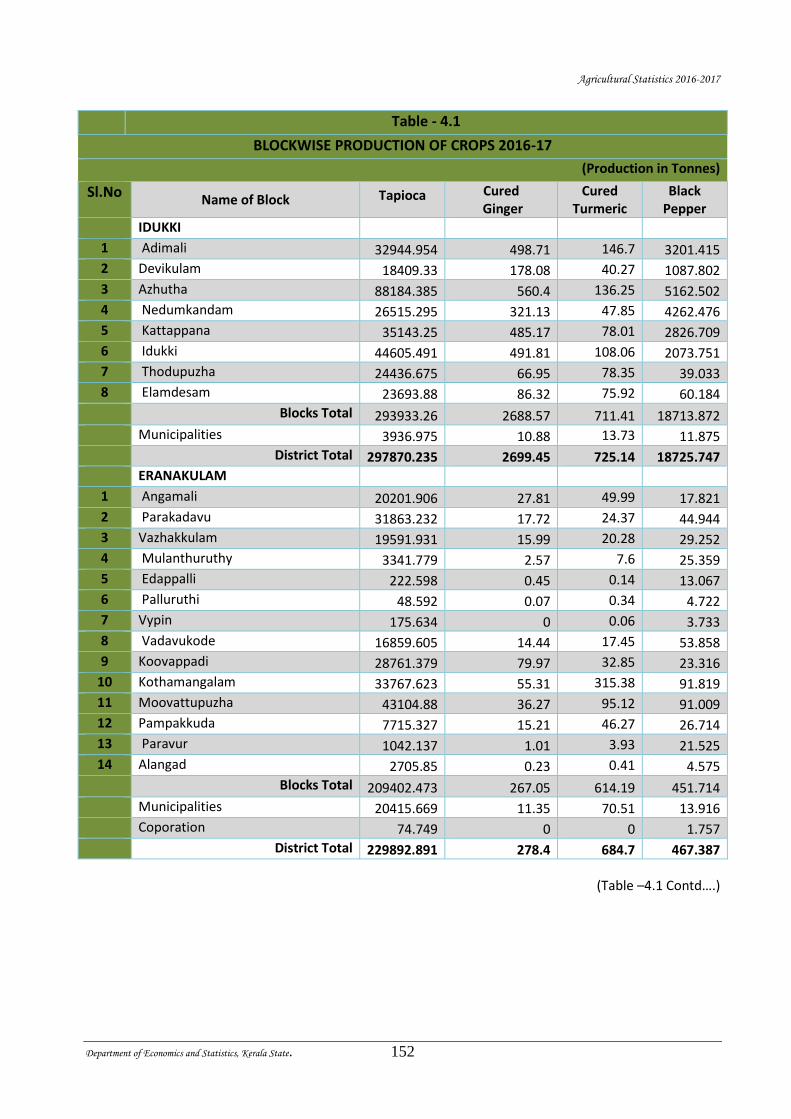
Agricultural Statistics 2016-2017
Department of Economics and Statistics, Kerala State. 152
Table - 4.1
BLOCKWISE PRODUCTION OF CROPS 2016-17
(Production in Tonnes)
Sl.No Name of Block Tapioca Cured
Ginger Cured
Turmeric Black
Pepper
IDUKKI
1 Adimali 32944.954 498.71 146.7 3201.415
2 Devikulam 18409.33 178.08 40.27 1087.802
3 Azhutha 88184.385 560.4 136.25 5162.502
4 Nedumkandam 26515.295 321.13 47.85 4262.476
5 Kattappana 35143.25 485.17 78.01 2826.709
6 Idukki 44605.491 491.81 108.06 2073.751
7 Thodupuzha 24436.675 66.95 78.35 39.033
8 Elamdesam 23693.88 86.32 75.92 60.184
Blocks Total 293933.26 2688.57 711.41 18713.872
Municipalities 3936.975 10.88 13.73 11.875
District Total 297870.235 2699.45 725.14 18725.747
ERANAKULAM
1 Angamali 20201.906 27.81 49.99 17.821
2 Parakadavu 31863.232 17.72 24.37 44.944
3 Vazhakkulam 19591.931 15.99 20.28 29.252
4 Mulanthuruthy 3341.779 2.57 7.6 25.359
5 Edappalli 222.598 0.45 0.14 13.067
6 Palluruthi 48.592 0.07 0.34 4.722
7 Vypin 175.634 0 0.06 3.733
8 Vadavukode 16859.605 14.44 17.45 53.858
9 Koovappadi 28761.379 79.97 32.85 23.316
10 Kothamangalam 33767.623 55.31 315.38 91.819
11 Moovattupuzha 43104.88 36.27 95.12 91.009
12 Pampakkuda 7715.327 15.21 46.27 26.714
13 Paravur 1042.137 1.01 3.93 21.525
14 Alangad 2705.85 0.23 0.41 4.575
Blocks Total 209402.473 267.05 614.19 451.714
Municipalities 20415.669 11.35 70.51 13.916
Coporation 74.749 0 0 1.757
District Total 229892.891 278.4 684.7 467.387
(Table –4.1 Contd….)
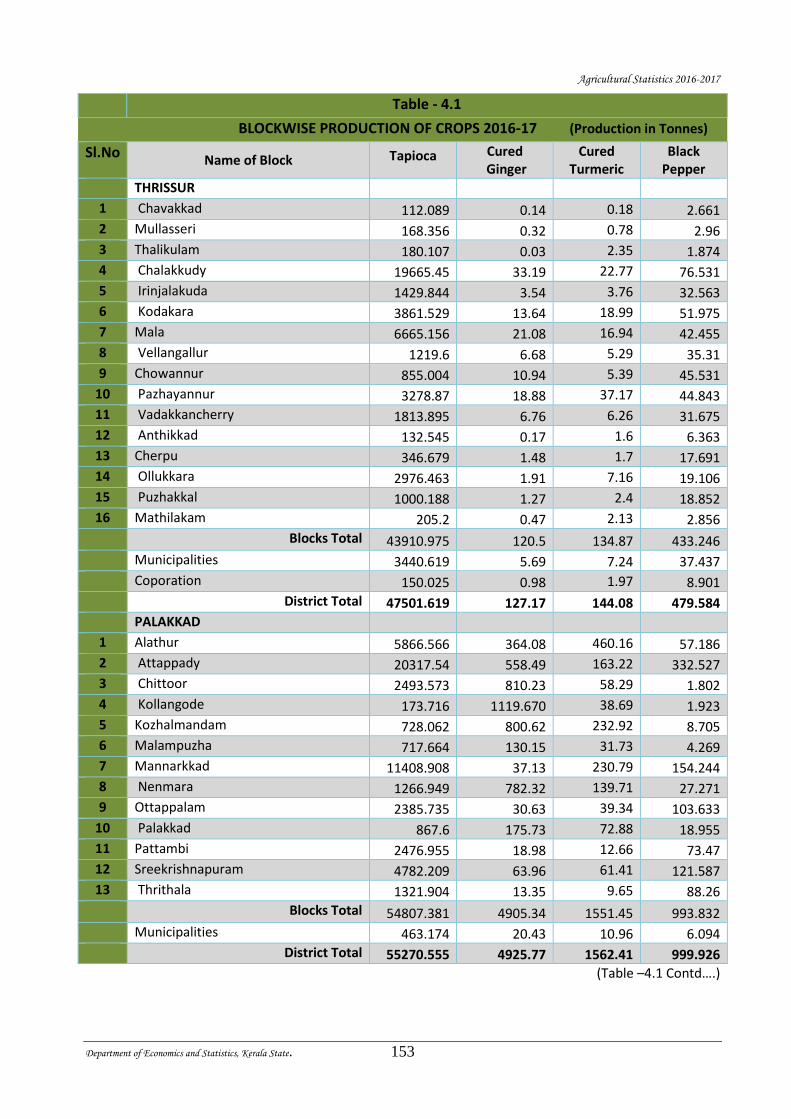
Agricultural Statistics 2016-2017
Department of Economics and Statistics, Kerala State. 153
Table - 4.1
BLOCKWISE PRODUCTION OF CROPS 2016-17 (Production in Tonnes)
Sl.No Name of Block Tapioca Cured
Ginger Cured
Turmeric Black
Pepper
THRISSUR
1 Chavakkad 112.089 0.14 0.18 2.661
2 Mullasseri 168.356 0.32 0.78 2.96
3 Thalikulam 180.107 0.03 2.35 1.874
4 Chalakkudy 19665.45 33.19 22.77 76.531
5 Irinjalakuda 1429.844 3.54 3.76 32.563
6 Kodakara 3861.529 13.64 18.99 51.975
7 Mala 6665.156 21.08 16.94 42.455
8 Vellangallur 1219.6 6.68 5.29 35.31
9 Chowannur 855.004 10.94 5.39 45.531
10 Pazhayannur 3278.87 18.88 37.17 44.843
11 Vadakkancherry 1813.895 6.76 6.26 31.675
12 Anthikkad 132.545 0.17 1.6 6.363
13 Cherpu 346.679 1.48 1.7 17.691
14 Ollukkara 2976.463 1.91 7.16 19.106
15 Puzhakkal 1000.188 1.27 2.4 18.852
16 Mathilakam 205.2 0.47 2.13 2.856
Blocks Total 43910.975 120.5 134.87 433.246
Municipalities 3440.619 5.69 7.24 37.437
Coporation 150.025 0.98 1.97 8.901
District Total 47501.619 127.17 144.08 479.584
PALAKKAD
1 Alathur 5866.566 364.08 460.16 57.186
2 Attappady 20317.54 558.49 163.22 332.527
3 Chittoor 2493.573 810.23 58.29 1.802
4 Kollangode 173.716 1119.670 38.69 1.923
5 Kozhalmandam 728.062 800.62 232.92 8.705
6 Malampuzha 717.664 130.15 31.73 4.269
7 Mannarkkad 11408.908 37.13 230.79 154.244
8 Nenmara 1266.949 782.32 139.71 27.271
9 Ottappalam 2385.735 30.63 39.34 103.633
10 Palakkad 867.6 175.73 72.88 18.955
11 Pattambi 2476.955 18.98 12.66 73.47
12 Sreekrishnapuram 4782.209 63.96 61.41 121.587
13 Thrithala 1321.904 13.35 9.65 88.26
Blocks Total 54807.381 4905.34 1551.45 993.832
Municipalities 463.174 20.43 10.96 6.094
District Total 55270.555 4925.77 1562.41 999.926
(Table –4.1 Contd….)
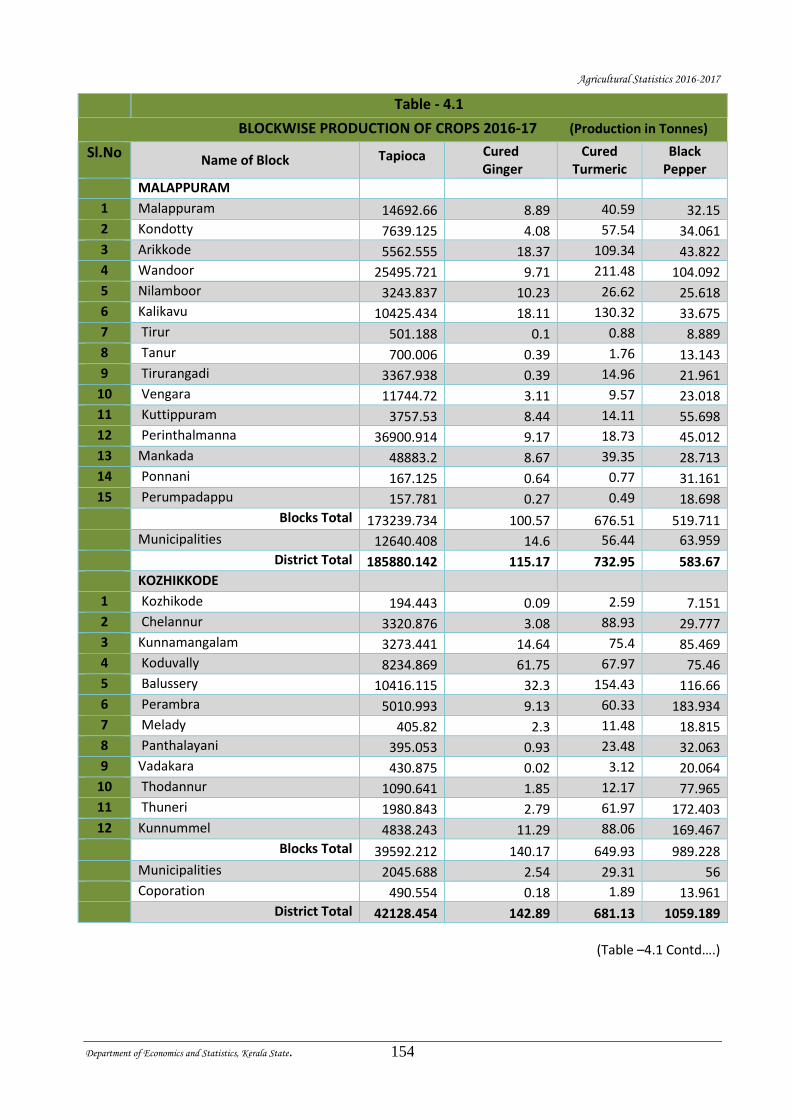
Agricultural Statistics 2016-2017
Department of Economics and Statistics, Kerala State. 154
Table - 4.1
BLOCKWISE PRODUCTION OF CROPS 2016-17 (Production in Tonnes)
Sl.No Name of Block Tapioca Cured
Ginger Cured
Turmeric Black
Pepper
MALAPPURAM
1 Malappuram 14692.66 8.89 40.59 32.15
2 Kondotty 7639.125 4.08 57.54 34.061
3 Arikkode 5562.555 18.37 109.34 43.822
4 Wandoor 25495.721 9.71 211.48 104.092
5 Nilamboor 3243.837 10.23 26.62 25.618
6 Kalikavu 10425.434 18.11 130.32 33.675
7 Tirur 501.188 0.1 0.88 8.889
8 Tanur 700.006 0.39 1.76 13.143
9 Tirurangadi 3367.938 0.39 14.96 21.961
10 Vengara 11744.72 3.11 9.57 23.018
11 Kuttippuram 3757.53 8.44 14.11 55.698
12 Perinthalmanna 36900.914 9.17 18.73 45.012
13 Mankada 48883.2 8.67 39.35 28.713
14 Ponnani 167.125 0.64 0.77 31.161
15 Perumpadappu 157.781 0.27 0.49 18.698
Blocks Total 173239.734 100.57 676.51 519.711
Municipalities 12640.408 14.6 56.44 63.959
District Total 185880.142 115.17 732.95 583.67
KOZHIKKODE
1 Kozhikode 194.443 0.09 2.59 7.151
2 Chelannur 3320.876 3.08 88.93 29.777
3 Kunnamangalam 3273.441 14.64 75.4 85.469
4 Koduvally 8234.869 61.75 67.97 75.46
5 Balussery 10416.115 32.3 154.43 116.66
6 Perambra 5010.993 9.13 60.33 183.934
7 Melady 405.82 2.3 11.48 18.815
8 Panthalayani 395.053 0.93 23.48 32.063
9 Vadakara 430.875 0.02 3.12 20.064
10 Thodannur 1090.641 1.85 12.17 77.965
11 Thuneri 1980.843 2.79 61.97 172.403
12 Kunnummel 4838.243 11.29 88.06 169.467
Blocks Total 39592.212 140.17 649.93 989.228
Municipalities 2045.688 2.54 29.31 56
Coporation 490.554 0.18 1.89 13.961
District Total 42128.454 142.89 681.13 1059.189
(Table –4.1 Contd….)
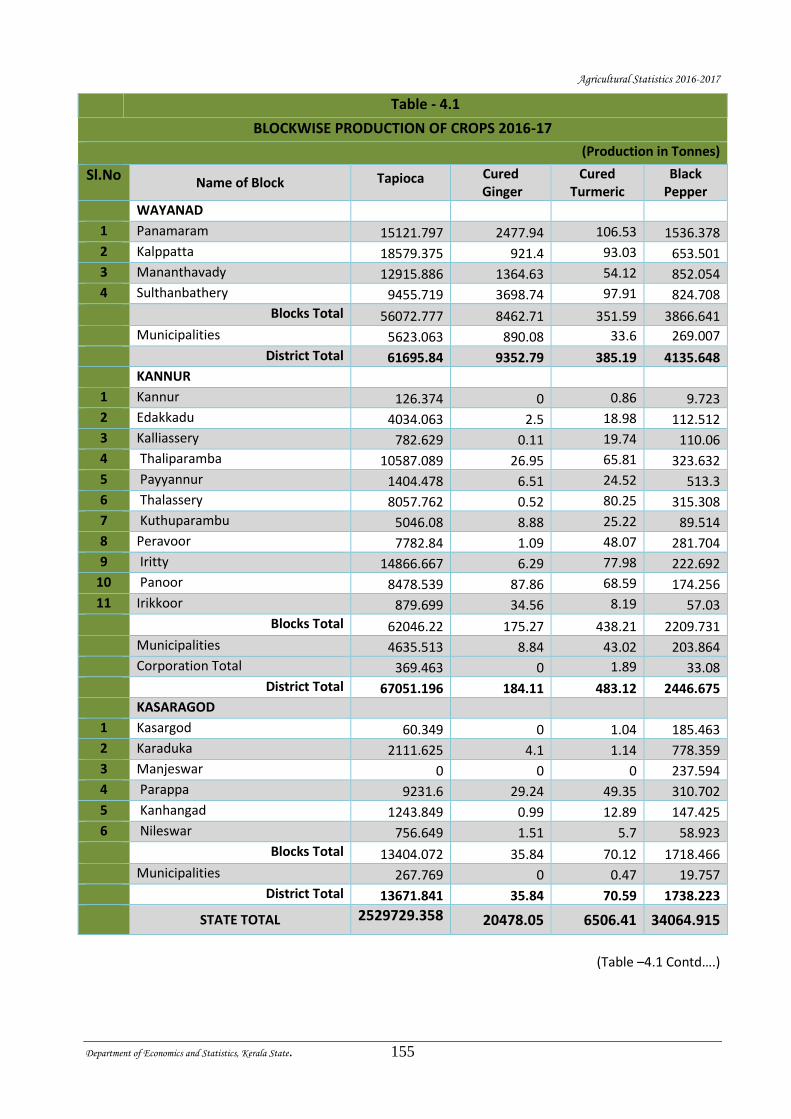
Agricultural Statistics 2016-2017
Department of Economics and Statistics, Kerala State. 155
Table - 4.1
BLOCKWISE PRODUCTION OF CROPS 2016-17
(Production in Tonnes)
Sl.No Name of Block Tapioca Cured
Ginger Cured
Turmeric Black
Pepper
WAYANAD
1 Panamaram 15121.797 2477.94 106.53 1536.378
2 Kalppatta 18579.375 921.4 93.03 653.501
3 Mananthavady 12915.886 1364.63 54.12 852.054
4 Sulthanbathery 9455.719 3698.74 97.91 824.708
Blocks Total 56072.777 8462.71 351.59 3866.641
Municipalities 5623.063 890.08 33.6 269.007
District Total 61695.84 9352.79 385.19 4135.648
KANNUR
1 Kannur 126.374 0 0.86 9.723
2 Edakkadu 4034.063 2.5 18.98 112.512
3 Kalliassery 782.629 0.11 19.74 110.06
4 Thaliparamba 10587.089 26.95 65.81 323.632
5 Payyannur 1404.478 6.51 24.52 513.3
6 Thalassery 8057.762 0.52 80.25 315.308
7 Kuthuparambu 5046.08 8.88 25.22 89.514
8 Peravoor 7782.84 1.09 48.07 281.704
9 Iritty 14866.667 6.29 77.98 222.692
10 Panoor 8478.539 87.86 68.59 174.256
11 Irikkoor 879.699 34.56 8.19 57.03
Blocks Total 62046.22 175.27 438.21 2209.731
Municipalities 4635.513 8.84 43.02 203.864
Corporation Total 369.463 0 1.89 33.08
District Total 67051.196 184.11 483.12 2446.675
KASARAGOD
1 Kasargod 60.349 0 1.04 185.463
2 Karaduka 2111.625 4.1 1.14 778.359
3 Manjeswar 0 0 0 237.594
4 Parappa 9231.6 29.24 49.35 310.702
5 Kanhangad 1243.849 0.99 12.89 147.425
6 Nileswar 756.649 1.51 5.7 58.923
Blocks Total 13404.072 35.84 70.12 1718.466
Municipalities 267.769 0 0.47 19.757
District Total 13671.841 35.84 70.59 1738.223
STATE TOTAL 2529729.358 20478.05 6506.41 34064.915
(Table –4.1 Contd….)
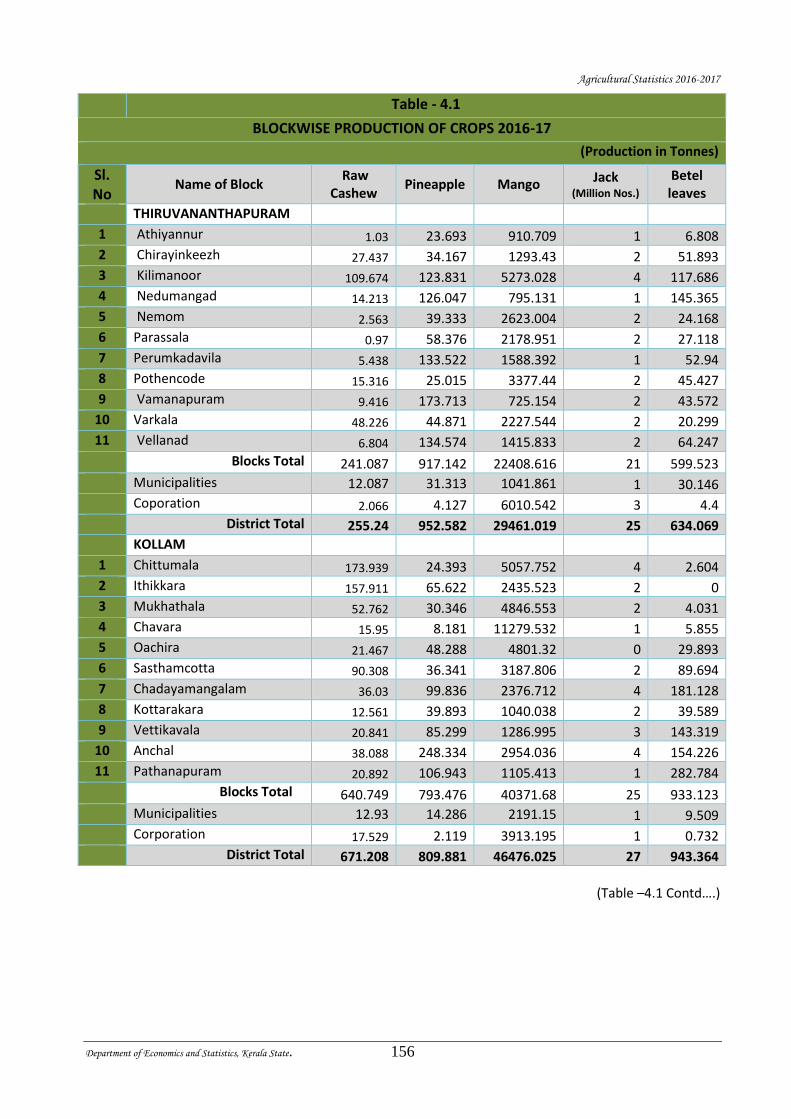
Agricultural Statistics 2016-2017
Department of Economics and Statistics, Kerala State. 156
Table - 4.1
BLOCKWISE PRODUCTION OF CROPS 2016-17
(Production in Tonnes)
Sl. No
Name of Block Raw
Cashew Pineapple Mango Jack
(Million Nos.) Betel
leaves
THIRUVANANTHAPURAM
1 Athiyannur 1.03 23.693 910.709 1 6.808
2 Chirayinkeezh 27.437 34.167 1293.43 2 51.893
3 Kilimanoor 109.674 123.831 5273.028 4 117.686
4 Nedumangad 14.213 126.047 795.131 1 145.365
5 Nemom 2.563 39.333 2623.004 2 24.168
6 Parassala 0.97 58.376 2178.951 2 27.118
7 Perumkadavila 5.438 133.522 1588.392 1 52.94
8 Pothencode 15.316 25.015 3377.44 2 45.427
9 Vamanapuram 9.416 173.713 725.154 2 43.572
10 Varkala 48.226 44.871 2227.544 2 20.299
11 Vellanad 6.804 134.574 1415.833 2 64.247
Blocks Total 241.087 917.142 22408.616 21 599.523
Municipalities 12.087 31.313 1041.861 1 30.146
Coporation 2.066 4.127 6010.542 3 4.4
District Total 255.24 952.582 29461.019 25 634.069
KOLLAM
1 Chittumala 173.939 24.393 5057.752 4 2.604
2 Ithikkara 157.911 65.622 2435.523 2 0
3 Mukhathala 52.762 30.346 4846.553 2 4.031
4 Chavara 15.95 8.181 11279.532 1 5.855
5 Oachira 21.467 48.288 4801.32 0 29.893
6 Sasthamcotta 90.308 36.341 3187.806 2 89.694
7 Chadayamangalam 36.03 99.836 2376.712 4 181.128
8 Kottarakara 12.561 39.893 1040.038 2 39.589
9 Vettikavala 20.841 85.299 1286.995 3 143.319
10 Anchal 38.088 248.334 2954.036 4 154.226
11 Pathanapuram 20.892 106.943 1105.413 1 282.784
Blocks Total 640.749 793.476 40371.68 25 933.123
Municipalities 12.93 14.286 2191.15 1 9.509
Corporation 17.529 2.119 3913.195 1 0.732
District Total 671.208 809.881 46476.025 27 943.364
(Table –4.1 Contd….)
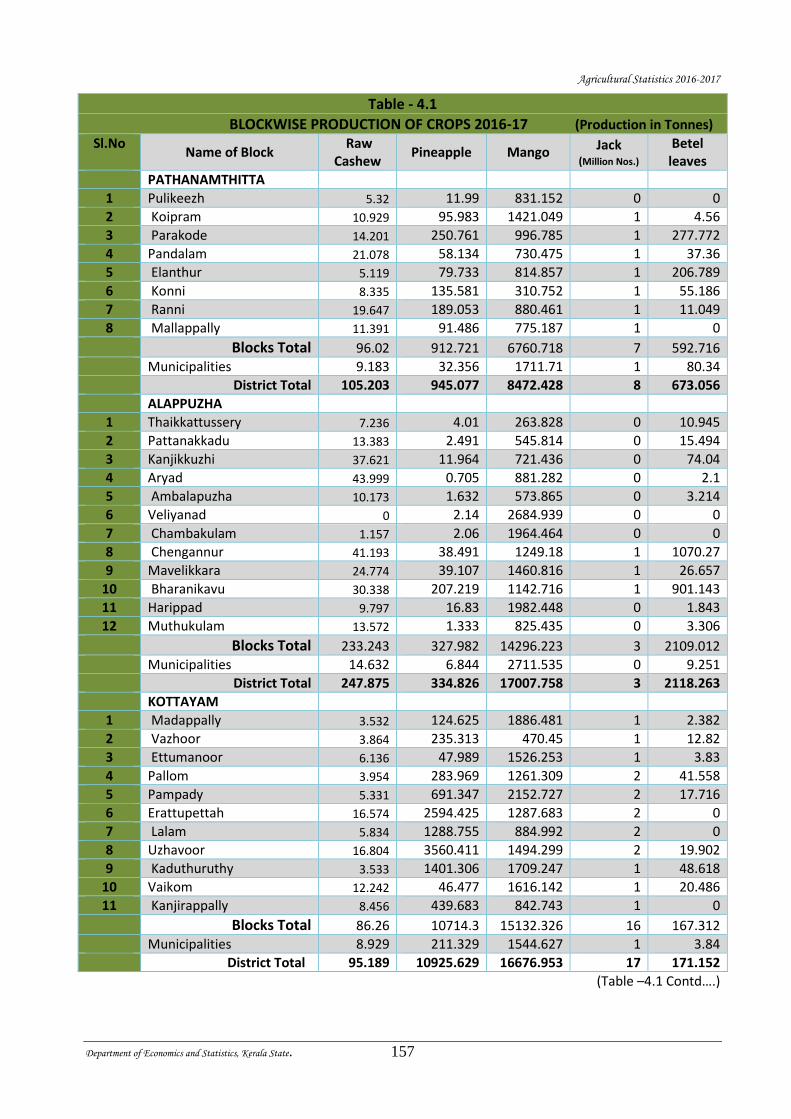
Agricultural Statistics 2016-2017
Department of Economics and Statistics, Kerala State. 157
Table - 4.1
BLOCKWISE PRODUCTION OF CROPS 2016-17 (Production in Tonnes) Sl.No
Name of Block Raw
Cashew Pineapple Mango
Jack (Million Nos.)
Betel leaves
PATHANAMTHITTA
1 Pulikeezh 5.32 11.99 831.152 0 0
2 Koipram 10.929 95.983 1421.049 1 4.56
3 Parakode 14.201 250.761 996.785 1 277.772
4 Pandalam 21.078 58.134 730.475 1 37.36
5 Elanthur 5.119 79.733 814.857 1 206.789
6 Konni 8.335 135.581 310.752 1 55.186
7 Ranni 19.647 189.053 880.461 1 11.049
8 Mallappally 11.391 91.486 775.187 1 0
Blocks Total 96.02 912.721 6760.718 7 592.716
Municipalities 9.183 32.356 1711.71 1 80.34
District Total 105.203 945.077 8472.428 8 673.056
ALAPPUZHA
1 Thaikkattussery 7.236 4.01 263.828 0 10.945
2 Pattanakkadu 13.383 2.491 545.814 0 15.494
3 Kanjikkuzhi 37.621 11.964 721.436 0 74.04
4 Aryad 43.999 0.705 881.282 0 2.1
5 Ambalapuzha 10.173 1.632 573.865 0 3.214
6 Veliyanad 0 2.14 2684.939 0 0
7 Chambakulam 1.157 2.06 1964.464 0 0
8 Chengannur 41.193 38.491 1249.18 1 1070.27
9 Mavelikkara 24.774 39.107 1460.816 1 26.657
10 Bharanikavu 30.338 207.219 1142.716 1 901.143
11 Harippad 9.797 16.83 1982.448 0 1.843
12 Muthukulam 13.572 1.333 825.435 0 3.306
Blocks Total 233.243 327.982 14296.223 3 2109.012
Municipalities 14.632 6.844 2711.535 0 9.251
District Total 247.875 334.826 17007.758 3 2118.263
KOTTAYAM
1 Madappally 3.532 124.625 1886.481 1 2.382
2 Vazhoor 3.864 235.313 470.45 1 12.82
3 Ettumanoor 6.136 47.989 1526.253 1 3.83
4 Pallom 3.954 283.969 1261.309 2 41.558
5 Pampady 5.331 691.347 2152.727 2 17.716
6 Erattupettah 16.574 2594.425 1287.683 2 0
7 Lalam 5.834 1288.755 884.992 2 0
8 Uzhavoor 16.804 3560.411 1494.299 2 19.902
9 Kaduthuruthy 3.533 1401.306 1709.247 1 48.618
10 Vaikom 12.242 46.477 1616.142 1 20.486
11 Kanjirappally 8.456 439.683 842.743 1 0
Blocks Total 86.26 10714.3 15132.326 16 167.312
Municipalities 8.929 211.329 1544.627 1 3.84
District Total 95.189 10925.629 16676.953 17 171.152
(Table –4.1 Contd….)
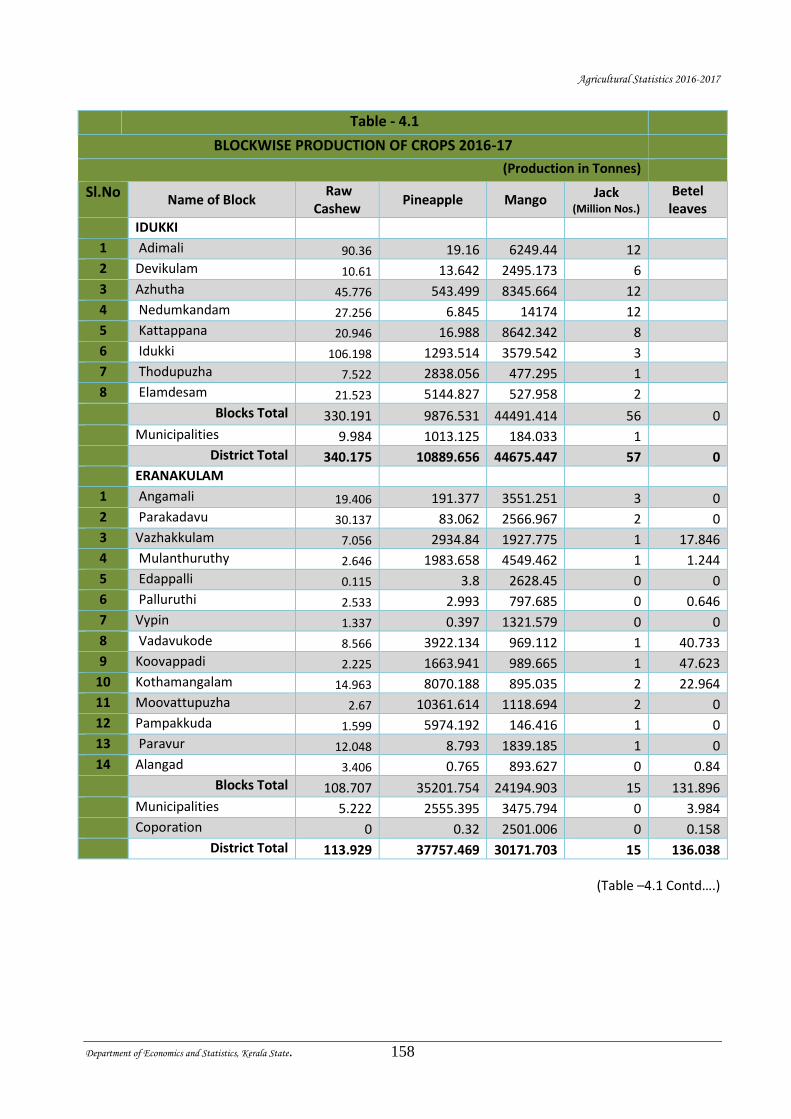
Agricultural Statistics 2016-2017
Department of Economics and Statistics, Kerala State. 158
Table - 4.1
BLOCKWISE PRODUCTION OF CROPS 2016-17
(Production in Tonnes)
Sl.No Name of Block
Raw Cashew
Pineapple Mango Jack
(Million Nos.) Betel
leaves
IDUKKI
1 Adimali 90.36 19.16 6249.44 12
2 Devikulam 10.61 13.642 2495.173 6
3 Azhutha 45.776 543.499 8345.664 12
4 Nedumkandam 27.256 6.845 14174 12
5 Kattappana 20.946 16.988 8642.342 8
6 Idukki 106.198 1293.514 3579.542 3
7 Thodupuzha 7.522 2838.056 477.295 1
8 Elamdesam 21.523 5144.827 527.958 2
Blocks Total 330.191 9876.531 44491.414 56 0
Municipalities 9.984 1013.125 184.033 1
District Total 340.175 10889.656 44675.447 57 0
ERANAKULAM
1 Angamali 19.406 191.377 3551.251 3 0
2 Parakadavu 30.137 83.062 2566.967 2 0
3 Vazhakkulam 7.056 2934.84 1927.775 1 17.846
4 Mulanthuruthy 2.646 1983.658 4549.462 1 1.244
5 Edappalli 0.115 3.8 2628.45 0 0
6 Palluruthi 2.533 2.993 797.685 0 0.646
7 Vypin 1.337 0.397 1321.579 0 0
8 Vadavukode 8.566 3922.134 969.112 1 40.733
9 Koovappadi 2.225 1663.941 989.665 1 47.623
10 Kothamangalam 14.963 8070.188 895.035 2 22.964
11 Moovattupuzha 2.67 10361.614 1118.694 2 0
12 Pampakkuda 1.599 5974.192 146.416 1 0
13 Paravur 12.048 8.793 1839.185 1 0
14 Alangad 3.406 0.765 893.627 0 0.84
Blocks Total 108.707 35201.754 24194.903 15 131.896
Municipalities 5.222 2555.395 3475.794 0 3.984
Coporation 0 0.32 2501.006 0 0.158
District Total 113.929 37757.469 30171.703 15 136.038
(Table –4.1 Contd….)
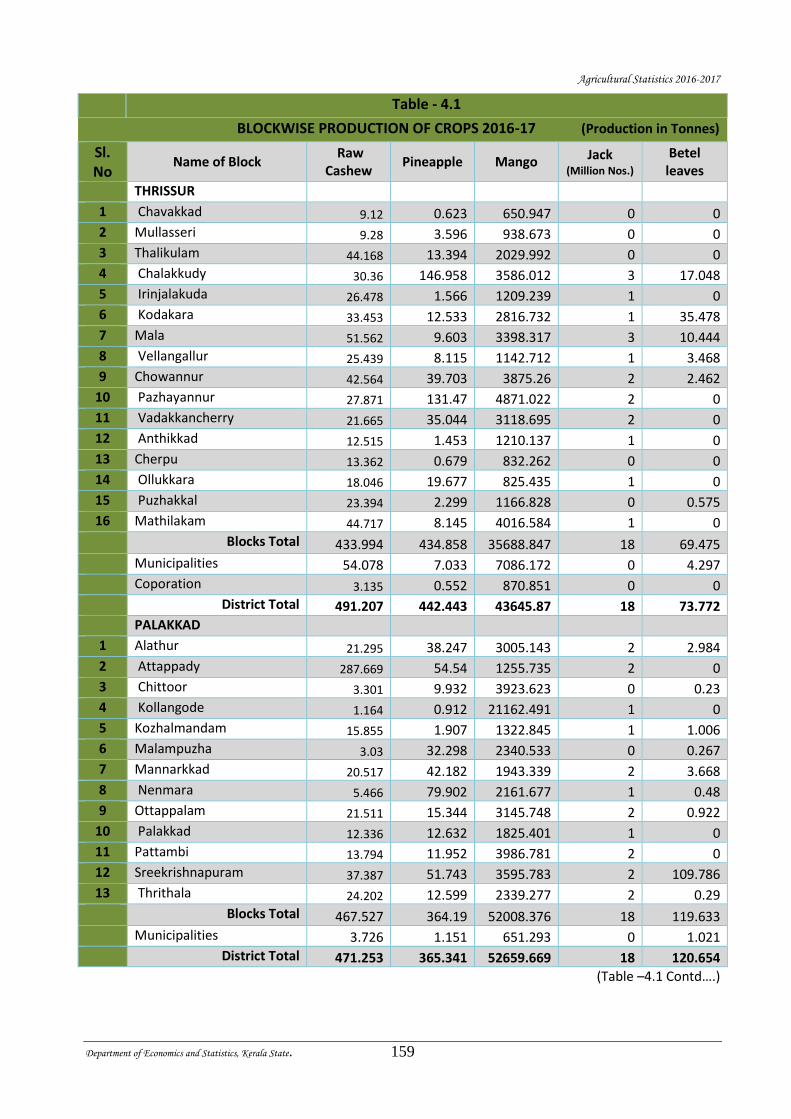
Agricultural Statistics 2016-2017
Department of Economics and Statistics, Kerala State. 159
Table - 4.1
BLOCKWISE PRODUCTION OF CROPS 2016-17 (Production in Tonnes)
Sl. No
Name of Block Raw
Cashew Pineapple Mango Jack
(Million Nos.) Betel
leaves
THRISSUR
1 Chavakkad 9.12 0.623 650.947 0 0
2 Mullasseri 9.28 3.596 938.673 0 0
3 Thalikulam 44.168 13.394 2029.992 0 0
4 Chalakkudy 30.36 146.958 3586.012 3 17.048
5 Irinjalakuda 26.478 1.566 1209.239 1 0
6 Kodakara 33.453 12.533 2816.732 1 35.478
7 Mala 51.562 9.603 3398.317 3 10.444
8 Vellangallur 25.439 8.115 1142.712 1 3.468
9 Chowannur 42.564 39.703 3875.26 2 2.462
10 Pazhayannur 27.871 131.47 4871.022 2 0
11 Vadakkancherry 21.665 35.044 3118.695 2 0
12 Anthikkad 12.515 1.453 1210.137 1 0
13 Cherpu 13.362 0.679 832.262 0 0
14 Ollukkara 18.046 19.677 825.435 1 0
15 Puzhakkal 23.394 2.299 1166.828 0 0.575
16 Mathilakam 44.717 8.145 4016.584 1 0
Blocks Total 433.994 434.858 35688.847 18 69.475
Municipalities 54.078 7.033 7086.172 0 4.297
Coporation 3.135 0.552 870.851 0 0
District Total 491.207 442.443 43645.87 18 73.772
PALAKKAD
1 Alathur 21.295 38.247 3005.143 2 2.984
2 Attappady 287.669 54.54 1255.735 2 0
3 Chittoor 3.301 9.932 3923.623 0 0.23
4 Kollangode 1.164 0.912 21162.491 1 0
5 Kozhalmandam 15.855 1.907 1322.845 1 1.006
6 Malampuzha 3.03 32.298 2340.533 0 0.267
7 Mannarkkad 20.517 42.182 1943.339 2 3.668
8 Nenmara 5.466 79.902 2161.677 1 0.48
9 Ottappalam 21.511 15.344 3145.748 2 0.922
10 Palakkad 12.336 12.632 1825.401 1 0
11 Pattambi 13.794 11.952 3986.781 2 0
12 Sreekrishnapuram 37.387 51.743 3595.783 2 109.786
13 Thrithala 24.202 12.599 2339.277 2 0.29
Blocks Total 467.527 364.19 52008.376 18 119.633
Municipalities 3.726 1.151 651.293 0 1.021
District Total 471.253 365.341 52659.669 18 120.654
(Table –4.1 Contd….)
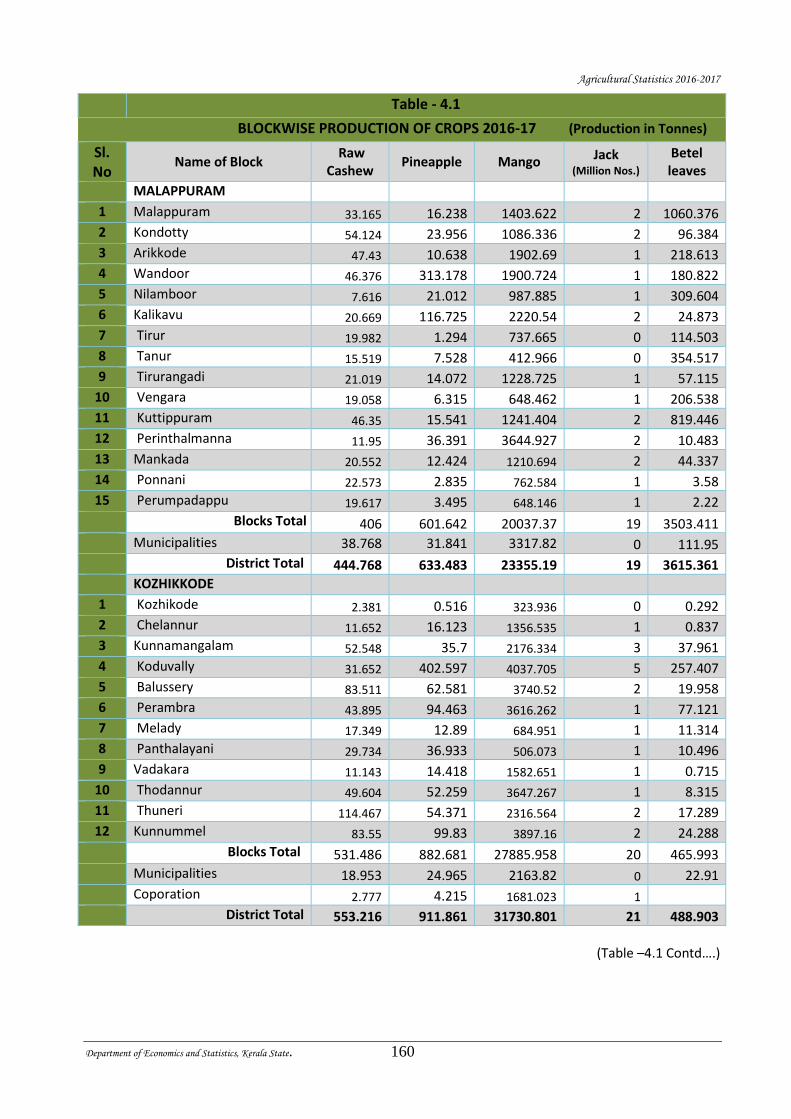
Agricultural Statistics 2016-2017
Department of Economics and Statistics, Kerala State. 160
Table - 4.1
BLOCKWISE PRODUCTION OF CROPS 2016-17 (Production in Tonnes)
Sl. No
Name of Block Raw
Cashew Pineapple Mango Jack
(Million Nos.) Betel leaves
MALAPPURAM
1 Malappuram 33.165 16.238 1403.622 2 1060.376
2 Kondotty 54.124 23.956 1086.336 2 96.384
3 Arikkode 47.43 10.638 1902.69 1 218.613
4 Wandoor 46.376 313.178 1900.724 1 180.822
5 Nilamboor 7.616 21.012 987.885 1 309.604
6 Kalikavu 20.669 116.725 2220.54 2 24.873
7 Tirur 19.982 1.294 737.665 0 114.503
8 Tanur 15.519 7.528 412.966 0 354.517
9 Tirurangadi 21.019 14.072 1228.725 1 57.115
10 Vengara 19.058 6.315 648.462 1 206.538
11 Kuttippuram 46.35 15.541 1241.404 2 819.446
12 Perinthalmanna 11.95 36.391 3644.927 2 10.483
13 Mankada 20.552 12.424 1210.694 2 44.337
14 Ponnani 22.573 2.835 762.584 1 3.58
15 Perumpadappu 19.617 3.495 648.146 1 2.22
Blocks Total 406 601.642 20037.37 19 3503.411
Municipalities 38.768 31.841 3317.82 0 111.95
District Total 444.768 633.483 23355.19 19 3615.361
KOZHIKKODE
1 Kozhikode 2.381 0.516 323.936 0 0.292
2 Chelannur 11.652 16.123 1356.535 1 0.837
3 Kunnamangalam 52.548 35.7 2176.334 3 37.961
4 Koduvally 31.652 402.597 4037.705 5 257.407
5 Balussery 83.511 62.581 3740.52 2 19.958
6 Perambra 43.895 94.463 3616.262 1 77.121
7 Melady 17.349 12.89 684.951 1 11.314
8 Panthalayani 29.734 36.933 506.073 1 10.496
9 Vadakara 11.143 14.418 1582.651 1 0.715
10 Thodannur 49.604 52.259 3647.267 1 8.315
11 Thuneri 114.467 54.371 2316.564 2 17.289
12 Kunnummel 83.55 99.83 3897.16 2 24.288
Blocks Total 531.486 882.681 27885.958 20 465.993
Municipalities 18.953 24.965 2163.82 0 22.91
Coporation 2.777 4.215 1681.023 1
District Total 553.216 911.861 31730.801 21 488.903
(Table –4.1 Contd….)
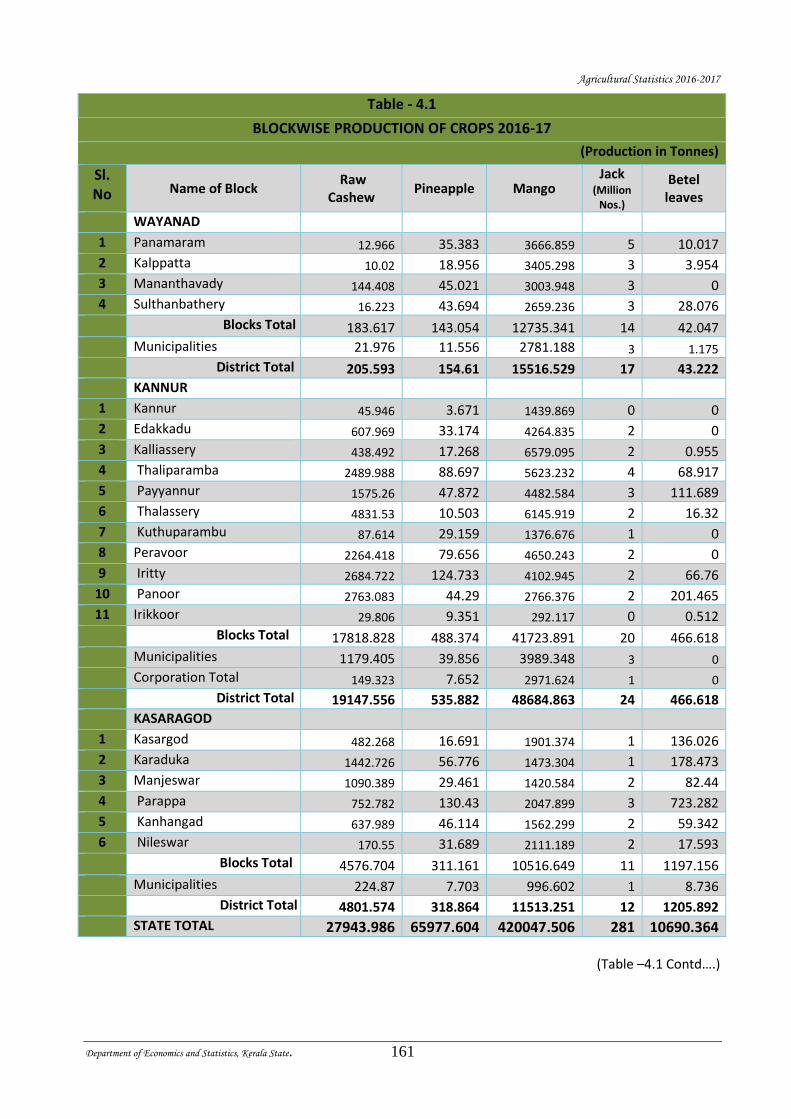
Agricultural Statistics 2016-2017
Department of Economics and Statistics, Kerala State. 161
Table - 4.1
BLOCKWISE PRODUCTION OF CROPS 2016-17
(Production in Tonnes)
Sl. No Name of Block
Raw Cashew
Pineapple Mango Jack
(Million Nos.)
Betel leaves
WAYANAD
1 Panamaram 12.966 35.383 3666.859 5 10.017
2 Kalppatta 10.02 18.956 3405.298 3 3.954
3 Mananthavady 144.408 45.021 3003.948 3 0
4 Sulthanbathery 16.223 43.694 2659.236 3 28.076
Blocks Total 183.617 143.054 12735.341 14 42.047
Municipalities 21.976 11.556 2781.188 3 1.175
District Total 205.593 154.61 15516.529 17 43.222
KANNUR
1 Kannur 45.946 3.671 1439.869 0 0
2 Edakkadu 607.969 33.174 4264.835 2 0
3 Kalliassery 438.492 17.268 6579.095 2 0.955
4 Thaliparamba 2489.988 88.697 5623.232 4 68.917
5 Payyannur 1575.26 47.872 4482.584 3 111.689
6 Thalassery 4831.53 10.503 6145.919 2 16.32
7 Kuthuparambu 87.614 29.159 1376.676 1 0
8 Peravoor 2264.418 79.656 4650.243 2 0
9 Iritty 2684.722 124.733 4102.945 2 66.76
10 Panoor 2763.083 44.29 2766.376 2 201.465
11 Irikkoor 29.806 9.351 292.117 0 0.512
Blocks Total 17818.828 488.374 41723.891 20 466.618
Municipalities 1179.405 39.856 3989.348 3 0
Corporation Total 149.323 7.652 2971.624 1 0
District Total 19147.556 535.882 48684.863 24 466.618
KASARAGOD
1 Kasargod 482.268 16.691 1901.374 1 136.026
2 Karaduka 1442.726 56.776 1473.304 1 178.473
3 Manjeswar 1090.389 29.461 1420.584 2 82.44
4 Parappa 752.782 130.43 2047.899 3 723.282
5 Kanhangad 637.989 46.114 1562.299 2 59.342
6 Nileswar 170.55 31.689 2111.189 2 17.593
Blocks Total 4576.704 311.161 10516.649 11 1197.156
Municipalities 224.87 7.703 996.602 1 8.736
District Total 4801.574 318.864 11513.251 12 1205.892
STATE TOTAL 27943.986 65977.604 420047.506 281 10690.364
(Table –4.1 Contd….)
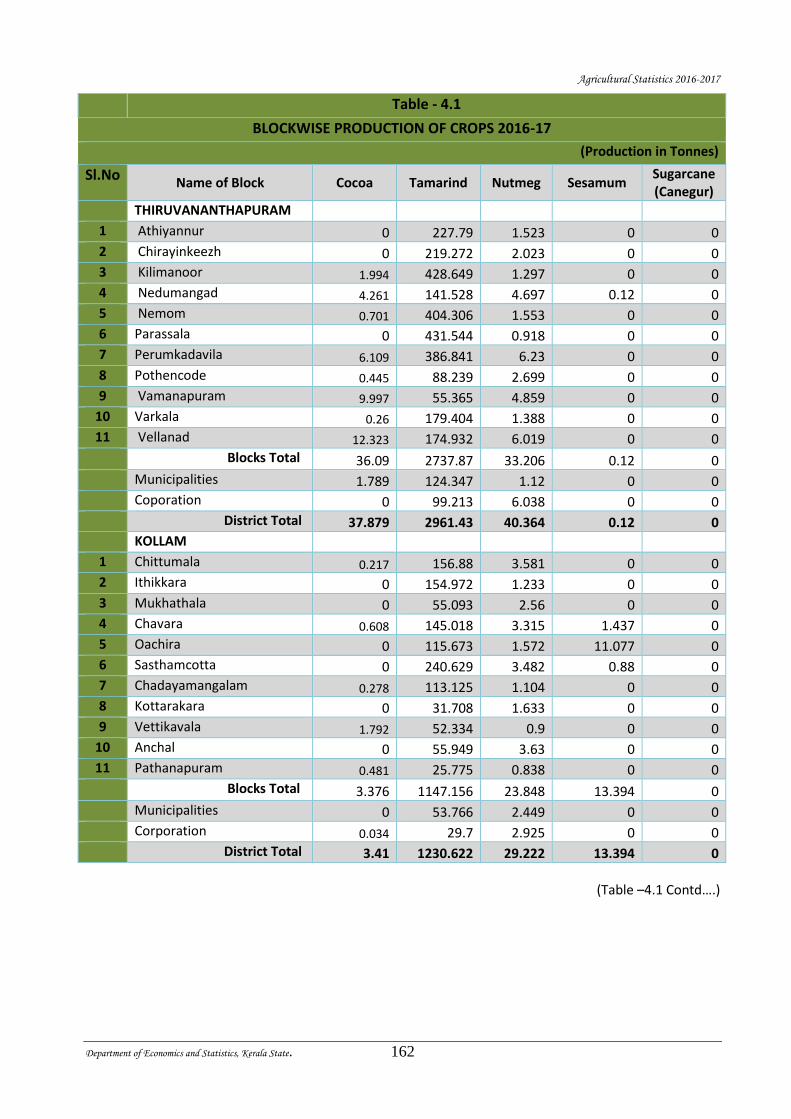
Agricultural Statistics 2016-2017
Department of Economics and Statistics, Kerala State. 162
Table - 4.1
BLOCKWISE PRODUCTION OF CROPS 2016-17
(Production in Tonnes)
Sl.No Name of Block Cocoa Tamarind Nutmeg Sesamum
Sugarcane (Canegur)
THIRUVANANTHAPURAM
1 Athiyannur 0 227.79 1.523 0 0
2 Chirayinkeezh 0 219.272 2.023 0 0
3 Kilimanoor 1.994 428.649 1.297 0 0
4 Nedumangad 4.261 141.528 4.697 0.12 0
5 Nemom 0.701 404.306 1.553 0 0
6 Parassala 0 431.544 0.918 0 0
7 Perumkadavila 6.109 386.841 6.23 0 0
8 Pothencode 0.445 88.239 2.699 0 0
9 Vamanapuram 9.997 55.365 4.859 0 0
10 Varkala 0.26 179.404 1.388 0 0
11 Vellanad 12.323 174.932 6.019 0 0
Blocks Total 36.09 2737.87 33.206 0.12 0
Municipalities 1.789 124.347 1.12 0 0
Coporation 0 99.213 6.038 0 0
District Total 37.879 2961.43 40.364 0.12 0
KOLLAM
1 Chittumala 0.217 156.88 3.581 0 0
2 Ithikkara 0 154.972 1.233 0 0
3 Mukhathala 0 55.093 2.56 0 0
4 Chavara 0.608 145.018 3.315 1.437 0
5 Oachira 0 115.673 1.572 11.077 0
6 Sasthamcotta 0 240.629 3.482 0.88 0
7 Chadayamangalam 0.278 113.125 1.104 0 0
8 Kottarakara 0 31.708 1.633 0 0
9 Vettikavala 1.792 52.334 0.9 0 0
10 Anchal 0 55.949 3.63 0 0
11 Pathanapuram 0.481 25.775 0.838 0 0
Blocks Total 3.376 1147.156 23.848 13.394 0
Municipalities 0 53.766 2.449 0 0
Corporation 0.034 29.7 2.925 0 0
District Total 3.41 1230.622 29.222 13.394 0
(Table –4.1 Contd….)
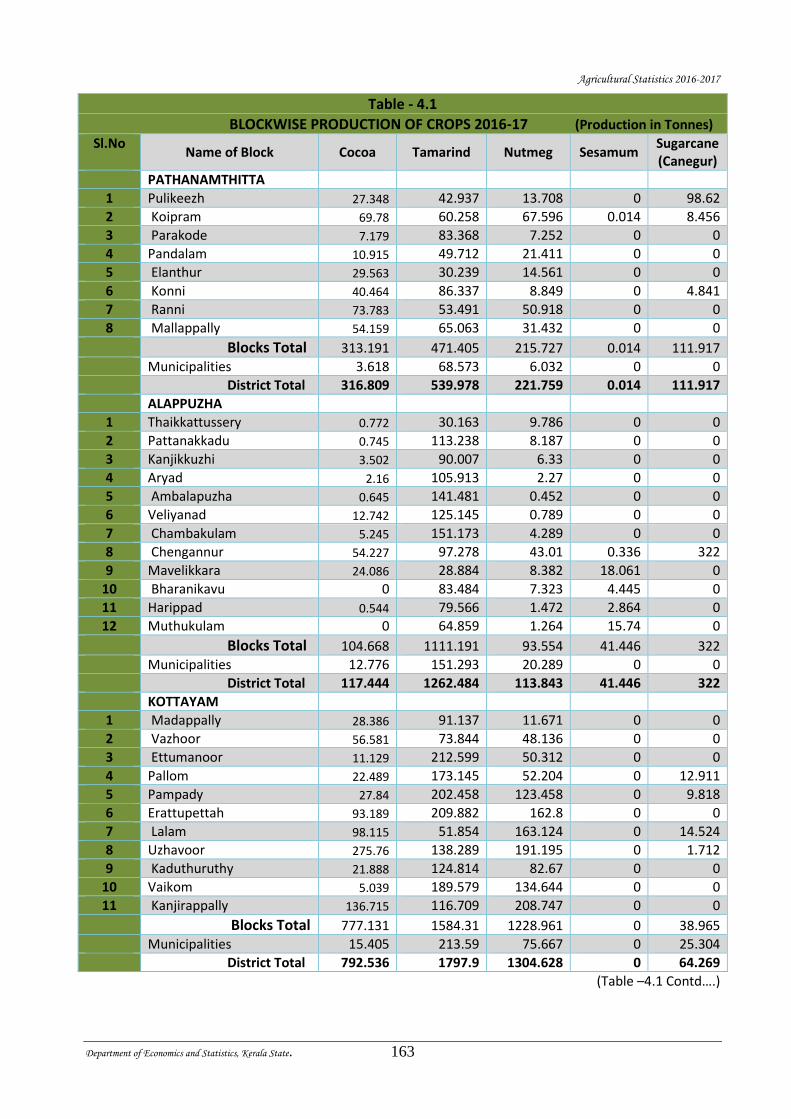
Agricultural Statistics 2016-2017
Department of Economics and Statistics, Kerala State. 163
Table - 4.1
BLOCKWISE PRODUCTION OF CROPS 2016-17 (Production in Tonnes) Sl.No
Name of Block Cocoa Tamarind Nutmeg Sesamum Sugarcane (Canegur)
PATHANAMTHITTA
1 Pulikeezh 27.348 42.937 13.708 0 98.62
2 Koipram 69.78 60.258 67.596 0.014 8.456
3 Parakode 7.179 83.368 7.252 0 0
4 Pandalam 10.915 49.712 21.411 0 0
5 Elanthur 29.563 30.239 14.561 0 0
6 Konni 40.464 86.337 8.849 0 4.841
7 Ranni 73.783 53.491 50.918 0 0
8 Mallappally 54.159 65.063 31.432 0 0
Blocks Total 313.191 471.405 215.727 0.014 111.917
Municipalities 3.618 68.573 6.032 0 0
District Total 316.809 539.978 221.759 0.014 111.917
ALAPPUZHA
1 Thaikkattussery 0.772 30.163 9.786 0 0
2 Pattanakkadu 0.745 113.238 8.187 0 0
3 Kanjikkuzhi 3.502 90.007 6.33 0 0
4 Aryad 2.16 105.913 2.27 0 0
5 Ambalapuzha 0.645 141.481 0.452 0 0
6 Veliyanad 12.742 125.145 0.789 0 0
7 Chambakulam 5.245 151.173 4.289 0 0
8 Chengannur 54.227 97.278 43.01 0.336 322
9 Mavelikkara 24.086 28.884 8.382 18.061 0
10 Bharanikavu 0 83.484 7.323 4.445 0
11 Harippad 0.544 79.566 1.472 2.864 0
12 Muthukulam 0 64.859 1.264 15.74 0
Blocks Total 104.668 1111.191 93.554 41.446 322
Municipalities 12.776 151.293 20.289 0 0
District Total 117.444 1262.484 113.843 41.446 322
KOTTAYAM
1 Madappally 28.386 91.137 11.671 0 0
2 Vazhoor 56.581 73.844 48.136 0 0
3 Ettumanoor 11.129 212.599 50.312 0 0
4 Pallom 22.489 173.145 52.204 0 12.911
5 Pampady 27.84 202.458 123.458 0 9.818
6 Erattupettah 93.189 209.882 162.8 0 0
7 Lalam 98.115 51.854 163.124 0 14.524
8 Uzhavoor 275.76 138.289 191.195 0 1.712
9 Kaduthuruthy 21.888 124.814 82.67 0 0
10 Vaikom 5.039 189.579 134.644 0 0
11 Kanjirappally 136.715 116.709 208.747 0 0
Blocks Total 777.131 1584.31 1228.961 0 38.965
Municipalities 15.405 213.59 75.667 0 25.304
District Total 792.536 1797.9 1304.628 0 64.269
(Table –4.1 Contd….)
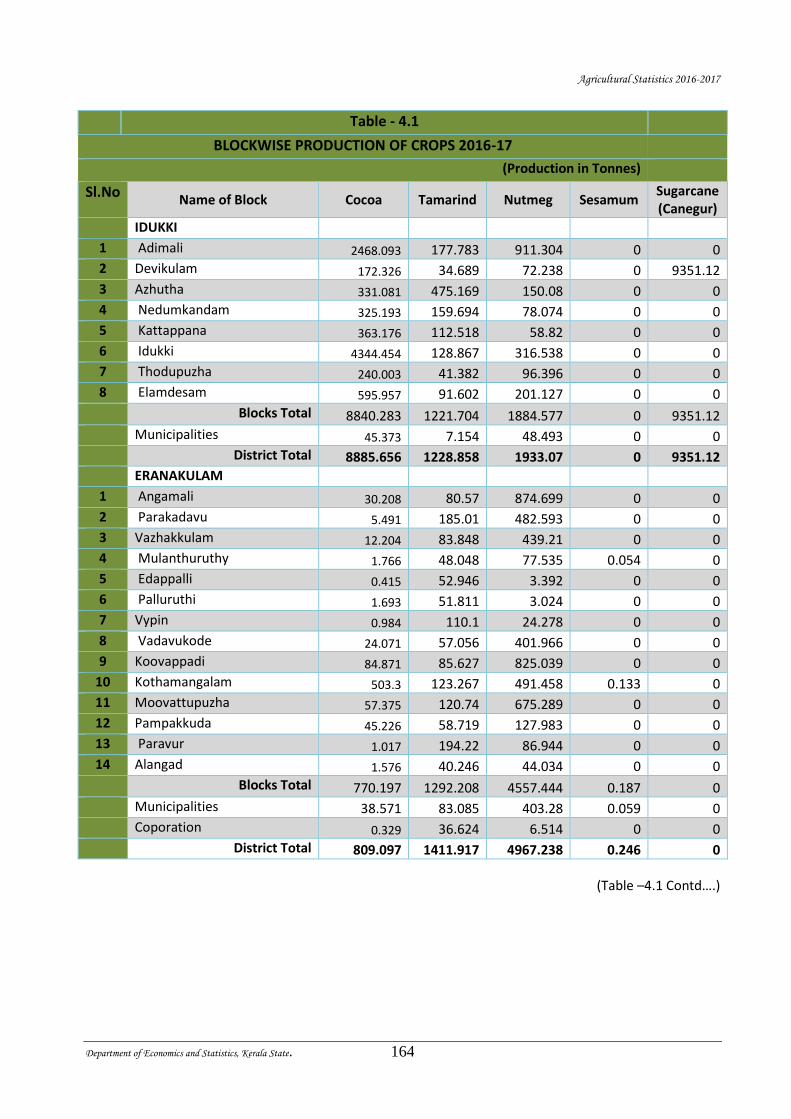
Agricultural Statistics 2016-2017
Department of Economics and Statistics, Kerala State. 164
Table - 4.1
BLOCKWISE PRODUCTION OF CROPS 2016-17
(Production in Tonnes)
Sl.No Name of Block Cocoa Tamarind Nutmeg Sesamum
Sugarcane (Canegur)
IDUKKI
1 Adimali 2468.093 177.783 911.304 0 0
2 Devikulam 172.326 34.689 72.238 0 9351.12
3 Azhutha 331.081 475.169 150.08 0 0
4 Nedumkandam 325.193 159.694 78.074 0 0
5 Kattappana 363.176 112.518 58.82 0 0
6 Idukki 4344.454 128.867 316.538 0 0
7 Thodupuzha 240.003 41.382 96.396 0 0
8 Elamdesam 595.957 91.602 201.127 0 0
Blocks Total 8840.283 1221.704 1884.577 0 9351.12
Municipalities 45.373 7.154 48.493 0 0
District Total 8885.656 1228.858 1933.07 0 9351.12
ERANAKULAM
1 Angamali 30.208 80.57 874.699 0 0
2 Parakadavu 5.491 185.01 482.593 0 0
3 Vazhakkulam 12.204 83.848 439.21 0 0
4 Mulanthuruthy 1.766 48.048 77.535 0.054 0
5 Edappalli 0.415 52.946 3.392 0 0
6 Palluruthi 1.693 51.811 3.024 0 0
7 Vypin 0.984 110.1 24.278 0 0
8 Vadavukode 24.071 57.056 401.966 0 0
9 Koovappadi 84.871 85.627 825.039 0 0
10 Kothamangalam 503.3 123.267 491.458 0.133 0
11 Moovattupuzha 57.375 120.74 675.289 0 0
12 Pampakkuda 45.226 58.719 127.983 0 0
13 Paravur 1.017 194.22 86.944 0 0
14 Alangad 1.576 40.246 44.034 0 0
Blocks Total 770.197 1292.208 4557.444 0.187 0
Municipalities 38.571 83.085 403.28 0.059 0
Coporation 0.329 36.624 6.514 0 0
District Total 809.097 1411.917 4967.238 0.246 0
(Table –4.1 Contd….)
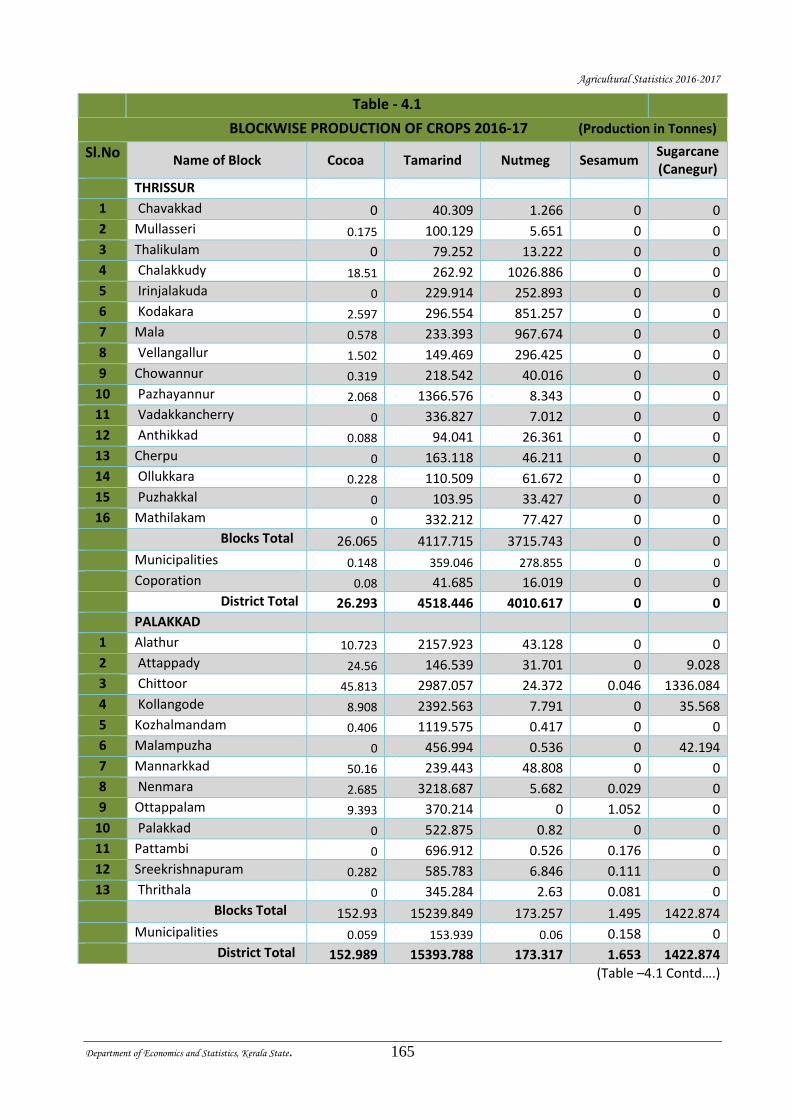
Agricultural Statistics 2016-2017
Department of Economics and Statistics, Kerala State. 165
Table - 4.1
BLOCKWISE PRODUCTION OF CROPS 2016-17 (Production in Tonnes)
Sl.No Name of Block Cocoa Tamarind Nutmeg Sesamum
Sugarcane (Canegur)
THRISSUR
1 Chavakkad 0 40.309 1.266 0 0
2 Mullasseri 0.175 100.129 5.651 0 0
3 Thalikulam 0 79.252 13.222 0 0
4 Chalakkudy 18.51 262.92 1026.886 0 0
5 Irinjalakuda 0 229.914 252.893 0 0
6 Kodakara 2.597 296.554 851.257 0 0
7 Mala 0.578 233.393 967.674 0 0
8 Vellangallur 1.502 149.469 296.425 0 0
9 Chowannur 0.319 218.542 40.016 0 0
10 Pazhayannur 2.068 1366.576 8.343 0 0
11 Vadakkancherry 0 336.827 7.012 0 0
12 Anthikkad 0.088 94.041 26.361 0 0
13 Cherpu 0 163.118 46.211 0 0
14 Ollukkara 0.228 110.509 61.672 0 0
15 Puzhakkal 0 103.95 33.427 0 0
16 Mathilakam 0 332.212 77.427 0 0
Blocks Total 26.065 4117.715 3715.743 0 0
Municipalities 0.148 359.046 278.855 0 0
Coporation 0.08 41.685 16.019 0 0
District Total 26.293 4518.446 4010.617 0 0
PALAKKAD
1 Alathur 10.723 2157.923 43.128 0 0
2 Attappady 24.56 146.539 31.701 0 9.028
3 Chittoor 45.813 2987.057 24.372 0.046 1336.084
4 Kollangode 8.908 2392.563 7.791 0 35.568
5 Kozhalmandam 0.406 1119.575 0.417 0 0
6 Malampuzha 0 456.994 0.536 0 42.194
7 Mannarkkad 50.16 239.443 48.808 0 0
8 Nenmara 2.685 3218.687 5.682 0.029 0
9 Ottappalam 9.393 370.214 0 1.052 0
10 Palakkad 0 522.875 0.82 0 0
11 Pattambi 0 696.912 0.526 0.176 0
12 Sreekrishnapuram 0.282 585.783 6.846 0.111 0
13 Thrithala 0 345.284 2.63 0.081 0
Blocks Total 152.93 15239.849 173.257 1.495 1422.874
Municipalities 0.059 153.939 0.06 0.158 0
District Total 152.989 15393.788 173.317 1.653 1422.874
(Table –4.1 Contd….)
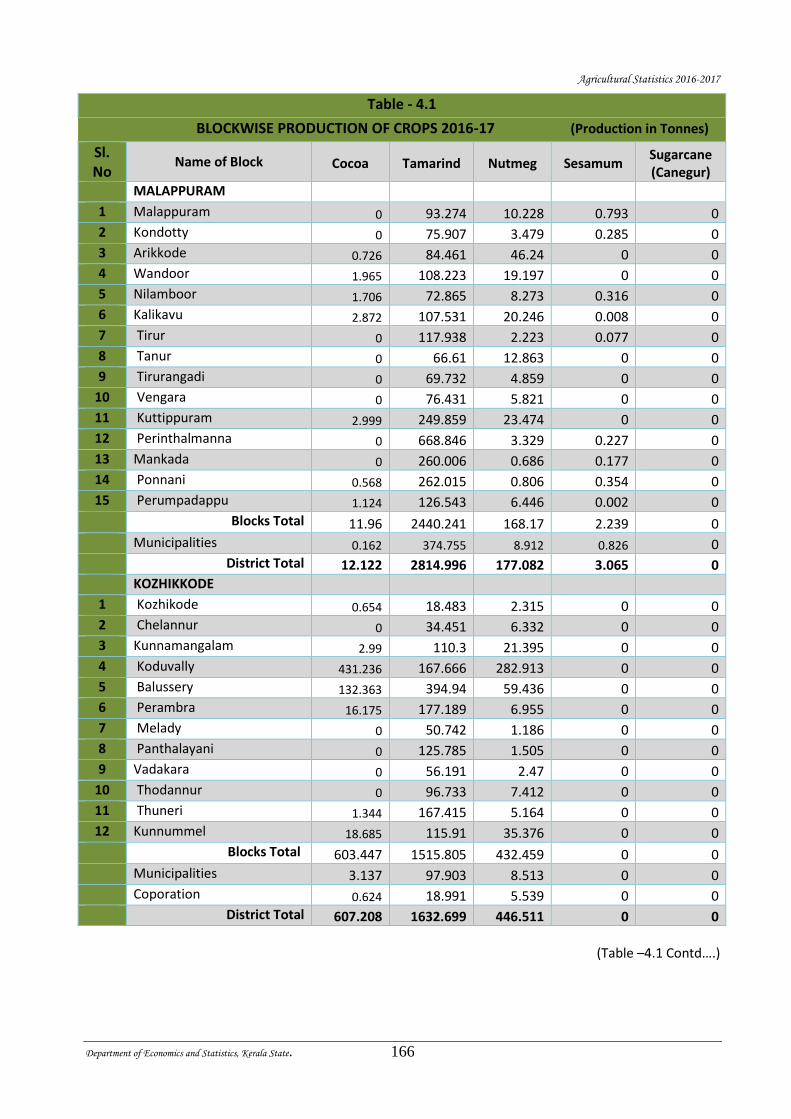
Agricultural Statistics 2016-2017
Department of Economics and Statistics, Kerala State. 166
Table - 4.1
BLOCKWISE PRODUCTION OF CROPS 2016-17 (Production in Tonnes)
Sl. No
Name of Block Cocoa Tamarind Nutmeg Sesamum Sugarcane (Canegur)
MALAPPURAM
1 Malappuram 0 93.274 10.228 0.793 0
2 Kondotty 0 75.907 3.479 0.285 0
3 Arikkode 0.726 84.461 46.24 0 0
4 Wandoor 1.965 108.223 19.197 0 0
5 Nilamboor 1.706 72.865 8.273 0.316 0
6 Kalikavu 2.872 107.531 20.246 0.008 0
7 Tirur 0 117.938 2.223 0.077 0
8 Tanur 0 66.61 12.863 0 0
9 Tirurangadi 0 69.732 4.859 0 0
10 Vengara 0 76.431 5.821 0 0
11 Kuttippuram 2.999 249.859 23.474 0 0
12 Perinthalmanna 0 668.846 3.329 0.227 0
13 Mankada 0 260.006 0.686 0.177 0
14 Ponnani 0.568 262.015 0.806 0.354 0
15 Perumpadappu 1.124 126.543 6.446 0.002 0
Blocks Total 11.96 2440.241 168.17 2.239 0
Municipalities 0.162 374.755 8.912 0.826 0
District Total 12.122 2814.996 177.082 3.065 0
KOZHIKKODE
1 Kozhikode 0.654 18.483 2.315 0 0
2 Chelannur 0 34.451 6.332 0 0
3 Kunnamangalam 2.99 110.3 21.395 0 0
4 Koduvally 431.236 167.666 282.913 0 0
5 Balussery 132.363 394.94 59.436 0 0
6 Perambra 16.175 177.189 6.955 0 0
7 Melady 0 50.742 1.186 0 0
8 Panthalayani 0 125.785 1.505 0 0
9 Vadakara 0 56.191 2.47 0 0
10 Thodannur 0 96.733 7.412 0 0
11 Thuneri 1.344 167.415 5.164 0 0
12 Kunnummel 18.685 115.91 35.376 0 0
Blocks Total 603.447 1515.805 432.459 0 0
Municipalities 3.137 97.903 8.513 0 0
Coporation 0.624 18.991 5.539 0 0
District Total 607.208 1632.699 446.511 0 0
(Table –4.1 Contd….)
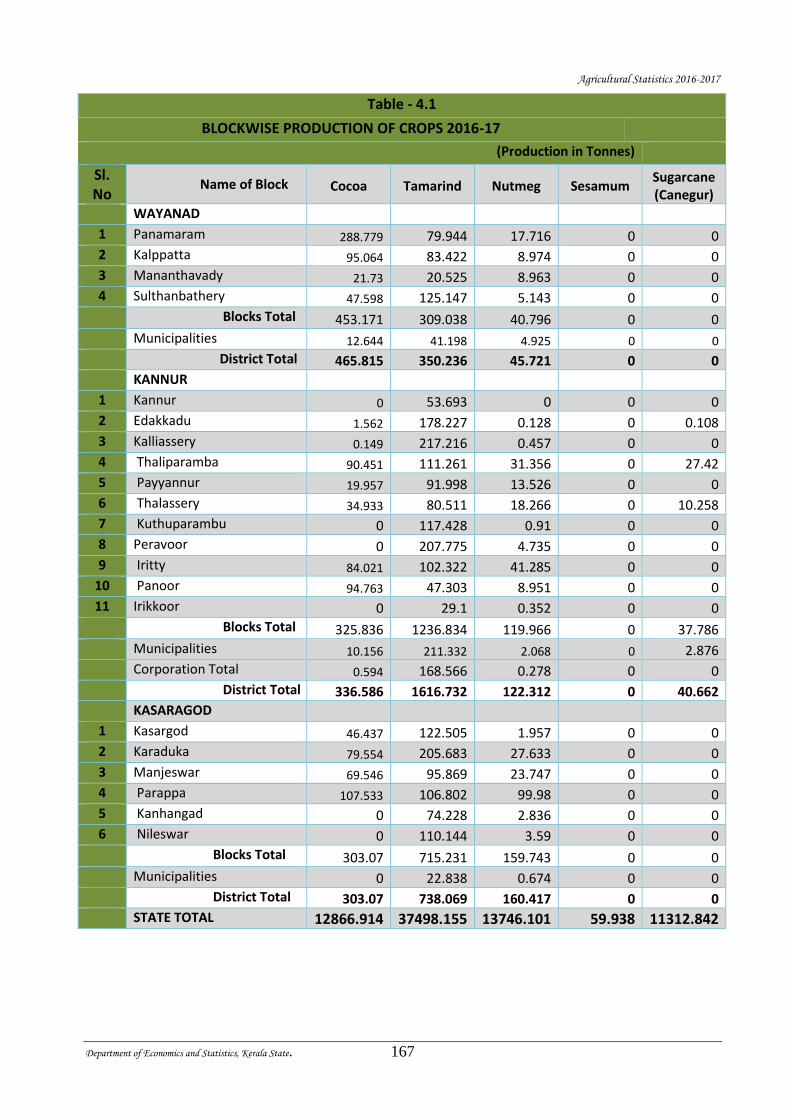
Agricultural Statistics 2016-2017
Department of Economics and Statistics, Kerala State. 167
Table - 4.1
BLOCKWISE PRODUCTION OF CROPS 2016-17
(Production in Tonnes)
Sl. No
Name of Block Cocoa Tamarind Nutmeg Sesamum Sugarcane (Canegur)
WAYANAD
1 Panamaram 288.779 79.944 17.716 0 0
2 Kalppatta 95.064 83.422 8.974 0 0
3 Mananthavady 21.73 20.525 8.963 0 0
4 Sulthanbathery 47.598 125.147 5.143 0 0
Blocks Total 453.171 309.038 40.796 0 0
Municipalities 12.644 41.198 4.925 0 0
District Total 465.815 350.236 45.721 0 0
KANNUR
1 Kannur 0 53.693 0 0 0
2 Edakkadu 1.562 178.227 0.128 0 0.108
3 Kalliassery 0.149 217.216 0.457 0 0
4 Thaliparamba 90.451 111.261 31.356 0 27.42
5 Payyannur 19.957 91.998 13.526 0 0
6 Thalassery 34.933 80.511 18.266 0 10.258
7 Kuthuparambu 0 117.428 0.91 0 0
8 Peravoor 0 207.775 4.735 0 0
9 Iritty 84.021 102.322 41.285 0 0
10 Panoor 94.763 47.303 8.951 0 0
11 Irikkoor 0 29.1 0.352 0 0
Blocks Total 325.836 1236.834 119.966 0 37.786
Municipalities 10.156 211.332 2.068 0 2.876
Corporation Total 0.594 168.566 0.278 0 0
District Total 336.586 1616.732 122.312 0 40.662
KASARAGOD
1 Kasargod 46.437 122.505 1.957 0 0
2 Karaduka 79.554 205.683 27.633 0 0
3 Manjeswar 69.546 95.869 23.747 0 0
4 Parappa 107.533 106.802 99.98 0 0
5 Kanhangad 0 74.228 2.836 0 0
6 Nileswar 0 110.144 3.59 0 0
Blocks Total 303.07 715.231 159.743 0 0
Municipalities 0 22.838 0.674 0 0
District Total 303.07 738.069 160.417 0 0
STATE TOTAL 12866.914 37498.155 13746.101 59.938 11312.842
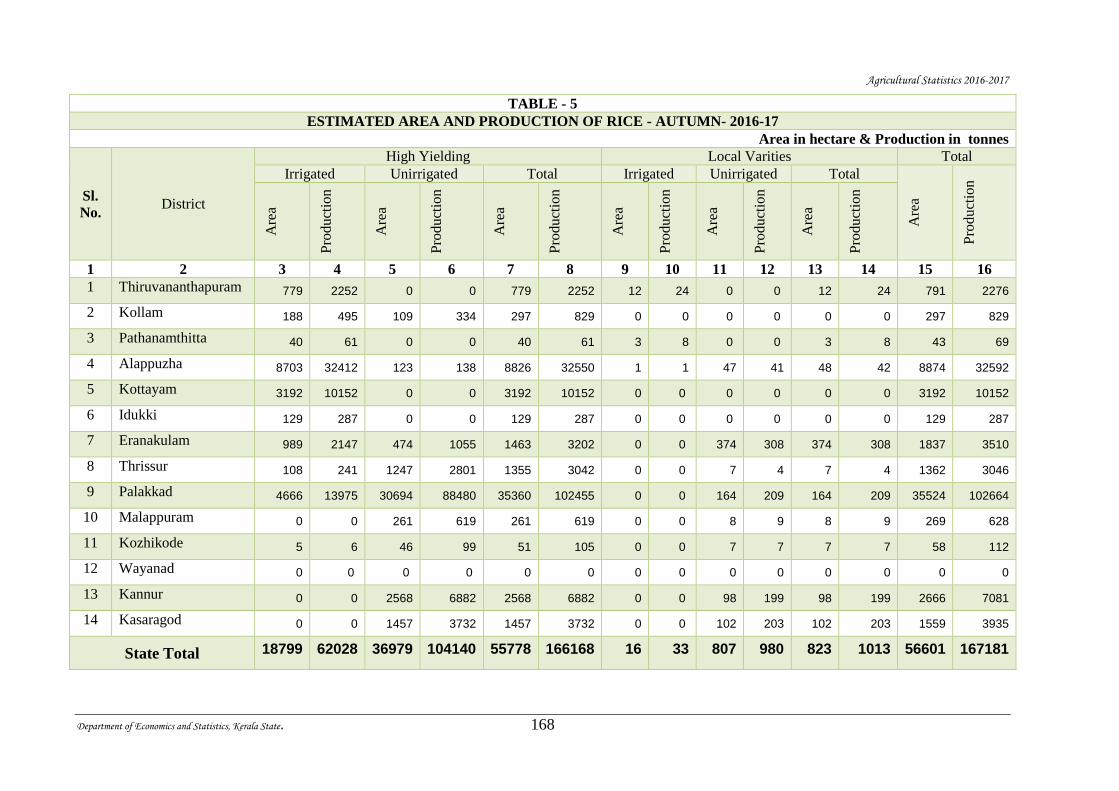
Agricultural Statistics 2016-2017
Department of Economics and Statistics, Kerala State. 168
TABLE - 5
ESTIMATED AREA AND PRODUCTION OF RICE - AUTUMN- 2016-17
Area in hectare & Production in tonnes
Sl.
No. District
High Yielding Local Varities Total
Irrigated Unirrigated Total Irrigated Unirrigated Total
Are
a
Pro
duct
ion
Are
a
Pro
duct
ion
Are
a
Pro
duct
ion
Are
a
Pro
duct
ion
Are
a
Pro
duct
ion
Are
a
Pro
duct
ion
Are
a
Pro
duct
ion
1 2 3 4 5 6 7 8 9 10 11 12 13 14 15 16
1 Thiruvananthapuram 779 2252 0 0 779 2252 12 24 0 0 12 24 791 2276
2 Kollam 188 495 109 334 297 829 0 0 0 0 0 0 297 829
3 Pathanamthitta 40 61 0 0 40 61 3 8 0 0 3 8 43 69
4 Alappuzha 8703 32412 123 138 8826 32550 1 1 47 41 48 42 8874 32592
5 Kottayam 3192 10152 0 0 3192 10152 0 0 0 0 0 0 3192 10152
6 Idukki 129 287 0 0 129 287 0 0 0 0 0 0 129 287
7 Eranakulam 989 2147 474 1055 1463 3202 0 0 374 308 374 308 1837 3510
8 Thrissur 108 241 1247 2801 1355 3042 0 0 7 4 7 4 1362 3046
9 Palakkad 4666 13975 30694 88480 35360 102455 0 0 164 209 164 209 35524 102664
10 Malappuram 0 0 261 619 261 619 0 0 8 9 8 9 269 628
11 Kozhikode 5 6 46 99 51 105 0 0 7 7 7 7 58 112
12 Wayanad 0 0 0 0 0 0 0 0 0 0 0 0 0 0
13 Kannur 0 0 2568 6882 2568 6882 0 0 98 199 98 199 2666 7081
14 Kasaragod 0 0 1457 3732 1457 3732 0 0 102 203 102 203 1559 3935
State Total 18799 62028 36979 104140 55778 166168 16 33 807 980 823 1013 56601 167181
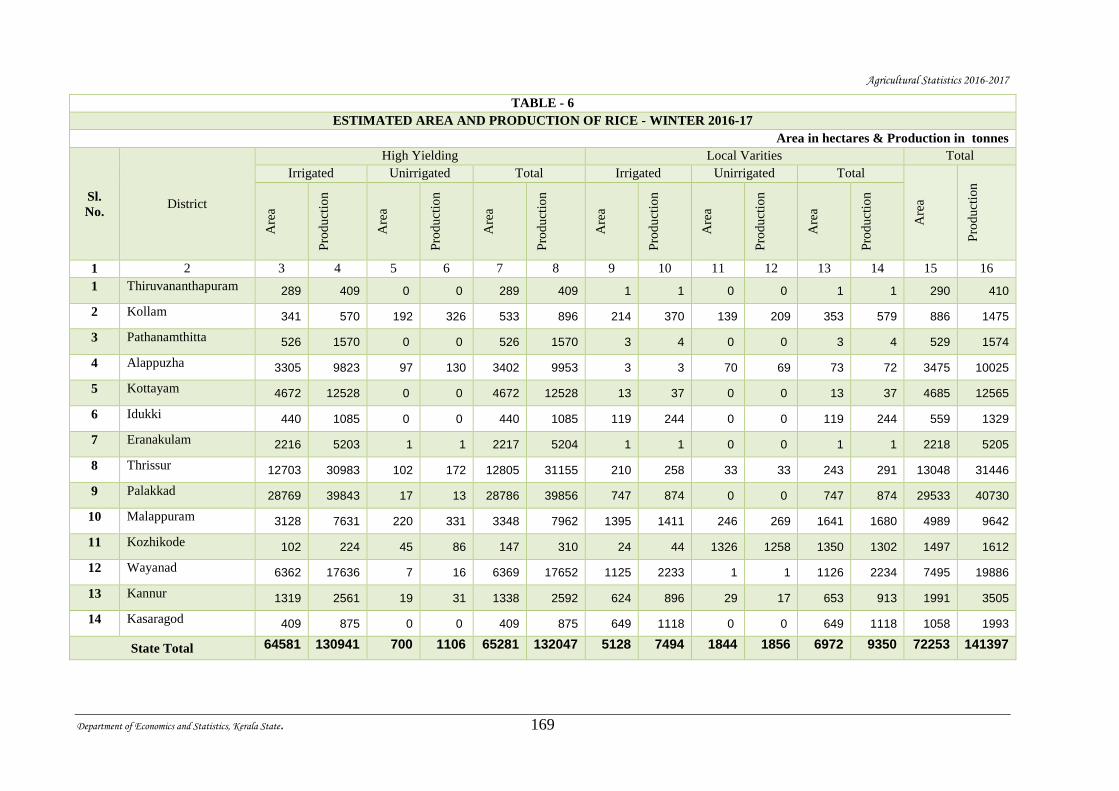
Agricultural Statistics 2016-2017
Department of Economics and Statistics, Kerala State. 169
TABLE - 6
ESTIMATED AREA AND PRODUCTION OF RICE - WINTER 2016-17
Area in hectares & Production in tonnes
Sl.
No. District
High Yielding Local Varities Total
Irrigated Unirrigated Total Irrigated Unirrigated Total
Are
a
Pro
du
ctio
n
Are
a
Pro
du
ctio
n
Are
a
Pro
du
ctio
n
Are
a
Pro
du
ctio
n
Are
a
Pro
du
ctio
n
Are
a
Pro
du
ctio
n
Are
a
Pro
du
ctio
n
1 2 3 4 5 6 7 8 9 10 11 12 13 14 15 16
1 Thiruvananthapuram 289 409 0 0 289 409 1 1 0 0 1 1 290 410
2 Kollam 341 570 192 326 533 896 214 370 139 209 353 579 886 1475
3 Pathanamthitta 526 1570 0 0 526 1570 3 4 0 0 3 4 529 1574
4 Alappuzha 3305 9823 97 130 3402 9953 3 3 70 69 73 72 3475 10025
5 Kottayam 4672 12528 0 0 4672 12528 13 37 0 0 13 37 4685 12565
6 Idukki 440 1085 0 0 440 1085 119 244 0 0 119 244 559 1329
7 Eranakulam 2216 5203 1 1 2217 5204 1 1 0 0 1 1 2218 5205
8 Thrissur 12703 30983 102 172 12805 31155 210 258 33 33 243 291 13048 31446
9 Palakkad 28769 39843 17 13 28786 39856 747 874 0 0 747 874 29533 40730
10 Malappuram 3128 7631 220 331 3348 7962 1395 1411 246 269 1641 1680 4989 9642
11 Kozhikode 102 224 45 86 147 310 24 44 1326 1258 1350 1302 1497 1612
12 Wayanad 6362 17636 7 16 6369 17652 1125 2233 1 1 1126 2234 7495 19886
13 Kannur 1319 2561 19 31 1338 2592 624 896 29 17 653 913 1991 3505
14 Kasaragod 409 875 0 0 409 875 649 1118 0 0 649 1118 1058 1993
State Total 64581 130941 700 1106 65281 132047 5128 7494 1844 1856 6972 9350 72253 141397
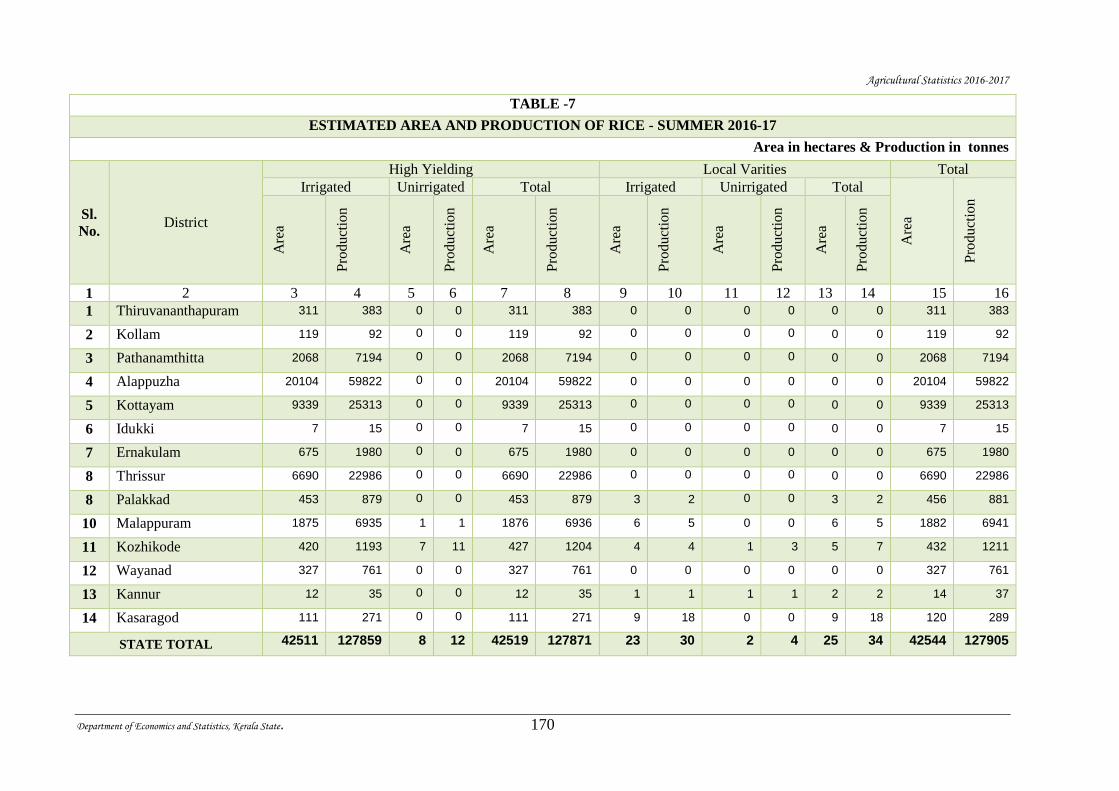
Agricultural Statistics 2016-2017
Department of Economics and Statistics, Kerala State. 170
TABLE -7
ESTIMATED AREA AND PRODUCTION OF RICE - SUMMER 2016-17
Area in hectares & Production in tonnes
Sl.
No. District
High Yielding Local Varities Total
Irrigated Unirrigated Total Irrigated Unirrigated Total
Are
a
Pro
duct
ion
Are
a
Pro
duct
ion
Are
a
Pro
duct
ion
Are
a
Pro
duct
ion
Are
a
Pro
duct
ion
Are
a
Pro
duct
ion
Are
a
Pro
duct
ion
1 2 3 4 5 6 7 8 9 10 11 12 13 14 15 16
1 Thiruvananthapuram 311 383 0 0 311 383 0 0 0 0 0 0 311 383
2 Kollam 119 92 0 0 119 92 0 0 0 0 0 0 119 92
3 Pathanamthitta 2068 7194 0 0 2068 7194 0 0 0 0 0 0 2068 7194
4 Alappuzha 20104 59822 0 0 20104 59822 0 0 0 0 0 0 20104 59822
5 Kottayam 9339 25313 0 0 9339 25313 0 0 0 0 0 0 9339 25313
6 Idukki 7 15 0 0 7 15 0 0 0 0 0 0 7 15
7 Ernakulam 675 1980 0 0 675 1980 0 0 0 0 0 0 675 1980
8 Thrissur 6690 22986 0 0 6690 22986 0 0 0 0 0 0 6690 22986
8 Palakkad 453 879 0 0 453 879 3 2 0 0 3 2 456 881
10 Malappuram 1875 6935 1 1 1876 6936 6 5 0 0 6 5 1882 6941
11 Kozhikode 420 1193 7 11 427 1204 4 4 1 3 5 7 432 1211
12 Wayanad 327 761 0 0 327 761 0 0 0 0 0 0 327 761
13 Kannur 12 35 0 0 12 35 1 1 1 1 2 2 14 37
14 Kasaragod 111 271 0 0 111 271 9 18 0 0 9 18 120 289
STATE TOTAL 42511 127859 8 12 42519 127871 23 30 2 4 25 34 42544 127905
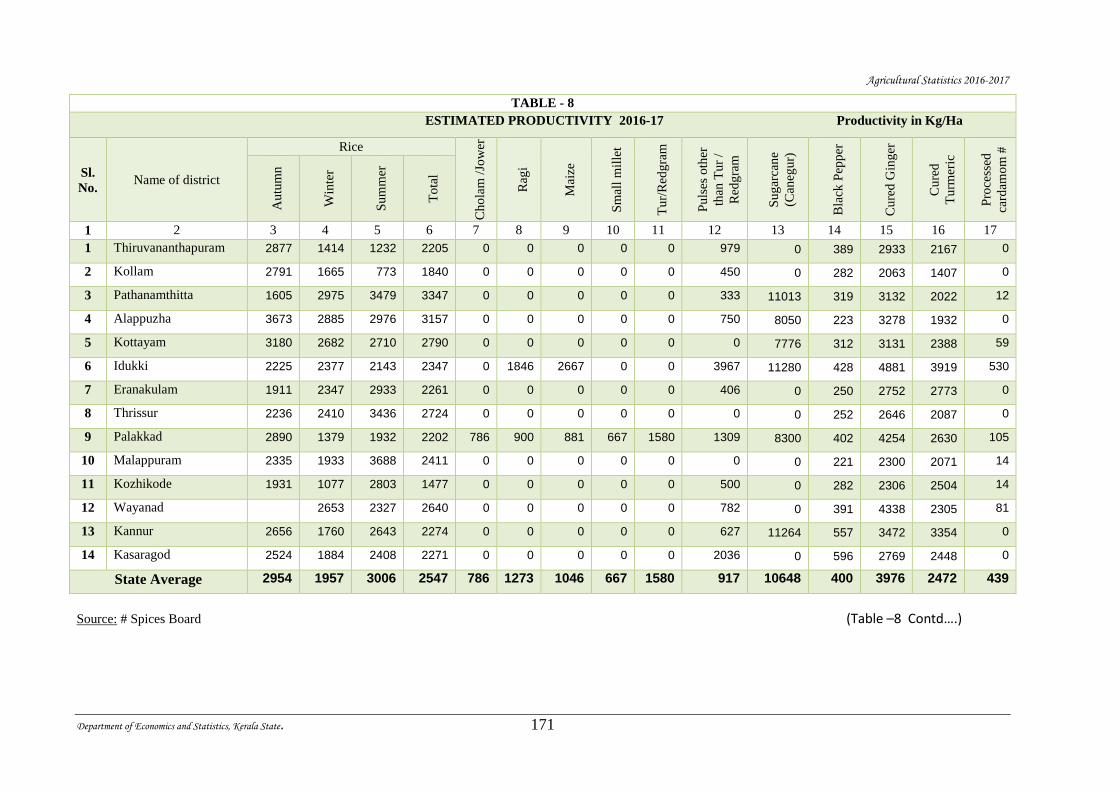
Agricultural Statistics 2016-2017
Department of Economics and Statistics, Kerala State. 171
TABLE - 8
ESTIMATED PRODUCTIVITY 2016-17 Productivity in Kg/Ha
Sl.
No. Name of district
Rice
Ch
ola
m /
Jow
er
Rag
i
Mai
ze
Sm
all
mil
let
Tu
r/R
edg
ram
Pu
lses
oth
er
than
Tu
r /
Red
gra
m
Su
gar
can
e
(Can
egu
r)
Bla
ck P
epp
er
Cu
red
Gin
ger
Cu
red
Tu
rmer
ic
Pro
cess
ed
card
amo
m #
Au
tum
n
Win
ter
Su
mm
er
To
tal
1 2 3 4 5 6 7 8 9 10 11 12 13 14 15 16 17
1 Thiruvananthapuram 2877 1414 1232 2205 0 0 0 0 0 979 0 389 2933 2167 0
2 Kollam 2791 1665 773 1840 0 0 0 0 0 450 0 282 2063 1407 0
3 Pathanamthitta 1605 2975 3479 3347 0 0 0 0 0 333 11013 319 3132 2022 12
4 Alappuzha 3673 2885 2976 3157 0 0 0 0 0 750 8050 223 3278 1932 0
5 Kottayam 3180 2682 2710 2790 0 0 0 0 0 0 7776 312 3131 2388 59
6 Idukki 2225 2377 2143 2347 0 1846 2667 0 0 3967 11280 428 4881 3919 530
7 Eranakulam 1911 2347 2933 2261 0 0 0 0 0 406 0 250 2752 2773 0
8 Thrissur 2236 2410 3436 2724 0 0 0 0 0 0 0 252 2646 2087 0
9 Palakkad 2890 1379 1932 2202 786 900 881 667 1580 1309 8300 402 4254 2630 105
10 Malappuram 2335 1933 3688 2411 0 0 0 0 0 0 0 221 2300 2071 14
11 Kozhikode 1931 1077 2803 1477 0 0 0 0 0 500 0 282 2306 2504 14
12 Wayanad 2653 2327 2640 0 0 0 0 0 782 0 391 4338 2305 81
13 Kannur 2656 1760 2643 2274 0 0 0 0 0 627 11264 557 3472 3354 0
14 Kasaragod 2524 1884 2408 2271 0 0 0 0 0 2036 0 596 2769 2448 0
State Average 2954 1957 3006 2547 786 1273 1046 667 1580 917 10648 400 3976 2472 439
Source: # Spices Board (Table –8 Contd….)
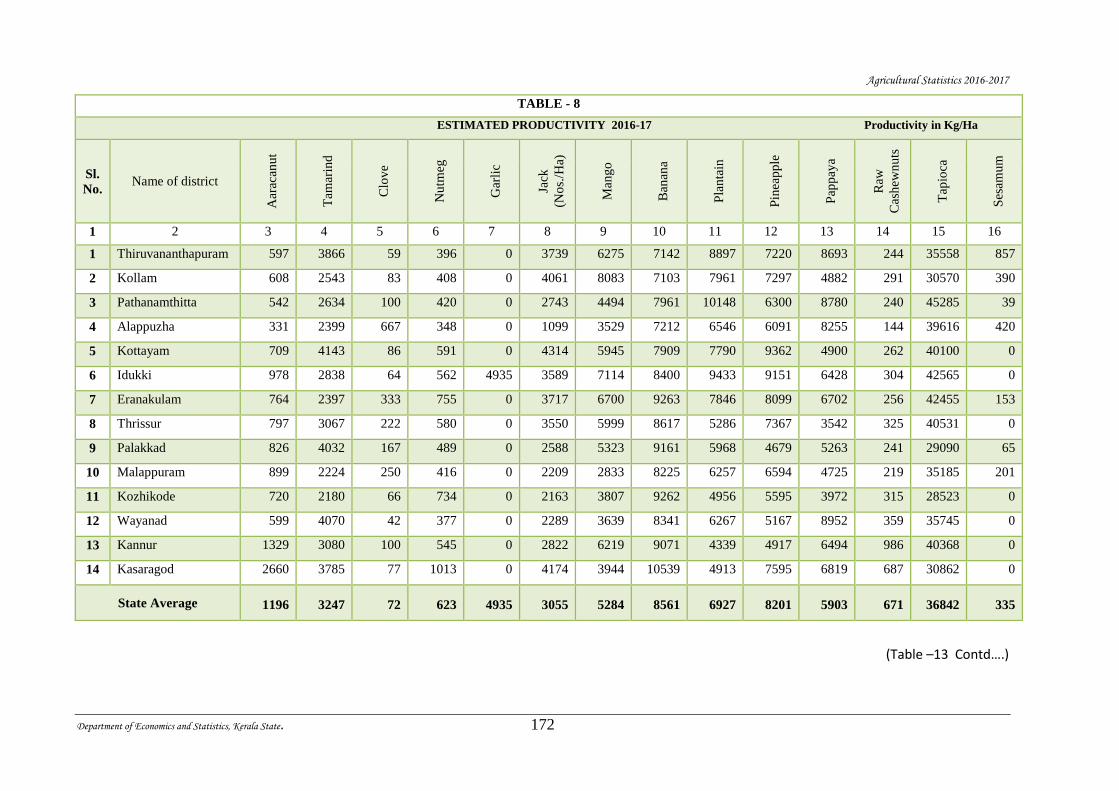
Agricultural Statistics 2016-2017
Department of Economics and Statistics, Kerala State. 172
TABLE - 8
ESTIMATED PRODUCTIVITY 2016-17 Productivity in Kg/Ha
Sl.
No. Name of district
Aar
acan
ut
Tam
arin
d
Clo
ve
Nu
tmeg
Gar
lic
Jack
(No
s./H
a)
Man
go
Ban
ana
Pla
nta
in
Pin
eap
ple
Pap
pay
a
Raw
Cas
hew
nu
ts
Tap
ioca
Ses
amu
m
1 2 3 4 5 6 7 8 9 10 11 12 13 14 15 16
1 Thiruvananthapuram 597 3866 59 396 0 3739 6275 7142 8897 7220 8693 244 35558 857
2 Kollam 608 2543 83 408 0 4061 8083 7103 7961 7297 4882 291 30570 390
3 Pathanamthitta 542 2634 100 420 0 2743 4494 7961 10148 6300 8780 240 45285 39
4 Alappuzha 331 2399 667 348 0 1099 3529 7212 6546 6091 8255 144 39616 420
5 Kottayam 709 4143 86 591 0 4314 5945 7909 7790 9362 4900 262 40100 0
6 Idukki 978 2838 64 562 4935 3589 7114 8400 9433 9151 6428 304 42565 0
7 Eranakulam 764 2397 333 755 0 3717 6700 9263 7846 8099 6702 256 42455 153
8 Thrissur 797 3067 222 580 0 3550 5999 8617 5286 7367 3542 325 40531 0
9 Palakkad 826 4032 167 489 0 2588 5323 9161 5968 4679 5263 241 29090 65
10 Malappuram 899 2224 250 416 0 2209 2833 8225 6257 6594 4725 219 35185 201
11 Kozhikode 720 2180 66 734 0 2163 3807 9262 4956 5595 3972 315 28523 0
12 Wayanad 599 4070 42 377 0 2289 3639 8341 6267 5167 8952 359 35745 0
13 Kannur 1329 3080 100 545 0 2822 6219 9071 4339 4917 6494 986 40368 0
14 Kasaragod 2660 3785 77 1013 0 4174 3944 10539 4913 7595 6819 687 30862 0
State Average 1196 3247 72 623 4935 3055 5284 8561 6927 8201 5903 671 36842 335
(Table –13 Contd….)
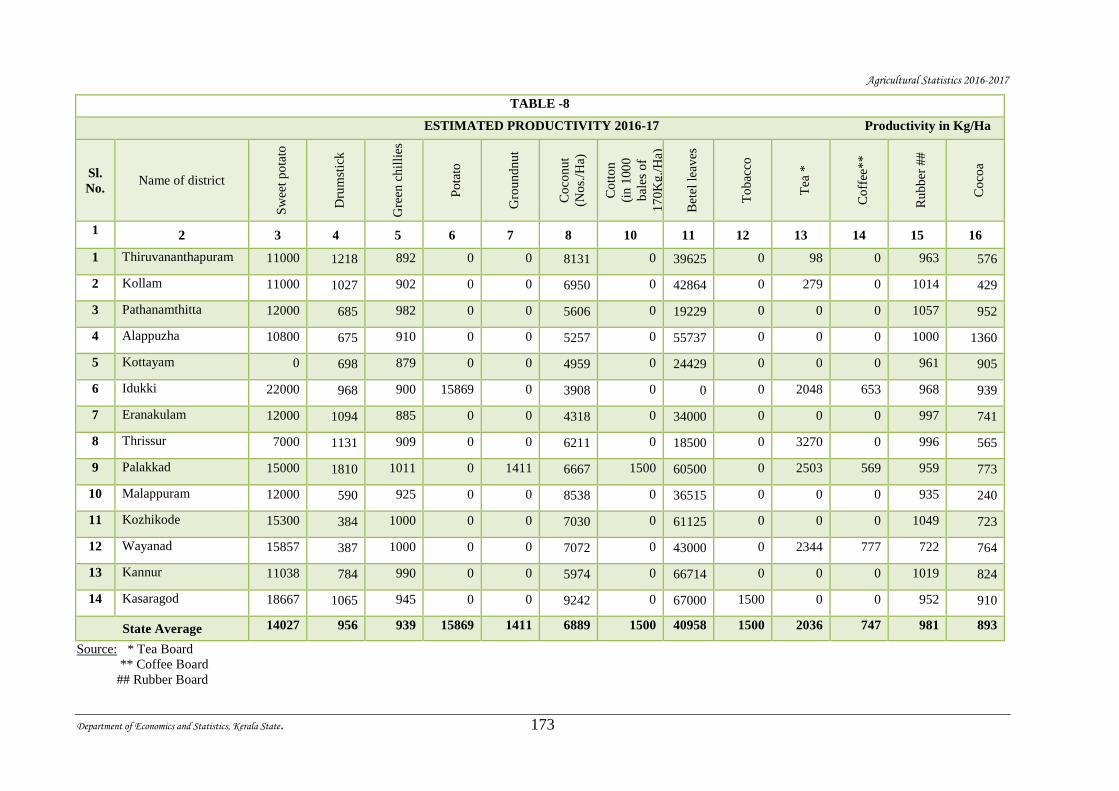
Agricultural Statistics 2016-2017
Department of Economics and Statistics, Kerala State. 173
TABLE -8
ESTIMATED PRODUCTIVITY 2016-17 Productivity in Kg/Ha
Sl.
No. Name of district
Sw
eet
po
tato
Dru
mst
ick
Gre
en c
hil
lies
Po
tato
Gro
un
dn
ut
Co
con
ut
(No
s./H
a)
Co
tto
n
(in
100
0
bal
es o
f
17
0K
g./
Ha)
Bet
el l
eav
es
To
bac
co
Tea
*
Co
ffee
**
Ru
bb
er #
#
Co
coa
1 2 3 4 5 6 7 8 10 11 12 13 14 15 16
1 Thiruvananthapuram 11000 1218 892 0 0 8131 0 39625 0 98 0 963 576
2 Kollam 11000 1027 902 0 0 6950 0 42864 0 279 0 1014 429
3 Pathanamthitta 12000 685 982 0 0 5606 0 19229 0 0 0 1057 952
4 Alappuzha 10800 675 910 0 0 5257 0 55737 0 0 0 1000 1360
5 Kottayam 0 698 879 0 0 4959 0 24429 0 0 0 961 905
6 Idukki 22000 968 900 15869 0 3908 0 0 0 2048 653 968 939
7 Eranakulam 12000 1094 885 0 0 4318 0 34000 0 0 0 997 741
8 Thrissur 7000 1131 909 0 0 6211 0 18500 0 3270 0 996 565
9 Palakkad 15000 1810 1011 0 1411 6667 1500 60500 0 2503 569 959 773
10 Malappuram 12000 590 925 0 0 8538 0 36515 0 0 0 935 240
11 Kozhikode 15300 384 1000 0 0 7030 0 61125 0 0 0 1049 723
12 Wayanad 15857 387 1000 0 0 7072 0 43000 0 2344 777 722 764
13 Kannur 11038 784 990 0 0 5974 0 66714 0 0 0 1019 824
14 Kasaragod 18667 1065 945 0 0 9242 0 67000 1500 0 0 952 910
State Average 14027 956 939 15869 1411 6889 1500 40958 1500 2036 747 981 893
Source: * Tea Board
** Coffee Board
## Rubber Board
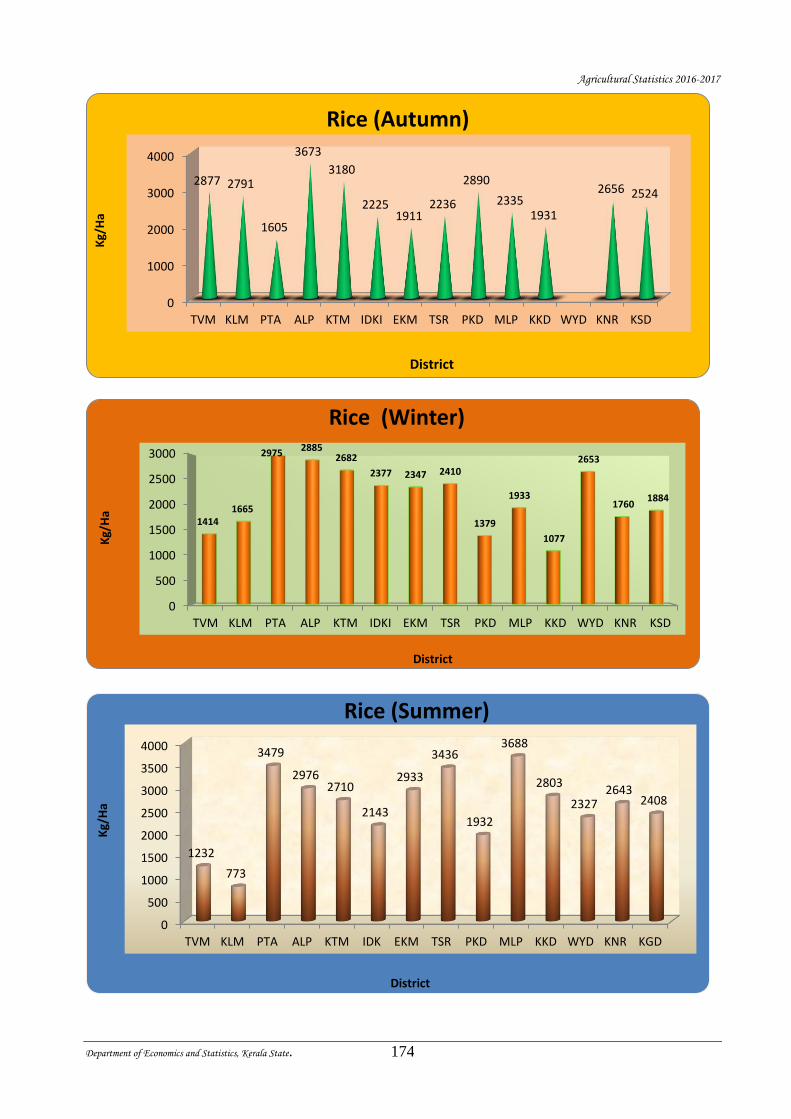
Agricultural Statistics 2016-2017
Department of Economics and Statistics, Kerala State. 174
0
1000
2000
3000
4000
TVM KLM PTA ALP KTM IDKI EKM TSR PKD MLP KKD WYD KNR KSD
2877 2791
1605
3673
3180
22251911
2236
2890
23351931
2656 2524
Kg/
Ha
District
Rice (Autumn)
0
500
1000
1500
2000
2500
3000
TVM KLM PTA ALP KTM IDKI EKM TSR PKD MLP KKD WYD KNR KSD
14141665
29752885
2682
2377 2347 2410
1379
1933
1077
2653
17601884
Kg/
Ha
District
Rice (Winter)
0
500
1000
1500
2000
2500
3000
3500
4000
TVM KLM PTA ALP KTM IDK EKM TSR PKD MLP KKD WYD KNR KGD
1232
773
3479
29762710
2143
2933
3436
1932
3688
2803
23272643
2408
Kg/
Ha
District
Rice (Summer)
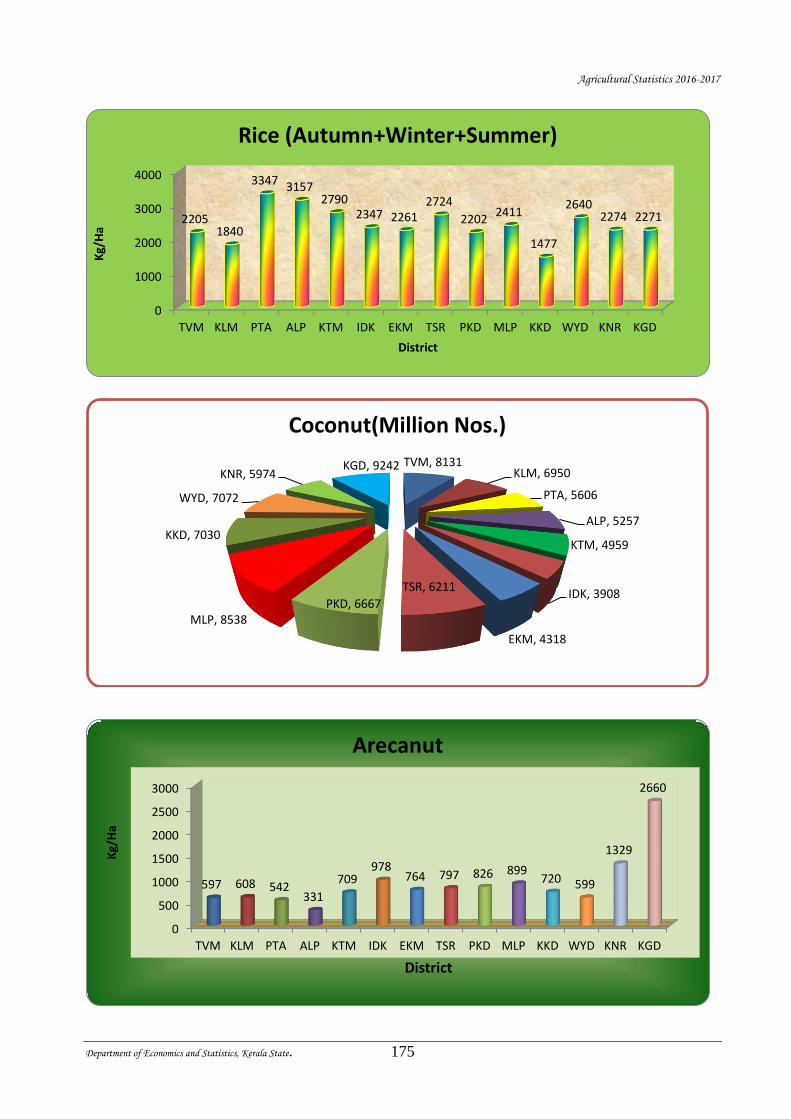
Agricultural Statistics 2016-2017
Department of Economics and Statistics, Kerala State. 175
0
1000
2000
3000
4000
TVM KLM PTA ALP KTM IDK EKM TSR PKD MLP KKD WYD KNR KGD
22051840
3347 31572790
2347 22612724
22022411
1477
26402274 2271
Kg/
Ha
District
Rice (Autumn+Winter+Summer)
TVM, 8131KLM, 6950
PTA, 5606
ALP, 5257
KTM, 4959
IDK, 3908
EKM, 4318
TSR, 6211
PKD, 6667MLP, 8538
KKD, 7030
WYD, 7072
KNR, 5974KGD, 9242
Coconut(Million Nos.)
0
500
1000
1500
2000
2500
3000
TVM KLM PTA ALP KTM IDK EKM TSR PKD MLP KKD WYD KNR KGD
597 608 542331
709978
764 797 826 899720 599
1329
2660
Kg/
Ha
District
Arecanut
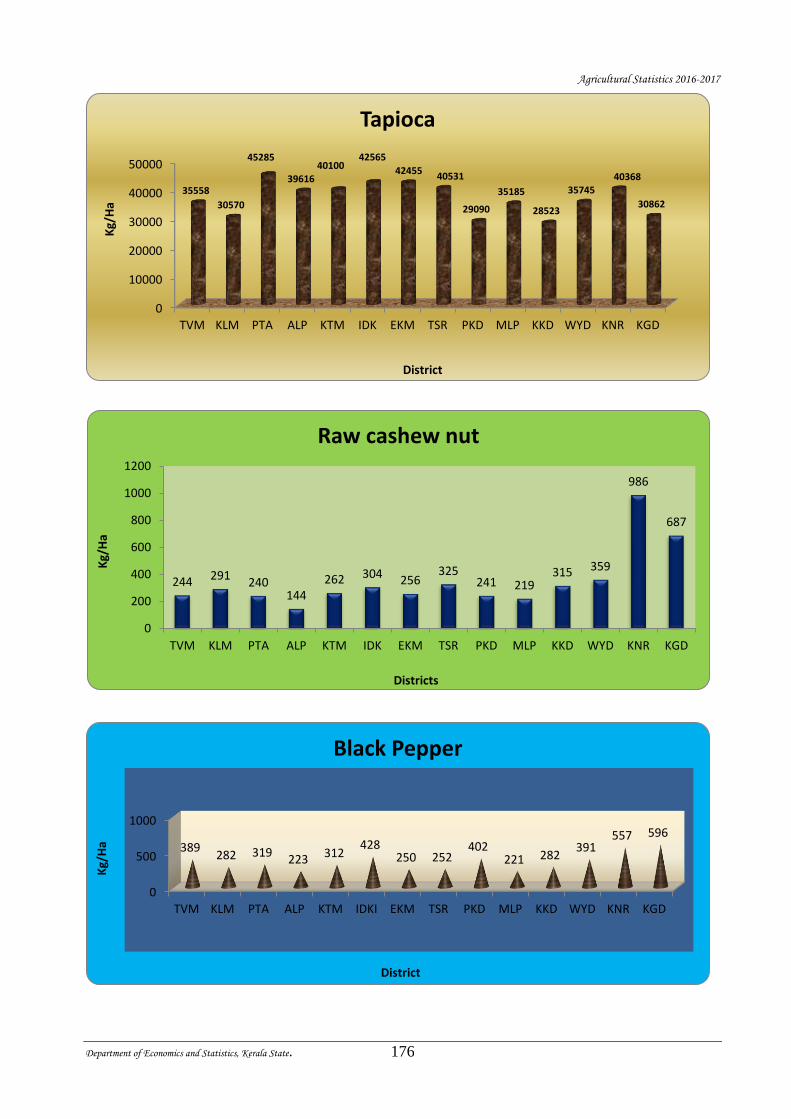
Agricultural Statistics 2016-2017
Department of Economics and Statistics, Kerala State. 176
0
10000
20000
30000
40000
50000
TVM KLM PTA ALP KTM IDK EKM TSR PKD MLP KKD WYD KNR KGD
35558
30570
45285
3961640100
42565
4245540531
29090
35185
28523
3574540368
30862
Kg/
Ha
District
Tapioca
244 291240
144262 304 256
325241 219
315 359
986
687
0
200
400
600
800
1000
1200
TVM KLM PTA ALP KTM IDK EKM TSR PKD MLP KKD WYD KNR KGD
Kg/
Ha
Districts
Raw cashew nut
0
500
1000
TVM KLM PTA ALP KTM IDKI EKM TSR PKD MLP KKD WYD KNR KGD
389282 319
223 312428
250 252402
221 282391
557 596
Kg/
Ha
District
Black Pepper
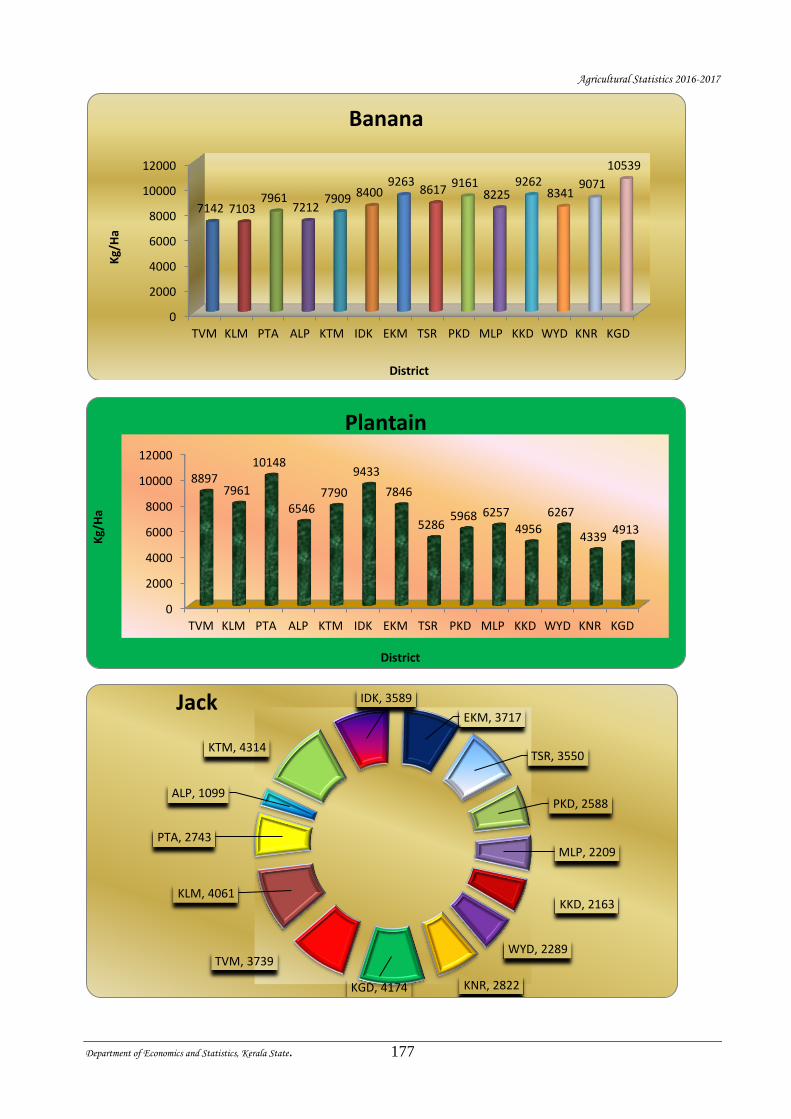
Agricultural Statistics 2016-2017
Department of Economics and Statistics, Kerala State. 177
0
2000
4000
6000
8000
10000
12000
TVM KLM PTA ALP KTM IDK EKM TSR PKD MLP KKD WYD KNR KGD
7142 71037961
72127909 8400
92638617
91618225
92628341
9071
10539
Kg/
Ha
District
Banana
0
2000
4000
6000
8000
10000
12000
TVM KLM PTA ALP KTM IDK EKM TSR PKD MLP KKD WYD KNR KGD
88977961
10148
65467790
9433
7846
52865968 6257
4956
6267
43394913
Kg/
Ha
District
Plantain
TVM, 3739
KLM, 4061
PTA, 2743
ALP, 1099
KTM, 4314
IDK, 3589
EKM, 3717
TSR, 3550
PKD, 2588
MLP, 2209
KKD, 2163
WYD, 2289
KNR, 2822KGD, 4174
Jack
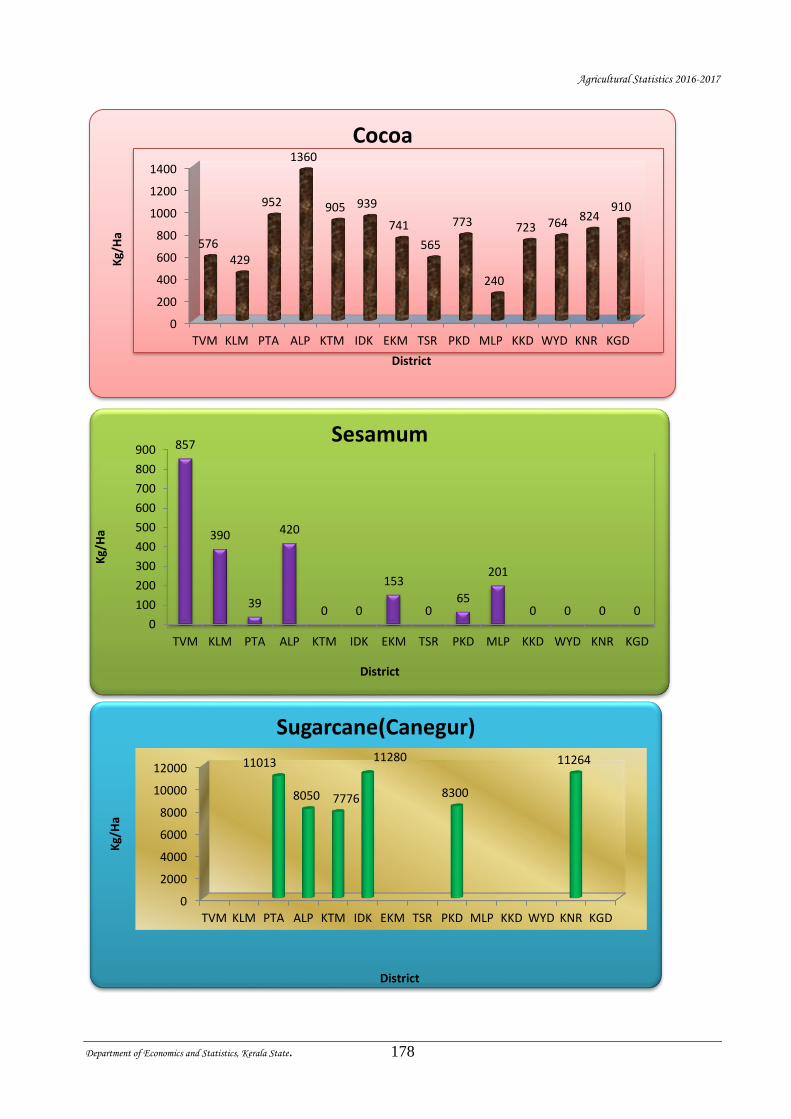
Agricultural Statistics 2016-2017
Department of Economics and Statistics, Kerala State. 178
0
200
400
600
800
1000
1200
1400
TVM KLM PTA ALP KTM IDK EKM TSR PKD MLP KKD WYD KNR KGD
576429
952
1360
905 939
741
565
773
240
723 764824
910
Kg/
Ha
District
Cocoa
857
390
39
420
0 0
153
065
201
0 0 0 00
100
200
300
400
500
600
700
800
900
TVM KLM PTA ALP KTM IDK EKM TSR PKD MLP KKD WYD KNR KGD
Kg/
Ha
District
Sesamum
0
2000
4000
6000
8000
10000
12000
TVM KLM PTA ALP KTM IDK EKM TSR PKD MLP KKD WYD KNR KGD
11013
8050 7776
11280
8300
11264
Kg/
Ha
District
Sugarcane(Canegur)
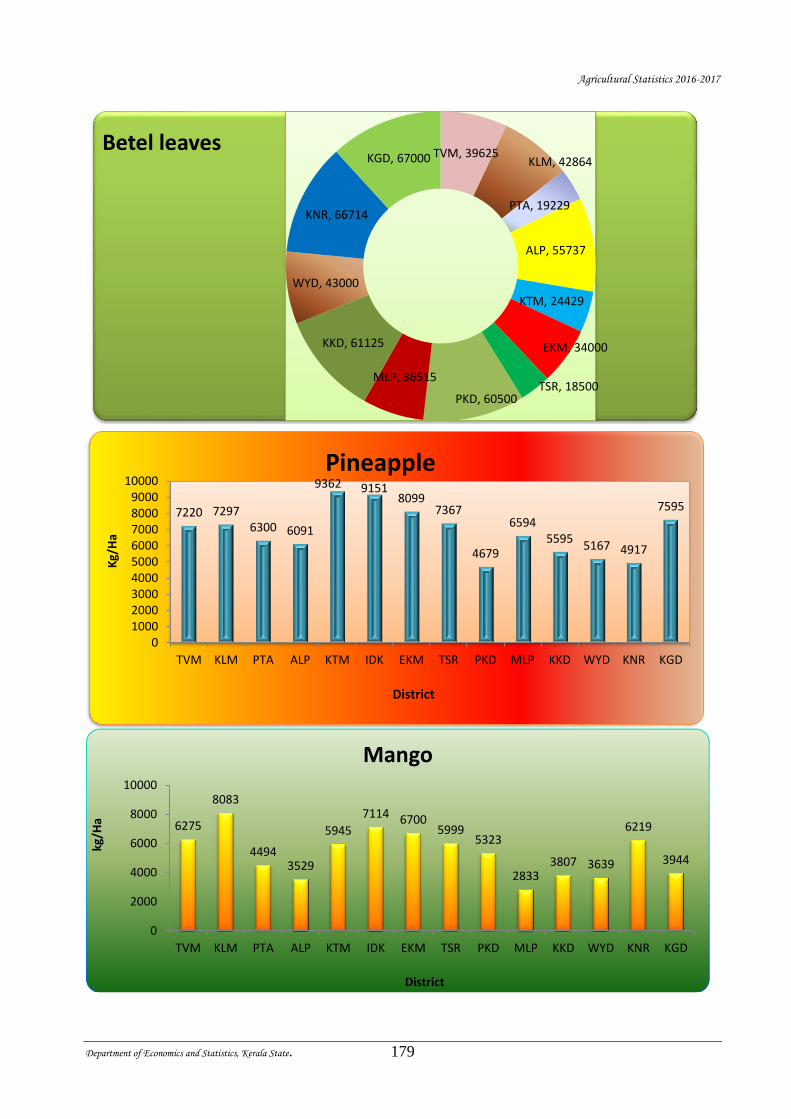
Agricultural Statistics 2016-2017
Department of Economics and Statistics, Kerala State. 179
TVM, 39625KLM, 42864
PTA, 19229
ALP, 55737
KTM, 24429
EKM, 34000
TSR, 18500PKD, 60500
MLP, 36515
KKD, 61125
WYD, 43000
KNR, 66714
KGD, 67000Betel leaves
7220 72976300 6091
9362 91518099
7367
4679
65945595
5167 4917
7595
0100020003000400050006000700080009000
10000
TVM KLM PTA ALP KTM IDK EKM TSR PKD MLP KKD WYD KNR KGD
Kg/
Ha
District
Pineapple
6275
8083
44943529
5945
7114 67005999
5323
28333807 3639
6219
3944
0
2000
4000
6000
8000
10000
TVM KLM PTA ALP KTM IDK EKM TSR PKD MLP KKD WYD KNR KGD
kg/H
a
District
Mango
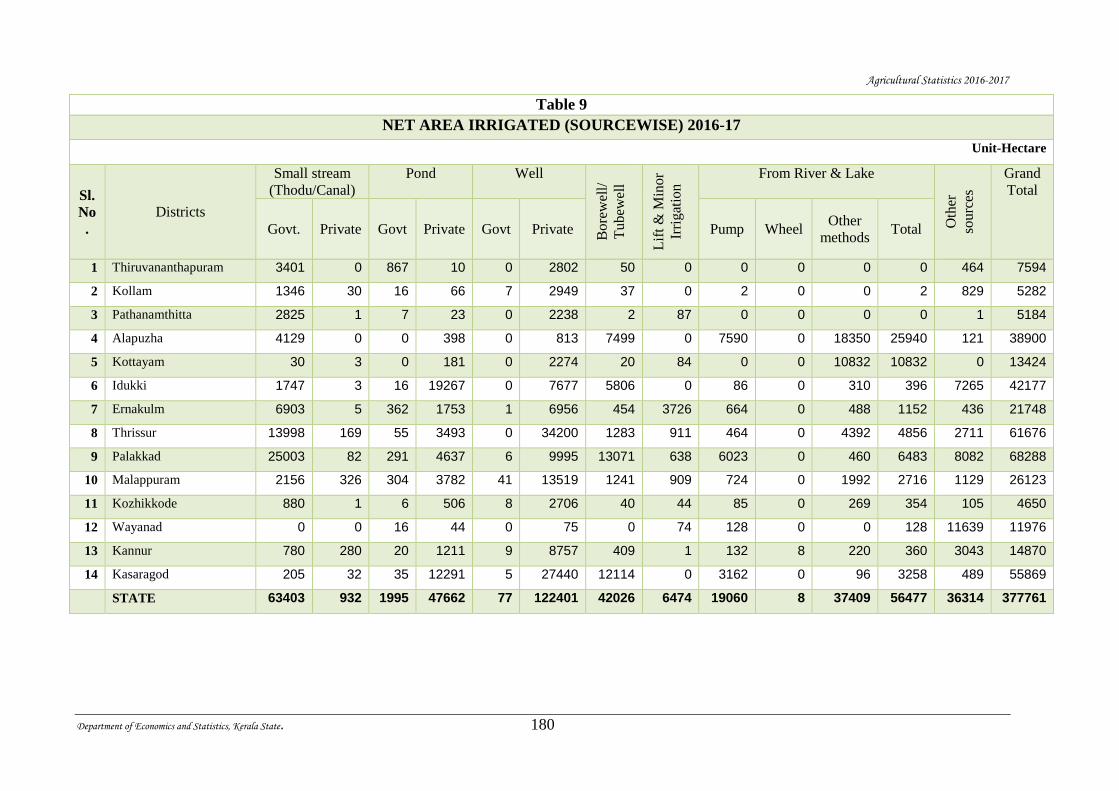
Agricultural Statistics 2016-2017
Department of Economics and Statistics, Kerala State. 180
Table 9
NET AREA IRRIGATED (SOURCEWISE) 2016-17
Unit-Hectare
Sl.
No
.
Districts
Small stream
(Thodu/Canal)
Pond Well
Bore
wel
l/
Tubew
ell
Lif
t &
Min
or
Irri
gat
ion From River & Lake
Oth
er
sourc
es
Grand
Total
Govt. Private Govt Private Govt Private Pump Wheel Other
methods Total
1 Thiruvananthapuram 3401 0 867 10 0 2802 50 0 0 0 0 0 464 7594
2 Kollam 1346 30 16 66 7 2949 37 0 2 0 0 2 829 5282
3 Pathanamthitta 2825 1 7 23 0 2238 2 87 0 0 0 0 1 5184
4 Alapuzha 4129 0 0 398 0 813 7499 0 7590 0 18350 25940 121 38900
5 Kottayam 30 3 0 181 0 2274 20 84 0 0 10832 10832 0 13424
6 Idukki 1747 3 16 19267 0 7677 5806 0 86 0 310 396 7265 42177
7 Ernakulm 6903 5 362 1753 1 6956 454 3726 664 0 488 1152 436 21748
8 Thrissur 13998 169 55 3493 0 34200 1283 911 464 0 4392 4856 2711 61676
9 Palakkad 25003 82 291 4637 6 9995 13071 638 6023 0 460 6483 8082 68288
10 Malappuram 2156 326 304 3782 41 13519 1241 909 724 0 1992 2716 1129 26123
11 Kozhikkode 880 1 6 506 8 2706 40 44 85 0 269 354 105 4650
12 Wayanad 0 0 16 44 0 75 0 74 128 0 0 128 11639 11976
13 Kannur 780 280 20 1211 9 8757 409 1 132 8 220 360 3043 14870
14 Kasaragod 205 32 35 12291 5 27440 12114 0 3162 0 96 3258 489 55869
STATE 63403 932 1995 47662 77 122401 42026 6474 19060 8 37409 56477 36314 377761
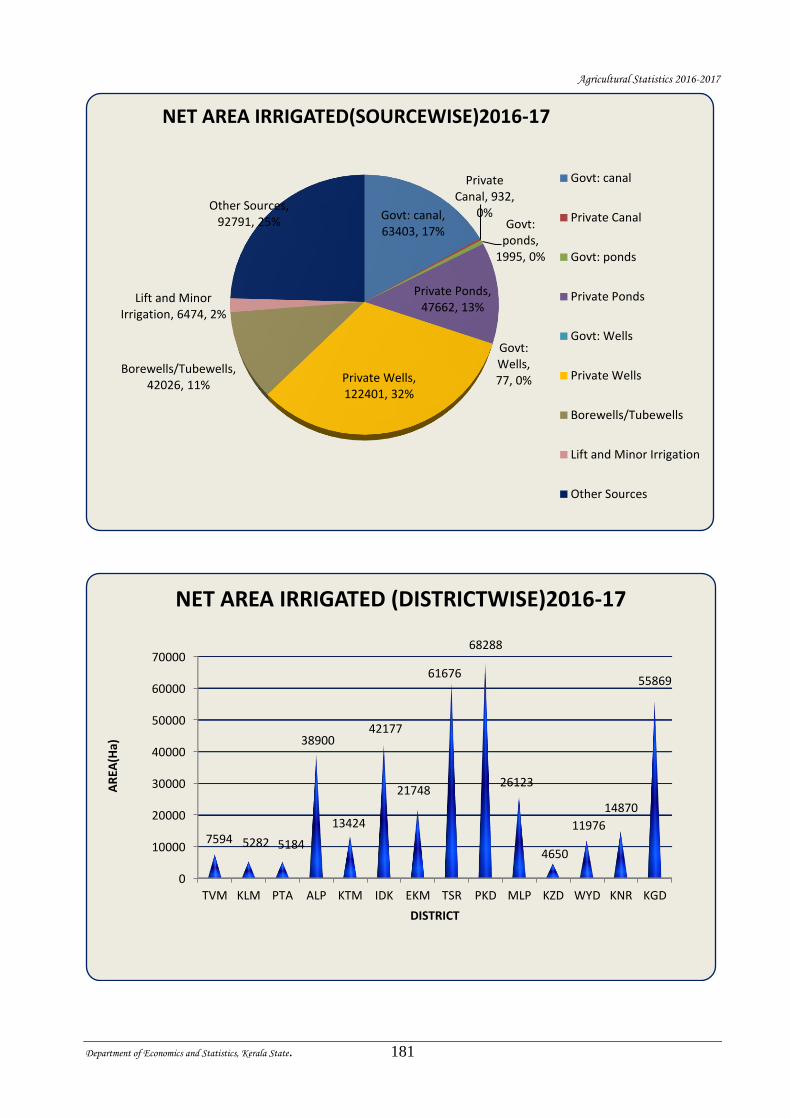
Agricultural Statistics 2016-2017
Department of Economics and Statistics, Kerala State. 181
Govt: canal, 63403, 17%
Private Canal, 932,
0%Govt:
ponds, 1995, 0%
Private Ponds, 47662, 13%
Govt: Wells, 77, 0%Private Wells,
122401, 32%
Borewells/Tubewells, 42026, 11%
Lift and Minor Irrigation, 6474, 2%
Other Sources, 92791, 25%
NET AREA IRRIGATED(SOURCEWISE)2016-17
Govt: canal
Private Canal
Govt: ponds
Private Ponds
Govt: Wells
Private Wells
Borewells/Tubewells
Lift and Minor Irrigation
Other Sources
0
10000
20000
30000
40000
50000
60000
70000
TVM KLM PTA ALP KTM IDK EKM TSR PKD MLP KZD WYD KNR KGD
7594 5282 5184
38900
13424
42177
21748
61676
68288
26123
4650
11976
14870
55869
AR
EA(H
a)
DISTRICT
NET AREA IRRIGATED (DISTRICTWISE)2016-17
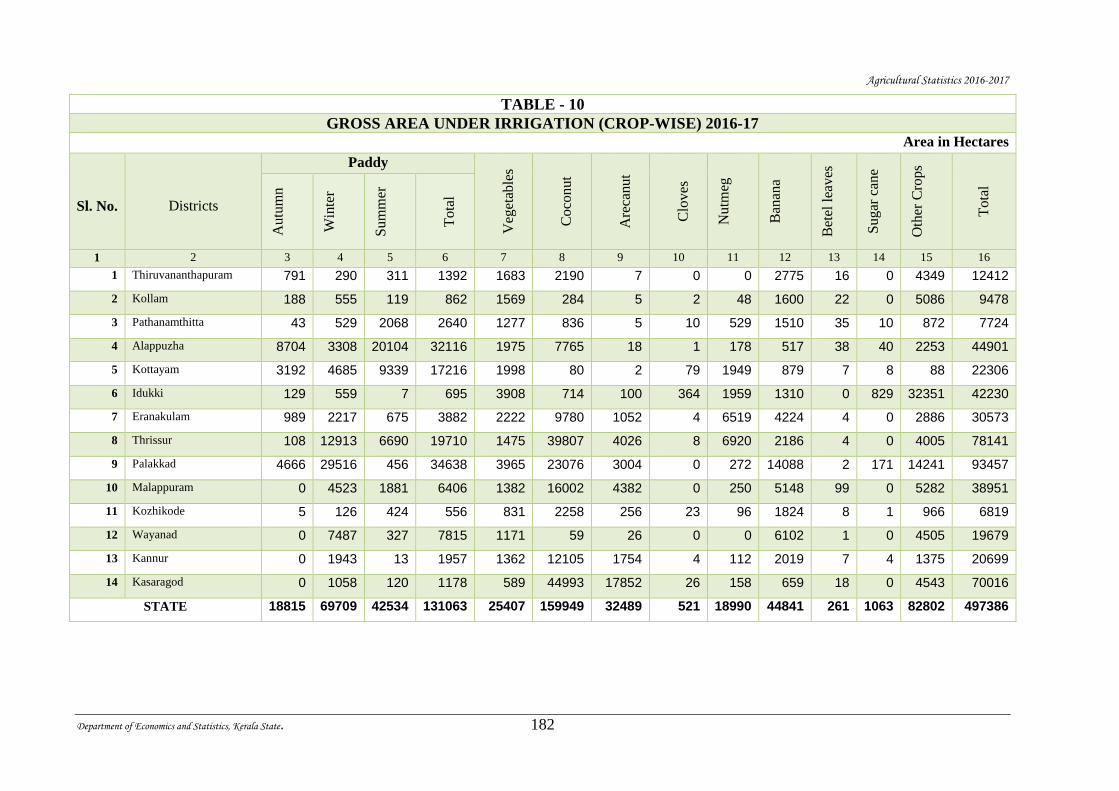
Agricultural Statistics 2016-2017
Department of Economics and Statistics, Kerala State. 182
TABLE - 10
GROSS AREA UNDER IRRIGATION (CROP-WISE) 2016-17
Area in Hectares
Sl. No.
Districts
Paddy
Veg
etab
les
Coco
nut
Are
canut
Clo
ves
Nutm
eg
Ban
ana
Bet
el l
eaves
Sugar
can
e
Oth
er C
rops
Tota
l
Autu
mn
Win
ter
Sum
mer
Tota
l
1 2 3 4 5 6 7 8 9 10 11 12 13 14 15 16
1 Thiruvananthapuram 791 290 311 1392 1683 2190 7 0 0 2775 16 0 4349 12412
2 Kollam 188 555 119 862 1569 284 5 2 48 1600 22 0 5086 9478
3 Pathanamthitta 43 529 2068 2640 1277 836 5 10 529 1510 35 10 872 7724
4 Alappuzha 8704 3308 20104 32116 1975 7765 18 1 178 517 38 40 2253 44901
5 Kottayam 3192 4685 9339 17216 1998 80 2 79 1949 879 7 8 88 22306
6 Idukki 129 559 7 695 3908 714 100 364 1959 1310 0 829 32351 42230
7 Eranakulam 989 2217 675 3882 2222 9780 1052 4 6519 4224 4 0 2886 30573
8 Thrissur 108 12913 6690 19710 1475 39807 4026 8 6920 2186 4 0 4005 78141
9 Palakkad 4666 29516 456 34638 3965 23076 3004 0 272 14088 2 171 14241 93457
10 Malappuram 0 4523 1881 6406 1382 16002 4382 0 250 5148 99 0 5282 38951
11 Kozhikode 5 126 424 556 831 2258 256 23 96 1824 8 1 966 6819
12 Wayanad 0 7487 327 7815 1171 59 26 0 0 6102 1 0 4505 19679
13 Kannur 0 1943 13 1957 1362 12105 1754 4 112 2019 7 4 1375 20699
14 Kasaragod 0 1058 120 1178 589 44993 17852 26 158 659 18 0 4543 70016
STATE 18815 69709 42534 131063 25407 159949 32489 521 18990 44841 261 1063 82802 497386
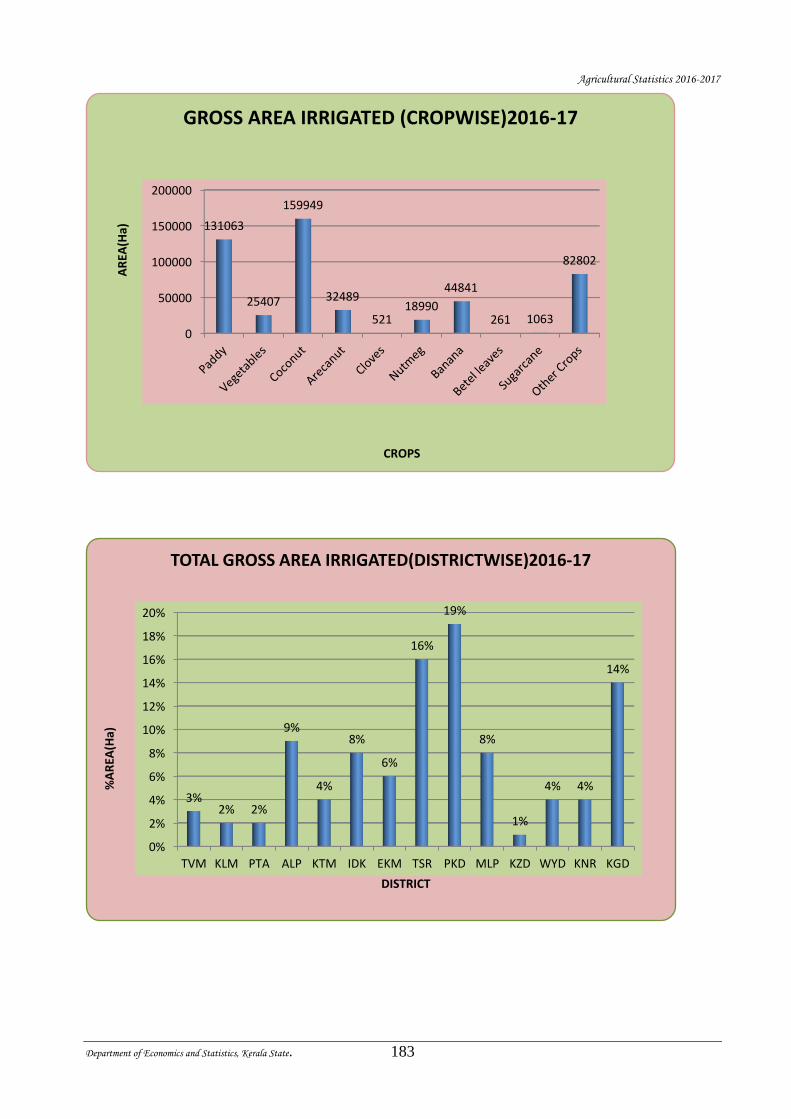
Agricultural Statistics 2016-2017
Department of Economics and Statistics, Kerala State. 183
0
50000
100000
150000
200000
131063
25407
159949
32489
52118990
44841
261 1063
82802
AR
EA(H
a)
CROPS
GROSS AREA IRRIGATED (CROPWISE)2016-17
0%
2%
4%
6%
8%
10%
12%
14%
16%
18%
20%
TVM KLM PTA ALP KTM IDK EKM TSR PKD MLP KZD WYD KNR KGD
3%2% 2%
9%
4%
8%
6%
16%
19%
8%
1%
4% 4%
14%
%A
REA
(Ha)
DISTRICT
TOTAL GROSS AREA IRRIGATED(DISTRICTWISE)2016-17
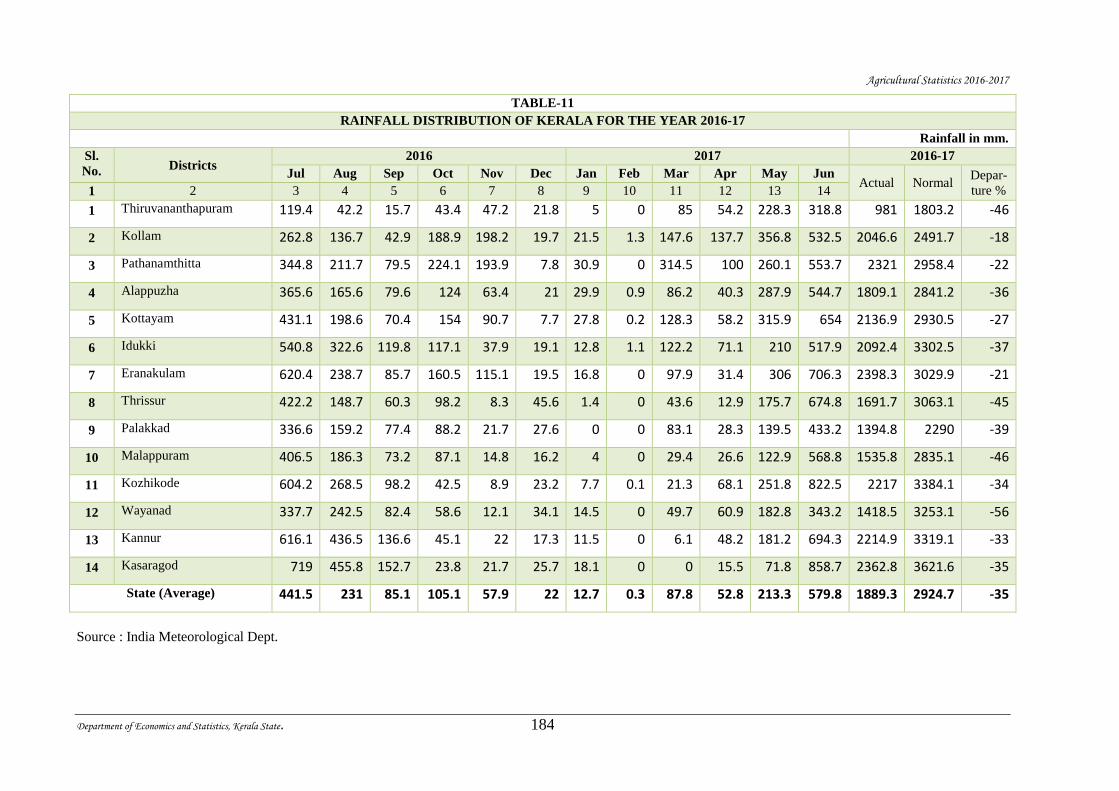
Agricultural Statistics 2016-2017
Department of Economics and Statistics, Kerala State. 184
TABLE-11
RAINFALL DISTRIBUTION OF KERALA FOR THE YEAR 2016-17
Rainfall in mm.
Sl.
No. Districts 2016 2017 2016-17
Jul Aug Sep Oct Nov Dec Jan Feb Mar Apr May Jun Actual Normal
Depar-
ture % 1 2 3 4 5 6 7 8 9 10 11 12 13 14
1 Thiruvananthapuram 119.4 42.2 15.7 43.4 47.2 21.8 5 0 85 54.2 228.3 318.8 981 1803.2 -46
2 Kollam 262.8 136.7 42.9 188.9 198.2 19.7 21.5 1.3 147.6 137.7 356.8 532.5 2046.6 2491.7 -18
3 Pathanamthitta 344.8 211.7 79.5 224.1 193.9 7.8 30.9 0 314.5 100 260.1 553.7 2321 2958.4 -22
4 Alappuzha 365.6 165.6 79.6 124 63.4 21 29.9 0.9 86.2 40.3 287.9 544.7 1809.1 2841.2 -36
5 Kottayam 431.1 198.6 70.4 154 90.7 7.7 27.8 0.2 128.3 58.2 315.9 654 2136.9 2930.5 -27
6 Idukki 540.8 322.6 119.8 117.1 37.9 19.1 12.8 1.1 122.2 71.1 210 517.9 2092.4 3302.5 -37
7 Eranakulam 620.4 238.7 85.7 160.5 115.1 19.5 16.8 0 97.9 31.4 306 706.3 2398.3 3029.9 -21
8 Thrissur 422.2 148.7 60.3 98.2 8.3 45.6 1.4 0 43.6 12.9 175.7 674.8 1691.7 3063.1 -45
9 Palakkad 336.6 159.2 77.4 88.2 21.7 27.6 0 0 83.1 28.3 139.5 433.2 1394.8 2290 -39
10 Malappuram 406.5 186.3 73.2 87.1 14.8 16.2 4 0 29.4 26.6 122.9 568.8 1535.8 2835.1 -46
11 Kozhikode 604.2 268.5 98.2 42.5 8.9 23.2 7.7 0.1 21.3 68.1 251.8 822.5 2217 3384.1 -34
12 Wayanad 337.7 242.5 82.4 58.6 12.1 34.1 14.5 0 49.7 60.9 182.8 343.2 1418.5 3253.1 -56
13 Kannur 616.1 436.5 136.6 45.1 22 17.3 11.5 0 6.1 48.2 181.2 694.3 2214.9 3319.1 -33
14 Kasaragod 719 455.8 152.7 23.8 21.7 25.7 18.1 0 0 15.5 71.8 858.7 2362.8 3621.6 -35
State (Average) 441.5 231 85.1 105.1 57.9 22 12.7 0.3 87.8 52.8 213.3 579.8 1889.3 2924.7 -35
Source : India Meteorological Dept.
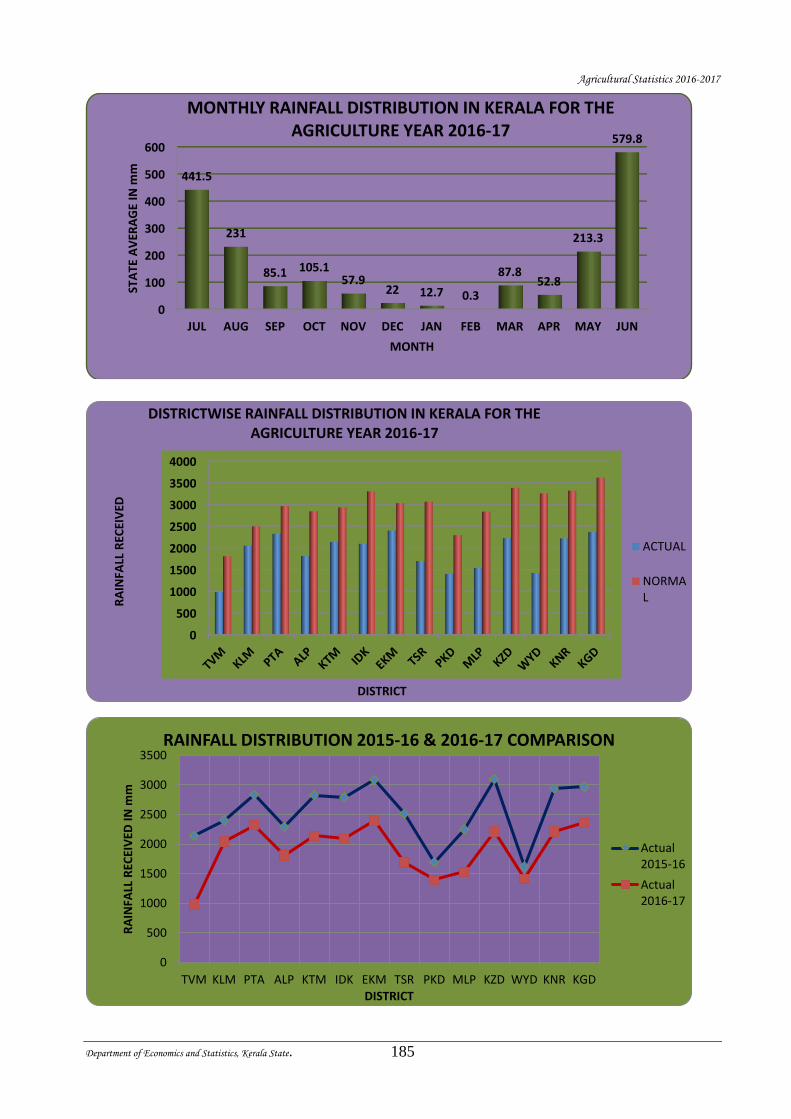
Agricultural Statistics 2016-2017
Department of Economics and Statistics, Kerala State. 185
0
100
200
300
400
500
600
JUL AUG SEP OCT NOV DEC JAN FEB MAR APR MAY JUN
441.5
231
85.1 105.157.9
22 12.7 0.3
87.852.8
213.3
579.8ST
ATE
AV
ERA
GE
IN m
m
MONTH
MONTHLY RAINFALL DISTRIBUTION IN KERALA FOR THE AGRICULTURE YEAR 2016-17
0
500
1000
1500
2000
2500
3000
3500
4000
RA
INFA
LL R
ECEI
VED
DISTRICT
DISTRICTWISE RAINFALL DISTRIBUTION IN KERALA FOR THE AGRICULTURE YEAR 2016-17
ACTUAL
NORMAL
0
500
1000
1500
2000
2500
3000
3500
TVM KLM PTA ALP KTM IDK EKM TSR PKD MLP KZD WYD KNR KGD
RA
INFA
LL R
ECEI
VED
IN
mm
DISTRICT
RAINFALL DISTRIBUTION 2015-16 & 2016-17 COMPARISON
Actual2015-16
Actual2016-17
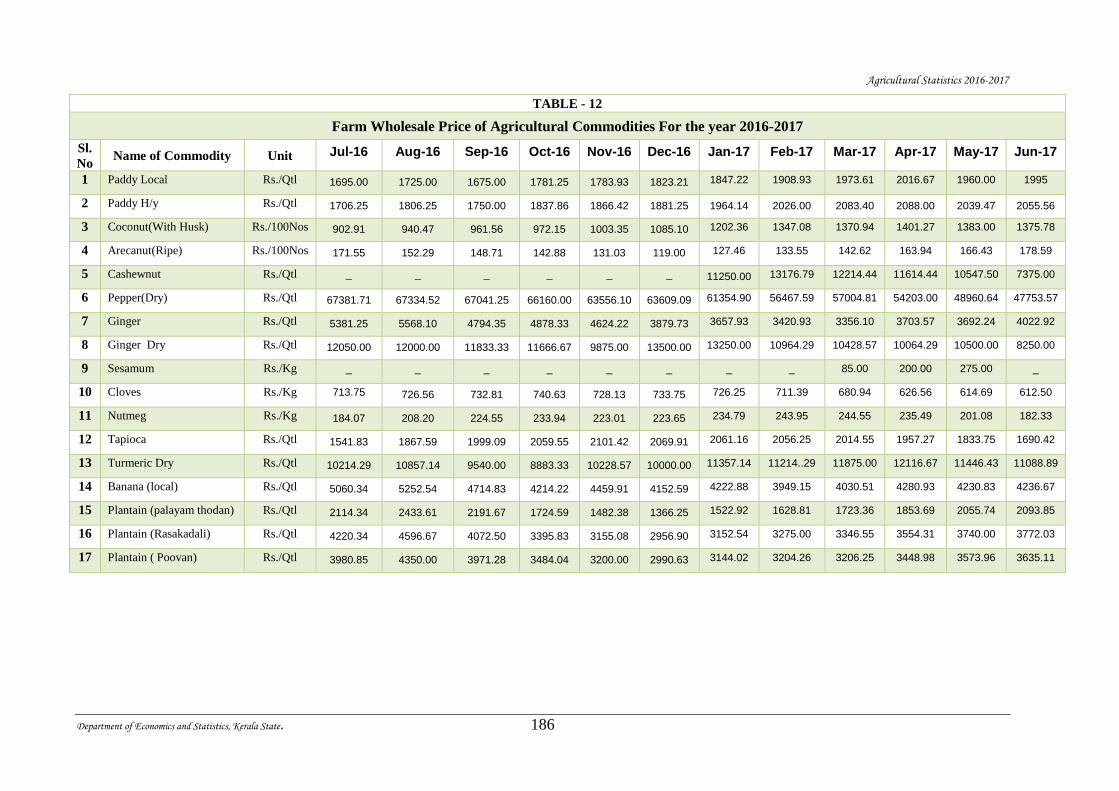
Agricultural Statistics 2016-2017
Department of Economics and Statistics, Kerala State. 186
TABLE - 12
Farm Wholesale Price of Agricultural Commodities For the year 2016-2017
Sl.
No Name of Commodity Unit Jul-16 Aug-16 Sep-16 Oct-16 Nov-16 Dec-16 Jan-17 Feb-17 Mar-17 Apr-17 May-17 Jun-17
1 Paddy Local Rs./Qtl 1695.00 1725.00 1675.00 1781.25 1783.93 1823.21 1847.22 1908.93 1973.61 2016.67 1960.00 1995
2 Paddy H/y Rs./Qtl 1706.25 1806.25 1750.00 1837.86 1866.42 1881.25 1964.14 2026.00 2083.40 2088.00 2039.47 2055.56
3 Coconut(With Husk) Rs./100Nos 902.91 940.47 961.56 972.15 1003.35 1085.10 1202.36 1347.08 1370.94 1401.27 1383.00 1375.78
4 Arecanut(Ripe) Rs./100Nos 171.55 152.29 148.71 142.88 131.03 119.00 127.46 133.55 142.62 163.94 166.43 178.59
5 Cashewnut Rs./Qtl _ _ _ _ _ _ 11250.00 13176.79 12214.44 11614.44 10547.50 7375.00
6 Pepper(Dry) Rs./Qtl 67381.71 67334.52 67041.25 66160.00 63556.10 63609.09 61354.90 56467.59 57004.81 54203.00 48960.64 47753.57
7 Ginger Rs./Qtl 5381.25 5568.10 4794.35 4878.33 4624.22 3879.73 3657.93 3420.93 3356.10 3703.57 3692.24 4022.92
8 Ginger Dry Rs./Qtl 12050.00 12000.00 11833.33 11666.67 9875.00 13500.00 13250.00 10964.29 10428.57 10064.29 10500.00 8250.00
9 Sesamum Rs./Kg _ _ _ _ _ _ _ _ 85.00 200.00 275.00 _
10 Cloves Rs./Kg 713.75 726.56 732.81 740.63 728.13 733.75 726.25 711.39 680.94 626.56 614.69 612.50
11 Nutmeg Rs./Kg 184.07 208.20 224.55 233.94 223.01 223.65 234.79 243.95 244.55 235.49 201.08 182.33
12 Tapioca Rs./Qtl 1541.83 1867.59 1999.09 2059.55 2101.42 2069.91 2061.16 2056.25 2014.55 1957.27 1833.75 1690.42
13 Turmeric Dry Rs./Qtl 10214.29 10857.14 9540.00 8883.33 10228.57 10000.00 11357.14 11214..29 11875.00 12116.67 11446.43 11088.89
14 Banana (local) Rs./Qtl 5060.34 5252.54 4714.83 4214.22 4459.91 4152.59 4222.88 3949.15 4030.51 4280.93 4230.83 4236.67
15 Plantain (palayam thodan) Rs./Qtl 2114.34 2433.61 2191.67 1724.59 1482.38 1366.25 1522.92 1628.81 1723.36 1853.69 2055.74 2093.85
16 Plantain (Rasakadali) Rs./Qtl 4220.34 4596.67 4072.50 3395.83 3155.08 2956.90 3152.54 3275.00 3346.55 3554.31 3740.00 3772.03
17 Plantain ( Poovan) Rs./Qtl 3980.85 4350.00 3971.28 3484.04 3200.00 2990.63 3144.02 3204.26 3206.25 3448.98 3573.96 3635.11
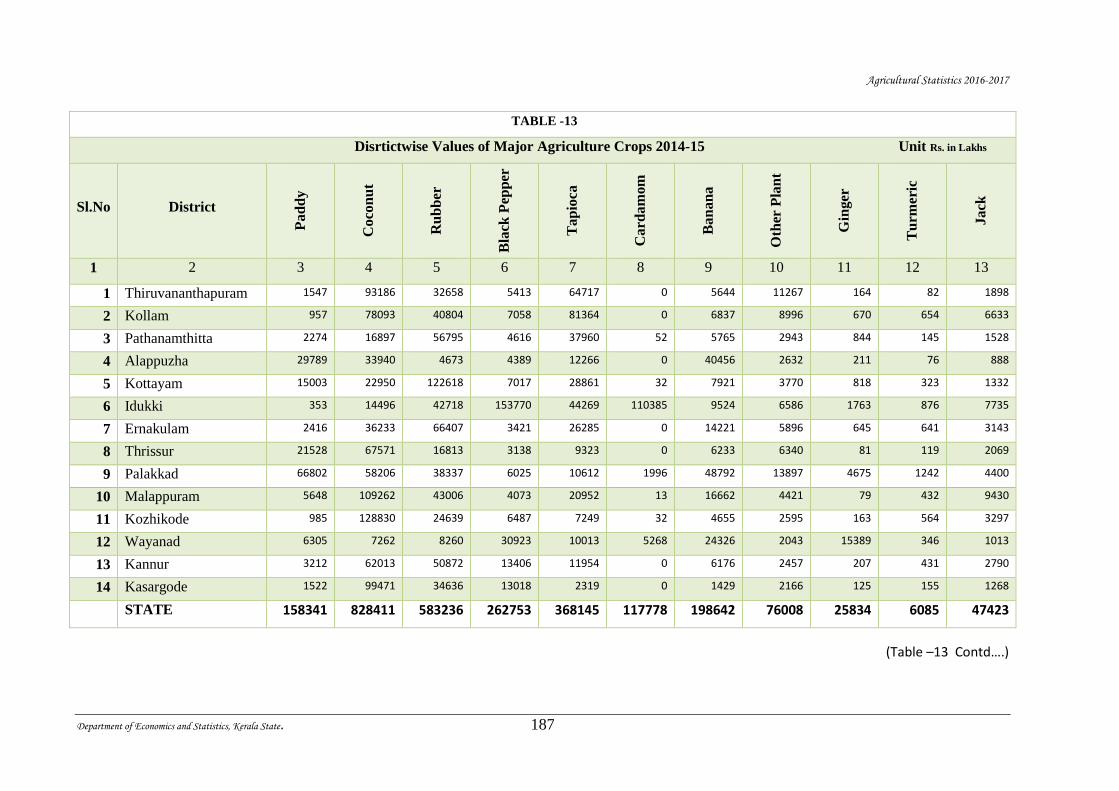
Agricultural Statistics 2016-2017
Department of Economics and Statistics, Kerala State. 187
TABLE -13
Disrtictwise Values of Major Agriculture Crops 2014-15 Unit Rs. in Lakhs
Sl.No District
Pad
dy
Coco
nu
t
Ru
bb
er
Bla
ck P
epp
er
Tap
ioca
Card
am
om
Ban
an
a
Oth
er P
lan
t
Gin
ger
Tu
rmer
ic
Jack
1 2 3 4 5 6 7 8 9 10 11 12 13
1 Thiruvananthapuram 1547 93186 32658 5413 64717 0 5644 11267 164 82 1898
2 Kollam 957 78093 40804 7058 81364 0 6837 8996 670 654 6633
3 Pathanamthitta 2274 16897 56795 4616 37960 52 5765 2943 844 145 1528
4 Alappuzha 29789 33940 4673 4389 12266 0 40456 2632 211 76 888
5 Kottayam 15003 22950 122618 7017 28861 32 7921 3770 818 323 1332
6 Idukki 353 14496 42718 153770 44269 110385 9524 6586 1763 876 7735
7 Ernakulam 2416 36233 66407 3421 26285 0 14221 5896 645 641 3143
8 Thrissur 21528 67571 16813 3138 9323 0 6233 6340 81 119 2069
9 Palakkad 66802 58206 38337 6025 10612 1996 48792 13897 4675 1242 4400
10 Malappuram 5648 109262 43006 4073 20952 13 16662 4421 79 432 9430
11 Kozhikode 985 128830 24639 6487 7249 32 4655 2595 163 564 3297
12 Wayanad 6305 7262 8260 30923 10013 5268 24326 2043 15389 346 1013
13 Kannur 3212 62013 50872 13406 11954 0 6176 2457 207 431 2790
14 Kasargode 1522 99471 34636 13018 2319 0 1429 2166 125 155 1268
STATE 158341 828411 583236 262753 368145 117778 198642 76008 25834 6085 47423
(Table –13 Contd….)
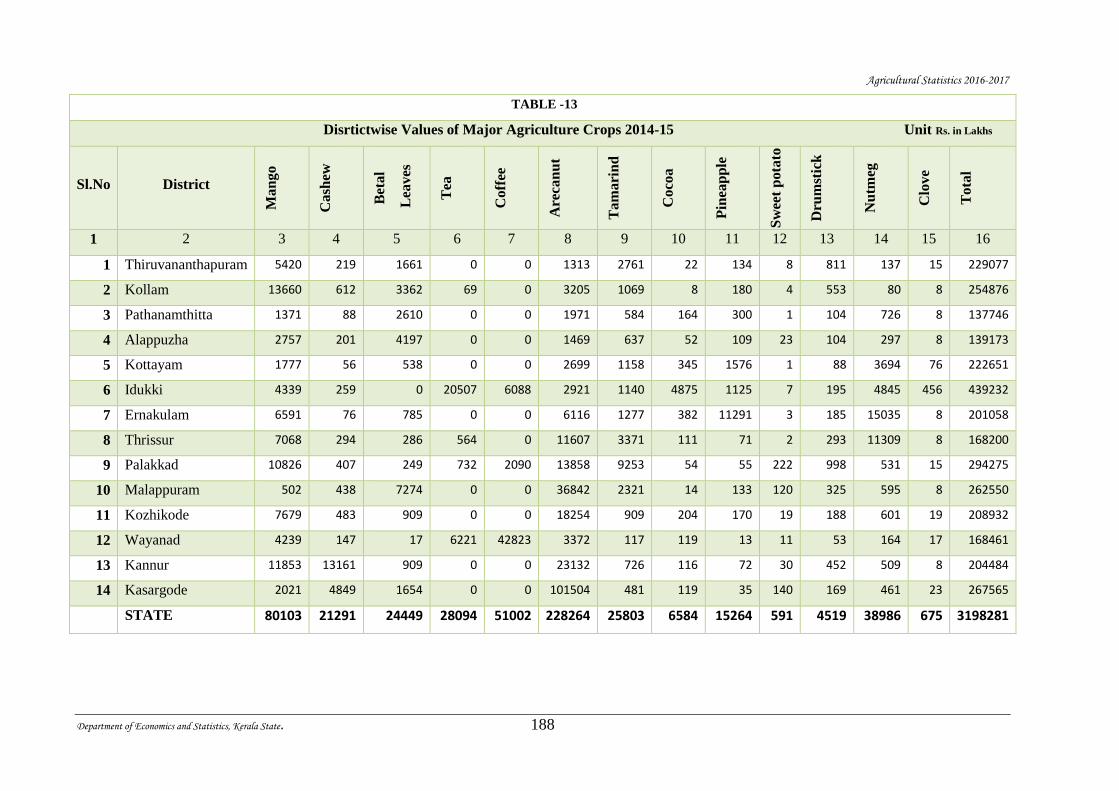
Agricultural Statistics 2016-2017
Department of Economics and Statistics, Kerala State. 188
TABLE -13
Disrtictwise Values of Major Agriculture Crops 2014-15 Unit Rs. in Lakhs
Sl.No District
Man
go
Cash
ew
Bet
al
Lea
ves
Tea
Coff
ee
Are
can
ut
Tam
ari
nd
Coco
a
Pin
eap
ple
Sw
eet
pota
to
Dru
mst
ick
Nu
tmeg
Clo
ve
Tota
l
1 2 3 4 5 6 7 8 9 10 11 12 13 14 15 16
1 Thiruvananthapuram 5420 219 1661 0 0 1313 2761 22 134 8 811 137 15 229077
2 Kollam 13660 612 3362 69 0 3205 1069 8 180 4 553 80 8 254876
3 Pathanamthitta 1371 88 2610 0 0 1971 584 164 300 1 104 726 8 137746
4 Alappuzha 2757 201 4197 0 0 1469 637 52 109 23 104 297 8 139173
5 Kottayam 1777 56 538 0 0 2699 1158 345 1576 1 88 3694 76 222651
6 Idukki 4339 259 0 20507 6088 2921 1140 4875 1125 7 195 4845 456 439232
7 Ernakulam 6591 76 785 0 0 6116 1277 382 11291 3 185 15035 8 201058
8 Thrissur 7068 294 286 564 0 11607 3371 111 71 2 293 11309 8 168200
9 Palakkad 10826 407 249 732 2090 13858 9253 54 55 222 998 531 15 294275
10 Malappuram 502 438 7274 0 0 36842 2321 14 133 120 325 595 8 262550
11 Kozhikode 7679 483 909 0 0 18254 909 204 170 19 188 601 19 208932
12 Wayanad 4239 147 17 6221 42823 3372 117 119 13 11 53 164 17 168461
13 Kannur 11853 13161 909 0 0 23132 726 116 72 30 452 509 8 204484
14 Kasargode 2021 4849 1654 0 0 101504 481 119 35 140 169 461 23 267565
STATE 80103 21291 24449 28094 51002 228264 25803 6584 15264 591 4519 38986 675 3198281
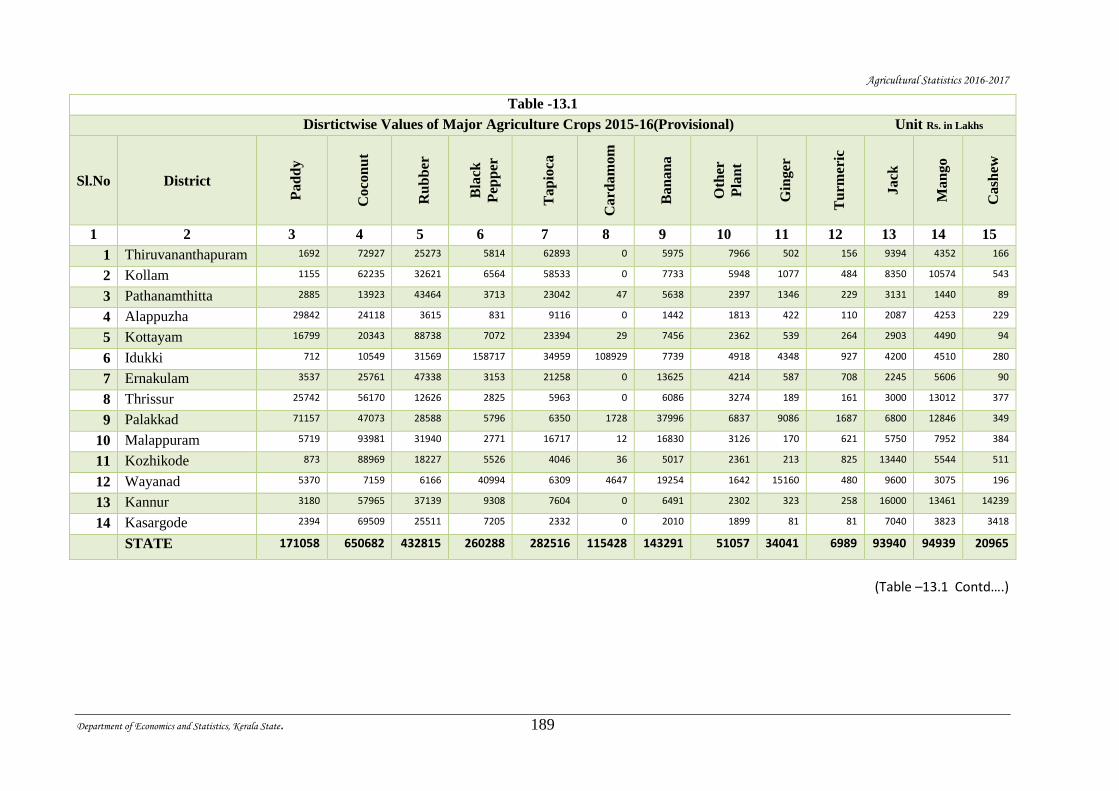
Agricultural Statistics 2016-2017
Department of Economics and Statistics, Kerala State. 189
Table -13.1
Disrtictwise Values of Major Agriculture Crops 2015-16(Provisional) Unit Rs. in Lakhs
Sl.No District
Pad
dy
Coco
nu
t
Ru
bb
er
Bla
ck
Pep
per
Tap
ioca
Card
am
om
Ban
an
a
Oth
er
Pla
nt
Gin
ger
Tu
rmer
ic
Jack
Man
go
Cash
ew
1 2 3 4 5 6 7 8 9 10 11 12 13 14 15
1 Thiruvananthapuram 1692 72927 25273 5814 62893 0 5975 7966 502 156 9394 4352 166
2 Kollam 1155 62235 32621 6564 58533 0 7733 5948 1077 484 8350 10574 543
3 Pathanamthitta 2885 13923 43464 3713 23042 47 5638 2397 1346 229 3131 1440 89
4 Alappuzha 29842 24118 3615 831 9116 0 1442 1813 422 110 2087 4253 229
5 Kottayam 16799 20343 88738 7072 23394 29 7456 2362 539 264 2903 4490 94
6 Idukki 712 10549 31569 158717 34959 108929 7739 4918 4348 927 4200 4510 280
7 Ernakulam 3537 25761 47338 3153 21258 0 13625 4214 587 708 2245 5606 90
8 Thrissur 25742 56170 12626 2825 5963 0 6086 3274 189 161 3000 13012 377
9 Palakkad 71157 47073 28588 5796 6350 1728 37996 6837 9086 1687 6800 12846 349
10 Malappuram 5719 93981 31940 2771 16717 12 16830 3126 170 621 5750 7952 384
11 Kozhikode 873 88969 18227 5526 4046 36 5017 2361 213 825 13440 5544 511
12 Wayanad 5370 7159 6166 40994 6309 4647 19254 1642 15160 480 9600 3075 196
13 Kannur 3180 57965 37139 9308 7604 0 6491 2302 323 258 16000 13461 14239
14 Kasargode 2394 69509 25511 7205 2332 0 2010 1899 81 81 7040 3823 3418
STATE 171058 650682 432815 260288 282516 115428 143291 51057 34041 6989 93940 94939 20965
(Table –13.1 Contd….)
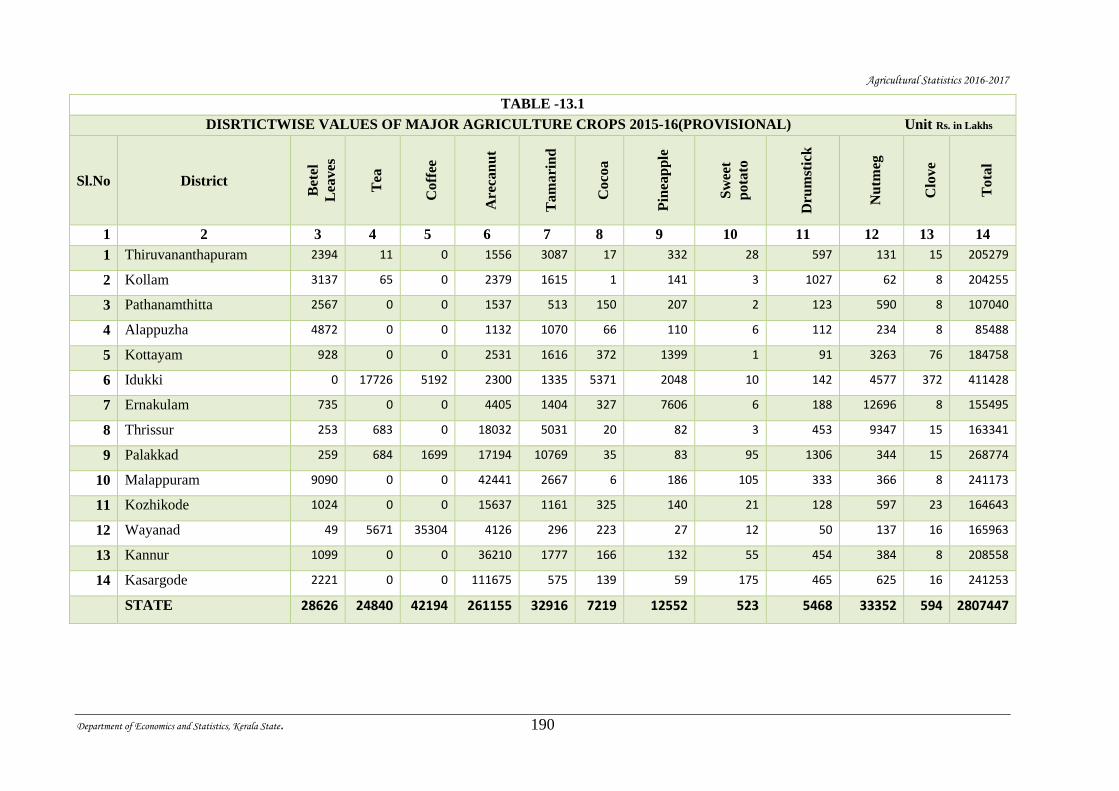
Agricultural Statistics 2016-2017
Department of Economics and Statistics, Kerala State. 190
TABLE -13.1
DISRTICTWISE VALUES OF MAJOR AGRICULTURE CROPS 2015-16(PROVISIONAL) Unit Rs. in Lakhs
Sl.No District
Bet
el
Lea
ves
Tea
Coff
ee
Are
can
ut
Tam
ari
nd
Coco
a
Pin
eap
ple
Sw
eet
pota
to
Dru
mst
ick
Nu
tmeg
Clo
ve
Tota
l
1 2 3 4 5 6 7 8 9 10 11 12 13 14
1 Thiruvananthapuram 2394 11 0 1556 3087 17 332 28 597 131 15 205279
2 Kollam 3137 65 0 2379 1615 1 141 3 1027 62 8 204255
3 Pathanamthitta 2567 0 0 1537 513 150 207 2 123 590 8 107040
4 Alappuzha 4872 0 0 1132 1070 66 110 6 112 234 8 85488
5 Kottayam 928 0 0 2531 1616 372 1399 1 91 3263 76 184758
6 Idukki 0 17726 5192 2300 1335 5371 2048 10 142 4577 372 411428
7 Ernakulam 735 0 0 4405 1404 327 7606 6 188 12696 8 155495
8 Thrissur 253 683 0 18032 5031 20 82 3 453 9347 15 163341
9 Palakkad 259 684 1699 17194 10769 35 83 95 1306 344 15 268774
10 Malappuram 9090 0 0 42441 2667 6 186 105 333 366 8 241173
11 Kozhikode 1024 0 0 15637 1161 325 140 21 128 597 23 164643
12 Wayanad 49 5671 35304 4126 296 223 27 12 50 137 16 165963
13 Kannur 1099 0 0 36210 1777 166 132 55 454 384 8 208558
14 Kasargode 2221 0 0 111675 575 139 59 175 465 625 16 241253
STATE 28626 24840 42194 261155 32916 7219 12552 523 5468 33352 594 2807447
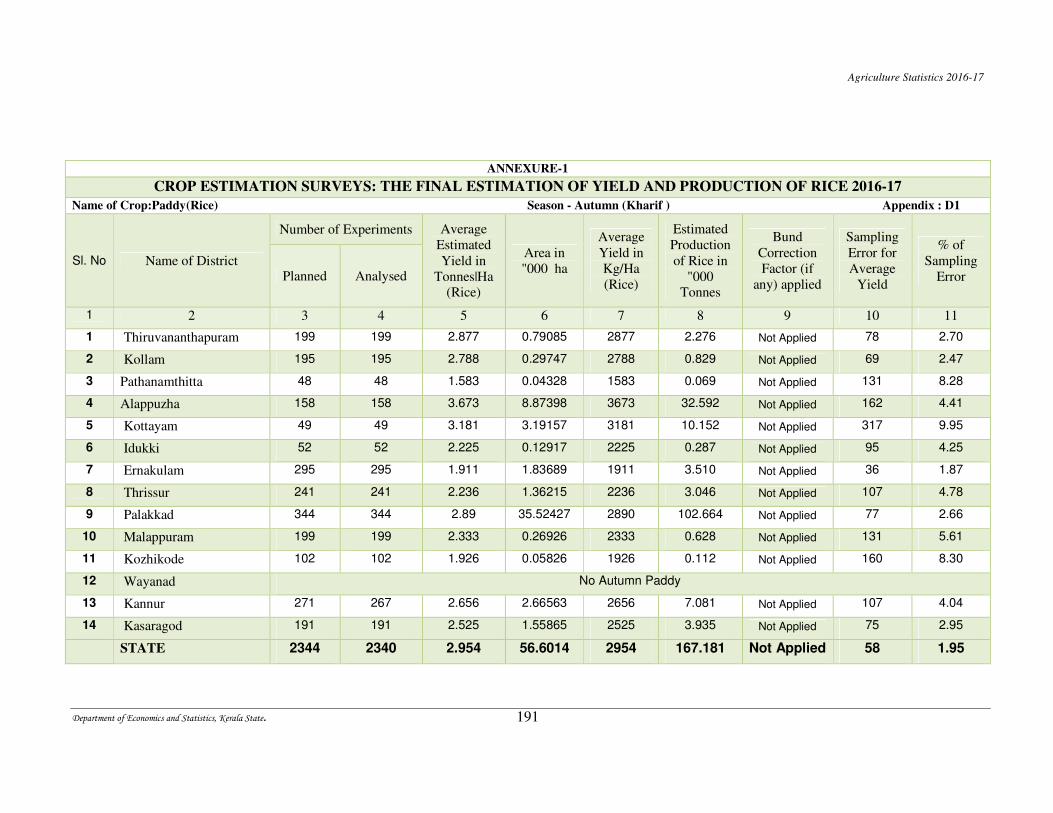
Agriculture Statistics 2016-17
Department of Economics and Statistics, Kerala State. 191
ANNEXURE-1
CROP ESTIMATION SURVEYS: THE FINAL ESTIMATION OF YIELD AND PRODUCTION OF RICE 2016-17
Name of Crop:Paddy(Rice) Season - Autumn (Kharif ) Appendix : D1
Sl. No Name of District
Number of Experiments Average
Estimated
Yield in
Tonnes|Ha
(Rice)
Area in
"000 ha
Average
Yield in
Kg/Ha
(Rice)
Estimated
Production
of Rice in
"000
Tonnes
Bund
Correction
Factor (if
any) applied
Sampling
Error for
Average
Yield
% of
Sampling
Error Planned Analysed
1 2 3 4 5 6 7 8 9 10 11
1 Thiruvananthapuram 199 199 2.877 0.79085 2877 2.276 Not Applied 78 2.70
2 Kollam 195 195 2.788 0.29747 2788 0.829 Not Applied 69 2.47
3 Pathanamthitta 48 48 1.583 0.04328 1583 0.069 Not Applied 131 8.28
4 Alappuzha 158 158 3.673 8.87398 3673 32.592 Not Applied 162 4.41
5 Kottayam 49 49 3.181 3.19157 3181 10.152 Not Applied 317 9.95
6 Idukki 52 52 2.225 0.12917 2225 0.287 Not Applied 95 4.25
7 Ernakulam 295 295 1.911 1.83689 1911 3.510 Not Applied 36 1.87
8 Thrissur 241 241 2.236 1.36215 2236 3.046 Not Applied 107 4.78
9 Palakkad 344 344 2.89 35.52427 2890 102.664 Not Applied 77 2.66
10 Malappuram 199 199 2.333 0.26926 2333 0.628 Not Applied 131 5.61
11 Kozhikode 102 102 1.926 0.05826 1926 0.112 Not Applied 160 8.30
12 Wayanad No Autumn Paddy
13 Kannur 271 267 2.656 2.66563 2656 7.081 Not Applied 107 4.04
14 Kasaragod 191 191 2.525 1.55865 2525 3.935 Not Applied 75 2.95
STATE 2344 2340 2.954 56.6014 2954 167.181 Not Applied 58 1.95
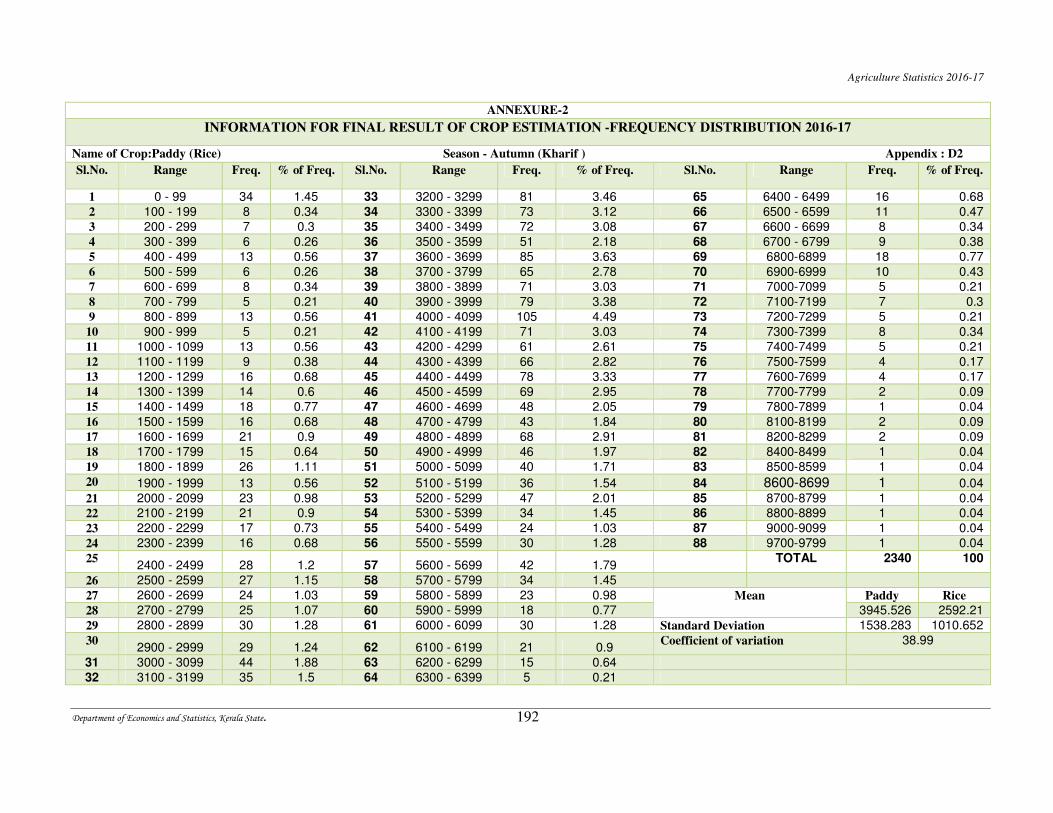
Agriculture Statistics 2016-17
Department of Economics and Statistics, Kerala State. 192
ANNEXURE-2
INFORMATION FOR FINAL RESULT OF CROP ESTIMATION -FREQUENCY DISTRIBUTION 2016-17
Name of Crop:Paddy (Rice) Season - Autumn (Kharif ) Appendix : D2
Sl.No. Range Freq. % of Freq. Sl.No. Range Freq. % of Freq. Sl.No. Range Freq. % of Freq.
1 0 - 99 34 1.45 33 3200 - 3299 81 3.46 65 6400 - 6499 16 0.68
2 100 - 199 8 0.34 34 3300 - 3399 73 3.12 66 6500 - 6599 11 0.47
3 200 - 299 7 0.3 35 3400 - 3499 72 3.08 67 6600 - 6699 8 0.34
4 300 - 399 6 0.26 36 3500 - 3599 51 2.18 68 6700 - 6799 9 0.38
5 400 - 499 13 0.56 37 3600 - 3699 85 3.63 69 6800-6899 18 0.77
6 500 - 599 6 0.26 38 3700 - 3799 65 2.78 70 6900-6999 10 0.43
7 600 - 699 8 0.34 39 3800 - 3899 71 3.03 71 7000-7099 5 0.21
8 700 - 799 5 0.21 40 3900 - 3999 79 3.38 72 7100-7199 7 0.3
9 800 - 899 13 0.56 41 4000 - 4099 105 4.49 73 7200-7299 5 0.21
10 900 - 999 5 0.21 42 4100 - 4199 71 3.03 74 7300-7399 8 0.34
11 1000 - 1099 13 0.56 43 4200 - 4299 61 2.61 75 7400-7499 5 0.21
12 1100 - 1199 9 0.38 44 4300 - 4399 66 2.82 76 7500-7599 4 0.17
13 1200 - 1299 16 0.68 45 4400 - 4499 78 3.33 77 7600-7699 4 0.17
14 1300 - 1399 14 0.6 46 4500 - 4599 69 2.95 78 7700-7799 2 0.09
15 1400 - 1499 18 0.77 47 4600 - 4699 48 2.05 79 7800-7899 1 0.04
16 1500 - 1599 16 0.68 48 4700 - 4799 43 1.84 80 8100-8199 2 0.09
17 1600 - 1699 21 0.9 49 4800 - 4899 68 2.91 81 8200-8299 2 0.09
18 1700 - 1799 15 0.64 50 4900 - 4999 46 1.97 82 8400-8499 1 0.04
19 1800 - 1899 26 1.11 51 5000 - 5099 40 1.71 83 8500-8599 1 0.04
20 1900 - 1999 13 0.56 52 5100 - 5199 36 1.54 84 8600-8699 1 0.04
21 2000 - 2099 23 0.98 53 5200 - 5299 47 2.01 85 8700-8799 1 0.04
22 2100 - 2199 21 0.9 54 5300 - 5399 34 1.45 86 8800-8899 1 0.04
23 2200 - 2299 17 0.73 55 5400 - 5499 24 1.03 87 9000-9099 1 0.04
24 2300 - 2399 16 0.68 56 5500 - 5599 30 1.28 88 9700-9799 1 0.04
25 2400 - 2499 28 1.2 57 5600 - 5699 42 1.79
TOTAL 2340 100
26 2500 - 2599 27 1.15 58 5700 - 5799 34 1.45
27 2600 - 2699 24 1.03 59 5800 - 5899 23 0.98 Mean Paddy Rice
28 2700 - 2799 25 1.07 60 5900 - 5999 18 0.77 3945.526 2592.21
29 2800 - 2899 30 1.28 61 6000 - 6099 30 1.28 Standard Deviation 1538.283 1010.652
30 2900 - 2999 29 1.24 62 6100 - 6199 21 0.9
Coefficient of variation 38.99
31 3000 - 3099 44 1.88 63 6200 - 6299 15 0.64
32 3100 - 3199 35 1.5 64 6300 - 6399 5 0.21
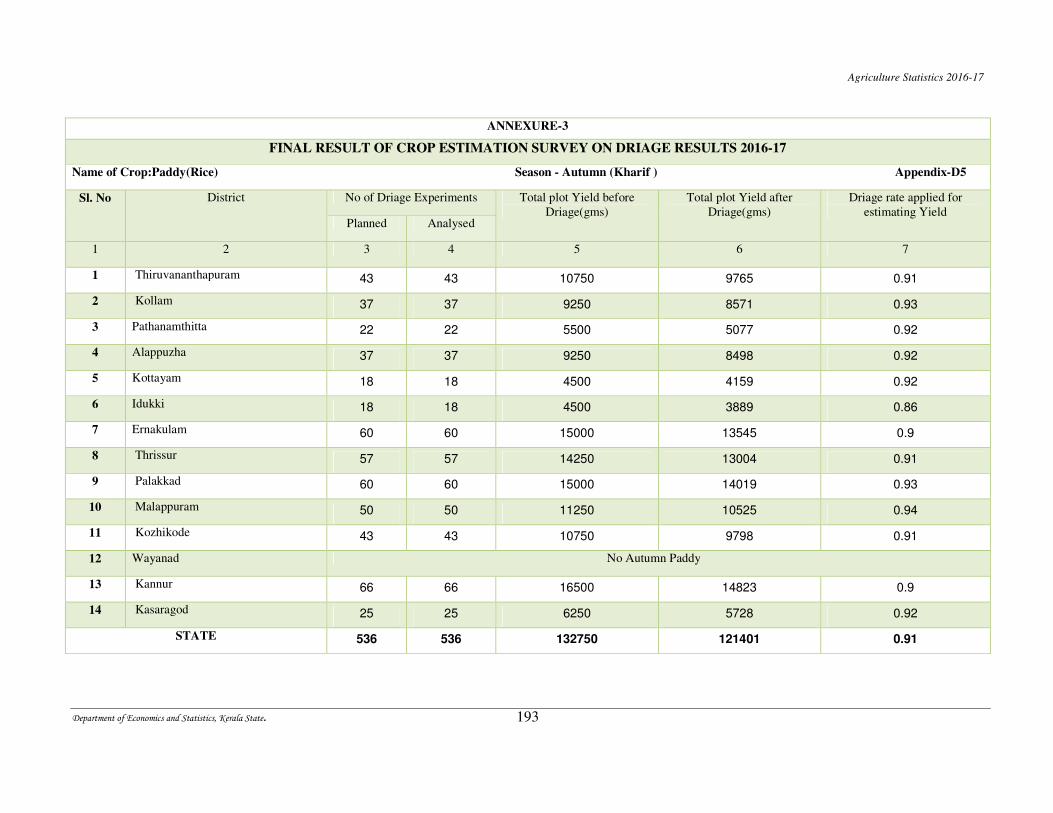
Agriculture Statistics 2016-17
Department of Economics and Statistics, Kerala State. 193
ANNEXURE-3
FINAL RESULT OF CROP ESTIMATION SURVEY ON DRIAGE RESULTS 2016-17
Name of Crop:Paddy(Rice) Season - Autumn (Kharif ) Appendix-D5
Sl. No District No of Driage Experiments Total plot Yield before
Driage(gms)
Total plot Yield after
Driage(gms)
Driage rate applied for
estimating Yield Planned Analysed
1 2 3 4 5 6 7
1 Thiruvananthapuram 43 43 10750 9765 0.91
2 Kollam 37 37 9250 8571 0.93
3 Pathanamthitta 22 22 5500 5077 0.92
4 Alappuzha 37 37 9250 8498 0.92
5 Kottayam 18 18 4500 4159 0.92
6 Idukki 18 18 4500 3889 0.86
7 Ernakulam 60 60 15000 13545 0.9
8 Thrissur 57 57 14250 13004 0.91
9 Palakkad 60 60 15000 14019 0.93
10 Malappuram 50 50 11250 10525 0.94
11 Kozhikode 43 43 10750 9798 0.91
12 Wayanad No Autumn Paddy
13 Kannur 66 66 16500 14823 0.9
14 Kasaragod 25 25 6250 5728 0.92
STATE 536 536 132750 121401 0.91
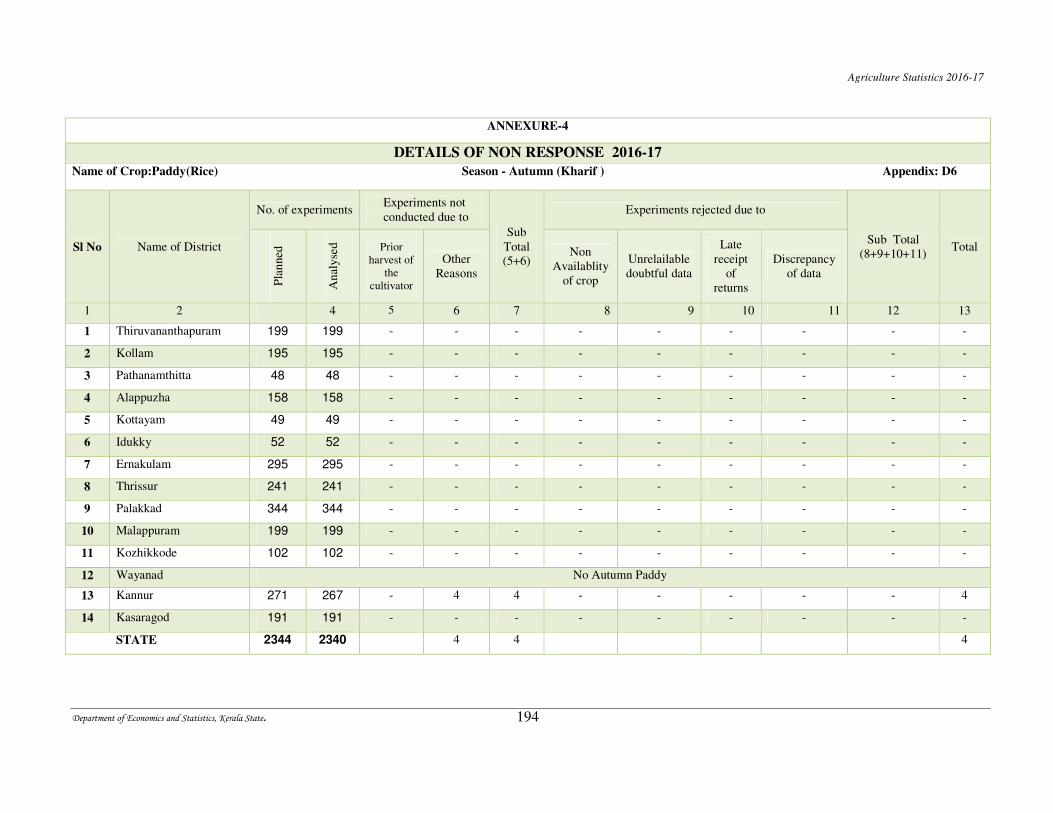
Agriculture Statistics 2016-17
Department of Economics and Statistics, Kerala State. 194
ANNEXURE-4
DETAILS OF NON RESPONSE 2016-17
Name of Crop:Paddy(Rice) Season - Autumn (Kharif ) Appendix: D6
Sl No Name of District
No. of experiments Experiments not
conducted due to
Sub
Total
(5+6)
Experiments rejected due to
Sub Total
(8+9+10+11) Total
Pla
nned
Anal
yse
d
Prior
harvest of
the
cultivator
Other
Reasons
Non
Availablity
of crop
Unrelailable
doubtful data
Late
receipt
of
returns
Discrepancy
of data
1 2 4 5 6 7 8 9 10 11 12 13
1 Thiruvananthapuram 199 199 - - - - - - - - -
2 Kollam 195 195 - - - - - - - - -
3 Pathanamthitta 48 48 - - - - - - - - -
4 Alappuzha 158 158 - - - - - - - - -
5 Kottayam 49 49 - - - - - - - - -
6 Idukky 52 52 - - - - - - - - -
7 Ernakulam 295 295 - - - - - - - - -
8 Thrissur 241 241 - - - - - - - - -
9 Palakkad 344 344 - - - - - - - - -
10 Malappuram 199 199 - - - - - - - - -
11 Kozhikkode 102 102 - - - - - - - - -
12 Wayanad No Autumn Paddy
13 Kannur 271 267 - 4 4 - - - - - 4
14 Kasaragod 191 191 - - - - - - - - -
STATE 2344 2340 4 4 4
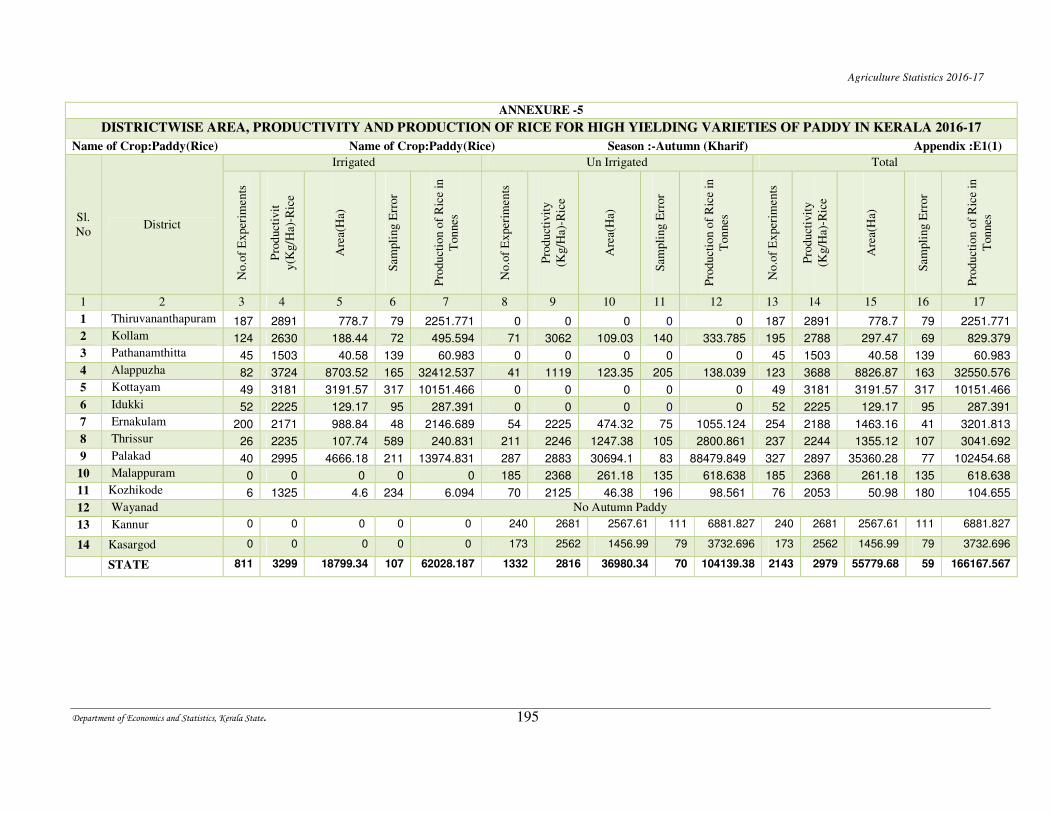
Agriculture Statistics 2016-17
Department of Economics and Statistics, Kerala State. 195
ANNEXURE -5
DISTRICTWISE AREA, PRODUCTIVITY AND PRODUCTION OF RICE FOR HIGH YIELDING VARIETIES OF PADDY IN KERALA 2016-17
Name of Crop:Paddy(Rice) Name of Crop:Paddy(Rice) Season :-Autumn (Kharif) Appendix :E1(1)
Sl.
No District
Irrigated Un Irrigated Total
No.o
f E
xper
iments
Pro
duct
ivit
y(K
g/H
a)-R
ice
Are
a(H
a)
Sam
pli
ng E
rror
Pro
duct
ion o
f R
ice
in
Ton
nes
No.o
f E
xper
iments
Pro
duct
ivit
y
(Kg/H
a)-R
ice
Are
a(H
a)
Sam
pli
ng E
rror
Pro
duct
ion o
f R
ice
in
Ton
nes
No.o
f E
xper
iments
Pro
duct
ivit
y
(Kg/H
a)-R
ice
Are
a(H
a)
Sam
pli
ng E
rror
Pro
duct
ion o
f R
ice
in
Ton
nes
1 2 3 4 5 6 7 8 9 10 11 12 13 14 15 16 17
1 Thiruvananthapuram 187 2891 778.7 79 2251.771 0 0 0 0 0 187 2891 778.7 79 2251.771
2 Kollam 124 2630 188.44 72 495.594 71 3062 109.03 140 333.785 195 2788 297.47 69 829.379
3 Pathanamthitta 45 1503 40.58 139 60.983 0 0 0 0 0 45 1503 40.58 139 60.983
4 Alappuzha 82 3724 8703.52 165 32412.537 41 1119 123.35 205 138.039 123 3688 8826.87 163 32550.576
5 Kottayam 49 3181 3191.57 317 10151.466 0 0 0 0 0 49 3181 3191.57 317 10151.466
6 Idukki 52 2225 129.17 95 287.391 0 0 0 0 0 52 2225 129.17 95 287.391
7 Ernakulam 200 2171 988.84 48 2146.689 54 2225 474.32 75 1055.124 254 2188 1463.16 41 3201.813
8 Thrissur 26 2235 107.74 589 240.831 211 2246 1247.38 105 2800.861 237 2244 1355.12 107 3041.692
9 Palakad 40 2995 4666.18 211 13974.831 287 2883 30694.1 83 88479.849 327 2897 35360.28 77 102454.68
10 Malappuram 0 0 0 0 0 185 2368 261.18 135 618.638 185 2368 261.18 135 618.638
11 Kozhikode 6 1325 4.6 234 6.094 70 2125 46.38 196 98.561 76 2053 50.98 180 104.655
12 Wayanad No Autumn Paddy
13 Kannur 0 0 0 0 0 240 2681 2567.61 111 6881.827 240 2681 2567.61 111 6881.827
14 Kasargod 0 0 0 0 0 173 2562 1456.99 79 3732.696 173 2562 1456.99 79 3732.696
STATE 811 3299 18799.34 107 62028.187 1332 2816 36980.34 70 104139.38 2143 2979 55779.68 59 166167.567
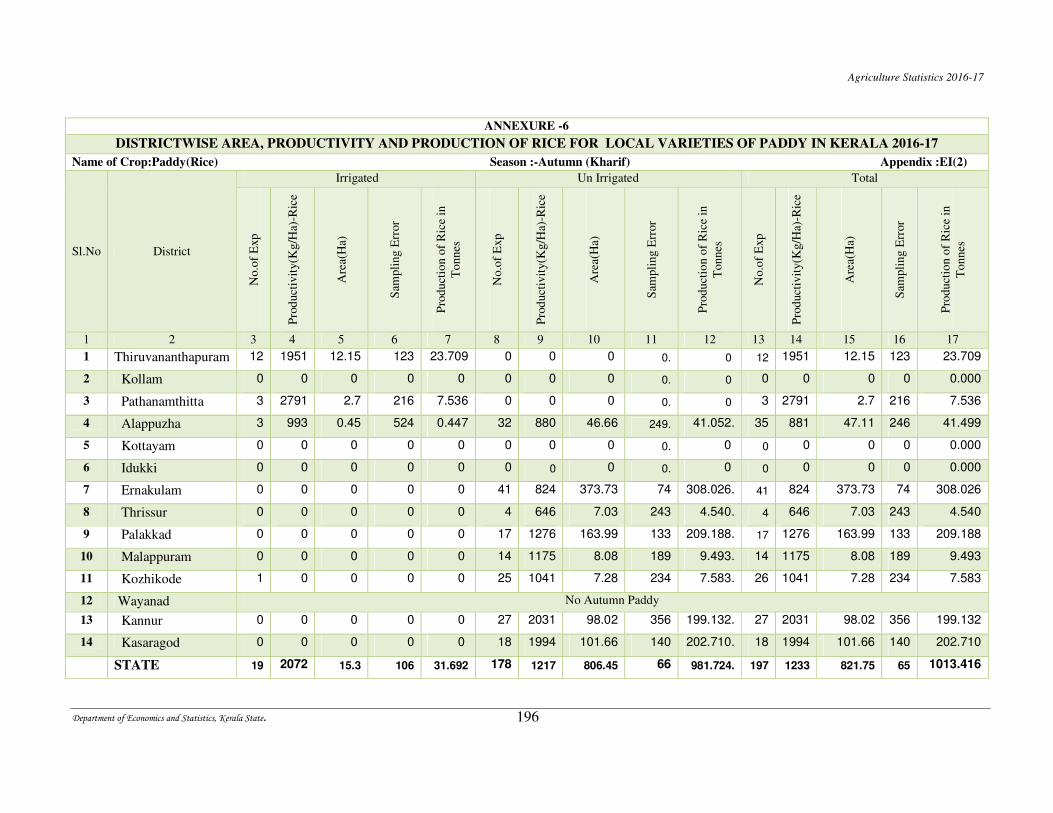
Agriculture Statistics 2016-17
Department of Economics and Statistics, Kerala State. 196
ANNEXURE -6
DISTRICTWISE AREA, PRODUCTIVITY AND PRODUCTION OF RICE FOR LOCAL VARIETIES OF PADDY IN KERALA 2016-17
Name of Crop:Paddy(Rice) Season :-Autumn (Kharif) Appendix :EI(2)
Sl.No District
Irrigated Un Irrigated Total
No.o
f E
xp
Pro
duct
ivit
y(K
g/H
a)-R
ice
Are
a(H
a)
Sam
pli
ng E
rror
Pro
duct
ion o
f R
ice
in
Tonnes
No.o
f E
xp
Pro
duct
ivit
y(K
g/H
a)-R
ice
Are
a(H
a)
Sam
pli
ng E
rror
Pro
duct
ion o
f R
ice
in
Tonnes
No.o
f E
xp
Pro
duct
ivit
y(K
g/H
a)-R
ice
Are
a(H
a)
Sam
pli
ng E
rror
Pro
duct
ion o
f R
ice
in
Tonnes
1 2 3 4 5 6 7 8 9 10 11 12 13 14 15 16 17
1 Thiruvananthapuram 12 1951 12.15 123 23.709 0 0 0 0. 0 12 1951 12.15 123 23.709
2 Kollam 0 0 0 0 0 0 0 0 0. 0 0 0 0 0 0.000
3 Pathanamthitta 3 2791 2.7 216 7.536 0 0 0 0. 0 3 2791 2.7 216 7.536
4 Alappuzha 3 993 0.45 524 0.447 32 880 46.66 249. 41.052. 35 881 47.11 246 41.499
5 Kottayam 0 0 0 0 0 0 0 0 0. 0 0 0 0 0 0.000
6 Idukki 0 0 0 0 0 0 0 0 0. 0 0 0 0 0 0.000
7 Ernakulam 0 0 0 0 0 41 824 373.73 74 308.026. 41 824 373.73 74 308.026
8 Thrissur 0 0 0 0 0 4 646 7.03 243 4.540. 4 646 7.03 243 4.540
9 Palakkad 0 0 0 0 0 17 1276 163.99 133 209.188. 17 1276 163.99 133 209.188
10 Malappuram 0 0 0 0 0 14 1175 8.08 189 9.493. 14 1175 8.08 189 9.493
11 Kozhikode 1 0 0 0 0 25 1041 7.28 234 7.583. 26 1041 7.28 234 7.583
12 Wayanad No Autumn Paddy
13 Kannur 0 0 0 0 0 27 2031 98.02 356 199.132. 27 2031 98.02 356 199.132
14 Kasaragod 0 0 0 0 0 18 1994 101.66 140 202.710. 18 1994 101.66 140 202.710
STATE 19 2072 15.3 106 31.692 178 1217 806.45 66 981.724. 197 1233 821.75 65 1013.416
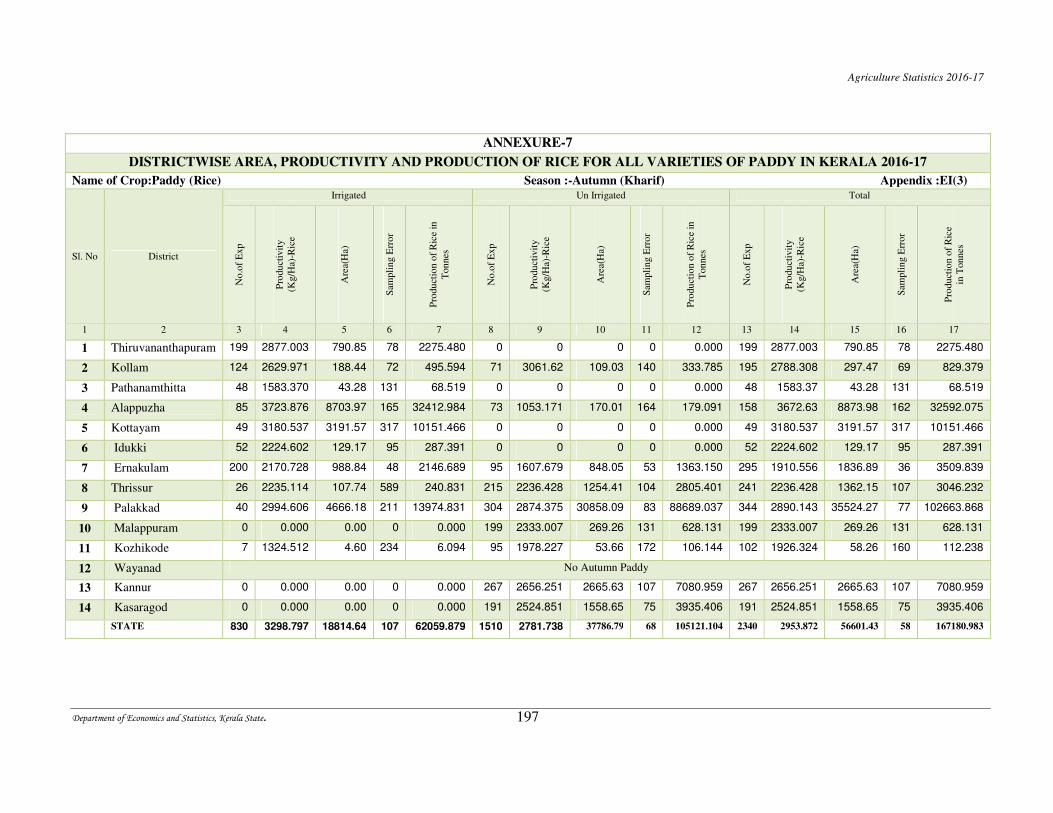
Agriculture Statistics 2016-17
Department of Economics and Statistics, Kerala State. 197
ANNEXURE-7
DISTRICTWISE AREA, PRODUCTIVITY AND PRODUCTION OF RICE FOR ALL VARIETIES OF PADDY IN KERALA 2016-17
Name of Crop:Paddy (Rice) Season :-Autumn (Kharif) Appendix :EI(3)
Sl. No District
Irrigated Un Irrigated Total
No
.of
Ex
p
Pro
du
ctiv
ity
(Kg/H
a)-R
ice
Are
a(H
a)
Sam
pli
ng E
rro
r
Pro
du
ctio
n o
f R
ice
in
Ton
nes
No
.of
Ex
p
Pro
du
ctiv
ity
(Kg/H
a)-R
ice
Are
a(H
a)
Sam
pli
ng E
rro
r
Pro
du
ctio
n o
f R
ice
in
Ton
nes
No
.of
Ex
p
Pro
du
ctiv
ity
(Kg/H
a)-R
ice
Are
a(H
a)
Sam
pli
ng E
rro
r
Pro
du
ctio
n o
f R
ice
in T
onn
es
1 2 3 4 5 6 7 8 9 10 11 12 13 14 15 16 17
1 Thiruvananthapuram 199 2877.003 790.85 78 2275.480 0 0 0 0 0.000 199 2877.003 790.85 78 2275.480
2 Kollam 124 2629.971 188.44 72 495.594 71 3061.62 109.03 140 333.785 195 2788.308 297.47 69 829.379
3 Pathanamthitta 48 1583.370 43.28 131 68.519 0 0 0 0 0.000 48 1583.37 43.28 131 68.519
4 Alappuzha 85 3723.876 8703.97 165 32412.984 73 1053.171 170.01 164 179.091 158 3672.63 8873.98 162 32592.075
5 Kottayam 49 3180.537 3191.57 317 10151.466 0 0 0 0 0.000 49 3180.537 3191.57 317 10151.466
6 Idukki 52 2224.602 129.17 95 287.391 0 0 0 0 0.000 52 2224.602 129.17 95 287.391
7 Ernakulam 200 2170.728 988.84 48 2146.689 95 1607.679 848.05 53 1363.150 295 1910.556 1836.89 36 3509.839
8 Thrissur 26 2235.114 107.74 589 240.831 215 2236.428 1254.41 104 2805.401 241 2236.428 1362.15 107 3046.232
9 Palakkad 40 2994.606 4666.18 211 13974.831 304 2874.375 30858.09 83 88689.037 344 2890.143 35524.27 77 102663.868
10 Malappuram 0 0.000 0.00 0 0.000 199 2333.007 269.26 131 628.131 199 2333.007 269.26 131 628.131
11 Kozhikode 7 1324.512 4.60 234 6.094 95 1978.227 53.66 172 106.144 102 1926.324 58.26 160 112.238
12 Wayanad No Autumn Paddy
13 Kannur 0 0.000 0.00 0 0.000 267 2656.251 2665.63 107 7080.959 267 2656.251 2665.63 107 7080.959
14 Kasaragod 0 0.000 0.00 0 0.000 191 2524.851 1558.65 75 3935.406 191 2524.851 1558.65 75 3935.406
STATE 830 3298.797 18814.64 107 62059.879 1510 2781.738 37786.79 68 105121.104 2340 2953.872 56601.43 58 167180.983
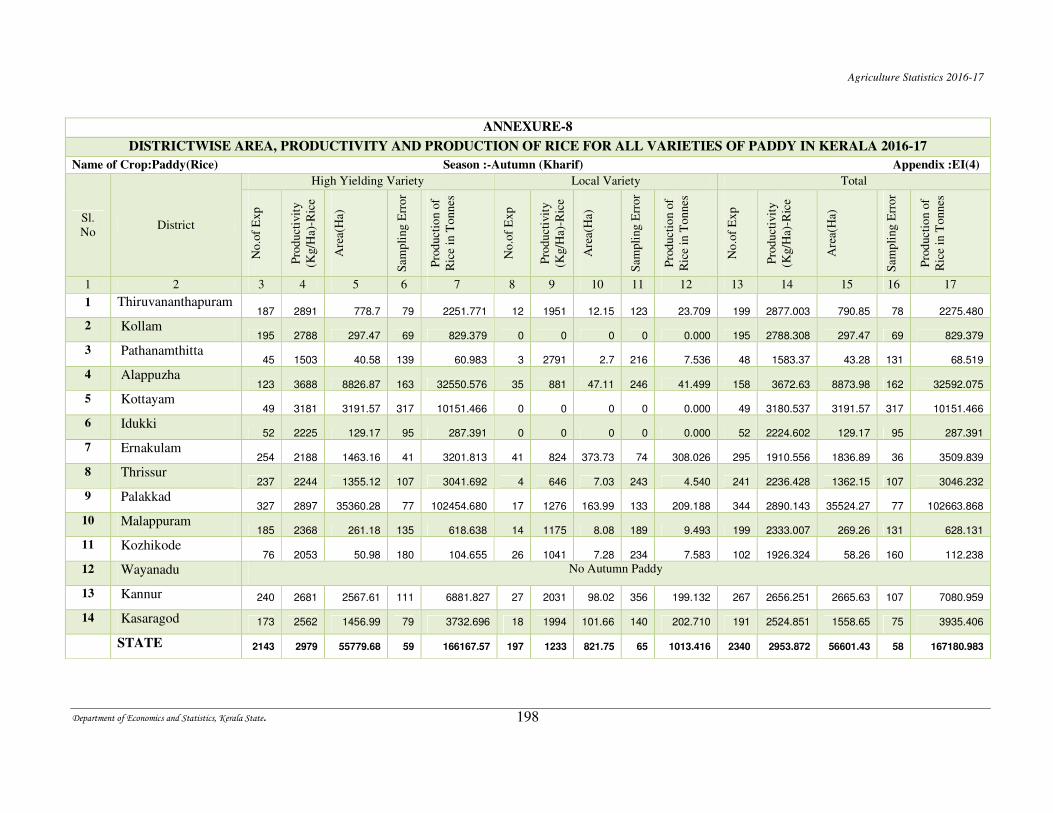
Agriculture Statistics 2016-17
Department of Economics and Statistics, Kerala State. 198
ANNEXURE-8
DISTRICTWISE AREA, PRODUCTIVITY AND PRODUCTION OF RICE FOR ALL VARIETIES OF PADDY IN KERALA 2016-17
Name of Crop:Paddy(Rice) Season :-Autumn (Kharif) Appendix :EI(4)
Sl.
No District
High Yielding Variety Local Variety Total
No.o
f E
xp
Pro
duct
ivit
y
(Kg/H
a)-R
ice
Are
a(H
a)
Sam
pli
ng E
rror
Pro
duct
ion o
f
Ric
e in
Tonnes
No.o
f E
xp
Pro
duct
ivit
y
(Kg/H
a)-R
ice
Are
a(H
a)
Sam
pli
ng E
rror
Pro
duct
ion o
f
Ric
e in
Tonnes
No.o
f E
xp
Pro
duct
ivit
y
(Kg/H
a)-R
ice
Are
a(H
a)
Sam
pli
ng E
rror
Pro
duct
ion o
f
Ric
e in
Tonnes
1 2 3 4 5 6 7 8 9 10 11 12 13 14 15 16 17
1 Thiruvananthapuram 187 2891 778.7 79 2251.771 12 1951 12.15 123 23.709 199 2877.003 790.85 78 2275.480
2 Kollam 195 2788 297.47 69 829.379 0 0 0 0 0.000 195 2788.308 297.47 69 829.379
3 Pathanamthitta 45 1503 40.58 139 60.983 3 2791 2.7 216 7.536 48 1583.37 43.28 131 68.519
4 Alappuzha 123 3688 8826.87 163 32550.576 35 881 47.11 246 41.499 158 3672.63 8873.98 162 32592.075
5 Kottayam 49 3181 3191.57 317 10151.466 0 0 0 0 0.000 49 3180.537 3191.57 317 10151.466
6 Idukki 52 2225 129.17 95 287.391 0 0 0 0 0.000 52 2224.602 129.17 95 287.391
7 Ernakulam 254 2188 1463.16 41 3201.813 41 824 373.73 74 308.026 295 1910.556 1836.89 36 3509.839
8 Thrissur 237 2244 1355.12 107 3041.692 4 646 7.03 243 4.540 241 2236.428 1362.15 107 3046.232
9 Palakkad 327 2897 35360.28 77 102454.680 17 1276 163.99 133 209.188 344 2890.143 35524.27 77 102663.868
10 Malappuram 185 2368 261.18 135 618.638 14 1175 8.08 189 9.493 199 2333.007 269.26 131 628.131
11 Kozhikode 76 2053 50.98 180 104.655 26 1041 7.28 234 7.583 102 1926.324 58.26 160 112.238
12 Wayanadu No Autumn Paddy
13 Kannur 240 2681 2567.61 111 6881.827 27 2031 98.02 356 199.132 267 2656.251 2665.63 107 7080.959
14 Kasaragod 173 2562 1456.99 79 3732.696 18 1994 101.66 140 202.710 191 2524.851 1558.65 75 3935.406
STATE 2143 2979 55779.68 59 166167.57 197 1233 821.75 65 1013.416 2340 2953.872 56601.43 58 167180.983
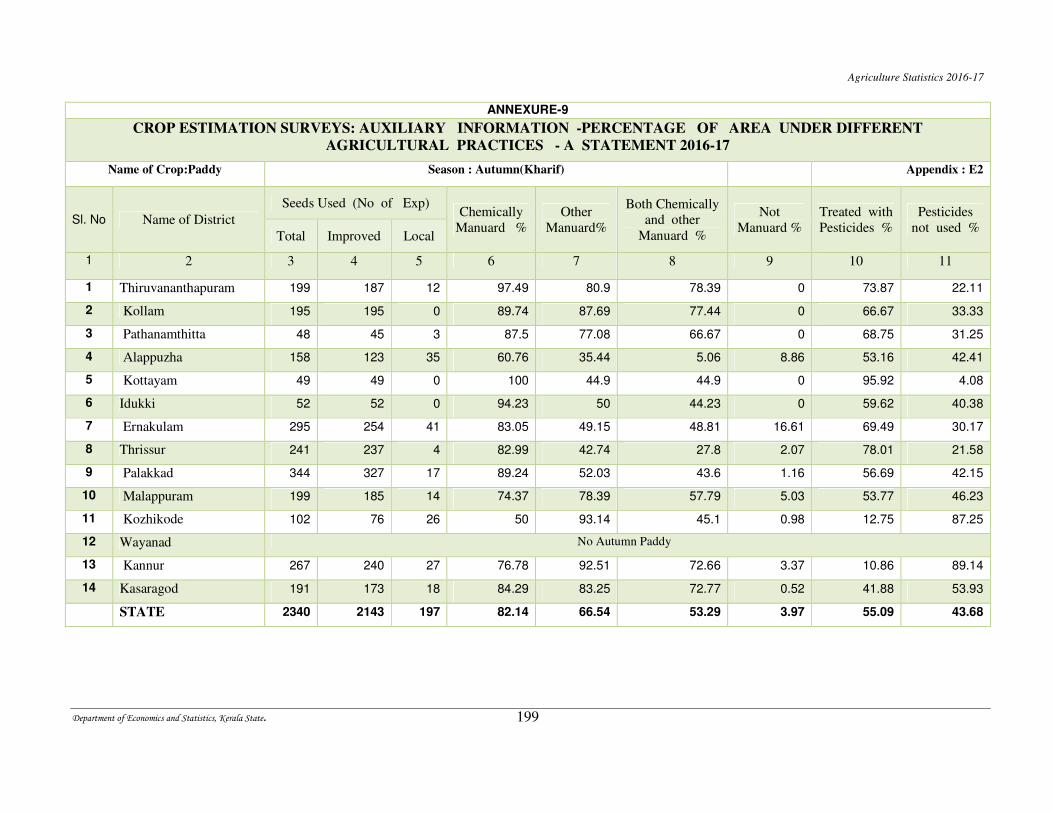
Agriculture Statistics 2016-17
Department of Economics and Statistics, Kerala State. 199
ANNEXURE-9
CROP ESTIMATION SURVEYS: AUXILIARY INFORMATION -PERCENTAGE OF AREA UNDER DIFFERENT
AGRICULTURAL PRACTICES - A STATEMENT 2016-17
Name of Crop:Paddy Season : Autumn(Kharif) Appendix : E2
Sl. No Name of District
Seeds Used (No of Exp) Chemically
Manuard %
Other
Manuard%
Both Chemically
and other
Manuard %
Not
Manuard %
Treated with
Pesticides %
Pesticides
not used % Total Improved Local
1 2 3 4 5 6 7 8 9 10 11
1 Thiruvananthapuram 199 187 12 97.49 80.9 78.39 0 73.87 22.11
2 Kollam 195 195 0 89.74 87.69 77.44 0 66.67 33.33
3 Pathanamthitta 48 45 3 87.5 77.08 66.67 0 68.75 31.25
4 Alappuzha 158 123 35 60.76 35.44 5.06 8.86 53.16 42.41
5 Kottayam 49 49 0 100 44.9 44.9 0 95.92 4.08
6 Idukki 52 52 0 94.23 50 44.23 0 59.62 40.38
7 Ernakulam 295 254 41 83.05 49.15 48.81 16.61 69.49 30.17
8 Thrissur 241 237 4 82.99 42.74 27.8 2.07 78.01 21.58
9 Palakkad 344 327 17 89.24 52.03 43.6 1.16 56.69 42.15
10 Malappuram 199 185 14 74.37 78.39 57.79 5.03 53.77 46.23
11 Kozhikode 102 76 26 50 93.14 45.1 0.98 12.75 87.25
12 Wayanad No Autumn Paddy
13 Kannur 267 240 27 76.78 92.51 72.66 3.37 10.86 89.14
14 Kasaragod 191 173 18 84.29 83.25 72.77 0.52 41.88 53.93
STATE 2340 2143 197 82.14 66.54 53.29 3.97 55.09 43.68
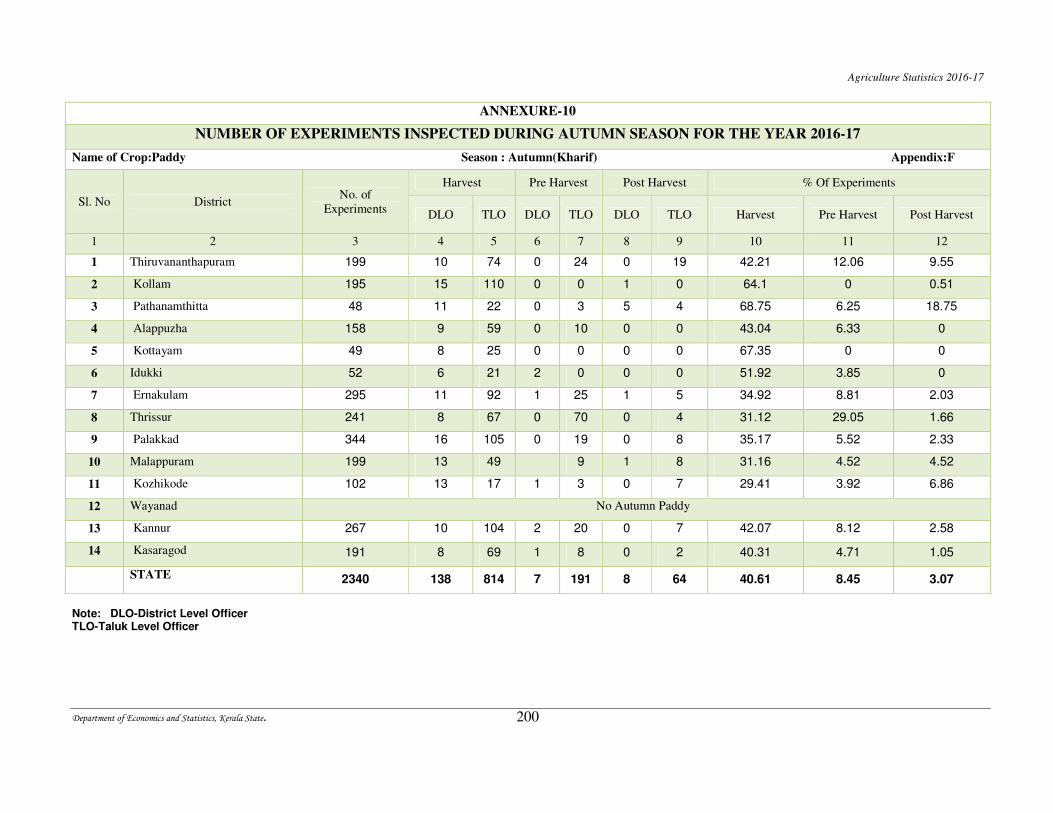
Agriculture Statistics 2016-17
Department of Economics and Statistics, Kerala State. 200
ANNEXURE-10
NUMBER OF EXPERIMENTS INSPECTED DURING AUTUMN SEASON FOR THE YEAR 2016-17
Name of Crop:Paddy Season : Autumn(Kharif) Appendix:F
Sl. No District No. of
Experiments
Harvest Pre Harvest Post Harvest % Of Experiments
DLO TLO DLO TLO DLO TLO Harvest Pre Harvest Post Harvest
1 2 3 4 5 6 7 8 9 10 11 12
1 Thiruvananthapuram 199 10 74 0 24 0 19 42.21 12.06 9.55
2 Kollam 195 15 110 0 0 1 0 64.1 0 0.51
3 Pathanamthitta 48 11 22 0 3 5 4 68.75 6.25 18.75
4 Alappuzha 158 9 59 0 10 0 0 43.04 6.33 0
5 Kottayam 49 8 25 0 0 0 0 67.35 0 0
6 Idukki 52 6 21 2 0 0 0 51.92 3.85 0
7 Ernakulam 295 11 92 1 25 1 5 34.92 8.81 2.03
8 Thrissur 241 8 67 0 70 0 4 31.12 29.05 1.66
9 Palakkad 344 16 105 0 19 0 8 35.17 5.52 2.33
10 Malappuram 199 13 49 9 1 8 31.16 4.52 4.52
11 Kozhikode 102 13 17 1 3 0 7 29.41 3.92 6.86
12 Wayanad No Autumn Paddy
13 Kannur 267 10 104 2 20 0 7 42.07 8.12 2.58
14 Kasaragod 191 8 69 1 8 0 2 40.31 4.71 1.05
STATE 2340 138 814 7 191 8 64 40.61 8.45 3.07
Note: DLO-District Level Officer TLO-Taluk Level Officer
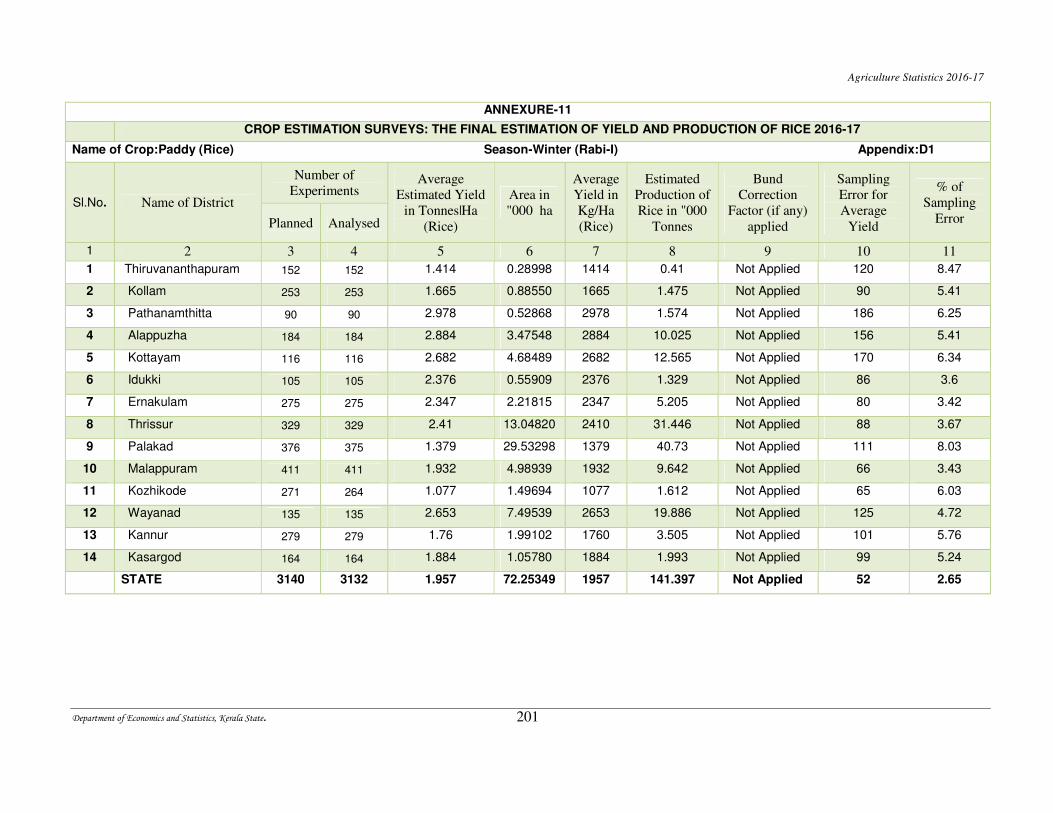
Agriculture Statistics 2016-17
Department of Economics and Statistics, Kerala State. 201
ANNEXURE-11
CROP ESTIMATION SURVEYS: THE FINAL ESTIMATION OF YIELD AND PRODUCTION OF RICE 2016-17
Name of Crop:Paddy (Rice) Season-Winter (Rabi-I) Appendix:D1
Sl.No. Name of District
Number of
Experiments Average
Estimated Yield
in Tonnes|Ha
(Rice)
Area in
"000 ha
Average
Yield in
Kg/Ha
(Rice)
Estimated
Production of
Rice in "000
Tonnes
Bund
Correction
Factor (if any)
applied
Sampling
Error for
Average
Yield
% of
Sampling
Error Planned Analysed
1 2 3 4 5 6 7 8 9 10 11
1 Thiruvananthapuram 152 152 1.414 0.28998 1414 0.41 Not Applied 120 8.47
2 Kollam 253 253 1.665 0.88550 1665 1.475 Not Applied 90 5.41
3 Pathanamthitta 90 90 2.978 0.52868 2978 1.574 Not Applied 186 6.25
4 Alappuzha 184 184 2.884 3.47548 2884 10.025 Not Applied 156 5.41
5 Kottayam 116 116 2.682 4.68489 2682 12.565 Not Applied 170 6.34
6 Idukki 105 105 2.376 0.55909 2376 1.329 Not Applied 86 3.6
7 Ernakulam 275 275 2.347 2.21815 2347 5.205 Not Applied 80 3.42
8 Thrissur 329 329 2.41 13.04820 2410 31.446 Not Applied 88 3.67
9 Palakad 376 375 1.379 29.53298 1379 40.73 Not Applied 111 8.03
10 Malappuram 411 411 1.932 4.98939 1932 9.642 Not Applied 66 3.43
11 Kozhikode 271 264 1.077 1.49694 1077 1.612 Not Applied 65 6.03
12 Wayanad 135 135 2.653 7.49539 2653 19.886 Not Applied 125 4.72
13 Kannur 279 279 1.76 1.99102 1760 3.505 Not Applied 101 5.76
14 Kasargod 164 164 1.884 1.05780 1884 1.993 Not Applied 99 5.24
STATE 3140 3132 1.957 72.25349 1957 141.397 Not Applied 52 2.65
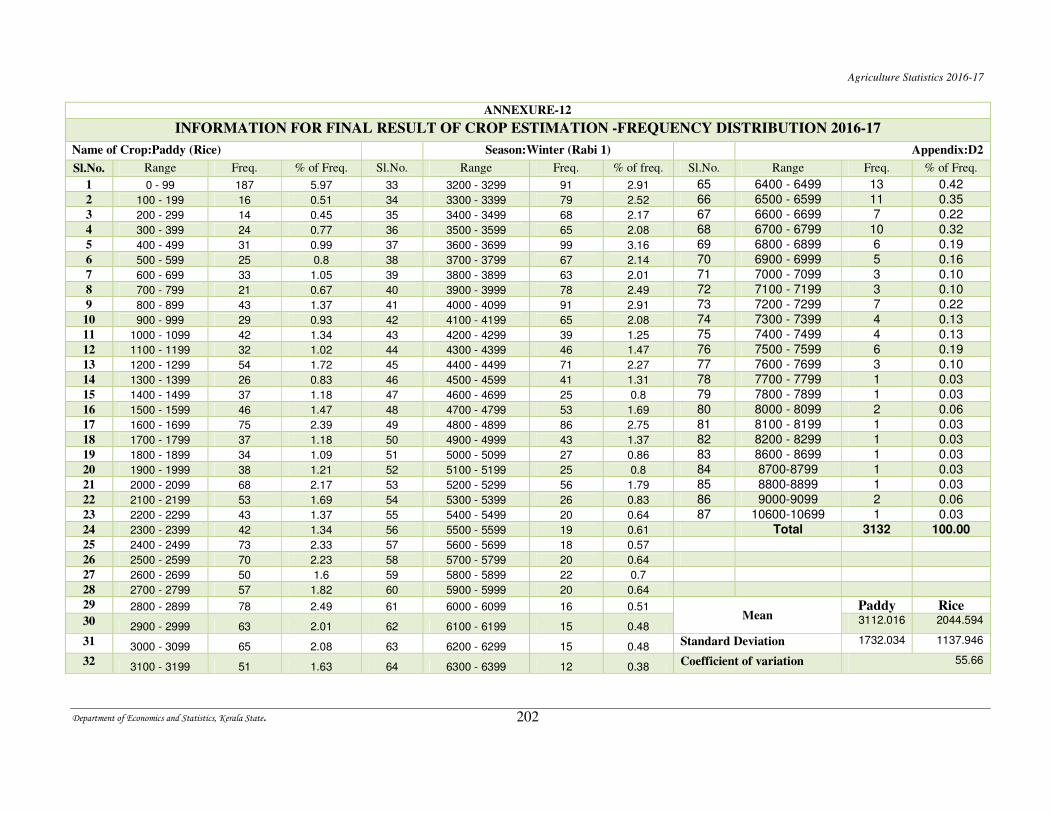
Agriculture Statistics 2016-17
Department of Economics and Statistics, Kerala State. 202
ANNEXURE-12
INFORMATION FOR FINAL RESULT OF CROP ESTIMATION -FREQUENCY DISTRIBUTION 2016-17
Name of Crop:Paddy (Rice) Season:Winter (Rabi 1) Appendix:D2
Sl.No. Range Freq. % of Freq. Sl.No. Range Freq. % of freq. Sl.No. Range Freq. % of Freq.
1 0 - 99 187 5.97 33 3200 - 3299 91 2.91 65 6400 - 6499 13 0.42
2 100 - 199 16 0.51 34 3300 - 3399 79 2.52 66 6500 - 6599 11 0.35
3 200 - 299 14 0.45 35 3400 - 3499 68 2.17 67 6600 - 6699 7 0.22
4 300 - 399 24 0.77 36 3500 - 3599 65 2.08 68 6700 - 6799 10 0.32
5 400 - 499 31 0.99 37 3600 - 3699 99 3.16 69 6800 - 6899 6 0.19
6 500 - 599 25 0.8 38 3700 - 3799 67 2.14 70 6900 - 6999 5 0.16
7 600 - 699 33 1.05 39 3800 - 3899 63 2.01 71 7000 - 7099 3 0.10
8 700 - 799 21 0.67 40 3900 - 3999 78 2.49 72 7100 - 7199 3 0.10
9 800 - 899 43 1.37 41 4000 - 4099 91 2.91 73 7200 - 7299 7 0.22
10 900 - 999 29 0.93 42 4100 - 4199 65 2.08 74 7300 - 7399 4 0.13
11 1000 - 1099 42 1.34 43 4200 - 4299 39 1.25 75 7400 - 7499 4 0.13
12 1100 - 1199 32 1.02 44 4300 - 4399 46 1.47 76 7500 - 7599 6 0.19
13 1200 - 1299 54 1.72 45 4400 - 4499 71 2.27 77 7600 - 7699 3 0.10
14 1300 - 1399 26 0.83 46 4500 - 4599 41 1.31 78 7700 - 7799 1 0.03
15 1400 - 1499 37 1.18 47 4600 - 4699 25 0.8 79 7800 - 7899 1 0.03
16 1500 - 1599 46 1.47 48 4700 - 4799 53 1.69 80 8000 - 8099 2 0.06
17 1600 - 1699 75 2.39 49 4800 - 4899 86 2.75 81 8100 - 8199 1 0.03
18 1700 - 1799 37 1.18 50 4900 - 4999 43 1.37 82 8200 - 8299 1 0.03
19 1800 - 1899 34 1.09 51 5000 - 5099 27 0.86 83 8600 - 8699 1 0.03
20 1900 - 1999 38 1.21 52 5100 - 5199 25 0.8 84 8700-8799 1 0.03
21 2000 - 2099 68 2.17 53 5200 - 5299 56 1.79 85 8800-8899 1 0.03
22 2100 - 2199 53 1.69 54 5300 - 5399 26 0.83 86 9000-9099 2 0.06
23 2200 - 2299 43 1.37 55 5400 - 5499 20 0.64 87 10600-10699 1 0.03
24 2300 - 2399 42 1.34 56 5500 - 5599 19 0.61 Total 3132 100.00
25 2400 - 2499 73 2.33 57 5600 - 5699 18 0.57
26 2500 - 2599 70 2.23 58 5700 - 5799 20 0.64
27 2600 - 2699 50 1.6 59 5800 - 5899 22 0.7
28 2700 - 2799 57 1.82 60 5900 - 5999 20 0.64
29 2800 - 2899 78 2.49 61 6000 - 6099 16 0.51 Mean
Paddy Rice 30 2900 - 2999 63 2.01 62 6100 - 6199 15 0.48
3112.016 2044.594
31 3000 - 3099 65 2.08 63 6200 - 6299 15 0.48 Standard Deviation 1732.034 1137.946
32 3100 - 3199 51 1.63 64 6300 - 6399 12 0.38
Coefficient of variation 55.66
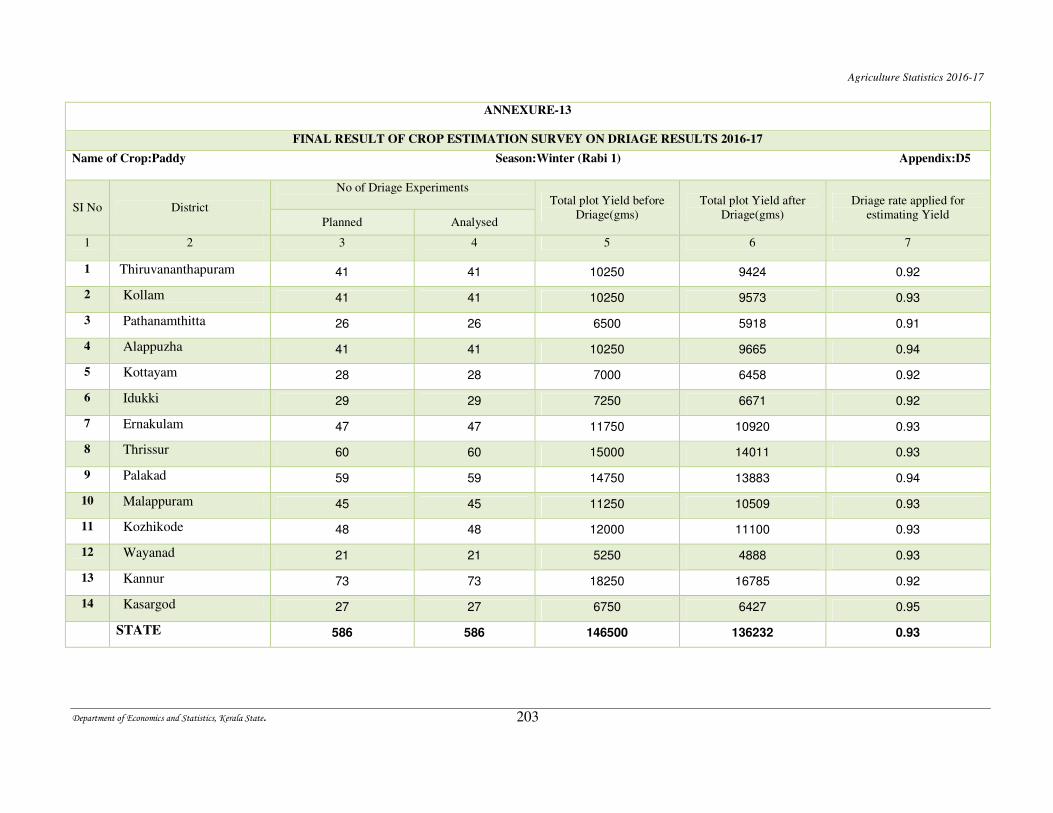
Agriculture Statistics 2016-17
Department of Economics and Statistics, Kerala State. 203
ANNEXURE-13
FINAL RESULT OF CROP ESTIMATION SURVEY ON DRIAGE RESULTS 2016-17
Name of Crop:Paddy Season:Winter (Rabi 1) Appendix:D5
SI No District
No of Driage Experiments
Total plot Yield before
Driage(gms)
Total plot Yield after
Driage(gms)
Driage rate applied for
estimating Yield Planned Analysed
1 2 3 4 5 6 7
1 Thiruvananthapuram 41 41 10250 9424 0.92
2 Kollam 41 41 10250 9573 0.93
3 Pathanamthitta 26 26 6500 5918 0.91
4 Alappuzha 41 41 10250 9665 0.94
5 Kottayam 28 28 7000 6458 0.92
6 Idukki 29 29 7250 6671 0.92
7 Ernakulam 47 47 11750 10920 0.93
8 Thrissur 60 60 15000 14011 0.93
9 Palakad 59 59 14750 13883 0.94
10 Malappuram 45 45 11250 10509 0.93
11 Kozhikode 48 48 12000 11100 0.93
12 Wayanad 21 21 5250 4888 0.93
13 Kannur 73 73 18250 16785 0.92
14 Kasargod 27 27 6750 6427 0.95
STATE 586 586 146500 136232 0.93
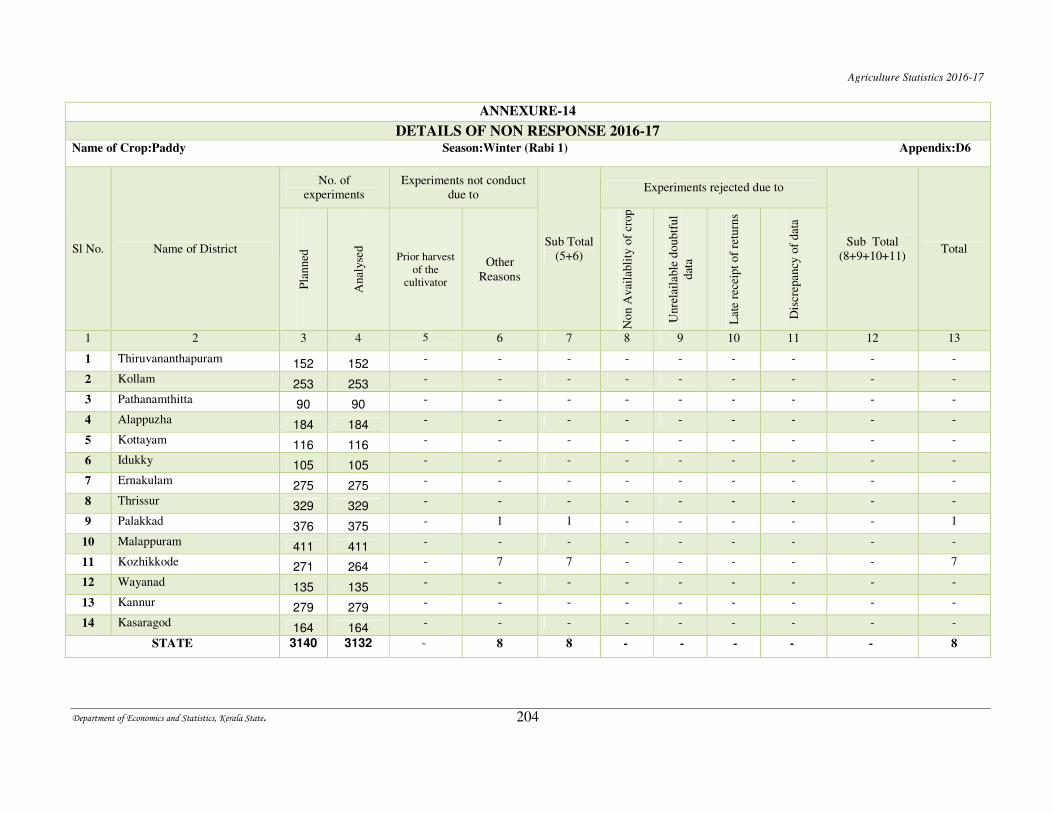
Agriculture Statistics 2016-17
Department of Economics and Statistics, Kerala State. 204
ANNEXURE-14
DETAILS OF NON RESPONSE 2016-17 Name of Crop:Paddy Season:Winter (Rabi 1) Appendix:D6
Sl No. Name of District
No. of
experiments
Experiments not conduct
due to
Sub Total
(5+6)
Experiments rejected due to
Sub Total
(8+9+10+11) Total
Pla
nned
Anal
yse
d
Prior harvest
of the
cultivator
Other
Reasons
No
n A
vai
labli
ty o
f cr
op
Unre
lail
able
doubtf
ul
dat
a
Lat
e re
ceip
t of
retu
rns
Dis
crep
ancy
of
dat
a
1 2 3 4 5 6 7 8 9 10 11 12 13
1 Thiruvananthapuram 152 152 - - - - - - - - -
2 Kollam 253 253 - - - - - - - - -
3 Pathanamthitta 90 90 - - - - - - - - -
4 Alappuzha 184 184 - - - - - - - - -
5 Kottayam 116 116 - - - - - - - - -
6 Idukky 105 105 - - - - - - - - -
7 Ernakulam 275 275 - - - - - - - - -
8 Thrissur 329 329 - - - - - - - - -
9 Palakkad 376 375 - 1 1 - - - - - 1
10 Malappuram 411 411 - - - - - - - - -
11 Kozhikkode 271 264 - 7 7 - - - - - 7
12 Wayanad 135 135 - - - - - - - - -
13 Kannur 279 279 - - - - - - - - -
14 Kasaragod 164 164 - - - - - - - - -
STATE 3140 3132 - 8 8 - - - - - 8
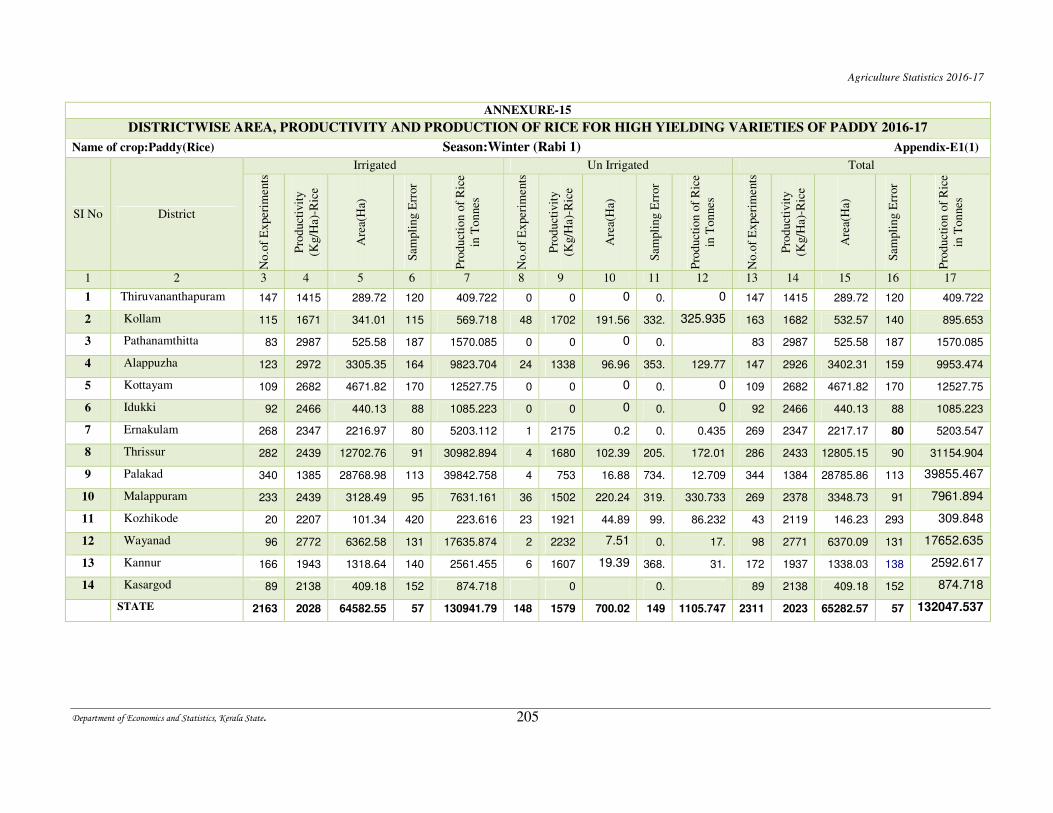
Agriculture Statistics 2016-17
Department of Economics and Statistics, Kerala State. 205
ANNEXURE-15
DISTRICTWISE AREA, PRODUCTIVITY AND PRODUCTION OF RICE FOR HIGH YIELDING VARIETIES OF PADDY 2016-17
Name of crop:Paddy(Rice) Season:Winter (Rabi 1) Appendix-E1(1)
SI No District
Irrigated Un Irrigated Total
No.o
f E
xper
iments
Pro
duct
ivit
y
(Kg/H
a)-R
ice
Are
a(H
a)
Sam
pli
ng E
rror
Pro
duct
ion o
f R
ice
in T
on
nes
No.o
f E
xper
iments
Pro
duct
ivit
y
(Kg/H
a)-R
ice
Are
a(H
a)
Sam
pli
ng E
rror
Pro
duct
ion o
f R
ice
in T
on
nes
No.o
f E
xper
iments
Pro
duct
ivit
y
(Kg/H
a)-R
ice
Are
a(H
a)
Sam
pli
ng E
rror
Pro
duct
ion o
f R
ice
in T
on
nes
1 2 3 4 5 6 7 8 9 10 11 12 13 14 15 16 17
1 Thiruvananthapuram 147 1415 289.72 120 409.722 0 0 0 0. 0 147 1415 289.72 120 409.722
2 Kollam 115 1671 341.01 115 569.718 48 1702 191.56 332. 325.935 163 1682 532.57 140 895.653
3 Pathanamthitta 83 2987 525.58 187 1570.085 0 0 0 0. 83 2987 525.58 187 1570.085
4 Alappuzha 123 2972 3305.35 164 9823.704 24 1338 96.96 353. 129.77 147 2926 3402.31 159 9953.474
5 Kottayam 109 2682 4671.82 170 12527.75 0 0 0 0. 0 109 2682 4671.82 170 12527.75
6 Idukki 92 2466 440.13 88 1085.223 0 0 0 0. 0 92 2466 440.13 88 1085.223
7 Ernakulam 268 2347 2216.97 80 5203.112 1 2175 0.2 0. 0.435 269 2347 2217.17 80 5203.547
8 Thrissur 282 2439 12702.76 91 30982.894 4 1680 102.39 205. 172.01 286 2433 12805.15 90 31154.904
9 Palakad 340 1385 28768.98 113 39842.758 4 753 16.88 734. 12.709 344 1384 28785.86 113 39855.467
10 Malappuram 233 2439 3128.49 95 7631.161 36 1502 220.24 319. 330.733 269 2378 3348.73 91 7961.894
11 Kozhikode 20 2207 101.34 420 223.616 23 1921 44.89 99. 86.232 43 2119 146.23 293 309.848
12 Wayanad 96 2772 6362.58 131 17635.874 2 2232 7.51 0. 17. 98 2771 6370.09 131 17652.635
13 Kannur 166 1943 1318.64 140 2561.455 6 1607 19.39 368. 31. 172 1937 1338.03 138 2592.617
14 Kasargod 89 2138 409.18 152 874.718 0 0. 89 2138 409.18 152 874.718
STATE 2163 2028 64582.55 57 130941.79 148 1579 700.02 149 1105.747 2311 2023 65282.57 57 132047.537
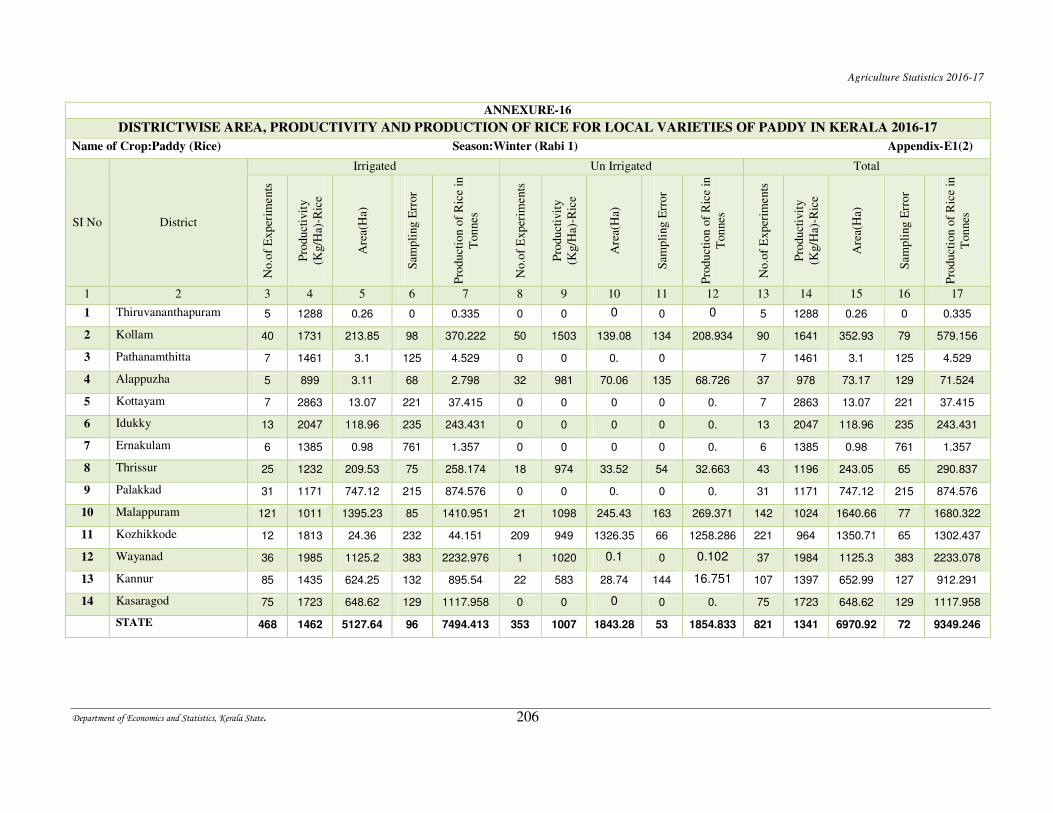
Agriculture Statistics 2016-17
Department of Economics and Statistics, Kerala State. 206
ANNEXURE-16
DISTRICTWISE AREA, PRODUCTIVITY AND PRODUCTION OF RICE FOR LOCAL VARIETIES OF PADDY IN KERALA 2016-17
Name of Crop:Paddy (Rice) Season:Winter (Rabi 1) Appendix-E1(2)
SI No District
Irrigated Un Irrigated Total
No.o
f E
xper
iments
Pro
duct
ivit
y
(Kg/H
a)-R
ice
Are
a(H
a)
Sam
pli
ng E
rror
Pro
duct
ion o
f R
ice
in
Ton
nes
No.o
f E
xper
iments
Pro
duct
ivit
y
(Kg/H
a)-R
ice
Are
a(H
a)
Sam
pli
ng E
rror
Pro
duct
ion o
f R
ice
in
Ton
nes
No.o
f E
xper
iments
Pro
duct
ivit
y
(Kg/H
a)-R
ice
Are
a(H
a)
Sam
pli
ng E
rror
Pro
duct
ion o
f R
ice
in
Ton
nes
1 2 3 4 5 6 7 8 9 10 11 12 13 14 15 16 17
1 Thiruvananthapuram 5 1288 0.26 0 0.335 0 0 0 0 0 5 1288 0.26 0 0.335
2 Kollam 40 1731 213.85 98 370.222 50 1503 139.08 134 208.934 90 1641 352.93 79 579.156
3 Pathanamthitta 7 1461 3.1 125 4.529 0 0 0. 0 7 1461 3.1 125 4.529
4 Alappuzha 5 899 3.11 68 2.798 32 981 70.06 135 68.726 37 978 73.17 129 71.524
5 Kottayam 7 2863 13.07 221 37.415 0 0 0 0 0. 7 2863 13.07 221 37.415
6 Idukky 13 2047 118.96 235 243.431 0 0 0 0 0. 13 2047 118.96 235 243.431
7 Ernakulam 6 1385 0.98 761 1.357 0 0 0 0 0. 6 1385 0.98 761 1.357
8 Thrissur 25 1232 209.53 75 258.174 18 974 33.52 54 32.663 43 1196 243.05 65 290.837
9 Palakkad 31 1171 747.12 215 874.576 0 0 0. 0 0. 31 1171 747.12 215 874.576
10 Malappuram 121 1011 1395.23 85 1410.951 21 1098 245.43 163 269.371 142 1024 1640.66 77 1680.322
11 Kozhikkode 12 1813 24.36 232 44.151 209 949 1326.35 66 1258.286 221 964 1350.71 65 1302.437
12 Wayanad 36 1985 1125.2 383 2232.976 1 1020 0.1 0 0.102 37 1984 1125.3 383 2233.078
13 Kannur 85 1435 624.25 132 895.54 22 583 28.74 144 16.751 107 1397 652.99 127 912.291
14 Kasaragod 75 1723 648.62 129 1117.958 0 0 0 0 0. 75 1723 648.62 129 1117.958
STATE 468 1462 5127.64 96 7494.413 353 1007 1843.28 53 1854.833 821 1341 6970.92 72 9349.246
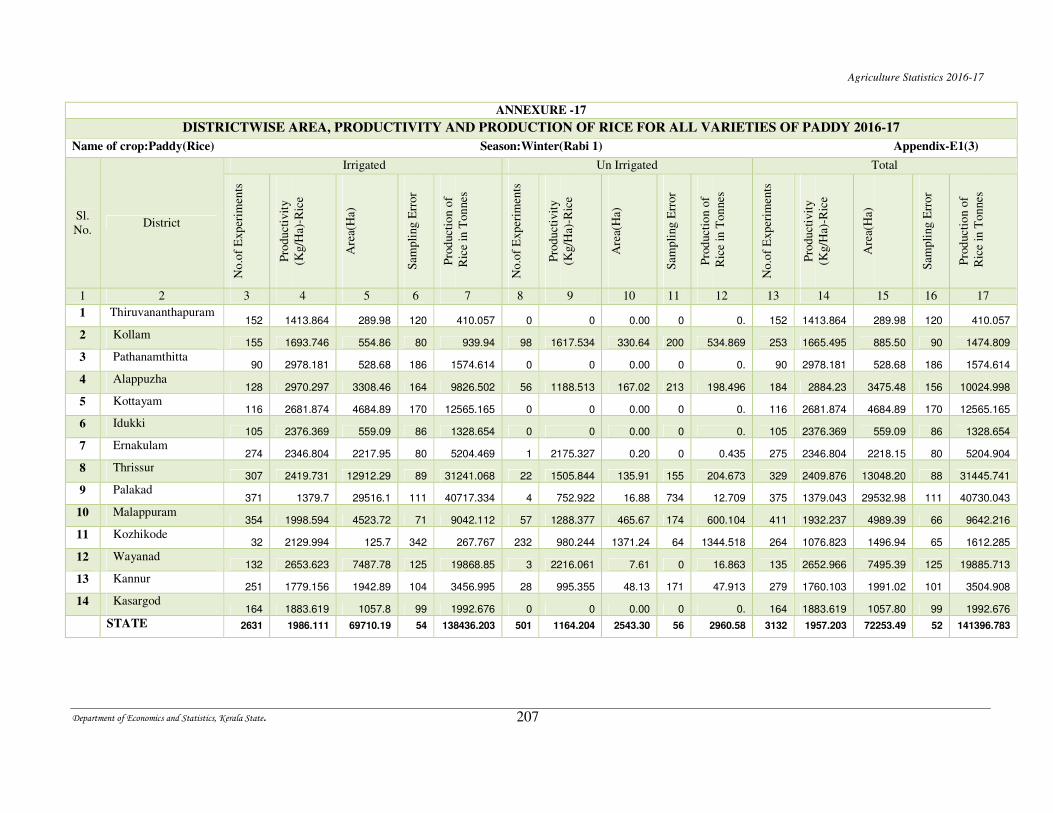
Agriculture Statistics 2016-17
Department of Economics and Statistics, Kerala State. 207
ANNEXURE -17
DISTRICTWISE AREA, PRODUCTIVITY AND PRODUCTION OF RICE FOR ALL VARIETIES OF PADDY 2016-17
Name of crop:Paddy(Rice) Season:Winter(Rabi 1) Appendix-E1(3)
Sl.
No. District
Irrigated Un Irrigated Total
No.o
f E
xper
imen
ts
Pro
duct
ivit
y
(Kg/H
a)-R
ice
Are
a(H
a)
Sam
pli
ng E
rror
Pro
duct
ion o
f
Ric
e in
Ton
nes
No.o
f E
xper
imen
ts
Pro
duct
ivit
y
(Kg/H
a)-R
ice
Are
a(H
a)
Sam
pli
ng E
rror
Pro
duct
ion o
f
Ric
e in
Ton
nes
No.o
f E
xper
imen
ts
Pro
duct
ivit
y
(Kg/H
a)-R
ice
Are
a(H
a)
Sam
pli
ng E
rror
Pro
duct
ion o
f
Ric
e in
Ton
nes
1 2 3 4 5 6 7 8 9 10 11 12 13 14 15 16 17
1 Thiruvananthapuram 152 1413.864 289.98 120 410.057 0 0 0.00 0 0. 152 1413.864 289.98 120 410.057
2 Kollam 155 1693.746 554.86 80 939.94 98 1617.534 330.64 200 534.869 253 1665.495 885.50 90 1474.809
3 Pathanamthitta 90 2978.181 528.68 186 1574.614 0 0 0.00 0 0. 90 2978.181 528.68 186 1574.614
4 Alappuzha 128 2970.297 3308.46 164 9826.502 56 1188.513 167.02 213 198.496 184 2884.23 3475.48 156 10024.998
5 Kottayam 116 2681.874 4684.89 170 12565.165 0 0 0.00 0 0. 116 2681.874 4684.89 170 12565.165
6 Idukki 105 2376.369 559.09 86 1328.654 0 0 0.00 0 0. 105 2376.369 559.09 86 1328.654
7 Ernakulam 274 2346.804 2217.95 80 5204.469 1 2175.327 0.20 0 0.435 275 2346.804 2218.15 80 5204.904
8 Thrissur 307 2419.731 12912.29 89 31241.068 22 1505.844 135.91 155 204.673 329 2409.876 13048.20 88 31445.741
9 Palakad 371 1379.7 29516.1 111 40717.334 4 752.922 16.88 734 12.709 375 1379.043 29532.98 111 40730.043
10 Malappuram 354 1998.594 4523.72 71 9042.112 57 1288.377 465.67 174 600.104 411 1932.237 4989.39 66 9642.216
11 Kozhikode 32 2129.994 125.7 342 267.767 232 980.244 1371.24 64 1344.518 264 1076.823 1496.94 65 1612.285
12 Wayanad 132 2653.623 7487.78 125 19868.85 3 2216.061 7.61 0 16.863 135 2652.966 7495.39 125 19885.713
13 Kannur 251 1779.156 1942.89 104 3456.995 28 995.355 48.13 171 47.913 279 1760.103 1991.02 101 3504.908
14 Kasargod 164 1883.619 1057.8 99 1992.676 0 0 0.00 0 0. 164 1883.619 1057.80 99 1992.676
STATE 2631 1986.111 69710.19 54 138436.203 501 1164.204 2543.30 56 2960.58 3132 1957.203 72253.49 52 141396.783
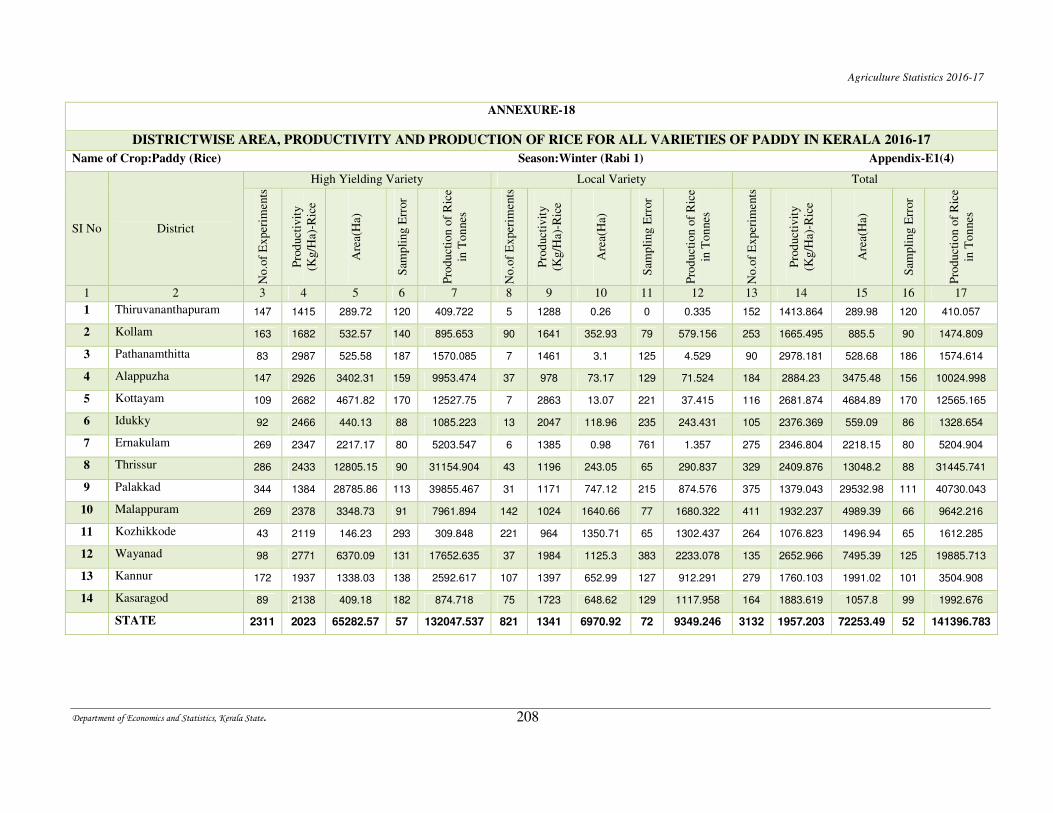
Agriculture Statistics 2016-17
Department of Economics and Statistics, Kerala State. 208
ANNEXURE-18
DISTRICTWISE AREA, PRODUCTIVITY AND PRODUCTION OF RICE FOR ALL VARIETIES OF PADDY IN KERALA 2016-17
Name of Crop:Paddy (Rice) Season:Winter (Rabi 1) Appendix-E1(4)
SI No District
High Yielding Variety Local Variety Total
No.o
f E
xper
iments
Pro
duct
ivit
y
(Kg/H
a)-R
ice
Are
a(H
a)
Sam
pli
ng E
rror
Pro
duct
ion o
f R
ice
in T
on
nes
No.o
f E
xper
iments
Pro
duct
ivit
y
(Kg/H
a)-R
ice
Are
a(H
a)
Sam
pli
ng E
rror
Pro
duct
ion o
f R
ice
in T
on
nes
No.o
f E
xper
iments
Pro
duct
ivit
y
(Kg/H
a)-R
ice
Are
a(H
a)
Sam
pli
ng E
rror
Pro
duct
ion o
f R
ice
in T
on
nes
1 2 3 4 5 6 7 8 9 10 11 12 13 14 15 16 17
1 Thiruvananthapuram 147 1415 289.72 120 409.722 5 1288 0.26 0 0.335 152 1413.864 289.98 120 410.057
2 Kollam 163 1682 532.57 140 895.653 90 1641 352.93 79 579.156 253 1665.495 885.5 90 1474.809
3 Pathanamthitta 83 2987 525.58 187 1570.085 7 1461 3.1 125 4.529 90 2978.181 528.68 186 1574.614
4 Alappuzha 147 2926 3402.31 159 9953.474 37 978 73.17 129 71.524 184 2884.23 3475.48 156 10024.998
5 Kottayam 109 2682 4671.82 170 12527.75 7 2863 13.07 221 37.415 116 2681.874 4684.89 170 12565.165
6 Idukky 92 2466 440.13 88 1085.223 13 2047 118.96 235 243.431 105 2376.369 559.09 86 1328.654
7 Ernakulam 269 2347 2217.17 80 5203.547 6 1385 0.98 761 1.357 275 2346.804 2218.15 80 5204.904
8 Thrissur 286 2433 12805.15 90 31154.904 43 1196 243.05 65 290.837 329 2409.876 13048.2 88 31445.741
9 Palakkad 344 1384 28785.86 113 39855.467 31 1171 747.12 215 874.576 375 1379.043 29532.98 111 40730.043
10 Malappuram 269 2378 3348.73 91 7961.894 142 1024 1640.66 77 1680.322 411 1932.237 4989.39 66 9642.216
11 Kozhikkode 43 2119 146.23 293 309.848 221 964 1350.71 65 1302.437 264 1076.823 1496.94 65 1612.285
12 Wayanad 98 2771 6370.09 131 17652.635 37 1984 1125.3 383 2233.078 135 2652.966 7495.39 125 19885.713
13 Kannur 172 1937 1338.03 138 2592.617 107 1397 652.99 127 912.291 279 1760.103 1991.02 101 3504.908
14 Kasaragod 89 2138 409.18 182 874.718 75 1723 648.62 129 1117.958 164 1883.619 1057.8 99 1992.676
STATE 2311 2023 65282.57 57 132047.537 821 1341 6970.92 72 9349.246 3132 1957.203 72253.49 52 141396.783
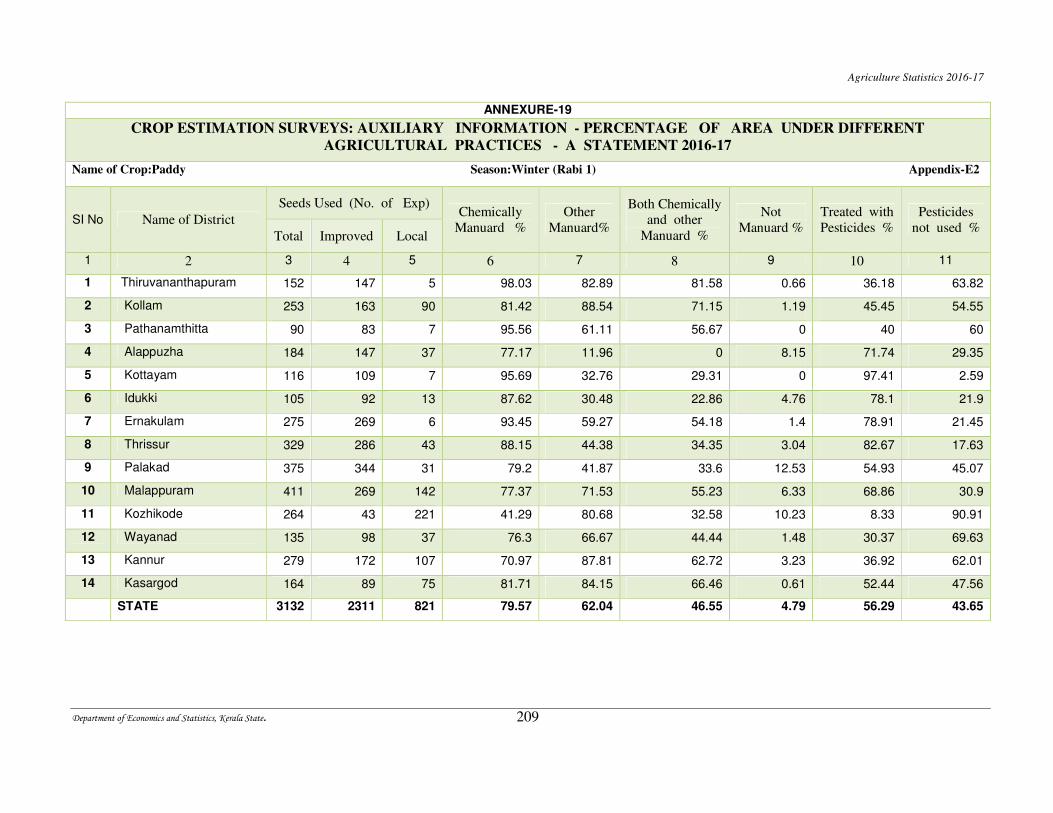
Agriculture Statistics 2016-17
Department of Economics and Statistics, Kerala State. 209
ANNEXURE-19
CROP ESTIMATION SURVEYS: AUXILIARY INFORMATION - PERCENTAGE OF AREA UNDER DIFFERENT
AGRICULTURAL PRACTICES - A STATEMENT 2016-17
Name of Crop:Paddy Season:Winter (Rabi 1) Appendix-E2
SI No Name of District
Seeds Used (No. of Exp) Chemically
Manuard %
Other
Manuard%
Both Chemically
and other
Manuard %
Not
Manuard %
Treated with
Pesticides %
Pesticides
not used % Total Improved Local
1 2 3 4 5 6 7 8 9 10 11
1 Thiruvananthapuram 152 147 5 98.03 82.89 81.58 0.66 36.18 63.82
2 Kollam 253 163 90 81.42 88.54 71.15 1.19 45.45 54.55
3 Pathanamthitta 90 83 7 95.56 61.11 56.67 0 40 60
4 Alappuzha 184 147 37 77.17 11.96 0 8.15 71.74 29.35
5 Kottayam 116 109 7 95.69 32.76 29.31 0 97.41 2.59
6 Idukki 105 92 13 87.62 30.48 22.86 4.76 78.1 21.9
7 Ernakulam 275 269 6 93.45 59.27 54.18 1.4 78.91 21.45
8 Thrissur 329 286 43 88.15 44.38 34.35 3.04 82.67 17.63
9 Palakad 375 344 31 79.2 41.87 33.6 12.53 54.93 45.07
10 Malappuram 411 269 142 77.37 71.53 55.23 6.33 68.86 30.9
11 Kozhikode 264 43 221 41.29 80.68 32.58 10.23 8.33 90.91
12 Wayanad 135 98 37 76.3 66.67 44.44 1.48 30.37 69.63
13 Kannur 279 172 107 70.97 87.81 62.72 3.23 36.92 62.01
14 Kasargod 164 89 75 81.71 84.15 66.46 0.61 52.44 47.56
STATE 3132 2311 821 79.57 62.04 46.55 4.79 56.29 43.65
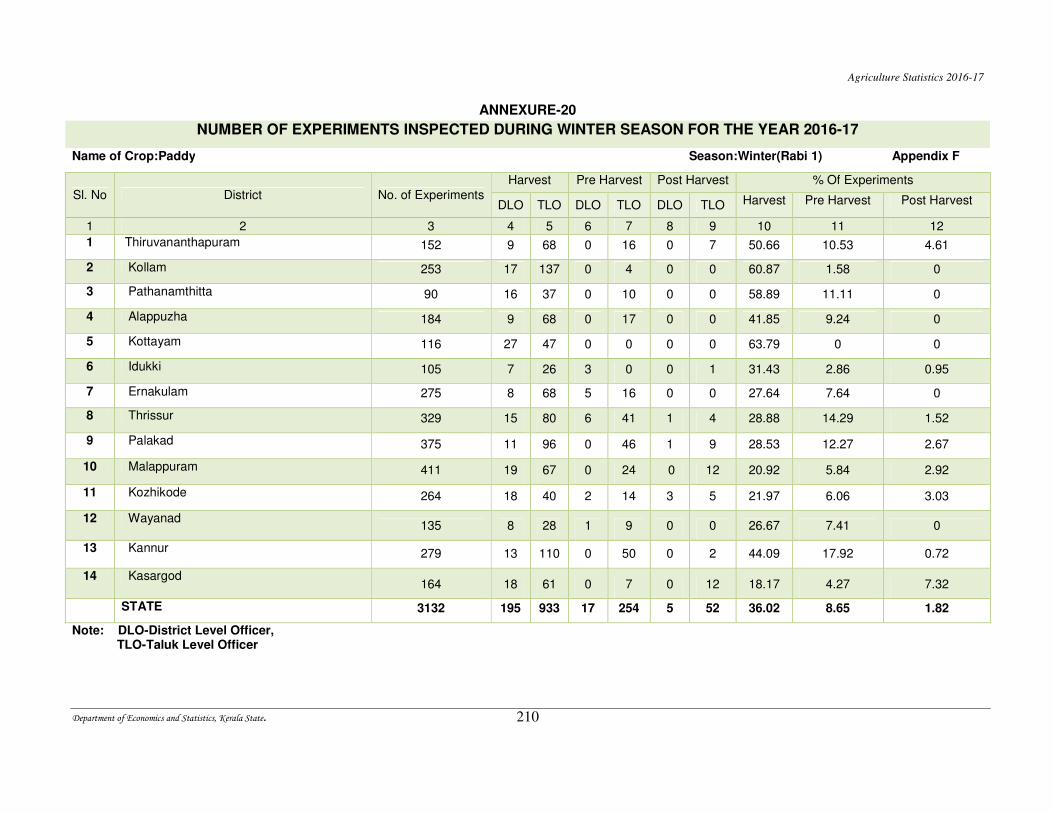
Agriculture Statistics 2016-17
Department of Economics and Statistics, Kerala State. 210
ANNEXURE-20
NUMBER OF EXPERIMENTS INSPECTED DURING WINTER SEASON FOR THE YEAR 2016-17
Name of Crop:Paddy Season:Winter(Rabi 1) Appendix F
Sl. No District No. of Experiments
Harvest Pre Harvest Post Harvest % Of Experiments
DLO TLO DLO TLO DLO TLO Harvest Pre Harvest Post Harvest
1 2 3 4 5 6 7 8 9 10 11 12
1 Thiruvananthapuram 152 9 68 0 16 0 7 50.66 10.53 4.61
2 Kollam 253 17 137 0 4 0 0 60.87 1.58 0
3 Pathanamthitta 90 16 37 0 10 0 0 58.89 11.11 0
4 Alappuzha 184 9 68 0 17 0 0 41.85 9.24 0
5 Kottayam 116 27 47 0 0 0 0 63.79 0 0
6 Idukki 105 7 26 3 0 0 1 31.43 2.86 0.95
7 Ernakulam 275 8 68 5 16 0 0 27.64 7.64 0
8 Thrissur 329 15 80 6 41 1 4 28.88 14.29 1.52
9 Palakad 375 11 96 0 46 1 9 28.53 12.27 2.67
10 Malappuram 411 19 67 0 24 0 12 20.92 5.84 2.92
11 Kozhikode 264 18 40 2 14 3 5 21.97 6.06 3.03
12 Wayanad 135 8 28 1 9 0 0 26.67 7.41 0
13 Kannur 279 13 110 0 50 0 2 44.09 17.92 0.72
14 Kasargod 164 18 61 0 7 0 12 18.17 4.27 7.32
STATE 3132 195 933 17 254 5 52 36.02 8.65 1.82
Note: DLO-District Level Officer, TLO-Taluk Level Officer
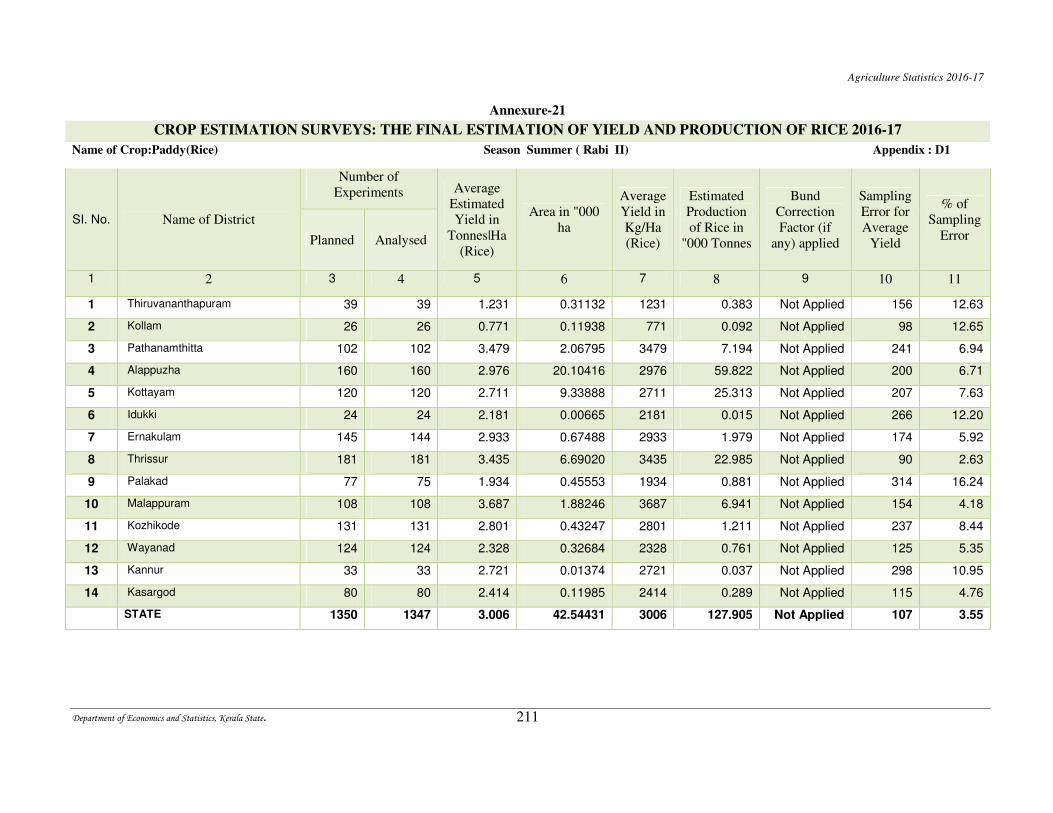
Agriculture Statistics 2016-17
Department of Economics and Statistics, Kerala State. 211
Annexure-21
CROP ESTIMATION SURVEYS: THE FINAL ESTIMATION OF YIELD AND PRODUCTION OF RICE 2016-17
Name of Crop:Paddy(Rice) Season Summer ( Rabi II) Appendix : D1
SI. No. Name of District
Number of
Experiments Average
Estimated
Yield in
Tonnes|Ha
(Rice)
Area in "000
ha
Average
Yield in
Kg/Ha
(Rice)
Estimated
Production
of Rice in
"000 Tonnes
Bund
Correction
Factor (if
any) applied
Sampling
Error for
Average
Yield
% of
Sampling
Error Planned Analysed
1 2 3 4 5 6 7 8 9 10 11
1 Thiruvananthapuram 39 39 1.231 0.31132 1231 0.383 Not Applied 156 12.63
2 Kollam 26 26 0.771 0.11938 771 0.092 Not Applied 98 12.65
3 Pathanamthitta 102 102 3.479 2.06795 3479 7.194 Not Applied 241 6.94
4 Alappuzha 160 160 2.976 20.10416 2976 59.822 Not Applied 200 6.71
5 Kottayam 120 120 2.711 9.33888 2711 25.313 Not Applied 207 7.63
6 Idukki 24 24 2.181 0.00665 2181 0.015 Not Applied 266 12.20
7 Ernakulam 145 144 2.933 0.67488 2933 1.979 Not Applied 174 5.92
8 Thrissur 181 181 3.435 6.69020 3435 22.985 Not Applied 90 2.63
9 Palakad 77 75 1.934 0.45553 1934 0.881 Not Applied 314 16.24
10 Malappuram 108 108 3.687 1.88246 3687 6.941 Not Applied 154 4.18
11 Kozhikode 131 131 2.801 0.43247 2801 1.211 Not Applied 237 8.44
12 Wayanad 124 124 2.328 0.32684 2328 0.761 Not Applied 125 5.35
13 Kannur 33 33 2.721 0.01374 2721 0.037 Not Applied 298 10.95
14 Kasargod 80 80 2.414 0.11985 2414 0.289 Not Applied 115 4.76
STATE 1350 1347 3.006 42.54431 3006 127.905 Not Applied 107 3.55
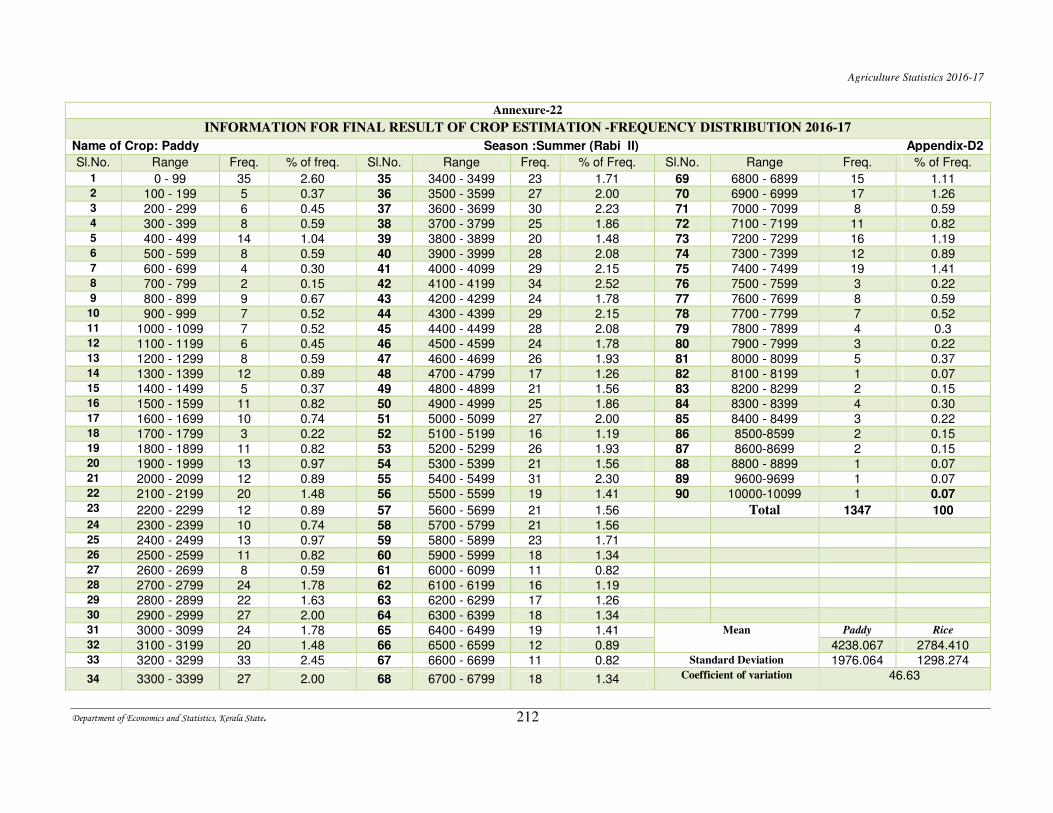
Agriculture Statistics 2016-17
Department of Economics and Statistics, Kerala State. 212
Annexure-22
INFORMATION FOR FINAL RESULT OF CROP ESTIMATION -FREQUENCY DISTRIBUTION 2016-17
Name of Crop: Paddy Season :Summer (Rabi II) Appendix-D2
Sl.No. Range Freq. % of freq. Sl.No. Range Freq. % of Freq. Sl.No. Range Freq. % of Freq.
1 0 - 99 35 2.60 35 3400 - 3499 23 1.71 69 6800 - 6899 15 1.11 2 100 - 199 5 0.37 36 3500 - 3599 27 2.00 70 6900 - 6999 17 1.26 3 200 - 299 6 0.45 37 3600 - 3699 30 2.23 71 7000 - 7099 8 0.59 4 300 - 399 8 0.59 38 3700 - 3799 25 1.86 72 7100 - 7199 11 0.82 5 400 - 499 14 1.04 39 3800 - 3899 20 1.48 73 7200 - 7299 16 1.19 6 500 - 599 8 0.59 40 3900 - 3999 28 2.08 74 7300 - 7399 12 0.89 7 600 - 699 4 0.30 41 4000 - 4099 29 2.15 75 7400 - 7499 19 1.41 8 700 - 799 2 0.15 42 4100 - 4199 34 2.52 76 7500 - 7599 3 0.22 9 800 - 899 9 0.67 43 4200 - 4299 24 1.78 77 7600 - 7699 8 0.59
10 900 - 999 7 0.52 44 4300 - 4399 29 2.15 78 7700 - 7799 7 0.52 11 1000 - 1099 7 0.52 45 4400 - 4499 28 2.08 79 7800 - 7899 4 0.3 12 1100 - 1199 6 0.45 46 4500 - 4599 24 1.78 80 7900 - 7999 3 0.22 13 1200 - 1299 8 0.59 47 4600 - 4699 26 1.93 81 8000 - 8099 5 0.37 14 1300 - 1399 12 0.89 48 4700 - 4799 17 1.26 82 8100 - 8199 1 0.07 15 1400 - 1499 5 0.37 49 4800 - 4899 21 1.56 83 8200 - 8299 2 0.15 16 1500 - 1599 11 0.82 50 4900 - 4999 25 1.86 84 8300 - 8399 4 0.30 17 1600 - 1699 10 0.74 51 5000 - 5099 27 2.00 85 8400 - 8499 3 0.22 18 1700 - 1799 3 0.22 52 5100 - 5199 16 1.19 86 8500-8599 2 0.15 19 1800 - 1899 11 0.82 53 5200 - 5299 26 1.93 87 8600-8699 2 0.15 20 1900 - 1999 13 0.97 54 5300 - 5399 21 1.56 88 8800 - 8899 1 0.07 21 2000 - 2099 12 0.89 55 5400 - 5499 31 2.30 89 9600-9699 1 0.07 22 2100 - 2199 20 1.48 56 5500 - 5599 19 1.41 90 10000-10099 1 0.07 23 2200 - 2299 12 0.89 57 5600 - 5699 21 1.56 Total 1347 100 24 2300 - 2399 10 0.74 58 5700 - 5799 21 1.56
25 2400 - 2499 13 0.97 59 5800 - 5899 23 1.71
26 2500 - 2599 11 0.82 60 5900 - 5999 18 1.34
27 2600 - 2699 8 0.59 61 6000 - 6099 11 0.82
28 2700 - 2799 24 1.78 62 6100 - 6199 16 1.19
29 2800 - 2899 22 1.63 63 6200 - 6299 17 1.26
30 2900 - 2999 27 2.00 64 6300 - 6399 18 1.34
31 3000 - 3099 24 1.78 65 6400 - 6499 19 1.41 Mean Paddy Rice
32 3100 - 3199 20 1.48 66 6500 - 6599 12 0.89 4238.067 2784.410 33 3200 - 3299 33 2.45 67 6600 - 6699 11 0.82 Standard Deviation 1976.064 1298.274
34 3300 - 3399 27 2.00 68 6700 - 6799 18 1.34 Coefficient of variation 46.63
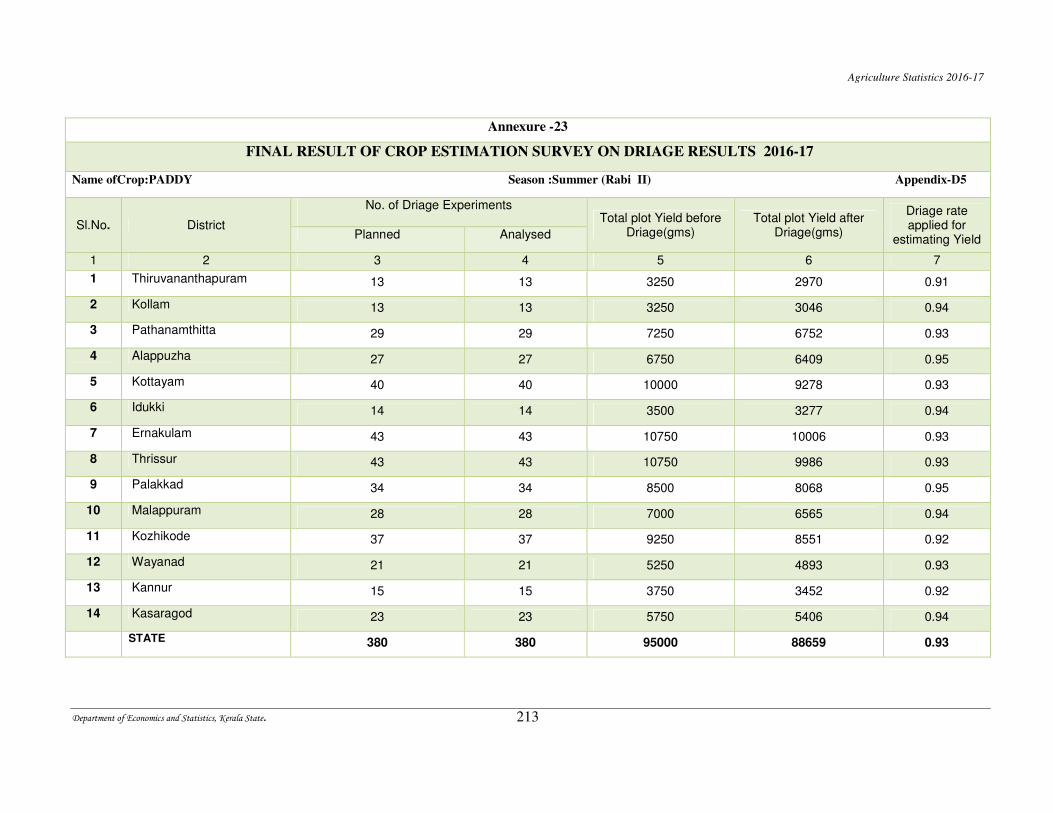
Agriculture Statistics 2016-17
Department of Economics and Statistics, Kerala State. 213
Annexure -23
FINAL RESULT OF CROP ESTIMATION SURVEY ON DRIAGE RESULTS 2016-17
Name ofCrop:PADDY Season :Summer (Rabi II) Appendix-D5
Sl.No. District
No. of Driage Experiments Total plot Yield before
Driage(gms) Total plot Yield after
Driage(gms)
Driage rate applied for
estimating Yield Planned Analysed
1 2 3 4 5 6 7
1 Thiruvananthapuram 13 13 3250 2970 0.91
2 Kollam 13 13 3250 3046 0.94
3 Pathanamthitta 29 29 7250 6752 0.93
4 Alappuzha 27 27 6750 6409 0.95
5 Kottayam 40 40 10000 9278 0.93
6 Idukki 14 14 3500 3277 0.94
7 Ernakulam 43 43 10750 10006 0.93
8 Thrissur 43 43 10750 9986 0.93
9 Palakkad 34 34 8500 8068 0.95
10 Malappuram 28 28 7000 6565 0.94
11 Kozhikode 37 37 9250 8551 0.92
12 Wayanad 21 21 5250 4893 0.93
13 Kannur 15 15 3750 3452 0.92
14 Kasaragod 23 23 5750 5406 0.94
STATE 380 380 95000 88659 0.93
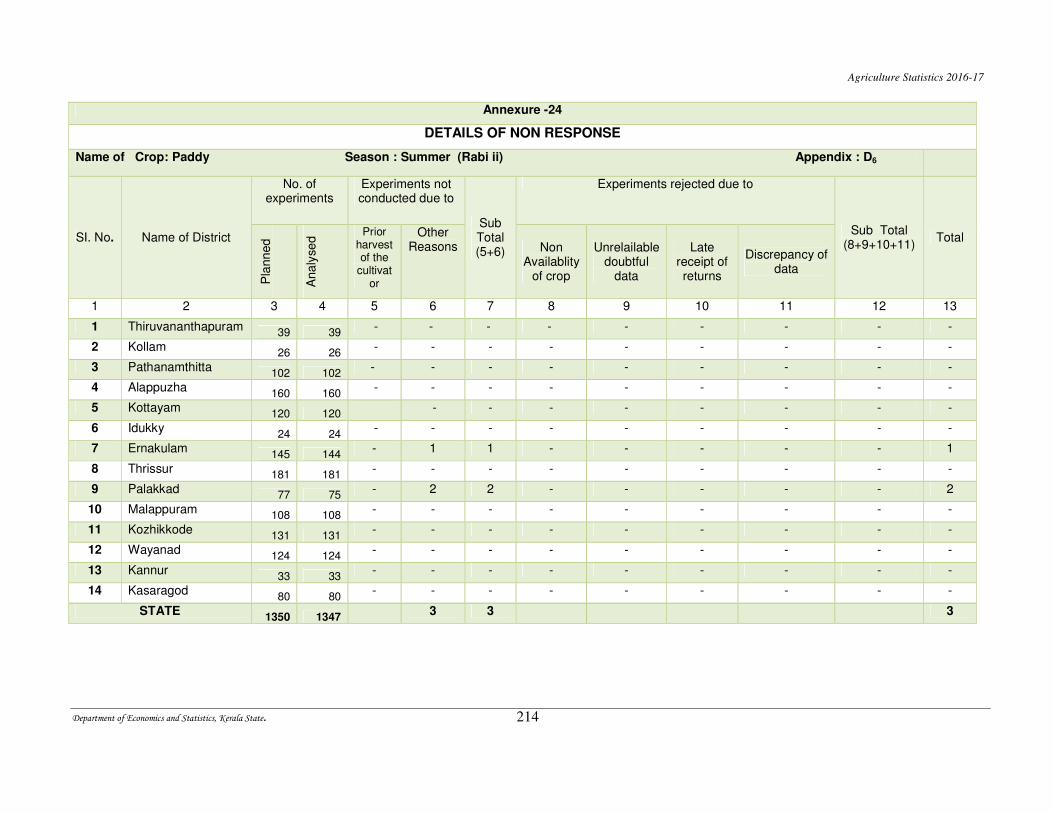
Agriculture Statistics 2016-17
Department of Economics and Statistics, Kerala State. 214
Annexure -24
DETAILS OF NON RESPONSE
Name of Crop: Paddy Season : Summer (Rabi ii) Appendix : D6
SI. No. Name of District
No. of experiments
Experiments not conducted due to
Sub Total (5+6)
Experiments rejected due to
Sub Total (8+9+10+11)
Total
Pla
nn
ed
Ana
lyse
d Prior
harvest of the
cultivator
Other Reasons Non
Availablity of crop
Unrelailable doubtful
data
Late receipt of returns
Discrepancy of data
1 2 3 4 5 6 7 8 9 10 11 12 13
1 Thiruvananthapuram 39 39
- - - - - - - - -
2 Kollam 26 26
- - - - - - - - -
3 Pathanamthitta 102 102
- - - - - - - - -
4 Alappuzha 160 160
- - - - - - - - -
5 Kottayam 120 120
- - - - - - - -
6 Idukky 24 24
- - - - - - - - -
7 Ernakulam 145 144
- 1 1 - - - - - 1
8 Thrissur 181 181
- - - - - - - - -
9 Palakkad 77 75
- 2 2 - - - - - 2
10 Malappuram 108 108
- - - - - - - - -
11 Kozhikkode 131 131
- - - - - - - - -
12 Wayanad 124 124
- - - - - - - - -
13 Kannur 33 33
- - - - - - - - -
14 Kasaragod 80 80
- - - - - - - - -
STATE 1350 1347
3 3 3
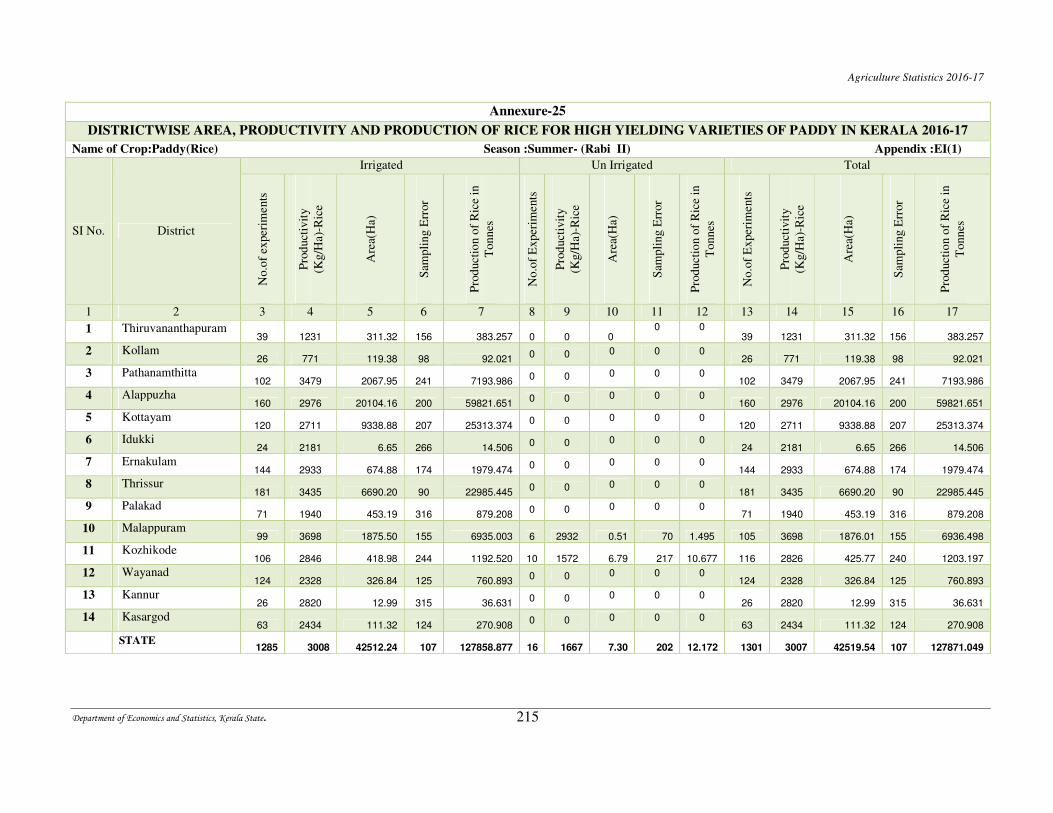
Agriculture Statistics 2016-17
Department of Economics and Statistics, Kerala State. 215
Annexure-25
DISTRICTWISE AREA, PRODUCTIVITY AND PRODUCTION OF RICE FOR HIGH YIELDING VARIETIES OF PADDY IN KERALA 2016-17
Name of Crop:Paddy(Rice) Season :Summer- (Rabi II) Appendix :EI(1)
SI No. District
Irrigated Un Irrigated Total
No.o
f ex
per
iments
Pro
duct
ivit
y
(Kg/H
a)-R
ice
Are
a(H
a)
Sam
pli
ng E
rror
Pro
duct
ion o
f R
ice
in
Tonnes
No.o
f E
xper
iments
Pro
duct
ivit
y
(Kg/H
a)-R
ice
Are
a(H
a)
Sam
pli
ng E
rror
Pro
duct
ion o
f R
ice
in
Tonnes
No.o
f E
xper
iments
Pro
duct
ivit
y
(Kg/H
a)-R
ice
Are
a(H
a)
Sam
pli
ng E
rror
Pro
duct
ion o
f R
ice
in
Tonnes
1 2 3 4 5 6 7 8 9 10 11 12 13 14 15 16 17
1 Thiruvananthapuram 39 1231 311.32 156 383.257 0 0 0
0 0 39 1231 311.32 156 383.257
2 Kollam 26 771 119.38 98 92.021
0 0 0 0 0 26 771 119.38 98 92.021
3 Pathanamthitta 102 3479 2067.95 241 7193.986
0 0 0 0 0 102 3479 2067.95 241 7193.986
4 Alappuzha 160 2976 20104.16 200 59821.651
0 0 0 0 0 160 2976 20104.16 200 59821.651
5 Kottayam 120 2711 9338.88 207 25313.374
0 0 0 0 0 120 2711 9338.88 207 25313.374
6 Idukki 24 2181 6.65 266 14.506
0 0 0 0 0 24 2181 6.65 266 14.506
7 Ernakulam 144 2933 674.88 174 1979.474
0 0 0 0 0 144 2933 674.88 174 1979.474
8 Thrissur 181 3435 6690.20 90 22985.445
0 0 0 0 0 181 3435 6690.20 90 22985.445
9 Palakad 71 1940 453.19 316 879.208
0 0 0 0 0 71 1940 453.19 316 879.208
10 Malappuram 99 3698 1875.50 155 6935.003 6 2932 0.51 70 1.495 105 3698 1876.01 155 6936.498
11 Kozhikode 106 2846 418.98 244 1192.520 10 1572 6.79 217 10.677 116 2826 425.77 240 1203.197
12 Wayanad 124 2328 326.84 125 760.893
0 0 0 0 0 124 2328 326.84 125 760.893
13 Kannur 26 2820 12.99 315 36.631
0 0 0 0 0 26 2820 12.99 315 36.631
14 Kasargod 63 2434 111.32 124 270.908
0 0 0 0 0 63 2434 111.32 124 270.908
STATE 1285 3008 42512.24 107 127858.877 16 1667 7.30 202 12.172 1301 3007 42519.54 107 127871.049
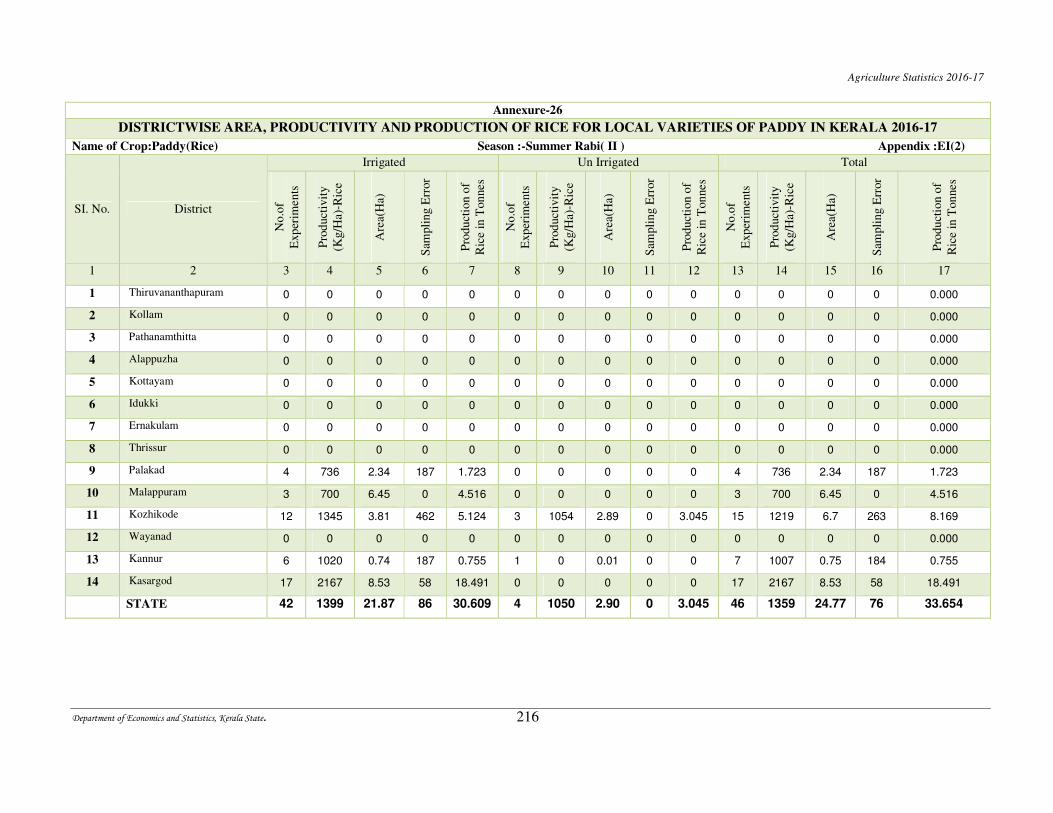
Agriculture Statistics 2016-17
Department of Economics and Statistics, Kerala State. 216
Annexure-26
DISTRICTWISE AREA, PRODUCTIVITY AND PRODUCTION OF RICE FOR LOCAL VARIETIES OF PADDY IN KERALA 2016-17
Name of Crop:Paddy(Rice) Season :-Summer Rabi( II ) Appendix :EI(2)
SI. No. District
Irrigated Un Irrigated Total
No.o
f
Exper
iments
Pro
duct
ivit
y
(Kg/H
a)-R
ice
Are
a(H
a)
Sam
pli
ng E
rror
Pro
duct
ion o
f
Ric
e in
Ton
nes
No.o
f
Exper
iments
Pro
duct
ivit
y
(Kg/H
a)-R
ice
Are
a(H
a)
Sam
pli
ng E
rror
Pro
duct
ion o
f
Ric
e in
Ton
nes
No.o
f
Exper
iments
Pro
duct
ivit
y
(Kg/H
a)-R
ice
Are
a(H
a)
Sam
pli
ng E
rror
Pro
duct
ion o
f
Ric
e in
Ton
nes
1 2 3 4 5 6 7 8 9 10 11 12 13 14 15 16 17
1 Thiruvananthapuram 0 0 0 0 0 0 0 0 0 0 0 0 0 0 0.000
2 Kollam 0 0 0 0 0 0 0 0 0 0 0 0 0 0 0.000
3 Pathanamthitta 0 0 0 0 0 0 0 0 0 0 0 0 0 0 0.000
4 Alappuzha 0 0 0 0 0 0 0 0 0 0 0 0 0 0 0.000
5 Kottayam 0 0 0 0 0 0 0 0 0 0 0 0 0 0 0.000
6 Idukki 0 0 0 0 0 0 0 0 0 0 0 0 0 0 0.000
7 Ernakulam 0 0 0 0 0 0 0 0 0 0 0 0 0 0 0.000
8 Thrissur 0 0 0 0 0 0 0 0 0 0 0 0 0 0 0.000
9 Palakad 4 736 2.34 187 1.723 0 0 0 0 0 4 736 2.34 187 1.723
10 Malappuram 3 700 6.45 0 4.516 0 0 0 0 0 3 700 6.45 0 4.516
11 Kozhikode 12 1345 3.81 462 5.124 3 1054 2.89 0 3.045 15 1219 6.7 263 8.169
12 Wayanad 0 0 0 0 0 0 0 0 0 0 0 0 0 0 0.000
13 Kannur 6 1020 0.74 187 0.755 1 0 0.01 0 0 7 1007 0.75 184 0.755
14 Kasargod 17 2167 8.53 58 18.491 0 0 0 0 0 17 2167 8.53 58 18.491
STATE 42 1399 21.87 86 30.609 4 1050 2.90 0 3.045 46 1359 24.77 76 33.654
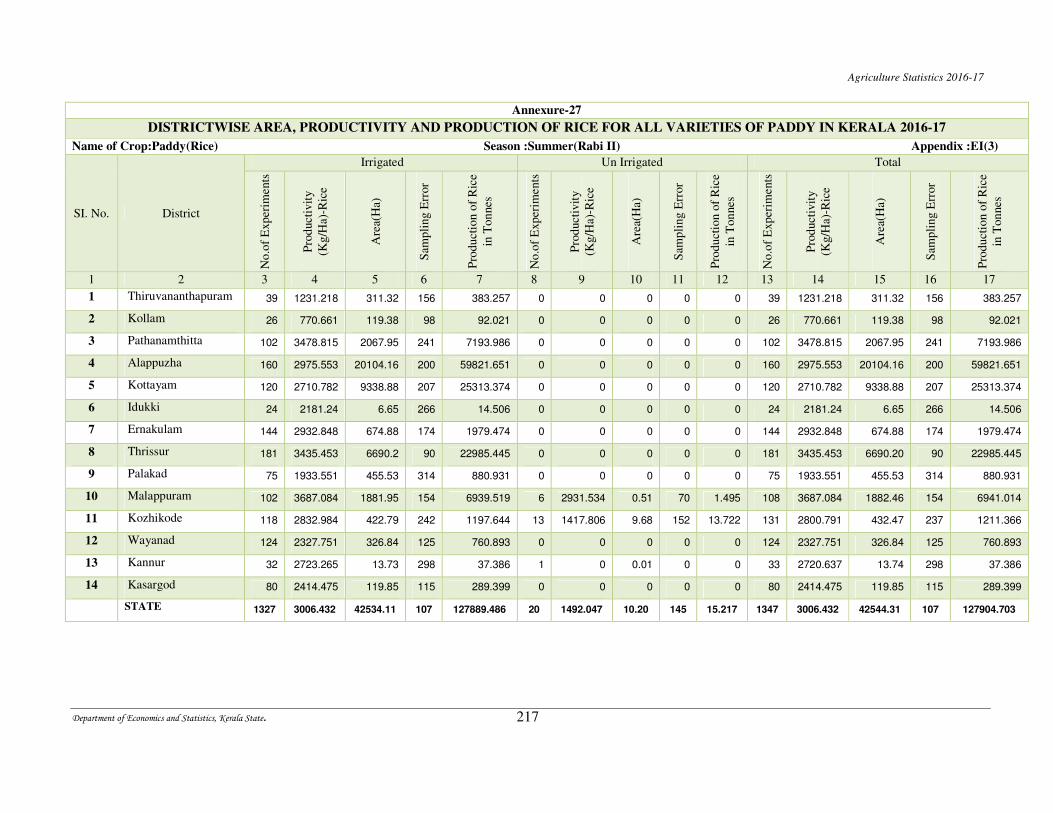
Agriculture Statistics 2016-17
Department of Economics and Statistics, Kerala State. 217
Annexure-27
DISTRICTWISE AREA, PRODUCTIVITY AND PRODUCTION OF RICE FOR ALL VARIETIES OF PADDY IN KERALA 2016-17
Name of Crop:Paddy(Rice) Season :Summer(Rabi II) Appendix :EI(3)
SI. No. District
Irrigated Un Irrigated Total
No.o
f E
xper
iments
Pro
duct
ivit
y
(Kg/H
a)-R
ice
Are
a(H
a)
Sam
pli
ng E
rror
Pro
duct
ion o
f R
ice
in T
on
nes
No.o
f E
xper
iments
Pro
duct
ivit
y
(Kg/H
a)-R
ice
Are
a(H
a)
Sam
pli
ng E
rror
Pro
duct
ion o
f R
ice
in T
on
nes
No.o
f E
xper
iments
Pro
duct
ivit
y
(Kg/H
a)-R
ice
Are
a(H
a)
Sam
pli
ng E
rror
Pro
duct
ion o
f R
ice
in T
on
nes
1 2 3 4 5 6 7 8 9 10 11 12 13 14 15 16 17
1 Thiruvananthapuram 39 1231.218 311.32 156 383.257 0 0 0 0 0 39 1231.218 311.32 156 383.257
2 Kollam 26 770.661 119.38 98 92.021 0 0 0 0 0 26 770.661 119.38 98 92.021
3 Pathanamthitta 102 3478.815 2067.95 241 7193.986 0 0 0 0 0 102 3478.815 2067.95 241 7193.986
4 Alappuzha 160 2975.553 20104.16 200 59821.651 0 0 0 0 0 160 2975.553 20104.16 200 59821.651
5 Kottayam 120 2710.782 9338.88 207 25313.374 0 0 0 0 0 120 2710.782 9338.88 207 25313.374
6 Idukki 24 2181.24 6.65 266 14.506 0 0 0 0 0 24 2181.24 6.65 266 14.506
7 Ernakulam 144 2932.848 674.88 174 1979.474 0 0 0 0 0 144 2932.848 674.88 174 1979.474
8 Thrissur 181 3435.453 6690.2 90 22985.445 0 0 0 0 0 181 3435.453 6690.20 90 22985.445
9 Palakad 75 1933.551 455.53 314 880.931 0 0 0 0 0 75 1933.551 455.53 314 880.931
10 Malappuram 102 3687.084 1881.95 154 6939.519 6 2931.534 0.51 70 1.495 108 3687.084 1882.46 154 6941.014
11 Kozhikode 118 2832.984 422.79 242 1197.644 13 1417.806 9.68 152 13.722 131 2800.791 432.47 237 1211.366
12 Wayanad 124 2327.751 326.84 125 760.893 0 0 0 0 0 124 2327.751 326.84 125 760.893
13 Kannur 32 2723.265 13.73 298 37.386 1 0 0.01 0 0 33 2720.637 13.74 298 37.386
14 Kasargod 80 2414.475 119.85 115 289.399 0 0 0 0 0 80 2414.475 119.85 115 289.399
STATE 1327 3006.432 42534.11 107 127889.486 20 1492.047 10.20 145 15.217 1347 3006.432 42544.31 107 127904.703
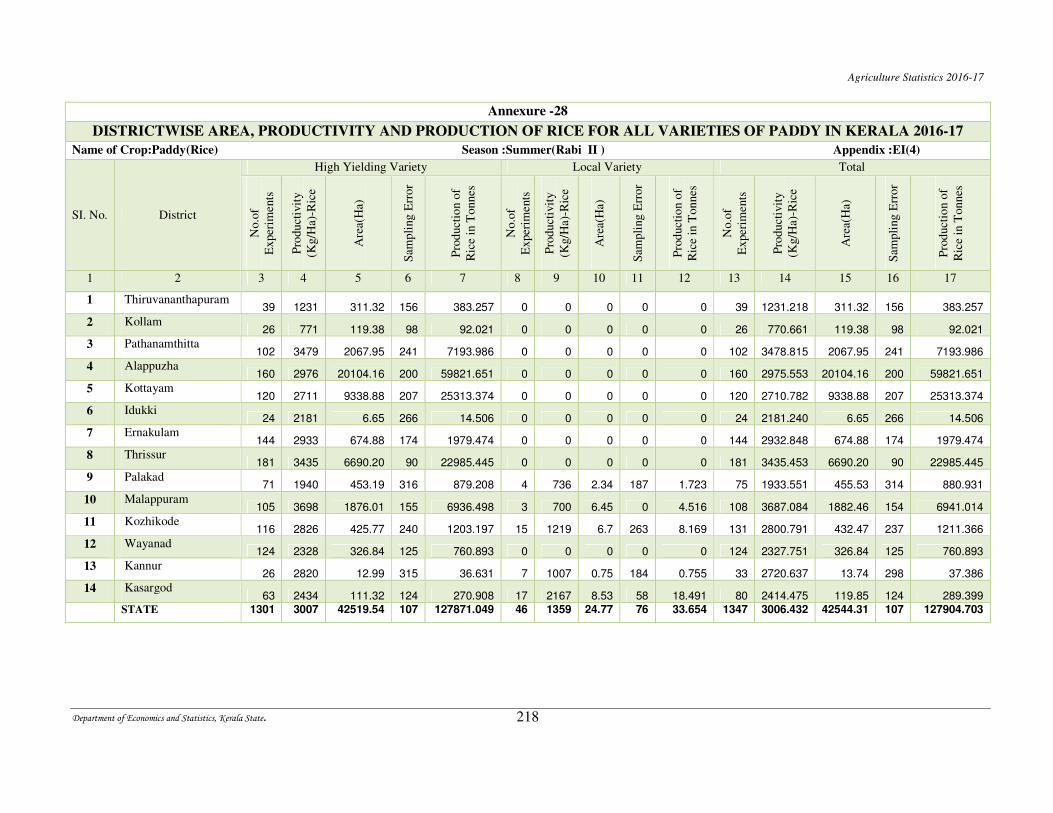
Agriculture Statistics 2016-17
Department of Economics and Statistics, Kerala State. 218
Annexure -28
DISTRICTWISE AREA, PRODUCTIVITY AND PRODUCTION OF RICE FOR ALL VARIETIES OF PADDY IN KERALA 2016-17
Name of Crop:Paddy(Rice) Season :Summer(Rabi II ) Appendix :EI(4)
SI. No. District
High Yielding Variety Local Variety Total
No.o
f
Exper
iments
Pro
duct
ivit
y
(Kg/H
a)-R
ice
Are
a(H
a)
Sam
pli
ng E
rror
Pro
duct
ion o
f
Ric
e in
Tonnes
No.o
f
Exper
iments
Pro
duct
ivit
y
(Kg/H
a)-R
ice
Are
a(H
a)
Sam
pli
ng E
rror
Pro
duct
ion o
f
Ric
e in
Tonnes
No.o
f
Exper
iments
Pro
duct
ivit
y
(Kg/H
a)-R
ice
Are
a(H
a)
Sam
pli
ng E
rror
Pro
duct
ion o
f
Ric
e in
Tonnes
1 2 3 4 5 6 7 8 9 10 11 12 13 14 15 16 17
1 Thiruvananthapuram 39 1231 311.32 156 383.257 0 0 0 0 0 39 1231.218 311.32 156 383.257
2 Kollam 26 771 119.38 98 92.021 0 0 0 0 0 26 770.661 119.38 98 92.021
3 Pathanamthitta 102 3479 2067.95 241 7193.986 0 0 0 0 0 102 3478.815 2067.95 241 7193.986
4 Alappuzha 160 2976 20104.16 200 59821.651 0 0 0 0 0 160 2975.553 20104.16 200 59821.651
5 Kottayam 120 2711 9338.88 207 25313.374 0 0 0 0 0 120 2710.782 9338.88 207 25313.374
6 Idukki 24 2181 6.65 266 14.506 0 0 0 0 0 24 2181.240 6.65 266 14.506
7 Ernakulam 144 2933 674.88 174 1979.474 0 0 0 0 0 144 2932.848 674.88 174 1979.474
8 Thrissur 181 3435 6690.20 90 22985.445 0 0 0 0 0 181 3435.453 6690.20 90 22985.445
9 Palakad 71 1940 453.19 316 879.208 4 736 2.34 187 1.723 75 1933.551 455.53 314 880.931
10 Malappuram 105 3698 1876.01 155 6936.498 3 700 6.45 0 4.516 108 3687.084 1882.46 154 6941.014
11 Kozhikode 116 2826 425.77 240 1203.197 15 1219 6.7 263 8.169 131 2800.791 432.47 237 1211.366
12 Wayanad 124 2328 326.84 125 760.893 0 0 0 0 0 124 2327.751 326.84 125 760.893
13 Kannur 26 2820 12.99 315 36.631 7 1007 0.75 184 0.755 33 2720.637 13.74 298 37.386
14 Kasargod 63 2434 111.32 124 270.908 17 2167 8.53 58 18.491 80 2414.475 119.85 124 289.399
STATE 1301 3007 42519.54 107 127871.049 46 1359 24.77 76 33.654 1347 3006.432 42544.31 107 127904.703
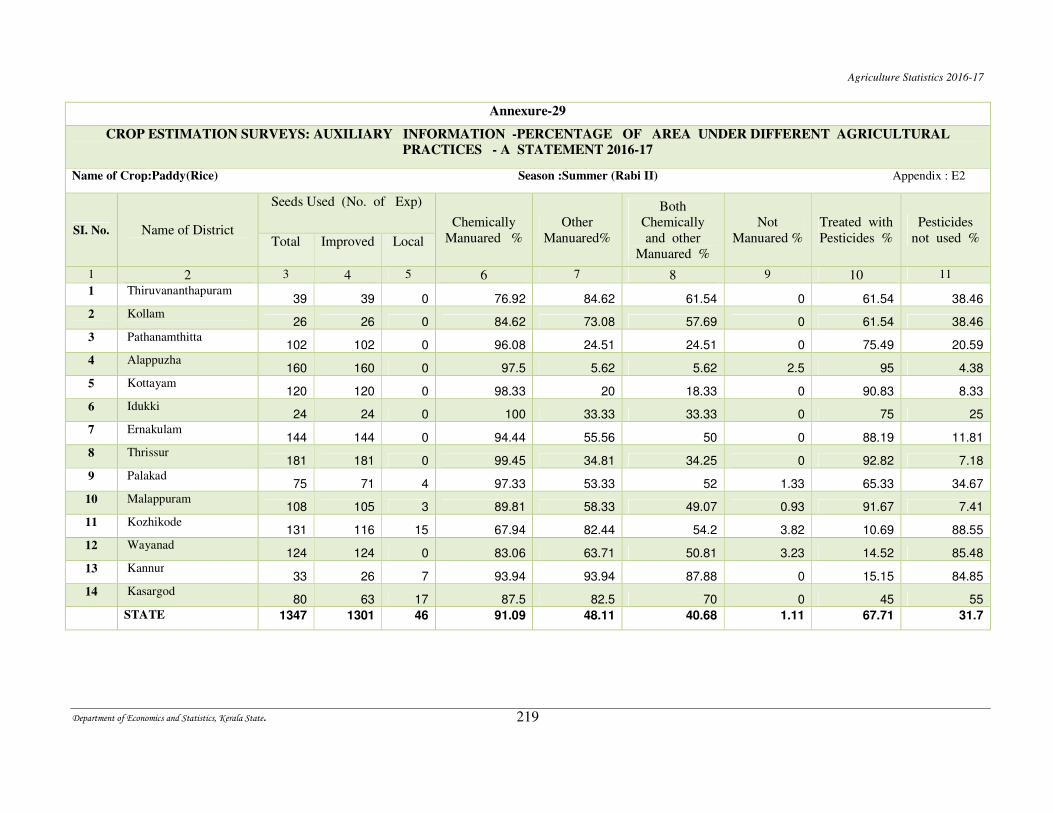
Agriculture Statistics 2016-17
Department of Economics and Statistics, Kerala State. 219
Annexure-29
CROP ESTIMATION SURVEYS: AUXILIARY INFORMATION -PERCENTAGE OF AREA UNDER DIFFERENT AGRICULTURAL
PRACTICES - A STATEMENT 2016-17
Name of Crop:Paddy(Rice) Season :Summer (Rabi II) Appendix : E2
SI. No. Name of District
Seeds Used (No. of Exp)
Chemically
Manuared %
Other
Manuared%
Both
Chemically
and other
Manuared %
Not
Manuared %
Treated with
Pesticides %
Pesticides
not used % Total Improved Local
1 2 3 4 5 6 7 8 9 10 11
1 Thiruvananthapuram 39 39 0 76.92 84.62 61.54 0 61.54 38.46
2 Kollam 26 26 0 84.62 73.08 57.69 0 61.54 38.46
3 Pathanamthitta 102 102 0 96.08 24.51 24.51 0 75.49 20.59
4 Alappuzha 160 160 0 97.5 5.62 5.62 2.5 95 4.38
5 Kottayam 120 120 0 98.33 20 18.33 0 90.83 8.33
6 Idukki 24 24 0 100 33.33 33.33 0 75 25
7 Ernakulam 144 144 0 94.44 55.56 50 0 88.19 11.81
8 Thrissur 181 181 0 99.45 34.81 34.25 0 92.82 7.18
9 Palakad 75 71 4 97.33 53.33 52 1.33 65.33 34.67
10 Malappuram 108 105 3 89.81 58.33 49.07 0.93 91.67 7.41
11 Kozhikode 131 116 15 67.94 82.44 54.2 3.82 10.69 88.55
12 Wayanad 124 124 0 83.06 63.71 50.81 3.23 14.52 85.48
13 Kannur 33 26 7 93.94 93.94 87.88 0 15.15 84.85
14 Kasargod 80 63 17 87.5 82.5 70 0 45 55
STATE 1347 1301 46 91.09 48.11 40.68 1.11 67.71 31.7
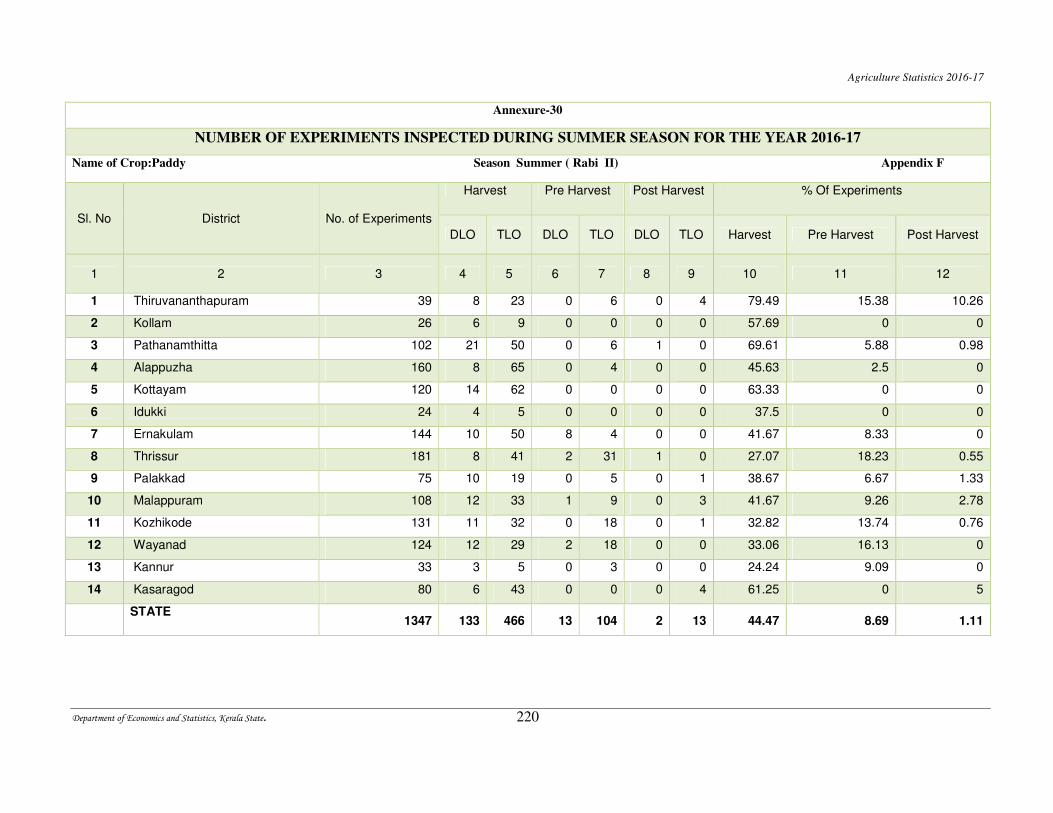
Agriculture Statistics 2016-17
Department of Economics and Statistics, Kerala State. 220
Annexure-30
NUMBER OF EXPERIMENTS INSPECTED DURING SUMMER SEASON FOR THE YEAR 2016-17
Name of Crop:Paddy Season Summer ( Rabi II) Appendix F
Sl. No District No. of Experiments
Harvest Pre Harvest Post Harvest % Of Experiments
DLO TLO DLO TLO DLO TLO Harvest Pre Harvest Post Harvest
1 2 3 4 5 6 7 8 9 10 11 12
1 Thiruvananthapuram 39 8 23 0 6 0 4 79.49 15.38 10.26
2 Kollam 26 6 9 0 0 0 0 57.69 0 0
3 Pathanamthitta 102 21 50 0 6 1 0 69.61 5.88 0.98
4 Alappuzha 160 8 65 0 4 0 0 45.63 2.5 0
5 Kottayam 120 14 62 0 0 0 0 63.33 0 0
6 Idukki 24 4 5 0 0 0 0 37.5 0 0
7 Ernakulam 144 10 50 8 4 0 0 41.67 8.33 0
8 Thrissur 181 8 41 2 31 1 0 27.07 18.23 0.55
9 Palakkad 75 10 19 0 5 0 1 38.67 6.67 1.33
10 Malappuram 108 12 33 1 9 0 3 41.67 9.26 2.78
11 Kozhikode 131 11 32 0 18 0 1 32.82 13.74 0.76
12 Wayanad 124 12 29 2 18 0 0 33.06 16.13 0
13 Kannur 33 3 5 0 3 0 0 24.24 9.09 0
14 Kasaragod 80 6 43 0 0 0 4 61.25 0 5
STATE 1347 133 466 13 104 2 13 44.47 8.69 1.11