Embed Size (px)
Citation preview
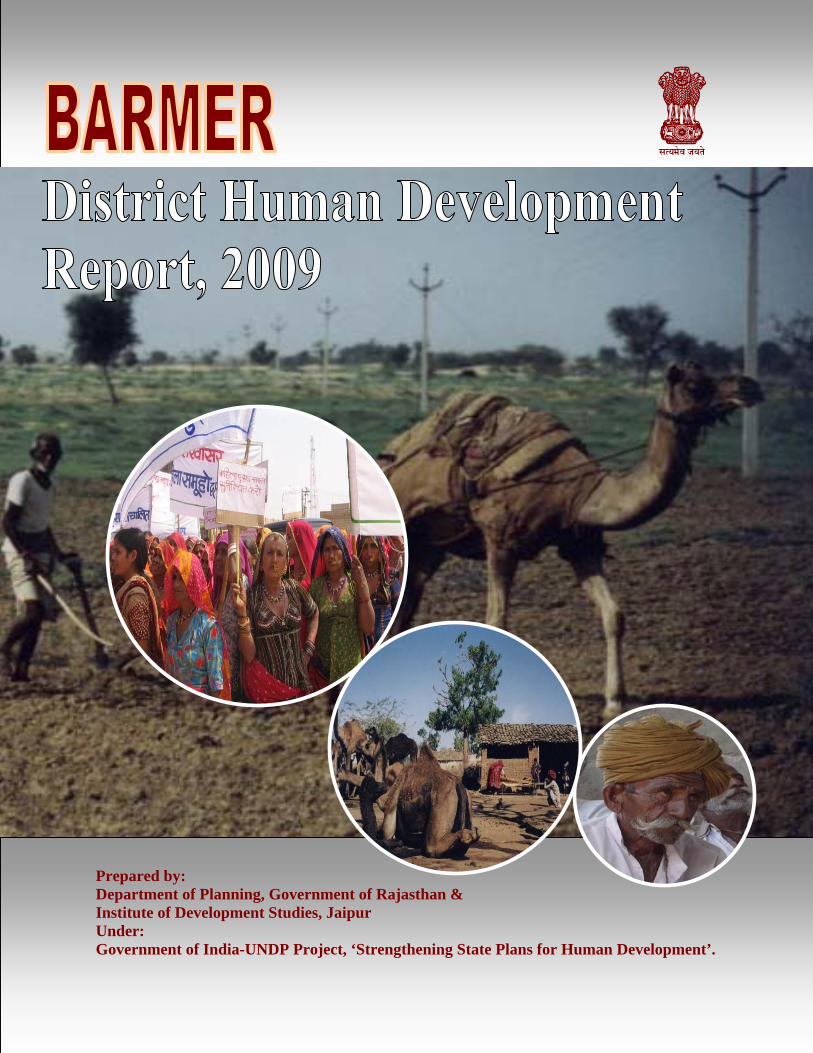
Prepared by: Department of Planning, Government of Rajasthan & Institute of Development Studies, Jaipur Under: Government of India-UNDP Project, ‘Strengthening State Plans for Human Development’.
Barmer District Human Development Profile
Report prepared under a Joint Programme of the Government of Rajasthan and the
Planning Commission of India, supported by the UNDP
Institute of Development Studies, Jaipur
2008
Preface
The District Human Development Profile of Barmer is jointly facilitated by UNDP and the
Planning Commission as part of the mainstreaming of the human development approach through
the project on Strengthening State Plans for Human Development in Rajasthan. This profile
comprehensively discusses the three dimensions of human development, viz., livelihoods, status of
education and the health status at the sub district level of Barmer. The focus of this report remains
‘Inclusive Growth’. Aspects of Human development are examined with respect to its distribution
across regions, social groups and gender.
The district human development profile is written with the support of the government officials. Human development is a State subject and it is important that the State Government is involved in the preparation of the Human Development Reports. True to the spirit district collector, Shri Ravi Jain was very understanding and welcoming to ideas and gave frank comments and suggestions. The Chief Planning Officer took a keen interest and provided data on the economic and social dimensions. Ms Leela Bhatnagar, Shri D.K.Jain, Directors, and Shri R.K.Pandey; Dy. Director, Directorate of Economics and Statistics, Ms. Alka Singh of UNDP and HDR&C Unit provided all the statistical support for the project.
We take this opportunity to thank a large number of people and organizations who have participated
in finalizing this report. First, we express our gratitude to the Planning Commission and the UNDP
for providing financial support for the report.
Finally, we would like to acknowledge the contribution of our research team, Shri Ratan Lal and Dr.
Jai Singh. While expressing our gratitude to all those who have helped us, we bear the responsibility
of the lacunae in this report.
Institute of Development Studies, Jaipur
Contents Executive Summary iii Chapter 1: Introduction 1 1.1 Administration set up of the District 1 1.2 Physiography 3 1.3 Climate 3 1.4 Geology and Minerals 4 1.5 Forest and Flora 5 1.6 Tourism 5 1.7 Villages in Barmer 6 1.8 Objectives of this Profile 6 1.9 Methodology 7 Chapter 2: Demographic Features 8 2.1 Population 8
2.1.1 Tehsil-wise Population 9 2.1.2 Population Growth 10 2.1.3 Population Density 12 2.1.4 Sex Ratio 13
2.2 Religious Group Population 15 Chapter 3: The Resource Base: Land, Water and Human 18 3.1 Land 18
3.1.1 Land Holdings 18 3.2 Water Resources and Irrigation 19 3.2.1 Rainfall 21 3.2.2 Floods 25 Chapter 4: Literacy and Education 27 4.1 Literacy Rates 27 4.2 School Infrastructure 32 4.3 Information on Schools/ Schooling as per DISE 34 4.3.1 Enrolment by Social Groups 37
i
Chapter 5: Health and Nutrition 44
5.1 Health Sector 44 5.2 The Integrated Child Development Scheme (ICDS) 48 Chapter 6: The District Economy: Income, Workers,
Crop and Livestock 50 6.1 Structure of Barmer Economy 50 6.2 Work Force 52 6.2.1 Work Participation Rates in Barmer 56 6.3 Agriculture in Barmer 59 6.3.1 Cropping Pattern 60 6.3.2 Production 64 6.4 Livestock 72 6.5 Industries 76 6.6 Employment Guarantee Scheme 80 6.7 Financial Sector 82 6.8 Infrastructure 83 6.9 Women and Livelihood 84 6.9.1 Women in Economic Activities 84 Chapter 7: Conclusions: The Way Ahead 87
ii
Executive Summary
This profile is an attempt to look at the status of natural and human resources. The district as it is located in a fragile environment and a border district with uneven terrain over the years had suffered nature and the state faced ample difficulties in provision of basic amenities to the local population due to sparse density which leads to higher cost of delivery of basic infrastructure. How can the quality of life be improved in the district and how people can be empowered is a major concern at present. In this background, the profile attempts to address the following issues: (i) to assess the extant livelihood status of the people in the district; (ii) t analyze the status of agriculture and livestock; (iii) to identify existing occupational activities; (iv) to assess the state of literacy and educational infrastructure, especially at the primary level; (v) to evaluate the status of health with special reference to women and children; and (vi) in the above context, what future up-scaling can be done. The Report Barmer district is divided into three district sub-regions (DSR) on the basis of irrigation development, ground water availability and land use pattern. These regions are: DSR1 Low NIA, poor ground water, coarse sandy soils (extreme west) DSR2 Low NIA, moderate ground water, moderate NSA (central part) DSR3 Moderate NIA, good ground water potential, part of area is salty (eastern portion) Based on this DSR cropping pattern is observed and so are the yield rates. The population density also varies. For instance DSR1 has the lowest population density followed by DSR2 and then DSR3. As one travels from east towards western side in the district, the population becomes sparse because of severe desert conditions. Similarly, literacy pattern is observed. This indicates lesser development of the western part adjacent to Pakistan. Opening up of Border has given fresh lease of life to rural population in terms of opportunities. DSR2 is the largest, accounting for 69 percent of area of the district. It has the smallest forest area and highest net sown area. It holds about 58-60 percent of waste and fallow lands of district. Due to severe desert situation, the proportion of cultivable waste and follow lands are very high in DSR1 and lowest NSA. DSR3 is the smallest sharing only 7 percent of area of the district but is much better developed with less land in form of wastelands and fallow lands, NSA of 50 percent plus and irrigation up to 10 percent with cropping intensity of 100 plus percent. Only 4 percent of land available for cultivation in the district is shared by this sub-region. Bajra is the major crop in DSR1 and DSR2 in view of scanty rainfall and coarse soils. The cropping pattern is more diverse in DSR2 with larger proportion of pulses and oilseeds and wheat due to irrigation facilities.
iii
Livestock composition does not vary much across DSRs, except that DSR3 has more buffaloes due to better availability of water and fodder. Issues for Agricultural Development in the district are: water shortage, formation of sand dunes due to wind velocity resulting into heavy soil erosion and depleting productivity of lands. Large livestock offers opportunities for development of livestock based agro processing industries, like sheep wool carpet making, using animal waste products like hides, skins, bones etc. This industrial base should be strengthened. There is need for arresting decline of small ruminant population. However, livestock is largely migrating for want of drinking water and fodder shortage. Cultivable wastelands and fallow lands are quite high, not put to any productive use because of large average holdings. Soils are sandy of poor water holding capacity and low in nutrients. Cropping pattern is dominated by low value cereals, particularly bajra and gaurseed. The development strategy has to be eco-system based. It should integrate various sectors/ sub-sectors keeping in view the desertic conditions. Recommendations In this framework:
provisioning of drinking water is on the top. It would help in controlling animal and human migration. Conserve rain water through adoption of suitable technology like underground storages and bunds in the fields, particularly in DSR1 and 2. Develop ground water resources wherever possible through borewells and tubewells.
Intensify social and agro-forestry (khejri and Rohida) for fuelwood and animal fodder. Silvi-pastures and horti-pastures needs to be developed to provide more employment opportunities.
Stabilizing sand dunes through afforestation and bush plantations, more intensively in DSR2 stabilizing.
Harvesting and conservation of rain water using improved technology that minimize water loss through mulching using organic, plastic or chemical mulching materials.
Augmenting fodder area and development of pastures by introducing better varieties. Aerial seeding can resorted too.
Agricultural technologies needs to given a boost for stabilizing yields.
Non-farm activities should be given greater importance, but at a higher scale than
iv
household industry.
Social groups education should be given greater importance and more so of women. This is more so after primary schooling. School infrastructure also requires added attention and SSA and NREGA should be used for construction of school buildings.
Programmes like NREGA should be better used to create rural infrastructure that betters livelihoods of people.
Oil reserves should be used for districts benefits.
Camel among the livestock should be given its due. Milk production should be given better linkages. Grazing lands need to be developed to hold back animal out- migration. Livestock is another sector that requires the most focused attention.
Better health facilities are required in the district, which are too meager today.
Minerals in the districts have not been used optimally for employment and income generation.
Education sector requires greater attention as gender parity is low after primary level. There are not many higher education institutions that provide skill education.
Female literacy requires added efforts; past efforts have yielded good results. This has to be in the border areas.
Student teacher ratio requires improvement. The gender gap in literacy rates also requires attention at post primary levels and more so among social groups and minorities.
Barmer shows that state has a major role to play in education and health sector and more resources should be earmarked for these activities.
Urbanization is very slow; it has to be encouraged. Higher the urbanization greater is the development.
The structure of the economy has to be done. For this infrastructure development is must in terms of roads, power, schools, markets and so on. Cost of infrastructure provisioning is high in the district and ways have to be found to reduce it. For instance, can we use wind mill and solar power instead of regular power supply. It could be tried on a BOT system with panchayat involvement. Occupational structure is too cultivator centric and this has to be diversified. The district faces all the hardships one can expect and development task is too difficult and require greater inflow of resources as per capita financial inputs required are very high.
v
Chapter 1
Introduction
The area comprising the district of Barmer used to be a part of the former Jodhpur State. On the
merger of Jodhpur state in the United States of Greater Rajasthan in the year 1949, a separate
district of Barmer was formed which include the former parganas of Mallani (now called
Barmer), Sheo, Pachpadra and Siwana. The Chohtan area (transferred from Sanchore tehsil of
Jalore district) of the fifth pargana of Sanchore, South of Mallani, also, now forms part of the
district’s jurisdiction. The district Barmer derives its name from the headquarters town, which is
said to have been founded in the 13th century by Bahada Rao (also called Bar Rao) and named
after him Bahada-mer or Barmer i.e. the hill fort of Bar.
1.1 Administrative set up of the District
The district is divided into 4 sub-divisions- Barmer, Gudhamalani, Balotra and Sheo and 8
tehsils. Out of the five tehsils existed during 1981, four namely Barmer, Sheo, Siwana and
Pachpadra, were transferred from former Jodhpur State and Chohtan was constituted with 77
villages, transferred from Sanchore tehsil of Jalore district, and 69 villages taken from Barmer
tehsil of the district during the inter-censal period 1951-61. During this period, 54 villages were
also transferred from Barmer to Pachpadra tehsil. During the inter-censal period 1981-91, two
new tehsils Baytoo and Gudhamalani have been formed. Baytoo tehsil has been formed from 244
villages transferred from Barmer tehsil likewise, Gudhamalani from 353 villages also transferred
from Barmer tehsil. In all there are 1933 inhabited villages and 8 un-inhabited villages. There are
2 towns classified in 2001.
The Collector is the administrative chief of the district, who is also the District Magistrate. Each
1
subdivision is under the charge of a Sub-Divisional Magistrate who is vested with 1st class
magisterial powers while each tehsil is under the charge and supervision of Tehsildar, who is
vested with the powers of an Executive Magistrate. Besides, the Collector, Sub-Divisional Offic-
ers and Tehsildars, who exercise criminal powers, there are courts of District and Sessions Judge
at Balotra, Civil Judge-cum-Chief Judicial Magistrate at Barmer and of Judicial Magistrates at
Barmer and Balotra. Additional District Sessions Judge is at Barmer. Besides these, the courts of
Munsif-cum-Judicial Magistrate also function three at Barmer and one each at Balotra and
Siwana.
With the advent of democratic decentralization, 8 Panchayat Samities have been formed in the
district. The Panchayat Samities are guided by the Zila Parishad under the Chairmanship of the
Zila Pramukh and supervised by the Collector of the district who is also the District
Development Officer. The Rajasthan Panchayat Samities and Zila Parishads Act, 1969
empowers these Panchayat Samities to take complete charge of the administration of the
Community Development Programmes. For imparting the technical guidance, to the villagers,
the Government has deputed representatives from various departments to the blocks, so that an
all-round progress may be achieved. The ultimate aim of the Government is to make these
Panchayat Samities the sole agency of all developmental activities at the block level.
Barmer is located at 25.75° N 71.38° E. It has an average elevation of 227 metres (744 feet). The
total area of Barmer district is 28387 km². The whole district lies between 24°58′ - 26°32′ N and
70°5′ – 72°52′. On its north is Jaisalmer, to the south is Jalore, and Pali and Jodhpur are to the
east. Pakistan is 270 km to the west. It is bounded on the north by Jaisalmer and Jodhpur district;
on the South by Jalore district on the west by Tharparkar district of Pakistan; and on the east by
Jodhpur, Pali and Jalore districts.
Barmer district is 3,727 ft (1,136 m) above sea level and 22 km in length. The longest river in the
district is the Luni. It is 480 km in length and drain into the Gulf of Kutch passing through
Jalore. The variation in temperature in various seasons is quite high. In summers the temperature
soars to 46 °C to 48 °C. In winters it drops to 5 °C (41 °F). Primarily Barmer district is a desert
where average rainfall in a year is 277 mm. However, extreme rainfall of 549 mm rain between
2
August 16 and August 25, 2006 left many dead and huge losses. As many as 20 new lakes
formed, and 6 covered an area of over 10 km².
1.2 Physiography
Apart from a small offshoot of the Aravalli hills in the east, the area is a vast sand covered tract
with substratum of gneiss, hornblende and quartz, which here and there rises up through the
sand, in some instances to a height of about 243 to 304 metres. In the extreme north and west, the
sandy plain is broken by sand hills called tibbas which sometimes rise to a height of 91 to 122
metres. This area is dreary and inhospitable and forms part of Thar Desert. The highest peak in
the district is the Chhappan-ka-Pahar in Siwana tehsil, which is about 973 metres above the sea-
level.
The only river of any consequence is the Luni (Salt river), which rises in the hills south-west of
Ajmer City, After flowing through Nagaur, Pali and, Jodhpur districts it enters this district near
village Rampur in Pachpadra tehsil and flows westward till just beyond Tilwara where it alters
course to south-west in the years of heavy rains which, however, are rare, the river overflows
(known as Rel) when crops of wheat, gram and barley become possible. After flowing into Jalore
district, it finally loses itself in marshy ground at the head of the Rann of Kutch. Another river is
Sukri which enters Barmer tehsil of the district from Jalore district, flows through a small portion
of the district and then joins the river Luni near Samdari. Other rivers of the district are Mitri and
Sukri No.2. Among streams mention may be made of the Lik Nadi in Pachpadra tehsil, Ranigaon
Nala near Barmer town, and Kavas and Kheorayal Nalas in Sheo tehsil.
In real sense, there is no lake in the district. However, there are numerous small ponds called
‘pars’ which are used for bed cultivation of wheat during the years of heavy rains. Most of the
ponds are dry by early summer but the ponds of Rewana in Pachpadra and Sheo tehsil usually
retain some water throughout the year.
1.3 Climate
The characteristic features of the climate of the district are its (dryness, extremes of temperature
and the fitful and erratic nature of the rainfall. The year may, be divided into four seasons, winter
3
from November to March, summer season from April to June, monsoon from July to mid-
September, and the post-monsoon season up to the end of October The normal annual rainfall at
the district headquarters is 27.75 cm. while the actual rainfall in 1989 was only 26.62 cm. During
the period the humidity percentage at Barmer Centre was 56.84. The rainfall decreases towards
the west. The average number of rainy days (days with rainfall of 2.5 mm. or more) in a year is
only taking the district as a whole. The winter season sets in by November, when both day and
night temperatures begin to drop, reaching the lowest point in January. The minimum
temperature often records below freezing point in January and trees and vegetation get injured by
frost. Temperatures rise rapidly after March and attain the peak in May or June. Day
temperatures have been known to reach as high as 49°C in May. Throughout summer, the heat is
intense and scorching winds prevail. Even during monsoon, the air is dry in between the fitful
spells of rain.
The soils of the district are broadly desertic type. Qualitatively the soils are very poor and devoid
of humus content. These soils are very deep and sandy, associated with dunes, inter dunes and
sandy plain covering about 31 percent of the area. Dunes are the spectacular feature of the
district and these occur scattered all over the area. In some parts of Barmer, red desert soils are
also found. Soil texture varies from sandy loam to sandy clay loam, becoming slightly heavier
with depth. Calcium carbonate is at varying depths and is frequently cemented. Solanchak (salini
soils) are also found in the district. Kolu, Chirai, Shergarh, Pal and Bap soil series have been
identified in the district.
1.4 Geology and Minerals
The oldest rocks found in the district are schists belonging to the Aravalli system. The sub aerial
character of the lava is proved by the inclusion between the flow of bands of rolled pebbles of
the lava itself and other crystalline rocks derived from the Aravalli range. The rhyolites of this
area are pierced by dykes and bosses of granite (known as Siwana granite) containing hom-
blende but no mica as distinct from the Jalore granite, which contains mica. These granites form
a considerable hill mass in the east of the district, the Saora range south of Siwana rising to over
1125 metres above sea level. The rhyolites are also traversed by numerous bands of intrusive
rock containing oegirime, augite, sanidine and sodalite. Sandstones and conglomerates with
4
traces of fossil leave occur at Barmer and are probably of Jurassic age. The sand also contains
salt, which has been loosened by rain over the ages to collect in the Pachpadra depression.
The district is poor in metallic mineral deposits. However, the important minerals produced in
the district are bentonite, gypsum, siliceous, earth and salt yielding good annual revenue. The
district is the largest producer of bentonite, which is used as grouting material in engineering
construction, in drilling muds and in insecticide, paint, pharmaceutical, vegetable oils and
petroleum industries. The important deposits extend from Khoryal to Mahawar over a distance of
86 km. Fuller’s earth which is used in refining of petroleum, vegetable oils and fats, occurs at
Kapoordi. Gypsum deposits are located at Phulsund, Kawas and Utarlai and are used in the
manufacture of fertilizer, plaster of paris, distemper and cement. Salt with sodium chloride is
extracted from Pachpadra Lake. Lignite occurrences have been reported at Unrod and Bharka.
Rhyolite and granite occur at Barmer and Siwana.
1.5 Forest and Flora
The flora of the district is that of a hot desert region. Most of the flowering plants are shrubs and
wild grasses. The grasses do not, however, survive for more than a few months after the rains.
The main varieties of trees are Khejra (Prosopis Spicigera), Rohira (Tecoma Undulata), Kair
(Capparis aphylla), Phog (Calligonus Polygonoides), Akra (Calotropis procera), Jal (Salvadora
persica and oleoides), Ber (Zizyphus Jujuba), Bordi (Zizyphus rotundifolia), Neem (Azadirachta
indica), Peepal (Ficus religiosa) etc. The district mainly provide of the timer and fruits. Besides,
some of the trees have medicinal value. Among the shrubs and grasses found in the region are
Bharut (Cenchrus cathaticus), Siwan (Panicum frumentaceum), Makra (Eleusine aegyptiaca),
Lamp (Aristida depressa), Dhamasa (Fagonia cretica) etc.
1.6 Tourism
To the immediate west of the city lie the remains of Juna or Juna Barmer and to the south are the
ruins of three Jain temples. There is an inscription dated 1295 AD on one of the pillars of the hall
of the largest temple at Juna. This mentions a Maharajakula Sri Samanta Sinha Deva ruling
Barmer at the time. Barmer is famous for its carved wooden furniture and hand block printing
industry.
5
There are number of festivals held in Barmer, the most famous of which is a cattle fair held
every year at Tilwara village situated on the banks of the Luni river. The fair goes on for a
fortnight in the months of March and April. The other major festival is the Barmer Thar Festival,
started as a practice to enhance the tourism potential of this town. During the annual Barmer
festival in March, the town is at its colourful best and that is the best time to visit Barmer.
Barmer is known for its vary famous Daluji ki Kachouri- a spicy fast food like Samosa.
Barmer district is part of the Great Indian Desert or Thar Desert. Like all other districts in the
desert region, Barmer is known for its folk music and dance. The Bhopas (priest singers) are
found in Barmer, who compose music in honour of the deities of the region and its war heroes.
The other folk musicians come from a community called the Muslim Dholis (drummers) for
most of whom this is the only means of livelihood.
1.7 Villages in Barmer
Barmer district in 1991 had 1634 villages of which 9 were uninhabited. This number increased to
1941 in 2001 (table 1.1). This means that dhannis have grown into villages. As per 1991 and
2001 census, majority of the villages were having population of below 1000. It is apparent that
size of villages with population of 500 to 999 has increased during the decade significantly,
while there is a significant reduction in village with population of 1000 to 1999 and 2000 to
4999. Thus, a strange phenomenon seems to be working in Barmer district- large villages
reducing in size. Is it due to permanent migration? If so then it has to be part of the district
planning as to how it can be arrested. Reduction in number in the category of 5000 to 9999
population is understandable as some may have graduated to a town category as per the
classification.
1.8 Objectives of this Profile
The profile is an attempt to look at the status of natural and human resources. The district as it is
located in a fragile environment and a border district with uneven terrain over the years had
suffered nature and the state faced ample difficulties in provision of basic amenities to the local
population due to sparse density which leads to higher cost of delivery of basic infrastructure.
6
How can the quality of life be improved in the district and how people can be empowered is a
major concern at present. In this background, the profile attempts to address the following issues:
1. to assess the extant livelihood status of the people in the district
2. to analyze the status of agriculture and livestock
3. to identify existing occupational activities
4. to assess the state of literacy and educational infrastructure, especially at the primary
level
5. to evaluate the status of health with special reference to women and children
6. In the above context, what future up-scaling can be done.
Table 1.1: Revenue Villages in Barmer (Number) --------------------------------------------------------------------------- Population 1991 2001 --------------------------------------------------------------------------- < 200 109 63 200-499 580 514 500-999 578 1202 1000-1999 258 139 2000-4999 94 11 5000-9999 6 4 Total 1625 1933 Uninhabited villages 9 8 Total Revenue villages 1634 1941 --------------------------------------------------------------------------- Source: Statistical Abstract of Rajasthan, 2005 and District Outline 2004.
1.9 Methodology
This study relies primarily on secondary sources of information, websites- state departments and
others and field level information. Attempt has also been to use other material that reflects on
development issues in Barmer. The process initiated with a district level workshop facilitated by
HDR&C unit, Rajasthan in which Zila Pramukh, government officers, public representatives and
NGOs participated and discussed major issues concerned with human development in the
district.
7
Chapter 2
Demographic Features Human population is an important constituent of the sustainable development agenda. A fast
growing population leads to a significant diversion of investable resources to consumption which
could otherwise be used for increasing investment and productivity and for improving the quality
of public services such as education, health, sanitation, provision of safe drinking water and for
control of environmental degradation. Enhanced investments in these sectors lead to improved
human development.
2.1 Population in Barmer
Barmer had population of 1964835 in 2001 of which males were 1038247 (52.84%) and females
were 926588 (47.16%), table 2.1. The district has 3.48 percent of state’s population and 8.29
percent area. The population growth during 1991-2001 was 36.83 percent compared to 28.27
percent during 1981-1991. The rural population stood at 1819431 (92.6%), while the urban
population was 145404 (7.4%). The scheduled caste population stood at 308996 constituting
15.73 percent of total population. The scheduled tribe population was recorded at 118688
constituting 6.04 percent. 0-4 population was 302215 while 5-14 years population was 545120,
15-59 years old were 978039 and 60 plus population was 139461. 15 percent of the population
is under 6 years of age. The district has an area of 28387 sq.km and density of population of 69
in 2001. Table 2.1: Population in 2001 ----------------------------------------------------------------------------------------------------- District No. of Households Persons Males Females ----------------------------------------------------------------------------------------------------- Total 309739 1964835 1038247 926588 Rural 284796 1819431 959844 859587 Urban 24943 145404 78403 67001 ---------------------------------------------------------------------------------------------------- Source: Statistical Abstract of Rajasthan, 2005.
8
The district has 309739 households of which 91.95 percent are rural areas and only 8.1 percent in
urban areas (table 2.1). Of the rural population, 52.78 percent are males while this proportion is
53.92 percent in urban areas.
Given the number of households in the district at 309739, the average household size comes to
6.34. The average household size in rural areas is 6.39 compared to urban household size of 5.83.
The family size in urban Barmer is thus lower than the rural family size. 28.3 percent houses are
permanent type followed by 14 percent that are semi-permanent and 57.8 percent are temporary
type.
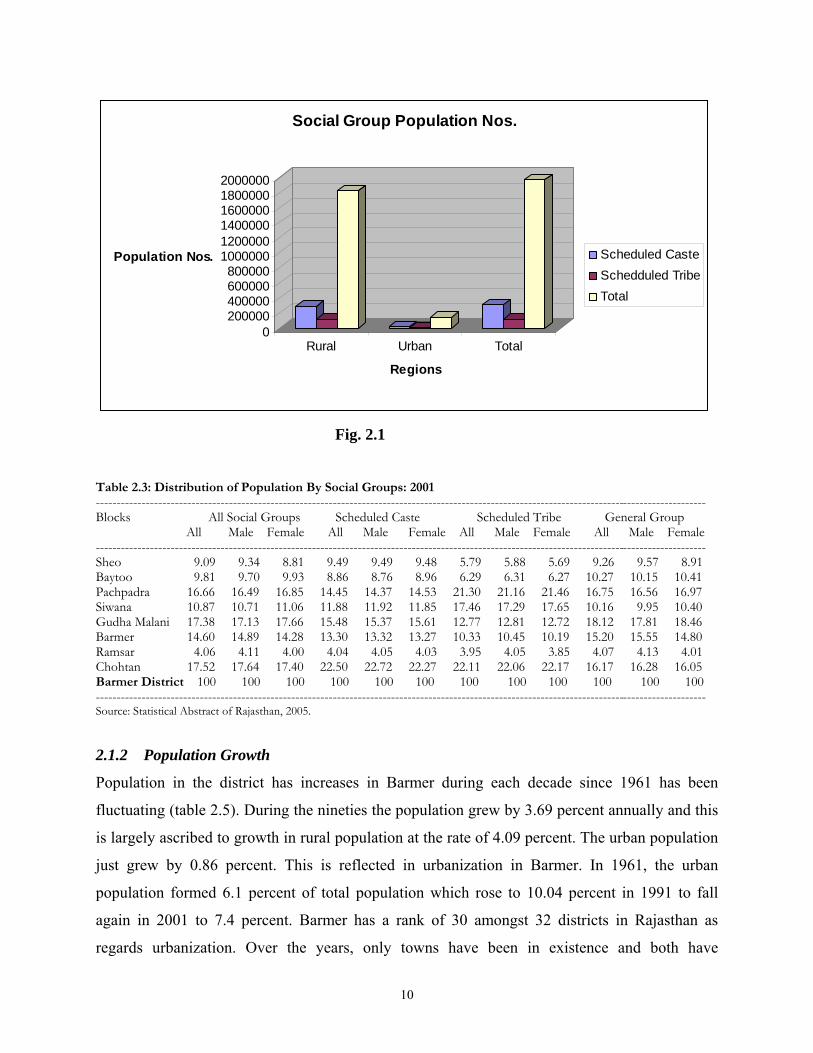
In 2001, there was 308996 scheduled caste population constituting 15.73 per cent of total
population while scheduled tribe population was 6.04 percent (table 2.2 and fig. 2.1). A higher
proportion of scheduled caste and tribe population resides in rural areas compared to urban areas.
The three largest scheduled caste groups in the district are Megh etc, Chamar and Koli while
three largest scheduled tribe groups are Bhil, Mina and Garasia (excluding Rajput garasia). Table 2.2: Social Group Population in 2001 by Regions ------------------------------------------------------------------------------------------- Social Groups Rural % Urban % Total % ------------------------------------------------------------------------------------------- Scheduled Caste 288825 15.87 20171 13.87 308996 15.73 Scheduled Tribe 115858 6.37 2830 1.95 118688 6.04 Total 1819431 100 145404 100 1964835 100 -------------------------------------------------------------------------------------------- Source: Statistical Abstract of Rajasthan, 2005. 2.1.1 Tehsil-wise Population
In 2001, Gudhamalani had the highest share in total population of the district and the lowest
share was of Ramsar (table 2.3). Chohtan tops with scheduled caste population with 22.5 percent
share and the lowest share is of Ramsar teshil. 21.3 percent of scheduled tribe resides in
Pachpadra teshil and only 3.95 percent in Ramsar.
Has the share of social group population changed during 1991-2001 across tehsils. Table 2.4
shows that ranking of teshils has not changed in case of scheduled caste and tribe population and
most tehsils have maintained the respective shares in population.
9
0200000400000600000800000
100000012000001400000160000018000002000000
Population Nos.
Rural Urban Total
Regions
Social Group Population Nos.
Scheduled CasteSchedduled TribeTotal
Fig. 2.1
Table 2.3: Distribution of Population By Social Groups: 2001 --------------------------------------------------------------------------------------------------------------------------------------------------- Blocks All Social Groups Scheduled Caste Scheduled Tribe General Group All Male Female All Male Female All Male Female All Male Female --------------------------------------------------------------------------------------------------------------------------------------------------- Sheo 9.09 9.34 8.81 9.49 9.49 9.48 5.79 5.88 5.69 9.26 9.57 8.91 Baytoo 9.81 9.70 9.93 8.86 8.76 8.96 6.29 6.31 6.27 10.27 10.15 10.41 Pachpadra 16.66 16.49 16.85 14.45 14.37 14.53 21.30 21.16 21.46 16.75 16.56 16.97 Siwana 10.87 10.71 11.06 11.88 11.92 11.85 17.46 17.29 17.65 10.16 9.95 10.40 Gudha Malani 17.38 17.13 17.66 15.48 15.37 15.61 12.77 12.81 12.72 18.12 17.81 18.46 Barmer 14.60 14.89 14.28 13.30 13.32 13.27 10.33 10.45 10.19 15.20 15.55 14.80 Ramsar 4.06 4.11 4.00 4.04 4.05 4.03 3.95 4.05 3.85 4.07 4.13 4.01 Chohtan 17.52 17.64 17.40 22.50 22.72 22.27 22.11 22.06 22.17 16.17 16.28 16.05 Barmer District 100 100 100 100 100 100 100 100 100 100 100 100 --------------------------------------------------------------------------------------------------------------------------------------------------- Source: Statistical Abstract of Rajasthan, 2005.
2.1.2 Population Growth
Population in the district has increases in Barmer during each decade since 1961 has been
fluctuating (table 2.5). During the nineties the population grew by 3.69 percent annually and this
is largely ascribed to growth in rural population at the rate of 4.09 percent. The urban population
just grew by 0.86 percent. This is reflected in urbanization in Barmer. In 1961, the urban
population formed 6.1 percent of total population which rose to 10.04 percent in 1991 to fall
again in 2001 to 7.4 percent. Barmer has a rank of 30 amongst 32 districts in Rajasthan as
regards urbanization. Over the years, only towns have been in existence and both have
10
population of less than one lakh. Lower urbanization means lower development level. It would
also mean less non-agricultural opportunities for people that generate employment and income.
This means that the district has very few industries. It could also be the reflection on poor
infrastructure like roads, railway lines. It could also mean too few higher educational institutions.
One can also say that its nearness to international border also does not facilitate economic
activities. Barmer is a desert district and it also is a hindrance to growth of urbanization. Table 2.4: Share of SC & ST Population in Total Population ---------------------------------------------------------------------------------- 1991 2001
Tehsil SC ST SC ST ----------------------------------------------------------------------------------- Sheo 16.3 3.7 16.4 3.8 Baytoo 14.2 3.8 14.2 3.9 Pachpadra 13.6 7.4 13.6 7.7 Siwana 17.5 8.6 17.2 9.7 Gudha Malani 13.9 4.2 14.0 4.4 Barmer 14.8 4.3 14.3 4.3 Chohtan 19.7 8.1 20.2 7.6 Barmer District 15.7 5.9 15.7 6.0 ---------------------------------------------------------------------------------- Source: Statistical Abstract of Rajasthan, 2005. At the teshil level, the growth of population is the highest in Chohtan and the lowest in Sheo
during the nineties (table 2.6). Some of the changes observed are also because of reorganization
of teshils after 1991. Table 2.5: Growth Rate of Population ------------------------------------------------------------------------------------------- Years Rural Urban Total % Urban population ------------------------------------------------------------------------------------------- 1961 610084 39710 649794 6.11 1971 718580 56225 774805 7.26 1981 1020663 98229 1118892 8.78 1991 1291056 144166 1435222 10.04 2001 1819431 145404 1964835 7.40 Growth Rates (%) 1961-2001 24.43 29.64 24.77 1961-1971 17.78 41.59 19.24 1971-1981 42.04 74.71 44.41 1981-1991 26.49 46.77 28.27 1991-2001 40.93 0.86 36.90 ------------------------------------------------------------------------------------------- Source: Statistical Abstract of Rajasthan, 2005.
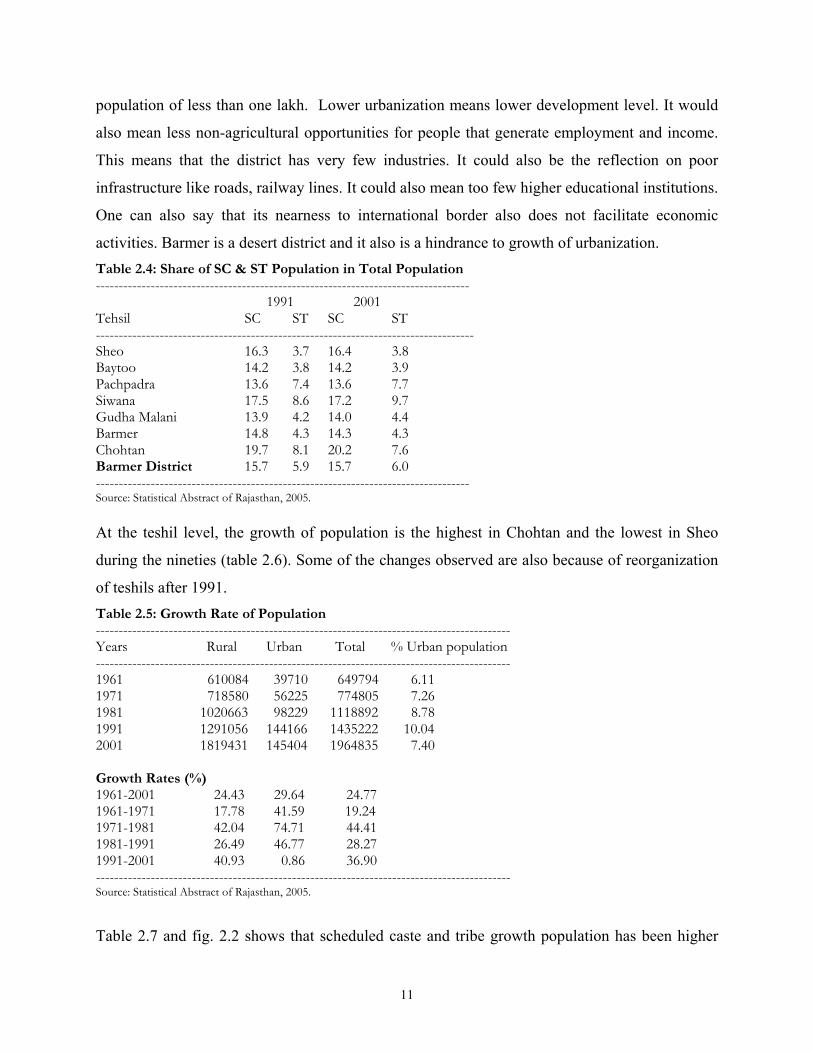
Table 2.7 and fig. 2.2 shows that scheduled caste and tribe growth population has been higher
11
than others groups in each decade since 1961-71. The trend has been similar of the two groups.
In comparison to the decade of 1981-91 the growth rate has been higher during 1991-2001 for
both the groups of population. The last decade observed population growth of 7.8 percent in case
of scheduled caste and tribes and 3.7 percent for the others group. Table 2.6: Decadal Growth Rate of Total Population ------------------------------------------------------------------------- Blocks 1991 2001 % Change ------------------------------------------------------------------------- Sheo 163 179 9.82 Baytoo 152 193 26.97 Pachpardra 192 327 70.31 Siwana 163 214 31.29 Gudha Malani 181 341 88.40 Barmer 171 287 67.84 Sindhari 168 Ramsar 79 Chohtan 171 344 101.17 ------------------------------------------------------------------------ Source: Statistical Abstract of Rajasthan, 2005. Table 2.7: Decadal Growth Rate in Barmer -------------------------------------------------------------- Decades Total SC/ST Others -------------------------------------------------------------- 1961-71 51.11 17.95 1971-81 85.12 43.32 1981-91 76.50 26.91 1991-01 78.04 36.55 -------------------------------------------------------------- Source: Statistical Abstract of Rajasthan, 2005. 2.1.3 Population Density
Table 2.8 shows that Sheo is the largest tehsil followed by Chohtan, Gudhamalani, Baytoo,
Pachpadra, Barmer, Siwana and the smallest tehsil is Ramsar. The population density during the
nineties has increased across tehsils and the most densely populated tehsil is Siwana (104) and
the one with least density is Sheo (27). The tehsils have maintained their ranks of 1991 in 2001.
Ramsar is a new addition as a tehsil and despite that ranking has not changed. This density of
population is one of the lowest and as mentioned above creates hindrances in facilitating social
and physical infrastructures that are very important for development. The cost of infrastructures
goes up. In the process, alternatives ways have to be devised to make available these
infrastructures.
12
0102030405060708090
1961-71 1971-81 1981-91 1991-01
Decades
Decadal Growth rate in Barmer
Total SC/STOther
Fig. 2.2
Table 2.8: Area of Tehsils and Population Density ------------------------------------------------------------------------ Tehsil Area Rank Density (sq.km) 2001 1991 (2001) ---------------------------------------------------------------------- Sheo 6616.32 1 27 18 Baytoo 3045.42 4 63 46 Pachpadra 3458.27 5 95 68 Siwana 2045.15 7 104 81 Gudha Malani 3975.81 3 86 61 Barmer 2893.87 6 99 61 Ramsar 1446.37 8 55 Chohtan 4692.11 2 73 55 Barmer District 28387 69 51 ------------------------------------------------------------------ Source: Statistical Abstract of Rajasthan, 2005. 2.1.4 Sex Ratio The sex ratio, defined as the number of females per 1000 males, is one status of women in a
society. Women invariably enjoy longer survival rate than men and this should be reflected in
sex ratio of greater than 1000. If the sex ratio is lower than 1000, it indicates general
discrimination against women. It reflects on the social structure of any society. India in recent
times has observed declining sex ratios due to variety of regions. Some of these are high
mortality rates among females, high maternal mortality ratio, practice of female foeticide, female
infanticide and neglect of the health of girl child, especially on the nutrition front, resulting in
13
higher mortality; besides immigration of single male population to a region. To overcome the
impact of immigration of single males to a region, which is the case particularly in urbanized and
industrialized regions and states of the country, the juvenile sex ratio is considered in analyzing
the status of women. Juvenile sex ratio is the sex ratio of population in age-group 0-6 years, data
for which are available in the censuses. The overall sex ratio in 2001 of Barmer was 892 while it
was 896 in rural areas and 855 in urban areas.
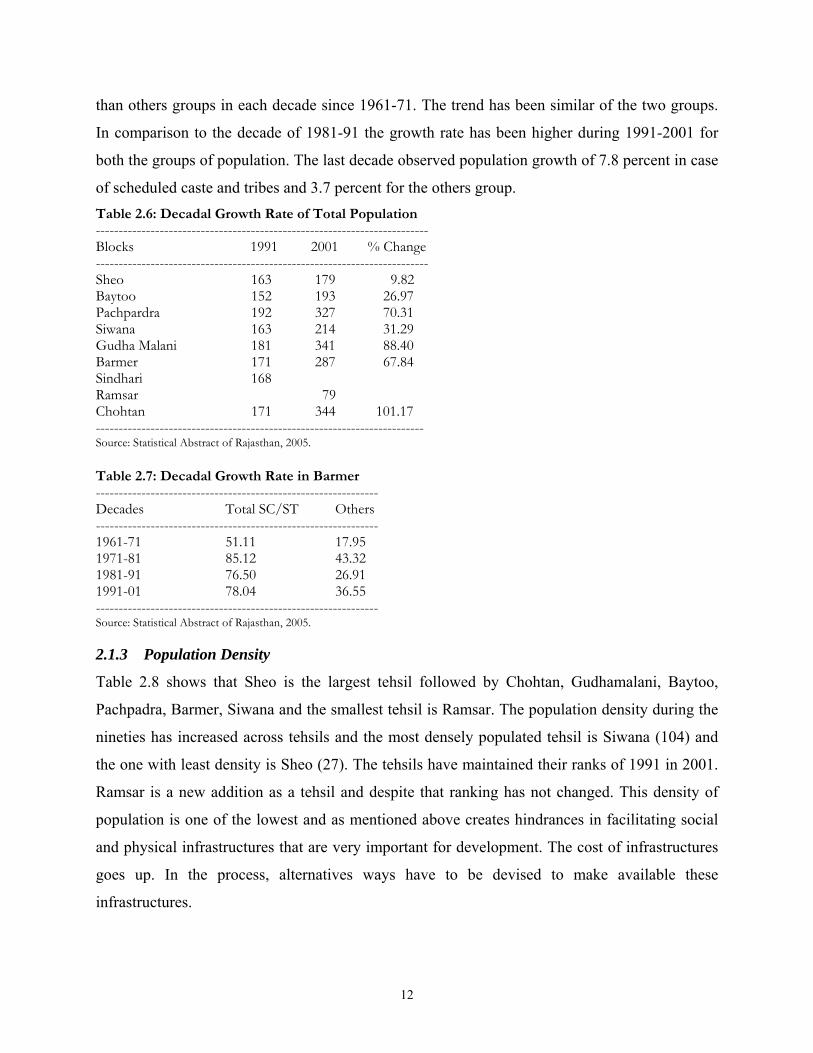
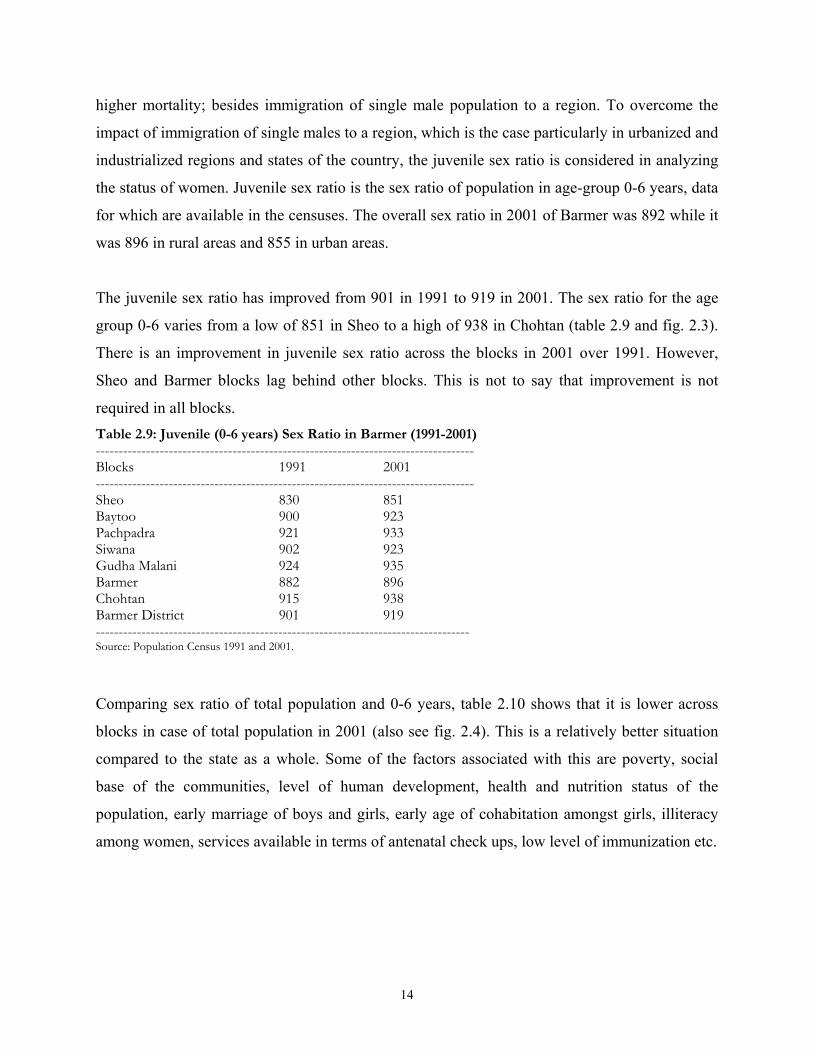
The juvenile sex ratio has improved from 901 in 1991 to 919 in 2001. The sex ratio for the age
group 0-6 varies from a low of 851 in Sheo to a high of 938 in Chohtan (table 2.9 and fig. 2.3).
There is an improvement in juvenile sex ratio across the blocks in 2001 over 1991. However,
Sheo and Barmer blocks lag behind other blocks. This is not to say that improvement is not
required in all blocks. Table 2.9: Juvenile (0-6 years) Sex Ratio in Barmer (1991-2001) ----------------------------------------------------------------------------------- Blocks 1991 2001 ----------------------------------------------------------------------------------- Sheo 830 851 Baytoo 900 923 Pachpadra 921 933 Siwana 902 923 Gudha Malani 924 935 Barmer 882 896 Chohtan 915 938 Barmer District 901 919 ---------------------------------------------------------------------------------- Source: Population Census 1991 and 2001.
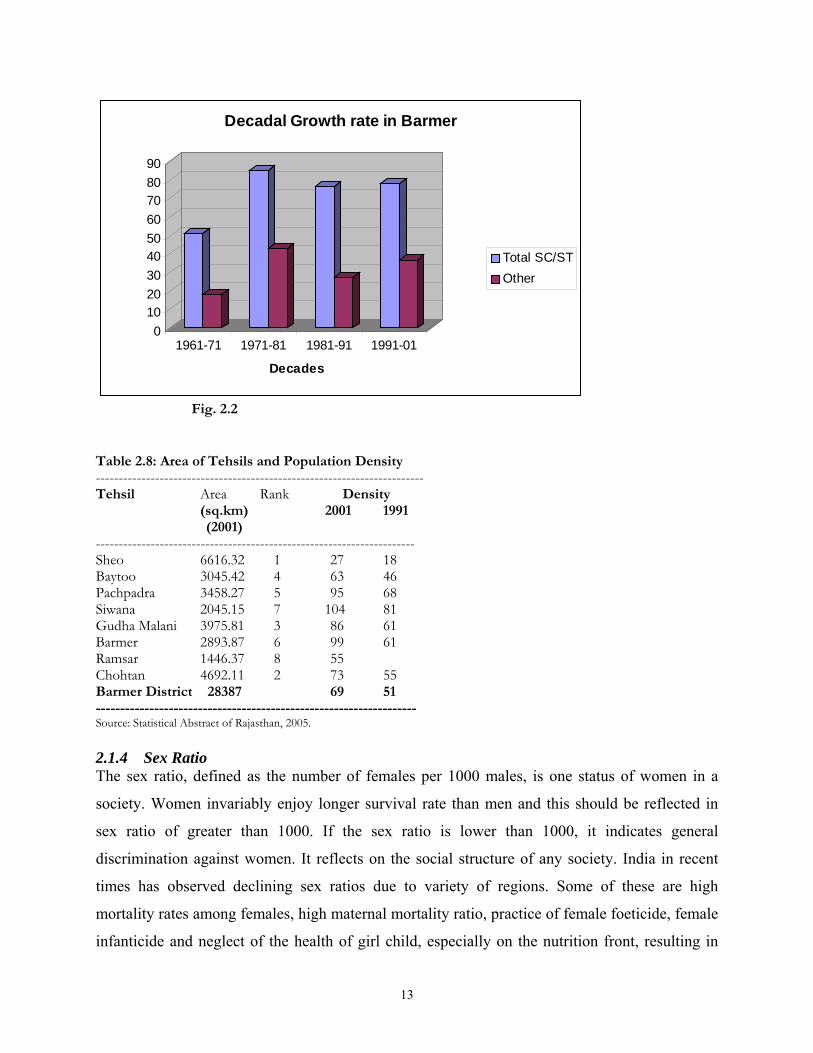
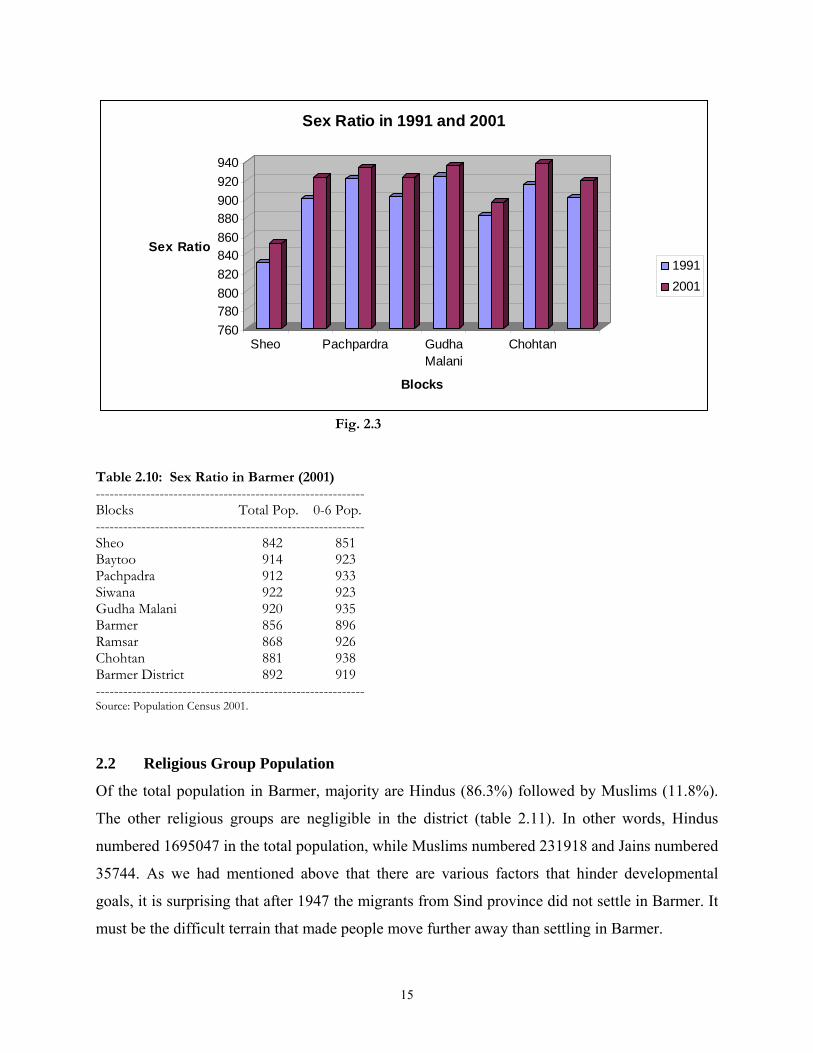
Comparing sex ratio of total population and 0-6 years, table 2.10 shows that it is lower across
blocks in case of total population in 2001 (also see fig. 2.4). This is a relatively better situation
compared to the state as a whole. Some of the factors associated with this are poverty, social
base of the communities, level of human development, health and nutrition status of the
population, early marriage of boys and girls, early age of cohabitation amongst girls, illiteracy
among women, services available in terms of antenatal check ups, low level of immunization etc.
14
760780800820840860880900920940
Sex Ratio
Sheo Pachpardra GudhaMalani
Chohtan
Blocks
Sex Ratio in 1991 and 2001
19912001
Fig. 2.3 Table 2.10: Sex Ratio in Barmer (2001) ----------------------------------------------------------- Blocks Total Pop. 0-6 Pop. ----------------------------------------------------------- Sheo 842 851 Baytoo 914 923 Pachpadra 912 933 Siwana 922 923 Gudha Malani 920 935 Barmer 856 896 Ramsar 868 926 Chohtan 881 938 Barmer District 892 919 ----------------------------------------------------------- Source: Population Census 2001.
2.2 Religious Group Population
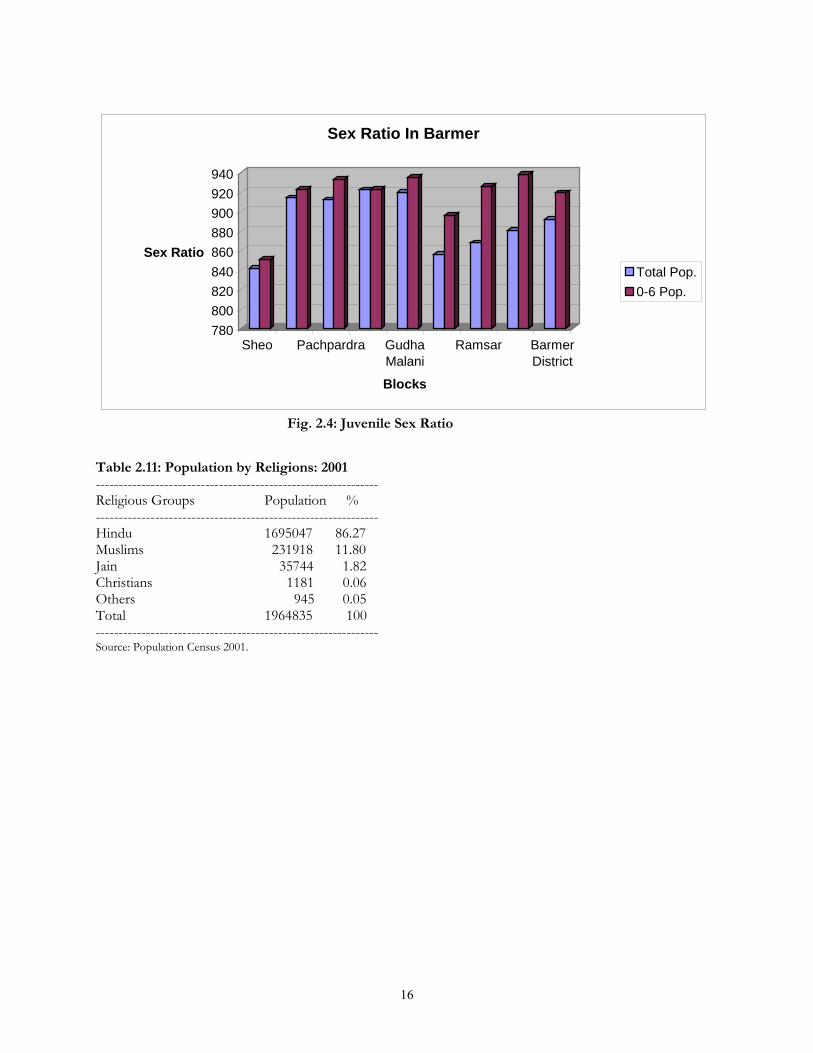
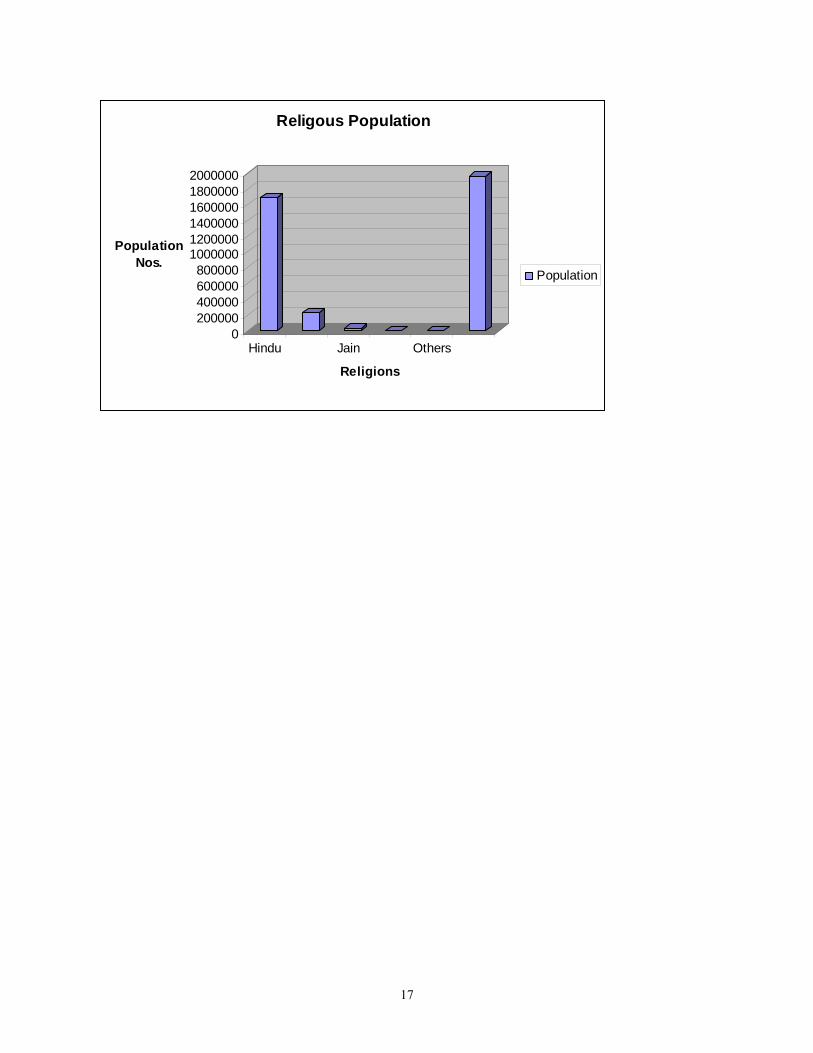
Of the total population in Barmer, majority are Hindus (86.3%) followed by Muslims (11.8%).
The other religious groups are negligible in the district (table 2.11). In other words, Hindus
numbered 1695047 in the total population, while Muslims numbered 231918 and Jains numbered
35744. As we had mentioned above that there are various factors that hinder developmental
goals, it is surprising that after 1947 the migrants from Sind province did not settle in Barmer. It
must be the difficult terrain that made people move further away than settling in Barmer.
15
780800820840860880900920940
Sex Ratio
Sheo Pachpardra GudhaMalani
Ramsar BarmerDistrict
Blocks
Sex Ratio In Barmer
Total Pop.0-6 Pop.
Fig. 2.4: Juvenile Sex Ratio Table 2.11: Population by Religions: 2001 -------------------------------------------------------------- Religious Groups Population % -------------------------------------------------------------- Hindu 1695047 86.27 Muslims 231918 11.80 Jain 35744 1.82 Christians 1181 0.06 Others 945 0.05 Total 1964835 100 -------------------------------------------------------------- Source: Population Census 2001.
16
0200000400000600000800000
100000012000001400000160000018000002000000
Population Nos.
Hindu Jain Others
Religions
Religous Population
Population
17
Chapter 3
The Resource Base: Land, Water and Human
In this chapter we look at resource base of the district of Barmer. Barmer is located in a desert
and is an agrarian district with large section of population dependent on land and land base
activities. We also look at the status human resources in the district in terms of literacy and social
infrastructure.
3.1 Land
The district has a geographical area of 2.82 million hectares. In 2004-05, about 1.12 percent of
the area had forest cover, 7.2 percent constituted pasture land, 25.13 percent was fallow land and
51.63 percent was cultivated crop land. The remainder was either not available for cultivation or
culturable wasteland (table 3.1). Gross cropped area in 2004-05 was 1.55 million hectares (1.79
million hectares in 2006-07) and area sown more than once stood at 90762. In 2006-07, some
changes took place with net sown area being 60 percent of total area. The forest cover marginally
increased to 1.13 percent and permanent pastures and other grazing lands constituting 15.38
percent and barren and culturable land another 18 percent. The cropping intensity for the year
stood at 106.24. It is the condition of the district that allows it to have only 6.24 percent area
under double cropping.
3.1.1 Land Holdings
Barmer district in 2003 had 27048 holdings of which majority were 4 hectares and above
(70.24%). Across tehsils, such holdings were 72.75 percent in Barmer, 73.48 percent in Baytoo,
83.57 percent in Chohtan, 57.61 percent in Gudhamalani, 59.51 percent in Pachpadra, 89.43
percent in Ramsar, 80.90 percent in Sheo, 50.42 percent in Siwana as against the district average
of 70.24 percent (tables 3.2 and 3.3 and fig. 3.1). Large holding does not mean much in rainfed
areas. However, this pattern of holdings would reflect on agricultural practices. Large land
18
holdings are a reflection of the harsh environmental conditions, and hence low population
density (69 people/ km²).
Table 3.1: Land Utilization in Barmer: 2004-05 --------------------------------------------------------------------------------------------- Items Area in hectares % --------------------------------------------------------------------------------------------- Reporting Area 2817332 100 Forest 31677 1.12 Area under Non-agricultural Uses 72926 2.59 Barren & Unculturable Land 126147 4.48 Permanent Pasture & other Grazing Land 202739 7.20 Land under Misc. Tree Crops & Groves 301 0.01 Culturable Waste Land 220963 7.84 Fallow Lands other Than Current Fallow 355854 12.63 Current Fallows 352234 12.50 Net Area Sown 1454491 51.63 Gross Cropped Area 1545253 Area Sown More Than Once 90762 --------------------------------------------------------------------------------------------- Source: Statistical Abstract of Rajasthan 2005.
3.2 Water Resources and Irrigation
In 2004, of the 8 blocks, 12.5 percent were safe, 25.0 percent were critical and 62.5 percent were
over-exploited (dark). As per the ground water quality status in Barmer, 97.6 percent habitations
are chemically affected (PHED, GOR). So the ground water situation is quite bad in Barmer.
During the summer months, acute water scarcity occurs in many parts of the district like Barmer
and Balotra.
Table 3.2: Tehsil wise Number of Holding: 2003 (Hectares) --------------------------------------------------------------------------------------------------- Hectares Tehsils < 1 1 - 2 2 - 4 4 - 10 10 + Total --------------------------------------------------------------------------------------------------- Barmer 125 143 434 1109 765 2576 Baytoo 117 166 480 1252 862 2877 Chohatan 132 177 658 3191 1727 5885 Gudha Malani 130 465 1359 1941 715 4610 Pachpadra 154 481 836 1258 904 3633 Ramsar 11 25 93 584 507 1220 Sheo 155 179 314 950 1795 3393 Siwana 154 456 805 941 498 2854 Barmer District 978 2092 4979 11226 7773 27048 Source: Statistical Outline of Barmer 2005.
19
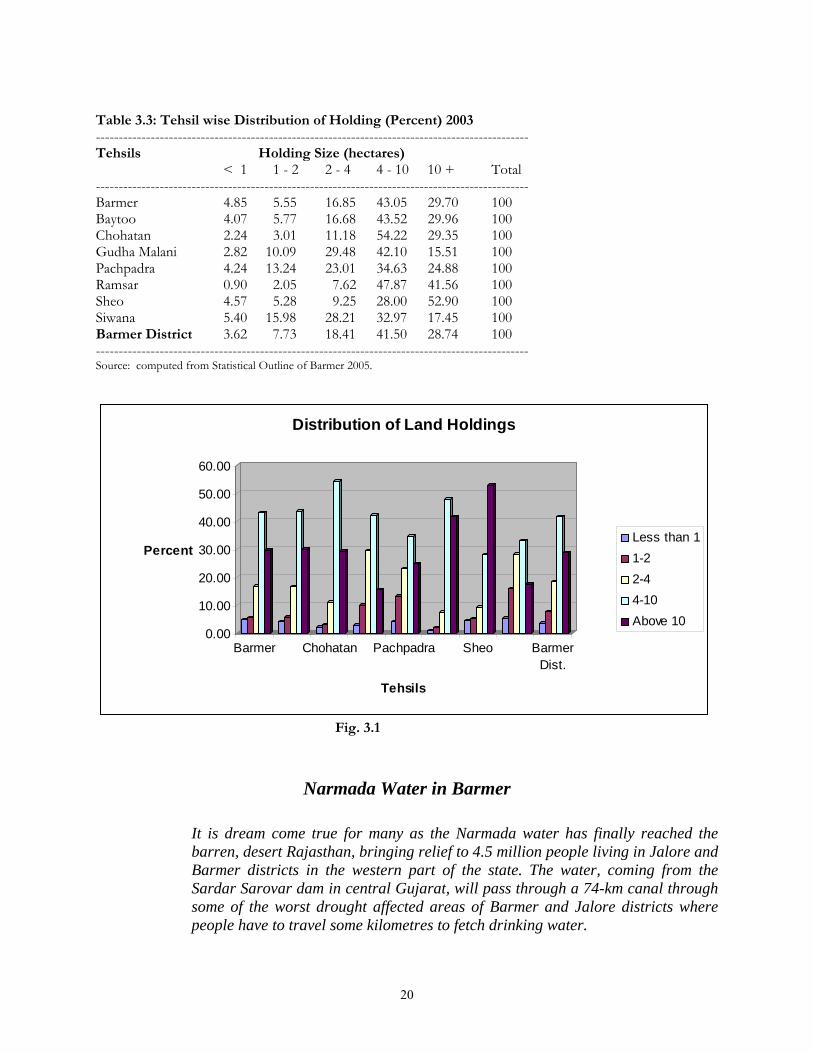
Table 3.3: Tehsil wise Distribution of Holding (Percent) 2003 ----------------------------------------------------------------------------------------------- Tehsils Holding Size (hectares) < 1 1 - 2 2 - 4 4 - 10 10 + Total
----------------------------------------------------------------------------------------------- Barmer 4.85 5.55 16.85 43.05 29.70 100 Baytoo 4.07 5.77 16.68 43.52 29.96 100 Chohatan 2.24 3.01 11.18 54.22 29.35 100 Gudha Malani 2.82 10.09 29.48 42.10 15.51 100 Pachpadra 4.24 13.24 23.01 34.63 24.88 100 Ramsar 0.90 2.05 7.62 47.87 41.56 100 Sheo 4.57 5.28 9.25 28.00 52.90 100 Siwana 5.40 15.98 28.21 32.97 17.45 100 Barmer District 3.62 7.73 18.41 41.50 28.74 100 ----------------------------------------------------------------------------------------------- Source: computed from Statistical Outline of Barmer 2005.
0.00
10.00
20.00
30.00
40.00
50.00
60.00
Percent
Barmer Chohatan Pachpadra Sheo BarmerDist.
Tehsils
Distribution of Land Holdings
Less than 11-22-44-10Above 10
Fig. 3.1
Narmada Water in Barmer
It is dream come true for many as the Narmada water has finally reached the barren, desert Rajasthan, bringing relief to 4.5 million people living in Jalore and Barmer districts in the western part of the state. The water, coming from the Sardar Sarovar dam in central Gujarat, will pass through a 74-km canal through some of the worst drought affected areas of Barmer and Jalore districts where people have to travel some kilometres to fetch drinking water.
20
As the Chief Minister said, “People have not seen water. They have just heard that Narmada water is coming to their state. When I saw the water I had tears in my eyes. The moment is theirs,” Rajasthan Chief Minister told reporters while releasing the water into the canal and performing a small religious ceremony, as over 100,000 people cheered and clapped, rejoicing the moment the water gushed through the canal. She also said, “But now the dream of the people has come true. This river is no less pious than the Ganga river. The water could not reach Rajasthan earlier as it had not paid Gujarat its share of Rs.6.46 billion towards the project cost. The day water was released, women wearing colorful lehngha-choli and decked with silver jewellery, filled pots and carried the water home to worship it. Children tugged behind their mothers, while men donning colorful turbans stood along the canal or tried to take a dip in the water. For the people of two district of Rajasthan, it will not only mean end of water scarcity, but will also help 233 villages in the area to irrigate 250,000 hectares of land. Apart from this, 518 areas in Jalore and 589 areas in Barmer - a total of 1,107 villages with a population of 4.5 million will be able to use the water for drinking purposes. A total of Rs.15.41 billion has been proposed for the project, of which Rs.11.88 billion has been invested. For many in the desert, it is no small wonder to see the water of a distant river at their doorstep. Phula Ram, 63, a villager, says they sometimes went without taking bath as they feared that the rainwater they had collected in their tanks will not last for long. For irrigation we can depend on the rain gods. But for drinking water we depend on our storage. Our women travel kilometres to get drinking water. People don't want to marry their daughters into our village as they fear their daughters will be just busy fetching water all day around. But the situation will be different now,” (gives a toothless smile).
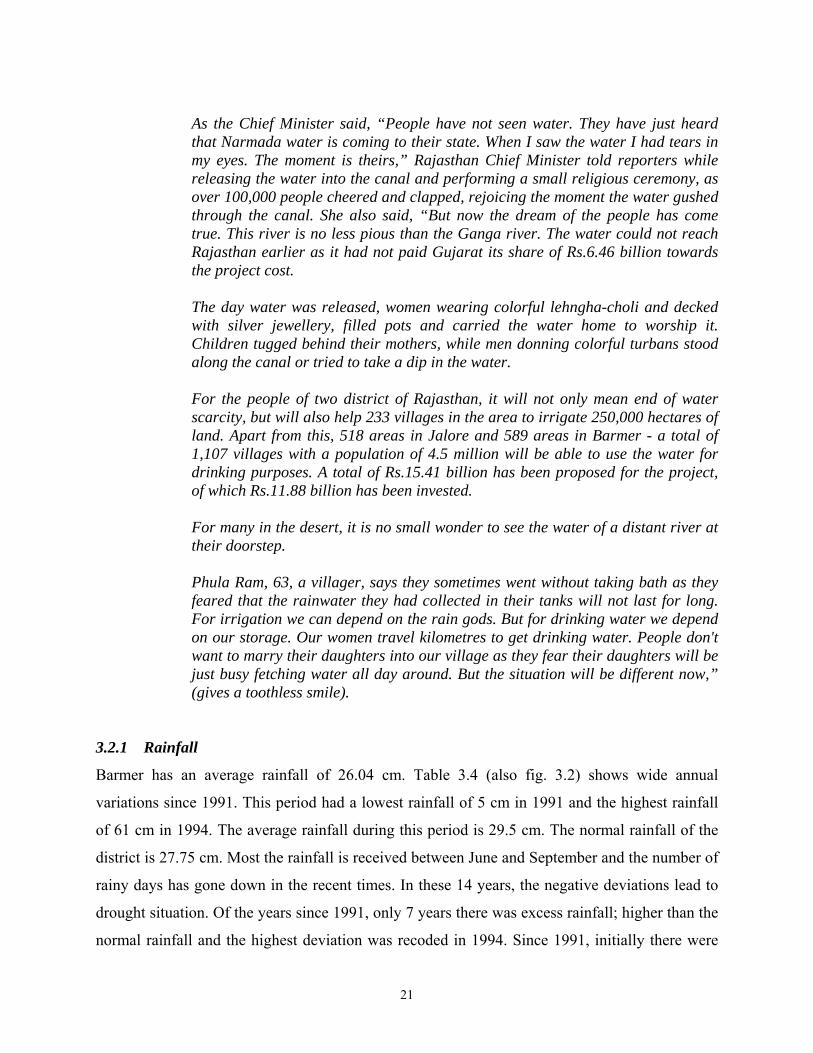
3.2.1 Rainfall
Barmer has an average rainfall of 26.04 cm. Table 3.4 (also fig. 3.2) shows wide annual
variations since 1991. This period had a lowest rainfall of 5 cm in 1991 and the highest rainfall
of 61 cm in 1994. The average rainfall during this period is 29.5 cm. The normal rainfall of the
district is 27.75 cm. Most the rainfall is received between June and September and the number of
rainy days has gone down in the recent times. In these 14 years, the negative deviations lead to
drought situation. Of the years since 1991, only 7 years there was excess rainfall; higher than the
normal rainfall and the highest deviation was recoded in 1994. Since 1991, initially there were
21
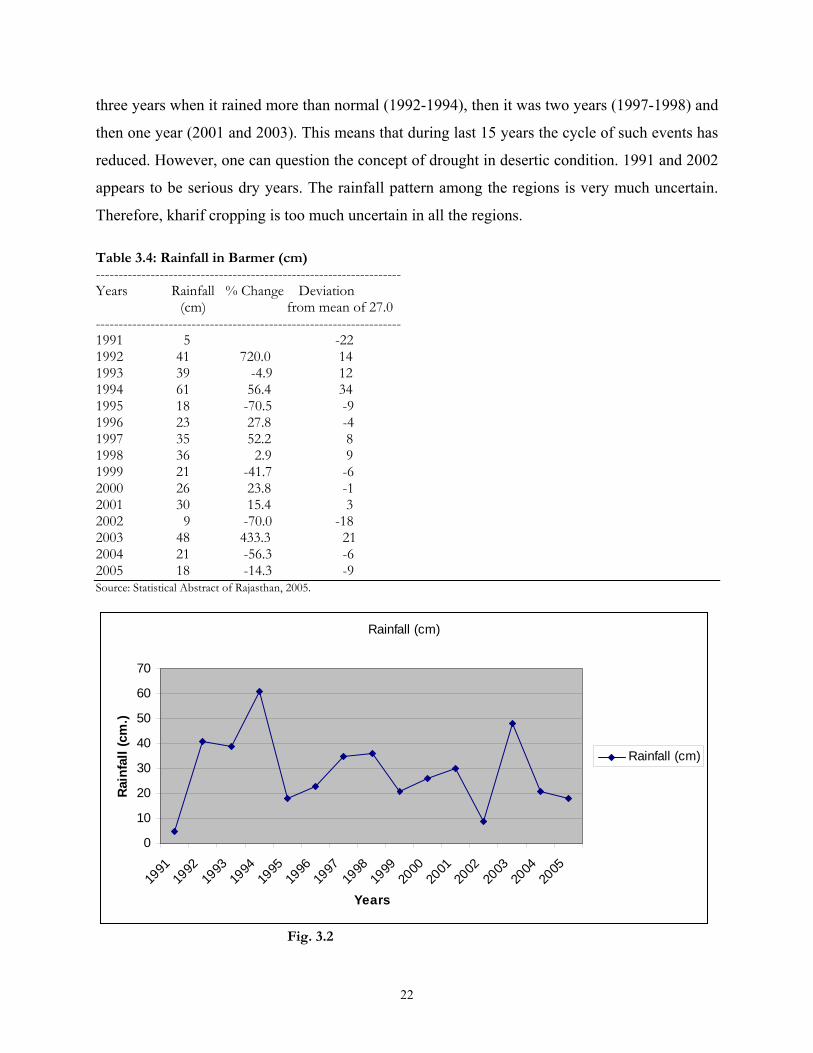
three years when it rained more than normal (1992-1994), then it was two years (1997-1998) and
then one year (2001 and 2003). This means that during last 15 years the cycle of such events has
reduced. However, one can question the concept of drought in desertic condition. 1991 and 2002
appears to be serious dry years. The rainfall pattern among the regions is very much uncertain.
Therefore, kharif cropping is too much uncertain in all the regions. Table 3.4: Rainfall in Barmer (cm) ------------------------------------------------------------------- Years Rainfall % Change Deviation (cm) from mean of 27.0 ------------------------------------------------------------------- 1991 5 -22 1992 41 720.0 14 1993 39 -4.9 12 1994 61 56.4 34 1995 18 -70.5 -9 1996 23 27.8 -4 1997 35 52.2 8 1998 36 2.9 9 1999 21 -41.7 -6 2000 26 23.8 -1 2001 30 15.4 3 2002 9 -70.0 -18 2003 48 433.3 21 2004 21 -56.3 -6 2005 18 -14.3 -9 Source: Statistical Abstract of Rajasthan, 2005.
Rainfall (cm)
0
10
20
30
40
50
60
70
1991
1992
1993
1994
1995
1996
1997
1998
1999
2000
2001
2002
2003
2004
2005
Years
Rain
fall
(cm
.)
Rainfall (cm)
Fig. 3.2
22
Shri Manvendra Singh, Barmer Lok Sabha MP views on Barmer as recorded in an interview with Ashutosh Bharadwaj, IndianNGOs.com
On water related problems- probably, in no other part of India, water is such a critical issue as it is in Barmer. The lack of awareness in context of management further aggravates the situation. The impact of unavailability of adequate water has a huge impact on the socio-economic and cultural development in a region. It is devastating because water is an intrinsic part of our lives. Too much of man power is consumed in fetching water, which could have been used for other productive means. The impact can be seen on children as well. These children get affected, as they have to go and fetch water. In course of time, with lack of water, the entire productive cycle gets disrupted. The problem of water is less acute in Siwana relatively. As Rajasthan has a wonderful tradition of water harvesting systems like bunds, tanks and wells. In Barmer, people do have tanks and few bowris. As the population is very sparse, people build tanks close to their homes. Unfortunately, over a period of time, people stopped paying attention to these traditional methods. The oldest bowri in the district is in ruins. This is due to negligence on the part of the state and society. People started neglecting it because they expected the PHED (Public Health and Engineering Department) to provide them water through pipelines. Water through pipelines depends on sub soil extraction of water, which caused depletion of water table. Barmer not only has lowest availability of water, but also has the highest depletion of sub soil water in the country. In the past decade, water table has gone down by more than ten meters. NGOs largely hold workshops and give lectures but there is no large presence as such. They focus on handicrafts, Self- Help groups and employment. There is no campaign specific to water. Resolving water crisis is a long-term effort. I gave 80 percent of my MP budget for tanks. In the first year as the MP itself, I helped the construction of around 2300 tanks. Also, I do not think that the large water bodies are the solution to the problem. For a highly dispersed population, water harvesting has to be localized. A tank approximately cost Rs. 25000. The long-term solution is water harvesting. We also need to change the priority from irrigation to drinking water. When you make a canal with irrigation in mind, it serves only the farmer around the canal. Instead, if drinking water were a priority, it would have far reaching effects as it would reach more families. In addition, it positively impacts animals. A desert economy depends on cattle and cannot be an agriculturally sustained area. Our sustainability depends on the animals. People expect the PHED to provide them water through pipelines. About Rs.1600 crore have been sanctioned to get water from the main source in Nashna to other parts of Barmer through series of lifts and pipelines. It would then be dovetailed into the PHED network and supplied through pipelines.
23
On Agriculture- agriculture depends on rainfall. However, if you bring crops from some other country/ regions thinking since those crops worked well there, they are likely to succeed here as well, it is unlikely. The soil in Rajasthan is different from the one in Israel for instance. Plants that were imported and planted here have ruined the growth of local plants. They do not allow local plants to grow. You can't transplant other people's knowledge into your own terrain. The solutions have to be local terrain specific. There is enough expertise and knowledge in the villages. Unfortunately, that's not the same in air-conditioned offices. Indira Gandhi Canal is being extended. What is the progress in this regard? It's a long-term strategy and the progress has been stopped right now as the project for the Desert National Park is being executed. The canal construction cannot take place through Desert National Park. However, I am not in favour of canal as an irrigation project. My main concern is drinking water for humans and animals. Unfortunately, the government likes big projects because it involves major expenditure and makes contractors happy. They make good brochure of these projects and promote them. However, drinking water is more important than these brochures.
Voices from Grassroots
Power of Community Based Institutions
Barmer is one district, which lacks even essentials like water to support life. In such a place it is common that young people migrate in search of livelihoods while the older ones are left behind to manage survival. Luxmipura is one such village in Sheo Tehsil of Barmer where Sh. Surta Ram a 65 years old man (potter by profession) has set a milestone. GRAVIS- a Jodhpur based NGO working in Thar Desert with the help of Helpage International initiated to form Village Older People’s Association (VOPA) in Barmer to build up self confidence in older and give a meaning to their lives.
Sh. Surta Ram joined the association in year 2004 and with a small budget available, he as an active member of VOPA was involved with GRAVIS in construction of water harvesting structures for drinking water (as underground tanks) and on agricultural lands (as bunds), several horticulture units were established and the older people of the village joined hands for the development of the village. Sh. Surta Ram was a popular VOPA member and in last panchayat elections he was elected unanimously as ‘Ward Panch’. Now as a public representative, he is not only raising issues related to the development of older people but also is more powerful on governance issues of the village. He expresses that confidence he gained as a VOPA member played a key role and now as VOPA has acted as a discussion platform for villagers, most of the decisions are taken with common understanding.
24
Rain Water Harvesting Structures
Water is scarce in Barmer, as the soil is sandy it does not has capacity to hold rainwater, which gets drained away during monsoons. Smt. Kiya w/o Sh. Saleshar Khan is a 72 years old lady with a family of 14 members residing in village Bipra of Mandaliya Gram Panchayat in Barmer. Months in summer were a real trying time for the family as the water was scarce and they had to walk to almost 8 kilometers to fetch water or purchase it from tanker suppliers at high prices.
Gramin Vikas Vigyan Samiti, a Jodhpur based organization supported Smt. Kiya to construct a underground tank called ‘tanka’ with a storage capacity of 19,500 litres of water. Tanka is meant for both purposes- one: harvest rain water with a catchment area designed to collect rainwater into the tank and two: store water for longer period. The structure was built in April 2007 and in the month of July in two consecutive rains it was filled up with water. The family is happy as the water lasted for 6 months and Smt. Kiya said that they spent saved money in repair of their hut.
Such small rain water harvesting structure have proved to a boon in the area and an advocacy campaign is being launched addressing government and public representatives to focus on such structures at village level.
Water Storage Structures
Construction of water storage structure/rain water-harvesting structure Tankas and Beris are structures constructed to harvest rainwater to be used for drinking water. These structures not only provide water but also employment to community. SURE, a NGO in Barmer, has constructed and repaired a number of Tankas during droughts to support community and benefited the Chohtan and Sheo blocks of Barmer District. High wind velocity cause silting of Nadis in the summer months so desilting of Nadis has been taken up time to time in the Villages of Chohtan and Sheo Block. Beries are deep traditional well like structures commonly found in the desert villages. During the droughts it has constructed, 40 new berries and repaired 111 beris to harness ground water. Beri construction is an ongoing programme in Bakhasar belt to support community, availability of drinking water.
3.2.2 Floods The climate is now leading to more erratic weather conditions. It is witnessed by 2006 floods in
certain parts of the district. Though, one can ascribe these floods to human error, as is
documented in the following paragraphs.
In August 2006, the usually drought prone Barmer district was hit by flash floods. As of August 27, 2006, 103 deaths had been reported in Rajasthan due to floods. Many people
25
died in this flood. The village of Kawas was the most affected village. The water level as on March 6, 2007 was about 3 feet to 10 feet in Kawas. People had to live in Camps. The loss included the death of 75194 cattle and damage to Kharif crop was worth Rs.1300 crore. Many villages in the district remained submerged under water for few days.
Floods in the deserts of Rajasthan are an almost surreal event, but then more and more nature seems to have become surreal and extreme. The floods in Barmer not only interested the experts but also brought those who simply wanted to gaze at the spectacle of dunes under water. The surreal sights of rivulets in the middle of the desert and the sands of Barmer swirling under 10 to 20 feet of water were a surprise as unexpected and unheard of floods hit the region. Barmer under water has become a spectacle even for those who live in the region. On one side, there were sand dunes and right next to it was what seems like a flowing river. After the floods, Barmer became the focus of all attention for scientists, environmentalists and ecologists across the world as they tried to understand what is happening to this desert region. The desert has also interested a world famous expert on desert ecology. "Barmer has got flooded but the northeast has got just 20-30 per cent of rainfall. Desert soil allows water to percolate fast, but how come the sands drainage system fail," (SM Mohnot, Desert Ecologist). The region has an ostensibly rugged hardy terrain but underneath there is a far more fragile and damaged ecological system, which is giving rise to many unanswered questions. The floods he says are a lesson for Barmer. Although it is a climactic shift, it is also an effect of too much tampering with the desert. The worst water logging was seen in areas where chip stones are mined, stones whose clay-like texture trapped the water. For drought relief, the area built a network of underground reservoirs or anicuts. So when the rainwater gushed down from Jaisalmer to Barmer, the huge amounts of water in the anicuts got carried along worsening the situation. Also construction of the Indira Gandhi Canal, one of the biggest projects in India, and the newly restored rail link between Munbao and Khokrapar could have interfered with the natural drainage system. The foliage of the desert the cacti are under water, and new recharged ground water means the growth of alien foliage. Thus, it is clear that even after the waters has receded it will take time to show what the landscape would be like in years to come (http://en.wikipedia.org/wiki/#cite_notes-0).
26
Chapter 4
Literacy and Education
4.1 Literacy Rates
Education is a major component of human development. Investment in human beings is creation
of human capital that helps in future production processes and economic progress. It is important
that every citizen has a basic education and also required skills. Rajasthan has been lagging
behind in social sectors especially education. However, the decades of the nineties has observed
tremendous efforts on the part of the state with support from innovative programmes like Lok
Jumbish, DPEP and Sarva Shiksha Abhiyan (SSA) facilitating growth in general literacy in
Rajasthan. Barmer district is no different despite the fact that is located in a hostile environment
where supply of school infrastructure is not cost effective. Female literacy was one of the lowest
in the country and is still lagging behind male literacy.
Barmer in 2001 had 902027 literate persons of which 590123 were males and 311904 were
females. In percentage terms, total literacy rate was 59.6 when male literacy was 73.6 compared
to much lower female literacy level of 43.9.
As per 2001 census, total literates in the district were 902027 and another 164788 were without
any education. There were 370095 with below primary education, 186398 had primary level
education, 91014 were middle pass, 70014 were matric/ higher secondary/ diploma graduates
and only 19718 were graduates and above.
In 2001, the total literacy rate in Barmer was 59.0 and the literacy rates were higher in
Gudhamalini and Barmer blocks compared to the district total. The highest literacy rate was
recorded in Barmer and the lowest in Ramsar (table 4.1 and fig 4.1). The total male literacy rates
across blocks were higher than the female literacy rates. The total male literacy rate in 2001 was
72.8 for the district as a whole compared to 43.5 percent for females. The gender difference
27
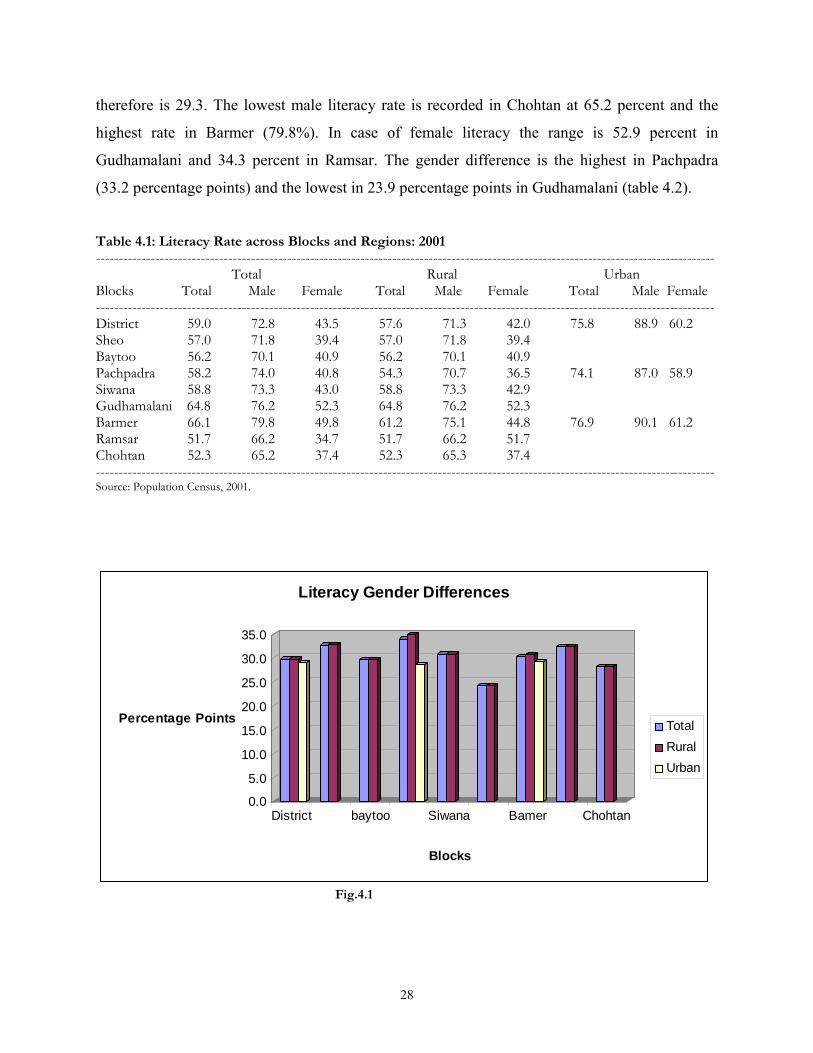
therefore is 29.3. The lowest male literacy rate is recorded in Chohtan at 65.2 percent and the
highest rate in Barmer (79.8%). In case of female literacy the range is 52.9 percent in
Gudhamalani and 34.3 percent in Ramsar. The gender difference is the highest in Pachpadra
(33.2 percentage points) and the lowest in 23.9 percentage points in Gudhamalani (table 4.2).
Table 4.1: Literacy Rate across Blocks and Regions: 2001 ---------------------------------------------------------------------------------------------------------------------------------------- Total Rural Urban Blocks Total Male Female Total Male Female Total Male Female ---------------------------------------------------------------------------------------------------------------------------------------- District 59.0 72.8 43.5 57.6 71.3 42.0 75.8 88.9 60.2 Sheo 57.0 71.8 39.4 57.0 71.8 39.4 Baytoo 56.2 70.1 40.9 56.2 70.1 40.9 Pachpadra 58.2 74.0 40.8 54.3 70.7 36.5 74.1 87.0 58.9 Siwana 58.8 73.3 43.0 58.8 73.3 42.9 Gudhamalani 64.8 76.2 52.3 64.8 76.2 52.3 Barmer 66.1 79.8 49.8 61.2 75.1 44.8 76.9 90.1 61.2 Ramsar 51.7 66.2 34.7 51.7 66.2 51.7 Chohtan 52.3 65.2 37.4 52.3 65.3 37.4 ---------------------------------------------------------------------------------------------------------------------------------------- Source: Population Census, 2001.
0.0
5.0
10.0
15.0
20.0
25.0
30.0
35.0
Percentage Points
District baytoo Siwana Bamer Chohtan
Blocks
Literacy Gender Differences
TotalRuralUrban
Fig.4.1
28
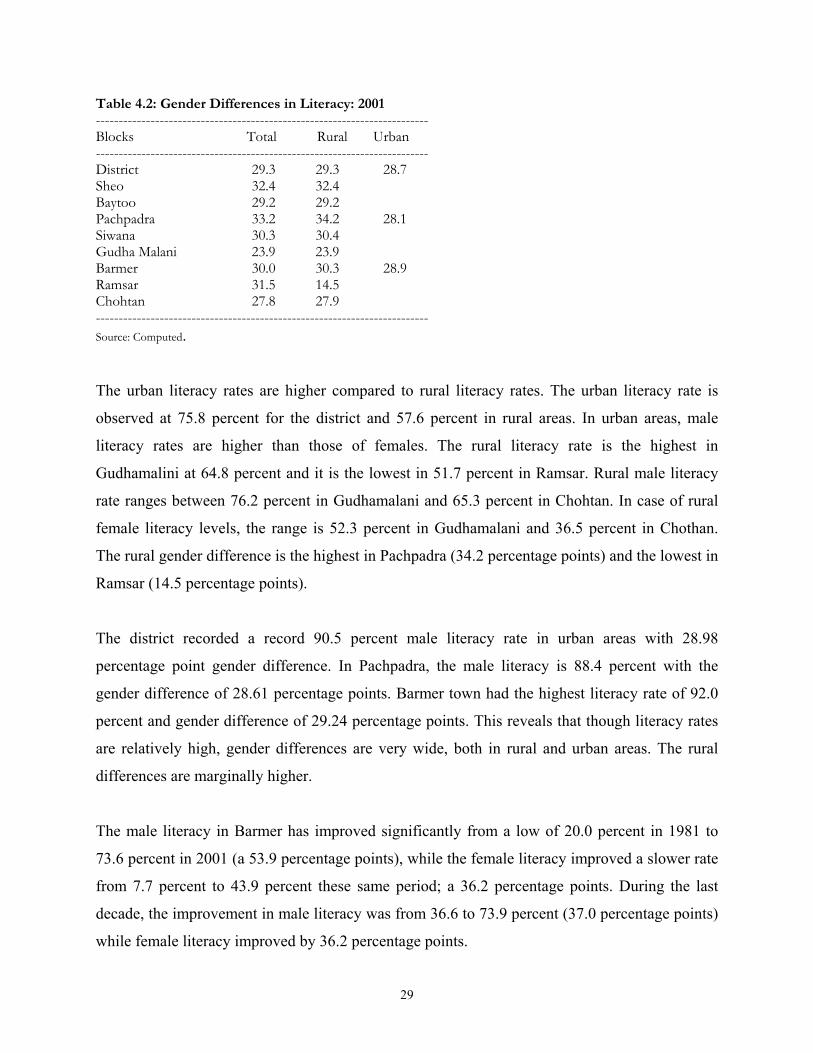
Table 4.2: Gender Differences in Literacy: 2001 ------------------------------------------------------------------------- Blocks Total Rural Urban ------------------------------------------------------------------------- District 29.3 29.3 28.7 Sheo 32.4 32.4 Baytoo 29.2 29.2 Pachpadra 33.2 34.2 28.1 Siwana 30.3 30.4 Gudha Malani 23.9 23.9 Barmer 30.0 30.3 28.9 Ramsar 31.5 14.5 Chohtan 27.8 27.9 ------------------------------------------------------------------------- Source: Computed.
The urban literacy rates are higher compared to rural literacy rates. The urban literacy rate is
observed at 75.8 percent for the district and 57.6 percent in rural areas. In urban areas, male
literacy rates are higher than those of females. The rural literacy rate is the highest in
Gudhamalini at 64.8 percent and it is the lowest in 51.7 percent in Ramsar. Rural male literacy
rate ranges between 76.2 percent in Gudhamalani and 65.3 percent in Chohtan. In case of rural
female literacy levels, the range is 52.3 percent in Gudhamalani and 36.5 percent in Chothan.
The rural gender difference is the highest in Pachpadra (34.2 percentage points) and the lowest in
Ramsar (14.5 percentage points).
The district recorded a record 90.5 percent male literacy rate in urban areas with 28.98
percentage point gender difference. In Pachpadra, the male literacy is 88.4 percent with the
gender difference of 28.61 percentage points. Barmer town had the highest literacy rate of 92.0
percent and gender difference of 29.24 percentage points. This reveals that though literacy rates
are relatively high, gender differences are very wide, both in rural and urban areas. The rural
differences are marginally higher.
The male literacy in Barmer has improved significantly from a low of 20.0 percent in 1981 to
73.6 percent in 2001 (a 53.9 percentage points), while the female literacy improved a slower rate
from 7.7 percent to 43.9 percent these same period; a 36.2 percentage points. During the last
decade, the improvement in male literacy was from 36.6 to 73.9 percent (37.0 percentage points)
while female literacy improved by 36.2 percentage points.
29
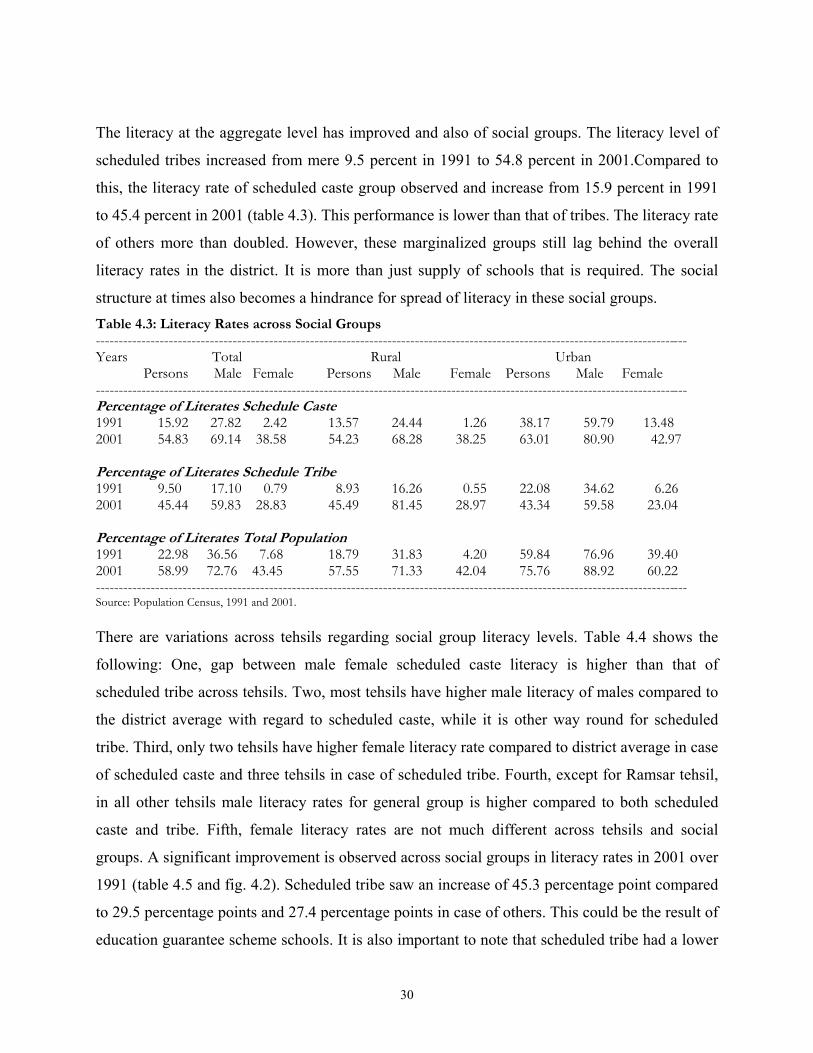
The literacy at the aggregate level has improved and also of social groups. The literacy level of
scheduled tribes increased from mere 9.5 percent in 1991 to 54.8 percent in 2001.Compared to
this, the literacy rate of scheduled caste group observed and increase from 15.9 percent in 1991
to 45.4 percent in 2001 (table 4.3). This performance is lower than that of tribes. The literacy rate
of others more than doubled. However, these marginalized groups still lag behind the overall
literacy rates in the district. It is more than just supply of schools that is required. The social
structure at times also becomes a hindrance for spread of literacy in these social groups. Table 4.3: Literacy Rates across Social Groups ---------------------------------------------------------------------------------------------------------------------------------- Years Total Rural Urban Persons Male Female Persons Male Female Persons Male Female ---------------------------------------------------------------------------------------------------------------------------------- Percentage of Literates Schedule Caste 1991 15.92 27.82 2.42 13.57 24.44 1.26 38.17 59.79 13.48 2001 54.83 69.14 38.58 54.23 68.28 38.25 63.01 80.90 42.97 Percentage of Literates Schedule Tribe 1991 9.50 17.10 0.79 8.93 16.26 0.55 22.08 34.62 6.26 2001 45.44 59.83 28.83 45.49 81.45 28.97 43.34 59.58 23.04 Percentage of Literates Total Population 1991 22.98 36.56 7.68 18.79 31.83 4.20 59.84 76.96 39.40 2001 58.99 72.76 43.45 57.55 71.33 42.04 75.76 88.92 60.22 ---------------------------------------------------------------------------------------------------------------------------------- Source: Population Census, 1991 and 2001. There are variations across tehsils regarding social group literacy levels. Table 4.4 shows the
following: One, gap between male female scheduled caste literacy is higher than that of
scheduled tribe across tehsils. Two, most tehsils have higher male literacy of males compared to
the district average with regard to scheduled caste, while it is other way round for scheduled
tribe. Third, only two tehsils have higher female literacy rate compared to district average in case
of scheduled caste and three tehsils in case of scheduled tribe. Fourth, except for Ramsar tehsil,
in all other tehsils male literacy rates for general group is higher compared to both scheduled
caste and tribe. Fifth, female literacy rates are not much different across tehsils and social
groups. A significant improvement is observed across social groups in literacy rates in 2001 over
1991 (table 4.5 and fig. 4.2). Scheduled tribe saw an increase of 45.3 percentage point compared
to 29.5 percentage points and 27.4 percentage points in case of others. This could be the result of
education guarantee scheme schools. It is also important to note that scheduled tribe had a lower
30
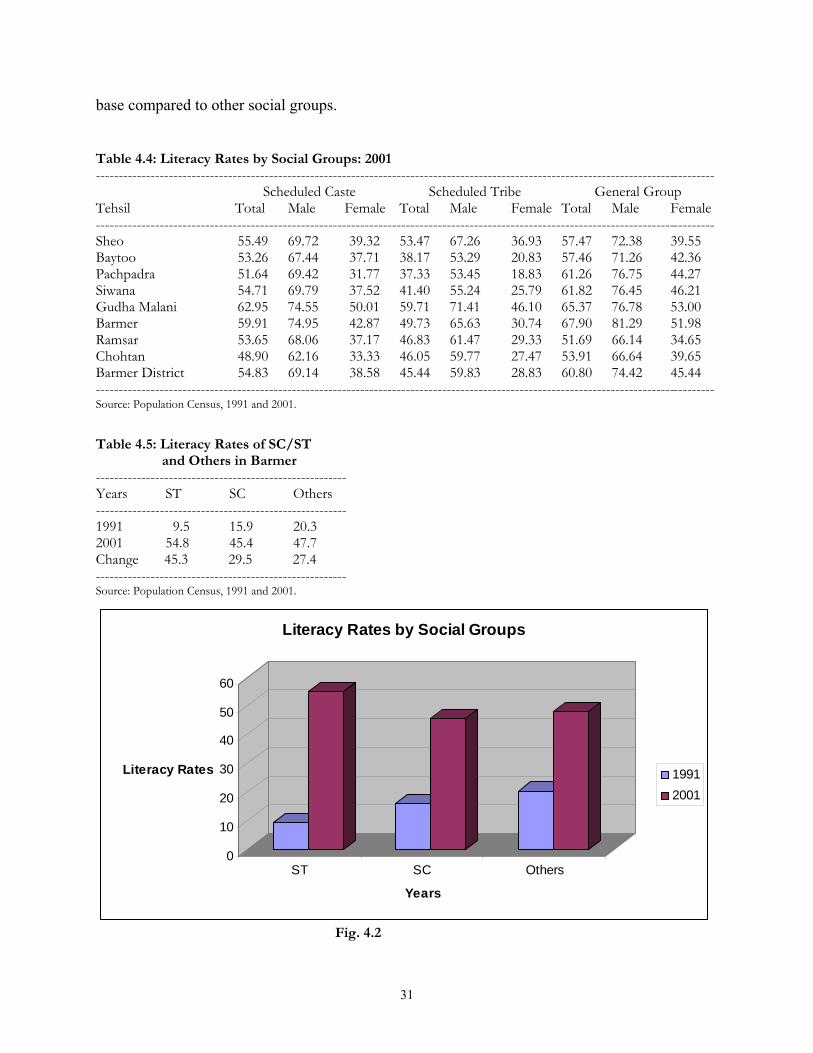
base compared to other social groups.
Table 4.4: Literacy Rates by Social Groups: 2001 ---------------------------------------------------------------------------------------------------------------------------------------- Scheduled Caste Scheduled Tribe General Group Tehsil Total Male Female Total Male Female Total Male Female ---------------------------------------------------------------------------------------------------------------------------------------- Sheo 55.49 69.72 39.32 53.47 67.26 36.93 57.47 72.38 39.55 Baytoo 53.26 67.44 37.71 38.17 53.29 20.83 57.46 71.26 42.36 Pachpadra 51.64 69.42 31.77 37.33 53.45 18.83 61.26 76.75 44.27 Siwana 54.71 69.79 37.52 41.40 55.24 25.79 61.82 76.45 46.21 Gudha Malani 62.95 74.55 50.01 59.71 71.41 46.10 65.37 76.78 53.00 Barmer 59.91 74.95 42.87 49.73 65.63 30.74 67.90 81.29 51.98 Ramsar 53.65 68.06 37.17 46.83 61.47 29.33 51.69 66.14 34.65 Chohtan 48.90 62.16 33.33 46.05 59.77 27.47 53.91 66.64 39.65 Barmer District 54.83 69.14 38.58 45.44 59.83 28.83 60.80 74.42 45.44 ---------------------------------------------------------------------------------------------------------------------------------------- Source: Population Census, 1991 and 2001.
Table 4.5: Literacy Rates of SC/ST and Others in Barmer ------------------------------------------------------- Years ST SC Others ------------------------------------------------------- 1991 9.5 15.9 20.3 2001 54.8 45.4 47.7 Change 45.3 29.5 27.4 ------------------------------------------------------- Source: Population Census, 1991 and 2001.
0
10
20
30
40
50
60
Literacy Rates
ST SC Others
Years
Literacy Rates by Social Groups
19912001
Fig. 4.2
31
4.2 School Infrastructure
In 2007-08 (as on September end 2007), there were 142 middle schools and 89 secondary
schools. In middle schools, there were 840 male teachers and 157 female teachers. At the
secondary level, there were 870 male teachers and 250 female teachers.
In 2007-08, there were 20190 boys in the age group 6-8 enrolled compared to 8280 girls giving a
gender parity of 0.41. In the age group 9-10 years, the boys enrolled were 20160 and 6597 girls
and a gender parity of 0.33. In the age group of 11-12, the enrollment of boys was 6552 and girls
2093 with gender parity of 0.32.
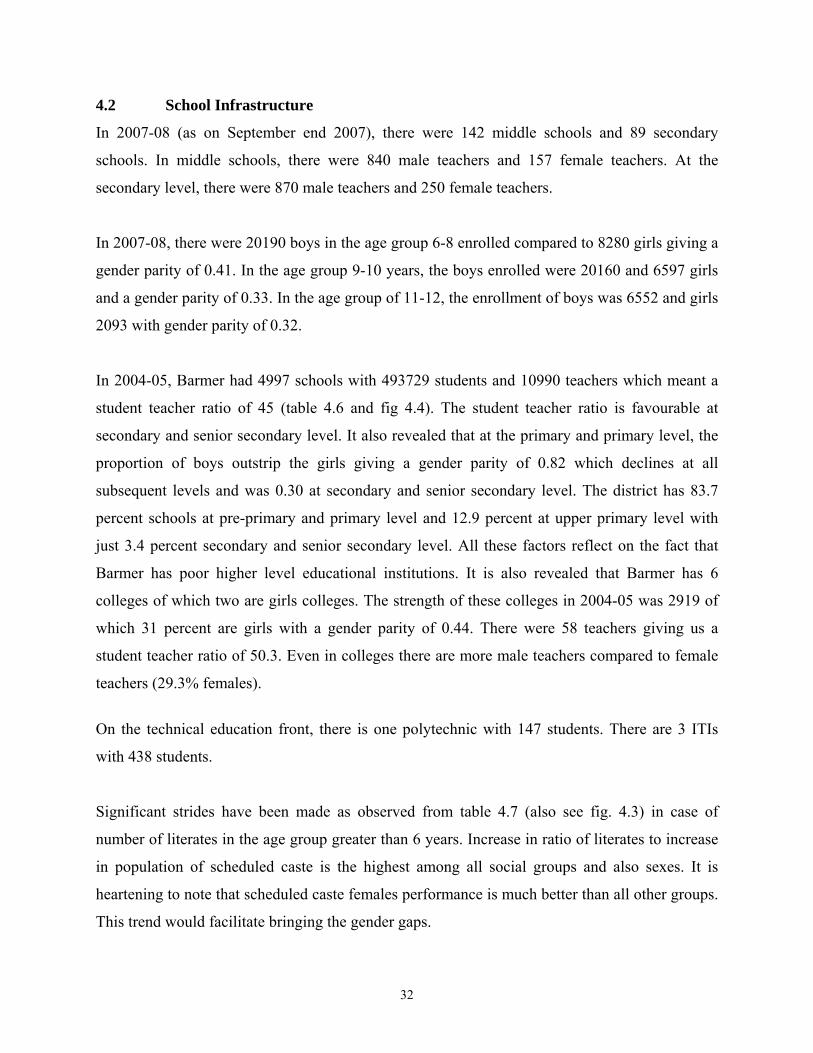
In 2004-05, Barmer had 4997 schools with 493729 students and 10990 teachers which meant a
student teacher ratio of 45 (table 4.6 and fig 4.4). The student teacher ratio is favourable at
secondary and senior secondary level. It also revealed that at the primary and primary level, the
proportion of boys outstrip the girls giving a gender parity of 0.82 which declines at all
subsequent levels and was 0.30 at secondary and senior secondary level. The district has 83.7
percent schools at pre-primary and primary level and 12.9 percent at upper primary level with
just 3.4 percent secondary and senior secondary level. All these factors reflect on the fact that
Barmer has poor higher level educational institutions. It is also revealed that Barmer has 6
colleges of which two are girls colleges. The strength of these colleges in 2004-05 was 2919 of
which 31 percent are girls with a gender parity of 0.44. There were 58 teachers giving us a
student teacher ratio of 50.3. Even in colleges there are more male teachers compared to female
teachers (29.3% females).
On the technical education front, there is one polytechnic with 147 students. There are 3 ITIs
with 438 students.
Significant strides have been made as observed from table 4.7 (also see fig. 4.3) in case of
number of literates in the age group greater than 6 years. Increase in ratio of literates to increase
in population of scheduled caste is the highest among all social groups and also sexes. It is
heartening to note that scheduled caste females performance is much better than all other groups.
This trend would facilitate bringing the gender gaps.
32
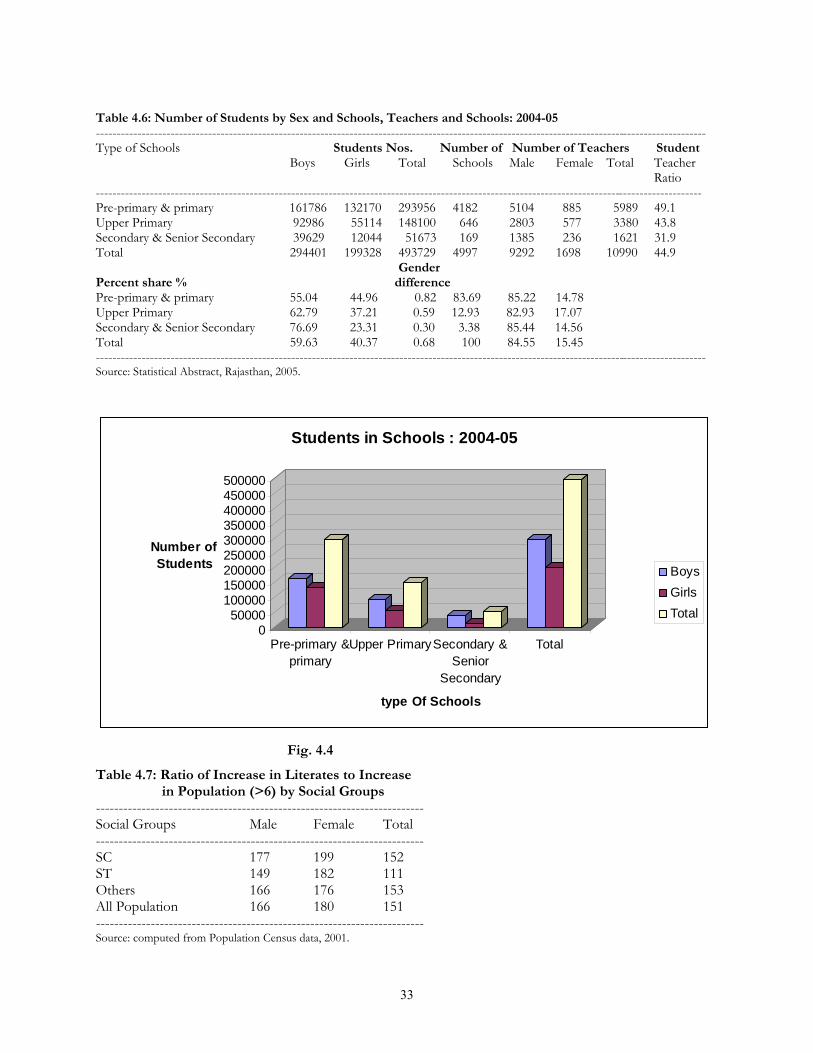
Table 4.6: Number of Students by Sex and Schools, Teachers and Schools: 2004-05 ---------------------------------------------------------------------------------------------------------------------------------------------------
Type of Schools Students Nos. Number of Number of Teachers Student Boys Girls Total Schools Male Female Total Teacher Ratio --------------------------------------------------------------------------------------------------------------------------------------------------
Pre-primary & primary 161786 132170 293956 4182 5104 885 5989 49.1 Upper Primary 92986 55114 148100 646 2803 577 3380 43.8 Secondary & Senior Secondary 39629 12044 51673 169 1385 236 1621 31.9 Total 294401 199328 493729 4997 9292 1698 10990 44.9 Gender Percent share % difference Pre-primary & primary 55.04 44.96 0.82 83.69 85.22 14.78 Upper Primary 62.79 37.21 0.59 12.93 82.93 17.07 Secondary & Senior Secondary 76.69 23.31 0.30 3.38 85.44 14.56 Total 59.63 40.37 0.68 100 84.55 15.45 --------------------------------------------------------------------------------------------------------------------------------------------------- Source: Statistical Abstract, Rajasthan, 2005.
050000
100000150000200000250000300000350000400000450000500000
Number of Students
Pre-primary &primary
Upper PrimarySecondary &Senior
Secondary
Total
type Of Schools
Students in Schools : 2004-05
BoysGirlsTotal
Fig. 4.4
Table 4.7: Ratio of Increase in Literates to Increase in Population (>6) by Social Groups ------------------------------------------------------------------------ Social Groups Male Female Total ------------------------------------------------------------------------ SC 177 199 152 ST 149 182 111 Others 166 176 153 All Population 166 180 151 ------------------------------------------------------------------------ Source: computed from Population Census data, 2001.
33
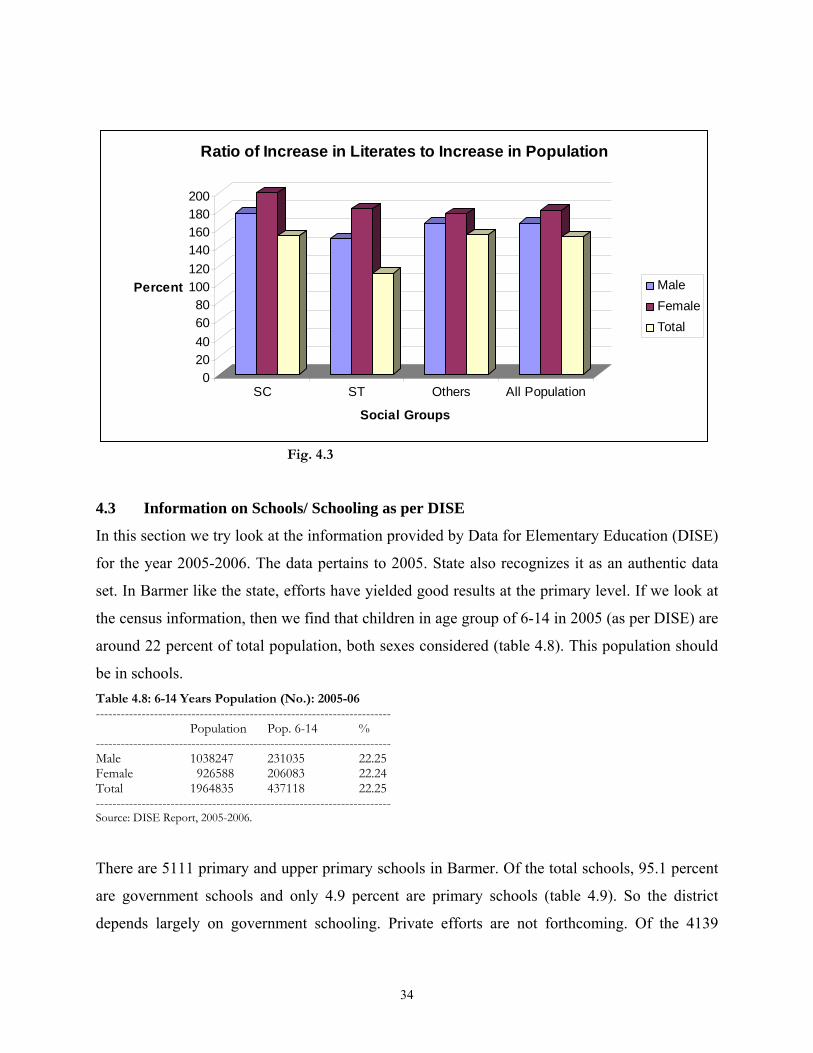
020406080
100120140160180200
Percent
SC ST Others All Population
Social Groups
Ratio of Increase in Literates to Increase in Population
MaleFemaleTotal
Fig. 4.3
4.3 Information on Schools/ Schooling as per DISE
In this section we try look at the information provided by Data for Elementary Education (DISE)
for the year 2005-2006. The data pertains to 2005. State also recognizes it as an authentic data
set. In Barmer like the state, efforts have yielded good results at the primary level. If we look at
the census information, then we find that children in age group of 6-14 in 2005 (as per DISE) are
around 22 percent of total population, both sexes considered (table 4.8). This population should
be in schools. Table 4.8: 6-14 Years Population (No.): 2005-06 ----------------------------------------------------------------------- Population Pop. 6-14 % ----------------------------------------------------------------------- Male 1038247 231035 22.25 Female 926588 206083 22.24 Total 1964835 437118 22.25 ----------------------------------------------------------------------- Source: DISE Report, 2005-2006.
There are 5111 primary and upper primary schools in Barmer. Of the total schools, 95.1 percent
are government schools and only 4.9 percent are primary schools (table 4.9). So the district
depends largely on government schooling. Private efforts are not forthcoming. Of the 4139
34
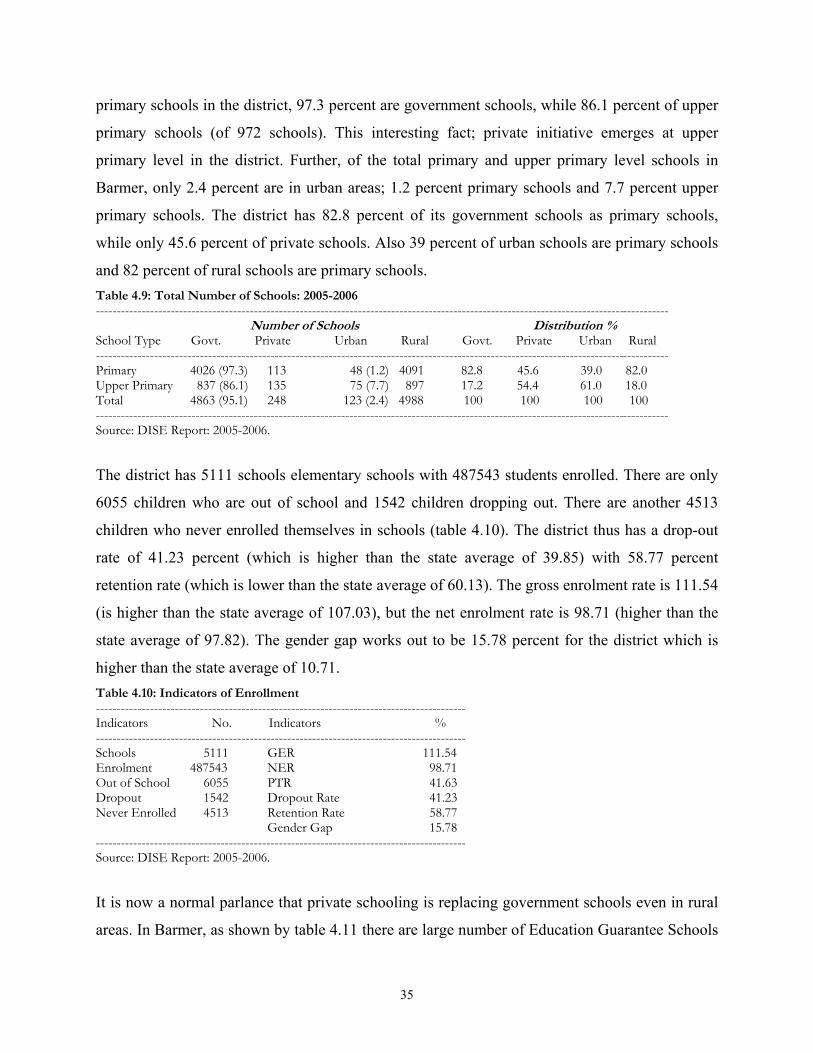
primary schools in the district, 97.3 percent are government schools, while 86.1 percent of upper
primary schools (of 972 schools). This interesting fact; private initiative emerges at upper
primary level in the district. Further, of the total primary and upper primary level schools in
Barmer, only 2.4 percent are in urban areas; 1.2 percent primary schools and 7.7 percent upper
primary schools. The district has 82.8 percent of its government schools as primary schools,
while only 45.6 percent of private schools. Also 39 percent of urban schools are primary schools
and 82 percent of rural schools are primary schools. Table 4.9: Total Number of Schools: 2005-2006 ------------------------------------------------------------------------------------------------------------------------------------------ Number of Schools Distribution % School Type Govt. Private Urban Rural Govt. Private Urban Rural ------------------------------------------------------------------------------------------------------------------------------------------ Primary 4026 (97.3) 113 48 (1.2) 4091 82.8 45.6 39.0 82.0 Upper Primary 837 (86.1) 135 75 (7.7) 897 17.2 54.4 61.0 18.0 Total 4863 (95.1) 248 123 (2.4) 4988 100 100 100 100 ------------------------------------------------------------------------------------------------------------------------------------------ Source: DISE Report: 2005-2006.
The district has 5111 schools elementary schools with 487543 students enrolled. There are only
6055 children who are out of school and 1542 children dropping out. There are another 4513
children who never enrolled themselves in schools (table 4.10). The district thus has a drop-out
rate of 41.23 percent (which is higher than the state average of 39.85) with 58.77 percent
retention rate (which is lower than the state average of 60.13). The gross enrolment rate is 111.54
(is higher than the state average of 107.03), but the net enrolment rate is 98.71 (higher than the
state average of 97.82). The gender gap works out to be 15.78 percent for the district which is
higher than the state average of 10.71. Table 4.10: Indicators of Enrollment ----------------------------------------------------------------------------------------- Indicators No. Indicators % ----------------------------------------------------------------------------------------- Schools 5111 GER 111.54 Enrolment 487543 NER 98.71 Out of School 6055 PTR 41.63 Dropout 1542 Dropout Rate 41.23 Never Enrolled 4513 Retention Rate 58.77 Gender Gap 15.78 ----------------------------------------------------------------------------------------- Source: DISE Report: 2005-2006.
It is now a normal parlance that private schooling is replacing government schools even in rural
areas. In Barmer, as shown by table 4.11 there are large number of Education Guarantee Schools
35
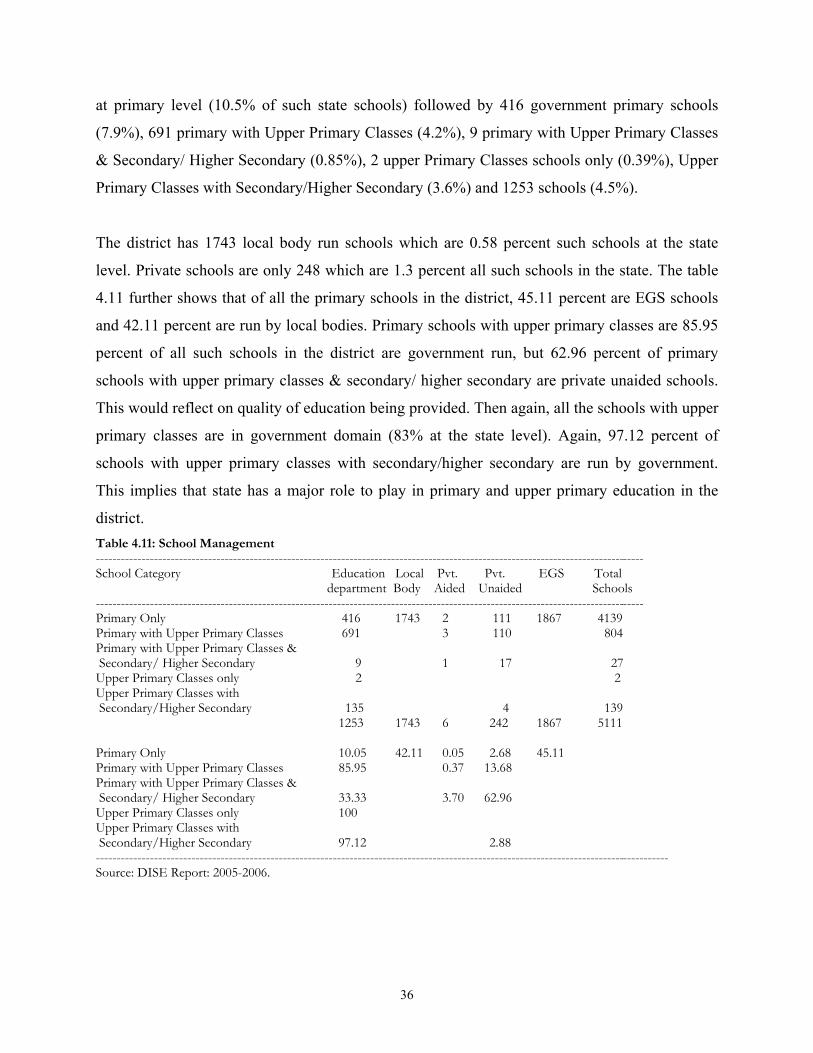
at primary level (10.5% of such state schools) followed by 416 government primary schools
(7.9%), 691 primary with Upper Primary Classes (4.2%), 9 primary with Upper Primary Classes
& Secondary/ Higher Secondary (0.85%), 2 upper Primary Classes schools only (0.39%), Upper
Primary Classes with Secondary/Higher Secondary (3.6%) and 1253 schools (4.5%).
The district has 1743 local body run schools which are 0.58 percent such schools at the state
level. Private schools are only 248 which are 1.3 percent all such schools in the state. The table
4.11 further shows that of all the primary schools in the district, 45.11 percent are EGS schools
and 42.11 percent are run by local bodies. Primary schools with upper primary classes are 85.95
percent of all such schools in the district are government run, but 62.96 percent of primary
schools with upper primary classes & secondary/ higher secondary are private unaided schools.
This would reflect on quality of education being provided. Then again, all the schools with upper
primary classes are in government domain (83% at the state level). Again, 97.12 percent of
schools with upper primary classes with secondary/higher secondary are run by government.
This implies that state has a major role to play in primary and upper primary education in the
district. Table 4.11: School Management ------------------------------------------------------------------------------------------------------------------------------------ School Category Education Local Pvt. Pvt. EGS Total department Body Aided Unaided Schools ------------------------------------------------------------------------------------------------------------------------------------ Primary Only 416 1743 2 111 1867 4139 Primary with Upper Primary Classes 691 3 110 804 Primary with Upper Primary Classes & Secondary/ Higher Secondary 9 1 17 27 Upper Primary Classes only 2 2 Upper Primary Classes with Secondary/Higher Secondary 135 4 139 1253 1743 6 242 1867 5111 Primary Only 10.05 42.11 0.05 2.68 45.11 Primary with Upper Primary Classes 85.95 0.37 13.68 Primary with Upper Primary Classes & Secondary/ Higher Secondary 33.33 3.70 62.96 Upper Primary Classes only 100 Upper Primary Classes with Secondary/Higher Secondary 97.12 2.88 ------------------------------------------------------------------------------------------------------------------------------------------ Source: DISE Report: 2005-2006.
36
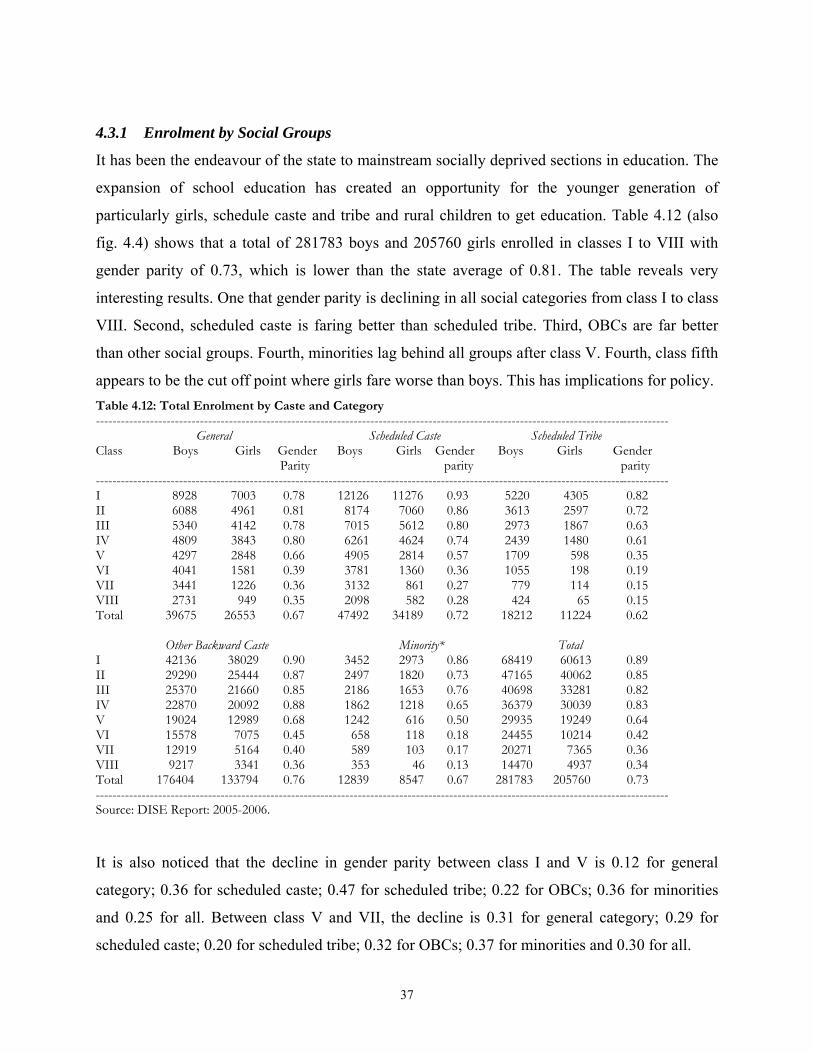
4.3.1 Enrolment by Social Groups
It has been the endeavour of the state to mainstream socially deprived sections in education. The
expansion of school education has created an opportunity for the younger generation of
particularly girls, schedule caste and tribe and rural children to get education. Table 4.12 (also
fig. 4.4) shows that a total of 281783 boys and 205760 girls enrolled in classes I to VIII with
gender parity of 0.73, which is lower than the state average of 0.81. The table reveals very
interesting results. One that gender parity is declining in all social categories from class I to class
VIII. Second, scheduled caste is faring better than scheduled tribe. Third, OBCs are far better
than other social groups. Fourth, minorities lag behind all groups after class V. Fourth, class fifth
appears to be the cut off point where girls fare worse than boys. This has implications for policy. Table 4.12: Total Enrolment by Caste and Category ------------------------------------------------------------------------------------------------------------------------------------------ General Scheduled Caste Scheduled Tribe Class Boys Girls Gender Boys Girls Gender Boys Girls Gender Parity parity parity ------------------------------------------------------------------------------------------------------------------------------------------ I 8928 7003 0.78 12126 11276 0.93 5220 4305 0.82 II 6088 4961 0.81 8174 7060 0.86 3613 2597 0.72 III 5340 4142 0.78 7015 5612 0.80 2973 1867 0.63 IV 4809 3843 0.80 6261 4624 0.74 2439 1480 0.61 V 4297 2848 0.66 4905 2814 0.57 1709 598 0.35 VI 4041 1581 0.39 3781 1360 0.36 1055 198 0.19 VII 3441 1226 0.36 3132 861 0.27 779 114 0.15 VIII 2731 949 0.35 2098 582 0.28 424 65 0.15 Total 39675 26553 0.67 47492 34189 0.72 18212 11224 0.62 Other Backward Caste Minority* Total I 42136 38029 0.90 3452 2973 0.86 68419 60613 0.89 II 29290 25444 0.87 2497 1820 0.73 47165 40062 0.85 III 25370 21660 0.85 2186 1653 0.76 40698 33281 0.82 IV 22870 20092 0.88 1862 1218 0.65 36379 30039 0.83 V 19024 12989 0.68 1242 616 0.50 29935 19249 0.64 VI 15578 7075 0.45 658 118 0.18 24455 10214 0.42 VII 12919 5164 0.40 589 103 0.17 20271 7365 0.36 VIII 9217 3341 0.36 353 46 0.13 14470 4937 0.34 Total 176404 133794 0.76 12839 8547 0.67 281783 205760 0.73 ------------------------------------------------------------------------------------------------------------------------------------------ Source: DISE Report: 2005-2006.
It is also noticed that the decline in gender parity between class I and V is 0.12 for general
category; 0.36 for scheduled caste; 0.47 for scheduled tribe; 0.22 for OBCs; 0.36 for minorities
and 0.25 for all. Between class V and VII, the decline is 0.31 for general category; 0.29 for
scheduled caste; 0.20 for scheduled tribe; 0.32 for OBCs; 0.37 for minorities and 0.30 for all.
37
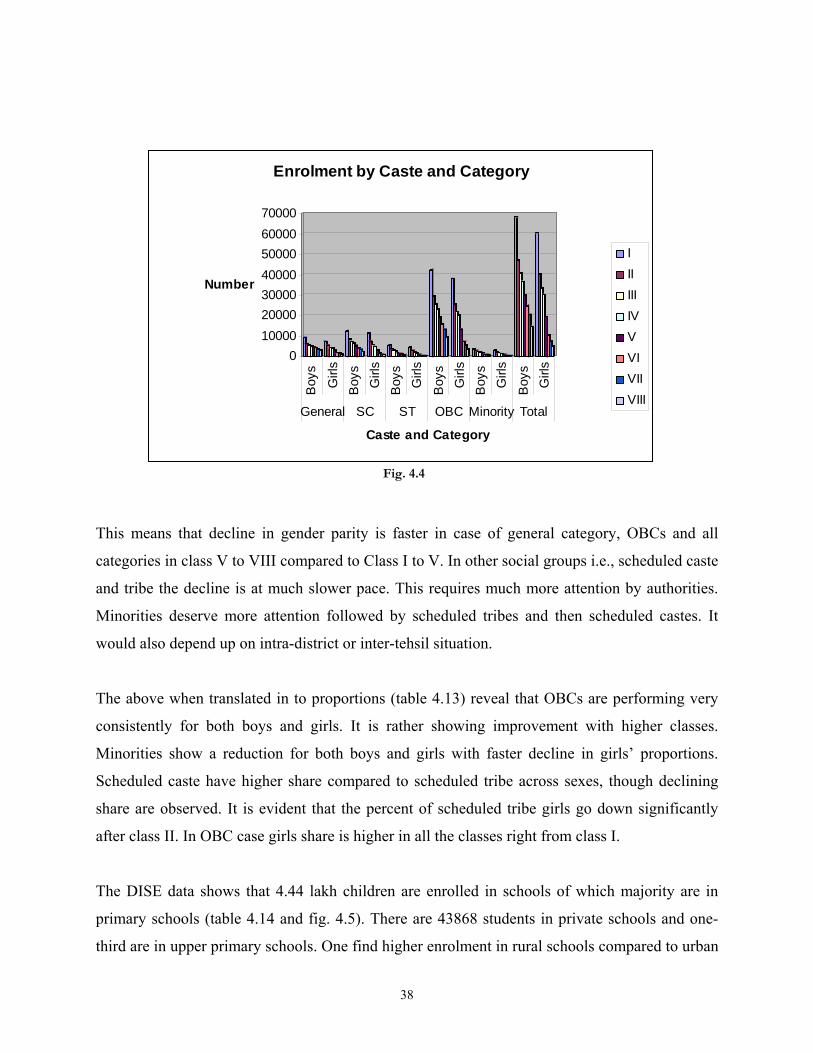
010000200003000040000500006000070000
Number
Boy
s
Girl
sB
oys
Girl
sB
oys
Girl
s
Boy
s G
irls
Boy
s G
irls
Boy
s G
irls
General SC ST OBC Minority Total
Caste and Category
Enrolment by Caste and Category
IIIIIIIVVVIVIIVIII
Fig. 4.4
This means that decline in gender parity is faster in case of general category, OBCs and all
categories in class V to VIII compared to Class I to V. In other social groups i.e., scheduled caste
and tribe the decline is at much slower pace. This requires much more attention by authorities.
Minorities deserve more attention followed by scheduled tribes and then scheduled castes. It
would also depend up on intra-district or inter-tehsil situation.
The above when translated in to proportions (table 4.13) reveal that OBCs are performing very
consistently for both boys and girls. It is rather showing improvement with higher classes.
Minorities show a reduction for both boys and girls with faster decline in girls’ proportions.
Scheduled caste have higher share compared to scheduled tribe across sexes, though declining
share are observed. It is evident that the percent of scheduled tribe girls go down significantly
after class II. In OBC case girls share is higher in all the classes right from class I.
The DISE data shows that 4.44 lakh children are enrolled in schools of which majority are in
primary schools (table 4.14 and fig. 4.5). There are 43868 students in private schools and one-
third are in upper primary schools. One find higher enrolment in rural schools compared to urban
38
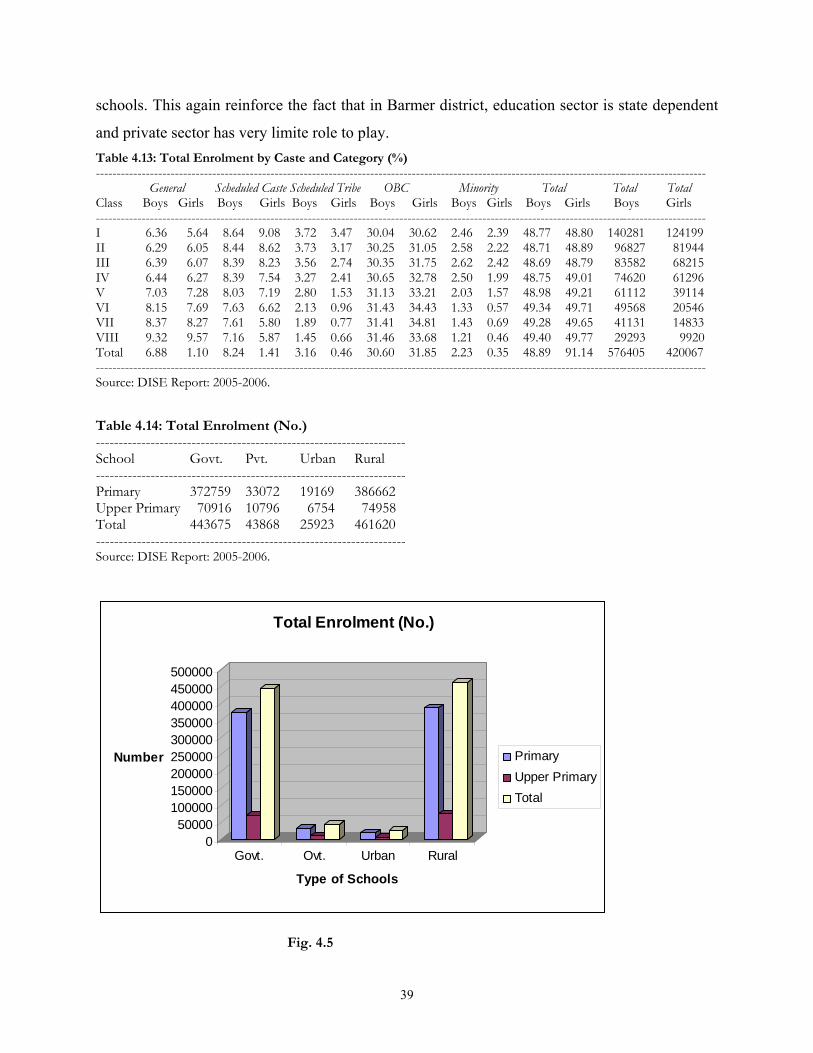
schools. This again reinforce the fact that in Barmer district, education sector is state dependent
and private sector has very limite role to play. Table 4.13: Total Enrolment by Caste and Category (%) --------------------------------------------------------------------------------------------------------------------------------------------------- General Scheduled Caste Scheduled Tribe OBC Minority Total Total Total Class Boys Girls Boys Girls Boys Girls Boys Girls Boys Girls Boys Girls Boys Girls --------------------------------------------------------------------------------------------------------------------------------------------------- I 6.36 5.64 8.64 9.08 3.72 3.47 30.04 30.62 2.46 2.39 48.77 48.80 140281 124199 II 6.29 6.05 8.44 8.62 3.73 3.17 30.25 31.05 2.58 2.22 48.71 48.89 96827 81944 III 6.39 6.07 8.39 8.23 3.56 2.74 30.35 31.75 2.62 2.42 48.69 48.79 83582 68215 IV 6.44 6.27 8.39 7.54 3.27 2.41 30.65 32.78 2.50 1.99 48.75 49.01 74620 61296 V 7.03 7.28 8.03 7.19 2.80 1.53 31.13 33.21 2.03 1.57 48.98 49.21 61112 39114 VI 8.15 7.69 7.63 6.62 2.13 0.96 31.43 34.43 1.33 0.57 49.34 49.71 49568 20546 VII 8.37 8.27 7.61 5.80 1.89 0.77 31.41 34.81 1.43 0.69 49.28 49.65 41131 14833 VIII 9.32 9.57 7.16 5.87 1.45 0.66 31.46 33.68 1.21 0.46 49.40 49.77 29293 9920 Total 6.88 1.10 8.24 1.41 3.16 0.46 30.60 31.85 2.23 0.35 48.89 91.14 576405 420067 --------------------------------------------------------------------------------------------------------------------------------------------------- Source: DISE Report: 2005-2006. Table 4.14: Total Enrolment (No.) -------------------------------------------------------------------- School Govt. Pvt. Urban Rural -------------------------------------------------------------------- Primary 372759 33072 19169 386662 Upper Primary 70916 10796 6754 74958 Total 443675 43868 25923 461620 -------------------------------------------------------------------- Source: DISE Report: 2005-2006.
050000
100000150000200000250000300000350000400000450000500000
Number
Govt. Ovt. Urban Rural
Type of Schools
Total Enrolment (No.)
PrimaryUpper PrimaryTotal
Fig. 4.5
39
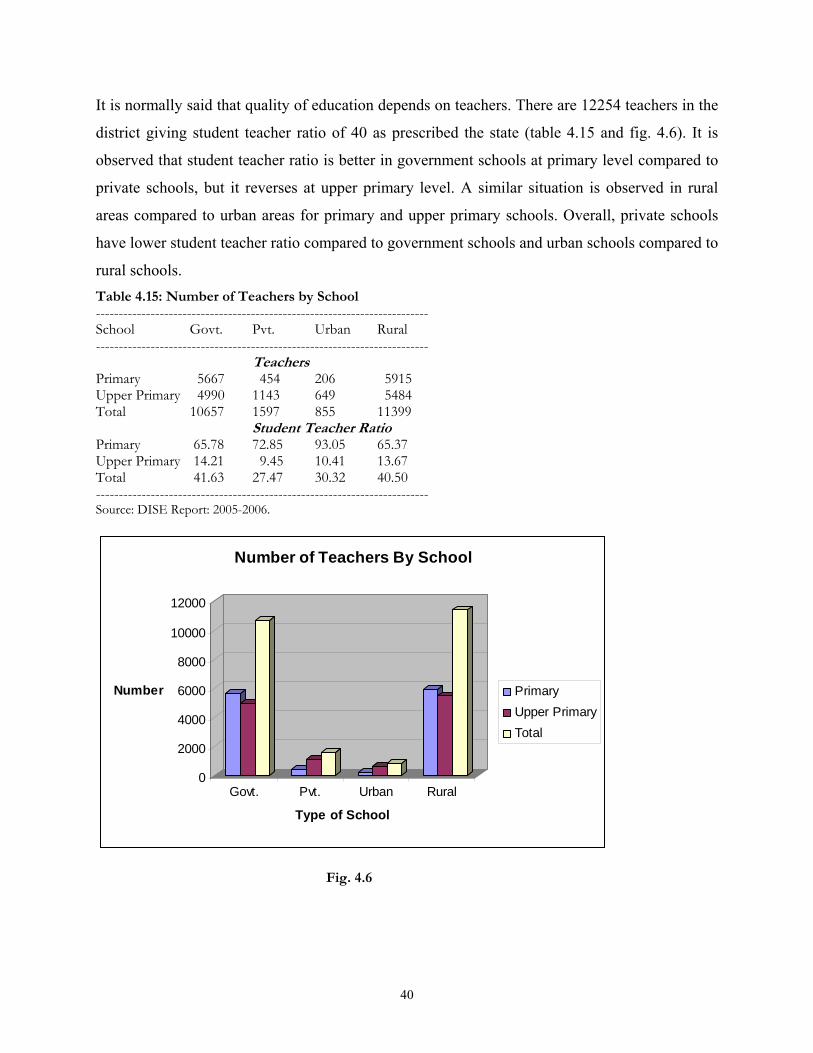
It is normally said that quality of education depends on teachers. There are 12254 teachers in the
district giving student teacher ratio of 40 as prescribed the state (table 4.15 and fig. 4.6). It is
observed that student teacher ratio is better in government schools at primary level compared to
private schools, but it reverses at upper primary level. A similar situation is observed in rural
areas compared to urban areas for primary and upper primary schools. Overall, private schools
have lower student teacher ratio compared to government schools and urban schools compared to
rural schools. Table 4.15: Number of Teachers by School ------------------------------------------------------------------------- School Govt. Pvt. Urban Rural ------------------------------------------------------------------------- Teachers
Primary 5667 454 206 5915 Upper Primary 4990 1143 649 5484 Total 10657 1597 855 11399 Student Teacher Ratio
Primary 65.78 72.85 93.05 65.37 Upper Primary 14.21 9.45 10.41 13.67 Total 41.63 27.47 30.32 40.50 ------------------------------------------------------------------------- Source: DISE Report: 2005-2006.
0
2000
4000
6000
8000
10000
12000
Number
Govt. Pvt. Urban Rural
Type of School
Number of Teachers By School
PrimaryUpper PrimaryTotal
Fig. 4.6
40
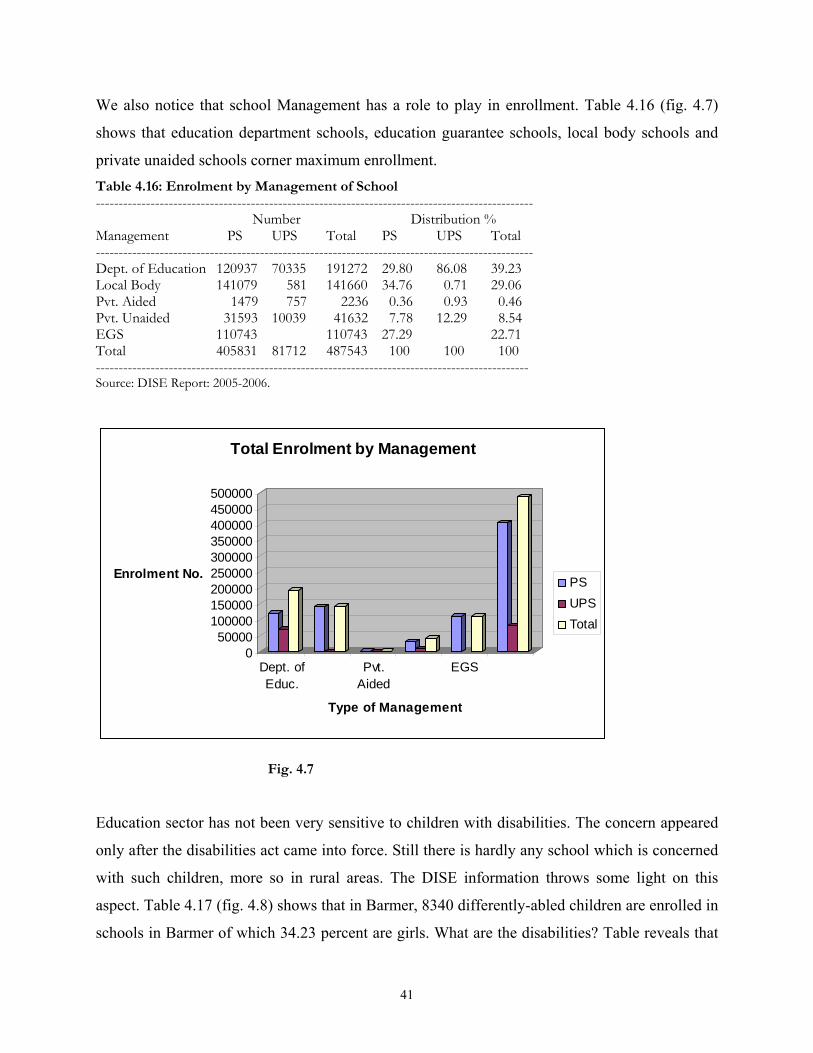
We also notice that school Management has a role to play in enrollment. Table 4.16 (fig. 4.7)
shows that education department schools, education guarantee schools, local body schools and
private unaided schools corner maximum enrollment. Table 4.16: Enrolment by Management of School ------------------------------------------------------------------------------------------------ Number Distribution %
Management PS UPS Total PS UPS Total ------------------------------------------------------------------------------------------------ Dept. of Education 120937 70335 191272 29.80 86.08 39.23 Local Body 141079 581 141660 34.76 0.71 29.06 Pvt. Aided 1479 757 2236 0.36 0.93 0.46 Pvt. Unaided 31593 10039 41632 7.78 12.29 8.54 EGS 110743 110743 27.29 22.71 Total 405831 81712 487543 100 100 100 ----------------------------------------------------------------------------------------------- Source: DISE Report: 2005-2006.
050000
100000150000200000250000300000350000400000450000500000
Enrolment No.
Dept. ofEduc.
Pvt.Aided
EGS
Type of Management
Total Enrolment by Management
PSUPSTotal
Fig. 4.7
Education sector has not been very sensitive to children with disabilities. The concern appeared
only after the disabilities act came into force. Still there is hardly any school which is concerned
with such children, more so in rural areas. The DISE information throws some light on this
aspect. Table 4.17 (fig. 4.8) shows that in Barmer, 8340 differently-abled children are enrolled in
schools in Barmer of which 34.23 percent are girls. What are the disabilities? Table reveals that
41
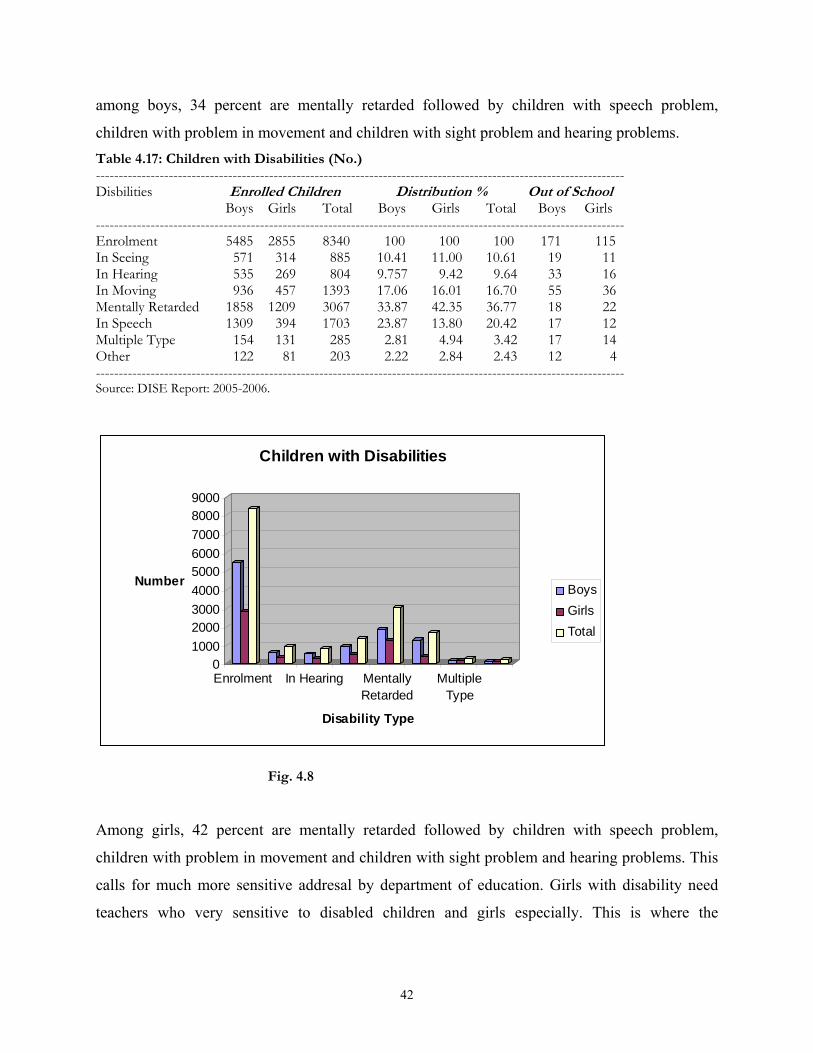
among boys, 34 percent are mentally retarded followed by children with speech problem,
children with problem in movement and children with sight problem and hearing problems. Table 4.17: Children with Disabilities (No.) -------------------------------------------------------------------------------------------------------------------- Disbilities Enrolled Children Distribution % Out of School Boys Girls Total Boys Girls Total Boys Girls
-------------------------------------------------------------------------------------------------------------------- Enrolment 5485 2855 8340 100 100 100 171 115 In Seeing 571 314 885 10.41 11.00 10.61 19 11 In Hearing 535 269 804 9.757 9.42 9.64 33 16 In Moving 936 457 1393 17.06 16.01 16.70 55 36 Mentally Retarded 1858 1209 3067 33.87 42.35 36.77 18 22 In Speech 1309 394 1703 23.87 13.80 20.42 17 12 Multiple Type 154 131 285 2.81 4.94 3.42 17 14 Other 122 81 203 2.22 2.84 2.43 12 4 -------------------------------------------------------------------------------------------------------------------- Source: DISE Report: 2005-2006.
0100020003000400050006000700080009000
Number
Enrolment In Hearing MentallyRetarded
MultipleType
Disability Type
Children with Disabilities
BoysGirlsTotal
Fig. 4.8
Among girls, 42 percent are mentally retarded followed by children with speech problem,
children with problem in movement and children with sight problem and hearing problems. This
calls for much more sensitive addresal by department of education. Girls with disability need
teachers who very sensitive to disabled children and girls especially. This is where the
42
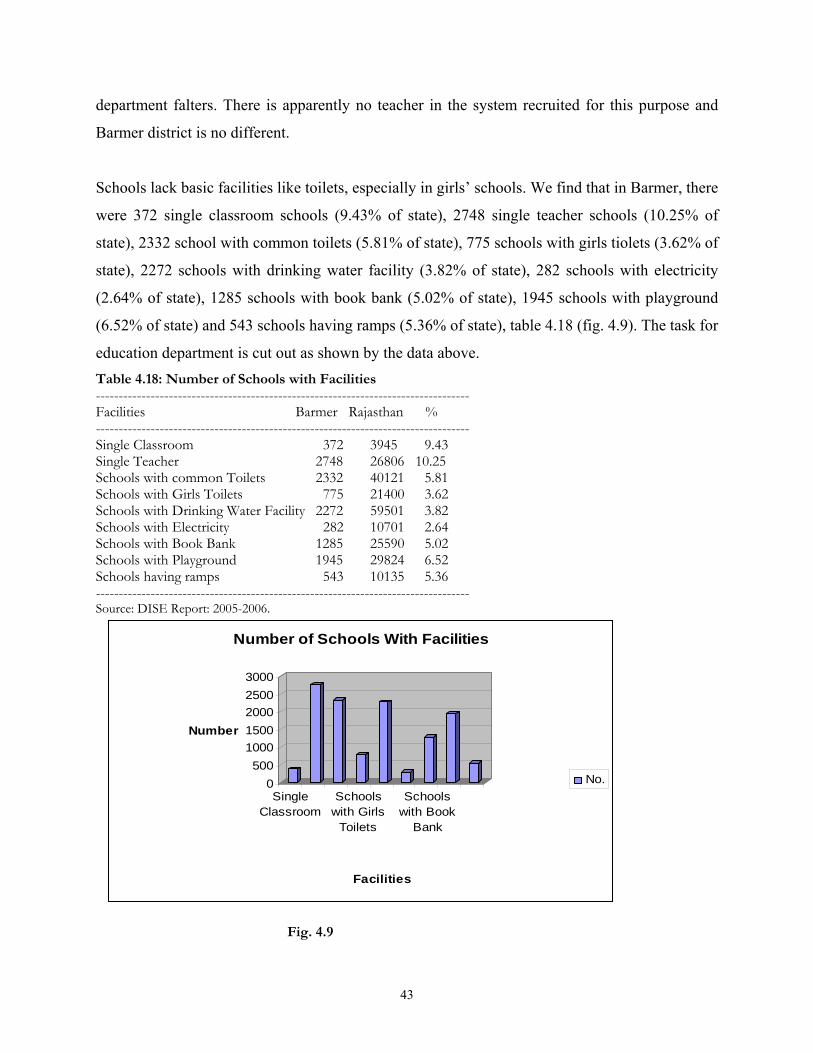
department falters. There is apparently no teacher in the system recruited for this purpose and
Barmer district is no different.
Schools lack basic facilities like toilets, especially in girls’ schools. We find that in Barmer, there
were 372 single classroom schools (9.43% of state), 2748 single teacher schools (10.25% of
state), 2332 school with common toilets (5.81% of state), 775 schools with girls tiolets (3.62% of
state), 2272 schools with drinking water facility (3.82% of state), 282 schools with electricity
(2.64% of state), 1285 schools with book bank (5.02% of state), 1945 schools with playground
(6.52% of state) and 543 schools having ramps (5.36% of state), table 4.18 (fig. 4.9). The task for
education department is cut out as shown by the data above. Table 4.18: Number of Schools with Facilities ---------------------------------------------------------------------------------- Facilities Barmer Rajasthan % ---------------------------------------------------------------------------------- Single Classroom 372 3945 9.43 Single Teacher 2748 26806 10.25 Schools with common Toilets 2332 40121 5.81 Schools with Girls Toilets 775 21400 3.62 Schools with Drinking Water Facility 2272 59501 3.82 Schools with Electricity 282 10701 2.64 Schools with Book Bank 1285 25590 5.02 Schools with Playground 1945 29824 6.52 Schools having ramps 543 10135 5.36 ---------------------------------------------------------------------------------- Source: DISE Report: 2005-2006.
0500
10001500200025003000
Number
SingleClassroom
Schoolswith Girls
Toilets
Schoolswith Book
Bank
Facilities
Number of Schools With Facilities
No.
Fig. 4.9
43
Chapter 5
Health and Nutrition
Given the discussion in earlier chapters, the status of human development indices is present in
table 5.1. The human development Update of Rajasthan places Barmer 25th among 32 districts
when arranged in decending order of the composite index of human development. The district
observes a value of 0.509 of the human development index as against the highest value of 0.763
and the lowest value of 0.357 in Dungarpur. In terms of individual components, the district ranks
15th, 16th and 28th for education, health and income development indices respectively.
5.1 Health Sector
Barmer is served by health infrastructure due to its location and cost of delivering such facilities.
In 2004-05, there were 3 hospitals, 3 dispensaries, 3 mother and child welfare centres, 66 rural
primary health centres and 443 sub centres (table 5.2). This means 518 health facilities of all
types. These facilities, served 27161 indoor patients in 2005 and 543158 outdoor patients.
Besides, these facilities, the district had one ayurvedic hospital, 94 dispensaries, and one mobile
medical unit. As regards the beds, there were 260 beds in hospitals, 24 beds in mother and child
welfare centres and 632 beds in PHCs implying 916 beds serving a population of 1964835 or
Table 5.3 (fig 5.1) shows that Balotra catered to most in-patients and Sheo the least as there is a
hospital in Balotra. Out-patients vary between 13129 in Sheo and 53177 in Balotra. In all there
were 18753 in-patients and 240072 out-patients.
Immunization is another important factor that helps in having healthy citizens. In Barmer,
significant progress has been made under various immunization programmes as shown in table
5.4 (fig 5.2).
44
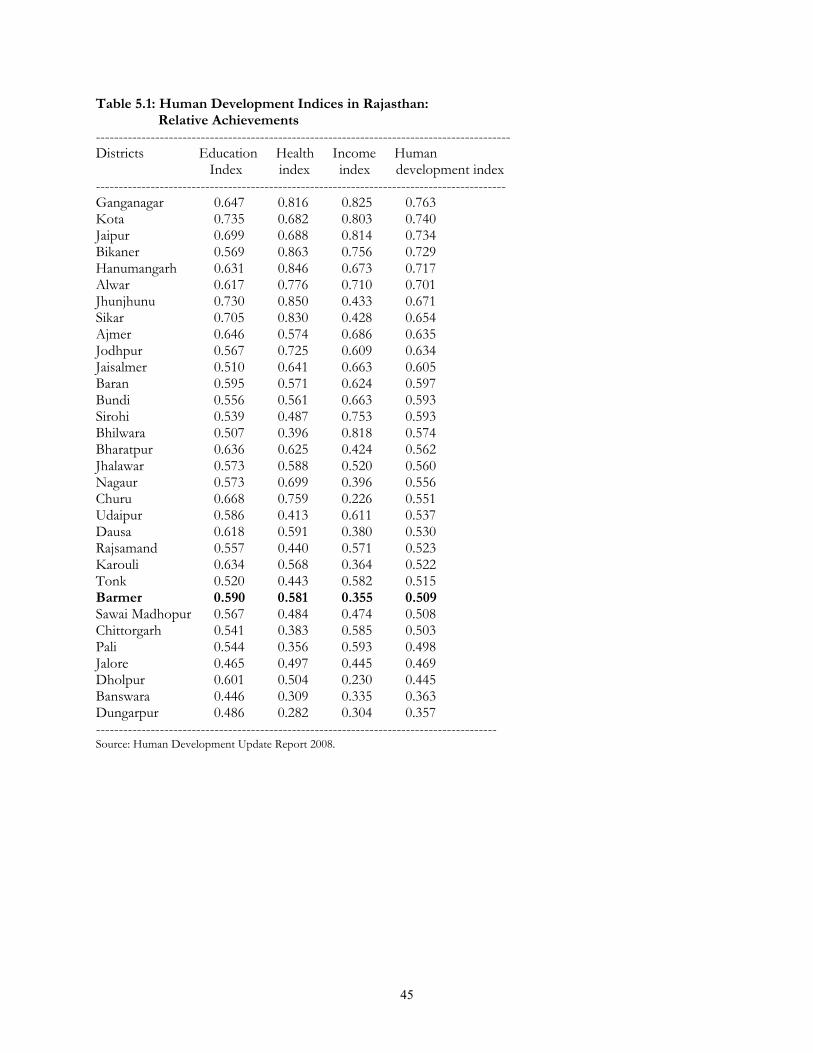
Table 5.1: Human Development Indices in Rajasthan: Relative Achievements ------------------------------------------------------------------------------------------- Districts Education Health Income Human Index index index development index ------------------------------------------------------------------------------------------ Ganganagar 0.647 0.816 0.825 0.763 Kota 0.735 0.682 0.803 0.740 Jaipur 0.699 0.688 0.814 0.734 Bikaner 0.569 0.863 0.756 0.729 Hanumangarh 0.631 0.846 0.673 0.717 Alwar 0.617 0.776 0.710 0.701 Jhunjhunu 0.730 0.850 0.433 0.671 Sikar 0.705 0.830 0.428 0.654 Ajmer 0.646 0.574 0.686 0.635 Jodhpur 0.567 0.725 0.609 0.634 Jaisalmer 0.510 0.641 0.663 0.605 Baran 0.595 0.571 0.624 0.597 Bundi 0.556 0.561 0.663 0.593 Sirohi 0.539 0.487 0.753 0.593 Bhilwara 0.507 0.396 0.818 0.574 Bharatpur 0.636 0.625 0.424 0.562 Jhalawar 0.573 0.588 0.520 0.560 Nagaur 0.573 0.699 0.396 0.556 Churu 0.668 0.759 0.226 0.551 Udaipur 0.586 0.413 0.611 0.537 Dausa 0.618 0.591 0.380 0.530 Rajsamand 0.557 0.440 0.571 0.523 Karouli 0.634 0.568 0.364 0.522 Tonk 0.520 0.443 0.582 0.515 Barmer 0.590 0.581 0.355 0.509 Sawai Madhopur 0.567 0.484 0.474 0.508 Chittorgarh 0.541 0.383 0.585 0.503 Pali 0.544 0.356 0.593 0.498 Jalore 0.465 0.497 0.445 0.469 Dholpur 0.601 0.504 0.230 0.445 Banswara 0.446 0.309 0.335 0.363 Dungarpur 0.486 0.282 0.304 0.357 ---------------------------------------------------------------------------------------- Source: Human Development Update Report 2008.
45
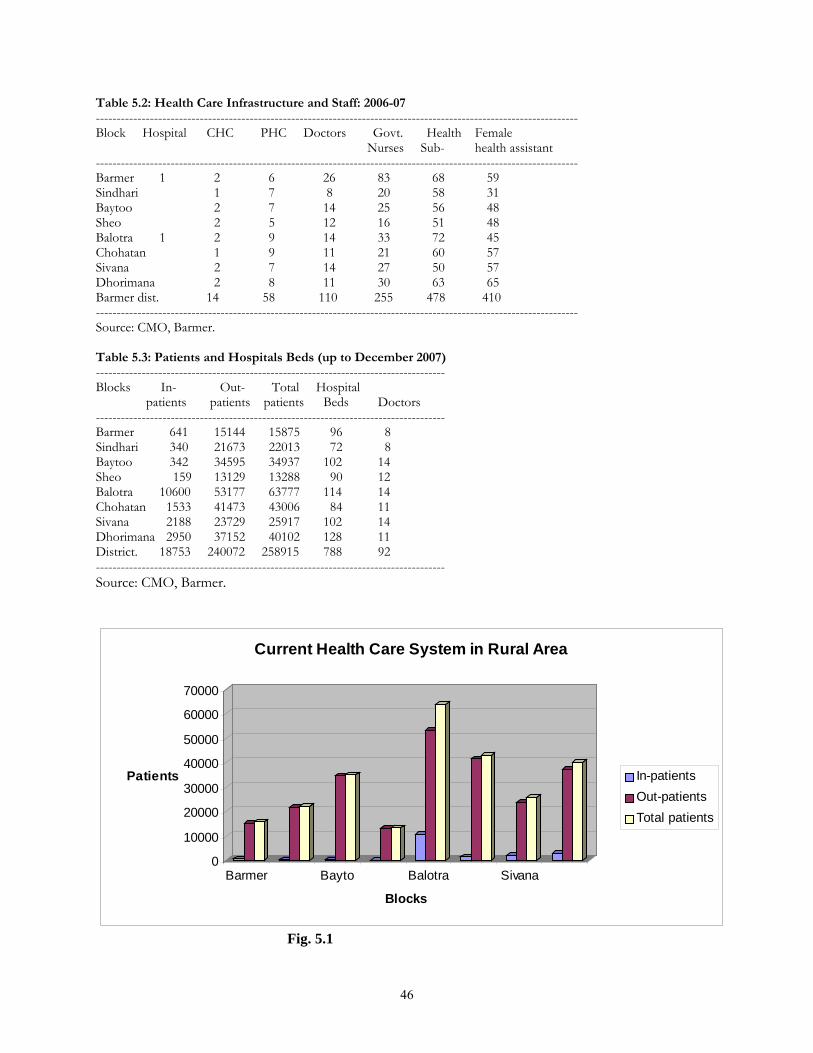
Table 5.2: Health Care Infrastructure and Staff: 2006-07 -------------------------------------------------------------------------------------------------------------------- Block Hospital CHC PHC Doctors Govt. Health Female Nurses Sub- health assistant -------------------------------------------------------------------------------------------------------------------- Barmer 1 2 6 26 83 68 59 Sindhari 1 7 8 20 58 31 Baytoo 2 7 14 25 56 48 Sheo 2 5 12 16 51 48 Balotra 1 2 9 14 33 72 45 Chohatan 1 9 11 21 60 57 Sivana 2 7 14 27 50 57 Dhorimana 2 8 11 30 63 65 Barmer dist. 14 58 110 255 478 410 -------------------------------------------------------------------------------------------------------------------- Source: CMO, Barmer. Table 5.3: Patients and Hospitals Beds (up to December 2007) ------------------------------------------------------------------------------------ Blocks In- Out- Total Hospital patients patients patients Beds Doctors ------------------------------------------------------------------------------------ Barmer 641 15144 15875 96 8 Sindhari 340 21673 22013 72 8 Baytoo 342 34595 34937 102 14 Sheo 159 13129 13288 90 12 Balotra 10600 53177 63777 114 14 Chohatan 1533 41473 43006 84 11 Sivana 2188 23729 25917 102 14 Dhorimana 2950 37152 40102 128 11 District. 18753 240072 258915 788 92 ------------------------------------------------------------------------------------ Source: CMO, Barmer.
0
10000
20000
30000
40000
50000
60000
70000
Patients
Barmer Bayto Balotra Sivana
Blocks
Current Health Care System in Rural Area
In-patientsOut-patientsTotal patients
Fig. 5.1
46
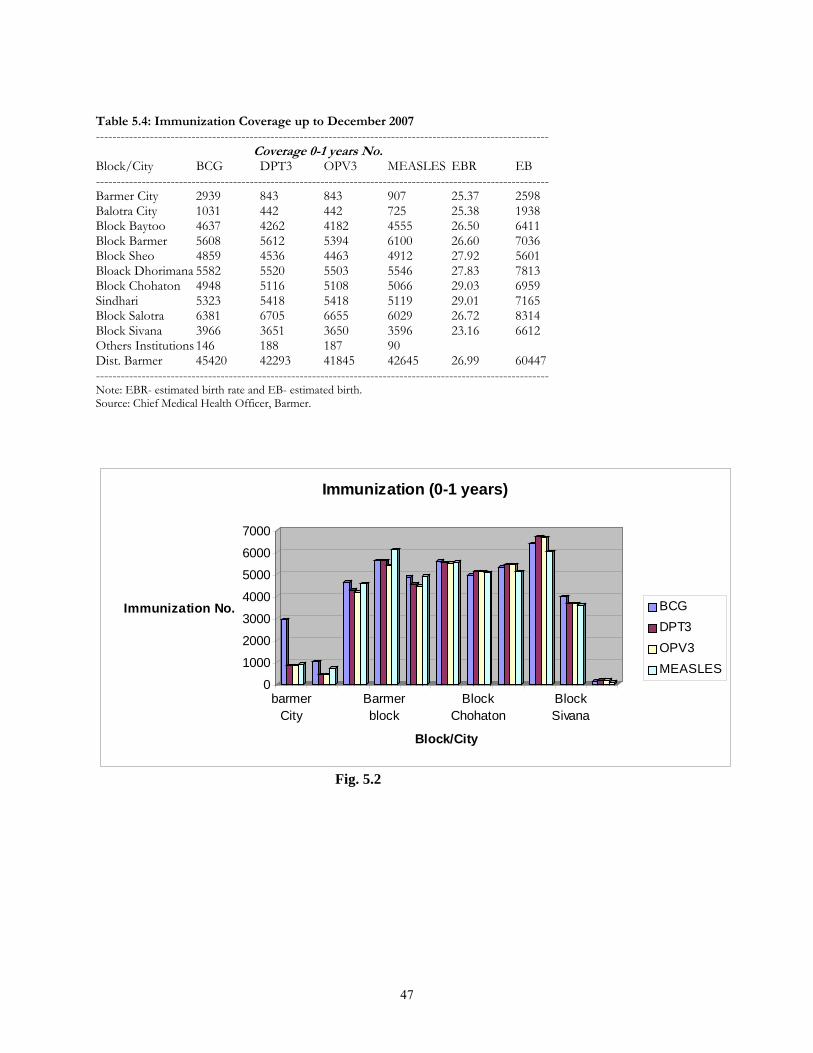
Table 5.4: Immunization Coverage up to December 2007 ------------------------------------------------------------------------------------------------------------- Coverage 0-1 years No. Block/City BCG DPT3 OPV3 MEASLES EBR EB ------------------------------------------------------------------------------------------------------------- Barmer City 2939 843 843 907 25.37 2598 Balotra City 1031 442 442 725 25.38 1938 Block Baytoo 4637 4262 4182 4555 26.50 6411 Block Barmer 5608 5612 5394 6100 26.60 7036 Block Sheo 4859 4536 4463 4912 27.92 5601 Bloack Dhorimana 5582 5520 5503 5546 27.83 7813 Block Chohaton 4948 5116 5108 5066 29.03 6959 Sindhari 5323 5418 5418 5119 29.01 7165 Block Salotra 6381 6705 6655 6029 26.72 8314 Block Sivana 3966 3651 3650 3596 23.16 6612 Others Institutions 146 188 187 90 Dist. Barmer 45420 42293 41845 42645 26.99 60447 ------------------------------------------------------------------------------------------------------------- Note: EBR- estimated birth rate and EB- estimated birth. Source: Chief Medical Health Officer, Barmer.
0
1000
2000
3000
4000
5000
6000
7000
Immunization No.
barmerCity
Barmerblock
BlockChohaton
BlockSivana
Block/City
Immunization (0-1 years)
BCGDPT3OPV3MEASLES
Fig. 5.2
47
Corporate Initiative in Barmer: Cairns Efforts
Child and Maternal Health Awareness
Center for Development and Population Activities (CEDPA), an international NGO that has worked on women and youth empowerment and health issues for over 30 years worldwide, CEDPA will work with local NGOs to deliver the project’s objectives, addressing the programme’s sustainability. The aim is to:
Increase community awareness about the prevention of STIs/HIV/AIDS
Empower adolescent boys and girls with life-skills education
Enhance capacity of community-level health workers and health providers at sub-centers and primary and community health centers to provide better services
Build the capacity of Panchayats to advocate, supervise, and monitor community development initiatives to sustain activities beyond the duration of the project
Improve knowledge of risk status and promote positive behaviors to help prevent HIV/AIDS transmission among migrant laborers and workers in the trucking industry, including mechanics
5.2 The Integrated Child Development Scheme (ICDS)
ICDS is an important state sponsored programme meant for strengthening nutrition among 0-6
years age group children and pregnant women/lactating mothers. It is a major effort to not only
strengthen childhood it is also an important anti-poverty programme. Central to this programme are
anganwaris, nutrition supplements and the anganwari worker.
Table 5.5 presents data on a panchayat-specific distribution of anganwaris as on March 2008. This table
suggests that there are 2093 anganwaris and all but one are operational. Further, the number of
CDPO/ACDPO sanctioned in the district were 19 as on March 2008 and 7 were in position. As
regards the number of supervisors, the sanctioned number stood at 98 while 36 were in position.
Thus staffs are not in position to deliver these services.
Table 5.6 presents data on the nutritional status of children reporting to the ICDS centres in 2008.
To begin with, it must be stated that nutrition provided at ICDS centres is usually availed by
48
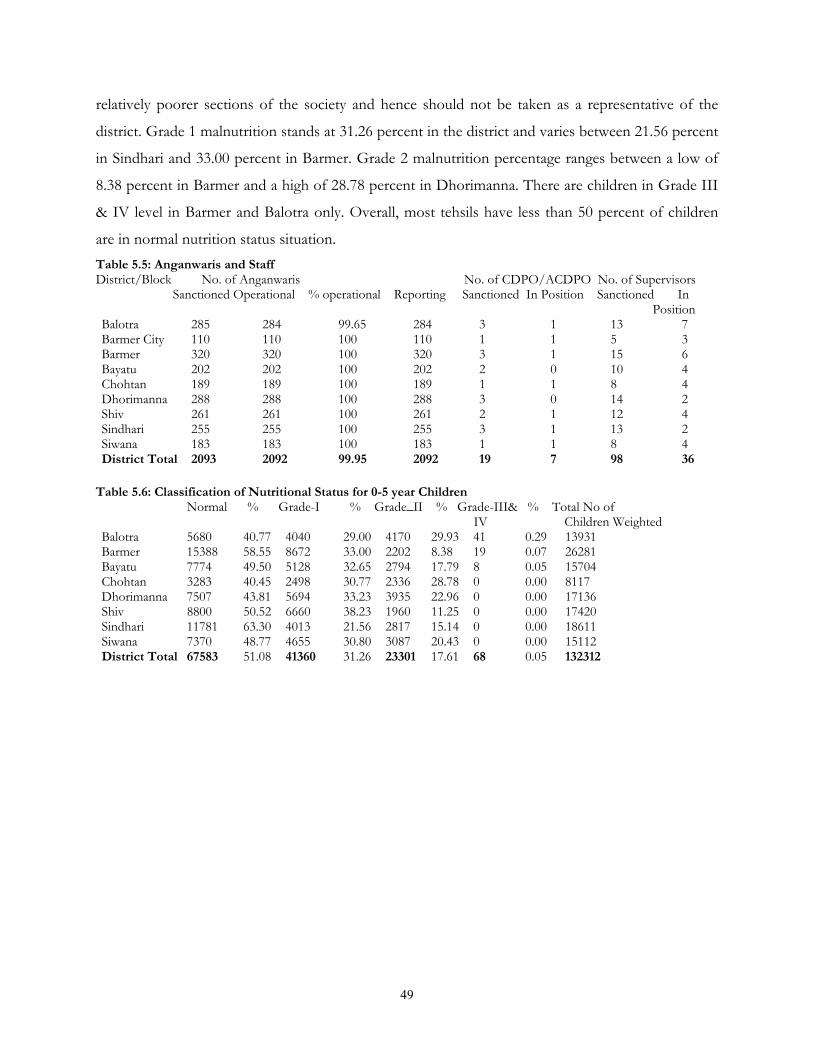
relatively poorer sections of the society and hence should not be taken as a representative of the
district. Grade 1 malnutrition stands at 31.26 percent in the district and varies between 21.56 percent
in Sindhari and 33.00 percent in Barmer. Grade 2 malnutrition percentage ranges between a low of
8.38 percent in Barmer and a high of 28.78 percent in Dhorimanna. There are children in Grade III
& IV level in Barmer and Balotra only. Overall, most tehsils have less than 50 percent of children
are in normal nutrition status situation. Table 5.5: Anganwaris and Staff District/Block No. of Anganwaris No. of CDPO/ACDPO No. of Supervisors Sanctioned Operational % operational Reporting Sanctioned In Position Sanctioned In Position Balotra 285 284 99.65 284 3 1 13 7 Barmer City 110 110 100 110 1 1 5 3 Barmer 320 320 100 320 3 1 15 6 Bayatu 202 202 100 202 2 0 10 4 Chohtan 189 189 100 189 1 1 8 4 Dhorimanna 288 288 100 288 3 0 14 2 Shiv 261 261 100 261 2 1 12 4 Sindhari 255 255 100 255 3 1 13 2 Siwana 183 183 100 183 1 1 8 4 District Total 2093 2092 99.95 2092 19 7 98 36
Table 5.6: Classification of Nutritional Status for 0-5 year Children Normal % Grade-I % Grade_II % Grade-III& % Total No of IV Children Weighted Balotra 5680 40.77 4040 29.00 4170 29.93 41 0.29 13931 Barmer 15388 58.55 8672 33.00 2202 8.38 19 0.07 26281 Bayatu 7774 49.50 5128 32.65 2794 17.79 8 0.05 15704 Chohtan 3283 40.45 2498 30.77 2336 28.78 0 0.00 8117 Dhorimanna 7507 43.81 5694 33.23 3935 22.96 0 0.00 17136 Shiv 8800 50.52 6660 38.23 1960 11.25 0 0.00 17420 Sindhari 11781 63.30 4013 21.56 2817 15.14 0 0.00 18611 Siwana 7370 48.77 4655 30.80 3087 20.43 0 0.00 15112 District Total 67583 51.08 41360 31.26 23301 17.61 68 0.05 132312
49
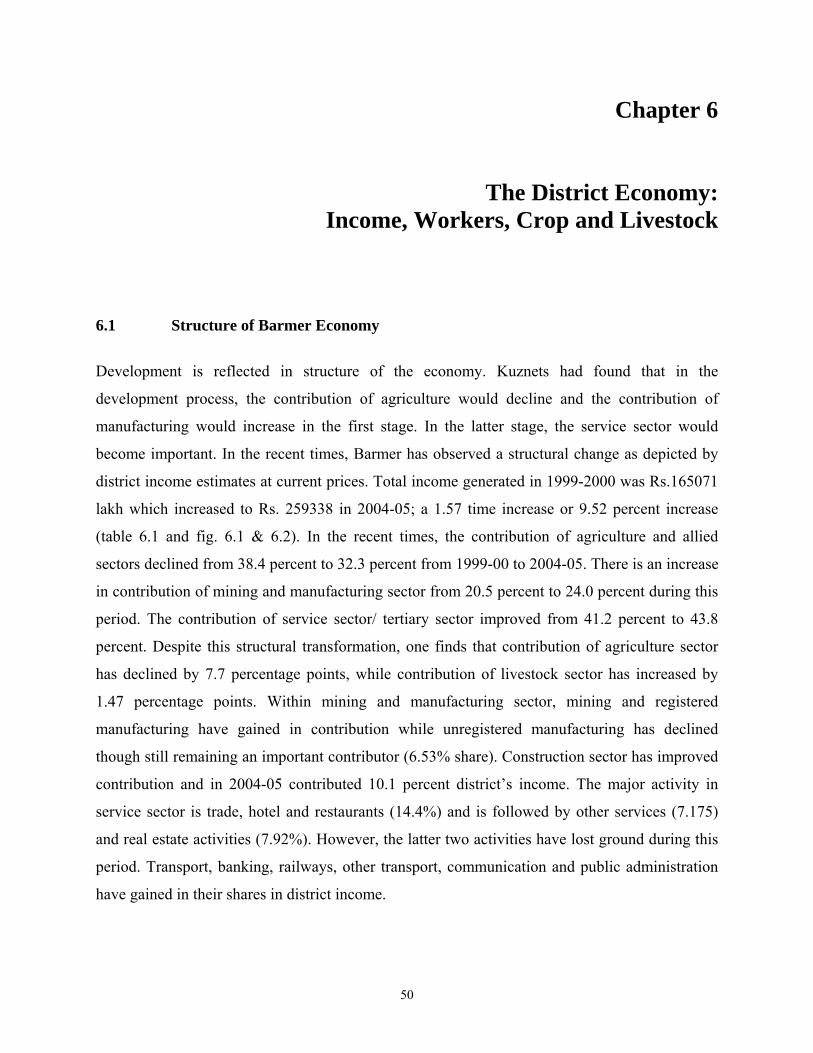
Chapter 6
The District Economy: Income, Workers, Crop and Livestock
6.1 Structure of Barmer Economy
Development is reflected in structure of the economy. Kuznets had found that in the
development process, the contribution of agriculture would decline and the contribution of
manufacturing would increase in the first stage. In the latter stage, the service sector would
become important. In the recent times, Barmer has observed a structural change as depicted by
district income estimates at current prices. Total income generated in 1999-2000 was Rs.165071
lakh which increased to Rs. 259338 in 2004-05; a 1.57 time increase or 9.52 percent increase
(table 6.1 and fig. 6.1 & 6.2). In the recent times, the contribution of agriculture and allied
sectors declined from 38.4 percent to 32.3 percent from 1999-00 to 2004-05. There is an increase
in contribution of mining and manufacturing sector from 20.5 percent to 24.0 percent during this
period. The contribution of service sector/ tertiary sector improved from 41.2 percent to 43.8
percent. Despite this structural transformation, one finds that contribution of agriculture sector
has declined by 7.7 percentage points, while contribution of livestock sector has increased by
1.47 percentage points. Within mining and manufacturing sector, mining and registered
manufacturing have gained in contribution while unregistered manufacturing has declined
though still remaining an important contributor (6.53% share). Construction sector has improved
contribution and in 2004-05 contributed 10.1 percent district’s income. The major activity in
service sector is trade, hotel and restaurants (14.4%) and is followed by other services (7.175)
and real estate activities (7.92%). However, the latter two activities have lost ground during this
period. Transport, banking, railways, other transport, communication and public administration
have gained in their shares in district income.
50
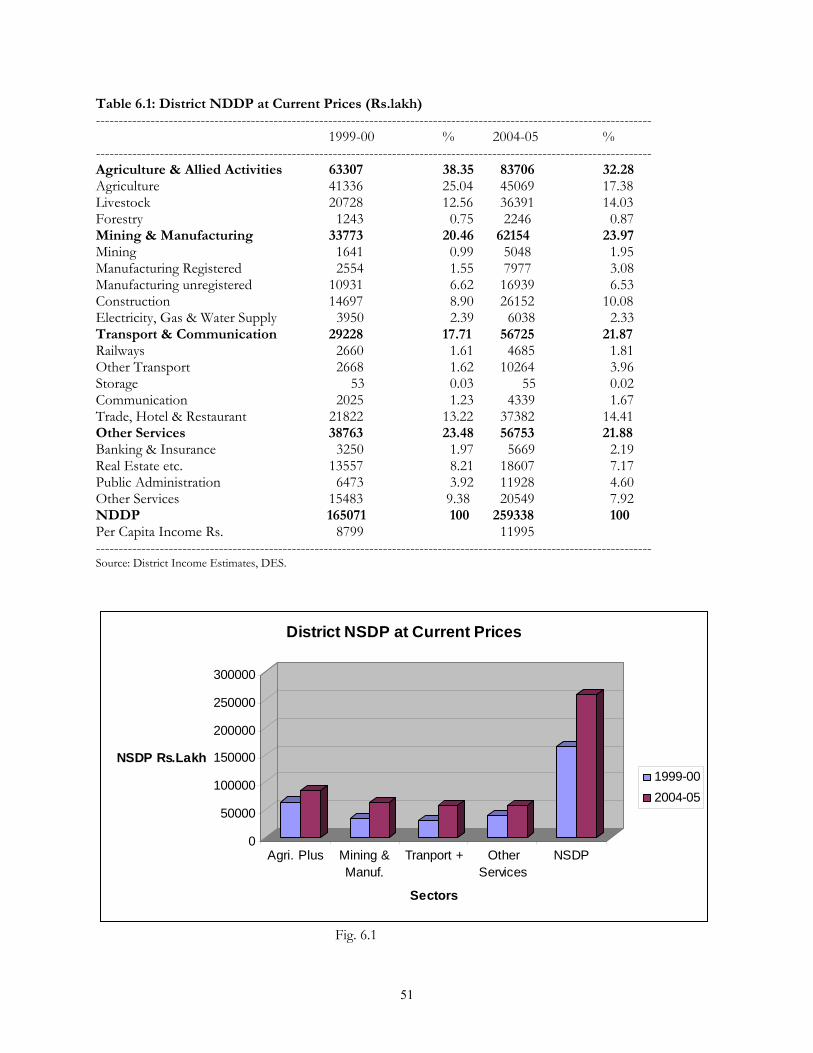
Table 6.1: District NDDP at Current Prices (Rs.lakh) -------------------------------------------------------------------------------------------------------------------------- 1999-00 % 2004-05 %
-------------------------------------------------------------------------------------------------------------------------- Agriculture & Allied Activities 63307 38.35 83706 32.28 Agriculture 41336 25.04 45069 17.38 Livestock 20728 12.56 36391 14.03 Forestry 1243 0.75 2246 0.87 Mining & Manufacturing 33773 20.46 62154 23.97 Mining 1641 0.99 5048 1.95 Manufacturing Registered 2554 1.55 7977 3.08 Manufacturing unregistered 10931 6.62 16939 6.53 Construction 14697 8.90 26152 10.08 Electricity, Gas & Water Supply 3950 2.39 6038 2.33 Transport & Communication 29228 17.71 56725 21.87 Railways 2660 1.61 4685 1.81 Other Transport 2668 1.62 10264 3.96 Storage 53 0.03 55 0.02 Communication 2025 1.23 4339 1.67 Trade, Hotel & Restaurant 21822 13.22 37382 14.41 Other Services 38763 23.48 56753 21.88 Banking & Insurance 3250 1.97 5669 2.19 Real Estate etc. 13557 8.21 18607 7.17 Public Administration 6473 3.92 11928 4.60 Other Services 15483 9.38 20549 7.92 NDDP 165071 100 259338 100 Per Capita Income Rs. 8799 11995 -------------------------------------------------------------------------------------------------------------------------- Source: District Income Estimates, DES.
0
50000
100000
150000
200000
250000
300000
NSDP Rs.Lakh
Agri. Plus Mining &Manuf.
Tranport + OtherServices
NSDP
Sectors
District NSDP at Current Prices
1999-002004-05
Fig. 6.1
51
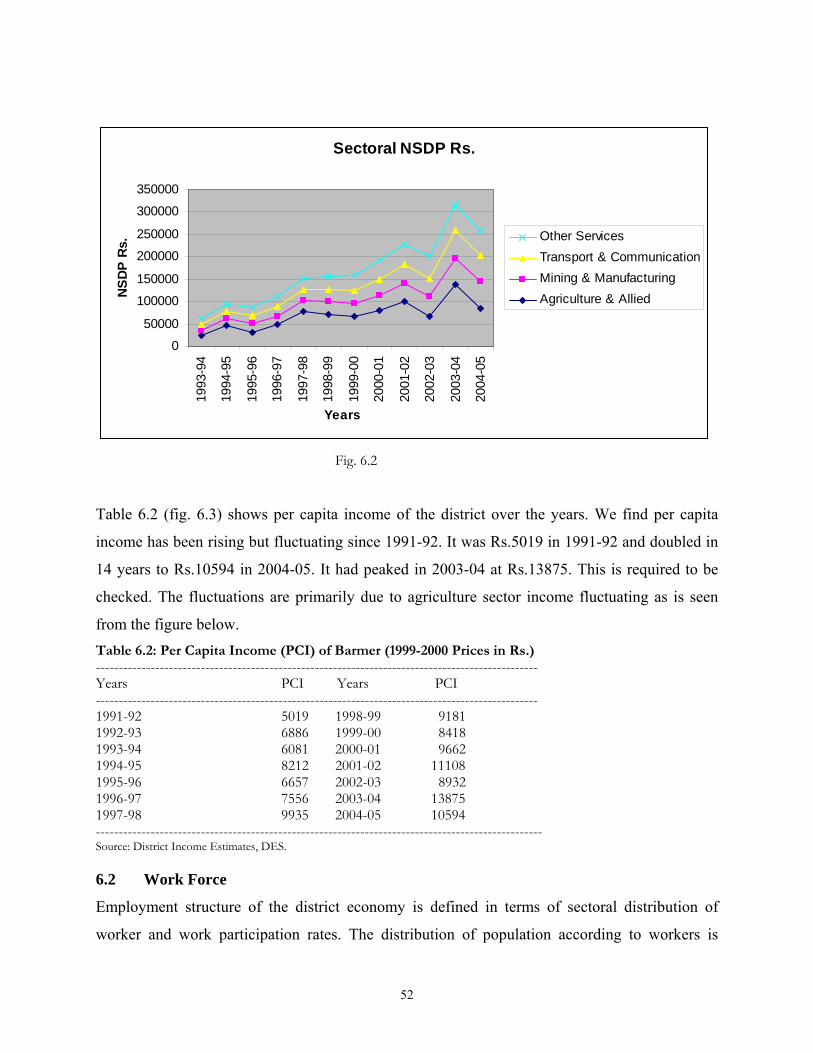
Sectoral NSDP Rs.
0
50000
100000
150000
200000
250000
300000
35000019
93-9
4
1994
-95
1995
-96
1996
-97
1997
-98
1998
-99
1999
-00
2000
-01
2001
-02
2002
-03
2003
-04
2004
-05
Years
NSD
P R
s. Other ServicesTransport & CommunicationMining & ManufacturingAgriculture & Allied
Fig. 6.2
Table 6.2 (fig. 6.3) shows per capita income of the district over the years. We find per capita
income has been rising but fluctuating since 1991-92. It was Rs.5019 in 1991-92 and doubled in
14 years to Rs.10594 in 2004-05. It had peaked in 2003-04 at Rs.13875. This is required to be
checked. The fluctuations are primarily due to agriculture sector income fluctuating as is seen
from the figure below. Table 6.2: Per Capita Income (PCI) of Barmer (1999-2000 Prices in Rs.) ------------------------------------------------------------------------------------------------- Years PCI Years PCI ------------------------------------------------------------------------------------------------- 1991-92 5019 1998-99 9181 1992-93 6886 1999-00 8418 1993-94 6081 2000-01 9662 1994-95 8212 2001-02 11108 1995-96 6657 2002-03 8932 1996-97 7556 2003-04 13875 1997-98 9935 2004-05 10594 -------------------------------------------------------------------------------------------------- Source: District Income Estimates, DES. 6.2 Work Force
Employment structure of the district economy is defined in terms of sectoral distribution of
worker and work participation rates. The distribution of population according to workers is
52
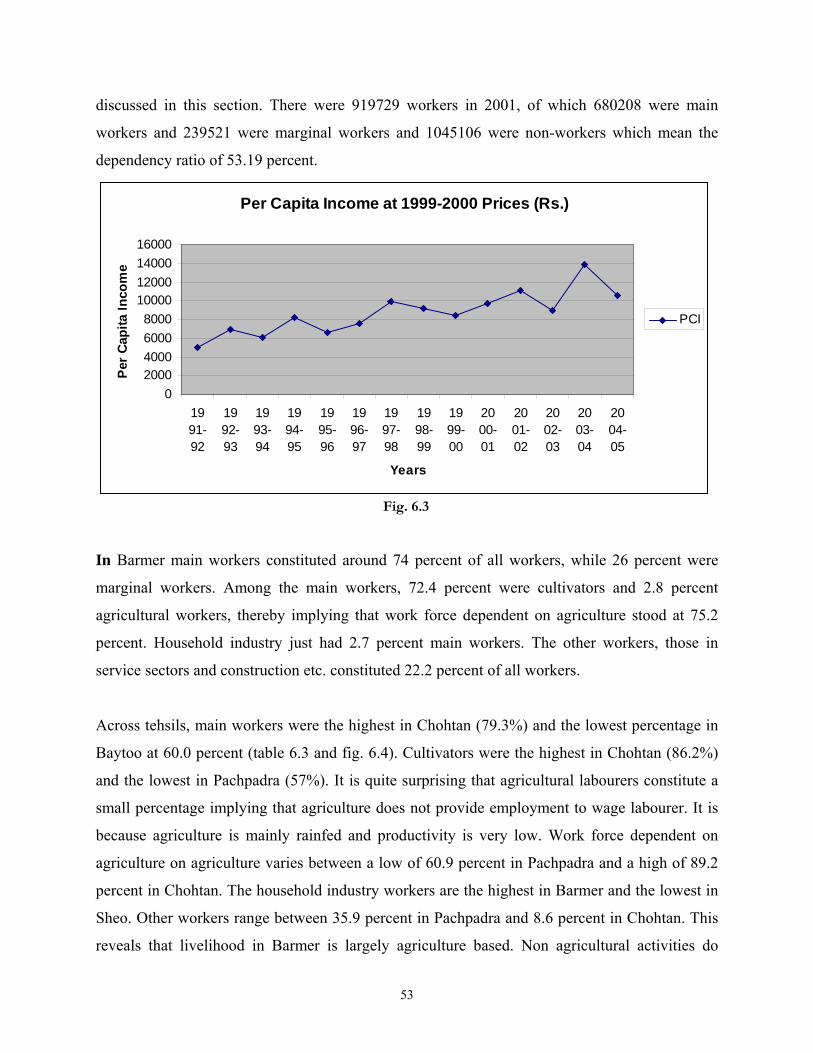
discussed in this section. There were 919729 workers in 2001, of which 680208 were main
workers and 239521 were marginal workers and 1045106 were non-workers which mean the
dependency ratio of 53.19 percent.
Per Capita Income at 1999-2000 Prices (Rs.)
02000400060008000
10000120001400016000
1991-92
1992-93
1993-94
1994-95
1995-96
1996-97
1997-98
1998-99
1999-00
2000-01
2001-02
2002-03
2003-04
2004-05
Years
Per
Cap
ita In
com
e
PCI
Fig. 6.3
In Barmer main workers constituted around 74 percent of all workers, while 26 percent were
marginal workers. Among the main workers, 72.4 percent were cultivators and 2.8 percent
agricultural workers, thereby implying that work force dependent on agriculture stood at 75.2
percent. Household industry just had 2.7 percent main workers. The other workers, those in
service sectors and construction etc. constituted 22.2 percent of all workers.
Across tehsils, main workers were the highest in Chohtan (79.3%) and the lowest percentage in
Baytoo at 60.0 percent (table 6.3 and fig. 6.4). Cultivators were the highest in Chohtan (86.2%)
and the lowest in Pachpadra (57%). It is quite surprising that agricultural labourers constitute a
small percentage implying that agriculture does not provide employment to wage labourer. It is
because agriculture is mainly rainfed and productivity is very low. Work force dependent on
agriculture on agriculture varies between a low of 60.9 percent in Pachpadra and a high of 89.2
percent in Chohtan. The household industry workers are the highest in Barmer and the lowest in
Sheo. Other workers range between 35.9 percent in Pachpadra and 8.6 percent in Chohtan. This
reveals that livelihood in Barmer is largely agriculture based. Non agricultural activities do
53
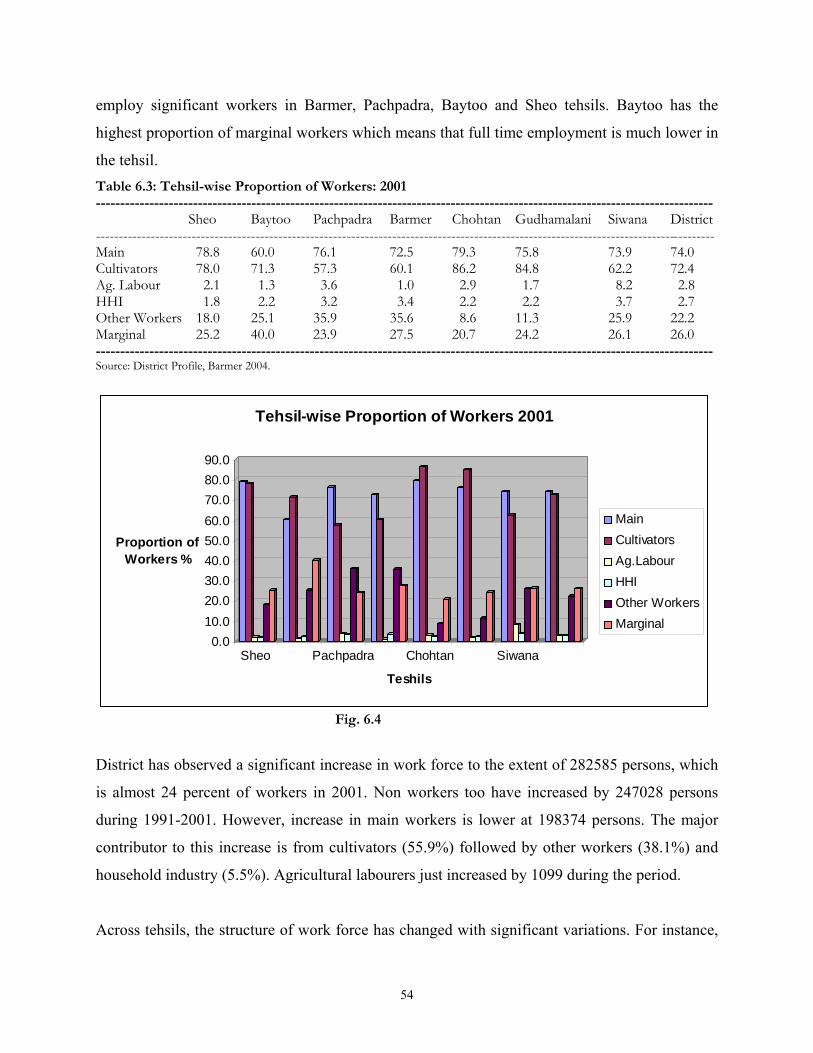
employ significant workers in Barmer, Pachpadra, Baytoo and Sheo tehsils. Baytoo has the
highest proportion of marginal workers which means that full time employment is much lower in
the tehsil. Table 6.3: Tehsil-wise Proportion of Workers: 2001 ------------------------------------------------------------------------------------------------------------------------------- Sheo Baytoo Pachpadra Barmer Chohtan Gudhamalani Siwana District
---------------------------------------------------------------------------------------------------------------------------------------- Main 78.8 60.0 76.1 72.5 79.3 75.8 73.9 74.0 Cultivators 78.0 71.3 57.3 60.1 86.2 84.8 62.2 72.4 Ag. Labour 2.1 1.3 3.6 1.0 2.9 1.7 8.2 2.8 HHI 1.8 2.2 3.2 3.4 2.2 2.2 3.7 2.7 Other Workers 18.0 25.1 35.9 35.6 8.6 11.3 25.9 22.2 Marginal 25.2 40.0 23.9 27.5 20.7 24.2 26.1 26.0 ------------------------------------------------------------------------------------------------------------------------------- Source: District Profile, Barmer 2004.
0.010.020.030.040.050.060.070.080.090.0
Proportion of Workers %
Sheo Pachpadra Chohtan Siwana
Teshils
Tehsil-wise Proportion of Workers 2001
MainCultivatorsAg.LabourHHIOther WorkersMarginal
Fig. 6.4
District has observed a significant increase in work force to the extent of 282585 persons, which
is almost 24 percent of workers in 2001. Non workers too have increased by 247028 persons
during 1991-2001. However, increase in main workers is lower at 198374 persons. The major
contributor to this increase is from cultivators (55.9%) followed by other workers (38.1%) and
household industry (5.5%). Agricultural labourers just increased by 1099 during the period.
Across tehsils, the structure of work force has changed with significant variations. For instance,
54
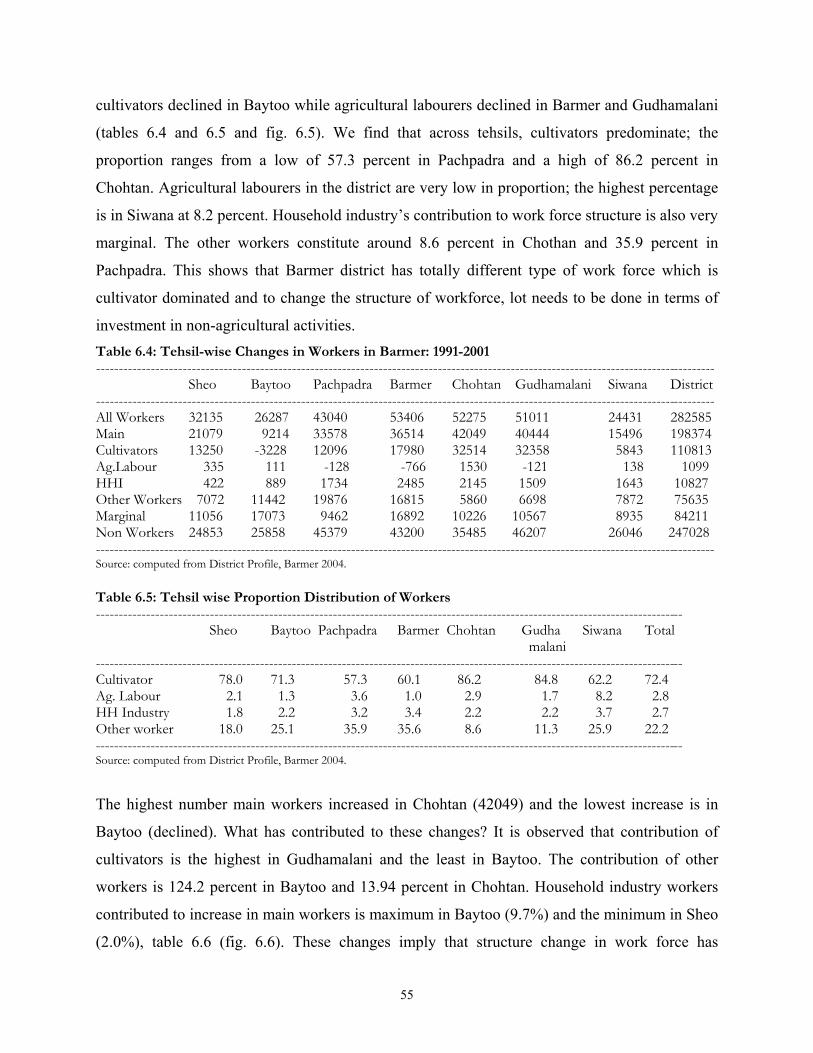
cultivators declined in Baytoo while agricultural labourers declined in Barmer and Gudhamalani
(tables 6.4 and 6.5 and fig. 6.5). We find that across tehsils, cultivators predominate; the
proportion ranges from a low of 57.3 percent in Pachpadra and a high of 86.2 percent in
Chohtan. Agricultural labourers in the district are very low in proportion; the highest percentage
is in Siwana at 8.2 percent. Household industry’s contribution to work force structure is also very
marginal. The other workers constitute around 8.6 percent in Chothan and 35.9 percent in
Pachpadra. This shows that Barmer district has totally different type of work force which is
cultivator dominated and to change the structure of workforce, lot needs to be done in terms of
investment in non-agricultural activities. Table 6.4: Tehsil-wise Changes in Workers in Barmer: 1991-2001 ---------------------------------------------------------------------------------------------------------------------------------------- Sheo Baytoo Pachpadra Barmer Chohtan Gudhamalani Siwana District
---------------------------------------------------------------------------------------------------------------------------------------- All Workers 32135 26287 43040 53406 52275 51011 24431 282585 Main 21079 9214 33578 36514 42049 40444 15496 198374 Cultivators 13250 -3228 12096 17980 32514 32358 5843 110813 Ag.Labour 335 111 -128 -766 1530 -121 138 1099 HHI 422 889 1734 2485 2145 1509 1643 10827 Other Workers 7072 11442 19876 16815 5860 6698 7872 75635 Marginal 11056 17073 9462 16892 10226 10567 8935 84211 Non Workers 24853 25858 45379 43200 35485 46207 26046 247028 ---------------------------------------------------------------------------------------------------------------------------------------- Source: computed from District Profile, Barmer 2004. Table 6.5: Tehsil wise Proportion Distribution of Workers --------------------------------------------------------------------------------------------------------------------------------- Sheo Baytoo Pachpadra Barmer Chohtan Gudha Siwana Total malani
--------------------------------------------------------------------------------------------------------------------------------- Cultivator 78.0 71.3 57.3 60.1 86.2 84.8 62.2 72.4 Ag. Labour 2.1 1.3 3.6 1.0 2.9 1.7 8.2 2.8 HH Industry 1.8 2.2 3.2 3.4 2.2 2.2 3.7 2.7 Other worker 18.0 25.1 35.9 35.6 8.6 11.3 25.9 22.2 --------------------------------------------------------------------------------------------------------------------------------- Source: computed from District Profile, Barmer 2004.
The highest number main workers increased in Chohtan (42049) and the lowest increase is in
Baytoo (declined). What has contributed to these changes? It is observed that contribution of
cultivators is the highest in Gudhamalani and the least in Baytoo. The contribution of other
workers is 124.2 percent in Baytoo and 13.94 percent in Chohtan. Household industry workers
contributed to increase in main workers is maximum in Baytoo (9.7%) and the minimum in Sheo
(2.0%), table 6.6 (fig. 6.6). These changes imply that structure change in work force has
55
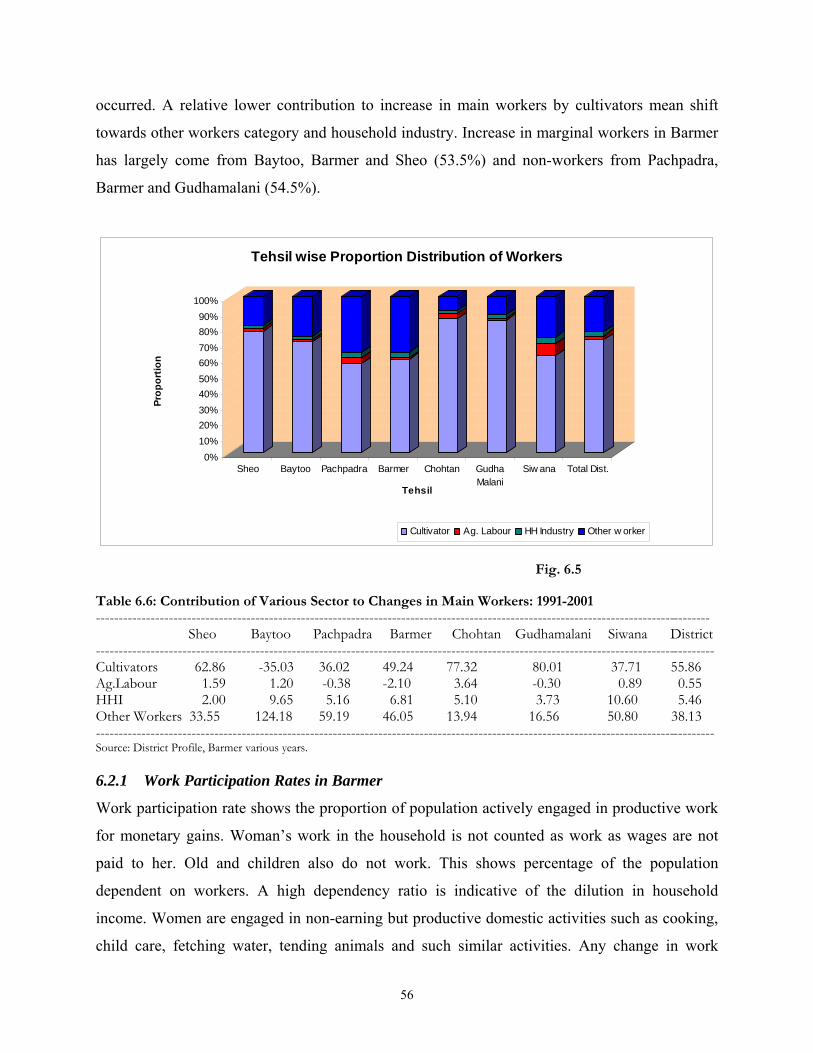
occurred. A relative lower contribution to increase in main workers by cultivators mean shift
towards other workers category and household industry. Increase in marginal workers in Barmer
has largely come from Baytoo, Barmer and Sheo (53.5%) and non-workers from Pachpadra,
Barmer and Gudhamalani (54.5%).
0%10%20%30%40%50%60%70%80%90%
100%
Prop
ortio
n
Sheo Baytoo Pachpadra Barmer Chohtan GudhaMalani
Siw ana Total Dist.
Tehsil
Tehsil wise Proportion Distribution of Workers
Cultivator Ag. Labour HH Industry Other w orker
Fig. 6.5 Table 6.6: Contribution of Various Sector to Changes in Main Workers: 1991-2001 --------------------------------------------------------------------------------------------------------------------------------------- Sheo Baytoo Pachpadra Barmer Chohtan Gudhamalani Siwana District ---------------------------------------------------------------------------------------------------------------------------------------- Cultivators 62.86 -35.03 36.02 49.24 77.32 80.01 37.71 55.86 Ag.Labour 1.59 1.20 -0.38 -2.10 3.64 -0.30 0.89 0.55 HHI 2.00 9.65 5.16 6.81 5.10 3.73 10.60 5.46 Other Workers 33.55 124.18 59.19 46.05 13.94 16.56 50.80 38.13 ---------------------------------------------------------------------------------------------------------------------------------------- Source: District Profile, Barmer various years. 6.2.1 Work Participation Rates in Barmer
Work participation rate shows the proportion of population actively engaged in productive work
for monetary gains. Woman’s work in the household is not counted as work as wages are not
paid to her. Old and children also do not work. This shows percentage of the population
dependent on workers. A high dependency ratio is indicative of the dilution in household
income. Women are engaged in non-earning but productive domestic activities such as cooking,
child care, fetching water, tending animals and such similar activities. Any change in work
56
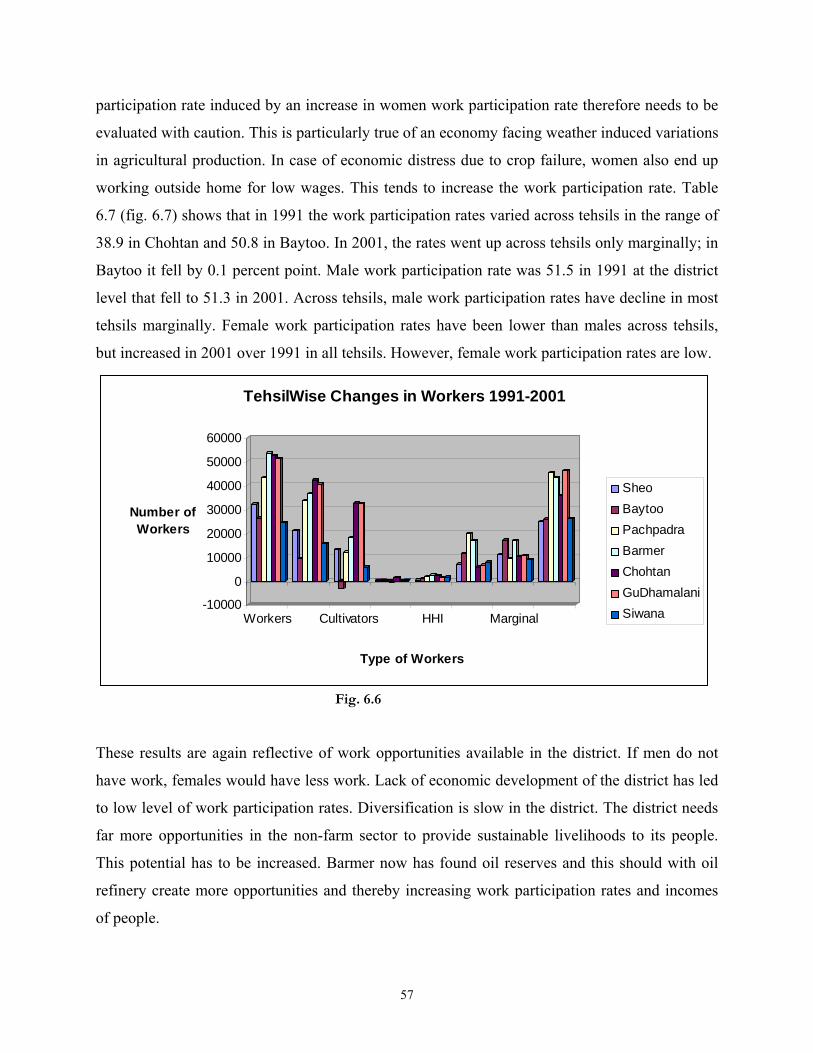
participation rate induced by an increase in women work participation rate therefore needs to be
evaluated with caution. This is particularly true of an economy facing weather induced variations
in agricultural production. In case of economic distress due to crop failure, women also end up
working outside home for low wages. This tends to increase the work participation rate. Table
6.7 (fig. 6.7) shows that in 1991 the work participation rates varied across tehsils in the range of
38.9 in Chohtan and 50.8 in Baytoo. In 2001, the rates went up across tehsils only marginally; in
Baytoo it fell by 0.1 percent point. Male work participation rate was 51.5 in 1991 at the district
level that fell to 51.3 in 2001. Across tehsils, male work participation rates have decline in most
tehsils marginally. Female work participation rates have been lower than males across tehsils,
but increased in 2001 over 1991 in all tehsils. However, female work participation rates are low.
-10000
0
10000
20000
30000
40000
50000
60000
Number of Workers
Workers Cultivators HHI Marginal
Type of Workers
TehsilWise Changes in Workers 1991-2001
SheoBaytooPachpadraBarmerChohtanGuDhamalaniSiwana
Fig. 6.6
These results are again reflective of work opportunities available in the district. If men do not
have work, females would have less work. Lack of economic development of the district has led
to low level of work participation rates. Diversification is slow in the district. The district needs
far more opportunities in the non-farm sector to provide sustainable livelihoods to its people.
This potential has to be increased. Barmer now has found oil reserves and this should with oil
refinery create more opportunities and thereby increasing work participation rates and incomes
of people.
57
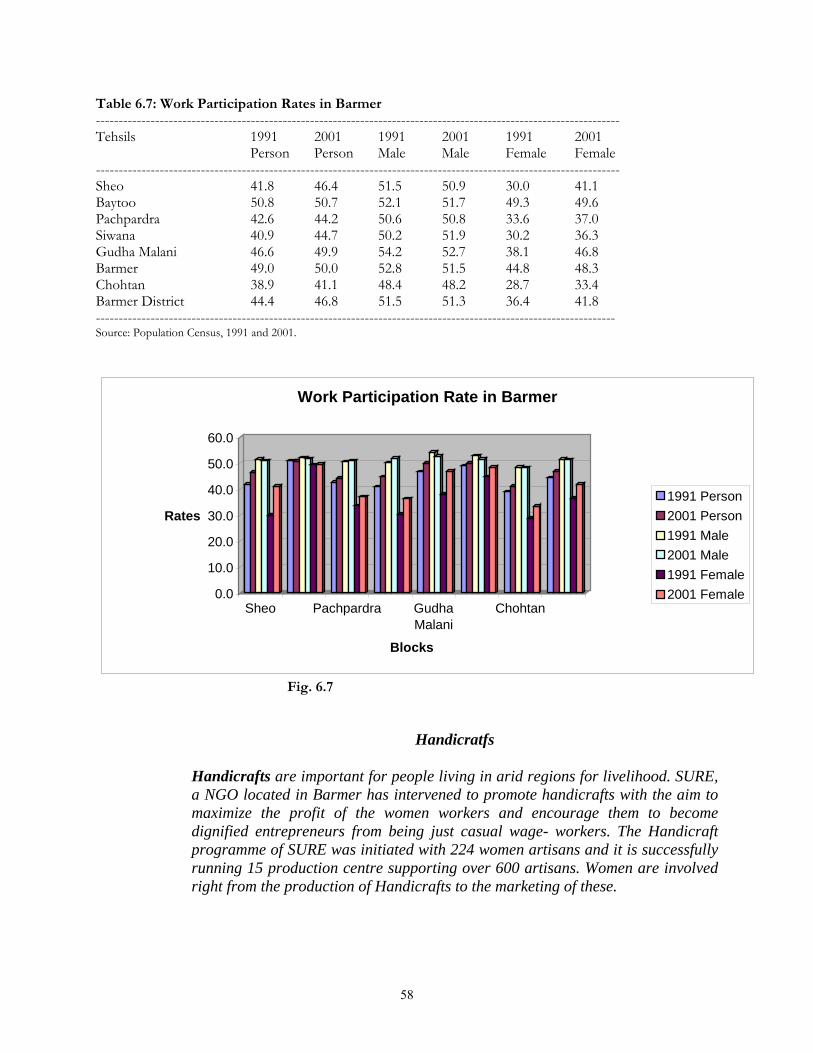
Table 6.7: Work Participation Rates in Barmer ------------------------------------------------------------------------------------------------------------------- Tehsils 1991 2001 1991 2001 1991 2001 Person Person Male Male Female Female ------------------------------------------------------------------------------------------------------------------- Sheo 41.8 46.4 51.5 50.9 30.0 41.1 Baytoo 50.8 50.7 52.1 51.7 49.3 49.6 Pachpardra 42.6 44.2 50.6 50.8 33.6 37.0 Siwana 40.9 44.7 50.2 51.9 30.2 36.3 Gudha Malani 46.6 49.9 54.2 52.7 38.1 46.8 Barmer 49.0 50.0 52.8 51.5 44.8 48.3 Chohtan 38.9 41.1 48.4 48.2 28.7 33.4 Barmer District 44.4 46.8 51.5 51.3 36.4 41.8 ------------------------------------------------------------------------------------------------------------------ Source: Population Census, 1991 and 2001.
0.0
10.0
20.0
30.0
40.0
50.0
60.0
Rates
Sheo Pachpardra GudhaMalani
Chohtan
Blocks
Work Participation Rate in Barmer
1991 Person2001 Person1991 Male2001 Male1991 Female2001 Female
Fig. 6.7
Handicratfs
Handicrafts are important for people living in arid regions for livelihood. SURE, a NGO located in Barmer has intervened to promote handicrafts with the aim to maximize the profit of the women workers and encourage them to become dignified entrepreneurs from being just casual wage- workers. The Handicraft programme of SURE was initiated with 224 women artisans and it is successfully running 15 production centre supporting over 600 artisans. Women are involved right from the production of Handicrafts to the marketing of these.
58
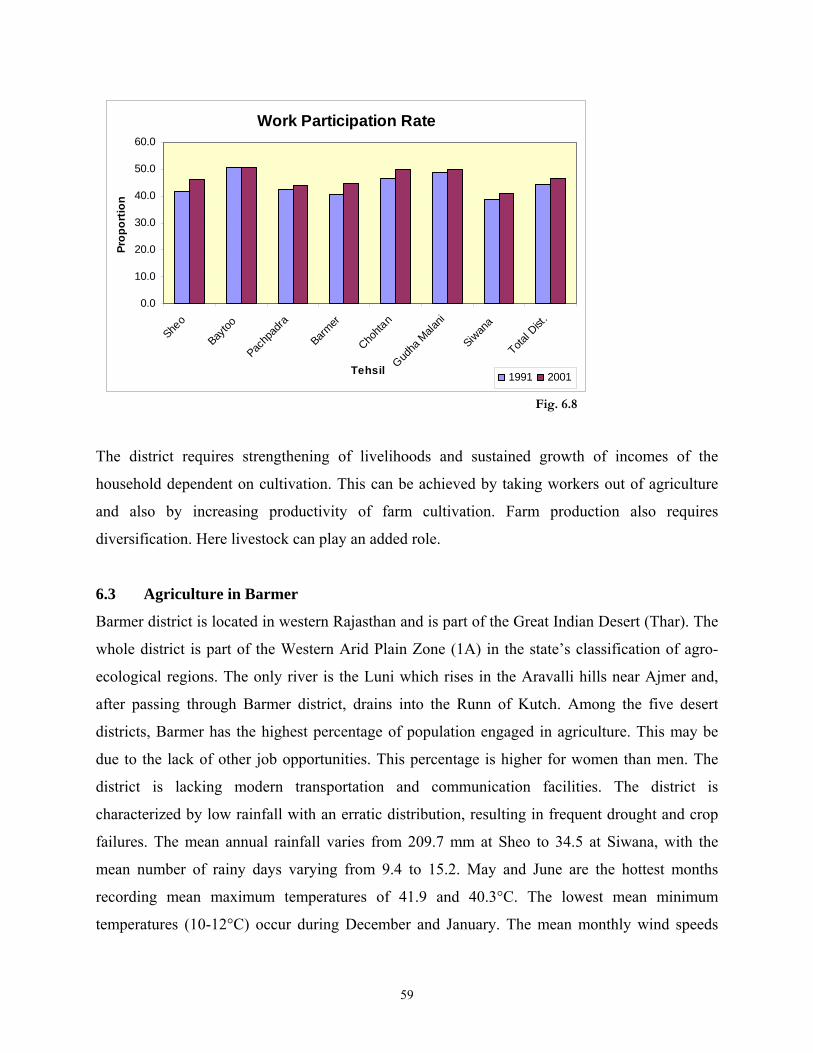
Work Participation Rate
0.0
10.0
20.0
30.0
40.0
50.0
60.0
Sheo
Baytoo
Pachp
adra
Barmer
Chohta
n
Gudha
Mala
ni
Siwan
a
Total D
ist.
Tehsil
Prop
ortio
n
1991 2001
Fig. 6.8
The district requires strengthening of livelihoods and sustained growth of incomes of the
household dependent on cultivation. This can be achieved by taking workers out of agriculture
and also by increasing productivity of farm cultivation. Farm production also requires
diversification. Here livestock can play an added role.
6.3 Agriculture in Barmer
Barmer district is located in western Rajasthan and is part of the Great Indian Desert (Thar). The
whole district is part of the Western Arid Plain Zone (1A) in the state’s classification of agro-
ecological regions. The only river is the Luni which rises in the Aravalli hills near Ajmer and,
after passing through Barmer district, drains into the Runn of Kutch. Among the five desert
districts, Barmer has the highest percentage of population engaged in agriculture. This may be
due to the lack of other job opportunities. This percentage is higher for women than men. The
district is lacking modern transportation and communication facilities. The district is
characterized by low rainfall with an erratic distribution, resulting in frequent drought and crop
failures. The mean annual rainfall varies from 209.7 mm at Sheo to 34.5 at Siwana, with the
mean number of rainy days varying from 9.4 to 15.2. May and June are the hottest months
recording mean maximum temperatures of 41.9 and 40.3°C. The lowest mean minimum
temperatures (10-12°C) occur during December and January. The mean monthly wind speeds
59
vary between 5.3 and 14.2 km/h. The potential evapo-transpiration across the district varies
between 1500-2000 mm per year and is highest from April to June.
Agriculture is the main source of livelihood other than the livestock rearing. A significant
portion of the economy of the district is agrarian. As a major portion of the district is parched
and infertile, agriculture becomes very difficult. Ground water is available only at a depth of 30
to 60 metres. Rainwater is the major source of irrigation and drinking water in the district. The
local people have adopted themselves with extreme temperature variations and constant water
shortage. Luni the seasonal shallow river passes through the Pachpadra and Gudhamalani tehsils.
It flow 482 kms before draining into the Arabian Sea. The area remains dry throughout the year
except few days of rain during July to September. There are few villages in the district that
receive water of the Indira Gandhi canal, which has been extended up to Gadra Road. It would
help irrigate about 0.1 million hectares of agriculture land. It is expected that canal would also
improve water level of the wells in the area covered by the flow. Ground water potential is very
limited. Wells are the main source of irrigation in the district. In this background the major crops
grown are cereal crops, pulses, oilseeds, spices, guarseed, isabgol, cumin etc. As water is limited,
use of modern seeds and fertilizers is limited.
6.3.1 Cropping Pattern
Barmer’s agriculture is rain-fed and it is reflected by crops grown in rabi and kharif seasons.
Kharif season is mainly rain dependent and rabi crops are gown by moisture conservation and
some winter rains. Tables 6.8 and 6.9 present in detail the share in area of various crops grown.
Data shows that there are year to year variations in cropped area. Among rabi cereal crops, wheat
is the important crop grown had 25 percent area in 1991-92 that went down to 14.14 percent in
1999-00 to continuously reduce to touch 8.29 percent in 2001-02. The area under wheat stood at
9.87 percent in 2004-05. Among rabi oilseeds, rape and mustard is the important crop that had
24.70 percent area under it in 1991-92. The area went up to 25.99 percent in 1995-96 to reduce
to 14.35 percent in 1999-00. Between 2000-01 and 2002-03 the area under rapeseed and mustard
was almost lost, to recover to 13.61 percent in 2004-05. Barmer is famous for spices especially
cumin. It is observed that in 1991-92, of the total rabi area 48.87 percent was under cumin. The
share in area fluctuated but increased to 69.74 percent in 2001-02. It was 48.13 percent in 2004-
60
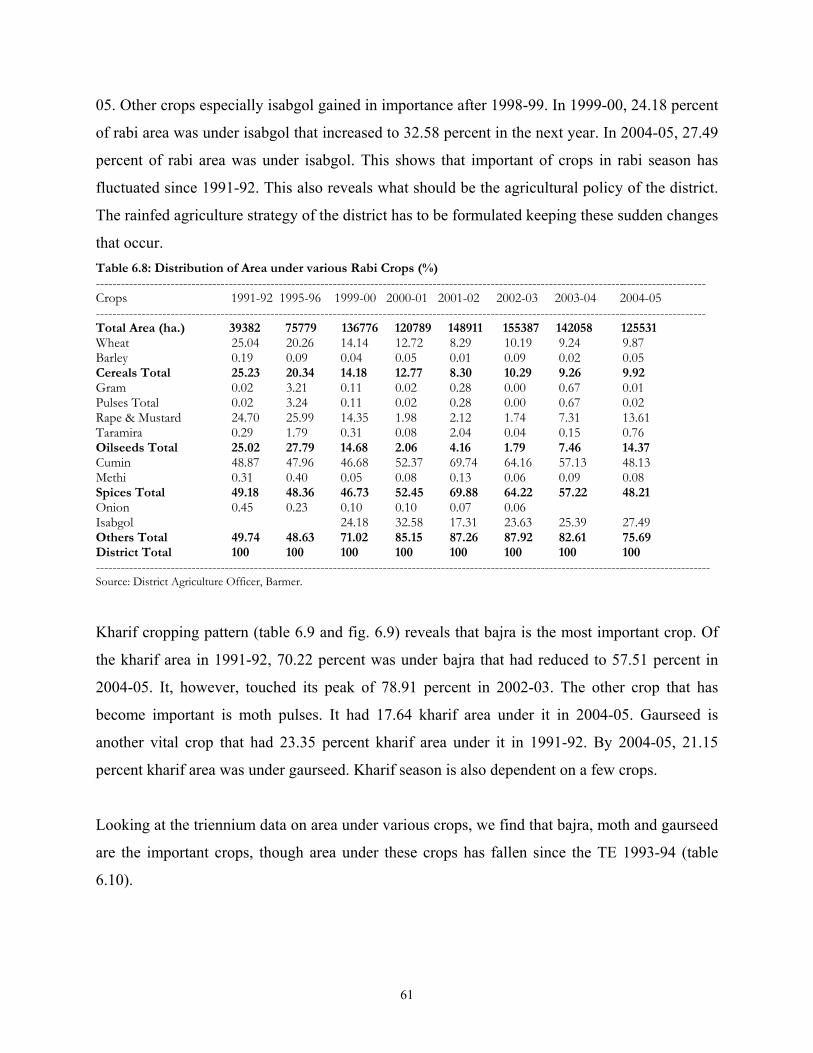
05. Other crops especially isabgol gained in importance after 1998-99. In 1999-00, 24.18 percent
of rabi area was under isabgol that increased to 32.58 percent in the next year. In 2004-05, 27.49
percent of rabi area was under isabgol. This shows that important of crops in rabi season has
fluctuated since 1991-92. This also reveals what should be the agricultural policy of the district.
The rainfed agriculture strategy of the district has to be formulated keeping these sudden changes
that occur. Table 6.8: Distribution of Area under various Rabi Crops (%) --------------------------------------------------------------------------------------------------------------------------------------------------- Crops 1991-92 1995-96 1999-00 2000-01 2001-02 2002-03 2003-04 2004-05 --------------------------------------------------------------------------------------------------------------------------------------------------- Total Area (ha.) 39382 75779 136776 120789 148911 155387 142058 125531 Wheat 25.04 20.26 14.14 12.72 8.29 10.19 9.24 9.87 Barley 0.19 0.09 0.04 0.05 0.01 0.09 0.02 0.05 Cereals Total 25.23 20.34 14.18 12.77 8.30 10.29 9.26 9.92 Gram 0.02 3.21 0.11 0.02 0.28 0.00 0.67 0.01 Pulses Total 0.02 3.24 0.11 0.02 0.28 0.00 0.67 0.02 Rape & Mustard 24.70 25.99 14.35 1.98 2.12 1.74 7.31 13.61 Taramira 0.29 1.79 0.31 0.08 2.04 0.04 0.15 0.76 Oilseeds Total 25.02 27.79 14.68 2.06 4.16 1.79 7.46 14.37 Cumin 48.87 47.96 46.68 52.37 69.74 64.16 57.13 48.13 Methi 0.31 0.40 0.05 0.08 0.13 0.06 0.09 0.08 Spices Total 49.18 48.36 46.73 52.45 69.88 64.22 57.22 48.21 Onion 0.45 0.23 0.10 0.10 0.07 0.06 Isabgol 24.18 32.58 17.31 23.63 25.39 27.49 Others Total 49.74 48.63 71.02 85.15 87.26 87.92 82.61 75.69 District Total 100 100 100 100 100 100 100 100 ---------------------------------------------------------------------------------------------------------------------------------------------------- Source: District Agriculture Officer, Barmer.
Kharif cropping pattern (table 6.9 and fig. 6.9) reveals that bajra is the most important crop. Of
the kharif area in 1991-92, 70.22 percent was under bajra that had reduced to 57.51 percent in
2004-05. It, however, touched its peak of 78.91 percent in 2002-03. The other crop that has
become important is moth pulses. It had 17.64 kharif area under it in 2004-05. Gaurseed is
another vital crop that had 23.35 percent kharif area under it in 1991-92. By 2004-05, 21.15
percent kharif area was under gaurseed. Kharif season is also dependent on a few crops.
Looking at the triennium data on area under various crops, we find that bajra, moth and gaurseed
are the important crops, though area under these crops has fallen since the TE 1993-94 (table
6.10).
61
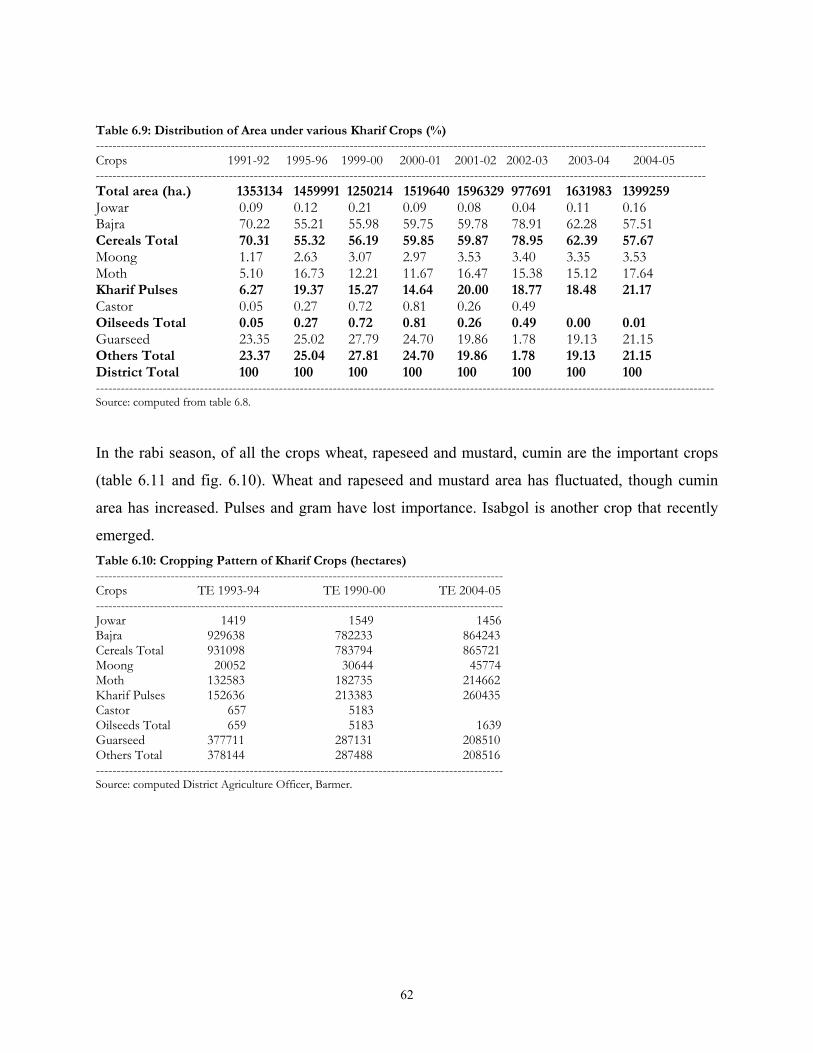
Table 6.9: Distribution of Area under various Kharif Crops (%) --------------------------------------------------------------------------------------------------------------------------------------------------- Crops 1991-92 1995-96 1999-00 2000-01 2001-02 2002-03 2003-04 2004-05 --------------------------------------------------------------------------------------------------------------------------------------------------- Total area (ha.) 1353134 1459991 1250214 1519640 1596329 977691 1631983 1399259 Jowar 0.09 0.12 0.21 0.09 0.08 0.04 0.11 0.16 Bajra 70.22 55.21 55.98 59.75 59.78 78.91 62.28 57.51 Cereals Total 70.31 55.32 56.19 59.85 59.87 78.95 62.39 57.67 Moong 1.17 2.63 3.07 2.97 3.53 3.40 3.35 3.53 Moth 5.10 16.73 12.21 11.67 16.47 15.38 15.12 17.64 Kharif Pulses 6.27 19.37 15.27 14.64 20.00 18.77 18.48 21.17 Castor 0.05 0.27 0.72 0.81 0.26 0.49 Oilseeds Total 0.05 0.27 0.72 0.81 0.26 0.49 0.00 0.01 Guarseed 23.35 25.02 27.79 24.70 19.86 1.78 19.13 21.15 Others Total 23.37 25.04 27.81 24.70 19.86 1.78 19.13 21.15 District Total 100 100 100 100 100 100 100 100 ----------------------------------------------------------------------------------------------------------------------------------------------------- Source: computed from table 6.8.
In the rabi season, of all the crops wheat, rapeseed and mustard, cumin are the important crops
(table 6.11 and fig. 6.10). Wheat and rapeseed and mustard area has fluctuated, though cumin
area has increased. Pulses and gram have lost importance. Isabgol is another crop that recently
emerged. Table 6.10: Cropping Pattern of Kharif Crops (hectares) -------------------------------------------------------------------------------------------------- Crops TE 1993-94 TE 1990-00 TE 2004-05 -------------------------------------------------------------------------------------------------- Jowar 1419 1549 1456 Bajra 929638 782233 864243 Cereals Total 931098 783794 865721 Moong 20052 30644 45774 Moth 132583 182735 214662 Kharif Pulses 152636 213383 260435 Castor 657 5183 Oilseeds Total 659 5183 1639 Guarseed 377711 287131 208510 Others Total 378144 287488 208516 -------------------------------------------------------------------------------------------------- Source: computed District Agriculture Officer, Barmer.
62
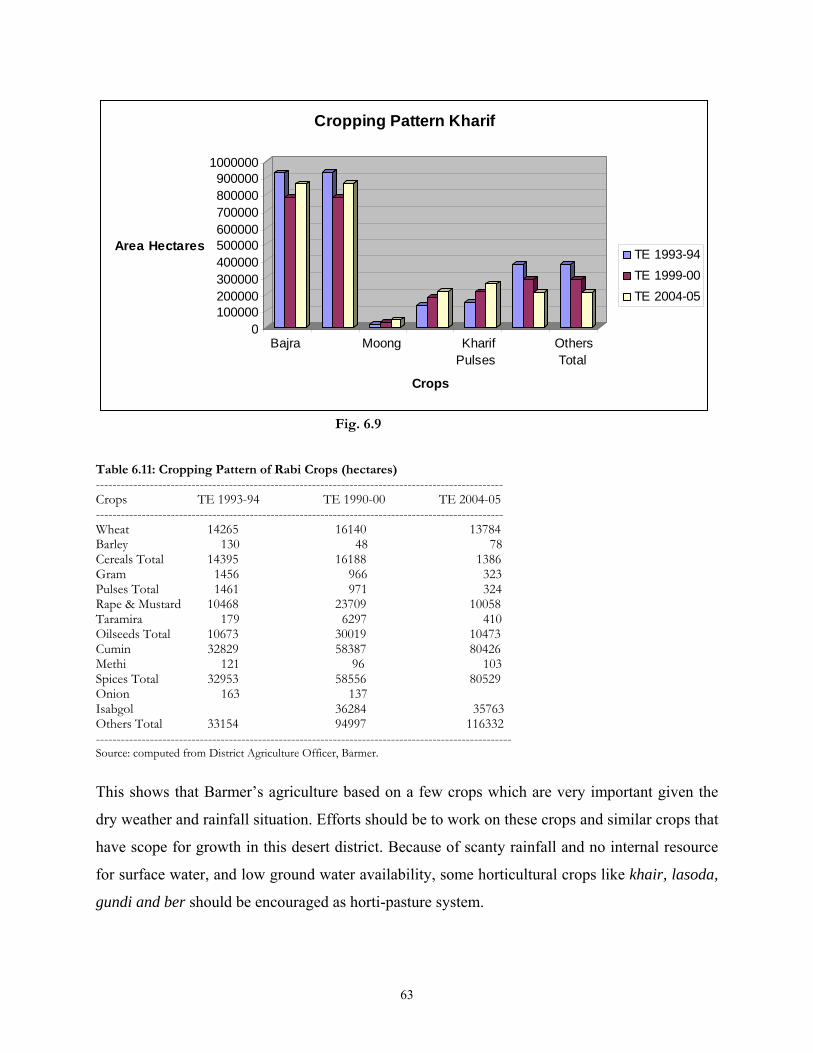
0100000200000300000400000500000600000700000800000900000
1000000
Area Hectares
Bajra Moong KharifPulses
OthersTotal
Crops
Cropping Pattern Kharif
TE 1993-94TE 1999-00TE 2004-05
Fig. 6.9 Table 6.11: Cropping Pattern of Rabi Crops (hectares) -------------------------------------------------------------------------------------------------- Crops TE 1993-94 TE 1990-00 TE 2004-05 -------------------------------------------------------------------------------------------------- Wheat 14265 16140 13784 Barley 130 48 78 Cereals Total 14395 16188 1386 Gram 1456 966 323 Pulses Total 1461 971 324 Rape & Mustard 10468 23709 10058 Taramira 179 6297 410 Oilseeds Total 10673 30019 10473 Cumin 32829 58387 80426 Methi 121 96 103 Spices Total 32953 58556 80529 Onion 163 137 Isabgol 36284 35763 Others Total 33154 94997 116332 ---------------------------------------------------------------------------------------------------- Source: computed from District Agriculture Officer, Barmer.
This shows that Barmer’s agriculture based on a few crops which are very important given the
dry weather and rainfall situation. Efforts should be to work on these crops and similar crops that
have scope for growth in this desert district. Because of scanty rainfall and no internal resource
for surface water, and low ground water availability, some horticultural crops like khair, lasoda,
gundi and ber should be encouraged as horti-pasture system.
63
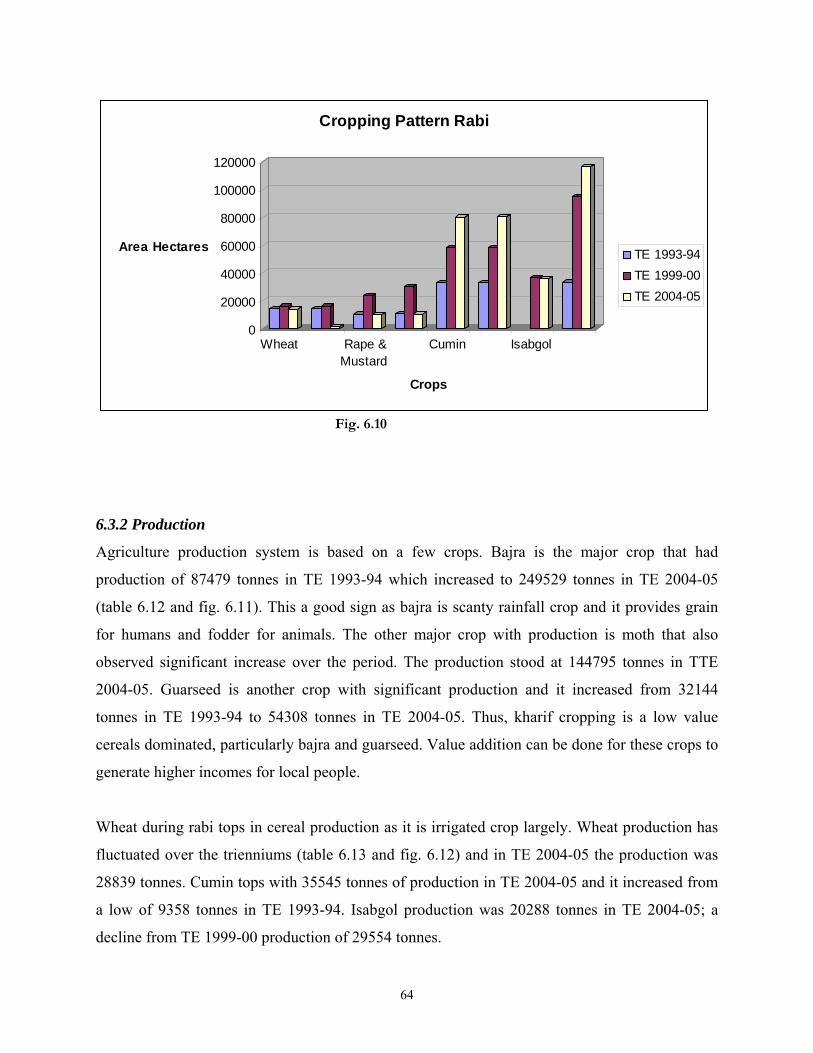
0
20000
40000
60000
80000
100000
120000
Area Hectares
Wheat Rape &Mustard
Cumin Isabgol
Crops
Cropping Pattern Rabi
TE 1993-94TE 1999-00TE 2004-05
Fig. 6.10
6.3.2 Production
Agriculture production system is based on a few crops. Bajra is the major crop that had
production of 87479 tonnes in TE 1993-94 which increased to 249529 tonnes in TE 2004-05
(table 6.12 and fig. 6.11). This a good sign as bajra is scanty rainfall crop and it provides grain
for humans and fodder for animals. The other major crop with production is moth that also
observed significant increase over the period. The production stood at 144795 tonnes in TTE
2004-05. Guarseed is another crop with significant production and it increased from 32144
tonnes in TE 1993-94 to 54308 tonnes in TE 2004-05. Thus, kharif cropping is a low value
cereals dominated, particularly bajra and guarseed. Value addition can be done for these crops to
generate higher incomes for local people.
Wheat during rabi tops in cereal production as it is irrigated crop largely. Wheat production has
fluctuated over the trienniums (table 6.13 and fig. 6.12) and in TE 2004-05 the production was
28839 tonnes. Cumin tops with 35545 tonnes of production in TE 2004-05 and it increased from
a low of 9358 tonnes in TE 1993-94. Isabgol production was 20288 tonnes in TE 2004-05; a
decline from TE 1999-00 production of 29554 tonnes.
64
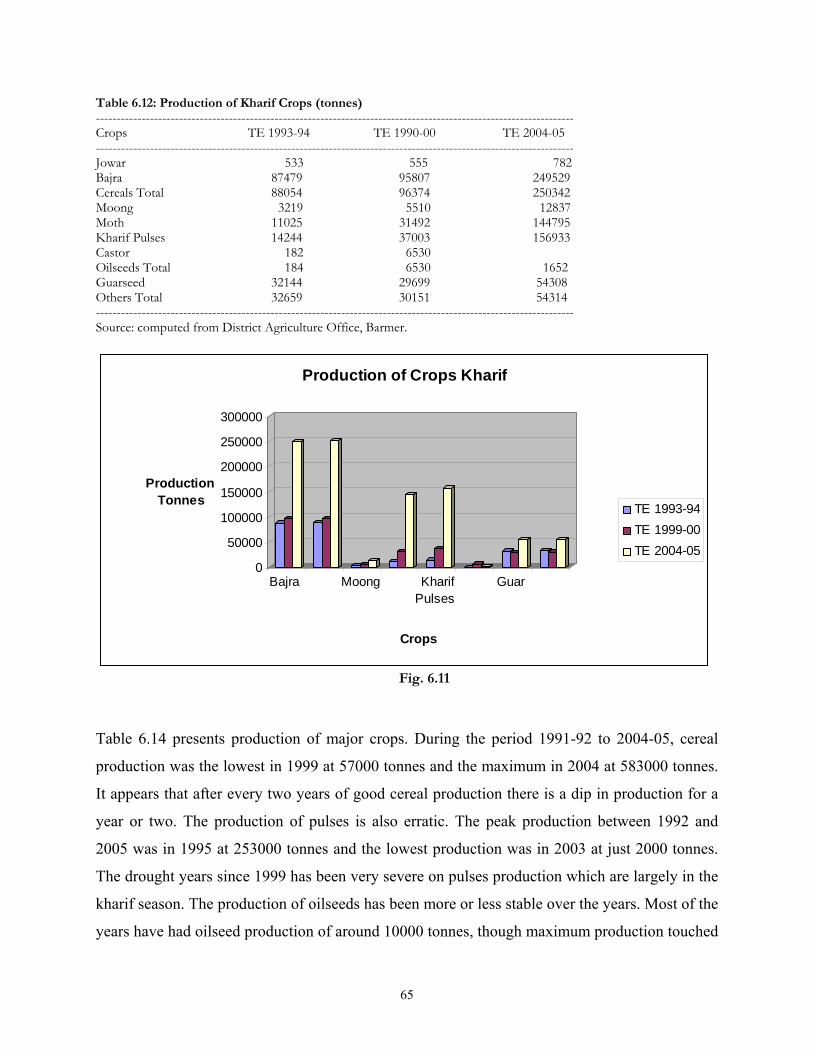
Table 6.12: Production of Kharif Crops (tonnes) ------------------------------------------------------------------------------------------------------------------- Crops TE 1993-94 TE 1990-00 TE 2004-05 ------------------------------------------------------------------------------------------------------------------- Jowar 533 555 782 Bajra 87479 95807 249529 Cereals Total 88054 96374 250342 Moong 3219 5510 12837 Moth 11025 31492 144795 Kharif Pulses 14244 37003 156933 Castor 182 6530 Oilseeds Total 184 6530 1652 Guarseed 32144 29699 54308 Others Total 32659 30151 54314 ------------------------------------------------------------------------------------------------------------------- Source: computed from District Agriculture Office, Barmer.
0
50000
100000
150000
200000
250000
300000
Production Tonnes
Bajra Moong KharifPulses
Guar
Crops
Production of Crops Kharif
TE 1993-94TE 1999-00TE 2004-05
Fig. 6.11
Table 6.14 presents production of major crops. During the period 1991-92 to 2004-05, cereal
production was the lowest in 1999 at 57000 tonnes and the maximum in 2004 at 583000 tonnes.
It appears that after every two years of good cereal production there is a dip in production for a
year or two. The production of pulses is also erratic. The peak production between 1992 and
2005 was in 1995 at 253000 tonnes and the lowest production was in 2003 at just 2000 tonnes.
The drought years since 1999 has been very severe on pulses production which are largely in the
kharif season. The production of oilseeds has been more or less stable over the years. Most of the
years have had oilseed production of around 10000 tonnes, though maximum production touched
65
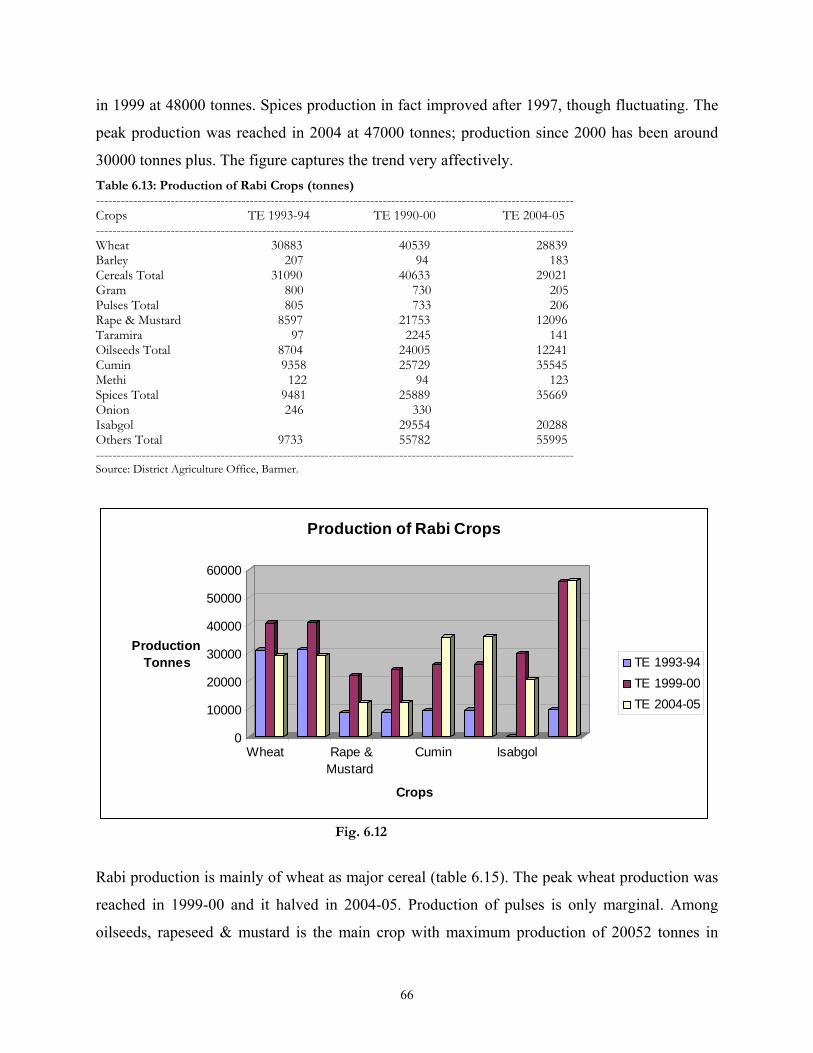
in 1999 at 48000 tonnes. Spices production in fact improved after 1997, though fluctuating. The
peak production was reached in 2004 at 47000 tonnes; production since 2000 has been around
30000 tonnes plus. The figure captures the trend very affectively. Table 6.13: Production of Rabi Crops (tonnes) ------------------------------------------------------------------------------------------------------------------- Crops TE 1993-94 TE 1990-00 TE 2004-05 ------------------------------------------------------------------------------------------------------------------- Wheat 30883 40539 28839 Barley 207 94 183 Cereals Total 31090 40633 29021 Gram 800 730 205 Pulses Total 805 733 206 Rape & Mustard 8597 21753 12096 Taramira 97 2245 141 Oilseeds Total 8704 24005 12241 Cumin 9358 25729 35545 Methi 122 94 123 Spices Total 9481 25889 35669 Onion 246 330 Isabgol 29554 20288 Others Total 9733 55782 55995 ------------------------------------------------------------------------------------------------------------------- Source: District Agriculture Office, Barmer.
0
10000
20000
30000
40000
50000
60000
Production Tonnes
Wheat Rape &Mustard
Cumin Isabgol
Crops
Production of Rabi Crops
TE 1993-94TE 1999-00TE 2004-05
Fig. 6.12
Rabi production is mainly of wheat as major cereal (table 6.15). The peak wheat production was
reached in 1999-00 and it halved in 2004-05. Production of pulses is only marginal. Among
oilseeds, rapeseed & mustard is the main crop with maximum production of 20052 tonnes in
66
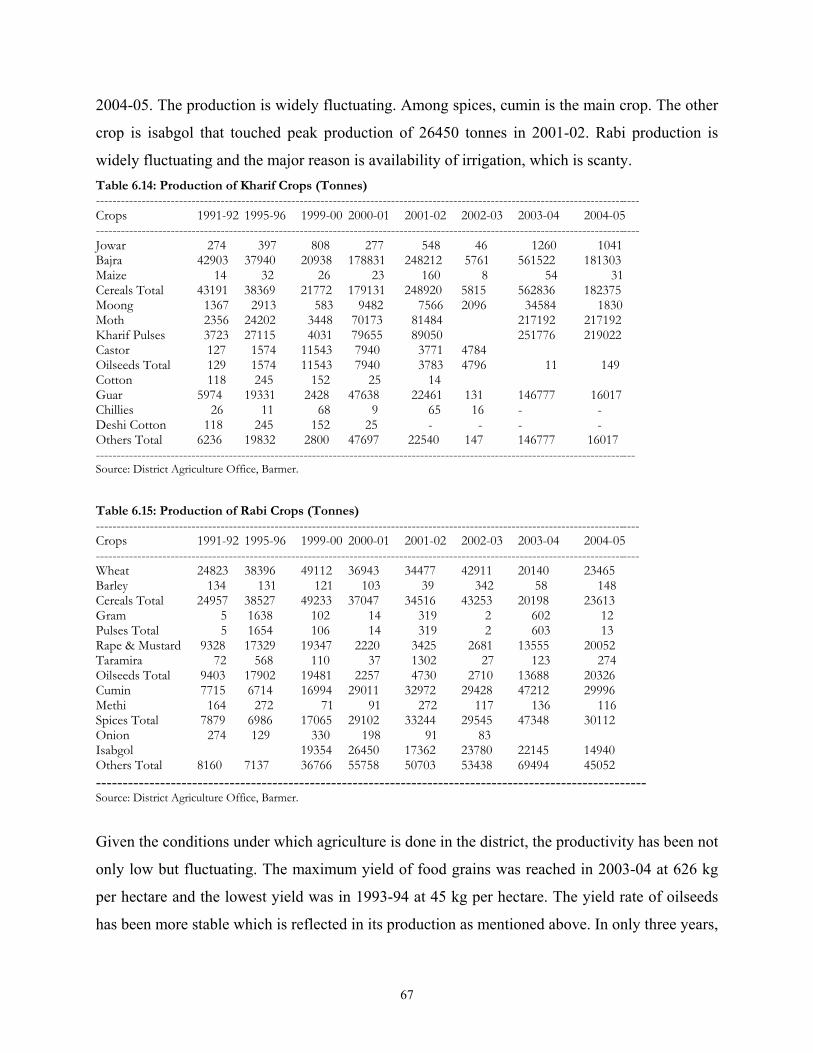
2004-05. The production is widely fluctuating. Among spices, cumin is the main crop. The other
crop is isabgol that touched peak production of 26450 tonnes in 2001-02. Rabi production is
widely fluctuating and the major reason is availability of irrigation, which is scanty. Table 6.14: Production of Kharif Crops (Tonnes) ----------------------------------------------------------------------------------------------------------------------------------- Crops 1991-92 1995-96 1999-00 2000-01 2001-02 2002-03 2003-04 2004-05 ----------------------------------------------------------------------------------------------------------------------------------- Jowar 274 397 808 277 548 46 1260 1041 Bajra 42903 37940 20938 178831 248212 5761 561522 181303 Maize 14 32 26 23 160 8 54 31 Cereals Total 43191 38369 21772 179131 248920 5815 562836 182375 Moong 1367 2913 583 9482 7566 2096 34584 1830 Moth 2356 24202 3448 70173 81484 217192 217192 Kharif Pulses 3723 27115 4031 79655 89050 251776 219022 Castor 127 1574 11543 7940 3771 4784 Oilseeds Total 129 1574 11543 7940 3783 4796 11 149 Cotton 118 245 152 25 14 Guar 5974 19331 2428 47638 22461 131 146777 16017 Chillies 26 11 68 9 65 16 - - Deshi Cotton 118 245 152 25 - - - - Others Total 6236 19832 2800 47697 22540 147 146777 16017 ---------------------------------------------------------------------------------------------------------------------------------- Source: District Agriculture Office, Barmer. Table 6.15: Production of Rabi Crops (Tonnes) ----------------------------------------------------------------------------------------------------------------------------------- Crops 1991-92 1995-96 1999-00 2000-01 2001-02 2002-03 2003-04 2004-05 ----------------------------------------------------------------------------------------------------------------------------------- Wheat 24823 38396 49112 36943 34477 42911 20140 23465 Barley 134 131 121 103 39 342 58 148 Cereals Total 24957 38527 49233 37047 34516 43253 20198 23613 Gram 5 1638 102 14 319 2 602 12 Pulses Total 5 1654 106 14 319 2 603 13 Rape & Mustard 9328 17329 19347 2220 3425 2681 13555 20052 Taramira 72 568 110 37 1302 27 123 274 Oilseeds Total 9403 17902 19481 2257 4730 2710 13688 20326 Cumin 7715 6714 16994 29011 32972 29428 47212 29996 Methi 164 272 71 91 272 117 136 116 Spices Total 7879 6986 17065 29102 33244 29545 47348 30112 Onion 274 129 330 198 91 83 Isabgol 19354 26450 17362 23780 22145 14940 Others Total 8160 7137 36766 55758 50703 53438 69494 45052 ------------------------------------------------------------------------------------------------------- Source: District Agriculture Office, Barmer.
Given the conditions under which agriculture is done in the district, the productivity has been not
only low but fluctuating. The maximum yield of food grains was reached in 2003-04 at 626 kg
per hectare and the lowest yield was in 1993-94 at 45 kg per hectare. The yield rate of oilseeds
has been more stable which is reflected in its production as mentioned above. In only three years,
67
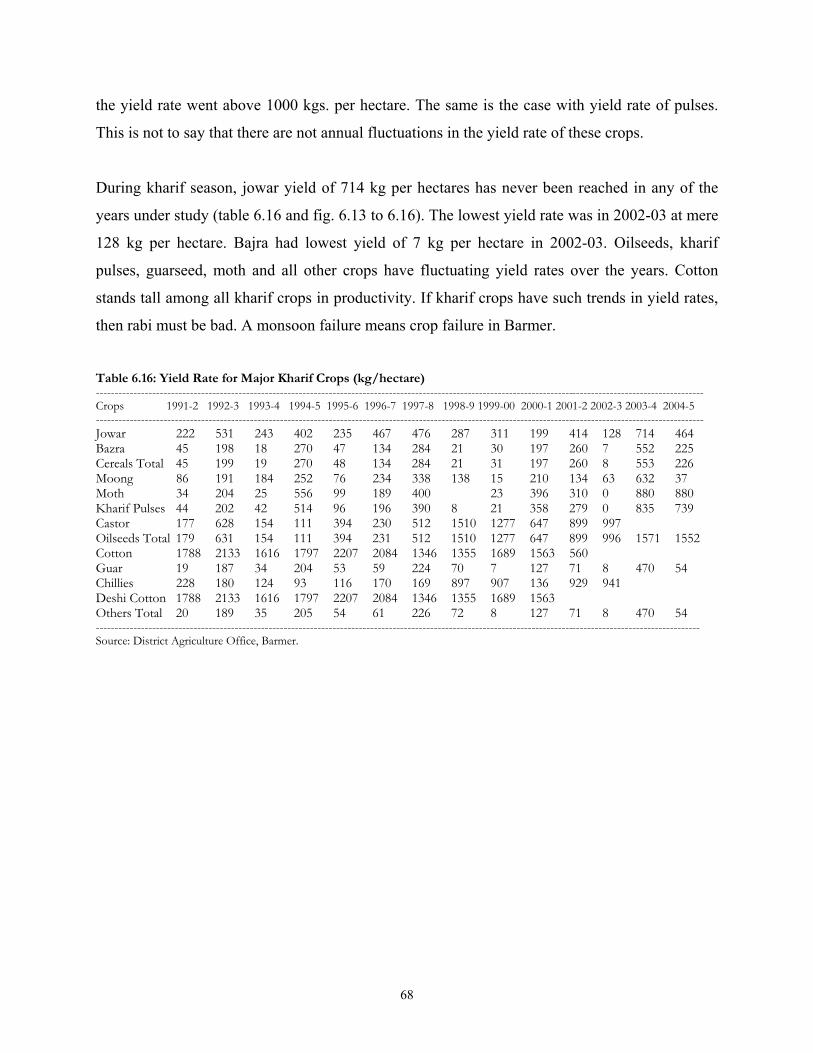
the yield rate went above 1000 kgs. per hectare. The same is the case with yield rate of pulses.
This is not to say that there are not annual fluctuations in the yield rate of these crops.
During kharif season, jowar yield of 714 kg per hectares has never been reached in any of the
years under study (table 6.16 and fig. 6.13 to 6.16). The lowest yield rate was in 2002-03 at mere
128 kg per hectare. Bajra had lowest yield of 7 kg per hectare in 2002-03. Oilseeds, kharif
pulses, guarseed, moth and all other crops have fluctuating yield rates over the years. Cotton
stands tall among all kharif crops in productivity. If kharif crops have such trends in yield rates,
then rabi must be bad. A monsoon failure means crop failure in Barmer.
Table 6.16: Yield Rate for Major Kharif Crops (kg/hectare) ------------------------------------------------------------------------------------------------------------------------------------------------------------------ Crops 1991-2 1992-3 1993-4 1994-5 1995-6 1996-7 1997-8 1998-9 1999-00 2000-1 2001-2 2002-3 2003-4 2004-5 ------------------------------------------------------------------------------------------------------------------------------------------------------------------ Jowar 222 531 243 402 235 467 476 287 311 199 414 128 714 464 Bazra 45 198 18 270 47 134 284 21 30 197 260 7 552 225 Cereals Total 45 199 19 270 48 134 284 21 31 197 260 8 553 226 Moong 86 191 184 252 76 234 338 138 15 210 134 63 632 37 Moth 34 204 25 556 99 189 400 23 396 310 0 880 880 Kharif Pulses 44 202 42 514 96 196 390 8 21 358 279 0 835 739 Castor 177 628 154 111 394 230 512 1510 1277 647 899 997 Oilseeds Total 179 631 154 111 394 231 512 1510 1277 647 899 996 1571 1552 Cotton 1788 2133 1616 1797 2207 2084 1346 1355 1689 1563 560 Guar 19 187 34 204 53 59 224 70 7 127 71 8 470 54 Chillies 228 180 124 93 116 170 169 897 907 136 929 941 Deshi Cotton 1788 2133 1616 1797 2207 2084 1346 1355 1689 1563 Others Total 20 189 35 205 54 61 226 72 8 127 71 8 470 54 ----------------------------------------------------------------------------------------------------------------------------------------------------------------- Source: District Agriculture Office, Barmer.
68
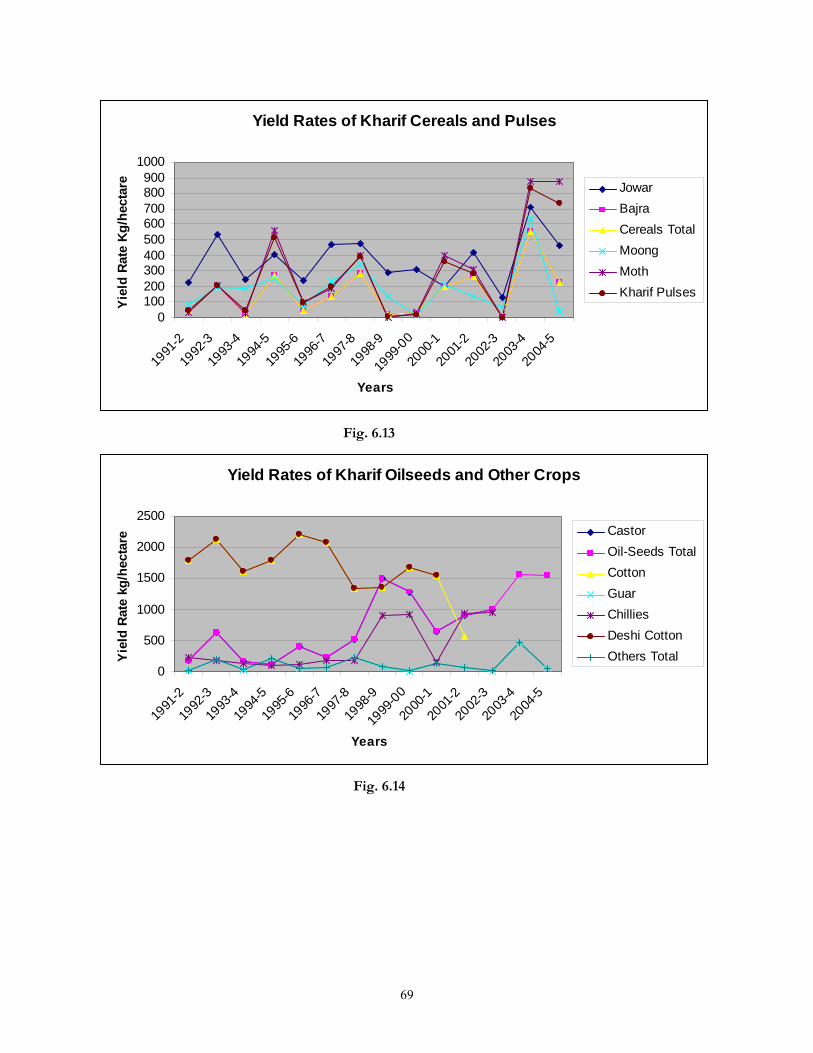
Yield Rates of Kharif Cereals and Pulses
0100200300400500600700800900
1000
1991
-2
1992
-3
1993
-4
1994
-5
1995
-6
1996
-7
1997
-8
1998
-9
1999
-00
2000
-1
2001
-2
2002
-3
2003
-4
2004
-5
Years
Yiel
d Ra
te K
g/he
ctar
e
Jowar BajraCereals Total Moong Moth Kharif Pulses
Fig. 6.13
Yield Rates of Kharif Oilseeds and Other Crops
0
500
1000
1500
2000
2500
1991
-2
1992
-3
1993
-4
1994
-5
1995
-6
1996
-7
1997
-8
1998
-9
1999
-00
2000
-1
2001
-2
2002
-3
2003
-4
2004
-5
Years
Yie
ld R
ate
kg/h
ecta
re Castor Oil-Seeds Total Cotton Guar Chillies Deshi Cotton Others Total
Fig. 6.14
69
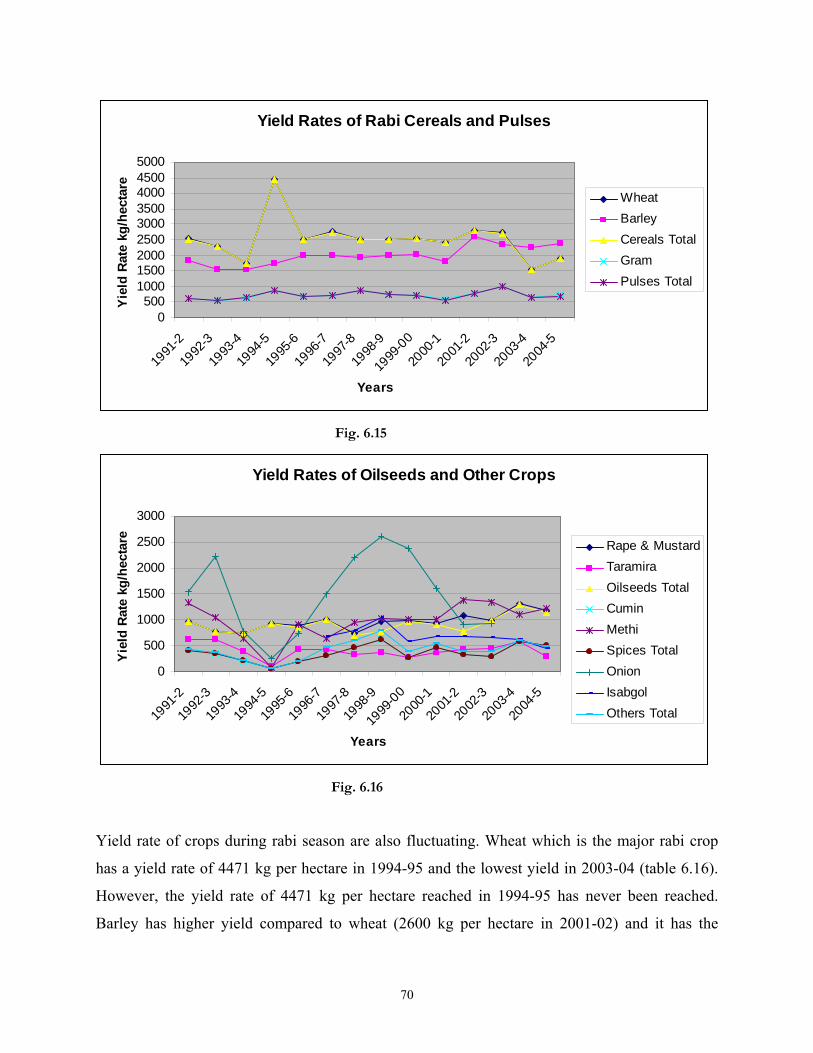
Yield Rates of Rabi Cereals and Pulses
0500
100015002000250030003500400045005000
1991
-2
1992
-3
1993
-4
1994
-5
1995
-6
1996
-7
1997
-8
1998
-9
1999
-00
2000
-1
2001
-2
2002
-3
2003
-4
2004
-5
Years
Yie
ld R
ate
kg/h
ecta
re
Wheat Barley Cereals Total Gram Pulses Total
Fig. 6.15
Yield Rates of Oilseeds and Other Crops
0
500
1000
1500
2000
2500
3000
1991
-2
1992
-3
1993
-4
1994
-5
1995
-6
1996
-7
1997
-8
1998
-9
1999
-00
2000
-1
2001
-2
2002
-3
2003
-4
2004
-5
Years
Yie
ld R
ate
kg/h
ecta
re Rape & MustardTaramira Oilseeds TotalCumin Methi Spices TotalOnion Isabgol Others Total
Fig. 6.16
Yield rate of crops during rabi season are also fluctuating. Wheat which is the major rabi crop
has a yield rate of 4471 kg per hectare in 1994-95 and the lowest yield in 2003-04 (table 6.16).
However, the yield rate of 4471 kg per hectare reached in 1994-95 has never been reached.
Barley has higher yield compared to wheat (2600 kg per hectare in 2001-02) and it has the
70
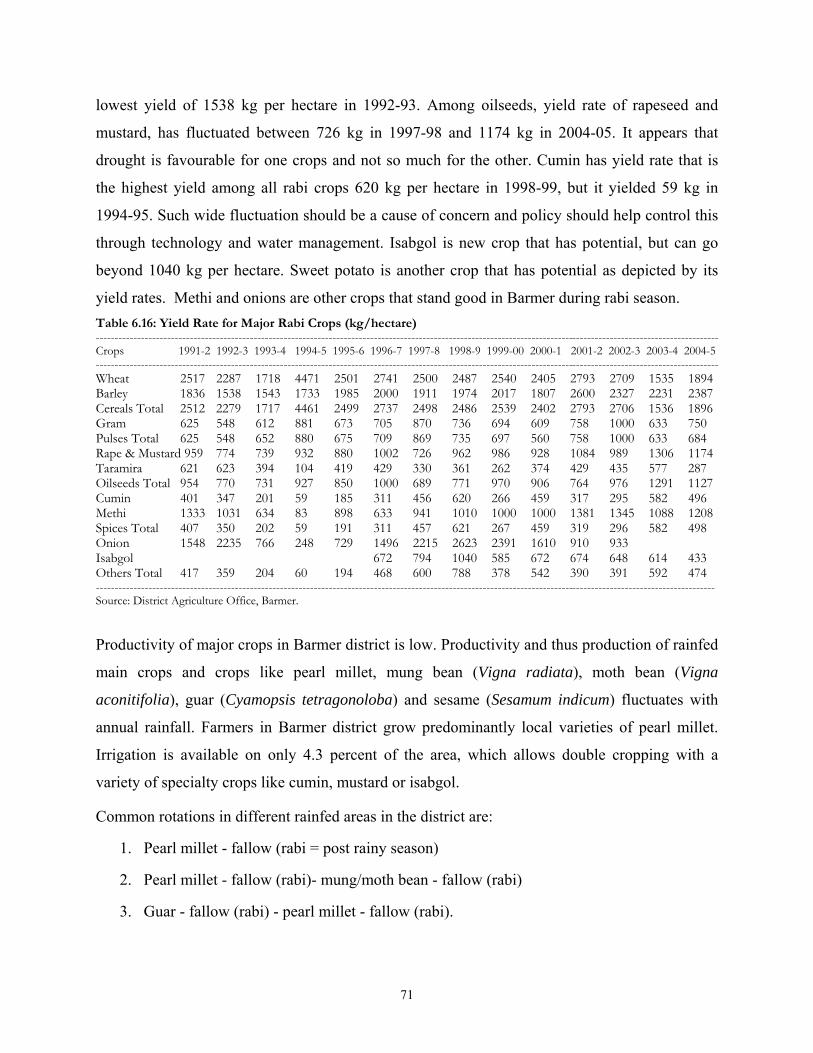
lowest yield of 1538 kg per hectare in 1992-93. Among oilseeds, yield rate of rapeseed and
mustard, has fluctuated between 726 kg in 1997-98 and 1174 kg in 2004-05. It appears that
drought is favourable for one crops and not so much for the other. Cumin has yield rate that is
the highest yield among all rabi crops 620 kg per hectare in 1998-99, but it yielded 59 kg in
1994-95. Such wide fluctuation should be a cause of concern and policy should help control this
through technology and water management. Isabgol is new crop that has potential, but can go
beyond 1040 kg per hectare. Sweet potato is another crop that has potential as depicted by its
yield rates. Methi and onions are other crops that stand good in Barmer during rabi season. Table 6.16: Yield Rate for Major Rabi Crops (kg/hectare) ---------------------------------------------------------------------------------------------------------------------------------------------------------------------- Crops 1991-2 1992-3 1993-4 1994-5 1995-6 1996-7 1997-8 1998-9 1999-00 2000-1 2001-2 2002-3 2003-4 2004-5 ---------------------------------------------------------------------------------------------------------------------------------------------------------------------- Wheat 2517 2287 1718 4471 2501 2741 2500 2487 2540 2405 2793 2709 1535 1894 Barley 1836 1538 1543 1733 1985 2000 1911 1974 2017 1807 2600 2327 2231 2387 Cereals Total 2512 2279 1717 4461 2499 2737 2498 2486 2539 2402 2793 2706 1536 1896 Gram 625 548 612 881 673 705 870 736 694 609 758 1000 633 750 Pulses Total 625 548 652 880 675 709 869 735 697 560 758 1000 633 684 Rape & Mustard 959 774 739 932 880 1002 726 962 986 928 1084 989 1306 1174 Taramira 621 623 394 104 419 429 330 361 262 374 429 435 577 287 Oilseeds Total 954 770 731 927 850 1000 689 771 970 906 764 976 1291 1127 Cumin 401 347 201 59 185 311 456 620 266 459 317 295 582 496 Methi 1333 1031 634 83 898 633 941 1010 1000 1000 1381 1345 1088 1208 Spices Total 407 350 202 59 191 311 457 621 267 459 319 296 582 498 Onion 1548 2235 766 248 729 1496 2215 2623 2391 1610 910 933 Isabgol 672 794 1040 585 672 674 648 614 433 Others Total 417 359 204 60 194 468 600 788 378 542 390 391 592 474 --------------------------------------------------------------------------------------------------------------------------------------------------------------------- Source: District Agriculture Office, Barmer.
Productivity of major crops in Barmer district is low. Productivity and thus production of rainfed
main crops and crops like pearl millet, mung bean (Vigna radiata), moth bean (Vigna
aconitifolia), guar (Cyamopsis tetragonoloba) and sesame (Sesamum indicum) fluctuates with
annual rainfall. Farmers in Barmer district grow predominantly local varieties of pearl millet.
Irrigation is available on only 4.3 percent of the area, which allows double cropping with a
variety of specialty crops like cumin, mustard or isabgol.
Common rotations in different rainfed areas in the district are:
1. Pearl millet - fallow (rabi = post rainy season)
2. Pearl millet - fallow (rabi)- mung/moth bean - fallow (rabi)
3. Guar - fallow (rabi) - pearl millet - fallow (rabi).
71
Guar gum
Since centuries, Barmer, the golden Thar Deserts of Rajasthan, emerged with a perfect blend of heritage in the field of production of guar seeds. The most suitable climatic conditions and soil of the region for the cultivation of Guar seeds play major key role in producing superb quality guar seeds. Just because of the availability of best quality guar seeds Barmer is able to produce BEST quality guargum split (raw material for production of guar gum). A substantial portion of Indian export of guar gum is sourced from Barmer. 80 percent of Guar Gum of world is produced in Rajasthan.
Barmer, with its rich cultivation heritage for guar seeds had been known for its super quality of Guar seeds for the ages. A single company called WestRaj Gum Udyog the exporters of guargum splits observed a quantum jump from zero exports to an exports of more than Rs. 200 crore a year, within a short span of little more than two decades. Barmer has earned a name of its own in the production and export of quality guar gum splits almost all over the world.
What is the per capita situation with regard to food grain production as it affects household
security. Table 6.17 shows that has been fluctuating; it was the maximum in 2004 at 397 kgs and
the lowest in 2003 at just 25 kg. It is also a source of worry that the 1995 was near this per capita
production at 357 kg. The three year moving average per capita production of food grain shows a
little more even situation.
6.4 Livestock
Livestock is a major source of livelihood of people in the desert and also in Barmer. Over the
years, shift in type of animals being reared has taken place in the district. During 1997-2003, the
population of cows has marginally increased by 0.50 percent (table 6.18). However, the major
change occurred in Sheo where the population of cow declined by 13.12 percent. Siwana and
Pachpadra also observed decline in cow population. Again, increases in cow population have
been observed in Baytoo, Gudhamalani, Barmer and Chhotan. The traditional small ruminants
like goat and sheep have observed declines in all the blocks. The decline in goat population is in
the range of 7.18 percent in Gudhamalani and 36.93 percent in Sheo. The decline in sheep
population is in the range of 47.85 percent in Pachpadra and 15.91 percent in Ramsar. There is
significant shift towards buffalo in all blocks in Barmer. This is a very important development
reflecting in regular cash flow through sale of milk. The maximum increase in buffalo population
72
is observed in Baytoo (almost doubled) followed Sheo (130%). The lowest increase is in case of
Pachpadra. At the district level buffalo population has increased by 41.54 percent. The camel
population in the district has declined in all blocks. A disturbing trend is visible in the sense that
livestock economy of the district is observing a declining importance. Milch animal role in
livestock economy has increased though. Table 6.17: Per Capita Food grain: Kgs. -------------------------------------------------------------------- Years Per Capita 3Yrs MA Foodgrain
------------------------------------------------------------------- 1992 51 1993 207 98 1994 37 200 1995 357 159 1996 82 197 1997 152 174 1998 290 159 1999 36 123 2000 44 90 2001 191 140 2002 186 134 2003 25 203 2004 397 207 2005 198 ------------------------------------------------------------------ Source: Calculated. Table 6.18: Percentage Change: 1997-2003 ------------------------------------------------------------------------------------------------------------------ Blocks Barmer Ramsar Baytoo Sheo Gudha Chhotan Siwana Pachpadra District malani ------------------------------------------------------------------------------------------------------------------ Cow 0.73 24.40 23.95 -13.12 10.29 1.50 -22.82 -2.93 0.50 Buffalo 62.63 88.79 184.82 129.95 55.01 77.89 21.19 17.79 41.54 Sheep -24.53 -15.91 -23.37 -35.47 -16.58 -31.87 -35.39 -47.85 -30.40 Goat -11.46 -26.52 -15.71 -36.93 -7.18 -23.01 -22.89 -19.31 -20.72 Camel -38.07 -32.98 -29.60 -40.88 -35.93 -43.40 -46.48 -24.38 -37.69 Others 242.12 28.39 442.54 58.08 658.39 114.47 522.63 391.17 -216.36 Total -11.78 -16.33 -11.41 -31.24 -3.47 -21.17 -20.41 -22.72 -17.98 ------------------------------------------------------------------------------------------------------------------ Source: District Profile, Barmer 2004.
It is also interesting to observe changes in livestock in Barmer district over different periods.
Table 6.19 shows that the changes in livestock holding in Barmer was adverse during 1997-2003
period when in all blocks observed a decline in livestock. During 1992-1997, on the other hand
all blocks witnessed a positive growth in livestock. This can only be ascribed to severe drought
73
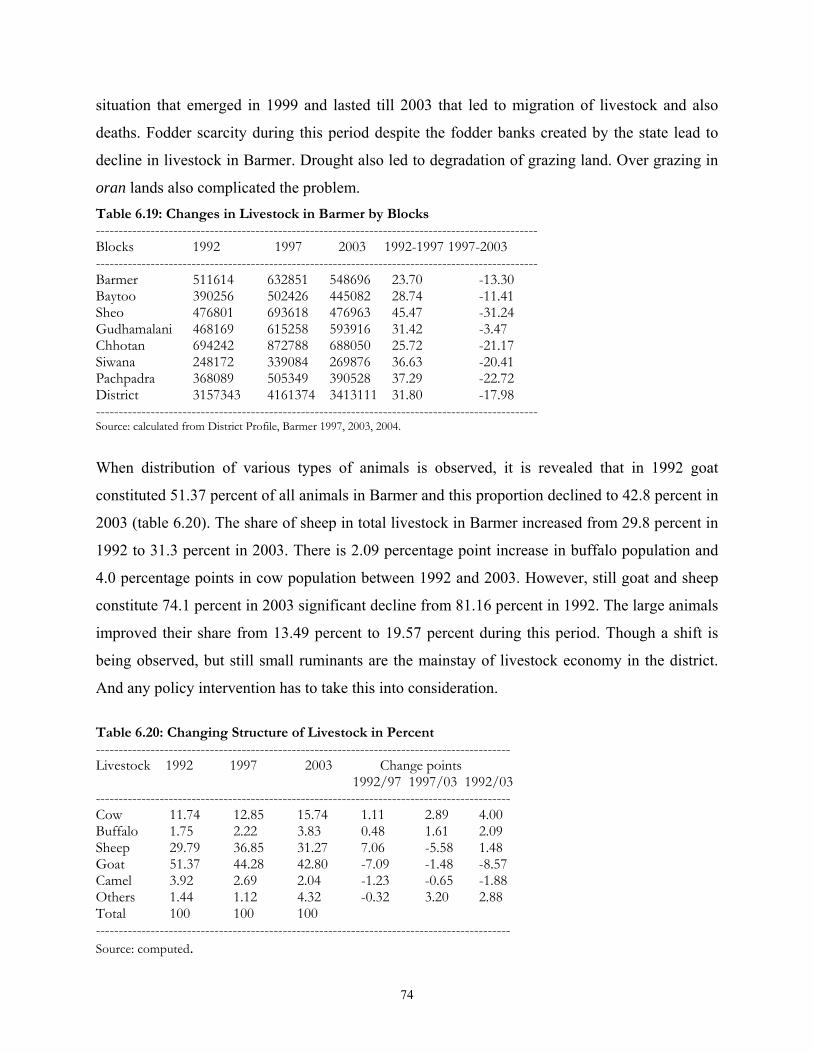
situation that emerged in 1999 and lasted till 2003 that led to migration of livestock and also
deaths. Fodder scarcity during this period despite the fodder banks created by the state lead to
decline in livestock in Barmer. Drought also led to degradation of grazing land. Over grazing in
oran lands also complicated the problem. Table 6.19: Changes in Livestock in Barmer by Blocks ------------------------------------------------------------------------------------------------- Blocks 1992 1997 2003 1992-1997 1997-2003 ------------------------------------------------------------------------------------------------- Barmer 511614 632851 548696 23.70 -13.30 Baytoo 390256 502426 445082 28.74 -11.41 Sheo 476801 693618 476963 45.47 -31.24 Gudhamalani 468169 615258 593916 31.42 -3.47 Chhotan 694242 872788 688050 25.72 -21.17 Siwana 248172 339084 269876 36.63 -20.41 Pachpadra 368089 505349 390528 37.29 -22.72 District 3157343 4161374 3413111 31.80 -17.98 ------------------------------------------------------------------------------------------------- Source: calculated from District Profile, Barmer 1997, 2003, 2004.
When distribution of various types of animals is observed, it is revealed that in 1992 goat
constituted 51.37 percent of all animals in Barmer and this proportion declined to 42.8 percent in
2003 (table 6.20). The share of sheep in total livestock in Barmer increased from 29.8 percent in
1992 to 31.3 percent in 2003. There is 2.09 percentage point increase in buffalo population and
4.0 percentage points in cow population between 1992 and 2003. However, still goat and sheep
constitute 74.1 percent in 2003 significant decline from 81.16 percent in 1992. The large animals
improved their share from 13.49 percent to 19.57 percent during this period. Though a shift is
being observed, but still small ruminants are the mainstay of livestock economy in the district.
And any policy intervention has to take this into consideration.
Table 6.20: Changing Structure of Livestock in Percent ------------------------------------------------------------------------------------------- Livestock 1992 1997 2003 Change points 1992/97 1997/03 1992/03 ------------------------------------------------------------------------------------------- Cow 11.74 12.85 15.74 1.11 2.89 4.00 Buffalo 1.75 2.22 3.83 0.48 1.61 2.09 Sheep 29.79 36.85 31.27 7.06 -5.58 1.48 Goat 51.37 44.28 42.80 -7.09 -1.48 -8.57 Camel 3.92 2.69 2.04 -1.23 -0.65 -1.88 Others 1.44 1.12 4.32 -0.32 3.20 2.88 Total 100 100 100 ------------------------------------------------------------------------------------------- Source: computed.
74
Initiatives of Cairns in Barmer
Cairns when set its foot on the soil of Barmer to explore oil, it took projects under Corporate Social Responsibility and its dairy project is one the major programme. The breed improvement programme, which is a part of the Dairy initiative, was also launched with the presentation of a good breed bull to one of the Self Help Groups. The project aims to increase the income of rural milk producers by facilitating the establishment of a collection network of milk in the villages and bulk milk sales to the end user and thus providing the farmers an assured and remunerative outlet for their milk.
On average more than 750 litres of milk is now being collected from 10 centres and is being sold to the Government of Rajasthan state dairy-SARAS. The project is ongoing in 10 villages including Naya Nagar, Dhandlawaas, Adarsh Nagar, Raawli Naadi and Maliyon Ki Dhani with a goal to create gainful employment in rural areas. In September 2007, more than 17,000 litres of milk was being supplied to Saras- the Rajasthan Government’s Dairy Cooperative.
“For us it is like fortune has knocked upon our door,” said Mukna Ram a resident of village Raawli Naadi where the dairy collection centre had started making it the fifth village connected to the project.
Livestock breeding has been the traditional subsistence strategy in western Rajasthan. It is an important source of income for sections of the community in the rural areas with limited or no land resources.
As part of IFC- Cairn India Linkage Programme, activities have been started to support the dairy development initiative in a number of villages in the Barmer district. The NGO– Society to Uplift Rural Economy (SURE), Barmer- is responsible for implementing the programme.
Key Components of the project include organization and capacity building of milk producers, improving quality standards of milk, linking increased supply of milk production to remunerative outlets, facilitating value addition through linkages with existing government schemes, undertaking breed and fodder improvement programmes and linkages with Banks for microfinance/ cattle insurance.
To date, the total milk collection centers set up under the Dairy Development Project is ten with a membership base of 475 dairy farmers. To establish milk collection centres in the Northern area, community consultation has started in Chokhla and Bhadhkha villages. Recently, under the cattle care component of the project, vaccination of cattle was carried out in 6 villages benefiting more than 500 cattle in the Nagar and Guda areas. Mineral mixtures and cattle feed have also been provided.
75
In the Rajasthan’s neighboring state Gujarat, villagers had set a sterling example of a co-operative organization's success which today is simply called- Amul. In January this year, villagers in the southern part of Barmer witnessed a small but firm step towards the dairy movement. The dairy pilot project was inaugurated on 15th January 2007 and for beneficiaries, it is like tasting the start of white revolution in the area. The cooler facility launched on Tuesday is expected to aid in collection and storage of the ‘evening milk’ from the villages which were largely going untapped because of the absence of adequate chilling and storage facilities.
In 2006-07, Barmer had 55 veterinary hospitals and three dispensaries. There were 47 sub
centres, 38 artificial insemination centres, 18 gaushalas benefiting 9862 animals.
Milk production, which is a major source of income in rural areas, was recorded at 3.08 lakh
tonnes in 2004-05. This mainly was cow milk followed by goat milk and then buffalo milk. This
is reflected by the animal holding in the district.
As Barmer has large sheep population, total wool production in 2004-05 was 19.39 lakh kg.
MALLINATH FAIR, TILWARA (MAR-APR) Mallinath Fair is one of the biggest cattle fairs of Rajasthan held annually near Tilwara (Tilwara is a rail-head on the Jodhpur-Barmer route), a village in Barmer district from Chaitra Budi Ekadashiio Chaitra Sudi Ekadashi (March-April). It lasts for a fortnight wherein the highly popular breeds of cows, camels, sheep, goats and horses attract Portrait of Mallinathji people. The fair is believed to have originated from transactions, which took place among admirers of Rawal Mallinath, a local hero traveling to Tilwara on well-bred animals to meet him. People make offerings of sweets and once their wishes are fulfilled, they offer miniature horses at the shrine. There are races organized of bullock, camel and horses. The prize- winning animals, sport white badges and command high prices.
6.5 Industries Barmer has very limited industries. In 2003-04, as per the Annual Survey of Industries, there
were 139 factories with Rs.3261 lakh fixed capital employing 2629 workers, 390 employees or
3109 total employees. These industries gross of value output of Rs.9644 lakh and net value
added of Rs.(-)15178. As far as structure of industrial scene is concerned, Barmer had 129
factories relating to spinning, weaving and finishing of textiles. The factories were manufacture
76
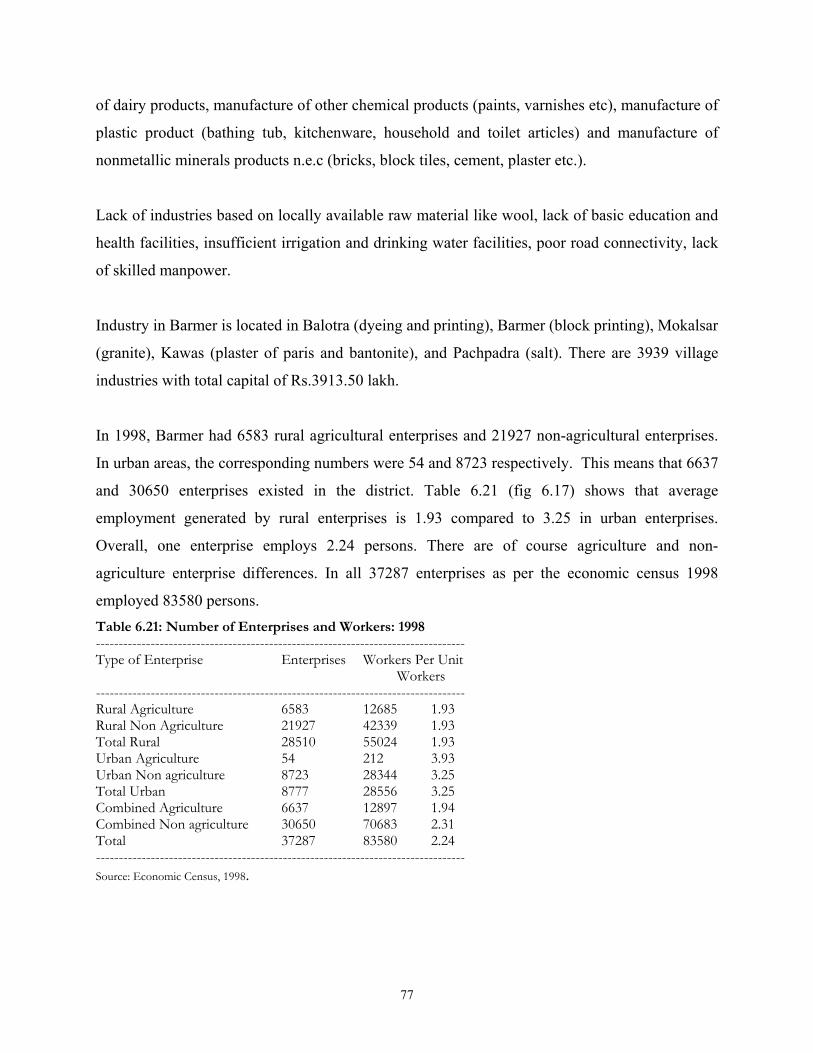
of dairy products, manufacture of other chemical products (paints, varnishes etc), manufacture of
plastic product (bathing tub, kitchenware, household and toilet articles) and manufacture of
nonmetallic minerals products n.e.c (bricks, block tiles, cement, plaster etc.).
Lack of industries based on locally available raw material like wool, lack of basic education and
health facilities, insufficient irrigation and drinking water facilities, poor road connectivity, lack
of skilled manpower.
Industry in Barmer is located in Balotra (dyeing and printing), Barmer (block printing), Mokalsar
(granite), Kawas (plaster of paris and bantonite), and Pachpadra (salt). There are 3939 village
industries with total capital of Rs.3913.50 lakh.
In 1998, Barmer had 6583 rural agricultural enterprises and 21927 non-agricultural enterprises.
In urban areas, the corresponding numbers were 54 and 8723 respectively. This means that 6637
and 30650 enterprises existed in the district. Table 6.21 (fig 6.17) shows that average
employment generated by rural enterprises is 1.93 compared to 3.25 in urban enterprises.
Overall, one enterprise employs 2.24 persons. There are of course agriculture and non-
agriculture enterprise differences. In all 37287 enterprises as per the economic census 1998
employed 83580 persons. Table 6.21: Number of Enterprises and Workers: 1998 --------------------------------------------------------------------------------- Type of Enterprise Enterprises Workers Per Unit Workers --------------------------------------------------------------------------------- Rural Agriculture 6583 12685 1.93 Rural Non Agriculture 21927 42339 1.93 Total Rural 28510 55024 1.93 Urban Agriculture 54 212 3.93 Urban Non agriculture 8723 28344 3.25 Total Urban 8777 28556 3.25 Combined Agriculture 6637 12897 1.94 Combined Non agriculture 30650 70683 2.31 Total 37287 83580 2.24 --------------------------------------------------------------------------------- Source: Economic Census, 1998.
77
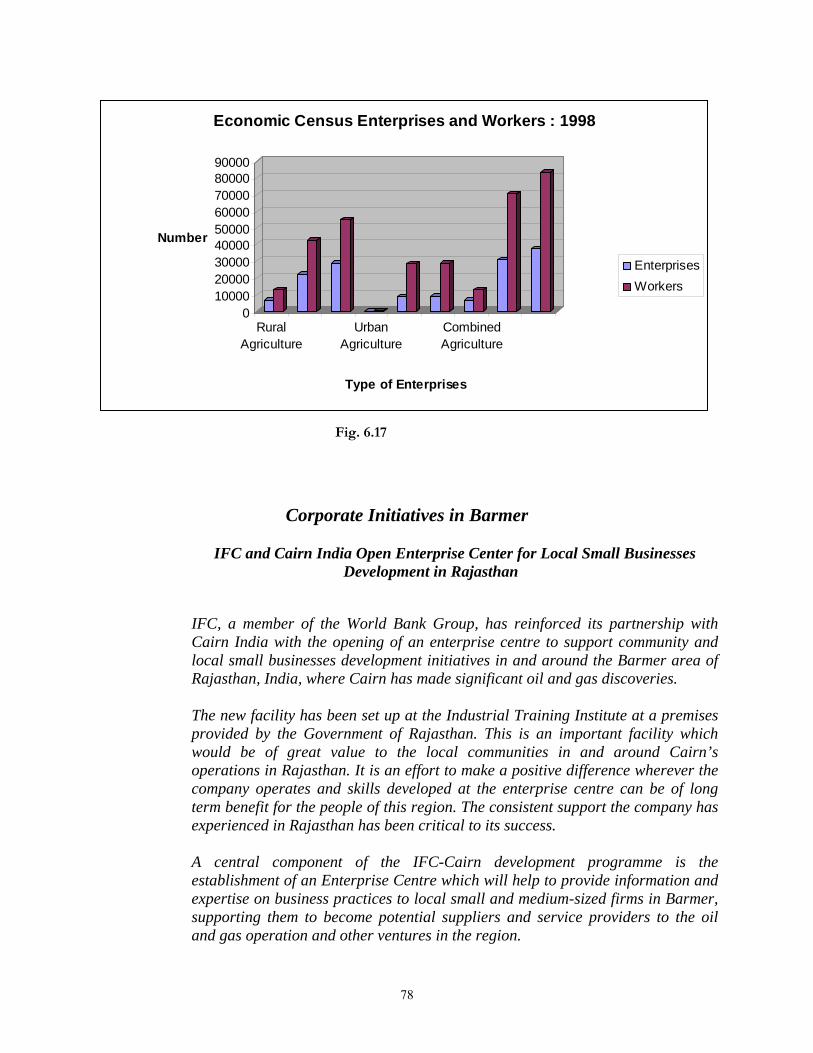
0100002000030000400005000060000700008000090000
Number
RuralAgriculture
UrbanAgriculture
CombinedAgriculture
Type of Enterprises
Economic Census Enterprises and Workers : 1998
EnterprisesWorkers
Fig. 6.17
Corporate Initiatives in Barmer
IFC and Cairn India Open Enterprise Center for Local Small Businesses Development in Rajasthan
IFC, a member of the World Bank Group, has reinforced its partnership with Cairn India with the opening of an enterprise centre to support community and local small businesses development initiatives in and around the Barmer area of Rajasthan, India, where Cairn has made significant oil and gas discoveries.
The new facility has been set up at the Industrial Training Institute at a premises provided by the Government of Rajasthan. This is an important facility which would be of great value to the local communities in and around Cairn’s operations in Rajasthan. It is an effort to make a positive difference wherever the company operates and skills developed at the enterprise centre can be of long term benefit for the people of this region. The consistent support the company has experienced in Rajasthan has been critical to its success.
A central component of the IFC-Cairn development programme is the establishment of an Enterprise Centre which will help to provide information and expertise on business practices to local small and medium-sized firms in Barmer, supporting them to become potential suppliers and service providers to the oil and gas operation and other ventures in the region.
78
“IFC’s goal is to make a difference by reducing poverty in emerging markets. Company believes that the private sector is key to development since it is the most important engine for growth and job creation,” “The Enterprise Centre, the Rural Dairy Development project and the Child and Maternal Health Initiative are an outcome of the IFC-Cairn partnership and exemplify the larger role that the private sector needs to play in emerging economies.” The Enterprise Centre will help local firms become suppliers to Cairn and other businesses. These firms will in turn create jobs and generate other opportunities to support communities across the Barmer region.”
IFC and Cairn India’s partnership aims to leverage the company’s investments in the region. The two institutions signed a Linkages Cooperation Agreement in June 2007 to design, fund, and implement sustainable socio-economic development programmes in Rajasthan over a three-year period. The programme includes an enterprise center for local development and vocational skills training, a rural dairy project to create alternative income-generating activities for rural households, and a child and maternal health awareness project for women and children in rural areas.
IFC will spearhead and manage operations at the Enterprise Centre, sharing its knowledge and experience from similar initiatives in Azerbaijan, Chad, Mozambique, and Peru. IFC will also adapt the project to the local environment. The International Centre for Entrepreneurship and Career Development together with the Centre for Development and Population Activities and Society to Uplift Rural Economy will implement the activities.
The center’s objectives are to: Develop skills within local communities in and around Barmer, including households that are affected by the project, to enhance employability
Provide business development services to build the capacities of local micro, small, and medium enterprises and facilitate business and market linkages
Develop capacities of MSMEs to become local suppliers to Cairn India and its contractors
Facilitate access to finance for SMEs and micro-entrepreneurs, helping establish and expand their businesses
Collect and disseminate information on employment opportunities, enterprise development, government schemes, and potential contracts and tenders The Center’s village-level activities began in August 2007, with basic skills training in construction-related trades, including masonry, fabrication, carpentry, electricals, and plumbing. Training was also provided in handicrafts, the
79
traditional skill of the area. By the end of the year, the programme had helped more than 1000 people, including 450 women who are working with local handicraft entrepreneurs and earning incomes for the first time. Linkages with existing contractors are underway, helping create jobs for the trainees. The SME development training has also been well received by local textile entrepreneurs. Over 88 enterprises have participated in capacity-building workshops on better techniques for dyeing and printing.
Rural Dairy Development
A second component of the IFC-Cairn India Linkage Programme provides rural families with an alternative source of income by supporting traditional dairy activities. The project targets marginalized dairy farmers who produce up to three litres of surplus milk. This unique feature allows 20 farmers from each village to work collectively to turn their product into a marketable commodity. Activities that have been implemented include:
The Society to Uplift Rural Economy (SURE) in Barmer was identified as the implementing partner, and a memorandum of understanding was signed to begin implementation.
Detailed livestock surveys were carried out, and villages were selected for the launch and expansion of the dairy project.
The project was launched in January 2007 in two villages. By year end the project had initiated milk collection and sale activities in 13 villages in the northern and southern areas of the Rajasthan block.
Linkages were established with the Rajasthan government dairy cooperative, Saras, to sell milk and provide value-added services, such as fodder, mineral supplement, and veterinary care.
Self-help groups have been formed in each village to execute the project, with regular capacity-building programs underway.
A bulk milk chilling plant was inaugurated in the Naya Nagar village of the Cairn Guda block to aid collection, storage, and sale of milk.
By the end of 2007, more than 600 dairy farmers were registered in the 13 Self-Help Groups, recording an average monthly income of 1,200 rupees per household.
6.6 Employment Guarantee Scheme
The scheme was implemented in the district during the 2007-08. There are 284796 rural
80
households as per the 2001 census and 374604 job cards were issued constituting 131.53 percent
of rural households. This means more than one card in some households. During the year
employment demanded was by 277595 persons and the same were provided employment which
is 100 percent of employment demanded. There were 74505 families that completed 100 days
were provide 100 days work constituting 26.8 percent of employment provided. In all 175.3 lakh
person days employment was created (table 6.22). On social component of the programme, 31.7
lakh scheduled caste person days employment was created (18.07%), while 16.6 lakh scheduled
tribe person days employment was created (9.5%). Women are mainly working in this
programme and 106.8 lakh women days employment was created (60.9%) and 127 lakh person
days employment for other category (72.4%). The average days of employment created was 63.2
days. During the year, centre released Rs.9827.82 lakh worth fund and the state contributed
Rs.1125.10 lakh. Thus total fund available were Rs.11532.38 lakh. Wages of unskilled amounted
to Rs.11492.50 or 60.75 percent, while wages of semi- and skilled wage Rs.659.98 constituting
3.49 percent share. The material cost stood at Rs.6237.68 lakh which was 32.97 percent of total
cost. Contingencies were around Rs.528.93 lakh or 2.8 percent. The total funds constituted
Rs.18919.09 lakh or 164.05 percent. During the period there was a negative balance of Rs.-
7387.71. The minimum wage stood at Rs.73 and the average wage per person per day was
estimated to be Rs.65.55 giving a cost of one day employment of Rs.107.91. Table 6.22: Works Completed in Barmer through NREGA ------------------------------------------------------------------------------------------------------------------------------------------------Works Completed Units Ongoing Unit Total Unit ------------------------------------------------------------------------------------------------------------------------------------------------ Water Conservation & Harvesting 407 6600 1867 20000 2274 26600 cu.mt Micro irrigation works 3 2 8 11 2 km Renovation of traditional bodies 31 19000 150 9900 181 28900 cu mt Flood Control & protection 30 41 71 km Rural Roads 123 175 1182 941 1305 1116 km Drought Proofing 4 15 19 hectare Provision of irrigation facility To land owned by pvt. 6620 3972 8861 11105 15481 15077 hectare Land Development 11 164930 11 164930 hectare Total 7218 12135 19353 ------------------------------------------------------------------------------------------------------------------------------------------------ Source: NREGA website. During the year 2007-08, 19353 projects were undertaken in the district. Of these 7218 were
completed and 12135 were on-going. The major projects undertaken belonged to provisioning of
irrigation facility to privately land owned, especially of SC/ST (79.99% projects). It is followed
by water conservation and water harvesting projects (11.75% projects) and rural roads (6.74%
81
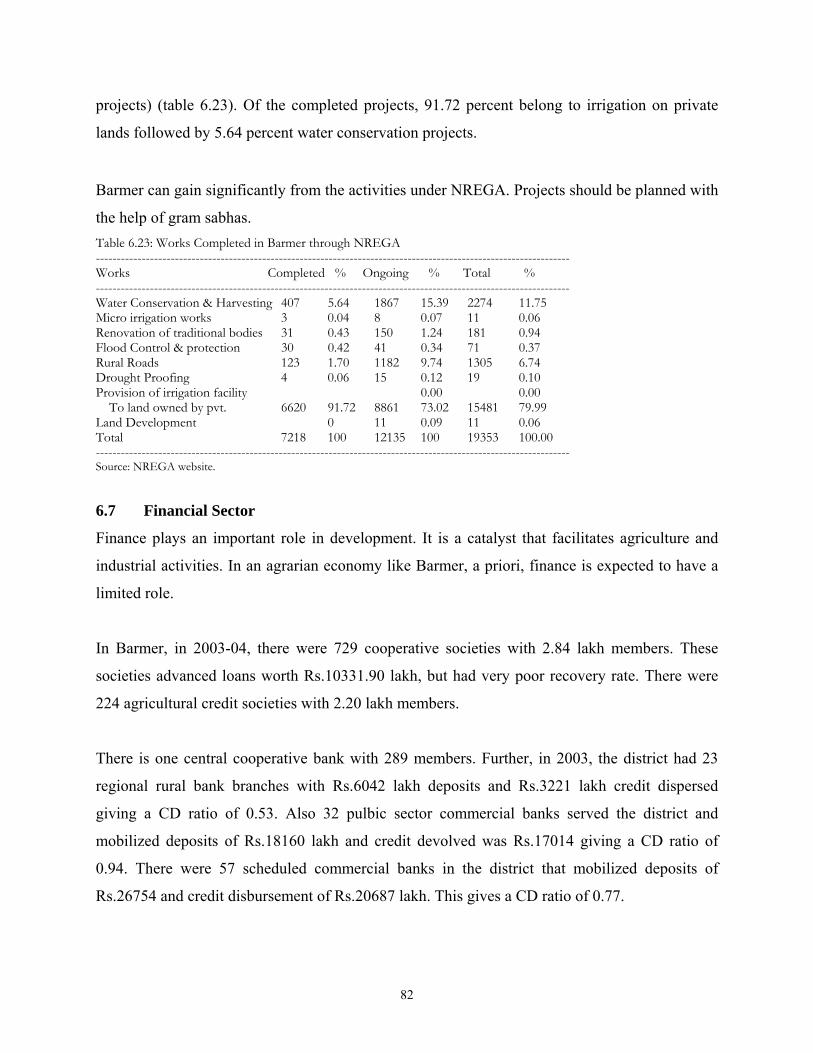
projects) (table 6.23). Of the completed projects, 91.72 percent belong to irrigation on private
lands followed by 5.64 percent water conservation projects. Barmer can gain significantly from the activities under NREGA. Projects should be planned with
the help of gram sabhas. Table 6.23: Works Completed in Barmer through NREGA ------------------------------------------------------------------------------------------------------------------ Works Completed % Ongoing % Total % ------------------------------------------------------------------------------------------------------------------ Water Conservation & Harvesting 407 5.64 1867 15.39 2274 11.75 Micro irrigation works 3 0.04 8 0.07 11 0.06 Renovation of traditional bodies 31 0.43 150 1.24 181 0.94 Flood Control & protection 30 0.42 41 0.34 71 0.37 Rural Roads 123 1.70 1182 9.74 1305 6.74 Drought Proofing 4 0.06 15 0.12 19 0.10 Provision of irrigation facility 0.00 0.00 To land owned by pvt. 6620 91.72 8861 73.02 15481 79.99 Land Development 0 11 0.09 11 0.06 Total 7218 100 12135 100 19353 100.00 ------------------------------------------------------------------------------------------------------------------ Source: NREGA website.
6.7 Financial Sector
Finance plays an important role in development. It is a catalyst that facilitates agriculture and
industrial activities. In an agrarian economy like Barmer, a priori, finance is expected to have a
limited role.
In Barmer, in 2003-04, there were 729 cooperative societies with 2.84 lakh members. These
societies advanced loans worth Rs.10331.90 lakh, but had very poor recovery rate. There were
224 agricultural credit societies with 2.20 lakh members.
There is one central cooperative bank with 289 members. Further, in 2003, the district had 23
regional rural bank branches with Rs.6042 lakh deposits and Rs.3221 lakh credit dispersed
giving a CD ratio of 0.53. Also 32 pulbic sector commercial banks served the district and
mobilized deposits of Rs.18160 lakh and credit devolved was Rs.17014 giving a CD ratio of
0.94. There were 57 scheduled commercial banks in the district that mobilized deposits of
Rs.26754 and credit disbursement of Rs.20687 lakh. This gives a CD ratio of 0.77.
82
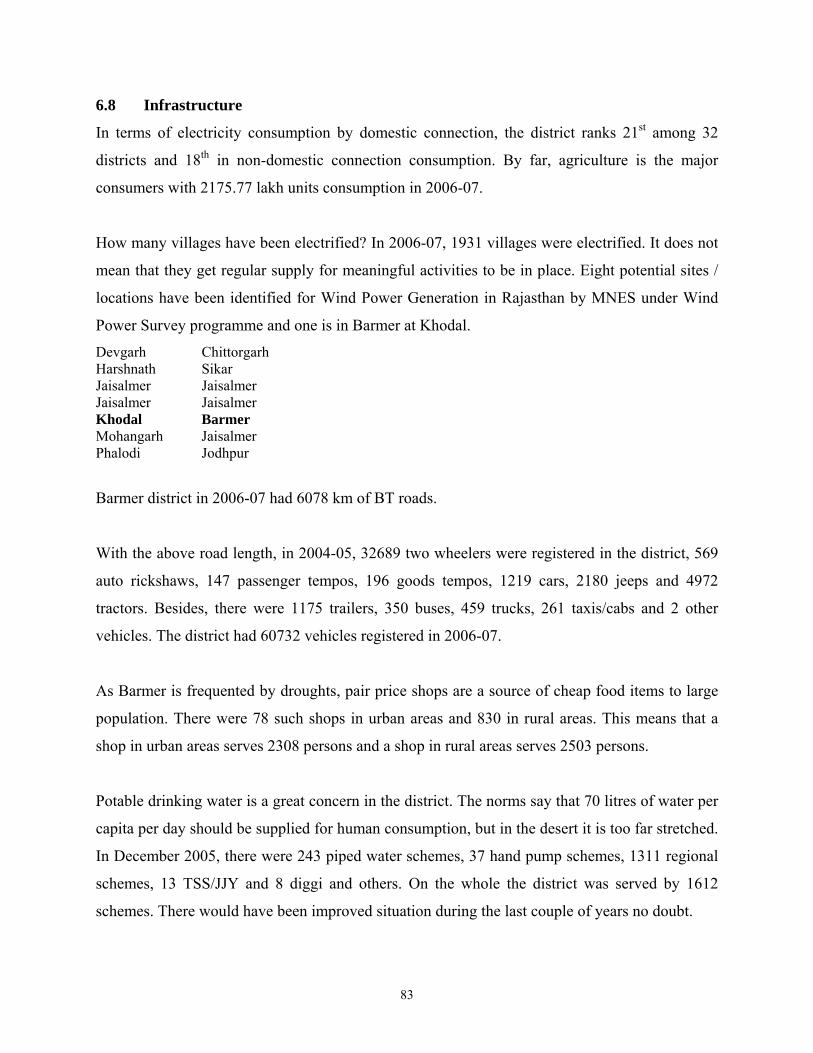
6.8 Infrastructure
In terms of electricity consumption by domestic connection, the district ranks 21st among 32
districts and 18th in non-domestic connection consumption. By far, agriculture is the major
consumers with 2175.77 lakh units consumption in 2006-07.
How many villages have been electrified? In 2006-07, 1931 villages were electrified. It does not
mean that they get regular supply for meaningful activities to be in place. Eight potential sites /
locations have been identified for Wind Power Generation in Rajasthan by MNES under Wind
Power Survey programme and one is in Barmer at Khodal.
Devgarh Chittorgarh Harshnath Sikar Jaisalmer Jaisalmer Jaisalmer Jaisalmer Khodal Barmer Mohangarh Jaisalmer Phalodi Jodhpur
Barmer district in 2006-07 had 6078 km of BT roads.
With the above road length, in 2004-05, 32689 two wheelers were registered in the district, 569
auto rickshaws, 147 passenger tempos, 196 goods tempos, 1219 cars, 2180 jeeps and 4972
tractors. Besides, there were 1175 trailers, 350 buses, 459 trucks, 261 taxis/cabs and 2 other
vehicles. The district had 60732 vehicles registered in 2006-07.
As Barmer is frequented by droughts, pair price shops are a source of cheap food items to large
population. There were 78 such shops in urban areas and 830 in rural areas. This means that a
shop in urban areas serves 2308 persons and a shop in rural areas serves 2503 persons.
Potable drinking water is a great concern in the district. The norms say that 70 litres of water per
capita per day should be supplied for human consumption, but in the desert it is too far stretched.
In December 2005, there were 243 piped water schemes, 37 hand pump schemes, 1311 regional
schemes, 13 TSS/JJY and 8 diggi and others. On the whole the district was served by 1612
schemes. There would have been improved situation during the last couple of years no doubt.
83
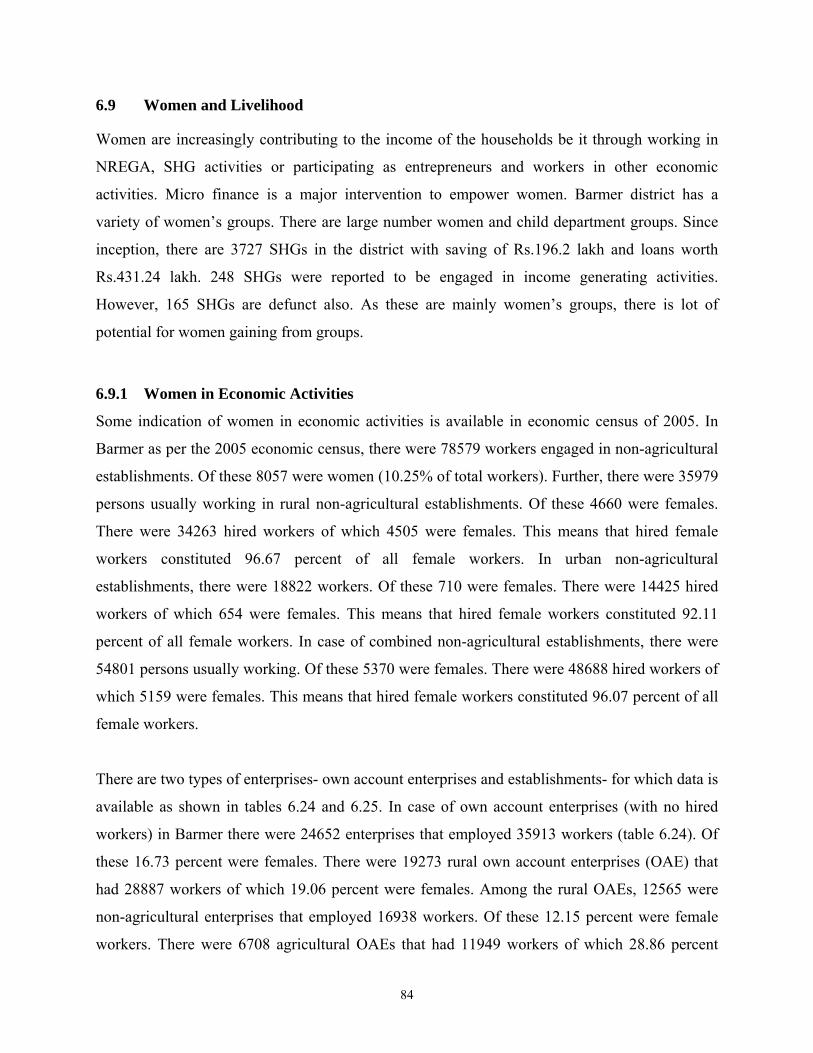
6.9 Women and Livelihood
Women are increasingly contributing to the income of the households be it through working in
NREGA, SHG activities or participating as entrepreneurs and workers in other economic
activities. Micro finance is a major intervention to empower women. Barmer district has a
variety of women’s groups. There are large number women and child department groups. Since
inception, there are 3727 SHGs in the district with saving of Rs.196.2 lakh and loans worth
Rs.431.24 lakh. 248 SHGs were reported to be engaged in income generating activities.
However, 165 SHGs are defunct also. As these are mainly women’s groups, there is lot of
potential for women gaining from groups.
6.9.1 Women in Economic Activities
Some indication of women in economic activities is available in economic census of 2005. In
Barmer as per the 2005 economic census, there were 78579 workers engaged in non-agricultural
establishments. Of these 8057 were women (10.25% of total workers). Further, there were 35979
persons usually working in rural non-agricultural establishments. Of these 4660 were females.
There were 34263 hired workers of which 4505 were females. This means that hired female
workers constituted 96.67 percent of all female workers. In urban non-agricultural
establishments, there were 18822 workers. Of these 710 were females. There were 14425 hired
workers of which 654 were females. This means that hired female workers constituted 92.11
percent of all female workers. In case of combined non-agricultural establishments, there were
54801 persons usually working. Of these 5370 were females. There were 48688 hired workers of
which 5159 were females. This means that hired female workers constituted 96.07 percent of all
female workers.
There are two types of enterprises- own account enterprises and establishments- for which data is
available as shown in tables 6.24 and 6.25. In case of own account enterprises (with no hired
workers) in Barmer there were 24652 enterprises that employed 35913 workers (table 6.24). Of
these 16.73 percent were females. There were 19273 rural own account enterprises (OAE) that
had 28887 workers of which 19.06 percent were females. Among the rural OAEs, 12565 were
non-agricultural enterprises that employed 16938 workers. Of these 12.15 percent were female
workers. There were 6708 agricultural OAEs that had 11949 workers of which 28.86 percent
84
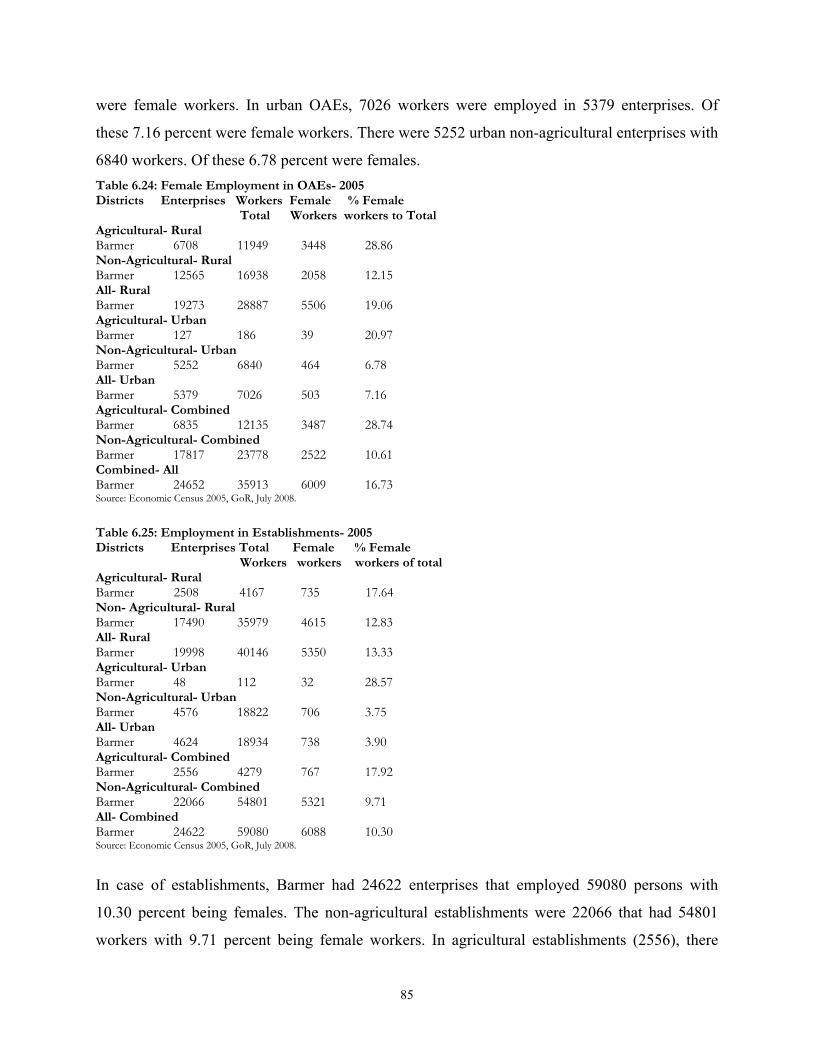
were female workers. In urban OAEs, 7026 workers were employed in 5379 enterprises. Of
these 7.16 percent were female workers. There were 5252 urban non-agricultural enterprises with
6840 workers. Of these 6.78 percent were females. Table 6.24: Female Employment in OAEs- 2005 Districts Enterprises Workers Female % Female Total Workers workers to Total Agricultural- Rural Barmer 6708 11949 3448 28.86 Non-Agricultural- Rural Barmer 12565 16938 2058 12.15 All- Rural Barmer 19273 28887 5506 19.06 Agricultural- Urban Barmer 127 186 39 20.97 Non-Agricultural- Urban Barmer 5252 6840 464 6.78 All- Urban Barmer 5379 7026 503 7.16 Agricultural- Combined Barmer 6835 12135 3487 28.74 Non-Agricultural- Combined Barmer 17817 23778 2522 10.61 Combined- All Barmer 24652 35913 6009 16.73 Source: Economic Census 2005, GoR, July 2008.
Table 6.25: Employment in Establishments- 2005 Districts Enterprises Total Female % Female Workers workers workers of total Agricultural- Rural Barmer 2508 4167 735 17.64 Non- Agricultural- Rural Barmer 17490 35979 4615 12.83 All- Rural Barmer 19998 40146 5350 13.33 Agricultural- Urban Barmer 48 112 32 28.57 Non-Agricultural- Urban Barmer 4576 18822 706 3.75 All- Urban Barmer 4624 18934 738 3.90 Agricultural- Combined Barmer 2556 4279 767 17.92 Non-Agricultural- Combined Barmer 22066 54801 5321 9.71 All- Combined Barmer 24622 59080 6088 10.30 Source: Economic Census 2005, GoR, July 2008.
In case of establishments, Barmer had 24622 enterprises that employed 59080 persons with
10.30 percent being females. The non-agricultural establishments were 22066 that had 54801
workers with 9.71 percent being female workers. In agricultural establishments (2556), there
85
were 4279 workers that had 17.92 percent female workers. Now in rural establishments (19998),
40146 workers are employed of which 13.33 percent are females while in case of non-
agricultural rural establishments (17490), 35979 workers are engaged of which 12.83 percent are
females. There are 2508 rural agricultural establishments that had 4167 workers with 735 female
workers. In urban establishments (4624), 18934 workers were engaged. Of these 3.90 percent are
females. In case of urban non-agricultural establishments (4572), there were 18822 workers with
3.75 percent female workers. There are 48 urban agricultural establishments that employed 112
workers and 32 female workers.
The above information shows that in Barmer women constitute a reasonable proportion of
workforce be it own account enterprises or establishments. However, women are mainly in
agricultural enterprises, though in rural areas they are significantly more than in urban areas.
86
Chapter 7
Conclusions The Way Ahead
Barmer district is divided into three district sub-regions (DSR) on the basis of irrigation
development, ground water availability and land use pattern. These regions are:
DSR1 Low NIA (<1%), poor ground water, coarse sandy soils (extreme west)
DSR2 Low NIA (<5%), moderate ground water, moderate NSA (central part)
DSR3 Moderate NIA (>5%), good ground water potential, part of area is salty (eastern portion)
Based on this DSR cropping pattern is observed and so are the yield rates. The population
density also varies. For instance DSR1 has the lowest population density followed by DSR2 and
then DSR3. As one travels from east towards western side in the district, the population becomes
sparse because of severe desert conditions. Similarly, literacy pattern is observed. This indicates
lesser development of the western part adjacent to Pakistan. Opening up of Border has given
fresh lease of life to rural population in terms of opportunities.
DSR2 is the largest, accounting for 69 percent of area of the district. It has the smallest forest
area and highest net sown area. It holds about 58-60 percent of waste and fallow lands of district.
Due to severe desert situation, the proportion of cultivable waste and follow lands are very high
in DSR1 and lowest NSA. DSR3 is the smallest sharing only 7 percent of area of the district but
is much better developed with less land in form of wastelands and fallow lands, NSA of 50
percent plus and irrigation up to 10 percent with cropping intensity of 100 plus percent. Only 4
percent of land available for cultivation in the district is shared by this sub-region.
Bajra is the major crop in DSR1 and DSR2 in view of scanty rainfall and coarse soils. The
cropping pattern is more diverse in DSR2 with larger proportion of pulses and oilseeds and
87
wheat due to irrigation facilities.
Livestock composition does not vary much across DSRs, except that DSR3 has more buffaloes
due to better availability of water and fodder.
Issues for Agricultural Development in the district are: water shortage, formation of sand dunes
due to wind velocity resulting into heavy soil erosion and depleting productivity of lands.
Large livestock offers opportunities for development of livestock based agro processing
industries, like sheep wool carpet making, using animal waste products like hides, skins, bones
etc. This industrial base should be strengthened. There is need for arresting decline of small
ruminant population. However, livestock is largely migrating for want of drinking water and
fodder shortage.
Cultivable wastelands and fallow lands are quite high, not put to any productive use because of
large average holdings.
Soils are sandy of poor water holding capacity and low in nutrients.
Cropping pattern is dominated by low value cereals, particularly bajra and gaurseed.
The development strategy has to be eco-system based. It should integrate various sectors/ sub-
sectors keeping in view the desertic conditions.
Recommendations
In this framework:
provisioning of drinking water is on the top. It would help in controlling animal and
human migration.
Conserve rain water through adoption of suitable technology like underground storages
88
and bunds in the fields, particularly in DSR1 and 2.
Develop ground water resources wherever possible through borewells and tubewells.
Intensify social and agro-forestry (khejri and Rohida) for fuelwood and animal fodder.
Silvi-pastures and horti-pastures needs to be developed to provide more employment
opportunities.
Stabilizing sand dunes through afforestation and bush plantations, more intensively in
DSR2 stabilizing.
Harvesting and conservation of rain water using improved technology that minimize
water loss through mulching using organic, plastic or chemical mulching materials.
Augmenting fodder area and development of pastures by introducing better varieties.
Aerial seeding can resorted too.
Agricultural technologies needs to given a boost for stabilizing yields.
Non-farm activities should be given greater importance, but at a higher scale than
household industry.
Social groups education should be given greater importance and more so of women. This
is more so after primary schooling. School infrastructure also requires added attention
and SSA and NREGA should be used for construction of school buildings.
Programmes like NREGA should be better used to create rural infrastructure that betters
livelihoods of people.
Oil reserves should be used for districts benefits.
89
Camel among the livestock should be given its due.
Milk production should be given better linkages.
Better health facilities are required in the district, which are too meager today.
Minerals in the districts have not been used optimally for employment and income
generation.
Education sector requires greater attention as gender parity is low after primary level.
There are not many higher education institutions that provide skill education.
Female literacy requires added efforts; past efforts have yielded good results. This has to
be in the border areas.
Student teacher ratio requires improvement.
The gender gap in literacy rates also requires attention at post primary levels and more so
among social groups and minorities.
Barmer shows that state has a major role to play in education and health sector and more
resources should be earmarked for these activities.
Urbanization is very slow; it has to be encouraged. Higher the urbanization greater is the
development.
The structure of the economy has to be done. For this infrastructure development is must
in terms of roads, power, schools, markets and so on.
Occupational structure is too cultivator centric and this has to be diversified.
90
Cost of infrastructure provisioning is high in the district and ways have to be found to
reduce it. For instance, can we use wind mill and solar power instead of regular power
supply. It could be tried on a BOT system with panchayat involvement.
Grazing lands need to be developed to hold back animal out- migration.
Livestock is another sector that requires the most focused attention.
The district faces all the hardships one can expect and development task is too difficult
and require greater inflow of resources as per capita financial inputs required are very
high.
91