Embed Size (px)
Citation preview
GOVERNMENT OF INDIA
CENTRAL GROUND WATER BOARD
MINISTRY OF WATER RESOURCES
STATE UNIT OFFICE
GOVERNMENT OF INDIA
CENTRAL GROUND WATER BOARD
MINISTRY OF WATER RESOURCES
STATE UNIT OFFICE NEW DELHI
OCTOBER-2012
CENTRAL GROUND WATER BOARD
2
FFOORREEWWOORRDD
Ground Water Year Book is based on the information
generated by monitoring of ground water observation wells of
NCT-Delhi during the field Season of 2011-12.All the hydrograph
data have been analyzed by a team of Officers of State Unit
Office-Delhi. The ground water quality analysis has been done by
CGWB, NWR, Chandigarh. The reports, annexures and maps
have been generated using GEMS Software, Version-2.1
developed indigenously by Central Ground Water Board.
Depiction of ground water hydrograph of Delhi state along
with ground water quality provides information on availability of
ground water in terms of quantityandquality, development
prospects and management options. I am happy to note that the
scientific information in this report is presented in a simplified form.
I sincerely hope this report will be of immense help not only to
planners, administrators, and policy makers but also to the
common man in need of such information to make himself aware
of the situation and help in formulating development and
management strategy.
The untiring efforts made byShriSanjay Kumar Naik, Asstt.
Hydrogeologistfor bringing out this report are highly appreciated.
Apart from this the contribution made by Sh. MuninKonwar,
Scientist-B and the Chemists from NWR-Chandigarh is duly
acknowledged.
(A.D. RAO)
Officer In-charge
State Unit Office, Delhi
Central Ground Water Board, New Delhi, Ministry of Water Resource
OCTOBER-2012

3
EXECUTIVE SUMMARY
GROUND WATER YEAR BOOK 2011-12
NCT DELHI
National Capital Territory of Delhi occupies an area of 1483 Sq. Km.
and lies between 280 24’ 15’’ and 280 53’ 00’’ N latitudes and 760 50’24” and
770 20’ 30” E longitudes. The total population of NCT Delhi, as per the census
20011 is 167.53 lakhs with a density of 11297 persons/Sq. km area.
The normal annual rainfall of NCT Delhi is 611.8mm. The rainfall
increases from the South-West to the North-West. About 81% of the annual
rainfall is received during the monsoon months July, August and September.
The rest of the annual rainfall is received in the form of winter rain.
The ground water availability in the territory is controlled by the
hydrogeological conditions characterized by occurrence of different geological
formations namely Delhi (Quartzite) Ridge, Older & Younger Alluvium. Central
Ground Water Board (CGWB) has established 162 hydrograph monitoring
stations, out of which 25 are dug wells and 137 are Piezometers. The ground
water monitoring stations are spread over both Alluvial as well as Delhi ridge
area. Nearly 60 stations fall in Delhi ridge area whereas 109 stations fall in
alluvial area including Yamuna Flood Plain.
District wise distribution of hydrograph network stations is highly
uneven and varies from one monitoring station per 1.4 Sq. Km in New Delhi
district to one monitoring station per 30 Sq. Km in North East district.
Considering this un-evenness, Central Ground Water Board is striving to
increase the number of monitoring stations for better monitoring of the ground
water regime in the diverse hydrogeological terrain.
4
The depth to water level recorded in NCT Delhi during May-2011
ranges from 0.96 to 66.45 m.bgl (below ground level). 44% wells of South
district show more than 40 m.bgl water level and 26% wells have 20 to 40
m.bgl water level. In New Delhi and South-West districts 10 to 20 m.bgl water
level is shown by 47% and 59% wells respectively. The depth to water level in
Central, East and North-West districts have 50%, 44% and 40% wells in the
range of 5-10 m.bgl whereas East, North, North-East, North-West, and West
district of 44%, 56%, 33%, 34% and 22% of wells show water level in the
range of 2 to 5m water level respectively; the entire Yamuna flood plain is also
falling in the 2 to 5m category.
The fluctuation of water level between May-2010and May-2011 of
Delhi state shows rise in water level in the range of 0.01 m to 39.35 m in the
district of New Delhi, South, North-West, South-West, East and West.
Whereas rest of the districts like North-East, Central, South and South-West
shows fall in the range of 0.02 to 5.70 m. The overall data indicates that South
and South-West districts are showing falling trend.
When the data of May-2011 was compared with 10 year mean of May
water level, it shows that 40% of wells show a fall in the range of 0.02 to 14.07
m. 59% wells of the New Delhi, East, North, North-West, South and South-
West show a rise in water level varying from 0.05 to 31.32m. The maximum
fall has taken place in North-West, South and South-West districts (i.e. 9.76 to
14.07 m).
The Depth to water level recorded in NCT Delhi during Aug-2011
ranges from 0.58 to 66.80 m. bgl. In which 48% wells of south district show
more than 40 m.bgl water level and 22% wells have 20 to 40 m.bgl water
level. In New Delhi and South-West district 47% and 53% wells have shown
10 to 20 m.bgl water level, respectively.
The fluctuation of water level between Pre-monsoon (May-2011) and
August-2011for Delhi indicates that 69% wells show rise in the range of 0 to
2 m and 25% depict a fall ranging from 0.02 m to 28.30 m.
The hydrograph analyses of August-2010and August-2011 water level
reveals that most of the districts (only in pockets) show rise in the range of 0
to 2 m while in few districts like New Delhi and South show fall in ground
water level in the range of 4 to 6 m. In totality 28% wells show fall in the range
of 0 to more than 4m whereas 69% wells show a slight rise in water level. The
fall of more than 4 m is recorded in only two districts i.e. New Delhi and South.
5
The overall analyses of the hydrographs show an improvement situation in the
state during monsoon period.
The depth to water level recorded in NCT Delhi during November-
2011 ranges from 0.91 to 66.73 m.bgl. 50% wells of South district have shown
more than 40 m.bgl water level and 18 % wells have water level of 20 to 40
m.bgl. The South-West district has 57% and 20% wells in the Category of 10
to 20 and 20 to 40 m.bgl respectively. The depth to water level of East, North-
East, North West and West district show 33%, 60%, 38% and 22% in the
range of 5-10 m.bgl whereas Central, North, N-E, N-W and West districts are
marked by wells of 50%, 57%, 20%, 28% and 44% in the range of 2 to 5m
water level respectively. The entire Yamuna flood plain is also falling in 2 to 5
m. bgl category.
The fluctuation of water level between Pre-monsoon (May-2011) and
Post Monsoon (Nov-2011) of Delhi state shows 0.01 to 10.30 m rise in 62%
of the wells. Few wells of South and South-West district shows fall in the
range of 0 to 4m. Analysis of data reveals that the declining trend is very less
in the South and South-West districts.
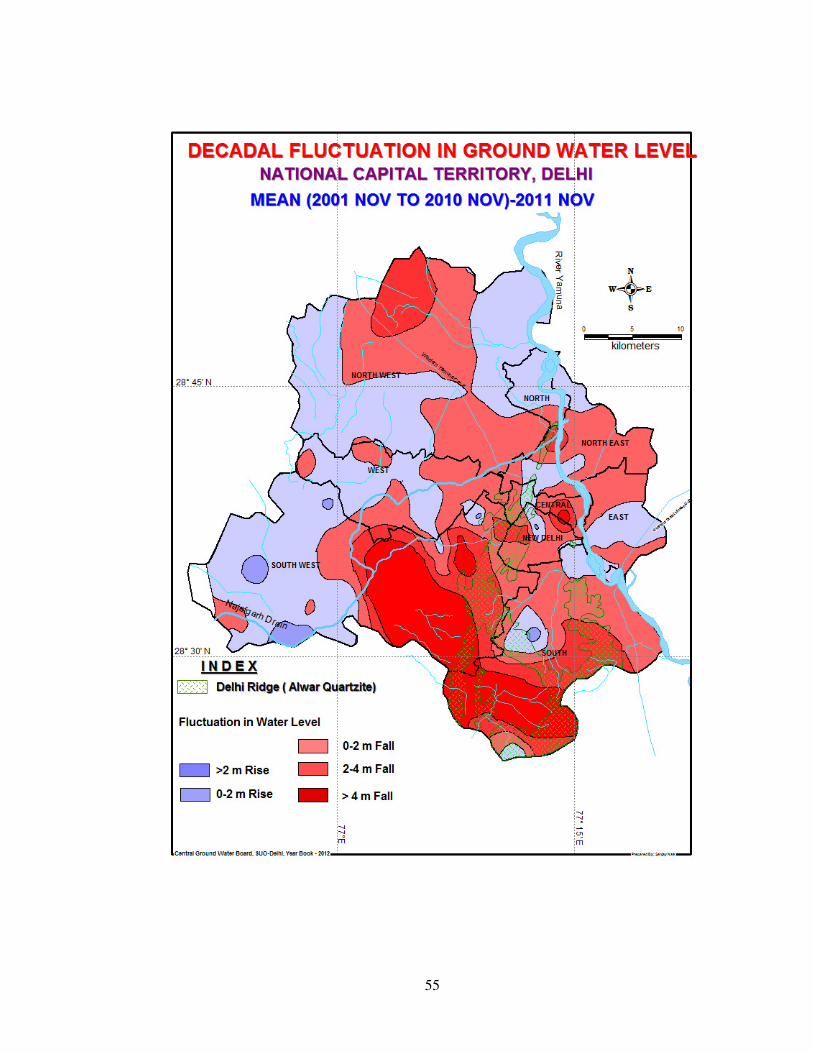
When the data of Nov-2011was compared with 10 year mean of Nov.
it shows that 53% of wells show a fall of water level in the range of 0.01 to
12.28.
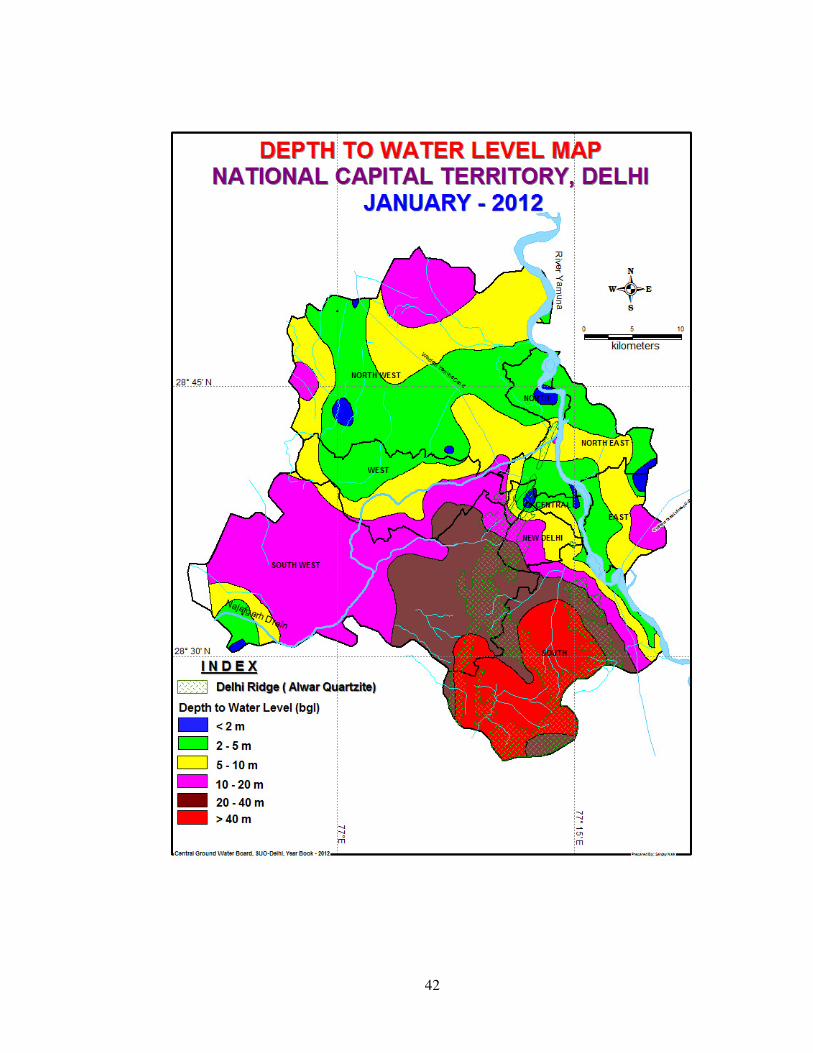
The depth to water level recorded during January-2012 ranges from
0.89 to 66.84 m. bgl in which South district alone shows 50% wells in the
category of more than 40 m depth to water level and 18% in the range of 20 to
40m depth to water level. 51% wells of district like South-West and New Delhi
have water levels in the range of 10 to 20 m. A few patches of 20 to 40 m
water level are also seen in these districts. Rest of the districts comes under
the category of 2 to 10 m. Some of the monitoring stations viz. MadanGir,
Saket and PushpVihar show depth to water level in the range of 51 to 67m,
which is maximum in Delhi state.
The fluctuation of water level between Pre-monsoon (May-2011) and
January-2012of Delhi state reveals that 41% wells of South, S-W and West
District fall in the range of 0.87 to 28.10 m and 62% wells show rise in the
range of 0.31 to 40.70 m in Central, East, North, North-East & New Delhi
district.
When the data of January-2012 was compared with 10 year mean of
January, It has been observed that49% of monitoring stations of New Delhi
and North West districts show a fall in water levels, the maximum fall is 2.80m

6
and 3.49 m respectively. The same conditions prevail in South and South
West Districts where 54% of the wells show fall in water level where the
maximum fall is 8.34 m and 11.49 m respectively. East and North East
districts have also suffered depletion of water table in the range of 1.22 to
2.22 m only. The overall observation of the state shows that the southern
districts of Delhi state are showing declining condition.
Ground Water Quality:
In almost 30 percent ground water samples of NCT Delhi mostly from
the district of South-West, West, and North-West contain high concentration
of fluoride beyond prescribed maximum permissible limit 1.5mg/l. Some more
sites are also affected by Fluoride content in ground water of Delhi which are
sporadically located. On perusal of data and affected locations, it is observed
that wherever existence of Saline/Brackish water is at shallow depth fluoride
concentration are more.
The Nitrate concentration in ground water of NCT Delhi shows a wide
range (i.e. less than 1mg/l to 1500mg/l). The Nitrate concentration in ground
water is generally spread out over the entire state but is more significant in
parts of West, South-West and some pockets of New Delhi districts. The
Nitrate pollution in the ground water is mostly anthropogenic and may be due
to improper disposal of sewage and unhygienic conditions around the well.
7
GROUND WATER YEAR BOOK NCT DELHI
2011-12
CONTENTS CONTENTS CONTENTS CONTENTS
CHAPTERS CHAPTERS CHAPTERS CHAPTERS
PAGE NO.PAGE NO.PAGE NO.PAGE NO.
Foreword
Executive Summary
1. Introduction:
1 1.1. General Introduction 1
1.2. Ground Water Regime Monitoring 1
1.3. Distribution of Hydrograph Network Station, NCT-Delhi 5
1.4. Periodic Analysis 6
2. Climate and Rainfall 9
3. Hydrogeological Framework 14
3.1. Physiography 14
3.2. Geology 16
3.3. Basement Topography 17
3.4. Subsurface Configuration and Aquifer Disposition 18
4. Water Level Behaviors during 2011-2012 25 4.1. May-2011 25
4.2. August-2011 26
4.3. November-2011 28
4.4. January-2012 29
5. Hydrochemistry 32 5.1. General Introduction 32
5.2. Discussion and Results 32
5.3. Hydro-Chemical Facies 34
8
TABLE:
1.1. Status of National Hydrograph Monitoring Stations in NCT Delhi
1.2. Density distribution of NHS in NCT Delhi
2.1. Seasons in NCT Delhi
2.2. Annual Rainfall and its deviation from Normal Rainfall
2.3. Normal and Extreme Rainfall
2.4. Rainfall and Evaporation losses
3.1. Geological Succession around NCT Delhi
3.2. Geological Succession in NCT Delhi
4.1. May 2011- Area Under Various DTWL in NCT Delhi
ANNEXURE:
1. Depth to Water Level Data of NCT Delhi, May-2010to May-2012
2. Ground Water Quality Parameters of NCT Delhi, Yr. 2011-12
May-2011:
3. DTWL-Distribution of Percentage of Observation wells: May-2011
4. District Wise Fluctuation and Frequency Distribution: May-10 to May-11
5.Fluctuation of water level with 10Year Mean of May month to May-11
August-2011:
6. DTWL-Distribution of Percentage of Observation wells: August-2011
7. District Wise Fluctuation and Frequency Distribution: Aug-10 to Aug-11
8. District Wise Fluctuation and Frequency Distribution: May-11 to Aug-11
9. Fluctuation of water level with 10Year Mean of Aug. month to Aug-11
November-2011:
10. DTWL-Distribution of Percentage of Observation wells: November-2011
11. District Wise Fluctuation and Frequency Distribution: Nov-10 to Nov-11
12. District Wise Fluctuation and Frequency Distribution: May-11 to Nov-11
13. Fluctuation of water level with 10Year Mean of Nov. month to Nov-11
January-2012
14. DTWL-Distribution of Percentage of Observation wells: January-2012
15. District Wise Fluctuation and Frequency Distribution: Jan-11 toJan-12
16. District Wise Fluctuation and Frequency Distribution: May-11to Jan-12
17. Fluctuation of water level with 10Year Mean of Jan. month to Jan-12
9
PLATES / FIGURES:
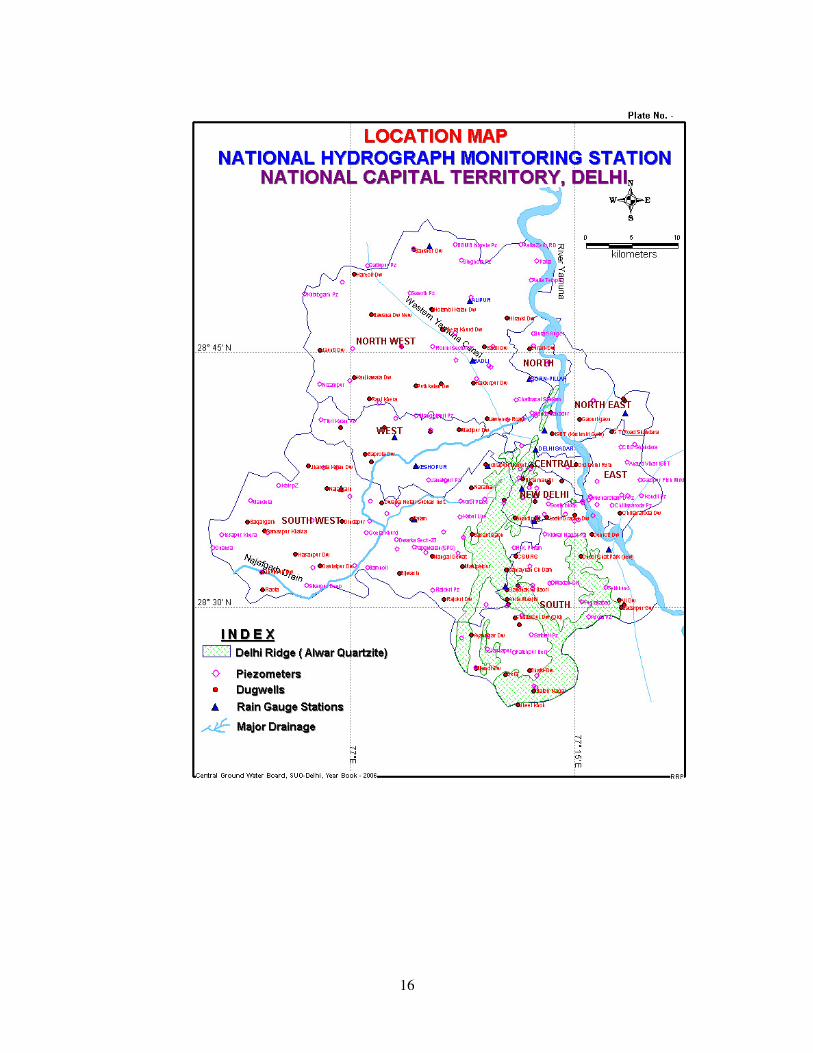
1. Location of Hydrograph Network Stations
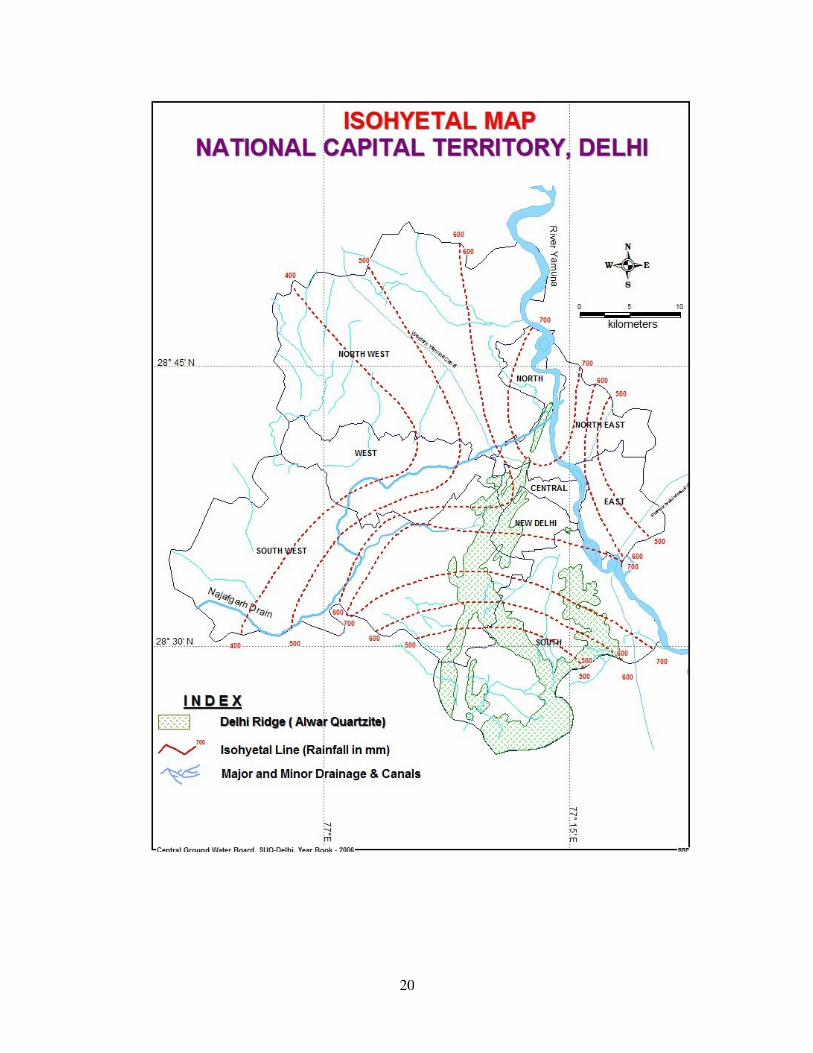
2. Isohyetal Map of NCT Delhi
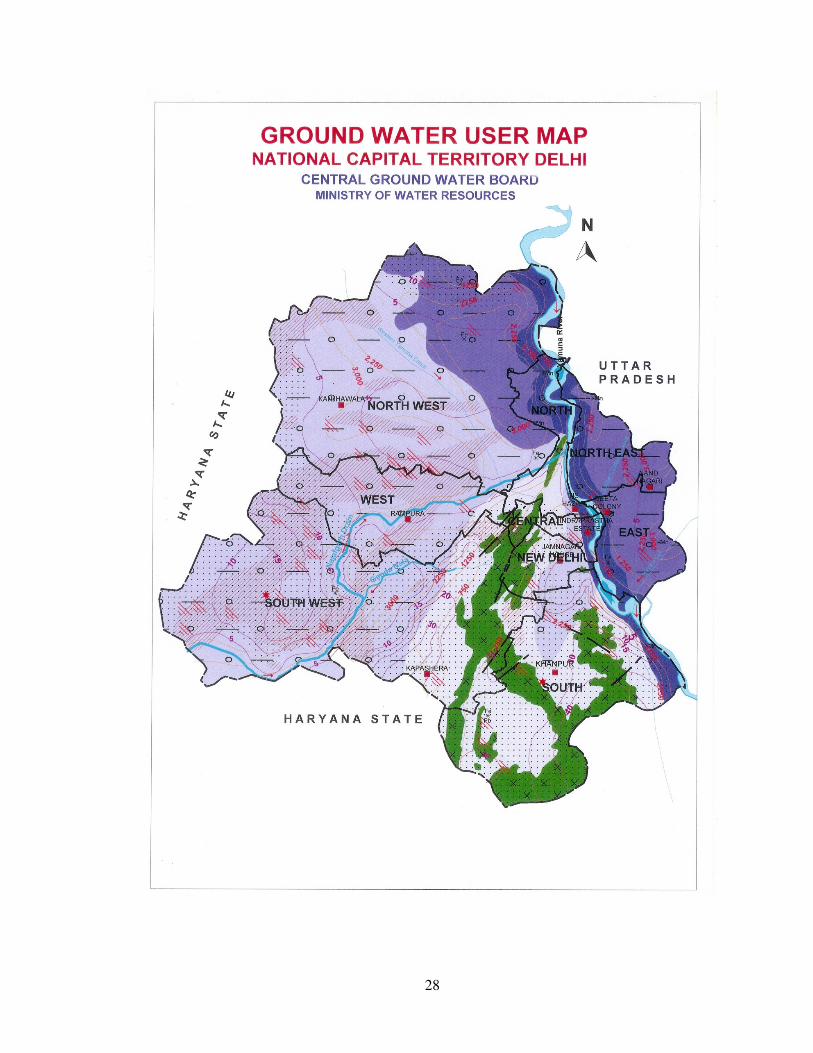
3. Ground Water User Map, NCT Delhi
4. Depth to Water Level Map May - 2011
5. Depth to Water Level Map Aug - 2011
6. Depth to Water Level Map Nov - 2011
7. Depth to Water Level Map Jan - 2012
8. Fluctuation in Water Level, May-10 to May-11
9. Fluctuation in Water Level, Aug-10 to Aug-11
10. Fluctuation in Water Level, Nov-10 to Nov-11
11. Fluctuation in Water Level, Jan-11 to Jan-12
12. Fluctuation in Water Level, Pre and Post Monsoon
13. Decadal Fluctuation in Ground Water Level Mean May (2001-2010)-
May 2011
14. Decadal Fluctuation in Ground Water Level Mean Aug (2001-2010)-
Aug 2011
15. Decadal Fluctuation in Ground Water Level Mean Nov (2001-2010)-
Nov 2011
16. Decadal Fluctuation in Ground Water Level Mean Jan (2002-2011)-
Jan 2012
17. Electrical Conductivity Map, NCT Delhi
18. Fluoride Concentration Map, NCT Delhi
19. Nitrate Concentration Map, NCT Delhi
20. Piper Diagram
21. US Salinity Plot
10
Chapter - 1
INTRODUCTION
1.1 - GENERAL INTRODUCTION
National Capital Territory of Delhi occupies an area of 1483 Sq.km. and
lies between 28° 24’ 15’’ & 28° 53’ 00’’N latitudes and 76° 50’24” & 77° 20’ 30”
E longitudes. Area is covered under Survey of India Toposheet Nos. 53D and
53H.For administrative purposes, NCT Delhi is divided into 9 districts and 27
Tehsils/Sub-divisions. NCT Delhi has three Statutory Towns, viz., the MCD,
the NDMC and the DCB, 110 Census Towns and 112 Villages as per the
census of 2011. Population of Delhi has increased at a rate of 2.1% per
annum during the decade 2001-2011. Considering the same growth rate for
the present decade, it is estimated that the population of Delhi in 2019 is
about 184 lakhs and it would be about 188 lakhs in 2021, 208 lakhs by 2031.
In order to evaluate the changes in ground water regime effect due to ever
growing demand for ground water and the increasing numbers of abstraction
structures in the city, CGWB has been continuously monitoring the water level
variation with its own network stations spread over the entire area of NCT
Delhi.
1.2 - GROUND WATER REGIME MONITORING
Monitoring of ground water regime is an effort to obtain information on
variation in ground water levels and chemical quality through representative
sampling both in time and space. The important attributes of ground water
regime monitoring are:
a) Ground Water Level
b) Ground Water Quality and
c) Temperature.
The primary objective of establishing the ground water monitoring
network stations is to record the response of ground water regime to the
natural and artificial conditions of recharge and discharge with reference to
geology, climate, physiography, land-use pattern and hydrologic
characteristics. The natural conditions affecting the regime involve climatic
parameters like rainfall; evapo-transpiration etc. and the artificial conditions
include pumpage from the aquifer, recharge due to irrigation system and other
11
man made causes like waste disposal etc. The database generated can form
the basis for ground water development and management programme. The
objectives of the Ground Water Observation Network may be broadly
summarized as below:
Collection of basic data on ground water conditions for:
• Study of inter-relationship between ground water and climatic
parameters,
• Study the influence of geology, topography, land-use on ground water
regime,
• Understanding the role of ground water in the hydrologic cycle and
influence of the recharge on ground water storage changes, chemistry
and temperature.
Application of ground water monitoring data for:
a. Reference purposes
b. Prediction measures
c. Environmental evaluation
d. Estimation of resources
Monitoring may come under two categories:
i) Background monitoring to characterizing the initial stage of a system,
(Background monitoring commences with inventory of existing information like
land-use, topography, extent, thickness, structure of the geological units and
their hydraulic properties. Based on the analysis of the data, different ground
water systems can be identified.)
ii) Specific monitoring to deal with systems, where significant changes
have taken place. This functions as an early warning system and
provides information for remedial actions.
GROUND WATER LEVELS:
The configuration of the water table depends upon topography,
geology, climate, water yielding and water bearing properties of rocks in the
zones of aeration and saturation which controls the ground water recharge.
The upper surface of the zone of saturation is the Water Table. In case of
wells penetrating confined aquifers, the water level represents the pressure or
12
Piezometric Head at that point.
Hydrograph network planning is basic to ground water assessment and
development programme. The ground water, being subterranean resource
can only be assessed through indirect reflection in the form of water level
changes. The systematic and regular monitoring of ground water levels can
bring out the changes taking place in the regime. The data so generated is of
immense help for regional ground water flow modeling to serve as a ground
water management tool and to provide the necessary advance information to
the user agencies to frame contingency plans in case of un-favorable ground
water recharge situation. The data also has immense utility in settling the
legal issues arising out of conflicting interests of ground water users.
BASIC ACTIVITY
The NCT Delhi covers an area of 1483 Sq. Km. Delhi state is divided
into 9 districts and 27 sub-divisions. Geologically, Delhi state is occupied by
Quartzite interbedded with Mica-Schist belonging to Delhi Super Group, un-
conformably overlain by unconsolidated Quaternary to Recent sediments. The
ground water availability in the territory is controlled by the hydrogeological
situation characterized by occurrence of alluvial formation and quartzite hard
rocks. The hydrogeological set up and the following distinct physiographic
units influence the ground water occurrence: -
1. Alluvial plain on eastern and western sides of the ridge.
2. Yamuna flood plain deposits.
3. Isolated and nearly closed Chattarpur alluvial basin.
4. NNE-SSW trending Quartzitic Ridge.
The basic activities pertaining to monitoring well design and
construction are as follows:
a. Suitable locations for installation of piezometer, working out
optimal depth and diameter of piezometer.
b. Appropriate drilling technique and suitable drilling rig for
piezometer construction.
c. Installation of suitable well assembly to tap the aquifer proposed
to be monitored, i.e. casing, screen etc.
d. Maintenance of well.
13
It is essential to have a complete understanding of aquifer disposition
and geometry in the area before the piezometers are designed and installed.
The hydrogeological mapping in the area may indicate the disposition and
inter-relationship of the aquifers spatially and depth wise. The information
generated from ground water surveys and exploration would enable one to
decide grouping of interrelated aquifers into one aquifer system for the
purpose of monitoring. The decision to install piezometers monitoring phreatic
and deeper confined aquifers would be dependent on the nature of aquifer
systemviz., alluvial aquifers or hard rock aquifers.
Alluvial aquifers:
In Delhi state alluvial areas, characterized by occurrence of number of
sand zones constituting the aquifers, it may not be essential to install
piezometers for each sand zone. Based on inter-relationship and behavior,
these aquifers are grouped into major aquifer systems and piezometers have
been installed accordingly.
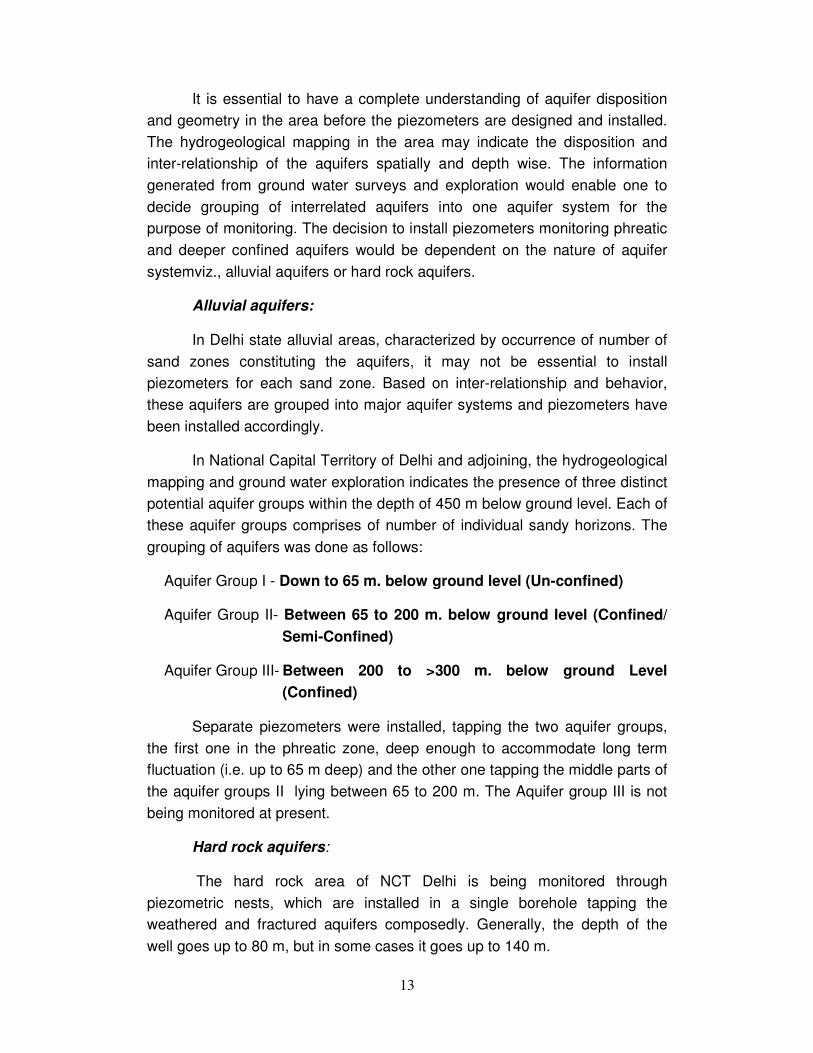
In National Capital Territory of Delhi and adjoining, the hydrogeological
mapping and ground water exploration indicates the presence of three distinct
potential aquifer groups within the depth of 450 m below ground level. Each of
these aquifer groups comprises of number of individual sandy horizons. The
grouping of aquifers was done as follows:
Aquifer Group I - Down to 65 m. below ground level (Un-confined)
Aquifer Group II- Between 65 to 200 m. below ground level (Confined/
Semi-Confined)
Aquifer Group III- Between 200 to >300 m. below ground Level
(Confined)
Separate piezometers were installed, tapping the two aquifer groups,
the first one in the phreatic zone, deep enough to accommodate long term
fluctuation (i.e. up to 65 m deep) and the other one tapping the middle parts of
the aquifer groups II lying between 65 to 200 m. The Aquifer group III is not
being monitored at present.
Hard rock aquifers:
The hard rock area of NCT Delhi is being monitored through
piezometric nests, which are installed in a single borehole tapping the
weathered and fractured aquifers composedly. Generally, the depth of the
well goes up to 80 m, but in some cases it goes up to 140 m.
14
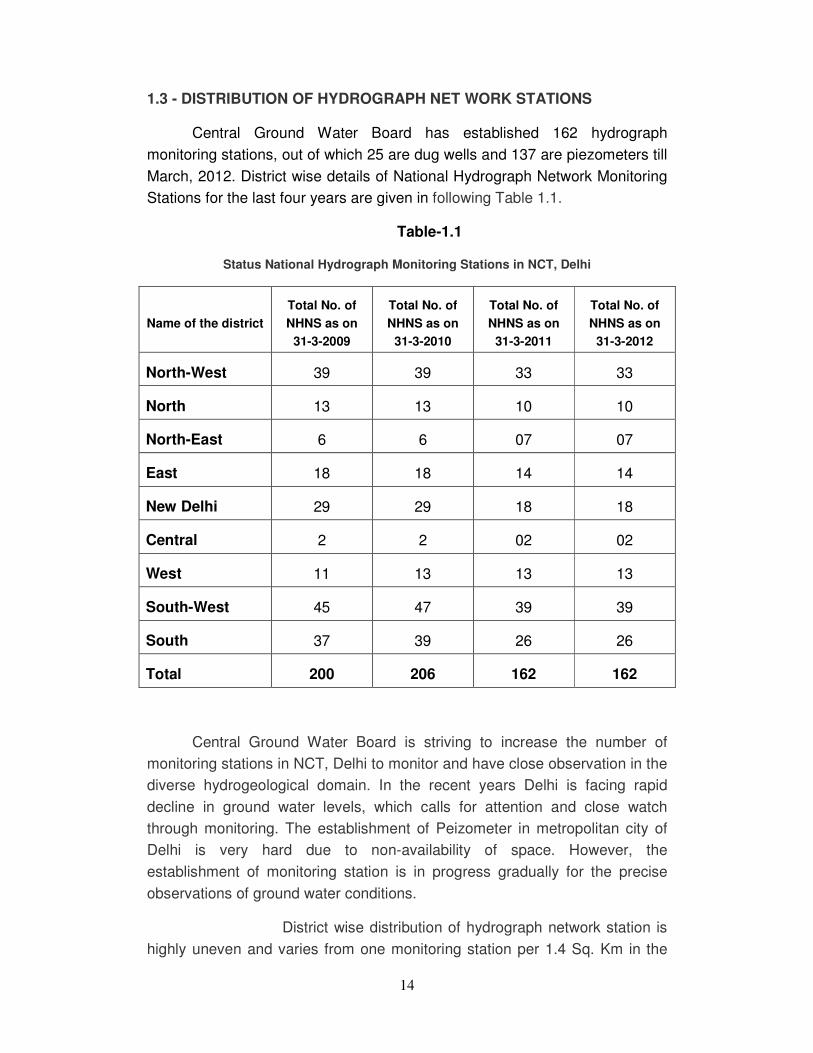
1.3 - DISTRIBUTION OF HYDROGRAPH NET WORK STATIONS
Central Ground Water Board has established 162 hydrograph
monitoring stations, out of which 25 are dug wells and 137 are piezometers till
March, 2012. District wise details of National Hydrograph Network Monitoring
Stations for the last four years are given in following Table 1.1.
Table-1.1
Status National Hydrograph Monitoring Stations in NCT, Delhi
Name of the district
Total No. of
NHNS as on
31-3-2009
Total No. of
NHNS as on
31-3-2010
Total No. of
NHNS as on
31-3-2011
Total No. of
NHNS as on
31-3-2012
North-West 39 39 33 33
North 13 13 10 10
North-East 6 6 07 07
East 18 18 14 14
New Delhi 29 29 18 18
Central 2 2 02 02
West 11 13 13 13
South-West 45 47 39 39
South 37 39 26 26
Total 200 206 162 162
Central Ground Water Board is striving to increase the number of
monitoring stations in NCT, Delhi to monitor and have close observation in the
diverse hydrogeological domain. In the recent years Delhi is facing rapid
decline in ground water levels, which calls for attention and close watch
through monitoring. The establishment of Peizometer in metropolitan city of
Delhi is very hard due to non-availability of space. However, the
establishment of monitoring station is in progress gradually for the precise
observations of ground water conditions.
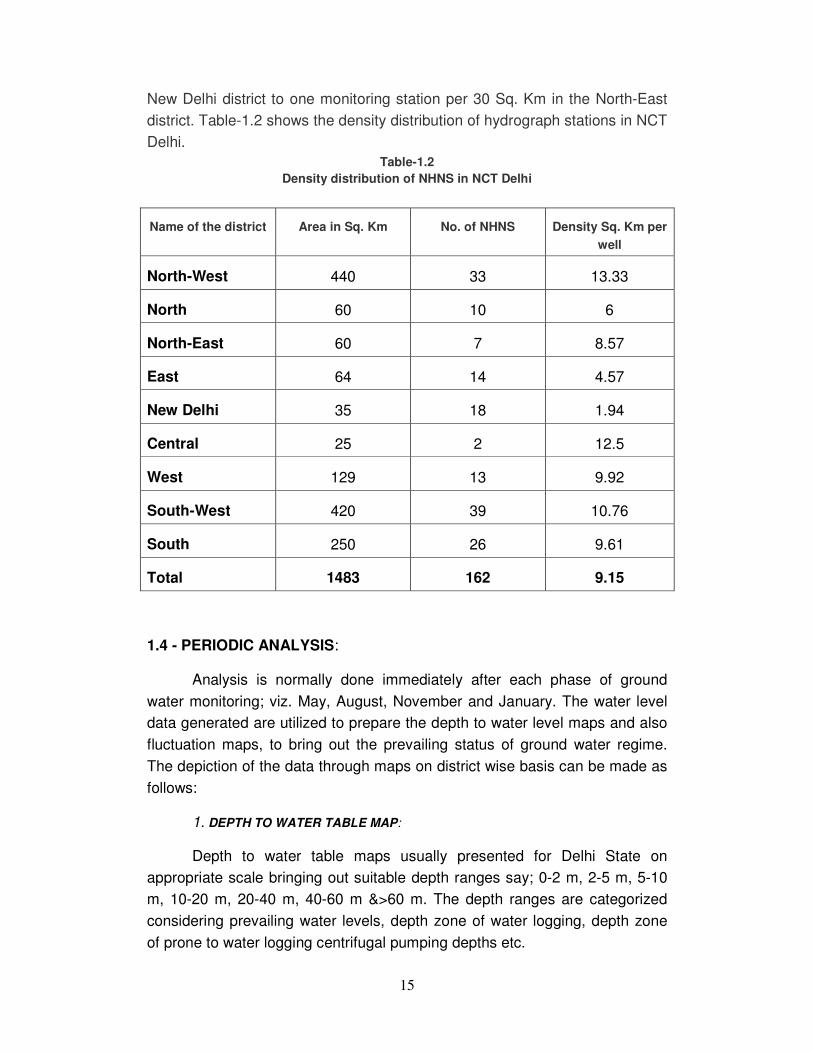
District wise distribution of hydrograph network station is
highly uneven and varies from one monitoring station per 1.4 Sq. Km in the
15
New Delhi district to one monitoring station per 30 Sq. Km in the North-East
district. Table-1.2 shows the density distribution of hydrograph stations in NCT
Delhi.
Table-1.2
Density distribution of NHNS in NCT Delhi
Name of the district Area in Sq. Km No. of NHNS Density Sq. Km per
well
North-West 440 33 13.33
North 60 10 6
North-East 60 7 8.57
East 64 14 4.57
New Delhi 35 18 1.94
Central 25 2 12.5
West 129 13 9.92
South-West 420 39 10.76
South 250 26 9.61
Total 1483 162 9.15
1.4 - PERIODIC ANALYSIS:
Analysis is normally done immediately after each phase of ground
water monitoring; viz. May, August, November and January. The water level
data generated are utilized to prepare the depth to water level maps and also
fluctuation maps, to bring out the prevailing status of ground water regime.
The depiction of the data through maps on district wise basis can be made as
follows:
1. DEPTH TO WATER TABLE MAP:
Depth to water table maps usually presented for Delhi State on
appropriate scale bringing out suitable depth ranges say; 0-2 m, 2-5 m, 5-10
m, 10-20 m, 20-40 m, 40-60 m &>60 m. The depth ranges are categorized
considering prevailing water levels, depth zone of water logging, depth zone
of prone to water logging centrifugal pumping depths etc.
16
17
2. WATER LEVEL FLUCTUATION MAPS:
The ground water level fluctuation usually depicted through a set of
maps showing the status of the water levels under observation as compared
to the levels of the same period of the previous year and to the decadal mean
water levels etc. These maps can be drawn as:
a. Fluctuation map comparing the water levels monitored with the
corresponding water levels in the preceding year.
b. Fluctuation maps comparing the Post-monsoon water level monitored
with Pre-monsoon water level of the same water year.
c. Fluctuation maps comparing the water level monitored with the mean
water levels of the period for at least a decade. This map would bring
out departures from normal ground water storage situations during the
period under consideration.
3.GROUND WATER QUALITY MAPS:
The ground water quality maps usually prepared are based on the
frequency of ground water sample collection. As the ground water quality
regime does not show marked variations sample collection is done once in a
year. Only major constituents analyzed are used in preparation of the maps.
The maps to be prepared are:
I. Map showing EC variation in the ground water
2. Map showing Nitrate distribution in the ground water
3. Map showing high point values of Fluoride, Nitrate and other
pollutants.
4.STATUS OF GROUND WATER REGIME:
After each measurement, a comprehensive report is prepared, which
include the following:
a. Brief write-up supported by water level data, maps of depth to water,
and rise and fall of ground water levels and ground water quality maps
etc.
18
b. Effects of various factors on ground water regime like rainfall, ground
water pumpage, irrigation practices etc.
c. Departure in the normal behavior of water levels bringing out the
factors responsible.
The report and maps are of immense help to the planners and ground
water users to chalk out the development strategy.

19
Chapter - 2
CLIMATE AND RAINFALL
CLIMATE:
The climate of NCT Delhi is mainly influenced by its inland position and
the prevalence of air of the continental type during the major part of the year.
Extreme dryness with the intensely hot summer and cold winter are the
characteristics of the climate. Only during the three-monsoon months July,
August, and September does air of oceanic origin penetrate to this state and
causes increased humidity, cloudiness and precipitation. The year can
broadly be divided into four seasons. The cold season starts in late November
and extends up to the beginning of March. This is followed by the hot season,
which lasts till about the end of June when the monsoon arrives over the
state. The monsoon continues to the last week of September. The two post
monsoon months October and November constitute a transition period from
the monsoon to winter condition.
Table-2.1
Seasons in NCT, Delhi
Season Begin End
Cold/Winter End of November Middle of March
Summer Middle/End of March End of June
Rainy season Early July September
RAINFALL:
Rainfall data of six of the stations located in NCT, Delhi has been
collected from IMD and presented in Table-2.3. For calculation of normal
rainfall of NCT Delhi, rainfall records from 1930-1980 for 13 stations were
considered. The normal annual rainfall in NCT Delhi is 611.8 mm. The rainfall
in NCT Delhi increases from the southwest to the northwest. About 81% of the
annual rainfall is received during the monsoon months July, August and
September. The rest of the annual rainfall is received as winter rains and as
thunderstorm rain in the pre and post monsoon months. The variation of
rainfall from year to year is large.
20
21
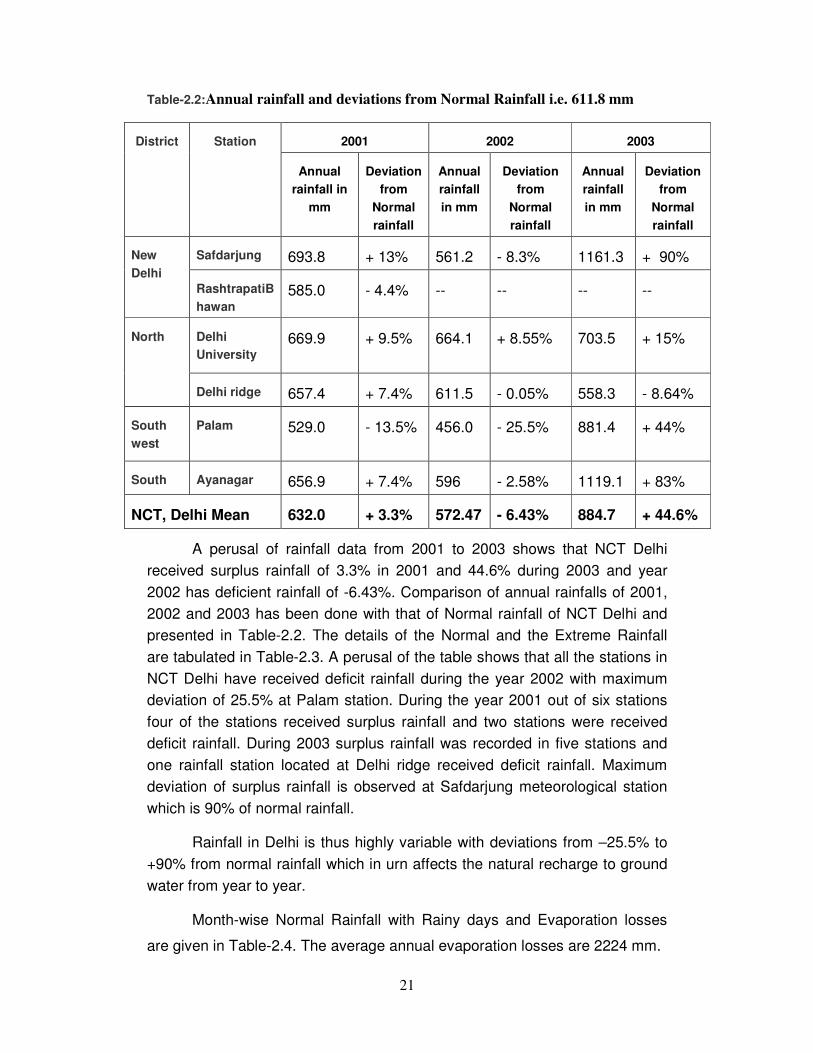
Table-2.2:Annual rainfall and deviations from Normal Rainfall i.e. 611.8 mm
District Station 2001 2002 2003
Annual
rainfall in
mm
Deviation
from
Normal
rainfall
Annual
rainfall
in mm
Deviation
from
Normal
rainfall
Annual
rainfall
in mm
Deviation
from
Normal
rainfall
New
Delhi
Safdarjung 693.8 + 13% 561.2 - 8.3% 1161.3 + 90%
RashtrapatiB
hawan
585.0 - 4.4% -- -- -- --
North Delhi
University
669.9 + 9.5% 664.1 + 8.55% 703.5 + 15%
Delhi ridge 657.4 + 7.4% 611.5 - 0.05% 558.3 - 8.64%
South
west
Palam 529.0 - 13.5% 456.0 - 25.5% 881.4 + 44%
South Ayanagar 656.9 + 7.4% 596 - 2.58% 1119.1 + 83%
NCT, Delhi Mean 632.0 + 3.3% 572.47 - 6.43% 884.7 + 44.6%
A perusal of rainfall data from 2001 to 2003 shows that NCT Delhi
received surplus rainfall of 3.3% in 2001 and 44.6% during 2003 and year
2002 has deficient rainfall of -6.43%. Comparison of annual rainfalls of 2001,
2002 and 2003 has been done with that of Normal rainfall of NCT Delhi and
presented in Table-2.2. The details of the Normal and the Extreme Rainfall
are tabulated in Table-2.3. A perusal of the table shows that all the stations in
NCT Delhi have received deficit rainfall during the year 2002 with maximum
deviation of 25.5% at Palam station. During the year 2001 out of six stations
four of the stations received surplus rainfall and two stations were received
deficit rainfall. During 2003 surplus rainfall was recorded in five stations and
one rainfall station located at Delhi ridge received deficit rainfall. Maximum
deviation of surplus rainfall is observed at Safdarjung meteorological station
which is 90% of normal rainfall.
Rainfall in Delhi is thus highly variable with deviations from –25.5% to
+90% from normal rainfall which in urn affects the natural recharge to ground
water from year to year.
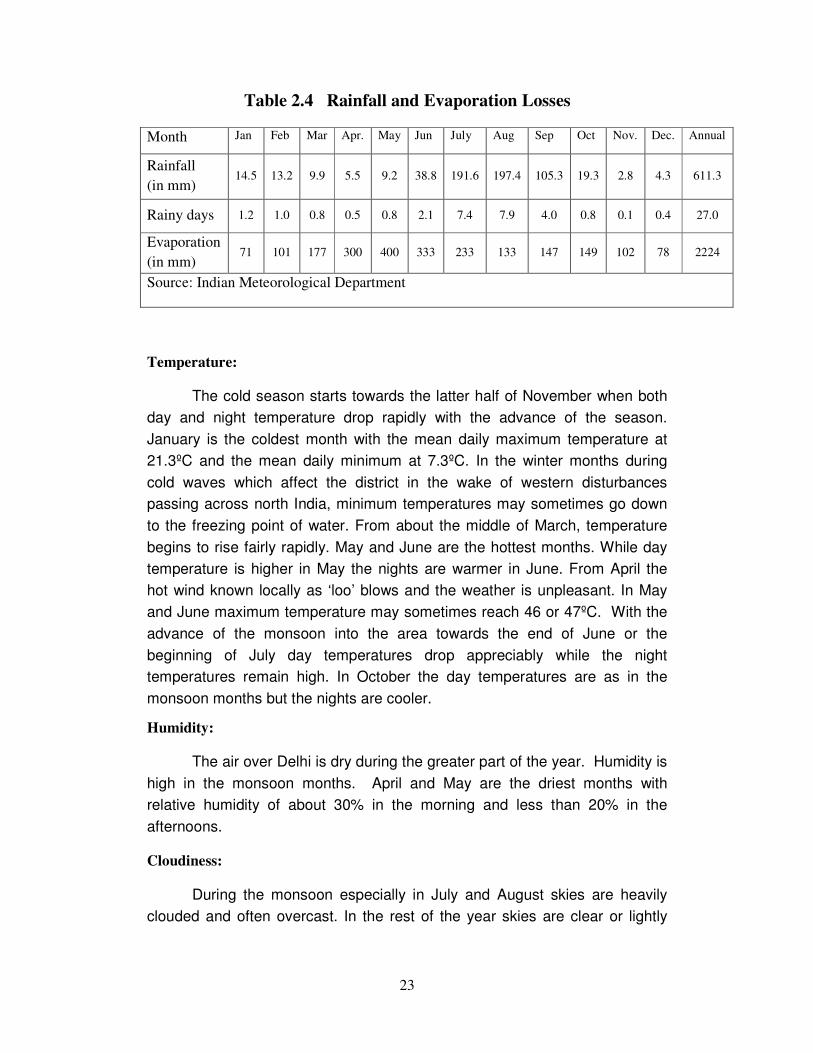
Month-wise Normal Rainfall with Rainy days and Evaporation losses
are given in Table-2.4. The average annual evaporation losses are 2224 mm.
22
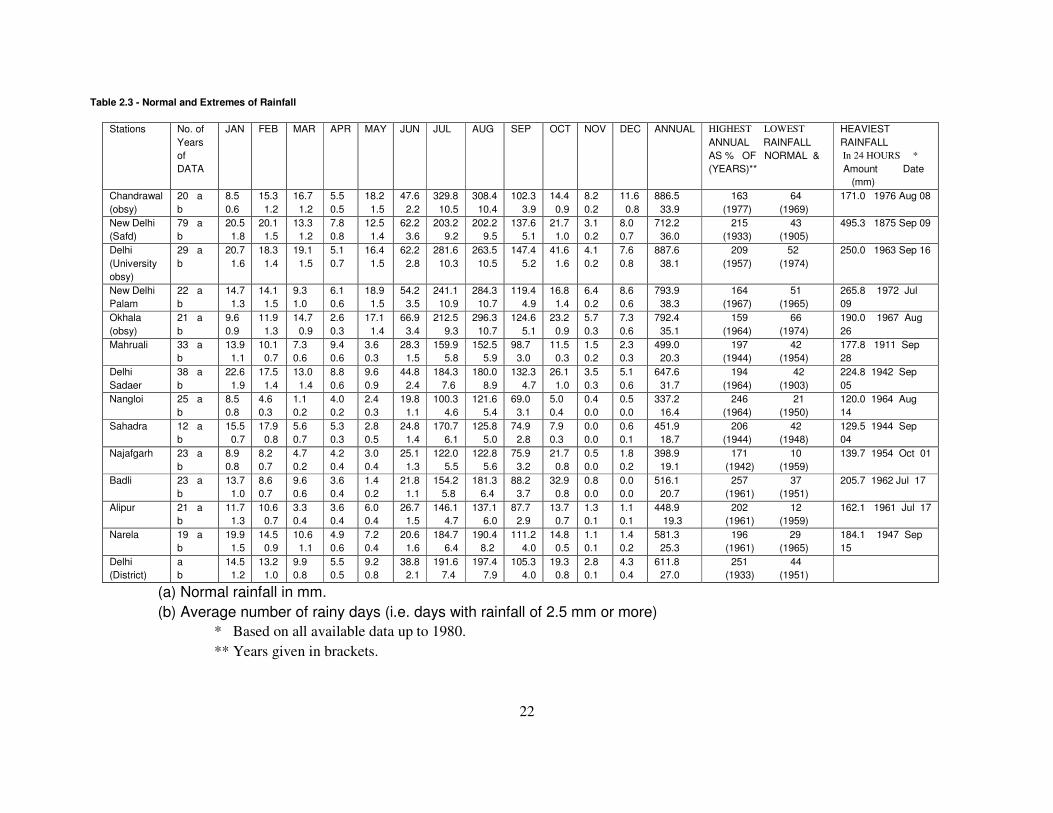
Table 2.3 - Normal and Extremes of Rainfall
Stations No. of
Years
of
DATA
JAN FEB MAR APR MAY JUN JUL AUG SEP OCT NOV DEC ANNUAL HIGHEST LOWEST
ANNUAL RAINFALL
AS % OF NORMAL &
(YEARS)**
HEAVIEST
RAINFALL
In 24 HOURS *
Amount Date
(mm)
Chandrawal
(obsy)
20 a
b
8.5
0.6
15.3
1.2
16.7
1.2
5.5
0.5
18.2
1.5
47.6
2.2
329.8
10.5
308.4
10.4
102.3
3.9
14.4
0.9
8.2
0.2
11.6
0.8
886.5
33.9
163 64
(1977) (1969)
171.0 1976 Aug 08
New Delhi
(Safd)
79 a
b
20.5
1.8
20.1
1.5
13.3
1.2
7.8
0.8
12.5
1.4
62.2
3.6
203.2
9.2
202.2
9.5
137.6
5.1
21.7
1.0
3.1
0.2
8.0
0.7
712.2
36.0
215 43
(1933) (1905)
495.3 1875 Sep 09
Delhi
(University
obsy)
29 a
b
20.7
1.6
18.3
1.4
19.1
1.5
5.1
0.7
16.4
1.5
62.2
2.8
281.6
10.3
263.5
10.5
147.4
5.2
41.6
1.6
4.1
0.2
7.6
0.8
887.6
38.1
209 52
(1957) (1974)
250.0 1963 Sep 16
New Delhi
Palam
22 a
b
14.7
1.3
14.1
1.5
9.3
1.0
6.1
0.6
18.9
1.5
54.2
3.5
241.1
10.9
284.3
10.7
119.4
4.9
16.8
1.4
6.4
0.2
8.6
0.6
793.9
38.3
164 51
(1967) (1965)
265.8 1972 Jul
09
Okhala
(obsy)
21 a
b
9.6
0.9
11.9
1.3
14.7
0.9
2.6
0.3
17.1
1.4
66.9
3.4
212.5
9.3
296.3
10.7
124.6
5.1
23.2
0.9
5.7
0.3
7.3
0.6
792.4
35.1
159 66
(1964) (1974)
190.0 1967 Aug
26
Mahruali
33 a
b
13.9
1.1
10.1
0.7
7.3
0.6
9.4
0.6
3.6
0.3
28.3
1.5
159.9
5.8
152.5
5.9
98.7
3.0
11.5
0.3
1.5
0.2
2.3
0.3
499.0
20.3
197 42
(1944) (1954)
177.8 1911 Sep
28
Delhi
Sadaer
38 a
b
22.6
1.9
17.5
1.4
13.0
1.4
8.8
0.6
9.6
0.9
44.8
2.4
184.3
7.6
180.0
8.9
132.3
4.7
26.1
1.0
3.5
0.3
5.1
0.6
647.6
31.7
194 42
(1964) (1903)
224.8 1942 Sep
05
Nangloi 25 a
b
8.5
0.8
4.6
0.3
1.1
0.2
4.0
0.2
2.4
0.3
19.8
1.1
100.3
4.6
121.6
5.4
69.0
3.1
5.0
0.4
0.4
0.0
0.5
0.0
337.2
16.4
246 21
(1964) (1950)
120.0 1964 Aug
14
Sahadra 12 a
b
15.5
0.7
17.9
0.8
5.6
0.7
5.3
0.3
2.8
0.5
24.8
1.4
170.7
6.1
125.8
5.0
74.9
2.8
7.9
0.3
0.0
0.0
0.6
0.1
451.9
18.7
206 42
(1944) (1948)
129.5 1944 Sep
04
Najafgarh 23 a
b
8.9
0.8
8.2
0.7
4.7
0.2
4.2
0.4
3.0
0.4
25.1
1.3
122.0
5.5
122.8
5.6
75.9
3.2
21.7
0.8
0.5
0.0
1.8
0.2
398.9
19.1
171 10
(1942) (1959)
139.7 1954 Oct 01
Badli 23 a
b
13.7
1.0
8.6
0.7
9.6
0.6
3.6
0.4
1.4
0.2
21.8
1.1
154.2
5.8
181.3
6.4
88.2
3.7
32.9
0.8
0.8
0.0
0.0
0.0
516.1
20.7
257 37
(1961) (1951)
205.7 1962 Jul 17
Alipur 21 a
b
11.7
1.3
10.6
0.7
3.3
0.4
3.6
0.4
6.0
0.4
26.7
1.5
146.1
4.7
137.1
6.0
87.7
2.9
13.7
0.7
1.3
0.1
1.1
0.1
448.9
19.3
202 12
(1961) (1959)
162.1 1961 Jul 17
Narela 19 a
b
19.9
1.5
14.5
0.9
10.6
1.1
4.9
0.6
7.2
0.4
20.6
1.6
184.7
6.4
190.4
8.2
111.2
4.0
14.8
0.5
1.1
0.1
1.4
0.2
581.3
25.3
196 29
(1961) (1965)
184.1 1947 Sep
15
Delhi
(District)
a
b
14.5
1.2
13.2
1.0
9.9
0.8
5.5
0.5
9.2
0.8
38.8
2.1
191.6
7.4
197.4
7.9
105.3
4.0
19.3
0.8
2.8
0.1
4.3
0.4
611.8
27.0
251 44
(1933) (1951)
(a) Normal rainfall in mm.
(b) Average number of rainy days (i.e. days with rainfall of 2.5 mm or more)
* Based on all available data up to 1980.
** Years given in brackets.
23
Table 2.4 Rainfall and Evaporation Losses
Temperature:
The cold season starts towards the latter half of November when both
day and night temperature drop rapidly with the advance of the season.
January is the coldest month with the mean daily maximum temperature at
21.3ºC and the mean daily minimum at 7.3ºC. In the winter months during
cold waves which affect the district in the wake of western disturbances
passing across north India, minimum temperatures may sometimes go down
to the freezing point of water. From about the middle of March, temperature
begins to rise fairly rapidly. May and June are the hottest months. While day
temperature is higher in May the nights are warmer in June. From April the
hot wind known locally as ‘loo’ blows and the weather is unpleasant. In May
and June maximum temperature may sometimes reach 46 or 47ºC. With the
advance of the monsoon into the area towards the end of June or the
beginning of July day temperatures drop appreciably while the night
temperatures remain high. In October the day temperatures are as in the
monsoon months but the nights are cooler.
Humidity:
The air over Delhi is dry during the greater part of the year. Humidity is
high in the monsoon months. April and May are the driest months with
relative humidity of about 30% in the morning and less than 20% in the
afternoons.
Cloudiness:
During the monsoon especially in July and August skies are heavily
clouded and often overcast. In the rest of the year skies are clear or lightly
Month Jan Feb Mar Apr. May Jun July Aug Sep Oct Nov. Dec. Annual
Rainfall
(in mm) 14.5 13.2 9.9 5.5 9.2 38.8 191.6 197.4 105.3 19.3 2.8 4.3 611.3
Rainy days 1.2 1.0 0.8 0.5 0.8 2.1 7.4 7.9 4.0 0.8 0.1 0.4 27.0
Evaporation
(in mm) 71 101 177 300 400 333 233 133 147 149 102 78 2224
Source: Indian Meteorological Department
24
clouded. But in the months January, February and early March skies become
cloudy and overcast when the district is affected by western disturbances.
Winds:
Winds are generally light during the post monsoon and winter months.
They strengthen during the summer and monsoon months. Except during the
monsoon months, winds are predominantly from a westerly or northwesterly
direction and tend to be more northerly in the afternoon. Easterly and
southeasterly winds are more common in the monsoon months.
25
Chapter - 3
Hydrogeological Framework of Delhi
3.1 - PHYSIOGRAPHY
The union territory of Delhi has four distinct physiographic units; these are as
follows:
1- Delhi (Quartzitic) Ridge
2- Older alluvium on both side of the Delhi Ridge
3- Younger Alluvium –All along Yamuna Flood Plain
4- Alluvium Deposits of Chattarpur Enclosed basin
The quartzitic ridge enters the area from the South-Eastern part and passes
through the Eastern part extending up to the western bank of river Yamuna near
Wazirabad. The rocky ridge has a length of about 35km and trends in a NNE-SSW
direction. Isolated exposures of the quartzite are also found in the Western part of the
area. The elevation of the crest of the ridge varies from 213 to 314 m above mean
sea level with an average elevation of 40 m from the surrounding plain. The land
surface on the Eastern side of ridge slopes towards the river Yamuna with a general
gradient of 3.3 m/km. On the West side of the ridge the ground slopes towards the
NajafgarhJheel in the South-West.
The alluvial plain in the area is almost flat and is interrupted by cluster of sand
dunes and quartzite ridges. The sand dunes which are more prominent in the western
part of the area are of varying dimensions and have North-East to South-West trend.
The crests of these dunes generally lie between 3 to10 meters above the surrounding
plains. The dunes in the area are more area less fixed with vegetation on them. The
dunes are mostly longitudinal in nature.
The nearly closed alluvial basin of Chattarpur (280 25' 30 " to 280 32' 30'' N and
770 07 ' 30'' to 770 13' 00'' E) in South Delhi occupies an area of about 78 km2. This is
a closed inland basin, the boundary of which is marked by the quartzite ridges. The
general slope of the land is towards the center of the basin from the surrounding
ridges. The slope in the southern part of the basin is towards south. The maximum
land altitude in the basin is about 259 m MSL whereas the land at the ridges is about
274 m MSL.
26
Younger alluvium (Flood Plain) deposits are confined all along the river Yamuna,
which are presently demarcated by embankment on both sides of the river. Virtually,
this is an active flood plain domain covering an area of nearly 97 sq. km,
characterized by granular deposits with shallow depth to water level. Presently, the
entire flood plain area is protected by constructing embankment running all through
Dahia Border to Badarpur border on Western bank and Loni border to MayurVihar
border on the Eastern bank of Yamuna River within National Capital Territory. The
depth to water level varies from 3 to 6 m.bgl in active flood plain.
The river Yamuna is the only perennial river flowing in the Southerly direction.
Either side of the river Yamuna is marked by the extensive alluvial flood plain. The
aerial extent of the active flood plain in NCT Delhi is 97 sq. km. The flood plains
towards the North falls in Narela and Civil-lines tehsils of North District, the Central
parts fall in North-East district and Daryaganj tehsil of Central district and the
Southern most part falls in Saidabad and Kalkaji tehsil of South district. In general,
the alluvial flood plain slope is towards South. The average slope of the Yamuna
River bed from North to South is 0.4 m/km. Eastern and Western Yamuna Canal and
Agra Canal are the three major canals originating from the river with Bawana, Rajpur
and Lampur distributaries. A dense network of lined canals system exists in the
North-Western part of the state.
A number of micro watersheds originate from the quartzite ridge. The drainage
on the East of the ridge enters river Yamuna, whereas on the West, it enters natural
depressions located in Najafgarh Tehsil of South-West district. The geographical area
of NCT Delhi, is broadly divided into seven drainage basins, ultimately discharging
into the Yamuna – (I) The Najafgarh Drain is about 39 Km long, flows North-Easterly
and joins Yamuna River at Wazirabad in North Delhi. (ii) Supplementary drain, (iii)
Barapullah drain. (iv) Wild life sanctuary area, (v) Drainage of Shahadra area, (vi)
Bawana drain basin, (vii) Otherdrains directly out falling into river Yamuna on right
bank. Swamp areas are common along the flood plains of Yamuna.

27
3.2 - GEOLOGY:
NCT Delhi is occupied by Quartzite inter-bedded with Mica-Schist belonging to
Delhi Super Group. Unconsolidated sediments of Quaternary to Recent age
unconformably overlie these. The quartzite is grey to brownish grey, massive to thinly
bedded and structurally form a coaxially refolded regional Antiform plunging towards
South-West. The major planar structure strikes NE-SW with steep South-Easterly
dips. Quartzite occurs in the Central and Southern part of the area while the
Quaternary sediments comprising older and newer alluvium cover the rest of the
area. The older Alluvium comprises silt and clay mixed with kankar in varying
proportions. The Newer Alluvium mainly consists of un-oxidized sands, silt and clay
occurring in the Yamuna flood plain. The thickness of alluvium on eastern and
western side of the ridge is variable but west of the ridge it is generally thicker (>300
m). The area is dissected by number of faults, fractures and shears; the trend of
these varies from NNE-SSW to ENE-WSW. The important faults west of the ridge
area are Rajendra Nagar fault, MES Depot, East Patel Nagar fault, Anand Parbat,
West Patel Nagar fault and Inderpuri fault. The notable faults east of the ridge are
Kishangarh fault, a WNW-ESE trending fault between QutabMinar and Mehrauli and
LadoSarai fault. The general stratigraphic sequence of the rock formations in the
territory is given in Table-3.1.
The geological succession in the area around National Capital Territory (NCT),
as worked out by Heron (1917), is given in table -3.1 and 3.2
Table –3.1 Geological succession around National Capital Territory
Post Tertiary Recent and Sub-recent Blown sand and Alluvium nodular limestone (Kankars)
-----------------------------------Unconformity---------------------------------------- Delhi System Intrusive pegmatite, and Hornstone BrecciasKushalgarh ( Proterozoic) quartz veins , granite , Limestone amphibolites Alwar Series Quartzite, Arkoses Grits, conglomerate, Limestone, Schist, mica and contemporaneous volcanic- Railo Series, Lime Stone and quartzite -
-----------------------------Unconformity------------------------------------------- Aravali System Intrusive quartz veins, Mica Schist , crystalline Limestone, quartzite
(Archaean) granite amphibolites. Schistose conglomerate.
28
29
30
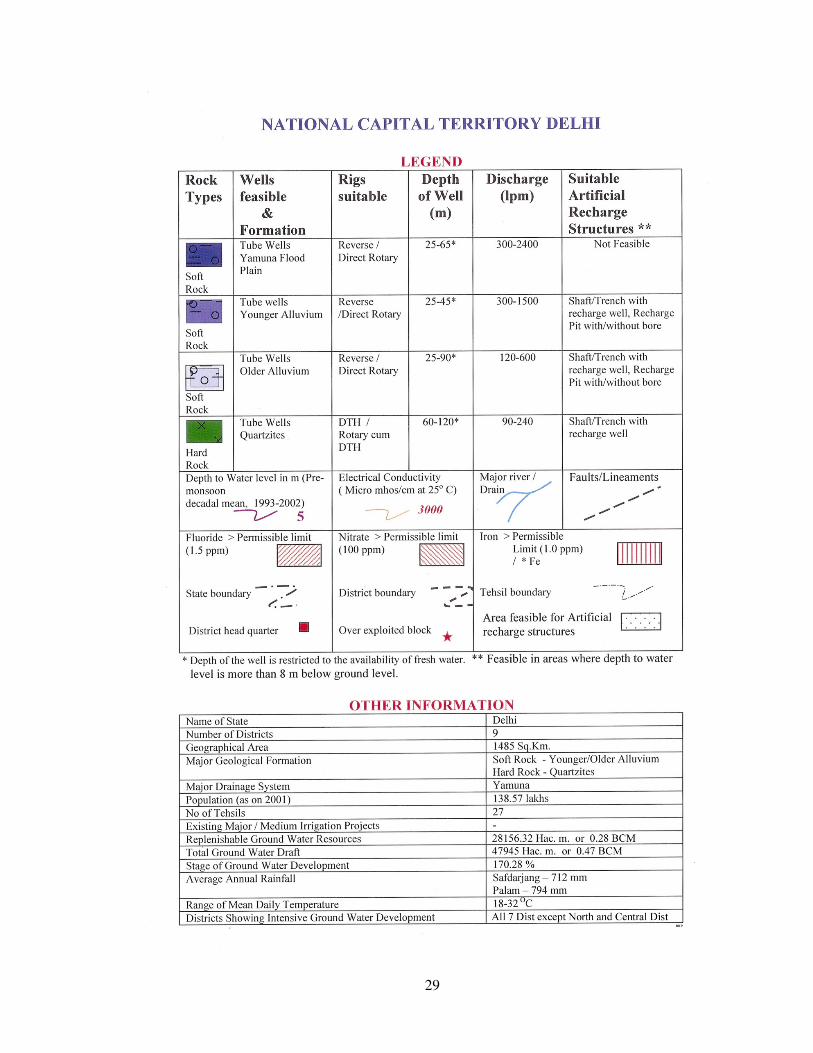
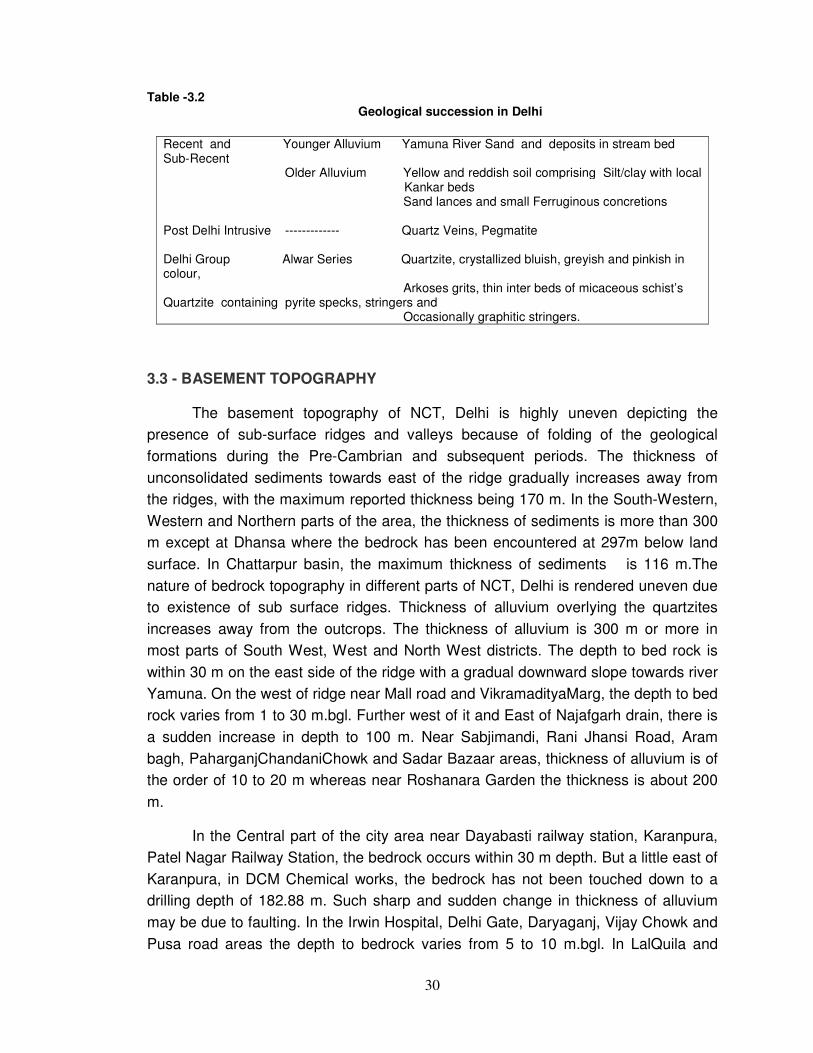
Table -3.2 Geological succession in Delhi
Recent and Younger Alluvium Yamuna River Sand and deposits in stream bed Sub-Recent Older Alluvium Yellow and reddish soil comprising Silt/clay with local
Kankar beds Sand lances and small Ferruginous concretions Post Delhi Intrusive ------------- Quartz Veins, Pegmatite Delhi Group Alwar Series Quartzite, crystallized bluish, greyish and pinkish in colour, Arkoses grits, thin inter beds of micaceous schist’s Quartzite containing pyrite specks, stringers and Occasionally graphitic stringers.
3.3 - BASEMENT TOPOGRAPHY
The basement topography of NCT, Delhi is highly uneven depicting the
presence of sub-surface ridges and valleys because of folding of the geological
formations during the Pre-Cambrian and subsequent periods. The thickness of
unconsolidated sediments towards east of the ridge gradually increases away from
the ridges, with the maximum reported thickness being 170 m. In the South-Western,
Western and Northern parts of the area, the thickness of sediments is more than 300
m except at Dhansa where the bedrock has been encountered at 297m below land
surface. In Chattarpur basin, the maximum thickness of sediments is 116 m.The
nature of bedrock topography in different parts of NCT, Delhi is rendered uneven due
to existence of sub surface ridges. Thickness of alluvium overlying the quartzites
increases away from the outcrops. The thickness of alluvium is 300 m or more in
most parts of South West, West and North West districts. The depth to bed rock is
within 30 m on the east side of the ridge with a gradual downward slope towards river
Yamuna. On the west of ridge near Mall road and VikramadityaMarg, the depth to bed
rock varies from 1 to 30 m.bgl. Further west of it and East of Najafgarh drain, there is
a sudden increase in depth to 100 m. Near Sabjimandi, Rani Jhansi Road, Aram
bagh, PaharganjChandaniChowk and Sadar Bazaar areas, thickness of alluvium is of
the order of 10 to 20 m whereas near Roshanara Garden the thickness is about 200
m.
In the Central part of the city area near Dayabasti railway station, Karanpura,
Patel Nagar Railway Station, the bedrock occurs within 30 m depth. But a little east of
Karanpura, in DCM Chemical works, the bedrock has not been touched down to a
drilling depth of 182.88 m. Such sharp and sudden change in thickness of alluvium
may be due to faulting. In the Irwin Hospital, Delhi Gate, Daryaganj, Vijay Chowk and
Pusa road areas the depth to bedrock varies from 5 to 10 m.bgl. In LalQuila and

31
Rajghat areas the depth to bedrock varies between 40 to 60 m.bgl. In Shantivan area
bedrock is encountered at a depth of 23 m.bgl. In NanglaMachi and Zoo complex,
bedrock exposures are present on surface. In Okhla village bedrock is exposed on
surface within the JamiaMiliaIslamia campus. The thickness of alluvium is about 30 m
at rail Bhawan and is about 100 to 150 m around India Gate. In Trans Yamuna area
the thickness of alluvium varies from less than 20 (near Kailash colony) to more than
150 m away from Yamuna. In Usmanpur area bedrock is encountered at a depth of
about 60 m. In Sonia Vihar area bedrock is encountered at a depth of 50 m.bgl. In
Chattarpur basin of Mehrauli block, the alluvial thickness varies from a few meters
near periphery to 115m around Satbari bund.
3.4 - SUBSURFACE CONFIGURATION AND AQUIFER DISPOSITION
Central District:
Central district of NCT Delhi is located in hard rock terrain of Delhi quartzite at
one end while alluvium is underlain by Delhi quartzite at another end. Nearly 25 Sq.
Km area covered in the district which is extending east to west, where eastern part is
just terminating along Yamuna Flood Plain. Depth to bedrock in the eastern part is
ranging from 10 to 60 m.bgl. In the western part some of the rock exposures of Delhi
ridge are also seen, sporadically covering 1.91 Sq.km area. Quaternary alluvium is
comprised of fine sand, silt, clay along with the occurrence of kankars. The sub
surface geology comprise of top soil which is silty clay and sand, sand which is
medium grained, sub-angular to sub rounded, grey in colour, composed of quartz
grains and mica flakes which occurs as massive as well as fractured, admixed with
calcareous matters and mica schist, alternate bands of light greyish to whitish in
colour. The aquifer system consists of sand which is fine to medium grained,
yellowish in colour, kankars medium to high grade. The depth to water level varies
from 2 m to 7 m. The quality of water down to 31 m.bgl is found to be fresh.
North District:
North District of NCT Delhi just lying all along Yamuna River covering 60
Sq.Km areas. Its 40% area is under Yamuna Flood Plain. The Southern part of the
District have a thin veneer of alluvium cover over quartzitic rock which is an extention
of Delhi Ridge (Strike-SSW to NNE), near Wazirabad Barrage. The slope of the
surface in the district is towards south by 0.40 m/km, but at the place of concealed
Delhi Ridge it gets elevated. Due to this reason it forms a depression at the northern
part of the upland area of the ridge leading to water logging conditions. Some of the
exploratory wells Drilled by CGWB falling in this area are Delhi University, Dhirpur
and Jagatpur encountered with bed rock at the depth of 32 m, 28 m and 167 m

32
respectively. The alluvium covers are dominant with the clayey-silt followed by buff
coloured semi plastic clay and on the margin of bedrock angular gravels with fine to
coarse sand occur. The bedrock encountered have suffered moderate to high
weathering in this area. The borehole logs of the Yamuna Flood Plain are
characterized by the granular zones consisting of fine to medium Yamuna sand. The
Percentage of Silt and Clay in flood plain are in lower side than sand.
East District:
East district of Delhi is located in the East of Yamuna River and extends up to
the borders of Gaziabad and Noida ares of Uttar Pradesh. Covering a total area of
64 Sq. Km. Virtually, East district of NCT Delhi is a domain lying in between two rivers
i.e. Yamuna in the West to Hindon in the East (6 Km eastward from the Delhi border).
The sub-surface material along yamuna flood plain and along eastern border
(proximity of Hindon River) shows thick fine sand and sandy-silt strata at shallower
depth i.e. up to 60 m.bgl. The finer sediments like clayey-silt, silty-clay and buff
coloured clay along with Kankars also do exists, as parting between granular zones.
The deeper zones beyond 60 m depth are characterized by fine material and lacking
in granular zone. The basement rock condition in East district area is moderately
uneven with gentle slopping towards East. It is unlike from western flank of NCT
Delhi. At Ghazipur, Kalyanpuri and MayurVihar a mound like basement rock prevails
in the depth range of 54 to 79 m.bgl. The basement rock situation around Yamuna
flood plain in East Delhi District is ranging from 28 to 204 m.bgl. Especially around
Akhsardham temple it ranges from 88 to 120 m.
The depth to water level in this district varies from 5 to 8 m.bgl and the
discharge of tube well in Flood Plain is in the range of 600 to 1800 LPM and in the
rest of the area it is 300 to 900 LPM with a draw-down of 6 to 13 m.
The Fresh–Saline water interface in Yamuna Flood Plain is ranging from 32 to 50 m
whereas in rest of the area it is ranging from 25 to 38 m.
New Delhi District:
New Delhi district is located centrally in the state occupying an area of 35 Sq.
Km. with varied surface altitude due to Delhi Ridge. Nearly 10 sq. Km. area falls
within ridge area having a height of 225 to 255 m Above Mean Sea Level (AMSL).
The surface is sloping gradually towards east up to the Yamuna river course where
altitude is 210 m AMSL. The sub-surface configuration of New Delhi is different at
various places, the western part which is adjoining to Delhi ridge is characterized by

33
marginal alluvium of 0 to 30 m thickness overlain on weathered and fractured
quartzite rocks (Delhi Ridge). The alluvium consists with clay, silt and fine to medium
sand. A substantial amount of Kankaris also admixed with the clayey-silt below 20 m
depth. This is the main aquifer material found in these areas. The top soil zone is
predominantly consists of silty-clay material followed by thin partings of clayey-silt,
sandy-silt and clay layers alternatively. Sandy-silt strata behave as favorable aquifer
zone with a substantial discharge. In the western part of New Delhi district covering
area of RashtrapatiBhavan, Chanakyapuri, Shantipath, South and North Avenue and
Connaught Place, tubewells are tapping both prevailing formation i.e. alluvium as well
as hard rock, whereas in the eastern part only alluvial aquifers are tapped with yield
ranging from 200 to 500 LPM. The extreme eastern part of New Delhi District
bounded by river Yamuna where a domain of Yamuna Flood Plain exists in a linear
fashion along river Yamuna .The potentiality of Ground water in this formation is
relatively high i.e. ranging from 500 to 1600 LPM.
Ground water in the area occurs both under water table as well as under semi-
confined conditions in the alluvium. The depth to water level in the district ranges from
5 to 25 m below ground level. The depth to water level varies widely depending upon
the topographic elevation; it varies from 5 to 8 m in Yamuna flood plain and increases
to 10 to 25 m towards the Delhi ridge. The tubewells usually tap kankar zone admixed
with clayey-silt and sandy-silt aquifer zone. These aquifer zones are generally
encountered alternatively below the depth of 20 m.bgl and onward up to the
basement rock.
North-East District:
North-East district is located east of Yamuna River and bordering to Gaziabad
district in the east and Merrut district in the north of Uttar Pradesh. It covers 60 Sq.Km
of area. Virtually, North-East district of NCT Delhi is a domain lying in between two
rivers i.e. Yamuna in the west to Hindon in the east (6 Km eastward from the Delhi
border).
The sub-surface material along Yamuna flood plain and along eastern border
(proximity of Hindon River) shows thick fine sand and sandy silt strata at shallower
depth i.e. up to 60 m.bgl. The finer sediments like clayey–silt, silty-clay and buff
coloured clay along with Kankars also do exists, as parting between granular zones.
The deeper zones beyond 60 m depth are characterized by fine material and lacking
in granular zone. Basement rock condition along the Yamuna Flood Plain in this
district is shallower because Delhi central ridge which is running NNE to SSW
diminishes at Wazirabad Barrage and protruding further in the same direction
resulting to shallower depth of basement condition in sub-surface–horizon. In this
34
district the depth is ranging from 54 m.bgl (Mandoli) to 67 m.bgl (Ushmanpur). Further
east the depth of basement rock increases.
The depth to water level in this district is 5 to 8 m.bgl and the discharge of tube
well in Flood Plain is in the range of 600 to 1800 LPM and in the rest of the area it is
300 to 900 LPM with a draw-down of 6 to 13 m.
The Fresh –Saline water interface in Yamuna Flood Plain is ranging from 32 to
50 m whereas in rest of the area it is ranging from 25 to 38 m.
North-West District:
The North-West district of NCT Delhi covers 440 Sq. km. area characterized by
unconsolidated quaternary alluvium deposits. So for 250 m depth has been explored
without encountering bed rock. The expected depth of bed rock is about 300 m or
beyond. Thick pile of alluvium over the basement rock possesses varied sediment
strata in an alternate fashion of geological setting. Nearly fine to medium and silt
grade of sediment are frequent up to the depth of 50 m along with buff coloured
clayey bed admixed with Coarse kankars. On the other hand after the depth of 50 m,
silty–clay and clay (Light yellow) beds with Kankars increases with depth. The semi-
plastic and plastic clay beds are also common at deeper depth i.e. 80 m.bgl to 250
m.bgl. The granular zone (Fine sand and silty–sand) at deeper depth are not so
frequent as in the shallower depth.
In large part of the district the water levels are shallow ranging from 2 to 8
m.bgl, whereas in a limited area towards the northern border (Narela) the water levels
are somewhat deeper ranging from 6 to 12 m.bgl.
The line of fresh-saline water interface also varies greatly in entire area. All
along the western Yamuna Canal and along Yamuna Flood Plain it shows deeper
existence that is between 40 to 70 m, whereas in rest of the area it is at 22 to 40 m
deep. It was also observed from the exploratory well data that salinity of water
increases with depth and there are no fresh water aquifers in between the saline
zone.
South District:
The South district of NCT Delhi covers 250 Sq. Km. of area of which 45.2 Sq.
Km area shows mountainous undulating terrain exposed with Delhi quartzite. The
district is also characterized by a saucer shaped vast alluvium field in the central part
of the district popularly known as Chattarpur Basin. Virtually this is valley fill deposit,
35
the alluvium thickness varies from 0.0 m to 140.00 m.bgl (Satbari village), below
which quartzitic basement rock prevails. Some of the villages like Chattarpur,
Gadaipur, Mandi, Ghitorni, Ayanagar, FatehpurBeri and Satbari fall within this area.
The overburden composed of unconsolidated clay, silt, sand and varying proportions
of Kankars. In the deep basin area, depth zone of 38 m to 55 m is characterized as
prominent gravel zone admixed with silt and fine sand followed by clayey-silt and fine
sand with occasional kankar nodules. Near to basement somewhat medium sands
and angular gravels (ferruginous and gritty types quartzites) are also encountered. At
some places viz.Aya Nagar &FarehpurBeri at depth near to the basement rock,
lenses of sticky yellowish clay also are encountered. The area across southern Delhi
Ridge which falls in South District namely Hauj-khas, Saket, Khanpur, Pushpvihar,
Lal-kunwa and Saritavihar are underlain by marginal alluvium deposits with a
thickness ranging from 60 m to 94 m below which Quartzitic basement rock prevails.
The bore hole constructed in Quartzites (Jaunapur, Asola, MandiTughlakabad)
reveals that moderately fractured zones are prevalent in the depth of 30 m to 90 m
and their fractured density gradually decreasing as depth increases. The weathered
zone is found at every place above hard rock but their thickness varies from place to
place.
The depth to water level varies widely in this district and is ranging from 8 m to 65
m. In the eastern tract of the district where Yamuna Flood Plain occur, depth to water
level varies from 8 m to 22 m.bgl but in rest of the area it ranges from 30 to 65 m.bgl.
The fresh/Saline water interface depth varies from 75 m to 100 m. The thickness of
the fresh water zone varies from 30 m to 85 m.
South-West District:
The South-West district of NCT Delhi covers 420 Sq. km. Majority of the area
characterized by unconsolidated quaternary alluvium deposits and about 18 Sq. Km
area is covered by denudation hills especially in the eastern part of the district.
Exploration upto a depth of 302 m was done to study the hydrogeological condition.
The bed rock was encountered at different depth i.e. in Dhansa (297 m),
Pindwalakala (300 m), Toghanpur (298 m) and Jhul-jhuli(251 m) Thick pile of alluvium
over the basement rock possesses varied nature of sediment strata in an alternate
fashion of geological setting. Nearly fine to medium and silt grade of sediment are
frequent up to the depth of 50 m along with buff coloured clayey bed admixed with
coarse kankars. On the other hand after the depth of 50m, silty–clay and clay (Light
yellow) beds with Kankars increases with depth. The semi-plastic and plastic clay
beds are also common at deeper depth i.e. 80 m .bgl to 250 m.bgl. The granular zone
36
(Fine sand and silty–sand) at deeper depth are not so frequent as in the shallower
depth.
In major part of the district the depth to water level ranges from 5 to 28 m.bgl
where as in rocky area which are lying in the eastern part of the district (Central Delhi
Ridge) the depth to water level is in the range of 22 m to 50 m.
The line of Fresh-Saline water interface also varies greatly in entire area. All
along the Najafgarh Drain and Two Depression (GumanheraVill. &PindwalanKalan)
possesses somewhat deep fresh water layer i.e. up to 35 m.bgl but on the other hand
rest of the area is having thin layer of fresh water i.e. up to the depth 25 to 28 m.bgl
only. In the Eastern rocky area the fresh–saline Interface lies at greater depths i.e.
around 80 to 90 m.bgl.
West District:
West district is occupied by unconsolidated Quaternary alluvium underlain by
Precambrian meta-sediments of Delhi System. Quaternary alluvium comprises of
sand, clay, silt, gravels/pebbles, kankars. The aquifer system include sand fine to
coarse grained admixed with kankars with little amount of clay and silt. Clay is sticky
and plastic in nature, light grayish in colour, admixed with a little sand and kankars,
fine to medium grained. The depth of water level varies in the district, 2 m to 15 m.
The depth of fresh saline interface also varies from 25 m to 50 m at different places.
The depth of fresh water zone varies from 10 m to 45 m.
37
Chapter-4
WATER LEVEL BEHAVIOR OF HYDROGRAPH STATIONS
DURING 2011-12
4.1. MAY- 2011:
Depth to water level:
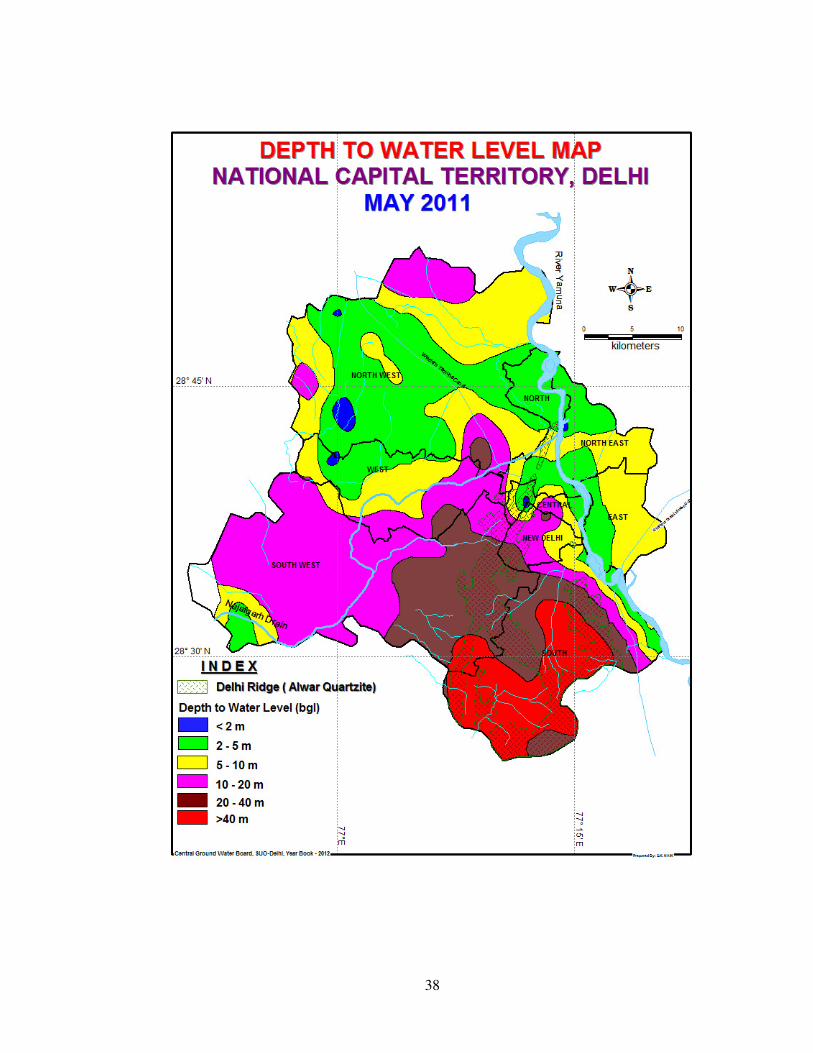
The Depth to water level recorded in NCT Delhi during May-2011 ranges from
0.96 to 66.45 m. bgl. The total 142 station of Delhi state have been analyzed district
wise where 43% wells of South district shown more than 40 m.bgl water level and
26% wells have 20 to 40 m.bgl water level. In New Delhi and South-West district 47%
and 59% of the wells show water levels ranging from 10 to 20 m.bgl, (Plate-4,
Annexure-I, Table- 4.1). In 50%, 44% and 40% of the wells in Central, East and North
West districts the water level ranges from of 5 to10 m.bgl respectively. The entire
Yamuna flood plain the water levels are between 2 to 5 m.
Annual Fluctuation:
The fluctuation of water level between May-2010 and May-2011 of Delhi state
shows rise in nearly 75% of wells with respect to the previous year water level in the
districts of North, North-West, New Delhi and South. Whereas rest of the district like
Central, East, North-East, South and South-West shows fall in the range of 0.26 to
5.70 m in 22% of the wells. The overall data indicates that South and South–West
districts are sharing a continuous fall in comparison to other areas. (Plate-8).
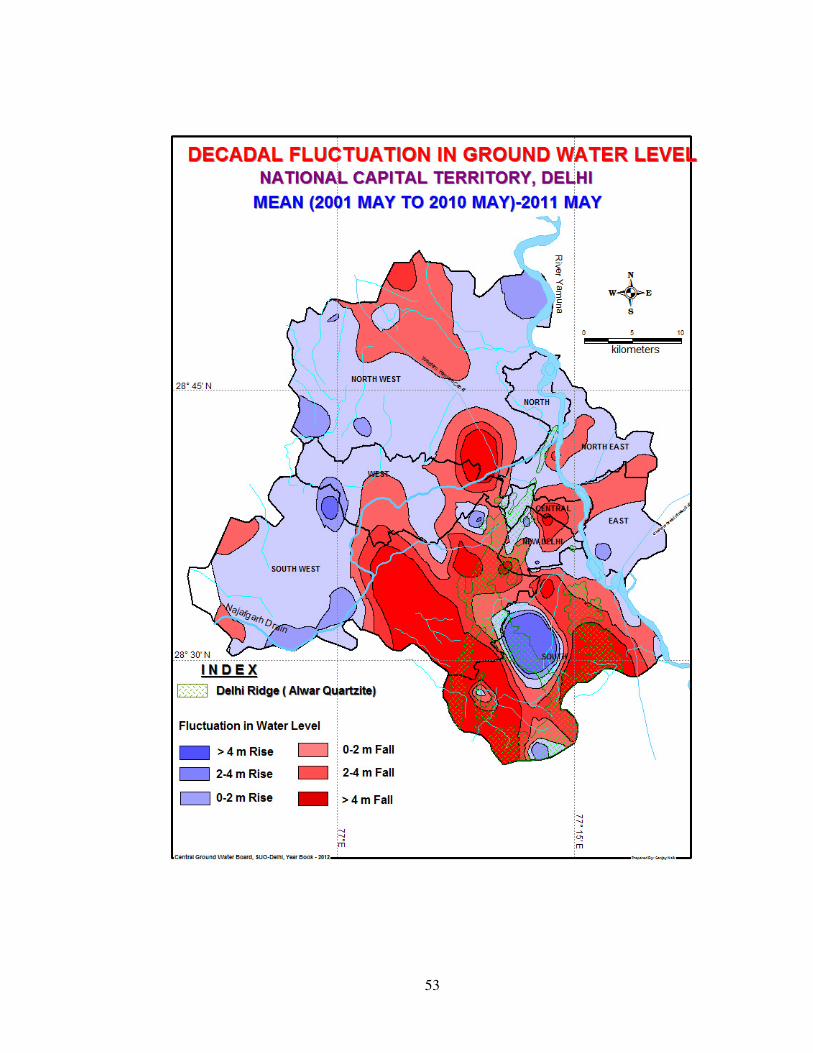
Decadal Fluctuation:
When the data of May-2011has compared with 10 year mean of May water
level 40% of the wells indicate fall in the range of 0.02 to more than 14.07 m. Only
57% wells of the North-West, West and New Delhi have been observed to show rising
condition in the range of 0 to 2 m. The maximum fall has taken place in district of
South and South-West (i.e. 9.76 to 10.96 m) (Plate-13, Table-4.2)
Area wise analysis of water level data of May, 2011 for142 stations is shown in
the following table:-
38

39

40

41
42
43
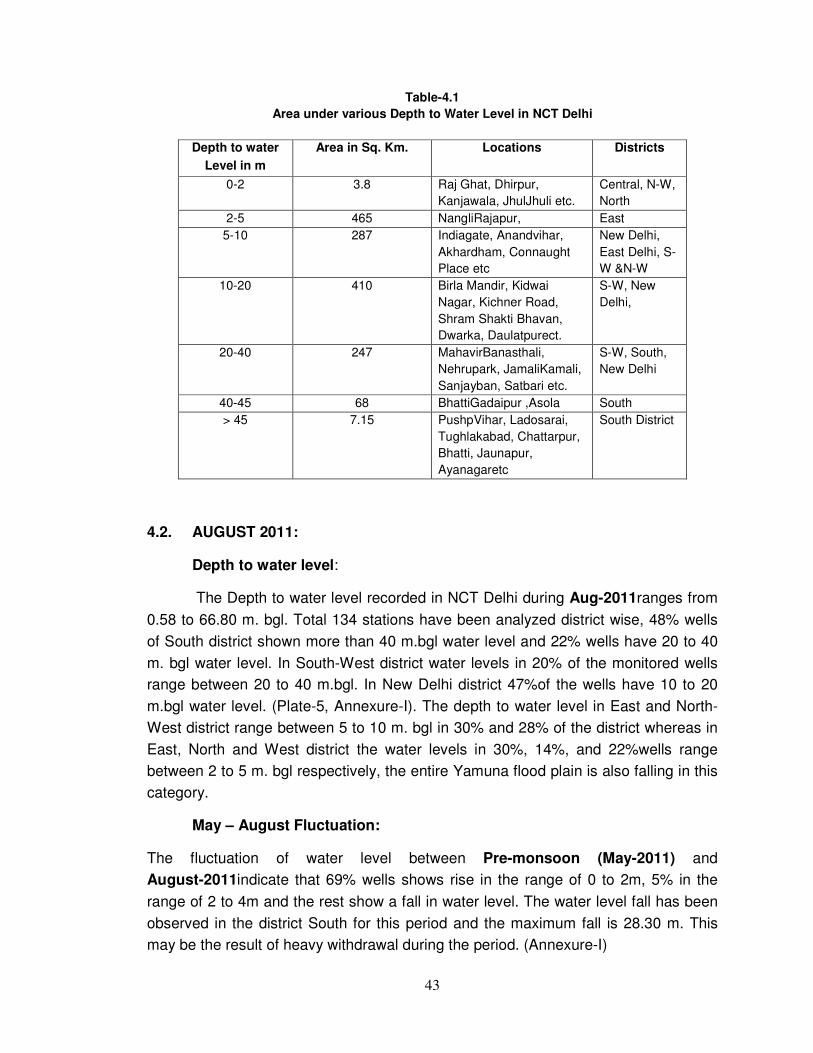
Table-4.1
Area under various Depth to Water Level in NCT Delhi
Depth to water
Level in m
Area in Sq. Km. Locations Districts
0-2 3.8 Raj Ghat, Dhirpur,
Kanjawala, JhulJhuli etc.
Central, N-W,
North
2-5 465 NangliRajapur, East
5-10 287 Indiagate, Anandvihar,
Akhardham, Connaught
Place etc
New Delhi,
East Delhi, S-
W &N-W
10-20 410 Birla Mandir, Kidwai
Nagar, Kichner Road,
Shram Shakti Bhavan,
Dwarka, Daulatpurect.
S-W, New
Delhi,
20-40 247 MahavirBanasthali,
Nehrupark, JamaliKamali,
Sanjayban, Satbari etc.
S-W, South,
New Delhi
40-45 68 BhattiGadaipur ,Asola South
> 45 7.15 PushpVihar, Ladosarai,
Tughlakabad, Chattarpur,
Bhatti, Jaunapur,
Ayanagaretc
South District
4.2. AUGUST 2011:
Depth to water level:
The Depth to water level recorded in NCT Delhi during Aug-2011ranges from
0.58 to 66.80 m. bgl. Total 134 stations have been analyzed district wise, 48% wells
of South district shown more than 40 m.bgl water level and 22% wells have 20 to 40
m. bgl water level. In South-West district water levels in 20% of the monitored wells
range between 20 to 40 m.bgl. In New Delhi district 47%of the wells have 10 to 20
m.bgl water level. (Plate-5, Annexure-I). The depth to water level in East and North-
West district range between 5 to 10 m. bgl in 30% and 28% of the district whereas in
East, North and West district the water levels in 30%, 14%, and 22%wells range
between 2 to 5 m. bgl respectively, the entire Yamuna flood plain is also falling in this
category.
May – August Fluctuation:
The fluctuation of water level between Pre-monsoon (May-2011) and
August-2011indicate that 69% wells shows rise in the range of 0 to 2m, 5% in the
range of 2 to 4m and the rest show a fall in water level. The water level fall has been
observed in the district South for this period and the maximum fall is 28.30 m. This
may be the result of heavy withdrawal during the period. (Annexure-I)
44
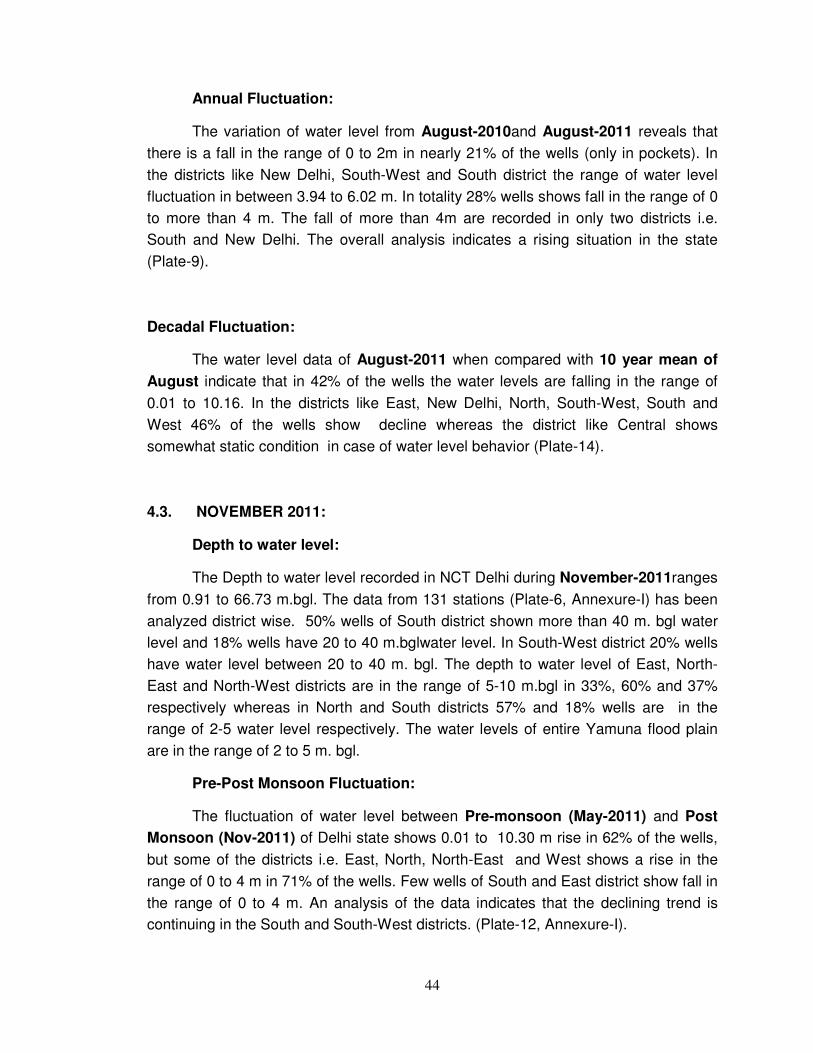
Annual Fluctuation:
The variation of water level from August-2010and August-2011 reveals that
there is a fall in the range of 0 to 2m in nearly 21% of the wells (only in pockets). In
the districts like New Delhi, South-West and South district the range of water level
fluctuation in between 3.94 to 6.02 m. In totality 28% wells shows fall in the range of 0
to more than 4 m. The fall of more than 4m are recorded in only two districts i.e.
South and New Delhi. The overall analysis indicates a rising situation in the state
(Plate-9).
Decadal Fluctuation:
The water level data of August-2011 when compared with 10 year mean of
August indicate that in 42% of the wells the water levels are falling in the range of
0.01 to 10.16. In the districts like East, New Delhi, North, South-West, South and
West 46% of the wells show decline whereas the district like Central shows
somewhat static condition in case of water level behavior (Plate-14).
4.3. NOVEMBER 2011:
Depth to water level:
The Depth to water level recorded in NCT Delhi during November-2011ranges
from 0.91 to 66.73 m.bgl. The data from 131 stations (Plate-6, Annexure-I) has been
analyzed district wise. 50% wells of South district shown more than 40 m. bgl water
level and 18% wells have 20 to 40 m.bglwater level. In South-West district 20% wells
have water level between 20 to 40 m. bgl. The depth to water level of East, North-
East and North-West districts are in the range of 5-10 m.bgl in 33%, 60% and 37%
respectively whereas in North and South districts 57% and 18% wells are in the
range of 2-5 water level respectively. The water levels of entire Yamuna flood plain
are in the range of 2 to 5 m. bgl.
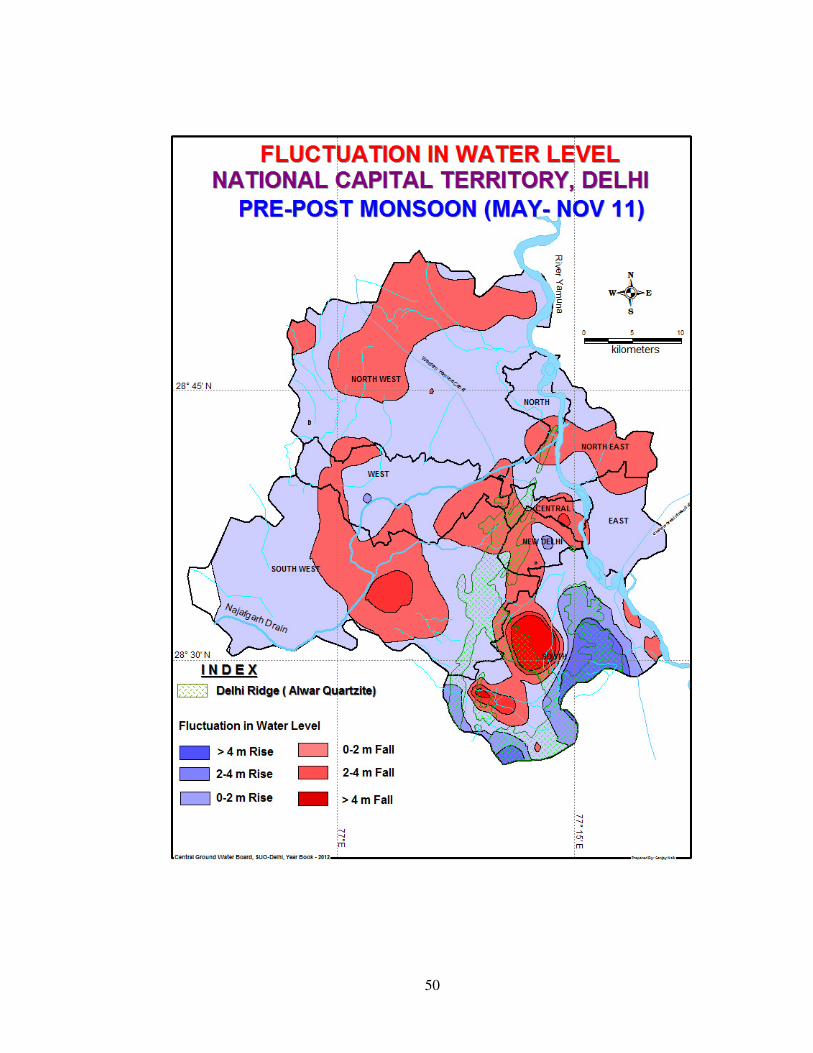
Pre-Post Monsoon Fluctuation:
The fluctuation of water level between Pre-monsoon (May-2011) and Post
Monsoon (Nov-2011) of Delhi state shows 0.01 to 10.30 m rise in 62% of the wells,
but some of the districts i.e. East, North, North-East and West shows a rise in the
range of 0 to 4 m in 71% of the wells. Few wells of South and East district show fall in
the range of 0 to 4 m. An analysis of the data indicates that the declining trend is
continuing in the South and South-West districts. (Plate-12, Annexure-I).

45
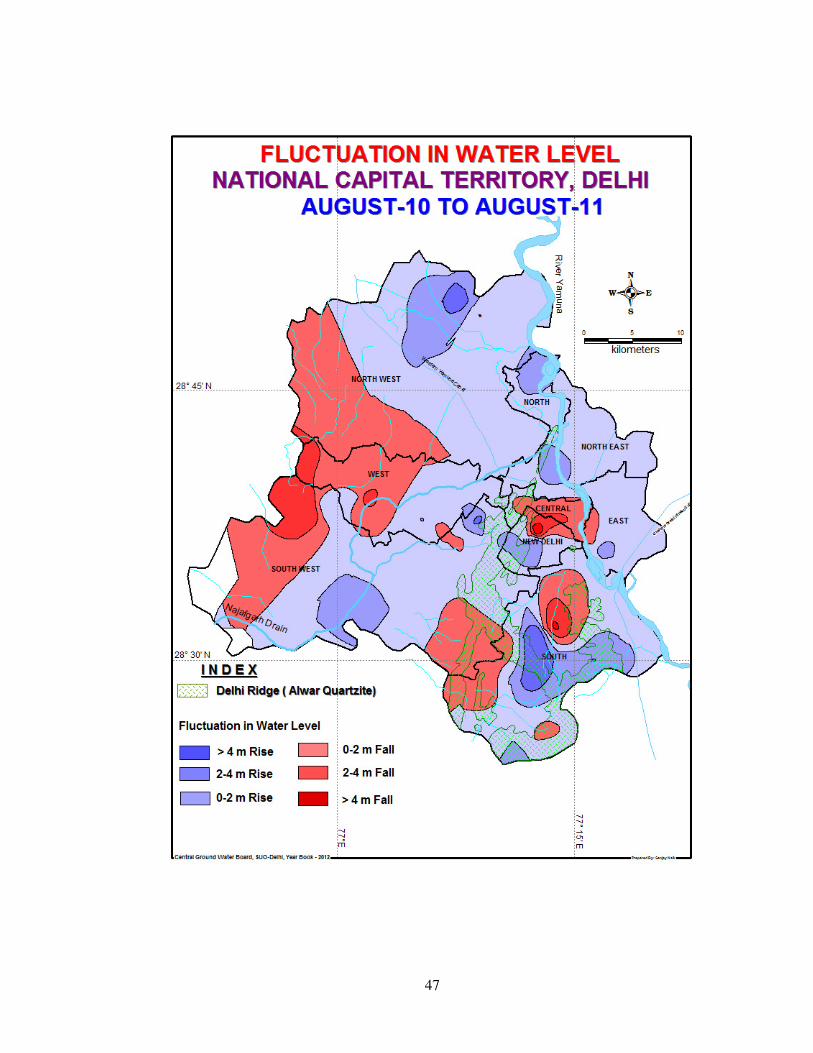
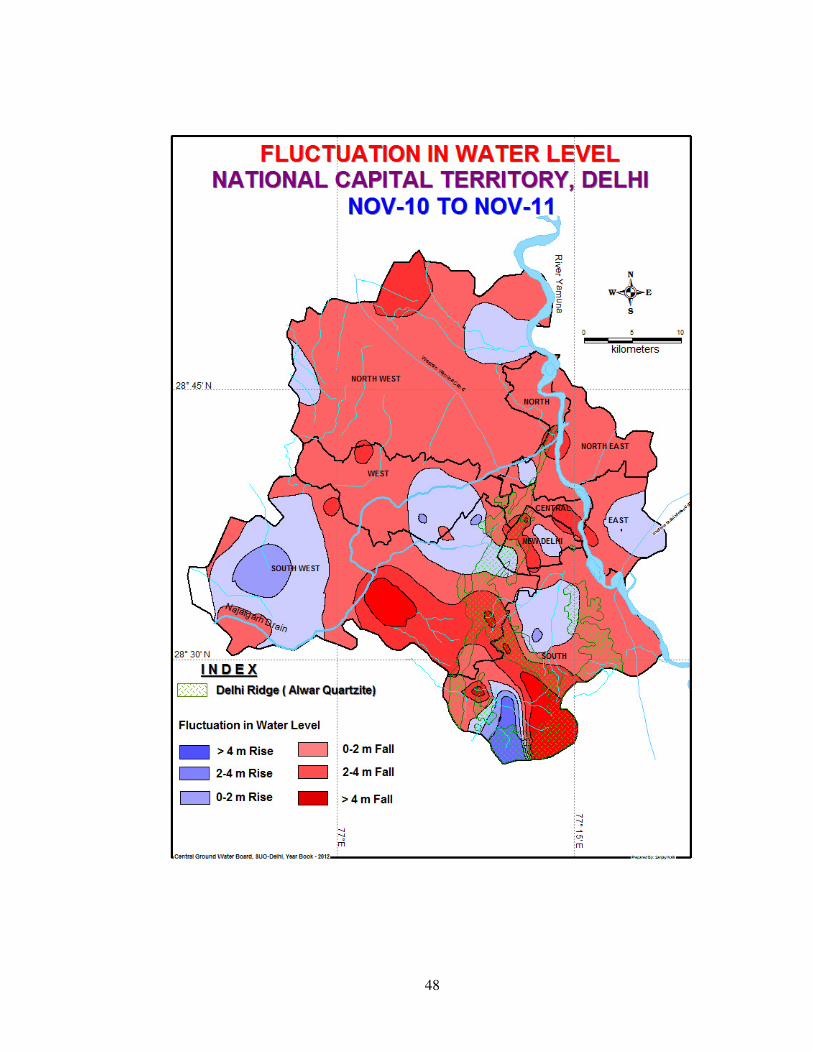
Annual Fluctuation:
The hydrograph analyses of Nov-2010 and Nov-2011water levels of 130 wells
reveals that 76% of the wells shows fall in the range of 0 to more than 4m whereas in
24% there is no perceptible change or just above than the previous year water level.
The fall of more than 4 m are recorded only in three districts, i.e. New Delhi, South
and South West. The overall analysis indicates a declining situation in the state
(Plate-10).

46
47
48
49
50
51
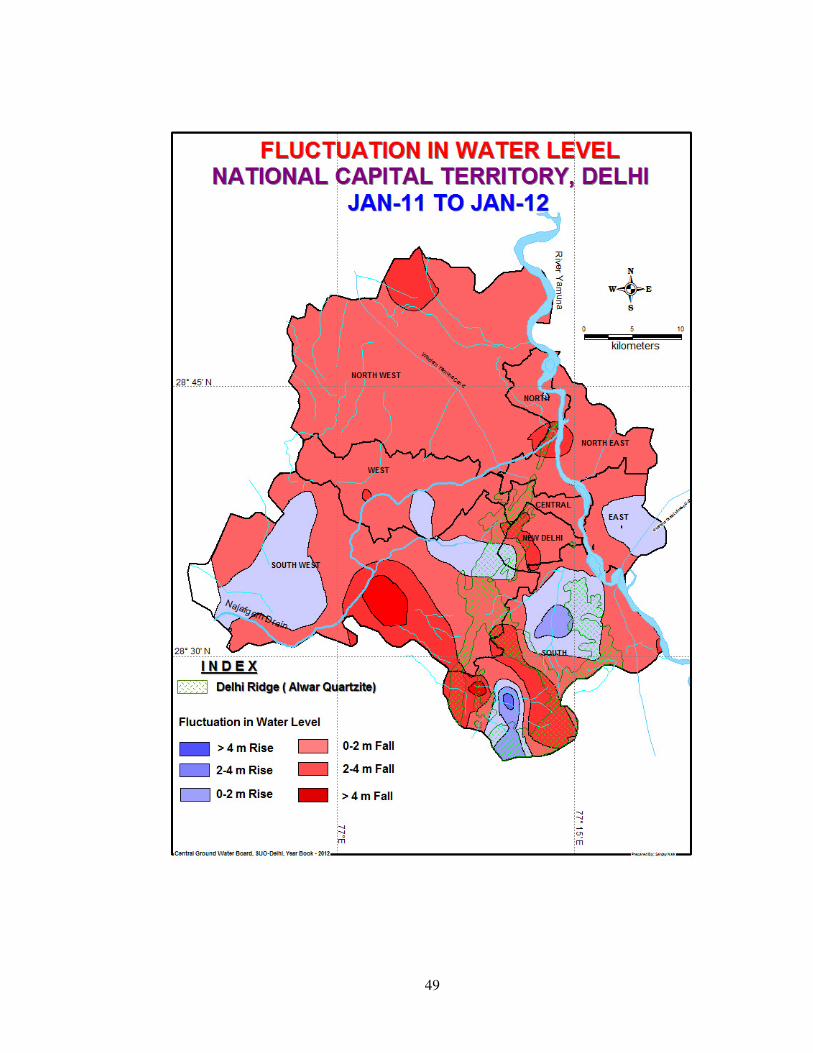
Decadal Fluctuation:
When the data of Nov-2011 was compared with 10 year mean of Nov. it
shows that the water levels in 53% of the wells have a fall in the range of 0.01to 12.28
m. Only 42% wells of the North, East and New Delhi districts have a rising condition
in the range of 0 to 2m (Plate-15).
4.4. JANUARY 2011:
Depth to water level:
The Depth to water level recorded in NCT Delhi during January-2011ranges
from 0.96 to 66.79 m.bgl. A total of 203 stations have been analyzed district wise. An
analysis of the data reveal that in south district 48% of the wells have water levels of
more than 40 m. bgl and 25% in the range of 20 to 40 m. bgl. The water levels in the
districts like South-West and New Delhi are in the range of 10 to 20 m. bgl in 50% of
the area and a few patches of 20 to 40 m. bgl water levels are also observed in New
Delhi, South and South-West districts. In rest of the districts the water level is
between of 2 to 10 m. bgl indicating that only in 27% of the state the water levels are
below 10 m. bgl (Plate-7, Annexure-I) covering entire Yamuna Flood Plain and East,
N-E, N-W and North districts. Maximum water levels in the states are observed in the
monitoring wells at Tughalakabad, Saket, PushpVihar and LadoSarai ranging
between of 58 to 62 m. bgl.
May 10 – January 11 Fluctuation:
The fluctuation of water level between Pre-monsoon (May-2010) and
January-2011have been analyzed for 200 wells in which it has been found that 39%
wells fall in the range of 0.01 to 36.78 m mostly in South, S-W and in New Delhi
District, and 59% area show rise in the range of 0.01 to 7.60 m in which the district
like East, North, N-E, West are covered (Annexure-I).

52
Annual Fluctuation:
The hydrograph analyses of January-2010 and January-2011reveals that in
70% of the wells the water level is falling and only in 29% rising, rise is in the range of
0 to 2 m. Only eight stations (Ladosarai, Jhelkhoh, Saket etc.) of South district and six
stations (Ghitorni, Kabuline, Kirbi Place etc.) of S-W district are showing fall of more
than 2 m (Plate-11).
Decadal Fluctuation:
When the data of January-2011 has compared with 10 year mean of
January. It has been observed that74% of monitoring stations of New Delhi and
North West show a fall in water level where the highest fall is 36.32 and 4.86 m
respectively. The same condition prevails in South and South West District in 73% of
the area where the highest depletion is 7.95 m and 11.02 m respectively. North East
and East have also suffered depletion of water table but this is in the range of 1.00 to
2.40 m only. The overall observation of water levels in the state indicates that the
southern district facing maximum declining condition (Plate-16).
53

54
55

56
57
Chapter – 5
HYDROGEOCHEMISTRY
5.1 - GENERAL INTRODUCTION:
Chemical quality of ground water in NCT Delhi varies with depth and space.
The fresh ground water aquifers mainly exist up to a depth of 25 to 35 m in
Northwest, West and South-West districts and in minor patches in North and Central
districts. In Southwest district, especially in NajafgarhJheelarea the fresh water
occurs up to a depth of 30 to 45 m. A localized area located just north of Kamala
Nehru Ridge (part of Delhi ridge falling in Central District) covering area of Dhirpur,
Wazirabad and Jagatpur are characterized by shallow depth of fresh water aquifers
that is in the range of 22 to 28m, regardless of proximity to River Yamuna.
In alluvial formations, the quality of ground water deteriorates with depth, which
is variable in different areas. The ground water is fresh at all depths in the areas
around the ridge falling in Central, New Delhi, South and eastern part (Ridge Area) of
South-West districts and also Chattarpur basin. In the areas west of the ridge, in
general, the thickness of fresh water aquifers decreases towards North-West, the
thickness of fresh water zone is limited in most parts of west and southwest districts.
In the flood plains of Yamuna, in general, fresh water aquifers exist down to depth of
30-45m and especially in Palla and zero RD area it reaches to the depth of 60 to 75m
below which brackish and saline water exists.
5.2 - DISCUSSION AND RESULT:
Distribution of Electrical Conductance (Salinity) in Ground Water
Electrical conductance of water is measured to get an approximate idea about
the extent of mineralization of ground water. It also gives idea of total dissolved salts
in a water sample. Out of the total 124 analyzed samples (Annexure-II) of NCT Delhi
42 samples have high EC value that is in the range of 2000 to 16700 µs/cm (Kair).
Most of the higher values are falling in western part of Delhi, especially West of Delhi
Ridge. The area of Najafgarh and Kanjhawala Block, Bhalsawa, Burari, Dhirpur and
Jagatpur are showing exceptionally high EC Values, even in shallower depth of tube
wells (i.e. up to the depth of 25/30m). While carrying out exploratory programme, it
has been found that deeper aquifer water have greater EC value than the shallow
aquifer, value increases with increase in depth.
58
South district and Delhi quartzite ridge area have EC values lower than the
2000 µs/cm (Plate-15).
Fluoride in Ground Water:
Out of 124 analyzed samples nine samples are showing higher value of
Fluoride concentration i.e. more than 1.5mg/l (this is the permissible limit of fluoride).
The data indicate that South–West and North-West districts are the only effected
parts of NCT Delhi. Rests of the sample are well within the limit of permissible limit.
The fluoride minerals present in soil strata have mostly contributed fluoride pollution
(geo-genic). High fluoride levels are mostly found in the areas where ground water is
brackish to saline in nature. Human activities like use of fluoride salts in steel,
aluminum, bricks and tile-industries and also agricultural discharges, can also
contribute for fluoride pollution in ground water (Plate-16).
Nitrate in Ground Water:
The studies carried out by CGWB indicates that nitrate concentrations in
ground water of Delhi have wide range (0.5mg/l Indirapuri Market to 1500 mg/l
Tikrikalan).Out of 124 analyzed samples (Plate-17) three samples are only showing
more than 100 mg/l i.e. Inderlok Temple well 116 mg/l, Chattarpur Temple 140mg/l
and Chawala 136 mg/l. The higher nitrate concentration may be attributed due to
combined effect of contamination from domestic sewage; livestock rearing, landfills
and run off from fertilized fields, unlined drains and cattle sheds. The perusal of data
indicates that higher concentration of nitrates are found at the places where domestic
effluent is discharged into open unlined drains and usually this places are thickly
habitated settlements. Mainly the higher concentration is due to point source of
contamination.
Delhi’s ground water has more nitrate contents at shallow levels but decrease
with depth. Well depth was found to be a dominant factor affecting nitrate
concentrations. This is mainly due to the sub-standard well construction and location
factor of wells near potential source of contamination like domestic effluent.

59
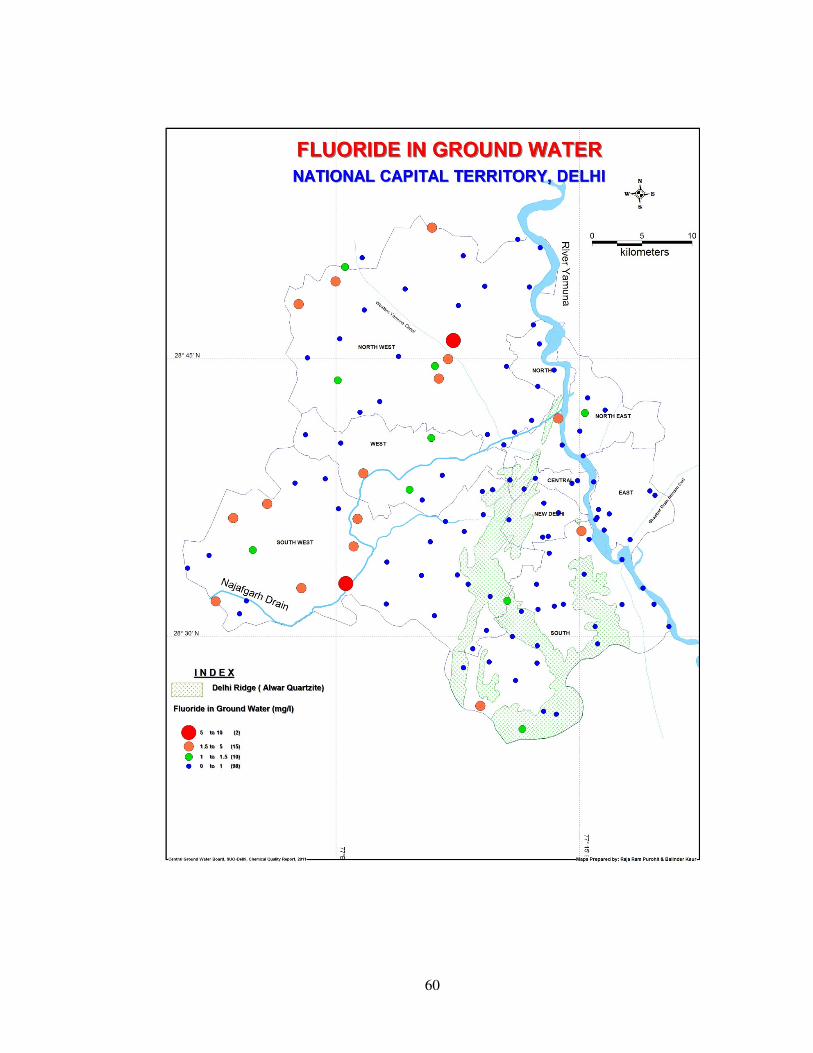
60
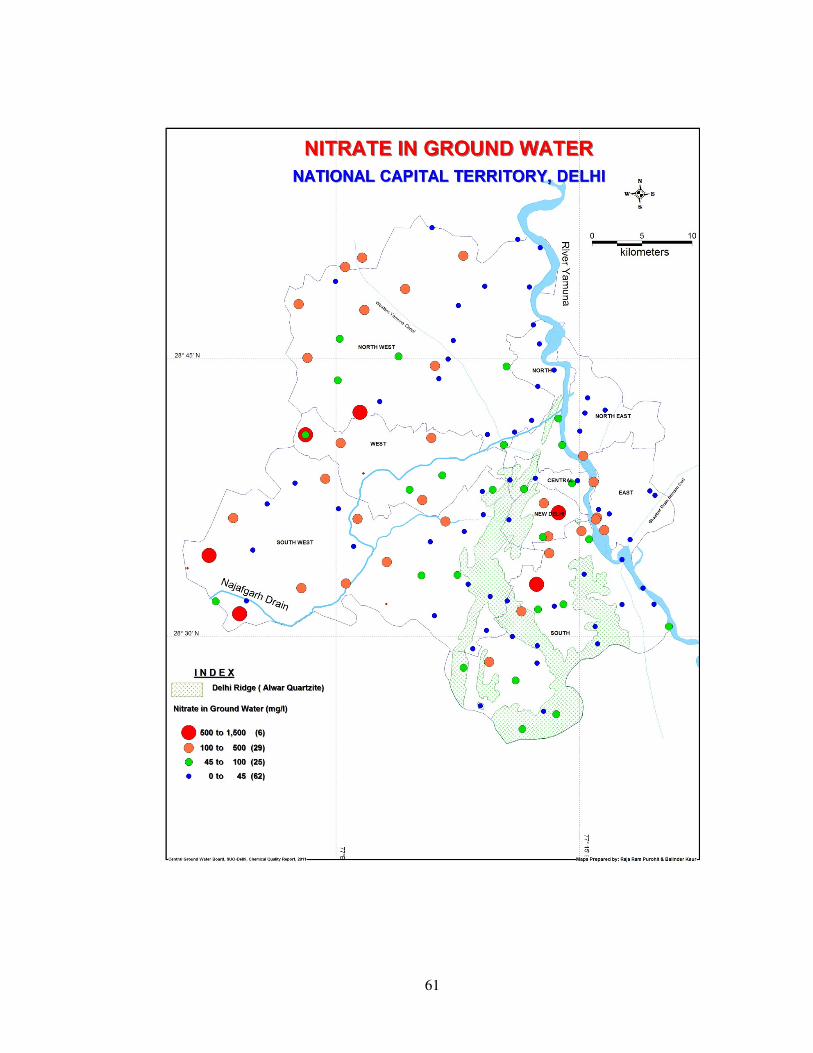
61
62
5.3 - HYDRO-CHEMICAL FACIES
The concept of hydro-chemical facies can be used to denote the diagnostic
chemical characteristics of water in hydrological systems. The facies reflect the effect
of chemical processes occurring between the mineral within the lithologicframe-work
and the ground water. The flow pattern based on the geology of the area controls the
type of facies and its distribution. The difference in hydro-chemical facies in the same
group of formations may be caused by characteristics of ground water flow and the
dilution effect of local recharge.
Hydro-chemical facies or hydro-chemical zonation for 124 analyzed data has
been carried out by plotting percentage reacting values of major ions in trilinear
diagrams. Trilinear diagram (Hill piper) which adds to the original two triangles, is a
diamond shaped area in which two points plotted with triangles are projected into
diamond and plotted as a single point. The analyzed data on the hydro-chemical
facies of ground water in NCT Delhi has been presented in trilinear diagrams (Plate-
20) which indicate distribution of hydro-chemical types present in respective area.
Formation of Various Chemical Type of Ground Water and Hydro-Chemical
Zones
The plot of South-West, West and North–West District chemical data of ground
water from more than 25m deep indicates that the water is predominantly of Calcium-
Bicarbonate type (temporary hardness) and Sodium-Chloride Type (Saline) whereas
aquifer from less than 25m shows mixed water type. Virtually, this is the end product
of exchange reactions of facies like Na-Ca-HCO3-Cl, Ca-Mg-HCO3-SO4, Na-Ca-Cl-
HCO3, Na-Mg-HCO3-SO4, Na-SO4-HCO3, Na-CO3–Cl, Ca-Na-HCO3, and Na-SO4-Cl.
In case of South and New Delhi districts where majority of samples have been
collected from deeper levels in Delhi Ridge areas are falling in the category of
Calcium Chloride Type (Permanent Hardness) and calcium Bicarbonate Type. But
few samples also fall in the range of mixed type.
In East Delhi most of the samples collected from the Akshardham and
Ghazipur Border area comes under the zone of calcium Bicarbonate type and mixed
Type.
At a few places in North District, ground water at depth of about 10/12m is of
Ca-CO3 type, which is in confirmation of general characteristic of ground water in the
recharge areas. In some of the Tube wells such as Dhirpur, Jagatpur and King'sway
camp ground water is of mixed facies, i.e. SO4-Cl, HCO3-Cl, Cl-HCO3, type with
predominance of sodium cations

63
US SALINITY DIAGRAM.
The total dissolved-solids content, measured in terms of specific electrical
conductance gives the salinity hazard of irrigation waters. Beside the salinity hazard,
excessive sodium content in water renders it unsuitable for soils containing
exchangeable ca++ and Mg ++ions. If the percentage of Na to Ca + Mg + Na is
considerably above 50 in irrigation waters, soil containing exchangeable Calcium and
Magnesium takes up Sodium and in exchange for Calcium and Magnesium causing
Deflocculation and impairment of filth and permeability of soils. The Sodium Hazard in
irrigated waters is expressed by determining the sodium adsorption ratio (SAR) by the
relation:
Na
SAR = -------------------------------------
√ (Ca + Mg) /2
Out of 124 ground water samples 72% falls in the category of C2 & C3 type of
salinity hazard, which is medium and high salinity (< 2250 EC). A few sites of S-W
District and South district fall in very high salinity category.
In case of Sodium hazard, the ground water of NCT Delhi covers low and
medium Hazard that means this kind of water contain appreciable Sodium hazard in
fine-textured soils having high cat ion-exchange capacity, especially under low-
leaching condition. A few samples of South and S-W Districts are placed under high
sodium hazard condition.
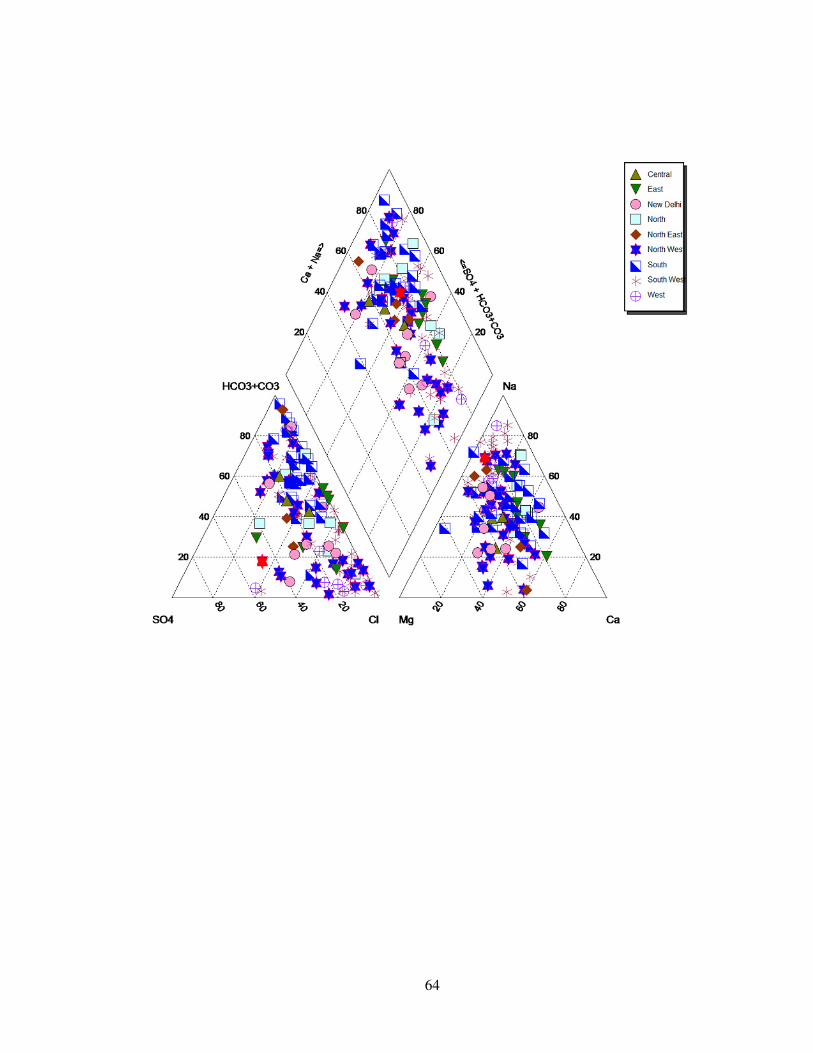
64

65