Embed Size (px)
Citation preview

&FACTSFIGURES
2014
GOVERNMENT OF BERMUDACabinet Office
Department of Statistics


F A C T S A N D F I G U R E S 2 0 1 4
Facts & Figures
2014
GOVERNMENT OF BERMUDA
Published By The Government Of BermudaThe Cabinet Office
Department Of StatisticsCedar Park Centre, 48 Cedar Avenue, Hamilton HM11
P.O. Box HM 3015, Hamilton HM MXtel: (441) 297-7761fax: (441) 295-8390
e-mail: [email protected]: www.statistics.gov.bm
October 2014Designed by Department of Communication and Information
Printed by Bermuda Blueprinting
F A C T S A N D F I G U R E S 2 0 1 4
This publication is compiled by the Department of Statistics. It shows in summary form some of the main indicators of social and economic
trends in Bermuda.
Much of the data have been drawn from published reports of government departments and public authorities. Their assistance and cooperation are gratefully acknowledged.
Symbols
— zero or less than ½%
p provisional
* fiscal year: 1 April – 31 March
r revised
$m millions of dollars
kWh kilowatt hour
000s thousands
N.A. not available
e estimate
F A C T S A N D F I G U R E S 2 0 1 4 1
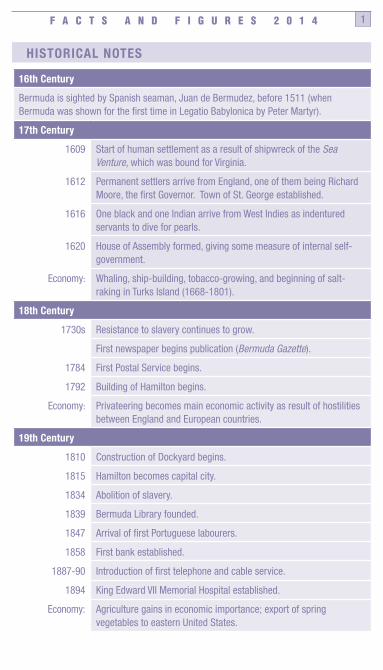
HISTORICAL NOTES
16th Century
Bermuda is sighted by Spanish seaman, Juan de Bermudez, before 1511 (when Bermuda was shown for the first time in Legatio Babylonica by Peter Martyr).
17th Century
1609 Start of human settlement as a result of shipwreck of the Sea Venture, which was bound for Virginia.
1612 Permanent settlers arrive from England, one of them being Richard Moore, the first Governor. Town of St. George established.
1616 One black and one Indian arrive from West Indies as indentured servants to dive for pearls.
1620 House of Assembly formed, giving some measure of internal self-government.
Economy: Whaling, ship-building, tobacco-growing, and beginning of salt-raking in Turks Island (1668-1801).
18th Century
1730s Resistance to slavery continues to grow.
First newspaper begins publication (Bermuda Gazette).
1784 First Postal Service begins.
1792 Building of Hamilton begins.
Economy: Privateering becomes main economic activity as result of hostilities between England and European countries.
19th Century
1810 Construction of Dockyard begins.
1815 Hamilton becomes capital city.
1834 Abolition of slavery.
1839 Bermuda Library founded.
1847 Arrival of first Portuguese labourers.
1858 First bank established.
1887-90 Introduction of first telephone and cable service.
1894 King Edward VII Memorial Hospital established.
Economy: Agriculture gains in economic importance; export of spring vegetables to eastern United States.

F A C T S A N D F I G U R E S 2 0 1 42
20th Century
1901 Tourism emerges as winter season economic activity.
1904 Introduction of electricity.
1930s Bermuda begins promoting itself as a summer tourist resort.
1931- 48 Bermuda Railway in operation.
1938 Introduction of passenger air service between Bermuda and New York.
1944 Women’s suffrage granted (with property qualification).
1946 General use of cars; establishment of first broadcasting station.
1963 Establishment of first political party.
1965 Formation of the Bermuda Regiment.
1968 New Constitution brings ministerial Government and first general election under universal adult suffrage.
1972 Bermuda College is established.
1979 Constitutional Conference.
1979 Women voluntarily join the Bermuda Regiment.
1984 The Human Rights Act of 1981 becomes operative.
1997 Pamela Gordon is appointed Premier by her United Bermuda Party colleagues, becoming the first female to hold this position.
1998 The Progressive Labour Party wins its first general election, marking the first change in Government since the establishment of party politics thirty years ago.
1998 Jennifer M. Smith, on November 9, 1998, became the first female political party leader to lead her party to a general election victory and then to become the Premier of Bermuda as a result of the said general election.
Economy: Tourism moves to forefront as primary foreign exchange earner, but gives way to international business during the last decade of the century.
21st Century
2003 U.K. Parliament passes an Order in Council to amend the parliamentary election process as laid out in the Bermuda Constitution from one based on 20 dual-seat constituencies to 36 single-seat constituencies comprising near equal numbers of eligible voters.
2008 Dame Lois Browne-Evans is celebrated as Bermuda’s first national hero on the inaugural National Heroes’ Day, 13 October 2008.
2012 The One Bermuda Alliance wins its first general election on 17 December.

F A C T S A N D F I G U R E S 2 0 1 4 3
Origin and Geography
Islands (approximately 138) are volcanic in origin with limestone cap. Mainland comprises 7 largest islands linked by bridges.
Latitude: 32° 19’ north Area: approx.20.5 sq.miles
Longitude: 64° 46’ west Max. elevation: 259.4 ft
Climate
Climate is sub-tropical and frost free.
2011 2012 2013
Air Temperature (F)
Absolute Maximum 87.8 (Aug) 88.3 (July) 88.0 (July)
Absolute Minimum 49.5 (Feb) 50.2 (Apr) 50.9 (Jan)
Mean Daily Maximum 75.7 75.9 75.1
Mean Daily Minimum 68.1 68 67.4
Mean Relative Humidity (%) 74 74 73
Annual Rainfall (ins) 40.57 49.27 61.72
Total no. of Rain days 182 174 177

F A C T S A N D F I G U R E S 2 0 1 44
Population and Vital Statistics
Population:1 1991 2000 2010
Civilian non-institutional 58,460 62,059 64,237
Male 28,345 29,802 30,858
Female 30,115 32,257 33,379
Population Density (per sq. mile)2 3,160 2,9923 3,0973
Population Characteristics:
Ethnicity
%Black 58 55 54
%White and other 42 45 46
Nativity
% Bermuda-born 73 71 69
Age
%21 yrs. Plus 73 74 77
Religion
% Anglican 28 23 16
% Roman Catholic 15 15 15
% A.M.E. 12 11 9
% Methodist 5 4 3
% 7th-Day Adventists 6 7 7
% Other4 34 40 50
Vital Statistics:5 2011 2012 2013
Crude birth rate 10.4 10.0 10.5
Crude death rate 6.6 6.5 7.6
Infant mortality rate 0 1.5 1.5
Crude marriage rate 8.6 9.3 7.6
Crude divorce rate6 2.7 2.2 2.7
Life expectancy at birth: 1991 2000 2010
Female 78 81 82
Male 70 75 771 Census Data2 Does not include land leased to the US government in 1980 and 19913 The population density includes former baselands 4 Includes non-religious and not stated5 Per 1,0006 Rates based on divorces granted

F A C T S A N D F I G U R E S 2 0 1 4 5
Economic Activity
Consumer Price Index (April 2006 = 100.0)
2011 2012 2013
All items C.P.I1 116.8 119.6 121.8
% change over previous year 2.7 2.4 1.8
Retail Sales Index (2006 = 100.0)
All retail sales2 94.4 94.7 94.6
% change over previous year -3.0 0.5 -0.2
Imports and Exports 2011 2012 2013
Merchandise imports ($m) 868.7 884.4 1,004.6
Merchandise exports ($m) 13.5 16.9 21.7
Imports by country (%):
United States 70 68 68
United Kingdom 3 4 3
Canada 12 11 12
Caribbean (mainly fuels) 1 5 7
All other countries 13 13 9
Central Government Finance ($m)* 10/11 11/12 12/13
Total Revenue 943.2 863.1 878.7
Principal sources:
Customs duty 190.8 166.8 183.4
Payroll tax 383.3 322.5 330.5
Hotel occupancy tax 8.2 7.9 8.5
Passenger tax 31.9 35.7 33.8
Land tax 48.2 50.6 54.3
International company tax 66.3 52.6 62.2
Stamp duties 27.5 19.0 22.7
Total Expenditure3 1,115.3 1,096.5 1,134.9
Current expenditure:
Salaries and wages 436.6 445.7 450.9
Other goods and services 375.1 342.4 305.7
Grants and contributions 179.0 194.1 213.0
Capital expenditure: 68.2 53.0 72.31 Annual averages2 Revised annual averages to reflect new base year (2006)3 Includes current and capital

F A C T S A N D F I G U R E S 2 0 1 46
Company Statistics1 2011 2012 2013
Local Companies 3,019 3,277r 3,440
International Companies:
Exempted 12,914 13,191r 13,297
Exempted partnership 1,317 1,368 1,400
Non-resident 638 628 604
Non-resident insurance 13 12 10
Total 14,882 15,199r 15,311
Consumer Spending 2011 2012 2013
Food, beverages and tobacco 368.5r 384.1r 392.7
Housing, light and power 948.5r 929.9r 924.9
Clothing and footwear 101.2 103.1 103.1
Household goods and services 418.2r 401.0r 392.8
Other goods and services 1,214.4r 1,207.3r 1,234.3
Total 3,050.8r 3,025.4r 3,047.1
Banking ($m)2 2011 2012 2013
Commercial Bank Assets 25,543 24,156 25,076
Cash 88 79 104
Demand and time deposits3 6,299 6,383 6,379
Investments 9,080 8,011 9,437
Loans and advances 9,214 8,833 8,342
Premises and equipment 564 531 507
Other assets 308 319 307
Commercial Bank Liabilities 25,543 24,156 25,076
Demand deposits 10,199 9,652 10,190
Time 6,572 5,650 5,896
Savings deposits 5,252 5,189 6,210
Other liabilities 506 650 415
Capital and reserves 3,014 3,015 2,365
No. of commercial banks 4 4 41 Registrar of Companies2 Bermuda Monetary Authority3 BMA has reallocated demand deposits and included them with time deposits4 Totals may not add due to rounding

F A C T S A N D F I G U R E S 2 0 1 4 7
National Accounts* 2011 2012 2013
GDP at market price ($m) 5,550.8 5,537.5r 5,573.7
GDP at constant price ($m) 5,067.5 4,822.5r 4,701.4
(2006=100)
GDP per capita 85,996 84,381 85,747
Balance of Payments 2011 2012 2013
Current Account balance ($m) 867r 926r 840r
Local Food Production ($000 2011 2012 2013
Vegetables 3,332 3,050 4,400
Fruit 198 178 190
Milk 1,656 1,587 1,504
Eggs 344 344 344
Honey 123 90 95
Total 5,653 5,249 6,533
Housing 2011 2012 2013
Residential dwelling units (000s)1 32 32 31
New units completed 393 228 118
1 As at Jan. 11, Jan. 12, Jan. 13
F A C T S A N D F I G U R E S 2 0 1 48
0 500 1000 1500 2000 2500 3000
Ag., Fishing & Quarrying
Manufacturing
Electricity, Gas & Water
Construction
Wholesale Trade & Motor Vehicles
Retail Trade & Repair Services
Hotels
Restaurants, Cafes & Bars
Transport & Communications
Financial Intermediation
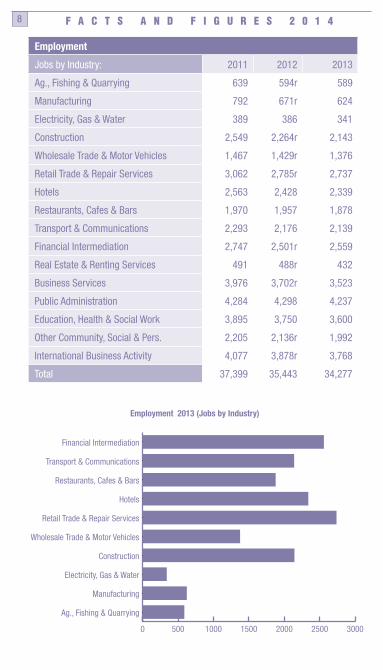
Employment 2013 (Jobs by Industry)
Employment
Jobs by Industry: 2011 2012 2013
Ag., Fishing & Quarrying 639 594r 589
Manufacturing 792 671r 624
Electricity, Gas & Water 389 386 341
Construction 2,549 2,264r 2,143
Wholesale Trade & Motor Vehicles 1,467 1,429r 1,376
Retail Trade & Repair Services 3,062 2,785r 2,737
Hotels 2,563 2,428 2,339
Restaurants, Cafes & Bars 1,970 1,957 1,878
Transport & Communications 2,293 2,176 2,139
Financial Intermediation 2,747 2,501r 2,559
Real Estate & Renting Services 491 488r 432
Business Services 3,976 3,702r 3,523
Public Administration 4,284 4,298 4,237
Education, Health & Social Work 3,895 3,750 3,600
Other Community, Social & Pers. 2,205 2,136r 1,992
International Business Activity 4,077 3,878r 3,768
Total 37,399 35,443 34,277

F A C T S A N D F I G U R E S 2 0 1 4 9
Proportion (%) of jobs held by: 2011 2012 2013
Males 51 50 51
Females 49 50 49
Bermudians 70 71 71
Non-Bermudians 30 29 29
Total Employment in Bermuda’s Information Communication Technology Sector
2011 2012 2013
Total ICT Employment1 1,327r 1,294r 1,209r
ICT Employment as % of Total Workforce 3.55% 3.65% 3.53%
Occupational Rankings by Number of Jobs and BermudianStatus in the Information Technology Sector
2013
Occupation Total Bermudian Non- Bermudian
Telecommunication Technician 191 163 28
Telephone Installer/Repairman 26 25 1
Computer Analyst 139 82 57
Electronic Computer and Related Equipment Mechanic 26 21 5
Miscellaneous 2011 2012 2013
Trade union membership
Bermuda Industrial Union 3,678 3,783 3,727
Bermuda Public Service 3,578 3,521 3,515
Avg. employment income ($) 87,458 89,748r 93,506
Avg. hours worked per week 35.8 36.1 36.0
Fisheries Industry 2011 2012 2013
Registered fishermen 305 356 315
Licensed fishing vessels2 194 n.a. n.a.
1 Industries that are involved in the development, delivery and support of advanced technological products.2 Those vessels which report volume of catch to Division of fisheries
F A C T S A N D F I G U R E S 2 0 1 410
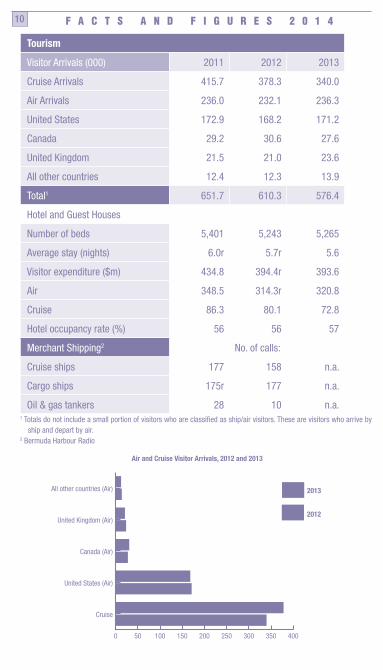
Tourism
Visitor Arrivals (000) 2011 2012 2013
Cruise Arrivals 415.7 378.3 340.0
Air Arrivals 236.0 232.1 236.3
United States 172.9 168.2 171.2
Canada 29.2 30.6 27.6
United Kingdom 21.5 21.0 23.6
All other countries 12.4 12.3 13.9
Total1 651.7 610.3 576.4
Hotel and Guest Houses
Number of beds 5,401 5,243 5,265
Average stay (nights) 6.0r 5.7r 5.6
Visitor expenditure ($m) 434.8 394.4r 393.6
Air 348.5 314.3r 320.8
Cruise 86.3 80.1 72.8
Hotel occupancy rate (%) 56 56 57
Merchant Shipping2 No. of calls:
Cruise ships 177 158 n.a.
Cargo ships 175r 177 n.a.
Oil & gas tankers 28 10 n.a.1 Totals do not include a small portion of visitors who are classified as ship/air visitors. These are visitors who arrive by
ship and depart by air.2 Bermuda Harbour Radio
0 50 100 150 200 250 300 350 400
2013
2012
Cruise
United States (Air)
Canada (Air)
United Kingdom (Air)
All other countries (Air)
Air and Cruise Visitor Arrivals, 2012 and 2013

F A C T S A N D F I G U R E S 2 0 1 4 11
Health & Education
2013
Medical and Health Personnel No.
Rate per 10,000
population
Physicians/Surgeons 173 27.9
Dentists/Dental Hygienists 78 12.6
Optometrists 8 1.3
Pharmacists 41 6.6
Dietitians 9 1.5
Registered Nurses 490 79.1
Hospital Care 10/11 11/12 12/13
General:
No. of beds 232 232 232
Discharges 6,115r 5,635r 6,062
Length of stay (days) 8.7 9.3 8.7
Occupancy rate (%) 63 62 62
Daily Bed Rate ($)1 1,082 1,098 1,120
Avg. cost of stay ($) 1,665 1,719 1,744
Other selected statistics:
Emergency visits 33,314 33,958 33,439
Operations 9,196r 9,349r 8,760
X-Ray (exams) 32,496 32,476 31,221
Education2 2011 2012 2013
Local student enrollment: 10,139 9,893 9,814
Government schools3 5,450 5,338 5,384
Private schools4 3,411 3,348 3,275
Bermuda College 1,278 1,207 1,155
Teachers5 1,295 1,295 1,234
1 Rate for public ward 2 Ministry of Education 3 Includes preschool children 4 Excludes preschool children 5 Includes school principals and special education teachers as collected in the Annual Employment Survey

F A C T S A N D F I G U R E S 2 0 1 412
Miscellaneous Statistics
Fire service1 2011 2012 2013
Total Number of Emergency Dispatches of which:
Total number of calls received 7,785 6,706 9,814
Number of EMS Dispatches (KEMH) 5,087 4,929 5,384
Number of Dispatches (Fire Service) 4,179 4,034 3,275
Politics & Government 2003 2007 2012
General Elections:
Progressive Labour Party 22 22 17
United Bermuda Party 14 14
One Bermuda Alliance 19
Total Elected Seats 362 362 362
Registered Voters (000s) 39.4 42.1 43.6
% Voting 75 76 71
Transport 2011 2012 2013
All classes of vehicles 48,661 47,367r 46,853
Private cars 21,991 21,707 21,564
Motorcycles 20,395 19,641 19,467
Buses, taxis & limousines 771 764r 768
Trucks & tank wagons 3,969 3,746 3,655
Other 1,535 1,509r 1,399
Energy Consumption3 2011 2012 2013
Electric Power (000s kW)
Total Consumption: 636,517 606,346r 586,704
Residential 265,243 249,749 295,042
Commercial 316,356 307,269 246,991
Other 54,918 49,328r 44,671
Max. Demand (kW) 118,200 113,700 110,100
Net price per kWh (cents)4
Residential 41.23 44.93 37.58
Commercial 39.92 43.79r 43.40
1 Bermuda Fire Service2 Single seat constituency with a thirty-six seat House of Assembly3 Bermuda Electric Light Co. Ltd.4 Adjusted for discount and fuel adjustment

F A C T S A N D F I G U R E S 2 0 1 4 13
Other Statistical Publications
Monthly
Consumer Price Index Free
Retail Sales Index Free
Quarterly
Bermuda Quarterly Bulletin of Statistics Free
Balance of Payments Free
Annually
Labour Force Survey Executive Report Free
Bermuda Digest of Statistics Free
Employment Briefs Free
Employment Survey Detailed Tabulation Set Free
Tourism Satellite Account Free
Information, Communication & Technology Free
Gross Domestic Product Free
Other
Household Expenditure Survey – 2013 Free
Bermuda Population Projections 2010-2020 Free
Emigration: Bermuda’s Qualified Human Capital Departs Free
Personal and Household IncomeEducation: Springboard to Employment and Higher Earnings Free
The 2010 Census of Population and Housing Free
Local School Enrollment, 2012-2013
0
1000
2000
3000
4000
5000
60002013
2012
Bermuda CollegePrivate schoolsGovernment schools

F A C T S A N D F I G U R E S 2 0 1 414
DEPARTMENT OF STATISTICS
Cedar Park Centre, 48 Cedar Avenue, Hamilton HM 11(P.O. Box HM 3015, Hamilton, Bermuda HM MX)Website: www.statistics.gov.bmE-mail: [email protected] Fax: (441) 295-8390 Tel: (441) 297-7761
SELECTED GOVERNMENT DEPARTMENTS
Registrar of Companies (441) 297-757430 Parliament Street, Hamilton HM 12
Registry General (441) 297-770530 Parliament Street, Hamilton HM 12
Immigration Department (441) 297-794130 Parliament Street, Hamilton HM 12
Department of Education (441) 278-330014 Waller’s Point Road, St. George’s DD03
Other Organizations
Bermuda Business Development Agency (441) 292-063222 Queen Street, Hamilton HM11
Bermuda Chamber of Commerce (441) 295-4201(P.O.Box HM 655, Hamilton, Bermuda HMCX)
Bermuda College (441) 236-9000Stonington Avenue, South Road, Paget PG BX(P.O. Box PG 297, Paget, Bermuda PG BX)
Visitors Information Centre (441) 295-14808 Front Street, Hamilton HM11
Bermuda Tourism Authority (441) 296-920022 Church Street, Hamilton HM11