Embed Size (px)
Citation preview

Governance in Education: Raising Performance
Maureen Lewis
(World Bank)
Gunilla Pettersson
(University of Sussex and World Bank)
22 December 2009
Acknowledgements: We are grateful to Rebecca Kinsey who compiled much of the original data, especially the perceptions-based corruption data, and to Felipe Barrera, Regina Maria Bendokat, Ariel Fiszbein, Emmanuel Jimenez, Elisabeth King, Reema Nayar, Harry Patrinos, Gary Reid, Alberto Rodriguez, Halsey Rogers, Randi Ryterman, and Lars Sondergaard for providing valuable insights and comments.
Keywords: Governance, corruption, education, education systems, education performance, indicators, education expenditures
JEL Classifications: I2, I21, I22, 128, O29

AbstractThe impacts of education investments in developing and transition countries are typically measured by inputs and outputs. Missing from the education agenda are measures of performance that reflect whether education systems are meeting their objectives; public resources are being used appropriately; and the priorities of governments are being implemented. This paper suggests that good governance can serve as an entry point to raising institutional performance in the delivery of education services. Crucial to high performance are standards, information, incentives and accountability. This paper provides a definition of good governance in education and a framework for thinking about governance issues as a way of improving performance in the education sector. Performance indicators that offer the potential for tracking relative education performance are proposed, and provide the context for the discussion of good governance in education in the areas of budget and resource management, human resources, household payments, and corruption perceptions. What we do and do not know about effective solutions to advance good governance and performance in education is presented for each area, drawing on existing research and documented experiences.

1. IntroductionThe impacts of investments in education in developing and transition countries are typically measured by inputs and outputs. Focusing on inputs (e.g. number of teachers or textbook provision) or aggregate education outcomes (such as literacy rates, enrollment and average years of education attained) while important does not capture performance, whether resources are actually deployed, or how effectively they are used. Performance is difficult to measure but it is critical to do so if education systems are to achieve their objectives and to ensure reasonable returns to public investments. This paper suggests that using good governance as an entry point can help to focus on performance in education service delivery, and in turn, provide policymakers and program managers with a basis upon which to raise performance.
What is good governance and why does it matter?
Good governance in education systems promotes effective delivery of education services. Critical are appropriate standards, incentives, information, and accountability, which induce high performance from public providers (Box 1). Sound provider performance in turn, raises the level of education outputs (e.g. school retention) and can contribute to improved outcomes (e.g. student test scores). This paper focuses on incentives, information, and accountability, that does not mean that standards are unimportant, rather these are implicit in the discussion throughout.
Improved public performance is one means to enhance returns to public education investments. It can also reduce disparities in education provision if targeted properly.1 Moreover, good governance can discourage corruption, an outgrowth of poor governance, which directly affects performance of the education sector. The remainder of this paper elaborates on the themes of good governance and performance, and the ways in which they apply to education.
The paper provides an overview of governance and performance issues in education, and attempts to identify what we do, and do not know about effective solutions to advance good governance and high performance in education, drawing heavily on the existing work of many researchers, specialists, and practitioners. The paper defines governance, presents a governance framework, and proposes a set of indicators to track education sector performance across countries and over time. The aim is to improve sectoral performance, complementing other education system efforts not addressed here, such as curriculum development, teacher training, and textbook design.
What is good governance? Kaufmann, Kraay, and Mastruzzi (2004; 2007) define it as the “traditions and institutions by which authority in a country is exercised for the common good”, which includes the process of selecting those in authority, capacity of the government to manage, and respect for the state (Annex 1). While desirable and perhaps necessary for the economic and social wellbeing of countries, these factors are neither necessary, nor sufficient to ensure effective public provision of education. Good governance in education requires enabling conditions: the existence of standards, information on performance, incentives for good performance, and, arguably most importantly, accountability (Box 1).
1 Equity in access to education is not discussed in this paper.
3

BOX 1. GOVERNANCE AND PERFORMANCE FUNDAMENTALS
Standards are transparent and publicly known criteria or benchmarks used to assess and inform education policy, provision, and performance.
Incentives are any financial or non-financial factors that motivate a specific type of behavior or action, and can be positive or negative, i.e. encourage a certain behavior or deter it.
Information in the form of clear definitions of outputs and outcomes combined with accurate data on performance and results collected at regular intervals enables sanctions to be imposed when specified standards are not met.
Accountability refers to the act of holding public officials/service providers answerable for processes and outcomes and imposing sanctions if specified outputs and outcomes are not delivered.
Ackerman (2005) describes accountability as “a pro-active process by which public officials inform about and justify their plans of action, their behavior and results, and are sanctioned accordingly.”2 Accountability requires that public servants have clear responsibilities and are held answerable in exercising those responsibilities, and if they do not, face predetermined sanctions. Without sanctions there cannot be any real accountability. Despite its importance to effective delivery of education services, real accountability is rare in most public education systems worldwide. Good governance also requires effective incentives at all levels of the education system, and both benchmarks for and information on performance in order to induce and sustain desirable behavior.
In education, poor governance results in inefficiency in service provision, and in some cases no service at all. Lack of standards, information, incentives, and accountability can not only lead to poor provider performance but also to corruption, the “use of public office for private gain” (Bardhan 1997: 139). However, the line between poor governance and corruption is often blurred. Is poor service a function of corruption or simply of mismanagement? Improving governance and (thereby) discouraging corruption in education ultimately aims to increase the efficiency of education services so as to raise performance, and ultimately, improve student learning and labor productivity.
The political economy context of education plays an important role in determining whether the ideas and analysis presented here have a chance of implementation. Indeed, some of the performance issues outlined in this paper stem from special interests that have captured the agenda and undermine performance. What is intended here is to focus on factors that help foster good governance and high performance in education systems.
Translating good governance into action
This paper identifies the key incentive and accountability issues that underpin education sector performance. In this section the conceptual framework for possible indicators that can be used to track performance in education service delivery is outlined. We are interested not simply in whether there is consultation or not between different stakeholders but also that the public sector reaches an acceptable standard of performance. That 2 Ackerman distinguishes accountability from transparency and responsiveness, which have elements of importance but are not substitutes for accountability.
4

performance entails basic functioning of the education system so that teachers are hired based on merit, administrators and teachers show up daily, adequate numbers of books are available, funds are budgeted and allocated transparently, incentives are set to promote good performance, and corruption is discouraged. Without these basic ingredients the broader education system objectives cannot be attained.
For effective service delivery, central public policymakers must have a set of objectives that are clear to lower levels of government, which then translate policy into viable programs that can be implemented by local government and service providers. For instance, (1) ministries of finance and parliaments set budget levels and broad education priorities; (2) ministries of education define specific educational objectives and translate those objectives into education programs; and (3) depending on whether the education system is centralized or decentralized, central or local government implements by constructing schools, hiring teachers and so on. This process must contain appropriate incentives, performance information, and accountability mechanisms at each level of the education system if the desired performance standards are to be attained and sustained (Figure 1).
Performance is determined by the nature of these relationships across policymakers, policy implementers, and direct providers. How things get done, and performance at the provider level, are informed by overall health policy but is defined through the specific policies and procedures of the education bureaucracy at central and/or local levels. These policies and procedures have built-in incentives, implicit and explicit, which drive performance in education service delivery, and can work at cross purposes or be mutually reinforcing.
The lines of accountability directly influence the effectiveness of performance incentives. Teachers hired, paid, and deployed by ministries of education become accountable to central government, not to local government, the community, or parents, as these entities have no financial or other leverage to hold teachers accountable. The distance between provider and central government/ministries of education can therefore become very long, and as a result, real accountability through these channels can evaporate (WDR 2004c).
5

FIGURE 1. OVERVIEW OF THE GOVERNANCE PROCESS
Ministry of education: Education
policy
Local government
Provider
performance
Service delivery quality
& Education outcomes
Beneficiaries &
Stakeholders
direction of incentives direction of accountability
direction of potential accountability
Parliament: Government
policy
direction of influence
Source: Authors.
While education providers remain technically accountable to the ministry of education, local governments, citizens and other stakeholders, in reality, they are typically not. This is in part due to the fact that provider accountability is unclear but even if accountability is clear, inadequate authority, lack of appropriate incentives, and absence of information on performance makes education systems difficult to manage and high performance hard to attain. Education ministries’ authority, and therefore, ability to hold line ministries accountable is often very limited, and this applies to parents and local governments as well. Figure 1 captures these relationships, and the direction of incentives and of accountability, between different levels of government, and between government and providers, and the roles of stakeholders and beneficiaries outside government.
To improve governance and subsequently the performance of education systems it is critical to identify the weak points that contribute to poor performance and corruption. The governance process outlined in Figure 1 indicates where governance failures tend to occur. For example, pervasive teacher absenteeism in developing countries is a symptom of governance failure due to little or no accountability of teachers to employers or parents. Budget leakages, where public education funds fail to reach intended recipients, offers another sign of governance failure due to some combination of mismanagement, lack of incentives to track funds, weak information systems that thwart the ability to track funds, and absence of mechanisms that would hold officials to account.
6

2. Good Governance in Education: Measuring PerformanceMeasuring performance is critical to establish benchmarks for efficiency, compare performance across time and providers, and assess effectiveness of public education investments. Real accountability hinges on having well-defined standards and adequate information about performance in education provision to enable policymakers and program administrators to improve service delivery.
The performance indicators proposed in this paper are generic enough to be adapted to different settings and can serve as a basis for cross-country and within country comparisons over time, and offer a menu of options. These indicators provide a starting point, drawing on existing data relevant to the education sector, which can be adopted to measure performance in education systems in developing and transition countries. Table 1 shows these indicators, which can be used to detect and assess performance in education systems, and also serves as an overview of the types of governance challenges discussed in this paper (aggregate-level governance indicators are discussed in Annex 1).
Only indicators for which at least some data are available are shown, other indicators of performance but for which there are very limited data are discussed in the text. Each indicator is defined here and its salient features briefly discussed, the indicators are then elaborated on in each relevant section under the aggregate groupings: budget and resource management, human resources, household payments, and institutions.
Budget and resource management
How funds flow through the government bureaucracy offers insights into the operational effectiveness of the government’s financial management functions. While sector specific measures are preferable, how well the overall system operates provides a benchmark for the education sector as financial management tends to be less efficient in education ministries than in either ministries of finance or on average across ministries (although there are exceptions).
Public Expenditure and Financial Accountability (PEFA) indicators are expert ratings of budget performance designed to track budget credibility, transparency, and the performance of key institutions involved in the budget cycle. They effectively provide an overall assessment of how well the budget process works. While these indicators currently only exist for overall public financial management, the process of developing sector-specific indicators, including for education, is ongoing.
Budget leakages are the discrepancy between the authorized budget for education and the amount of funds received by intended recipients. Leakages may occur at multiple stages in the education system: outflows from one level to inflows at the next level, inflows and outflows within a specific level; and leakages across multiple levels. Sometimes leakages are reported for broad expenditure categories, e.g. total public education expenditure, other times for specific expenditure areas such as payments to school teachers in a particular local district.
One common component of total budget leakages is payroll irregularities associated with ghost workers, those listed on payroll but who no longer (or never did) work for the Ministry of Education or a lower level of government. Ghost workers are typically
7

measured as the discrepancy between the number of teachers on payroll and the number of teachers employed as listed on employment records. Payroll irregularities can also result in workers who are not paid because employment records fail to include them.
Human Resources
Teachers claim a substantial share of total public education funds and pose a significant management challenge given the difficulty of allocating and supervising a large cadre of public sector workers. The indicators discussed below aim to capture the performance problems associated with the overall teacher selection process, and with subsequent performance of teachers once hired.
Job purchasing refers to the purchasing of public positions, which bypasses hiring based on objective criteria. Indicators are typically based on perceptions of the extent to which personnel hiring decisions are influenced by illegal payments, measured as the share of respondents who regard job purchasing to be common or very common, and in rare cases the “cost” of a particular job. These perceptions often differ depending on the position of the respondent in the education hierarchy making it important to use a cross-section of individuals. Related to the purchasing of posts are nepotism and favoritism in hiring. The former is defined as the illegal preference given to a relative; the latter as the illegal preference given to any person without consideration of relative merit or other objective factors. Mainly anecdotal and occasionally some perception-based evidence is available on the prevalence of nepotism and favoritism.
Teacher absenteeism is defined as the proportion of teachers (and/or administrators) contracted to be working on site during the period(s) of observation but who are not present and captures the underperformance of education providers and, depending on the reason for absence, fraud associated with unexcused absences. Teacher absence data can be collected by various means: surprise visits, direct observation at schools, attendance records kept by school administrators, or other methods that document actual and expected attendance (see Patrinos and Kagia 2007 and Rogers and Vegas 2009 for comprehensive overviews).
It is extremely difficult to reflect teacher performance in a single, direct indicator since any individual teacher’s performance depends not only on her training, skill, and effort but also on those of her co-workers, the availability of necessary equipment and materials, and student characteristics. Instead, indirect measures such as assessments of the existence and effectiveness of incentive and accountability mechanisms faced by teachers can provide insights and be useful for designing improved arrangements.
8

Household payments
Informal payments in education are charges for education services meant to be provided for free, or paid “under-the-table” directly to public officials or teachers to obtain specific favors. These are generally measured as the fraction of survey respondents reporting that they made payments to a public education entity for education services intended to be free of charge. Household surveys and perception surveys of citizens and public officials are the most common sources of information. More detailed surveys may also include the average value of payments made, to whom, and for what specific service. Types of informal payments include but are not restricted to payments for admission, advancement, preferential access to resources, and specific grades.
TABLE 1. PERFORMANCE ISSUES AND INDICATORS FOR EDUCATIONAREA ISSUE KEY INDICATOR(S)
Budget processes PEFA indicators track budget credibility, comprehensiveness, transparency, execution, recording, reporting, and external audits and scrutiny.
Budget leakages Discrepancy between budgeted public education funds and the amounts received by education providers.
Payroll irregularities Discrepancy between payroll roster and health workers on site.
Job purchasing Frequency of illegal side-payments/bribes influencing hiring decisions and of payments for particular assignments.
Teacher absenteeism Fraction of teachers contracted for service but not on site during the period(s) of observation.
Informal payments Frequency of iIllegal charges for publicly provided education services.
Academic fraud Fraction of respondents perceiving academic fraud involving payments.
Involuntary private tutoring Frequency of teachers charging for private tutoring of academic material omitted from the required curriculum.
Perceptions of corruptionFraction of households, public officials, or experts reporting corruption in the education sector.Relative ranking of education sector on corruption indices.
Institutional quality The Country and Policy Institutional Asessements (CPIA) for education.
Source: Authors.
BU
DG
ET A
ND
R
ESO
UR
CE
MA
NA
GEM
ENT
HU
MA
N
RES
OU
RC
ESC
OR
RU
PTIO
N
PER
CEP
TIO
NS
HO
USE
HO
LD
PAYM
ENTS
9

A special case of informal payments are involuntary private tutoring payments, fees paid for supplementary tutoring in academic subjects meant to be covered during regular school hours but intentionally omitted (tutoring of material that is omitted due to, for instance, a genuine lack of time are not involuntary). Some data on payments for all private tutoring (voluntary and involuntary) exist but data on involuntary private tutoring payments are very difficult to obtain. Given the prevalence and growth of private tutoring in many developing countries, more information is needed to assess the extent of informal (illegal) payments versus legal private tutoring payments, a crucial distinction for assessing inappropriate behavior.
Academic fraud by its nature often goes undetected and few data are available. Academic fraud includes but is not limited to: cheating on examinations, result falsification, credentials fraud, and diploma milling. Here the focus is on academic fraud that entails informal payments for which perceptions of academic fraud based on surveys of students, teachers or experts are the best source of data (Hallak and Poisson 2007).
Corruption Perceptions
Aggregate measures of corruption and institutional quality are difficult to create given the breadth of relevant factors. Kauffman, Kraay, and Mastruzzi (2007) have developed general indices of corruption that integrate the results from multiple perceptions surveys (see Error: Reference source not found). Some education sector specific indicators of corruption and institutional quality also exist, and complement the aggregate measures.
The World Bank’s Country Policy and Institutional Assessment (CPIA), assesses overall institutional quality and also by sector, including for education. But the CPIA includes a broad range of issues, some which affect performance and some that do not, and the degree of variation across countries is limited. Perceptions of corruption in education are generally reported as one of the following: the fraction of citizens, public officials, or experts perceiving worse-than-neutral corruption outcomes, an average of all scores across interview categories, or respondents’ ranking of how corrupt the education sector is relative to other sectors. While these perception measures are imperfect they complement the disaggregated indicators discussed above. Perceptions matter because people may change their behavior, including education decisions, based on these perceptions even if incorrect, and where perceptions are largely negative, this suggests the need to examine the performance of education service delivery more carefully.
Potential data and information sources for the indicators outlined above are shown in Table2. Some of the data and information are readily available and based on administrative data. Others draw on large surveys, some of which have only been conducted in selected countries (e.g. Quantitative Service Delivery Surveys (QSDS) and Public Expenditure Tracking Surveys (PETS)). Living Standard Measurement Surveys (LSMS), other household surveys, and public expenditure reviews exist for more countries but are administered intermittently. Still, such surveys offer a wealth of data and the basis for useful analysis that can shed light on education service delivery performance.
10

TABLE 2. SOURCES OF PERFORMANCE DATA IN EDUCATIONGOVERNANCE AREA ISSUE INDICATOR(S)
Budget processes
° Public Expenditure and Financial Accountability indicators° Focus groups with public officials, recipient institutions, and civil society° Interviews with public officials, recipient institutions, and civil society
Budget leakages
° Public Expenditure Tracking Surveys° Public Expenditure Reviews° Focus groups with public officials, recipient institutions, and civil society° Interviews with public officials, recipient institutions, and civil society
Payroll irregularities
° Public Expenditure Tracking Surveys° Public Expenditure Reviews° Focus groups with public officials° Household surveys
Job purchasing
° Official administrative records combined with facility surveys° Focus groups with public officials and teachers° Governance and Anti-Corruption Country Diagnostic surveys
Teacher absenteeism
° Quantitative Service Delivery Surveys° Surprise visits° Direct observation° Facility records° Focus groups with headmasters and parents° Interviews with headmasters and parents
Teacher performance
° Direct observation° Facility surveys° Focus groups with teachers, students, and parents° Administrative records
Informal payments
Academic fraud
Involuntary private tutoring
Perceptions of corruption
° Governance and Anti-Corruption Country Diagnostic surveys
Institutional quality
° WB Country Policy and Institutional Assessements (CPIA)
Source: Compiled by authors.
INST
ITU
TIO
NS
° Household surveys ° Focus groups with providers/students/parents ° Interviews with providers/students/parents ° Governance and Anti-Corruption Country Diagnostic surveys
BU
DG
ET A
ND
RES
OU
RC
EM
AN
AG
EMEN
TH
OU
SEH
OLD
PA
YMEN
TSH
UM
AN
R
ESO
UR
CES
11

The set of indicators discussed above are unevenly available and only sometimes enable comparison across countries, or over time, and even less often across regions and schools within countries. However, when they are available they provide important insights into governance challenges and performance issues in education. Ideally, data for indicators such as these should be collected on a regular basis and be made publicly available to provide the basis for improving incentives and accountability in education, and ultimately performance.
The remainder of this paper places each indicator from Table 1 into context describing the underlying governance failure and performance problems, and presents available evidence on potential solutions to address these challenges.
3. Budget and Resource Management
Without funding public education services grind to a halt. The flow of public funds and the ability to manage funds at the provider level thus become the first level of concern for performance of the education system. Where funds originate, consistency in disbursement and financial management combined with spending discipline at the school level are the broad categories of concern in budget and resource management. Effective incentives and accountabilities across the government, from the Ministry of Finance through the Ministry of Education, and across all entities involved in dissemination of funding to education providers are crucial, and therefore, this section is concerned with how well funds move through the institutions shown in Figure 1.
Weak governance structures, characterized by low capacity to plan, allocate and execute budgets; weak internal controls; poor management and supervision of funds; absence of external accountability (including audits); and distorted incentives that considerably increase the opportunity for mismanagement and corruption, affect the funding received by education providers, and thereby the delivery of education services. Table 3 outlines some common vulnerabilities in public financial management (PFM) systems by area.
Public financial management has well-developed standards and benchmarks for performance that are widely endorsed. Ensuring sound financial arrangements that limit leakages is the first step in building a high performance public sector, including education, and effective incentives and real accountability are the backbone of successful arrangements.
12

TABLE 3. OVERVIEW OF VULNERABILITIES IN PUBLIC FINANCIAL MANAGEMENTVulnerabilities• Absence of clear rules on hiring• Absence of management controls, internal controls• Absence or weakness in internal audit, external audit• Absence of treasury payroll matching• Absence of records, weak record record keeping• Absence of management mandates for and review of regular financial reports
• Absence of nonpayroll expenditure controls• Absence of inventory control, asset registry• Weak procurement system• Absence of management oversight and review of payment and procurement practices
• Cash or in-kind transfers• Weak or no record keeping• Absence of clear procedures for processing applicants• Failure to follow procedures• Absence of clear laws, regulations, rules for eligibility, criteria
• Absence of nonpayroll expenditure controls• Absence of management oversight and review of payment and procurement practices• Weak procurement system
Source: Adapted from Dorotinsky and Pradhan (2007).
Capital expenditures
Employee compensation
Goods and services
Transfers
Measuring budget performance
It is difficult to assess budget performance directly but some very useful process indicators exist based on the Public Expenditure and Financial Accountability (PEFA) framework. This uses a comprehensive set of 31 indicators to assess overall performance of public financial management systems (PEFA Secretariat 2005).3 Indicators especially relevant to education are shown in Table 4.
3 At the time of writing, PEFA assessments had been carried out in 100 countries, out of which about 40 assessments are publicly available.
13

TABLE 4. SELECTED PUBLIC EXPENDITURE AND FINANCIAL ACCOUNTABILITY (PEFA) INDICATORS RELEVANT TO EDUCATIONPredictability and control in budget
execution Budget credibility Budget comprehensiveness and transparency
° Predictability in the availability of funds for commitment of expenditures
° Aggregate expenditure outturn compared to original approved budget
° Transparency of inter-governmental fiscal relations
° Recording and management of cash balances, debt and guarantees
° Composition of expenditure out-turn compared to original approved budget
° Public access to key fiscal information
° Effectiveness of payroll controls
° Competition, value for money and controls in procurement
° Effectiveness of internal controls for non-salary expenditure
° Effectiveness of internal audit
Policy-based budgeting Accounting, recording and reporting External scrutiny and audit
° Orderliness and participation in the annual budget process
° Availability of information on resources received by service delivery units
° Scope, nature and follow-up of external audit
Source: PEFA Secretariat (2005).
The PEFA indicators are rated from 1-4 with + modifiers (4 indicating strongest performance).4 Scores for three PEFA indicators especially relevant to education: (1) aggregate expenditure compared to original approved budget (in some countries there are large discrepancies suggesting that allocated resources do not reach service providers), (2) effectiveness of payroll controls (a particularly critical issue for education given that the payroll costs in education are the largest among government sectors), and (3) availability of information on resources received by service delivery units.
The PEFA indicators are useful for identifying where in the budget process governance and performance problems exist. For example, a poor score on the aggregate expenditure outturn compared to original approved budget indicator may be a sign of poor management, inadequate monitoring of processes, and/or of weak disbursement systems. In any event, there is a clear absence of accountability in financial management. If a country scores low on the effectiveness of payroll controls indicator, the problem of payroll irregularities may be serious. A low score on availability of information on resources received by service delivery units indicator suggests some combination of inadequate transparency, poor recordkeeping, low budget management capacity, and insufficient accountability.
4 The PEFA indicators are rated from A (best) to D with + modifiers, here we have converted them into numerical values for ease of exposition.
14

Data for five countries are shown in Figure 2 to illustrate relative performance across these three areas. Bangladesh scores relatively poorly on all three indicators; the Dominican Republic scores the worst on aggregate expenditure outturn compared to the original approved budget; Macedonia scores comparatively poorly on information on resources received by service delivery units; and Mozambique and the Ukraine both score poorly with respect to the effectiveness of payroll controls. PEFA indicators can thus be helpful in pinpointing and prioritizing areas where action is needed to strengthen budget processes and help bolster good governance in PFM.
FIGURE 2. SELECTED PUBLIC EXPENDITURE AND FINANCIAL ACCOUNTABILITY (PEFA) INDICATORS FOR FIVE COUNTRIES, 2005-07
01
23
4S
elec
ted
PE
FA b
udge
t per
form
ance
indi
cato
rs
Bangladesh Dominican Republic Macedonia Mozambique Ukraine
Aggregate expenditure outturn compared to original approved budget
Effectiveness of payroll controls
Availability of information on resources received by service delivery unit
Source: PEFA Secretariat (various years).
Budget Leakages
Weaknesses in budget management can result in funds never arriving at their intended destination due to mismanagement, arbitrary reallocation or theft, and where allocated education funding is not disbursed, or is diverted en route from the point of disbursement to schools, education provision tends to suffer.
Public Expenditure Tracking Surveys (PETS) and Public Expenditure Reviews (PERs) are important means to track funds and scrutinize the flow of public resources in education across administrative layers (Engberg-Pedersen et al. 2005; Reinikka and Smith 2004;
15

Savedoff 2008).5 Tracking inflows, understanding spending, and identifying where governance failures may arise, PETS and PERs complement what PEFA evidence reveals about government-wide performance, thereby offering an important diagnostic on budget management and possible leakages.
PETS can be a useful tool for determining where leakages occur in the flow of funds, and what types of flows are more vulnerable to leakage in a particular country. There are several potential leakage points as illustrated in Figure 3: discrepancies between budgeted and disbursed funds; differences in outflows from one level to inflows at the subsequent level; differences between inflows and outflows within a specific level; and leakages across multiple levels in the chain of budget allocations (Savedoff 2008).
FIGURE 3. OVERVIEW OF POTENTIAL LEAKAGE POINTSLevel and Recorded Information Potential Leakage
Absenteeism, Theft
Level 1
Budgeted
Authorized
Disbursed
Level 2Inflow
Outflow
Level 3Inflow
Outflow
FacilityInflow
Outputs
Diversion
Policy Changes
Diversion, Theft, Administration
Diversion
Diversion
Diversion, Theft, Administration
Figure 1: Representation of Potential Leakage Points
Diversion, Theft, Administration
Level and Recorded Information Potential Leakage
Absenteeism, Theft
Level 1
Budgeted
Authorized
Disbursed
Level 1
Budgeted
Authorized
Disbursed
Level 2Inflow
OutflowLevel 2
Inflow
Outflow
Level 3Inflow
OutflowLevel 3
Inflow
Outflow
FacilityInflow
OutputsFacility
Inflow
Outputs
Diversion
Policy Changes
Diversion, Theft, Administration
Diversion
Diversion
Diversion, Theft, Administration
Figure 1: Representation of Potential Leakage Points
Diversion, Theft, Administration
Source: Savedoff (2008).
The much cited study on Uganda by Reinikka and Svensson (2004) provides an example of extensive budget leakages; in 1995, on average, only 22 percent of capitation grants reached primary schools. The leakage of these funds was likely due to a combination of non-disbursement for bureaucratic reasons, diversion of resources to purposes other than education, and private capture by local officials and politicians.
Evidence from PETS in other countries further illustrates the extent of leakages in primary education (Table 5). Certain types of funding, discretionary as opposed to rules-based, and in-kind and cash flows, may be more susceptible to leakages. In Zambia, leakages of fixed school grants were estimated at 10 percent compared to 76 percent for a discretionary non-wage grant program in 2001 (Reinikka and Smith 2004).5 For access to available PETS by country see http://go.worldbank.org/HSQUS4IS20. Also see Savedoff (2008).
16

A PETS for Tanzania in 1998 showed that merely 43 percent of non-wage funding destined for primary schools reached schools with the remaining 57 percent going to non-education sectors and private capture. Similarly, a PETS for Ghana found that in 2001 only 51 percent of grants made it to end-users. The 49 percent that did not reach schools were seemingly lost between line ministries and districts at the point at which public funds were converted into in-kind transfers (Reinikka and Smith 2004).
TABLE 5: BUDGET LEAKAGES OF NON-WAGE FUNDS IN PRIMARY EDUCATION IN SELECTED COUNTRIES, 1995-2001
Expenditure program Leakages (%)
Uganda (1995) Per capita student capitation grant 87
Zambia (2001) Discretionary non-wage grant program 76
Tanzania (1998) Non-wage spending in (multiple programs) 57
Ghana (1998) Non-wage spending in (multiple programs) 49
Papua New Guinea (2001) School fee subsidy 16-29
Zambia (2001) Fixed school grant 10Source: Instituto Apoyo and World Bank (2002); Reinikka and Smith (2004); World Bank (2004a).
Most education PERs address governance and performance problems, explicitly or implicitly, and contain information on performance and potential solutions to identified governance weaknesses and performance challenges.
A PER for Sierra Leone describes a stark case of leakages but also hints at a possible solution. Schools receive a per student fee subsidy each term but there were serious problems in ensuring that the subsidies actually reached schools. Two different methods were used to transfer the subsidy to schools. The first allocated the subsidy to the Education Secretaries and to the District Education Offices, for onward transfer to schools. The second used a third-party, KPMG, to distribute the subsidy directly to the schools (World Bank 2004b).
The first method led to substantial leakages with merely 45 percent of the funds disbursed centrally, and 28 percent of teaching materials, reaching schools during the last two terms of the school year 2001-2002 (Transparency International 2004). When funds were instead transferred via KPMG during the first term of 2002-2003, 78.8 percent of funds disbursed centrally reached schools, and 98.6 percent of the funds actually transferred to KPMG reached schools, and about 70 percent of teaching materials (World Bank 2004b; Transparency International 2004). A 10 percent service charge was paid to KPMG, and some transportation costs were incurred, thus the loss between central disbursement and KPMG was no more than 10 percent (Sewell 2004).
The difference in the amount of the subsidy received under the two delivery methods is stark. However, some anecdotal evidence suggests that now leakages occur after schools receive funds, rather than en route (World Bank 2004b). This underlines the importance of having effective incentives, accurate and up-to-date financial information, and accountability mechanisms at all levels of the education system so as not to shift leakages from one level to another.
17

Payroll irregularities
Teachers listed on payroll and being paid but who no longer, or never, worked at a school are manifested as payroll irregularities, and are made possible by the absence of accurate and updated employee records, functioning information systems, payroll controls, and internal and external controls (e.g. payroll audits). The flipside is not uncommon, where teachers who are on the payroll do not receive their wages (or receive them with great delay).
Multiple reasons account for the discrepancy between employee records, actual numbers of teachers employed, and teachers listed on payroll. Lists of public sector teachers are sometimes kept by multiple agencies (e.g. the Ministry of Education, the Ministry of Finance, and schools) and are often infrequently updated. Where teachers have left, died, or retired, and those separations are not recorded there is a disconnect between official records and actual teacher numbers. Such problems may be the result of administrative error or fraud, and suggest the need for efforts to strengthen both personnel and budget management, and accountability. Poor scores on the PEFA indicator effectiveness of payroll controls (Table 4) may imply the existence of ghost teachers on payroll.
Some of the estimates of the prevalence of ghost workers that are available come from Uganda, Honduras, and Papua New Guinea. Ghost workers were estimated to account for approximately 20 percent of primary teachers in Uganda in 1995, by 2005/06 this share had declined to 4 percent (World Bank 2007c). In Honduras, 2.9 percent of education staff and 4.6 percent of primary school teachers did not exist in surveys from 2000 (Dehn, Reinikka, and Svensson 2003).
In Papua New Guinea, there was notable discrepancy between the number of teachers on payroll and those on school rosters for a sample of 205 schools surveyed. Figure 4 shows how the different gross and net rates were computed. The total number of teachers listed on payroll was 5,982, out of these 1,534 teachers were on the surveyed PESD schools’ roster and also on the payroll; 346 teachers were on payroll but not on any of the surveyed schools’ roster, a gross ghost teacher rate of 15 percent.
18

FIGURE 4. GHOST TEACHERS IN PAPUA NEW GUINEA, 2002
Source: World Bank (2004a).
Another area in which poor governance often results in resource leakages and corruption is public procurement. This is due to the uniqueness of the public procurement process in that (1) private sector participants who are stakeholders in the outcome of the process directly participate; (2) large, discrete amounts of public expenditure are involved; and (3) it entails significant discretion on part of public officials (PEFA Secretariat 2005). When governance is weak, manifested by the lack of a clearly regulated procurement process; little or no accountability; weak incentives for public officials involved in the process to ensure an efficient and fair process; and inadequate oversight and controls, the opportunity for inefficiencies and corruption is exacerbated (Ware et al. 2007).
In the education sector, poor governance provides opportunities for leakages and other irregularities in procurement for the construction and maintenance of school buildings, the purchase and distribution of textbooks, the acquisition of school supplies, and the delivery of school meals. For example, in the Philippines, a 1998 audit found that the Department of Education had bought US$320,000 worth of textbooks that were overpriced by bidders, not fit for use, or simply not delivered (Leung 2005; OECD 2006). A combination of factors, including non-transparent procurement rules, inadequate controls, and the inability to effectively hold public officials with significant discretion over procurement decisions accountable, led to the collapse of public sector performance.
19

Potential solutionsBetween inputs and outputs, and between outputs and outcomes, are the institutional and public sector actions that define performance. The budget and resource management solutions aimed at improving governance and thereby education sector performance listed below vary in scope and design but all share common elements: the need to put in place effective incentives, increase oversight, and introduce accountability.
Performance based budgeting
One potential way to address poor governance in public financial management is performance based budgeting, which links allocated funds to measurable outputs or outcomes to improve resource allocation and resource-use efficiency to enhance the quality of public expenditures and, ultimately, public service provision (OECD 2007; World Bank 2008). Two main characteristics set performance-based budgeting apart from traditional budgeting systems: “the greater focus on the achievement of public program objectives and their alignment with government policies” and “an emphasis on holding senior officials accountable for deliverables – often with an accompanying change in the nature of expenditure controls, away from detailed ‘line item’ input controls to one where managers are held accountable for both results and the use of inputs” (World Bank 2008: 6). Only some qualitative evidence on the effectiveness of overall performance-based budgeting in improving performance exists for developing and transition countries, and evidence for the education sector in particular is lacking.
Increasing internal transparency: information and its systematic application
Internal transparency, which ensures that information and data are recorded accurately and on a regular basis, and are available to decision makers on demand, is a vital component of good governance in budget and resource management. When internal transparency is strong, monitoring of management is more effective and detection of irregularities in the budget process easier. To strengthen internal transparency typically requires the creation of effective information management systems, training of staff in their application and use, and, crucially, the introduction of incentives for accurate reporting of data and their use. The importance of getting incentives right is illustrated by the Sierra Leone example. Comparing EMIS data on student enrollment with those from two other sources and from random checks it became apparent that some districts were significantly over-reporting their student numbers as school principals had strong incentives to over-report but no incentives to report accurately (Hamminger 2008).
Improving internal controls: oversight, audits, and simplification
Management control and oversight are necessary to implement financial and budget rules, establish civil servant accountability, and improve performance. Audits can detect a range of financial irregularities and provide information on means to rectify problems when incentives to follow up and respond to audit findings are in place. To help minimize the time and cost of audits, education and finance ministries can undertake record simplification and procedural streamlining. Improved oversight, follow-through on recommendations, and institutionalization of audit procedures can promote progress in these areas.
20

Strengthening external accountability mechanisms: parental and community involvement
Improved access to information on education budget allocations and disbursements for stakeholders (e.g. parents and civil society) can complement initiatives such as those mentioned above. This is particularly relevant to primary education (whereas at tertiary level there is less potential for influencing policy or its execution). These measures have been shown effective in Uganda where a campaign publishing monthly inter-governmental transfers of education funds in the main newspapers and posting details of primary education funds transfers on notice boards in schools and district centers provided parents with information, which enabled them to hold local officials and providers accountable for funds transfers (Reinikka and Svensson 2005). Still, this type of action arguably only works when parents and communities have the ability and means to discipline providers if they perform poorly, and also tend to depend on the education and income levels of parents. More evidence is needed to determine how and when access to information can help strengthen external accountability.
Payroll cleanup and management
Regular updating of employee lists and payroll commitments is a basic management tool and is a high priority for education systems, which have large numbers of employees. While politically difficult and not inexpensive, accurate, up-to-date employee records are a critical starting point for improving staff management and reducing payroll irregularities. Physical verification where teams visit points of pay and verify that teachers on payroll exist and are being paid the correct salary can be carried out. A less costly method is to have auditors carry out spot checks at schools to verify that teachers on payroll exist. Uganda has undertaken several payroll cleanups and has seen a decline in the share of ghost teachers from roughly 20 percent in 1993 to 4 percent in 2005/06 (World Bank 2007c). However, it is not possible to determine how large a share of this decline is attributable to payroll cleanups although they have likely contributed.
Tracking the flow of funds
PERs and PETs in the education sector can provide information on where budget leakages take place during the flow of funds. Quantitative Service Delivery Surveys (QSDS) provide a useful complement since they track services instead of flows of funds, providing further information on areas that are prone to leakage. Once the main governance weaknesses contributing to leakages have been identified priority actions can be outlined. For instance, education PETS for Tanzania and Uganda served to determine at which administrative level of the education system leakages were most likely to occur (local level) and a Zambia PETS addressed what type of funding, rules-based or discretionary was more vulnerable to leakages (discretionary funding) (Savedoff 2008).
21

Outsourcing disbursement of funds to independent third-party
Contracting out disbursements to an independent third-party can substitute or complement government efforts, and are particularly useful in fragile states with little existing capacity to ensure that public funds reach their destination. In general, contracting out should be a temporary strategy until public financial management systems have been sufficiently strengthened (see Sierra Leone example in Budget Leakages section).
Making it easier for end-users to access goods and funds
Facilitating the receipt of education funds by making disbursement directly to front-line providers may help ensure that schools receive funds if check and balances are in place to avoid frontline providers capturing public funds (instead of officials at higher levels in the education system). In Kenya, a primary education project arranged to have textbook grants transferred directly to primary school bank accounts. School Committees could then purchase books locally (World Bank 2003). Recent INT audits showed virtually no leakages.
Introducing (and enforcing) clear and transparent procurement rules
Establishing clear and transparent procurement rules including clear and objective criteria for prequalification and bidding procedures with explicit specifications to avoid hidden wires (specifications in proposed bids that are written in such a way as to benefit certain manufacturers or a single group) is crucial to assure competition and efficiency.
Introducing e-procurement
E-procurement allow governments to use information technology in the procurement process to create more transparent and efficient arrangements for bidding on and awarding of contracts by improving access to information, increasing efficiency, and promoting competition, ultimately lowering costs and raising the quality of purchased education goods and services. The introduction of e-procurement (for all sectors) has been highly successful in reducing costs and corruption in several countries including the Republic of Korea, Mexico, and Chile (Ware et al. 2007).
External monitoring of procurement: engaging stakeholders
In countries where central governments do not have the resources or capacity to monitor each local school district to check if supplies reach schools, participation of civil society and community volunteers in monitoring the procurement process can improve the procurement and delivery of school supplies. These volunteers can also serve as checks on government officials and agencies engaged in the procurement process. One example is the national textbook delivery program, Textbook Count 1-2-3, in the Philippines started in 2003 to address corruption in textbook procurement (Leung 2005; OECD 2006). The program ensured that the tendering process selected the best qualified suppliers relied on volunteers from the Scouts, the National Movement for Free Elections, church-based and other local groups to monitor, and in some cases physically deliver textbooks to schools. The program succeeded in decreasing the cost of each textbook by roughly 50 percent and in providing nearly all schools with timely supplies of textbooks (Department of Education 2007).
22

Acting on findings of corrupt behavior
Random forensic audits in which auditors select specific procurement projects and scrutinize actual submitted invoices, check on the quality and quantity of contracted supplies, investigate whether a contractor actually exists and so on, can help government detect irregularities and deter firms from inappropriate behavior. If audits detect corruption but the prospects of being disciplined are small or non-existent, corrupt officials and firms will not be deterred from further corrupt behavior. The stringency of sanctions for procurement fraud varies substantially across countries, from dismissal to prison in Hong Kong to virtually none in Bangladesh (ADB/OECD 2006). For effective sanctioning, a complaints system staffed by independent investigators with the authority to scrutinize contracts is necessary, and when corruption is discovered, publication of sanctions can serve to deter other firms and officials from wrongdoing.
Establishing voluntary disclosure programs
The creation of voluntary disclosure programs that allows contractors to report on corruption in exchange for immunity or milder sanctions and do not prohibit reporting firms from participating in bidding on future contracts, can help reduce procurement corruption. Several countries already have some version of such programs, e.g. Argentina, Brazil, and Pakistan, and so far there has been some success in discouraging procurement irregularities (Ware et al. 2007).
4. Performance of Human ResourcesTeachers represent one of the largest groups of civil servants, and as a result, the education sector claims a substantial fraction of national budgets. Because education is labor intensive, human resource management and the performance of teachers largely define the scope and performance of education service delivery. How public sector teachers are recruited, deployed, monitored, and perform is governed by underlying education system incentives and lines of accountability.
Hard evidence on these topics is scarce; most of the available measures of teacher performance are negative and include indicators such as absenteeism and reliance on bribery or personal contacts to obtain jobs and promotions. This section outlines the main governance issues and potential performance indicators, and examines existing evidence and possible solutions to the persistent challenges facing human resource management in education.
Designing recruitment and assignment to improve performance
Civil service regulations and recruitment systems are intended to ensure a professional, politically neutral workforce with appointment and promotion based on transparent civil service regulations and pay scales. With those advantages can come disincentives for performance including compression of pay differentials that make rewards minimal, promotion based on seniority rather than performance, lack of mechanisms to monitor effort, and limited or no freedom of managers to reward and discipline staff. Civil service
23

reforms can address some of these limitations but pose political and operational difficulties.
Teacher performance can be enhanced through policies that promote the recruitment, hiring, transfer, and assignment of adequately trained staff; appropriate performance incentives; and effective accountability mechanisms. While it is relatively simple to outline the processes, implementation is complex. Without consideration of these components human resource management becomes susceptible to some combination of political manipulation, mismanagement, nepotism/favoritism, and fraud, which tend to compromise performance.
A modified version of the teacher education and development framework designed by the US Educational Testing Service (ETS) summarizing how high-performing country systems screen for high-quality teachers is shown in Table 6. These systems include the following components: standards for entrance into and exit from teacher education programs, certification requirements, and minimum academic qualifications (Wang et al. 2003).6
TABLE 6. POTENTIAL CONTROLS FOR TEACHER TRAINING AND HIRINGIntensity of controls
Entry to teacher education
Exit from teacher education
Teacher certification Hiring
High Must exceed threshold levels on subject area examinations, advanced level national examinations or university entrance examinations.
Systemwide exit examinations in subject areas and on other topics.
Systemwide examinations.
Pass of national examination with high score required; additional tests required locally.
Medium Must exceed threshold levels on school exit examinations or national examinations.
Institutional examinations in subject area and on other topics.
Some evaluation of teaching is required and is reviewed by statutory authorities.
Decision is made by state authorities or national ministry with set thresholds for passage required on multiple criteria.
Low Must pass a basic skills test.
Degree requirements, perhaps plus a basic skills test.
Degree requirements only.
Up to individual school.
Source: Adapted from Wang et al. (2003).
Note: Criteria can be high-standard where candidates are required to satisfy a certain criterion to continue. A medium-standard criterion is one that a candidate has to satisfy but, which is easier to satisfy than other regulations. A low-standard criterion is a minimum or voluntary requirement.
These components are useful for controlling the quality of the flow of teachers into and out of teacher education systems, and into public sector jobs. The existence and application of controls can help avoid or reduce irregularities such as favoritism and nepotism in hiring and sale of teaching posts (e.g. hiring based on national test scores), and bribery (e.g. certification based on systemwide examinations). Clearly, the number of controls, their
6 High-performing countries are those whose eight-graders performed as well or better than American students on mathematics or science in TIMMS 1999; these countries were Australia, England, Japan, Hong Kong, the Republic of Korea, the Netherlands and Singapore.
24

design, intensity, and where along the teacher education pipeline they are implemented will vary across countries depending on country circumstances (Table 6).
Hiring and assignment: discouraging favoritism, nepotism, and purchasing of posts
Favoritism is the illegal preference given to any person while nepotism is the illegal preference given to a relative (Hallak and Poisson 2007). Favoritism and nepotism often do not involve bribes whereas purchasing of posts does. In the latter case, a teacher may, pay an official to be hired, or to get a specific position (e.g. urban rather than rural). Hiring and appointments are susceptible to both forms of corruption when the recruitment process is not transparent, rules are not made public, and there are no credible sanctions for inappropriate behavior.
Teachers sometimes perceive the promotional process in their country to be non-transparent and unfair because posts are not advertised, which creates distrust in the recruitment system. In some countries, education administrators are recruited based on party affiliation, or teachers based on union membership, for example in Mexico (Hallak and Poisson 2007). Unsurprisingly, there is little systematic evidence on the incidence of favoritism and nepotism in the recruitment and appointment of teachers.
Bribes sometimes play a key role in the selection process. In some countries, teaching posts can be “bought” from school committees or board members, purchasing of posts. As a consequence, teacher recruitment and selection processes hinge on the ability and willingness to pay for teaching positions rather than on competence and suitability. It may also lead to newly hired teachers requesting payoffs from students and parents to recoup what they had to pay for their position.
As long as recruitment criteria are convoluted, or systematically bypassed, and there are no monitoring mechanisms in place there is a risk that less qualified teachers and administrators will be appointed because no one is accountable for the quality of hiring, with likely adverse effects on teacher and thereby student performance.
Some available perceptions-based data on the purchasing of posts suggest that this practice is quite common in some countries (Table 7). The average share of respondents who perceives job purchasing in education as common, or very common, ranges from 10 percent in Benin to 77 percent in Paraguay. In Colombia, job purchasing is perceived as more common among superiors (40 percent), than among peers and subordinates (20 percent for each) whereas in Peru the opposite is true.7 Clearly, the patterns of perceived purchasing of posts are highly variable across countries.
7 These are perceptions so attention should mainly be paid to relative rankings rather than magnitude.
25

TABLE 7: PUBLIC OFFICIALS’ REPORTS ON THE EXTENT TO WHICH EDUCATION PERSONNEL DECISIONS ARE INFLUENCED BY ILLEGAL PAYMENTS, 2000-2006
Among superiors
Among peers Among subordinates
Average
Benin (2006) 13.9 7.4 9.0 -Colombia (2002) 40.0 20.0 20.0 -Ghana (2000) - - - 18.4Guinea (2005) - - - 26.2Paraguay (2006) - - - 77.1Peru (2001) 25.0 38.0 33.0 -Sierra Leone (2002) - - - 24.3Zambia (2003) 30.8 24.7 22.9 -Source: World Bank Governance and Anti-Corruption Diagnostic Surveys (various years).
Job purchasing in education is common or very common
Reducing the scope for irregularities in teacher deployment
With teacher deployment the problem is not necessarily the lack of qualified teachers, though that may also be the case, but the resistance of teachers to be assigned to remote or rural areas. Risks to health and safety, language barriers, poor living conditions, and fears of not being able to participate in professional development programs and networking opportunities are important factors in teachers’ reluctance to transfer to faraway schools (Mulkeen, Chapman, Dejaeghere, Leu, and Bryner 2005). Consequently, there are times when teachers resort to paying bribes to avoid a posting in a remote area or secure an attractive posting (Chapman 2005).
The effect of this problem is particularly evident in post-conflict societies. For instance, 40 percent of teachers in rural schools in northern Namibia are qualified compared to 92 percent in the capital Windhoek. In Uganda, two-thirds of primary school teachers in urban schools are qualified, while in rural schools only half are (Bennell and Akyeampong 2007). With bribes paid to secure appointments, and less qualified teachers deployed to remote schools, the quality of education tends to deteriorate.
Teacher unions influence teacher management
Teachers’ unions serve an important role by protecting teachers’ rights, and in many countries they possess a strong bargaining position and actively lobby to affect education policy, including teacher recruitment, deployment, and transfer criteria. Sometimes teachers’ unions are directly involved in the recruitment and deployment of teachers, which can undermine public efforts to raise performance by weakening incentives and accountability when the interests of teachers do not coincide with those of other stakeholders (such as government, parents, and students).
For example, in Mexico, unions are typically given the responsibility of nominating individuals for vacant teaching posts. In half of all Mexican states teachers’ unions allocate all teachers (Álvarez, Garcia Moreno, and Patrinos 2007), and government officials merely have the power to check whether a candidate fits the basic requirements of the position
26

(Hallak and Poisson 2001).8 This arrangement arguably reduces the competitiveness of the teacher selection process, which can result in greater accountability to unions than to the employer, parents, or students, with possible adverse effects on teacher performance.
Also, in Mexico, Álvarez, Garcia Moreno, and Patrinos (2007) found that students in states with lower levels of conflict between state authorities and teachers’ unions and higher teacher wages performed better in terms of average PISA mathematics scores (Figure 5). For instance, test scores were highest in states with low levels of conflict between state authorities and teachers’ unions and with high teacher wages, and lowest in states with high levels of state-teacher’s union conflict and high teacher wages, implying that simply paying teachers more may not affect student performance as measured by test scores. Students in states with strong accountability systems (e.g. testing, report cards, and school rankings, and the dissemination of results) performed even better.
A case of teachers’ unions influencing the level at which accountability exists in the education system is the Indian state of Uttar Pradesh (UP) examined by Kingdon and Muzammil (forthcoming).9 In the mid-1960s school teachers’ unions lobbied to have local government schools come under state government management; in the early 1990s the UP government announced decentralization reforms including the transfer of the authority of teacher appointment for publicly aided schools from the Secondary Education Selection Board to the schools themselves, a measure strongly opposed by the unions and never realized; in 2006 teachers’ unions vehemently opposed the Model Right to Education Bill, which aims to give school management committees at each school significant powers (e.g. teacher appointments, disbursement of wages, and disciplinary action) and to introduce a school-based teacher cadre (under this system once teachers are appointed they cannot request a transfer for any reason). The Bill remains under consideration.
These are but some examples of the difficulties that may arise when different stakeholders have conflicting interests. Nevertheless, accommodating and working with teachers unions to improve performance is a highly desirable, and arguably necessary, element to improve human resource management in education.
8 In Mexico all public school teachers are unionized (Alvarez, Moreno, and Patrinos 2007).9 In UP, 85 percent of all primary and secondary school teachers working in state-funded schools (government and aided) are unionized based on a survey of 570 teachers in rural primary and secondary schools in five districts in UP conducted by Kingdon and Muzammil (forthcoming). The extent of union influence is reflected in the trend or real wages for teachers; between 1973 and 1996 real wages for teachers grew at an annual rate of 5 percent compared to a real growth rate of 3 percent per year of GDP per capita.
27

FIGURE 5: PISA MATHEMATICS SCORES AND LEVEL OF TEACHER WAGES AND INTENSITY OF TEACHERS’ UNION-STATE AUTHORITY CONFLICT IN MEXICO
383
391
410
382385
377
351346
300
320
340
360
380
400
420
Low-Low Low-Medium Low-High Medium-Low Medium-Medium
Medium-High
High-Medium
High-High
Status of level of state authority-teacher's union conflict and teacher wages
PIS
A m
athe
mat
ics
scor
e
Source: Álvarez, Moreno, and Patrinos (2007).
Using information to introduce accountability
The effective management of human resources in the education sector is not only dependent on clear standards and regulations, appropriate incentives, and effective accountability mechanisms but also on the availability of and access to accurate and up-to-date information about staff and school needs. This information is critical to monitor teacher assignments and performance although the decision on what information should be used to measure personnel and school needs, and the subsequent collection of that information, is a challenge.
A study of teacher management information systems in Botswana, Malawi, South Africa, and Uganda examined the personnel data collected, processed, and available at nationwide level (Göttelman-Duret and Hogan 1998). In Uganda, a computerized management information system made it possible for the government to identify 25,000 ghost teachers. In Botswana, the information system allowed the government to accurately monitor the number of teachers employed and the salary each received. South Africa was able to improve its personnel and financial management by using an electronic Personnel and Salary system.
Despite the successes, these information systems suffered from problems, especially in terms of the capacity to maintain and further develop the systems. Creation of databases and computerized systems is the first step; making sure that the information stored is
28

accurate and up-to-date is another, more challenging step. In the case of these countries, collection of information was annual, and data were only processed and disseminated one year after they were entered into the system thereby severely reducing their usefulness in terms of policy and monitoring, and making it difficult to hold officials, schools, and teachers accountable for performance.
Other weaknesses that are common in many countries include: incomplete data; difficulty updating individual records due to lack of monitoring mechanisms; no collection of data on teacher turnover and transfers; lack of uniformity in measures used; and absence of adequate databases and records at the provincial or district levels (Göttelman-Duret and Hogan 1998). In addition, when capitation grants are tied to the number of students enrolled, local officials and principals have an incentive to report exaggerated enrollment numbers in order to receive more funding (World Bank 2007c).
BOX 2. INFORMATION AND INCENTIVES FOR PERFORMANCE IN PUNJAB, PAKISTANThe Punjab Education Sector Reform Program (PESRP) is an interesting example of a program to promote good governance in education to improve school performance through information gathering and oversight, incentives linking school rewards to performance, and accountability through competition.
The PESRP program has helped decentralize the highly centralized, province-level Department of School Education, responsible for service delivery in over 63,000 schools with more than 500,000 employees. Teacher recruitment, performance management, and even minor disciplinary issues were all centralized at the provincial level. The absence of incentives and accountability in this highly centralized system undermined the quality of service delivery (World Bank 2004d). One of the components of the PESRP program aims to improve education governance by strengthening teacher management, school councils, and monitoring and evaluation.
To improve teacher management the program is “(i) changing the terms of contracts with new teachers from standard civil service recruitment to site-specific, fixed-term contracts, with almost 20% of the teaching staff already recruited through such contracts; and (ii) introducing district monitoring mechanisms to curb absenteeism and monitor local schools. Transparency in teacher recruitment, postings and transfers is being enhanced through (i) new merit-based recruitment criteria, based on a point system, which favors recruiting women and local candidates; and (ii) temporarily freezing transfers of education management staff, during the first year, to provide continuity” (World Bank 2004d: p. 17).
The provincial and district governments have undertaken several measures to empower school councils including “(i) an agreement on the role of School Councils included in the [terms of partnership] (TOPs); (ii) the issuance of guidelines by the provincial government clarifying the role of [school councils], including their authority to undertake small procurement of works; and (iii) contracting NGOs for provision of capacity support to school [councils] in six districts during the first year” (World Bank 2004d: p. 18). Building upon this pilot, the Government is expanding the capacity building program to strengthen school council capability across all 35 districts.
Finally, to build monitoring capacity the Government of Punjab has “(a) developed district education profiles and established baseline indicators of education performance for the
29

reform program; (b) agreed on monitoring targets with the districts and included them in the TOPs; (c) established a Program Monitoring and Implementation Unit (PMIU) in the Provincial Education Department; and (c) approved an education awareness campaign for disseminating information about the reform program” (World Bank 2004d: p. 18).
As part of the effort to strengthen monitoring each school (a total of 63,000) receives an unannounced monthly visit by an inspector from the independent monitoring unit, and the data collected on school performance are matched with school information systems and cross-checked with implementation systems. The information is then reviewed at district level and aggregated at the provincial level to enable monthly performance assessments.
The performance evaluation index currently consists of twelve components: teacher absenteeism, transfer of funds to school councils, free textbook provision, enrollment-attendance gap, non-teaching staff absenteeism, school inspections by District Education Department staff, meetings of the District Review Committee, illegal fees, school cleanliness, missing facilities schemes progress, school utilities functionality, and teacher training (Shakil 2008). The index components are revised periodically to reflect the requirements for monitoring of various aspects of the sector.
The frequent monitoring of school performance has enabled the introduction of incentives in the form of awards to the best performing district managers for school investments, but there are no sanctions for poor performance, the accountability element is partial. The information on performance in each district is disseminated to all other districts introducing an element of competition among education managers. However, the information is not disseminated to the public, doing that in the future could help introduce the basis for external accountability where community and parental groups pressure for better performance. Figure 6 shows the index for the five best and worst performing Punjab districts in November and December of 2007.
30

FIGURE 6. VARIATION IN SCHOOL PERFORMANCE IN PUNJAB, NOV-DEC 2007
Five best performers
0
10
20
30
40
50
60
70
80
90
Lahore Lodhran Rawalpindi Sahiwal Jhelum
Nov-07 Dec-07
Five worst performers
0
10
20
30
40
50
60
70
80
Gujranwala Khanewal Layyah Attock D.G.Khan
Nov-07 Dec-07
Source: Shakil (2008) based on data provided by the Department of Education, Punjab, Pakistan.
A successful example of using student performance on achievement tests to oversee school performance comes from Mexico. States that implement their own student assessments in addition to international PISA assessments disseminate results to the schools and the public; engage with schools on their test performance to find ways to raise scores; and design strategies and policies for improving education in the state based on that information have students performing significantly better on both PISA mathematics and reading tests (Álvarez, Garcia Moreno, and Patrinos 2007). The competition, external scrutiny, and engagement on policy and program issues of specific schools offer a form of school accountability to state education officials. It also improves transparency and oversight, which together help to promote better performance. Effectively the
31

accountability arises through the increased transparency and involvement of the community (despite the lack of sanctions).
To make information systems work it is not sufficient to put new systems in place but also to introduce incentives at each level, whether at local government or school level, to collect, accurately report, and actually use the available information. Once accurate data are available on a regular basis, sustained monitoring and periodic third-party validation are typically required; the resulting information can then be used to introduce incentives and hold providers accountable and, ultimately, improve teacher and school performance.
BOX 3. DOES SCHOOL-BASED MANAGEMENT IMPROVE INCENTIVES, OVERSIGHT, AND ACCOUNTABILITY, AND ULTIMATELY, PERFORMANCE?The last few years there has been a surge in decentralization and thereby a delegation of decision-making power from central government to the community and school levels in many countries with the objective of increasing the effectiveness and responsiveness of resource allocations and to improve performance. Because decision-makers at the central level may be too far removed from schools to ensure that spending is appropriately targeted and managed, decentralization is seen as a way of bringing decisionmaking to the local level where officials, in theory at least, have better information on school resource needs, and face greater pressure from communities to effectively deliver education services (assuming there is local voting) (Wößman 2003; World Bank 2007a).
To evaluate the impact of school-based management on education performance and outcomes it is important to be clear about which decisions (human resources, supplies, finances) are decentralized, and to whom (school officials, parents, teachers), since different combinations of decisions transferred, and to different parties, can produce different outcomes (De Grauwe 2005). Moreover, de jure decentralization does not always translate into de facto decentralization. Finally, the circumstances under which school-based management is introduced matters.
In Madagascar there was concerted effort to decentralize to the level of the community and to allow parents to make decisions, however, teachers’ promotions and service location were determined centrally (Brinkerhoff and Keener 2003) and accountability remained centralized and parents’ authority was dissipated.
Some studies report a positive effect of school-based management on student attendance and performance. In post-conflict El Salvador, student attendance was higher in the EDUCO schools managed by local parent committees than in regular schools, and standardized test scores were similar to those in regular schools despite students coming, on average, from more disadvantaged backgrounds (Jimenez and Sawada 2000).
Students in schools with greater autonomy in Nicaragua had higher test scores than students in non-autonomous schools (King and Özler 2001). This effect seemingly worked through schools’ authority over teacher staffing, monitoring, and evaluation, suggesting that school autonomy contributed to improved student performance through its impact on teacher quality.
A study on Brazil used panel data at state level for the period 1981–1993 to estimate the impact of school autonomy in the form of transfer of funds to schools; election of school
32

principals; and the setting up of school councils, and found that school autonomy reduced drop-out rates and repetition rates (Pães de Barros, Ricardo, and Mendonça 1998).
Another study assessed the impact of Mexico’s Quality Schools Program (PEC) program, a voluntary, urban-based program open to all public schools and found that school-based management reduced repetition, drop-out and failure rates (Skoufias and Shapiro 2006).
Gertler, Patrinos, and Rubio-Codina (2006) assessed the impact the Support to School Management (AGE) program in Mexico, which consisted of financial support and training to parents associations at rural primary schools in deeply disadvantaged regions. The schools received AGE over the period 1998-2001 with the objective of increasing the influence of parents, teachers, and principals over how the schools were run. The main impacts of AGE was a significant reduction in grade failure and in repetition rates. However, there was no statistically significant impact on student drop-out rates.
Another study on the effect of a school-based management program, PROHECO,10 in Honduras, found a direct positive impact on teacher behavior, which in turn improved student learning outcomes as measured by student test scores (Di Gropello and Marshall 2005).
An important issue to consider when assessing the impact of school-based management is the potential difference between de jure and de facto school autonomy. Even if power is transferred to “all” schools, some schools will find it easier to use their new powers than others, which will be reflected in any evaluation results. That is, the results will not cleanly capture the impact of school-based management itself but also the effect of some schools being better able to use their new powers (Gunnarsson et al. 2006).
Gunnarsson et al. (2006) found that parental participation and school supplies have statistically significant and positive effects on 4th grade test performance, whereas school autonomy had no impact. They argued that SBM works when communities have the necessary capacity and will to manage schools, but fails when communities lack the required skills, authority, and information.
Available evidence suggests that school-based management at the primary level in some cases increases attendance and reduces drop-out, repetition, and failure rates. However, the evidence on the impact on student test scores is less encouraging. Overall, the research on primary level school-based management suggests that it is effective if parents have authority over funds and/or teachers, which allows them to hold providers accountable (Lewis 2004).
Why and how often are teachers absent?
Teacher performance directly depends on teachers being present during contracted hours, yet absenteeism a chronic problem in many education systems in developing and transition countries, is often unmeasured, and sometimes completely overlooked (Lewis 2006). When it is widespread, it can severely limit access to and quality of education, and when absences are unauthorized it constitutes fraud. Here, teacher absenteeism is defined as unauthorized absences by teachers during contracted hours.
10 PROHECO stands for Proyecto Hondureño de Educación Comunitaria.
33

Unauthorized absenteeism, teachers failing to show up for work, arriving late and leaving early, constitute a major drag on education resources and have a direct negative impact on student performance (Wößman 2003; Suryadarma et al. 2006). One estimate puts the direct financial cost of teacher absenteeism at 10-24 percent of recurrent primary education expenditures (Patrinos and Kagia 2007). Estimated financial losses range from US$16 million in Ecuador (0.05 percent of GDP) to US$59 million in Uganda (0.86 percent of GDP) to more than US$2 billion in India (0.29 percent of GDP) (Patrinos and Kagia 2007). Estimates for Uganda suggest that reducing teacher absenteeism by one-fifth would generate savings of approximately US$5.1 million (World Bank 2007c).
The effect of teacher absenteeism on student learning is difficult to assess but is no doubt substantial and some evidence on this is presented below.11 Some recent evidence also suggests that parents are less likely to send their children to school when they expect high teacher absenteeism because the opportunity cost of their children’s time becomes too high (Rogers and Vegas 2009).
Low pay per se does not appear to be the reason for the high and endemic teacher absenteeism observed in developing countries. After all, private sector teachers who often earn notably less tend to be present at least as often, if not more frequently, than their higher earning public sector counterparts (PROBE 1999; World Bank 2007d; Kremer et al. 2005; Das, Pandey, and Zajonc 2006).12 Moreover, within schools, higher paid teachers (e.g. head teachers), on average, tend to be absent more frequently than lower paid teachers (Rogers and Vegas 2009). This points to two other possible explanations for absenteeism: the absence of performance-based incentives and the inability to hold teachers accountable for their attendance and performance. Yet, existing evidence (see below) suggests that performance-based incentives on their own do not work well but teacher accountability is also required.
An important factor affecting teacher attendance is the quality of school facilities and the availability of teaching materials. A World Bank study of teacher absenteeism in six countries showed that well-equipped schools with better infrastructure had absentee rates roughly half that of schools with poor infrastructure (Chaudhury, Hammer, Kremer, Muralidharan, and Rogers 2006). Implicitly good infrastructure provides an incentive for higher level performance. Interestingly, household evidence suggests that parents are also more likely to send their children, especially girls, to schools with better infrastructure (King and van de Walle 2007).
The extent of the problem of absent teachers is highlighted by the World Bank study of Bangladesh, Ecuador, India, Indonesia, Peru, and Uganda, which used surprise visits to a random sample of schools, and recorded an average absentee rate of 19 percent for primary school teachers (Chaudhury et al. 2006). Teacher absenteeism in an additional set of countries, for which relatively recent data are available, ranges from 11 percent in Peru and 14 percent in Honduras to 30 percent in Senegal (Table 8) (Benavot and Gad 2004; Chaudhury et al. 2006; Reinikka and Smith 2003). These data are based on direct
11 Indirect costs stem from the opportunity cost of students’ time and the potential loss of human capital due to missed instruction. While estimates of these indirect costs do not currently exist, they are arguably large.12 In a study of Pakistan, private school teachers were found to be absent 1.8 days per month compared to 3.2 days for public school teachers (Das, Pandey, and Zajonc 2006). Wages of public sector teachers in Uganda are 60 percent higher than those of private sector teachers (World Bank 2007c).
34

observation, which is important given the frequent discrepancy between reported (e.g. records kept by headmasters) and observed absentee rates (Rogers and Vegas 2009).
TABLE 8. PRIMARY TEACHER ABSENTEEISM SELECTED COUNTRIES, 2001-2004
Absentee rate (percent)
Bangladesh (2002) 16
Ecuador (2002/03) 16
Ghana (2003) 19
Honduras (2001) 14
India (2002/03) 25
Indonesia (2002/03) 19
Papua New Guinea (2002) 15
Peru (2002/03) 11
Senegal (2004) 30
Uganda (2002/03) 27
Zambia (2002) 17
Unweighted average 19Sources: Benavot and Gad 2004; Chaudhury et al. 2006; and Reinikka and Smith 2003.
More detailed evidence on absenteeism provides additional insight. The average absentee rate for primary teachers in Honduras is 14 percent (Table 9). Further indicating the extent of the problem, 40 percent of teachers are absent one month or more each year; teachers even self-report that they work 30 hours a week instead of the stipulated 37 hours (World Bank 2005a). Part of the problem is that absenteeism is frequently not considered a serious problem by school officials. In the 2000 school census only 7 percent of surveyed school principals in Honduras considered absenteeism a problem; the subsequent lack of sanctions for failing to show up for work is therefore unsurprising (World Bank 2007b).
TABLE 9. TEACHER ABSENTEEISM IN HONDURASLength of absence
Average annual teacher absence 16 days
Teachers with no month absent 60%
Teachers with 1 month absent 26%
Teachers absent 2 months or more 14%Source: World Bank (2007b).
One very important aspect of absenteeism is its duration (Table 9); whether a teacher is absent for one day, or ten, or thirty likely has very different effects on student learning. A survey in Papua New Guinea found that, on average, teachers were absent 15 percent of the time, out of these absent teachers 30 percent had been absent for one day only but 25
35

percent for seven days. In Honduras the average annual duration of teacher absences was even longer, 16 days (World Bank 2004a; World Bank 2007c).
A nationally representative study of public primary schools in Peru, based on two separate, unannounced visits to a random sample of schools, found that teachers were absent 11 percent of the time, with absentee rates being higher in poorer and remote areas (Alcázar et al. 2006). The study examined the reasons for teacher absence and found that better infrastructure (also see Kremer et al. 2005), and a school being located in a richer community were associated with lower teacher absenteeism. Parents in richer communities are typically more educated and thus likely better able to monitor teacher attendance and discipline teachers if they fail to show up. Teachers born and working locally, non-contract teachers, and the competition from private schools were also correlated with lower absentee rates.
Oversight without any ability to hold teachers accountable seems to have little value; distance to the nearest Ministry of Education Office, or the share of schools within the province recently inspected, were not significantly correlated with teacher absenteeism in Peru, nor was Parents’ association monitoring (Alcázar et al. 2006). The likely reason is that teachers who fail to show up for work do not face any sanctions. These results suggest that under existing incentive and accountability arrangements, monitoring alone is not effective (see Box 4).
The main reason for widespread teacher absenteeism is arguably the exceedingly low probability of being disciplined; an explanation consistent with the Indian teacher compensation structure described by Pritchett and Murgai (2006), see below.
While punitive action for teacher absences is provided for in official regulations in many countries, in practice, disciplinary action is rare. In a recent survey of almost 3,000 Indian government-run schools with an average 25 percent teacher absentee rate, only one headmaster reported firing a teacher for repeated absence (Chaudhury et al. 2006). Data on teachers’ disciplinary records in Mozambique further suggest that sanctions for misbehavior, including absenteeism, are uncommon: in 2004 there were approximately 46,600 primary teachers but only 58 disciplinary actions were taken: 23 five-year suspensions, 7 permanent dismissals, 20 demotions, and 8 fines (Mulkeen and Chen 2008).
BOX 4. MONITORING ALONE IS NOT ENOUGHOne increasingly considered method for reducing teacher absence is monitoring, which can take several forms. (1) external monitoring where an employee in the education system is assigned the job of monitoring teachers but, which may lead teachers to bribe monitoring inspectors; (2) impersonal monitoring but this may fail to identify legitimate absences; and (3) beneficiary control where those with an interest in the delivery and quality of education services, e.g. parents, monitor teachers is a less costly option but is ineffective if parents lack the authority and means to discipline absent and/or underperforming teachers.
In Kenya, external monitoring of a program, pre-primary school headmasters monitored teachers was evaluated. Teachers with good attendance were given a prize (a bicycle), if their attendance was poor the money (for the bicycle) remained with the school (Banerjee and Duflo 2006). Kremer and Chen (2001) found that prizes were given to all teachers because all were recorded present an adequate number of times. Surprise visits to the
36

schools showed equally high absentee levels in treatment and control schools. Headmasters had simply marked teachers as present, either to avoid confrontation, or because they felt that the teachers “deserved” the prize. This particular experience suggests that in education systems with weak governance structures characterized by little or no accountability, incentives may not work as intended.
In Udaipur district, India, Seva Mandir, a non-governmental organization, introduced impersonal monitoring to deal with teacher absenteeism (Duflo, Hanna, and Ryan 2007). Schools were randomly selected to receive a camera with tamper-proof data and time function with instructions for teachers to take a picture of themselves and their students at the start and end of every school day.13 Teachers received a financial bonus based on days attended, and paid a penalty for each day missed above the minimum number of days required attendance. During the monitoring period the absentee rate was reduced from 44 to 21 percent in the treatment schools mainly due to the financial incentive, not the monitoring (Duflo, Hanna, and Ryan 2007).
A beneficiary monitoring program in Kenya to reduce teacher absenteeism through monitoring and transfer of certain authorities to local school committees was implemented in 36 randomly chosen schools. After 12-months the teacher absentee rates in treatment and control schools were not statistically different (Banerjee and Duflo 2006). It may be that insufficient authority was delegated to the school committees.
By itself monitoring may not be very effective in reducing absenteeism but combined with incentives and disincentives it can generate performance improvements. As discussed below, monitoring in conjunction with other measures such as financial rewards can positively affect measurable performance including teacher attendance.
A few studies attempt to evaluate the impact of teacher absenteeism on student learning outcomes. Das et al. (2005) evaluated the impact of teacher absenteeism on student learning as measured by fifth-grade test scores on English and mathematics tests using data for 182 schools in Zambia at two points in time, 2001 and 2002. Their main measure of teacher absence was head-teachers’ reports of teacher absenteeism in the 30 days before the survey. For students whose teachers were absent 10 percent of the time compared to students whose teachers were not absent, there was a sharp decline in learning as measured by standardized test scores. But the reduction in learning when the absentee rate rose from 10 percent to above 10 percent was smaller, implying a potentially non-linear effect of teacher absenteeism on student learning. For the sub-sample of students who were taught by the same teacher during the two years in which they were tested, a 5-percent increase in their teacher’s absentee rate decreased their learning by approximately 4 percent of the average learning gains during the two years.14
Suryadarma et al. (2006) also examined the relationship between teacher absenteeism and student learning using a nationally representative sample of students in Indonesia. They
13 A valid day is one in which the start and end of the day photos are separated by at minimum of five hours, and a minimum number of children are shown in both photos.14 For the sub-sample of students who were not taught by the same teacher over the two years there was no statistically significant relationship between teacher absenteeism and student learning.
37

used data on public primary school teacher absenteeism obtained from direct observations, and fourth-grade students’ scores on mathematics and dictation tests in 2002 and 2003. The tests were administered by the researchers making it impossible to tamper with the test results. In addition, the tests were not announced in advance, thereby avoiding the problem of teaching to the test. Suryadarma et al. (2006) found that higher teacher absenteeism (average teacher absentee rate for each school), and a larger share of permanent teachers were both associated with lower test scores in mathematics but not in dictation. This suggests that the loss of instructional time due to absent teachers translates into lower student learning, and that teachers who feel more secure in their job may feel that they do not need to exert extra effort as there are no personal costs for poor performance.
Motivating teachers to raise their performance
Teacher performance matters for student performance; the evidence shows that students of better teachers consistently achieve better learning outcomes (Hanushek 2003; Rivkin, Hanushek, and Kain 2005; Umansky 2005). Unfortunately, it is very difficult to tell the difference between good and bad teachers. Observable characteristics such as education attainment, experience, and wages are often very similar. More variable characteristics that are less easy to observe, including teacher effort, may be far more important for student performance in many contexts.
Many teacher performance problems stem from weak governance systems that fail to reward good performance and discipline teachers who under-perform. For teacher performance to reach and remain at acceptable levels, effective incentive structures, oversight mechanisms, and teacher accountability are key.
Financial and non-financial incentives that motivate teachers are listed in Table 10. The list is not exhaustive but indicative of the wide range of factors that influence teacher performance. For example, teachers may exert more effort if this improves their standing in the local community. A good work environment also tends to improve teacher performance (IIEP 2006). These incentives are country-specific and should be viewed as tools to raise performance.
38

TABLE 10. TEACHER INCENTIVES TO PERFORM, OR NOT
Non-financial incentives Financial incentives
Career development prospects Employer power to fire
Good work environment Job security
Intrinsic motivation Pay level
Prestige in local community Performance pay
Professional recognition
Student/parent appreciation
Source: Adapted from Vegas and Umansky (2005).
Note: The ordering of incentives does not indicate importance. Work environment includes things such as number of hours worked per week, class size, availability of teaching materials, and the physical condition of classrooms/schools.
The evidence on the effect of pay on teacher performance is mixed (Kingdon and Teal 2002; Vegas 2002). In a study of teacher recruitment and retention in Sub-Saharan Africa where teacher attrition rates are high, teachers indicated that although higher pay would encourage better performance, improvements in working conditions, better deployment systems, and more professional development opportunities, were deemed equally important in promoting job satisfaction and retention and motivating teachers (Mulkeen, Chapman, DeJaeghere, and Leung 2007).
In a recent study Pritchett and Murgai (2006) document weaknesses in India’s public sector teacher compensation system: little or no ability to fire teachers; high pay relative to comparable professions; pay does not vary with performance; and the degree of overpay compared to private sector teachers and other similar professions is higher at the early stages of teachers’ careers. The lack of pay incentives combined with virtually no teacher accountability (it is virtually impossible to get fired and even disciplinary action is rare), does nothing to encourage existing teachers to increase their effort, or invest in adapting more effective teaching methods.
Another much debated teacher incentive is performance-based pay. Overall, the evidence on performance-based pay is mixed, and some evidence indicates that it can in some cases lead to unintended and undesirable changes in teacher behavior. For example, if teacher performance is evaluated based on students’ test scores, teachers may teach to the test rather than, as intended, provide their students with lasting, widely applicable skills. Or worse, teachers may focus their attention on students most likely to improve their test scores at the expense of students at the bottom and top of the test score distribution (Umansky 2005).
Glewwe, Illias, and Kremer (2003) examined how primary school teachers in Kenya changed their behavior in response to a monetary bonus received if students improved their performance on standardized tests. Their results suggested that there was no change in teacher absenteeism, the frequency of homework assignments, or in classroom practices but that there was an increase in test taking tutorials, which had a positive but short-lived impact on student test scores.
39

Using a randomized trial in Andhra Pradesh, India to evaluate the impact of bonus payments, both individual (teacher) and group (school) based, Muralidharan and Sundararaman (2008) found that bonus payments (3% of teacher pay) significantly improved student performance.15 The bonus payments were based on students’ average improvement on independently administered tests and at the end of the two-year program test scores for students in program schools was 0.28 standard deviations higher in mathematics and 0.16 standard deviations higher in languages compared to test scores for students in control schools. The improved student performance was seemingly the result of genuine learning since the students performed better on both mechanical (meant to capture rote learning) and conceptual (meant to capture deeper learning) tests. The students in schools participating in the incentive program also performed better on tests in subjects not part of the program, implying positive spillovers from the program. During the first year of the program schools with individual- and group-based incentives performed equally well, however, in the second year, the schools with individual-based incentives performed markedly better, perhaps because it is typically easier to monitor and hold an individual teacher accountable for performance than a group of teachers.
Potential solutionsRaising teacher performance requires the introduction of effective incentives, means to assess or audit performance, and accountability mechanisms. How to do this in practice remains a challenge but some initiatives have shown promise. A review study by IIEP (2006) suggests that financial incentives matter but have to be accompanied by some combination of accountability mechanisms and/or non-financial incentives such as training opportunities, a good work environment, and availability of resources as discussed above.
Making regulations clear and transparent
The quality of public school teachers partly depends on the type and number of regulations that are in place (when enforced). Adoption of context-based regulations can help improve performance by addressing the specific needs of any given education system, i.e. if more attention is given to one aspect, for example, teacher education, certification, or recruitment (Table 6) over another, based on which contributes the most to inefficiencies in the sector. However, clear and transparent regulations are only a first, necessary but not sufficient step to improve teacher quality. Without appropriate incentive structures and accountability mechanisms, regulations become irrelevant. For example, India has a good track record in recruiting and hiring qualified teacher but coupled with weak incentives and virtually no accountability, teacher performance remains relatively poor (Pritchett and Murgai 2006).
Transparent recruitment and promotion systems
Teacher knowledge and awareness of how the recruitment and promotion processes work are vital to attract strong candidates. At the basic level, advertising of higher posts to teachers already in the system contributes to the perception that the hiring and promotion
15 The sample consisted of a representative sample of 300 rural, government schools with 100 schools in each treatment (individual- and group-based) school and 100 schools in the control group (Muralidharan and Sundararaman 2008).
40

process is fair and transparent. Hiring and promotion by selection committees is preferable to the actions of a single administrator, and decisions of the selection body are more credible if they are open to questioning and clarification. Participation of communities and parents in the selection committee, either as voting members or simply as observers, offers transparency and fairness in the recruitment and promotion process.
Innovative hiring mechanisms and incentives for remote posts
To ensure the distribution of experienced teachers to rural and remote areas incentives for relocation must be sufficiently attractive and transfer systems transparent. Education reform in the city of Bogota, Colombia introduced a more transparent system for transferring teachers. Under the new deployment procedures, transfers were only to take place at the end of the school year, all transfer requests were centralized, and software that incorporated relevant criteria to assess school needs and teacher characteristics, was introduced in order to increase transparency (Hallak and Poisson 2007). Given the resistance of teachers it took several years before all transfers were made under the new system. A comprehensive benefits package (housing, insurance, hardship allowances, family relocation, and opportunities for continuing education and training) and/or rotations with defined service periods can also serve to make remote and rural areas more attractive (or at least more acceptable) to qualified teachers. Another, potentially complementary strategy is to hire local teachers under the presumption that people with roots in the area will be more willing to return and remain in the area. Some evidence from Punjab, Pakistan, suggests that female teachers who live in the community in which the school they work at is located have lower absentee rates (Ghuman and Lloyd 2007).
Leveraging information to improve provider performance
Collecting and managing education data accurately and in a timely fashion at all levels of the education system allows service providers, whether local government, school official, headmasters, and teachers, to be held accountable for their performance (if the relevant stakeholders have the means to impose sanctions). But incentives are needed for the agencies at all levels of the education system to record data since unless data collection and use are required and enforced, data collection tends to become erratic or even stop.
Combining monitoring with incentives
Monitoring attendance is necessary but not sufficient for discouraging teacher absenteeism. Offering financial (e.g. financial bonuses and penalties), and non-financial incentives (e.g. a good work environment or professional recognition) for regular attendance combined with accountability measures (real probability of being transferred, demoted, or otherwise disciplined) can help address persistent absences (see Box 4).
Performance pay combined with accountability
Well-designed financial incentives based on performance have the potential to improve teaching quality if teacher performance, on which rewards and penalties are based, can be measured accurately, and if combined with accountability. The major challenge is implementing such schemes on a large scale and following through on accountability. In India, performance pay for private sector teachers is associated with better student
41

performance but this is not the case for public sector teachers (Kingdon and Teal 2002). This implies that there is some factor in the private sector that elicits a response to performance pay that does not exist in the public sector. It may be that the accountability (possibility of being fired or demoted) in the private sector makes the performance pay incentive effective, which may also allow the private sector to set wage levels below those of the public sector.
School-based teacher management
School-based teacher management can increase accountability at the primary school level by making the teacher selection process transparent and merit-based and by giving school councils authority to hire and fire teachers (and administrators). However, school-based management does not tend to work unless local school councils have the authority to hold teachers and schools accountable for their performance by rewarding or penalizing teachers according to their performance. It is a largely primary school strategy, not easily applicable at higher levels of education where parents are typically less involved (see Box 4).
Introducing standardized examinations
Standardized examinations can help raise and maintain education standards at all levels of the education system, inform resource allocation decisions, and assign accountability for student performance by comparing student performance to national and/or international standards. If a student performs poorly it can be determined whether this is due to the effort and ability of the individual student, or to poor teacher performance if the whole class performs relatively poorly (PROBE 1999; Kellaghan and Greaney 2001).
Contract teachers instead of civil servants
Over the last few years several countries, especially in Sub-Saharan Africa, have experienced rapid rises in enrollment and given budget constraints have started hiring contract teachers who are typically paid less, receive no benefits, and have short-term contracts, rather than regular (i.e. civil servants) teachers. The evidence on the effect of contract teachers on education quality is ambiguous. In some countries (e.g. Niger, Togo, and Guinea) there seems to have been a negative effect of contract teachers on student performance, in other (e.g. Cameroon, Madagascar, and Senegal) students of contract teachers performed better than those of regular teachers (Santibañez 2008). These differences may be the result of contract teachers being hired by the public authorities in the countries where they seemingly affected student performance negatively, and by parents’ associations and local communities in countries where they were associated with better student performance thereby strengthening accountability, and also that contract teachers face incentives to perform well in order to become regular teachers.
5. Household PaymentsInformal household payments stem from the lack performance fundamentals: incentives are wrong, information absent, and accountability missing (Box 1). These informal payments – illegal charges for education services or supplies meant to be provided for free
42
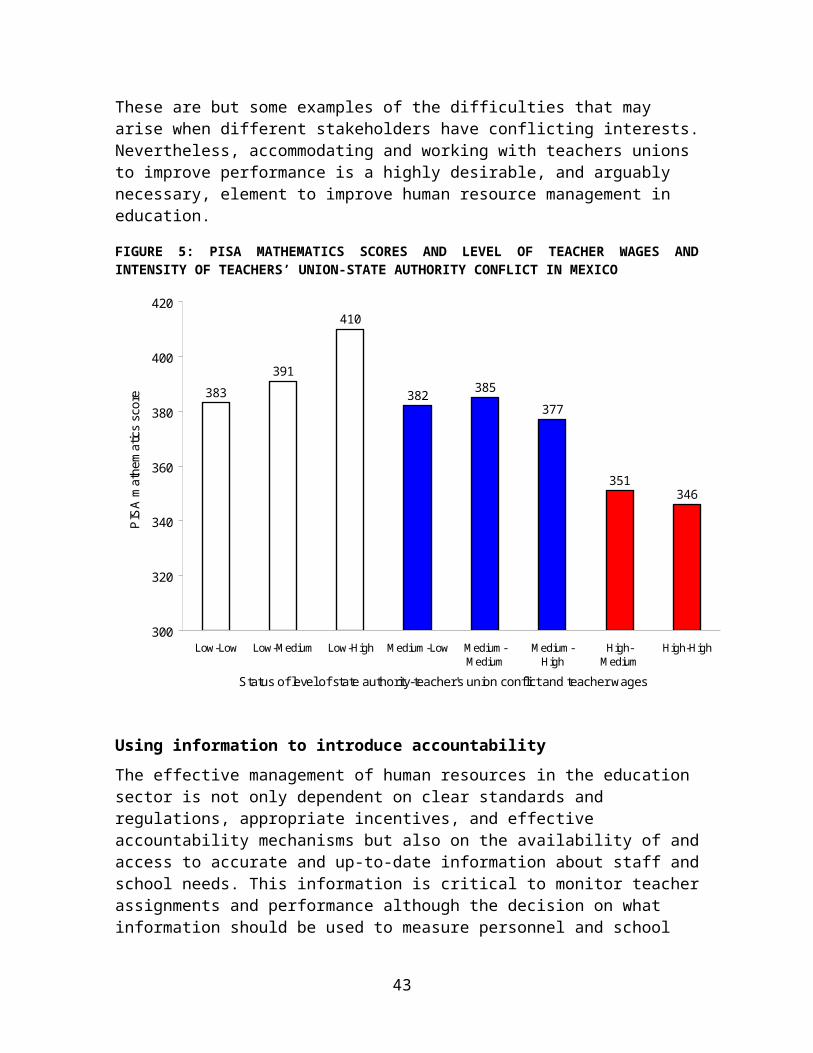
or to obtain specific favors – are surprisingly widespread in education although objective evidence is limited.
Institutional performance as outlined in Figure 1 deteriorates when informal payments drive financing and delivery of education services. Indeed, the perpetuation of informal payments suggests a breakdown of public sector operations and undermines good governance, provider performance, and equal access to publicly funded and delivered services.
Weak governance structures characterized by lack of appropriate incentives, oversight, and accountability, contribute to poor performance in service delivery and create opportunity for under-the-table payments for access to services, upgraded services and, in some instances, jobs (see previous section). Service providers can charge informally when users do not know what services they are entitled to; providers have discretion over how resources are allocated; and users are willing to pay to receive better or faster services (CMS 2006; Lewis 2000).
The cost of education to households as reported in household surveys is significant even when children attend free public schools. Costs include some combination of uniforms, parent teacher association (PTAs) fees, transportation, textbooks, and general contributions (Bentaouet Kattan and Burnett 2004). These required fees can make schooling too costly for some households, effectively preventing parents from sending their children to school. Parents may in addition have to pay informal fees for a variety of services: access to school, advancement to the next grade, to pass examinations, access to library resources, or for their children to be taught the stipulated curriculum after school-hours, and so on.
What is the extent of informal payments?
There is considerable anecdotal evidence on informal payments in education but there are relatively few data considering the likely prevalence and magnitude of informal payments in many developing and transition countries. Household surveys and citizen report cards provide some useful insights.
Across five types of fees in public primary education for 79 countries: tuition, textbook, uniforms, PTA and community contributions, and school-based activity fees, one-third of all fees collected were informal (Bentaouet Kattan and Burnett 2004). In CIS countries, Burnett and Cnobloch (2003) estimate that informal payments, on average, finance half of all public education.
In household surveys the average share of users of education services who report making informal payments varies substantially within and across regions (Table 11). The largest differences are in South Asia where 25 percent of service-users in Nepal report that they made informal payments compared to 92 percent in Pakistan. In Latin America reported informal payments are least frequent in Colombia (close to 2 percent), and most common in Haiti (60 percent). Relatively fewer service-users report informal payments in Sub-Saharan Africa, from 2 percent of users in Madagascar to 20 percent in Namibia (Afrobarometer 2006; AmericasBarometer 2006; USAID Vitosha various years; and Thampi 2002). But anecdotal evidence suggests significantly higher under-the-table payments in Sub-Saharan Africa where the abolishment of user fees has led to huge class sizes and some parents have resorted to paying teachers to give their children an
43

advantage. The notable variation in the frequency of informal payments across countries may be due to them varying in nature making cross-country and even cross-country comparisons difficult. However, without better data any conclusion is speculative only.
The household burden of informal payments can be seen in terms of their relative share of average income. This varies substantially across countries: from 4.4 percent of half monthly per capita income in Bulgaria, to 143 percent in Ghana, to an astounding 380 percent in Pakistan (Table 11). In the case of Pakistan, 92 percent of parents reported making informal payments (all types) for education, combining this with the large amounts paid, the scale of the problem is enormous and may help to explain why private primary schools have seen the fastest growth over the last decade, and this applies to girls’ schooling in particular (Lloyd, Mete, and Grant 2007). Even in countries where informal education payments are smaller in absolute terms, they can still constitute a large share of total household expenditure.
TABLE 11. INCIDENCE AND MAGNITUDE OF INFORMAL PAYMENTS FOR EDUCATION SELECTED COUNTRIES, 2000-2006
Informal payment(% of half monthly per capita income)
% of households that make informal payments
Albania (2005) 46 35Bulgaria (2001) 4 16Tajikistan (2003) 23 9
Colombia (2006) n.a. 2Guatemala (2005) 38 8Haiti (2006) n.a. 60Paraguay (2006) 23 7Peru (2001) 6 7
Bangladesh (2002) 87 40India (2002) 76 34Nepal (2002) 139 25Pakistan (2002) 380 92Sri Lanka (2002) 86 61
Ghana (2000) 143 24Madagascar (2006) 38 7Mozambique (2004) 57 16Namibia (2006) n.a. 20Zambia (2003) 9 6Note: Data for each region are from the same survey where possible to ensure consistency across countries in how the question on informal payments was asked.Sources: World Bank LSMS (various years); World Bank Diagnostic Survey (various years); and Thampi (2002).
Charging for admission, advancement, and specific grades
In some developing countries informal fees are charged at all levels of education to guarantee admission, for grade advancement, to graduate, to receive higher marks, and to pass exams.
44

In several countries, which officially prohibit school fees, households still report payment of fees. Out of 79 countries surveyed, tuition fees were collected in 30 countries although they were only legal in 19 of them (Bentaouet Kattan and Burnett 2004).16 In China, out of 3,000 primary and 1,500 secondary schools audited in the Jiangxi province in 2003 there were 125 cases of illegally collected school fees with a value of US$2 million. At the national level, more than US$20 million in illegal school fees were collected at primary and secondary level. For the 18 higher education institutions audited, 15 per cent of all fees charged were illegal (UNDP 2008).
Citizen report cards, users’ assessment of the performance and quality of education collected through survey questionnaires can be used as a possible basis for increasing accountability of public officials, schools, and teachers if higher level officials act on the information and findings. However, in practice, it is often difficult to punish such corrupt behavior.17
A report card survey of primary education in eight subdistricts of Mymensingh district in Bangladesh conducted in 2000 showed that households were paying for a variety of education services all meant to be provided for free. 6.2 percent of respondents reported paying for admission and 5.3 percent for primary school textbooks (Karim 2004). Out of students who had passed their final examinations, 2.3 percent reported paying to be promoted to the next grade, however, this only occurred in one of the eight subdistricts (Sadar). In Bangladesh, the government does not pay for primary schools to hold examinations so instead teachers charge students; approximately 96 percent of students reported paying to sit the first term, second term, and annual examinations respectively, implying that informal payments to sit examinations are systematic.
Thus, report card surveys can be very useful in collecting information on patterns of behavior in the school system, including frequency and type of informal payments. But for the information to have any impact on performance and corruption, effective accountability mechanisms, that include the authority and means to impose sanctions, must exist. The findings from the Bangladesh study were widely disseminated but had a limited impact: after having been informed of irregularities taking place in their offices many primary subdistrict education offices introduced transparent and standard fees for examinations and, subsequently, many teachers reported that they no longer had to pay bribes to obtain services (Karim 2004).
When incentives for good performance are weak or lacking, there is little or no oversight, and accountability is non-existent, informal payments to access examination questions in advance, or to pass or receive a certain grade, can become the rule not the exception. Hallak and Poisson (2007: 231) define examination fraud as “any prescribed action taken in connection with an examination or test that attempts to gain an unfair advantage.” The practice of paying for advance test information, to pass, or for a particular grade, has serious implications. When results can be purchased, resources are allocated to students able and willing to pay instructors, which undermine education objectives and put those without funds at a disadvantage.16 These included Benin, Ethiopia, Indonesia, Vietnam, India, Nepal, Colombia, Bosnia, Latvia, Russia, and Egypt.17 Citizen report card surveys are based on stratified, random sampling to make sure that results are representative of the underlying population.
45

There is little hard evidence on the extent of informal payments for gaining access to examination questions in advance, or receiving a specific grade but anecdotal evidence suggests that these practices are widespread. At one extreme, public announcements in Georgia notified students of the payments required to pass courses (MacWilliams 2002). Focus groups consisting of secondary school students and graduates in Russia, Ukraine, and Uzbekistan, all highlighted the need to pay teachers to receive good examination marks (OSI 2006). Another stark example of cheating on examinations is provided by indirect evidence from Uttar Pradesh, India. The average annual pass rates for exams of the UP High School Exam Board over the period 1988 to 1991 ranged from 46 to 61 percent, however, when police were stationed at examination centers in 1992 to discourage cheating, the pass rate dropped to 17 percent (Kingdon and Muzammil 2003).
Perception-based surveys carried out in Bulgaria, Croatia, Moldova, and Serbia show that academic fraud involving informal payments is perceived as widespread. Roughly between 27 and 36 percent of interviewed students believe that admission scores can be changed if students are willing to pay professors. Between 35 and 45 percent think that their faculty does not follow the official admission selection process (Table 12). Survey respondents when asked, estimated the share of students who have paid to take an exam, or to receive a specific grade to be 1.5 percent in Croatia, 3.8 percent in Serbia, 6.5 percent in Bulgaria, and a high of 28 percent in Moldova (Hallak and Poisson 2007).
TABLE 12. STUDENT PERCEPTIONS OF ACADEMIC FRAUD SELECTED COUNTRIESShare of students who perceive that: Bulgaria Croatia Moldova Serbia
the official selection process is bypassed in their faculty
37.1 35.1 38.4 44.9
there is possibility for admission test scores to be changed illegally
32.9 27.5 36.1 36.3
there are illegal activities concerning students ranked in the admissions list
26.6 32.2 60.9 39.0
there are illegal changes in the quotas of those who do and do not pay
20.3 25.2 47.1 32.8
Students' perception of: Bulgaria Croatia Moldova Serbia
the share of students who have paid for taking an exam or receiving a certain grade
6.5 1.5 28 3.8
the share of students who were illegally admitted to the university/faculty
18 18 40 15.1
Source: Adapted from Hallak and Poisson (2007).
Many countries have national assessment systems but these are mostly ineffective in reducing the extent of informal payments to pass, or for specific grades, when there are no penalties for examination fraud.
46

Involuntary private tutoring
In addition to formal and informal school fees, and illegal payments to pass, advance, or for specific grades, households sometimes spend a non-negligible share of their incomes on private tutoring. While some tutoring is voluntary and reflects parental interest in bolstering their children’s performance, it can be abused by teachers when parents feel forced to finance private tutoring on omitted parts of the curriculum to ensure that their children pass (Bray 2003). Information on such practices is scarce, and what does exist emerges mainly from qualitative surveys.
In a survey of schools in Morocco, 70 percent of teachers at the senior secondary level said that they were unable to cover the full curriculum during regular school hours; 70 percent of teachers at this level also reported that they offered private tutoring (Bray 1999). This raises concerns that teachers may intentionally omit important topics from regular instruction in order to supplement their incomes with earnings from involuntary private tutoring.
In Azerbaijan, Georgia, Mongolia, and Ukraine, “respondents reported that some teachers pressured their students to take supplementary private tutoring with them after school hours; in some instances, the pressure included threatening students with lower grades if they refused to take private tutoring” (OSI 2006). A recent empirical study of private tutoring in Nepal suggests that secondary school teachers who engage in private tutoring teach less during official school hours causing students to perform worse as measured by test scores (Jayachandran 2008).18
Potential solutions
Replacing informal with formal user fees
Informal payments are a form of corruption, which can reduce the quantity and quality of education services. In health, the introduction of formal fees while ensuring that providers continued to receive some additional earnings, have shown promise in reducing the level of informal payments in Kyrgyzstan and Cambodia (Kutzin et al. 2003; Barber, Bonnet, and Bekedam 2004). Formal contributions that are transparent and may make teachers and principals more responsive to parents, is an alternative that deserves attention and experimentation.
18 Students in schools that offer private tutoring score approximately 0.1 standard deviations lower on the national secondary exam.
47

Using campaigns to inform parents about education entitlements
Often parents and students are not (fully) aware of what their education entitlements are, for instance, they do not know whether primary education is meant to be provided for free or not, or if there are fees they do not know the correct amount. In either case, the lack of information facilitates the charging of informal payments by education officials and teachers. Public dissemination of information on school fees (amount and frequency), the need to pay officially, and to receive a receipt, can potentially help reduce the extent of informal payments when parents and communities have the knowledge and ability to refuse payment. There is no direct evidence on the effect of school fee dissemination on the extent of informal payments for access to education but some related evidence on the positive impact of information being made available to communities for the reduction of leakages exists (Reinikka and Svensson 2005).
Penalties for cheating on examinations
The introduction of financial or professional (e.g. dismissal and expulsion) penalties for both students paying to access examination information in advance and those selling this information (e.g. test providers and teachers) could, if enforceable, help reduce cheating.
6. Corruption PerceptionsAs noted in the previous section, informal payments, a form of corruption, reflects a breakdown of good governance and undermines service provision. Indeed, corruption brings into question the viability of the governance process summarized in Figure 1, and suggests that accountability of service providers is either not enforced or non-existent. Perceptions of corruption are useful for tracking overall corruption but must be complemented by more objective measures, such as those discussed above, to identify specific levers that can help raise performance.
Perceptions of the education sector and education service delivery provide a guide to how public services are performing. While perceptions of actual performance or corruption are not necessarily accurate, they can affect the behavior of providers, parents, and students. Their ability to cover households as well as providers and the private sector makes perception surveys useful. They also signal how well public investments in the sector are perceived, which in turn tends to influence utilization and public support for publicly financed education. The alternative to perceptions surveys is household surveys, which are more costly and time consuming but provide more extensive evidence and context.
Corruption perception surveys by the World Bank, AfroBarometer, AmericasBarometer, and Transparency International among others, focus on specific sectors including education, and provide perceptions of the extent of corruption in the sector. Results are typically reported either as the share of citizens, business people, experts, or public officials reporting worse-than-neutral corruption outcomes, or as an average of all scores.
Corruption in education, as measured by perception surveys, varies substantially within and across regions (Figure 7). In Sub-Saharan Africa, the share of households perceiving the education sector as corrupt ranges from 5 percent in Madagascar to 36 percent in
48

Nigeria, In Latin America from 18 percent in Paraguay to 51 percent in Honduras, and in Eastern Europe from 10 percent in Bulgaria to more than 33 percent in Serbia.
Countries with better institutions should in theory be less corrupt. The World Bank’s Country Policy and Institutional Assessment (CPIA) offers a measure of institutional quality. It includes a subcategory, building human resources in education, which “assesses national policies and public and private sector service delivery that affect access to and quality of education, ECD, training and literacy” (OPSC 2007: 3). The scores range from 1–6 (6 indicating higher quality institutions) and are based on the assessments of education experts working on the country against a sample of regional benchmark countries.
Average regional CPIA scores for building human resources for education are shown in Figure 8. In 2007, Europe and Central Asia had the highest average regional score followed by Latin America and the Caribbean and South Asia; Sub-Saharan Africa had the lowest average score. There is, of course, significant variation across countries within each region. While not perfect, such scores reflect both policy and execution of policy and the institutional quality of the entities providing education services and therefore, provide a sense of education performance and honesty of government.
49

FIGURE 7. SHARE OF HOUSEHOLDS PERCEIVING EDUCATION AS CORRUPT IN SELECTED COUNTRIES, 2002-06 (PERCENT)
0 10 20 30 40 50 60
Madagascar (2005)
Cape Verde (2005)
Tanzania (2005)
Lesotho (2005)
Kenya (2005)
Bulgaria (2002)
Albania (2002)
Zimbabwe (2005)
Senegal (2005)
Botswana (2005)
Uganda (2005)
Malawi (2005)
Ghana (2005)
Croatia (2002)
Romania (2002)
Paraguay (2006)
South Africa (2006)
Mali (2005)
Montenegro (2002)
Zambia (2005)
BIH (2002)
Macedonia (2002)
Guatemala (2005)
Mozambique (2005)
Namibia (2006)
Serbia (2002)
Nigeria (2005)
Haiti (2004)
Colombia (2002)
Honduras (2002)
Share of households perceiving education as corrupt (percent)
Note: Data for each region are from the same survey to ensure consistency across countries in how the question on informal payments was asked.Sources: Afrobarometer Round 3 (2006); SELDI (2002); and World Bank Governance and Anti-Corruption Diagnostic Surveys (various years).
50

FIGURE 8: CPIA SCORES FOR BUILDING HUMAN RESOURCES IN EDUCATION BY REGION, 2007
3.0
3.2
3.4
3.6
3.8
4.0
4.2
East Asia andPacific
Europe andCentral Asia
Latin Americaand the
Caribbean
Middle Eastand North
Africa
South Asia Sub-SaharanAfrica
CP
IA s
core
s on
bui
ldin
g hu
man
reso
urce
s ed
ucat
ion
2007
Note: Unweighted average CPIA scores for question 9b, building human resources in education, by region.Source: CPIA Review (2007).
Another approach to capturing perceptions of education sector institutions and performance is client satisfaction surveys. Satisfaction surveys complement evidence on perceptions of and experience with corruption and education service delivery performance. Recent survey data from Indonesia has been used to examine whether client satisfaction surveys can guide policy. The findings suggest that perceptions data are not as useful for directly informing policymaking as they are for providing insights to policymakers on the priorities of citizens, and on the acceptability and effect of specific reforms such as decentralization (Dasgupta, Narayan, and Skoufias 2009).
Still, high scores on perceived corruption and low scores on perceived institutional quality and performance all provide red flags and indicate the need to assess possible corruption and shortcomings in education service delivery and financing.
7. ConclusionsThe role of good governance in raising education provision performance is important and provides a useful entry point for discussions of policy, programs, and implementation. Considerable work exists on how to design sound education programs – quality of inputs and budget and financial management for example. Much of that knowledge informs countries’ education agendas. However, the challenge of translating those concepts into functioning and effective education systems is a harder and more complicated step. It moves into the realm of political economy to align the interests of different stakeholders,
51

and ensure that they face the appropriate incentives and accountabilities to perform as intended.
The gap between good ideas and evidence-based programs on the one hand, and education performance and outcomes on the other, is often significant. The governance agenda focuses on the elements of implementation, the factors that drive performance and make sound technical designs successful in a public context. In effect, good governance offers tools for the middle-ground between program design and its execution.
This paper provides a definition of good governance in education and a framework for thinking about governance issues as a way of improving performance in the education sector. Performance indicators are proposed that offer the potential for comparison, and whose collection is not overly complex or costly, and that have relevance at the national level as well as at the school level. These indicators, when available, are useful tools for cross-country comparisons and for tracking relative education performance, and provide the context for the discussion of good governance and performance in education.
The crucial elements for good governance and high performance include standards, incentives, information, and accountability, all of which support implementation. The paper reviews budget and financial management issues; examines human resource policies and performance; discusses the issues surrounding informal payments for education services; and briefly summarizes the evidence on corruption perceptions in education. This review of ideas and evidence is intended to contribute to the design of projects, and assessment of options for improving education service delivery performance.
While virtually none of the indicators or evidence applies to all countries, they provide a basis for measuring performance. Experiences from other countries are useful in designing programs or conducting analytic work where performance is an issue. This paper is not meant as a catalogue of the possible but rather as an effort to define and analyze the governance and performance issues in education while realizing that much more work needs to be done to understand how to raise education sector performance.
52

References
ADB/OECD (2006), Curbing Corruption in Public Procurement in Asia and the Pacific. Progress and Challenges in 25 Countries, Available at http://www.oecd.org/corruption/asiapacific
Alcázar, Lorena, F. Halsey Rogers, Nazmul Chaudhury, Jeffrey Hammer, Michael Kremer, and Karthik Muralidharan (2006), “Why Are Teachers Absent? Probing Service Delivery in Peruvian Primary Schools”, International Journal of Educational Research 45(3): 117-136.
Alderman, Harold H., Jooseop Kim, and Peter F. Orazem (2003), “Design, Evaluation, and Sustainability of Private Schools for the Poor: The Pakistan Urban and Rural Fellowship School Experiments”, Economics of Education Review 22(3) (June): 265–274.
Álvarez, Jesús, Vicente Garcia Moreno & Harry A. Patrinos (2007), “Institutional Effects as Determinants of Learning Outcomes. Exploring State Variations in Mexico”, HDN Policy Research Working Paper 4286. Washington, DC: Human Development Network, World Bank.
Avalos, Beatrice (2000), “Policies for Teacher Education in Developing Countries”, International Journal of Education Research 33(5): 457–474.
Banerjee, Abhijit V. and Esther Dulfo (2006), “Addressing Absence”, Journal of Economic Perspectives 20(1): 117–132.
Banerjee, Abhijit, Rukmini Banerji, Esther Duflo, Rachel Glennerster, Daniel Kenniston, Stuti Khemani, and Marc Shotland (2007), “Can Information Campaigns Raise Awareness and Local Participation in Primary Education?”, Economic and Political Weekly 42(15): 1365–1372.
Barber, Sarah, Frederic Bonnet, and Henk Bekedam (2004), “Formalizing Under-the-Table Payments to Control Out-of-Pocket Hospital Expenditures in Cambodia”, Health Policy and Planning 19(4): 199–208.
Barrera-Osorio, Felipe (2007), “The Impact of Private Provision of Public Education: Empirical Evidence from Bogota's Concession Schools”, World Bank Policy Research Working Paper 4121, Washington, DC: World Bank.
Benveniste, Luis, Jeffery Marshall, and Lucrecia Santibañez (2007), Teaching in Lao PDR, Washington, DC: World Bank and the Ministry of Education Lao PDR.
Bennell, Paul and Kwame Akyeampong (2007), Teacher Motivation in Sub-Saharan Africa and South Asia, Essex, U.K.: Department for International Development.
Bennett, Nicholas (2001), “Corruption in Education Systems in Developing Countries: What It Is Doing to the Young”, Paper presented to the 10th International Anticorruption Conference, Prague, Czech Republic, October 7–11.
Bentaouet Kattan, Raja, and Nicholas Burnett (2004), “User Fees in Primary Education”, Education for All Working Paper 30108, Washington, DC: World Bank.
53

Bray, Mark (2003), Adverse effects of private supplementary tutoring. Dimensions, Implications and Government Responses, Paris, France: UNESCO, International Institute for Educational Planning.
Bray, Mark (1999), “The Shadow Education System: Private Tutoring and Its Implications for Planners”, Fundamentals of Education Planning 61. Paris, France: UNESCO, International Institute for Educational Planning
Bruns, Barbara, Alain Mingat, and Ramahatra Rakotomalala (2003), Achieving Universal Primary Education by 2015: A Chance for Every Child, Washington, DC: World Bank.
Burnett, Nicholas and Rodica Cnobloch (2003), “Public Education on Spending in the CIS-7 Countries: The Hidden Crisis”, Paper presented at the IMF/World Bank Conference on Expenditures, Lucerne, Switzerland, January.
Chapman, David (2005) “Stealing an Education: Corruption in education - Its Nature, Effects, and Remedies”, Sectoral Perspectives on Corruption, Commissioned paper prepared for USAID (through MSI International), Washington DC.
Chaudhury, Nazmul, Jeffrey S. Hammer, Michael R. Kremer, Karthik Muralidharan, and F. Halsey Rogers (2006), “Missing in Action: Teacher and Health Worker Absence in Developing Countries”, Journal of Economic Perspectives 20(1): 91–116.
CMS (2006), “Tracking Corruption in India – 2005. Towards Sustaining Good Governance”, New Delhi: Centre for Media Studies.
Das, Jishnu, Stefan Dercon, James Habyarimana, and Pramila Krishnan. 2005. “Teacher shocks and student learning: Evidence from Zambia.” World Bank Policy Research Working Paper 3602. Washington, DC: World Bank.
Das, Jishnu, Priyanka Pandey, and Tristan Zajonc (2005), “Learning Levels and Gaps in Pakistan”, World Bank Policy Research Working Paper 4067, Washington, DC: World Bank.
De Grauwe, Anton (2005), “Improving the Quality of Education Through School-Based Management: Learning from International Experiences”, International Review of Education 51(4): 269-287.
Dehn, Jan, Ritva Reinikka, and Jakob Svensson (2003), “Survey Tools for Assessing Performance in Service Delivery”, in François Bourguinon and Luiz A. Pereira da Silva (editors), The Impact of Economic Policies on Poverty and Income Distribution: Evaluation Techniques and Tools, New York, NY: Oxford University Press, pp. 191–212.
Department of Education (2007), Second Social Expenditure Management Project Completion Report, September 2007. Manila: Department of Education.
Di Gropello, Emanuela and Jeffery H. Marshall (2005), “Teacher Effort and Schooling Outcomes in Rural Honduras”, in Emiliana Vegas (editor), Incentives to Improve Teaching: Lessons from Latin America, Washington, DC: World Bank.
54

Dorotinsky, William and Shilpa Pradhan (2007), “Exploring Corruption in Public Financial Management”, in J. Edgardo Campos and Sanjay Pradhan (editors), The Many Faces of Corruption: Tracking Vulnerabilities at the Sector Level, Washington, DC: World Bank.
Duflo, Esther, Rema Hanna and Stephen Ryan (2007), “Monitoring Works: Getting Teachers to Come to School”, BREAD Working Paper 103, Durham, NC: Bureau for Research and Economic Analysis of Development.
Engberg-Pedersen, Poul, Kai Kaiser, Gregory Kisunko, Inna Kushnarova, and Magnus Lindelow (2005), “Public Expenditure Tracking Surveys: A Stocktaking”, Draft, Washington, DC: World Bank.
Gauthier, Bernard (2006), “PETS-QSDS in Sub-Saharan Africa: A Stocktaking Study”, Draft, Montreal, QC: Institute of Applied Economics, HEC Montreal.
Gaynor, Cathy (1998), Decentralization of Education: Teacher Management, Washington, DC: World Bank.
Gertler, Paul J., Harry A. Patrinos, and Marta Rubio-Codina (2006), “Empowering Parents to Improve Education: Evidence from Rural Mexico”, World Bank Policy Research Working Paper 3935, Washington, DC: World Bank.
Glewwe, Paul W., Nauman Ilias, and Michael R. Kremer (2003), “Teacher Incentives”, NBER Working Paper 9671, Cambridge, MA: National Bureau of Economic Research.
Göttelman-Duret, Gabriele and Joe Hogan (editors) (1998), The Utilization, Deployment and Management of Teachers in Botswana, Malawi, South Africa and Uganda, Paris, France: UNESCO.
Gunnarsson, Victoria, Peter F. Orazem, Mario A. Sánchez, and Aimee Verdisco (2006), “Does School Decentralization Raise Student Outcomes? Theory and Evidence on the Roles of School Autonomy and Community Participation”, Iowa State University Economics Working Paper 04005, Ames, IA: Iowa State University.
Hallak, Jacques and Muriel Poisson (2007), Corrupt Schools, Corrupt Universities: What Can Be Done? Paris, France: UNESCO, Institute for Educational Planning.
Hallak, Jacques and Muriel Poisson (2001), Ethics and Corruption in Education. Results from the Expert Workshop held at IIEP, Paris 28-29 November. Available at http://www.unesco.org/iiep/PDF/Forum15.pdf
Hamminger, Leo (2008), “The Power of Data: Enhancing Transparency in the Education Sector in Sierra Leone”, U4 Brief 22, Bergen: Chr. Michelsen Institute.
IIEP (2006), ”Teacher Motivation, Compensation and Working Conditions”, in Guidebook for Planning Education in Emergencies and Reconstruction, Paris: UNESCO, Institute for International Educational Planning.
IIEP and UNICEF (1994), “Decentralised Management of Primary Education: Bangladesh”, Working Document for Regional Workshop, December 13–21, Kathmandu, Nepal: IIEP and UNICEF.
55

Jayachandran, Seema (2008), “Incentives to Teach Badly? After-School Tutoring in Developing Countries”, Draft.
Jimenez, Emmanuel Y. and Yasuyuki Sawada (2000), “Do Community-Managed Schools Work? An Evaluation of El Salvador’s EDUCO Program”, World Bank Economic Review 13(3): 415–441.
Kaufmann, Daniel, Aart C. Kraay and Massimo Mastruzzi (2003), “Governance Matters III: Governance Indicators for 1996–2002”, World Bank Policy Research Working Paper 3106, Washington, DC: World Bank.
Kaufmann, Daniel, Aart C. Kraay and Massimo Mastruzzi (2007), “Governance Matters VI: Aggregate and Individual Governance Indicators 1996–2006”, World Bank Policy Research Working Paper 4280, Washington, DC: World Bank.
Kellaghan, Thomas and Vincent Greaney (2001), Using Assessment to Improve the Quality of Education, Paris: UNESCO, International Institute for Educational Planning.
King, Elizabet, M. and Dominique van de Walle (2006), “Girls in Lao PDR: Ethnic Affiliation, Poverty, and Location ,” in Maureen A. Lewis and Marlaine Lockheed (editors), Exclusion, Gender and Education: Case Studies from the Developing World, Washington, DC: Center for Global Development.
King, Elizabeth M. and Berk Özler (2004), “What’s Decentralization Got to Do with Learning? School Autonomy and Student Performance”, Impact Evaluation of Education Reforms Working Paper 9, Washington, DC: World Bank.
Kingdon, Geeta and Mohd Muzammil (forthcoming), “Teacher unions and teacher politics: Implications for Teacher accountability in India”, Draft.
Kingdon, Geeta and Mohd Muzammil (2003), The Political Economy of Education in India. Teacher Politics in Uttar Pradesh, Oxford, UK: Oxford University Press.
Kingdon, Geeta and Francis J. Teal (2002), “Does Performance-Related Pay for Teachers Improve Student Performance? Some Evidence from India”, CSAE Working Paper 165, Oxford, England: Centre for the Study of African Economics.
Kremer, Michael R., Nazmul Chaudhury, F. Halsey Rogers, Karthik Muralidharan, and Jeffrey S. Hammer (2005), “Teacher Absence in India: A Snapshot”, Journal of the European Economic Association 3(2–3): 658–667.
Kremer, Michael R. and Daniel Chen (2001), “An Interim Report on a Teacher Attendance Incentive Program in Kenya”, Mimeo, Harvard University.
Kutzin, Joseph, Tilek Meimanaliev, Ainoura Ibraimova, Cheryl Cashin, and Sheila O’Dougherty (2003), “Formalizing Informal Payments in Kyrgyz Hospitals: Evidence from Phased Implementation of Financing Reforms”, Paper presented at the International Health Economics Association Fourth World Congress, San Francisco, California.
Leung, Grace (2005), Textbook Count and Civil Society Participation: Effecting System Reforms in the Department of Education. Makati, the Philippines: Ateneo School of Government.
56

Lewis, Maureen A. (forthcoming), “Decentralizing Education: Do Communities and Parents Matter?” Draft, Washington, DC: The World Bank.
Lewis, Maureen A. (2006), “Governance and Corruption in Public Health Care Systems”, CGD Working Paper 78, Washington, DC: Center for Global Development.
Lloyd, Cynthia, Cem Mete, and Monica Grant (2007), “Rural Girls in Pakistan: Constraints of Policy and Culture”, in Maureen A. Lewisand Marlaine E. Lockheed (editors), Inexcusable Absence: Why 60 Million Girls Still Aren’t in School and What to Do About It, Washington, DC: Center for Global Development.
MacWilliams, Bryon (2002), “In Georgia, Professors Hand Out Price Lists” Chronicle of Higher Education 11(2): A34.
Mulkeen, Aidan and Dandan Chen (Eds.) (2008), Teacher for Rural Schools. Experiences in Lesotho, Malawi, Mozambique, Tanzania, and Uganda, Africa Human Development Series. Washington, DC: World Bank.
Mulkeen, Aidan, David Chapman, Joan DeJaeghere, and Elizabeth Leu (2007), “Recruiting, Retaining, and Retraining Secondary School Teachers and Principals in Sub-Saharan Africa: Secondary Education in Africa”, World Bank Working Paper No. 99, Washington, DC: World Bank.
Muralidharan, Khartik, and Venkatesh Sundararaman (2008), “Teacher Performance Pay: Experimental Evidence from India,” Draft, University of California at San Diego.
OPCS (2007), “Country Policy and Institutional Assessments (2007), Assessment Questionnaire”, Washington, DC: World Bank Operations Policy and Country Services.
Orazem, Peter, Paul W. Glewwe, and Harry A. Patrinos (2007), “The Benefits and Costs of Alternative Strategies to Improve Educational Outcomes”, Iowa State University Department of Economics Working Paper 07028, Ames, IA: Iowa State University.
OECD (2007), Performance Budgeting in OECD Countries, Paris: Organisation for Economic Co-operation and Development.
OSI (2006), Education in a Hidden Marketplace: Monitoring Private Tutoring, New York, NY: Open Society Institute.
Paes de Barros, Ricardo and Rosane Mendonca (1998), “The Impact of Three Institutional Innovations in Brazilian Education”, in William D. Savedoff (editor), Organization Matters: Agency Problems in Health and Education in Latin America, Washington, DC: Inter-American Development Bank.
Patrinos, Harry A. and Ruth Kagia (2007), “Maximizing the Performance of Education Systems: The Case of Teacher Absenteeism”, in J. Edgardo Campos and Sanjay Pradhan (editors), The Many Faces of Corruption: Tracking Vulnerabilities at the Sector Level, Washington, DC: The World Bank, pp. 63–87.
PEFA Secretariat (2005), Public Financial Management. Performance Measurement Framework, Washington, DC: Public Expenditure and Financial Accountability Program.
57

Pritchett, Lant H. and Rinku Murgai (2006), “Teacher Compensation: Whether Decentralization to Local Bodies Can Take India from the Perfect Storm Through Troubled Waters to Clear Sailing”, in Suman Bery, Barry P. Bosworth and Arvind Panagariya (editors), India Policy Forum 2006/07, Los Angeles, CA: Sage Publications.
PROBE (1999), Public Report on Basic Education in India, Oxford, UK; Oxoford University Press.
Reinikka, Ritva and Jakob Svensson (2005), “Fighting Corruption to Improve Schooling: Evidence from a Newspaper Campaign in Uganda”, Journal of the European Economic Association 3 (2–3): 259–267.
Reinikka, Ritva and Jakob Svensson (2004), “Local Capture: Evidence from a Central Government Transfer Program in Uganda”, Quarterly Journal of Economics 119(2): 679–706.
Reinikka, Ritva and Nathanael Smith (2004), Public Expenditure Tracking Surveys in Education, Paris, France: UNESCO, International Institute for Educational Planning.
Rivkin, Steven, G., Eric A. Hanushek, and John F. Kain (2005), “Teachers, Schools, and Academic Achievement”, Econometrica 73(2): 417–458.
Rogers, F. Halsey and Emiliana Vegas (2009), “No More Cutting Class? Reducing Teacher Absenteeism and Providing Incentives for Performance”, World Bank Policy Research Working Paper 4847, Washington, DC: World Bank.
Santibañez, Lucrecia (2008), “Teacher Contracting: Review of the Theory and Evidence Around the World”, Draft, Washington, DC: World Bank.
Sawada, Yasuyuki and Andrew B. Ragatz (2005), “Decentralization of Education, Teacher Behavior and Outcomes: The Case of El Salvador’s EDUCO Program”, in Emiliana Vegas (editor), Incentives to Improve Teaching: Lessons from Latin America, Washington, DC: World Bank.
Savedoff, William D. (2008), “Public Expenditure Tracing Surveys: Planning, Implementation and Uses”, Draft, Washington, DC: Social Insight and World Bank.
Sewell, David (2004), “Lessons on Sequencing Financial Management and Accountability Systems in Decentralized Post-Conflict/Low Capacity Contexts: The Case of Sierra Leone”, PRMPS Working Paper, Washington, DC: World Bank.
Shakil, Sofia (2008), “Pakistan: Governance and Accountability to Improve Education Service Delivery”, Presentation at HD Learning Week, November 12, Washington, DC.
Skoufias Emmanuel and Joseph Shapiro (2006), “Evaluating the Impact of Mexico’s Quality Schools Program: The Pitfalls of Using Nonexperimental Data”, World Bank Policy Research Working Paper 4036, Washington, DC: World Bank.
Thampi, Gopakumar Krishnan (2002), “Corruption in South Asia, Insights and Benchmarks from Citizen Feedback Surveys in Five Countries”, Draft, Berlin, Germany: Transparency International.
58

SELDI (various years), “Regional Corruption Monitoring in Albania, Bosnia and Herzegovina, Bulgaria, Croatia, Macedonia, Romania, and Serbia and Montenegro”, Draft, Rome, Italy: The Southeast European Legal Development Initiative Secretariat.
Transparency International (2004), Stealing the Future: Corruption in the Classroom: Ten Real World Experiences, Berlin, Germany: Transparency International.
Transparency International (2007), “Corruption in the Education Sector”, Transparency International Working Paper e4, Berlin, Germany: Transparency International.
Umansky, Illana (2005), “A Literature Review of Teacher Quality and Incentives”, in Emiliana Vergas (editor), Incentives to Improve Teaching: Lessons from Latin America, Washington, DC: The World Bank, pp. 21–62.
UNDP (2008), Tackling Corruption, Transforming Lives: Accelerating Human Development in Asia and the Pacific, New Delhi, India: Macmillan India Ltd.
Vegas, Emiliana and Ilana Umansky (2005), “Improving Teaching and Learning Through Effective Incentives: Lessons from Education Reforms in Latin America”, in Emiliana Vergas (editor), Incentives to Improve Teaching: Lessons from Latin America, Washington, DC: The World Bank, pp. 1–20.
Vegas, Emiliana (2002), “School Choice, Student Performance, and Teacher and Student Characteristics: The Chilean Case”, World Bank Policy Research Working Paper 2833, Washington, DC: World Bank.
Wang, Aubrey H., Ashaki B. Coleman, Richard J. Coley, and Richard P. Phelps (2003), Preparing Teachers Around the World: Policy Information Report. Princeton, NJ: Educational Testing Service.
Ware, Glenn, T., Shaun Moss, J. Edgardo Campos, and Gregory P. Noone (2007), “Corruption in Public Procurement. A Perennial Challenge”, in J. Edgardo Campos and Sanjay Pradhan (editors), The Many Faces of Corruption. Tracking Vulnerabilities at the Sector Level, Washington, DC: World Bank.
World Bank (2003), “Project Appraisal Document on a Proposed Grant in the Amount of SDR36.7 Million to the Republic of Kenya For the Free Primary Education Support Project.” Report No. 25651-KE. Washington, DC: World Bank
World Bank (2004a), “Papua New Guinea: Public Expenditure and Service Delivery”, PESD Report, Washington, DC: World Bank.
World Bank (2004b), “Sierra Leone Public Expenditure Review: From Post-Conflict Recovery to Sustained Growth.” Public Expenditure Review Report 29075-SL, Washington, DC: World Bank.
World Bank (2004c), World Development Report 2004: Making Services Work for Poor People, Washington, DC: World Bank.
World Bank (2004d), “International Development Association Program Document for a Proposed Sector Adjustment Credit in the Amount of SDR69.5 Million (US$100 Million Equivalent) to the Islamic Republic of Pakistan for an Education Sector
59

Adjustment Credit for the Government of Punjab Province”, Report No. 27528-PK, January 8, Human Development Sector Unit, South Asia Region, World Bank.
World Bank (2005a), “Central America Education Strategy. An Agenda for Action”, World Bank Country Study, Washington, DC: World Bank.
World Bank (2006), World Development Indicators, Washington, DC: World Bank.
World Bank. (2007a), What Is School-Based Management?, Washington, DC: World Bank.
World Bank (2007b), “Honduras Public Expenditure Review 2007, Vol. 1.” Public Expenditure Review Report 39251-HO. Washington, DC: World Bank.
World Bank (2007c), “Uganda. Fiscal Policy for Growth. Public Expenditure Review 2007. Volume II: Main Report.” Public Expenditure Review Report 40161-UG. Washington, DC: World Bank.
World Bank (2008), Performance-Informed Budgeting in Latin America. Experiences and Opportunities, Washington, DC: World Bank Public Sector Governance Unit Latin America and the Caribbean.
Wößman, Ludger (2003), “Schooling Resources, Educational Institutions, and Student Performance: The International Evidence”, Oxford Bulletin of Economics and Statistics 65(2): 117–170.
60

ANNEX 1. SELECT AGGREGATE GOVERNANCE INDICATORS
Governance encompasses multiple aspects. These include the capacity of the government to formulate sound policies, manage resources, and provide services efficiently; the effective processes that allow citizens to select, hold accountable, monitor, and replace government; and the respect of government and citizens for the institutions that govern economic and social interactions. Kaufmann, Kraay, and Mastruzzi (2007) break these down into six specific areas: voice and accountability; government effectiveness; control of corruption; regulatory quality; rule of law; and political stability and absence of violence. Of the six, the first four are directly relevant to good governance in education.
Voice and accountability captures the extent to which a country’s citizens are able to participate in the selection of their government, as well as the extent to which public institutions are held accountable. It allows citizens to express their preferences and be involved in the decision-making processes. This dimension also covers freedom of expression, freedom of association, and the presence of a free media. In education, a system with a high level of accountability, one possessing checks and balances; transparent decision-making; access to information; and effective monitoring and evaluation, can improve resource management, reduce corruption, and enhance public service delivery, and ultimately, improve education quality.
Government effectiveness is reflected in the quality of policy formulation and implementation, the effectiveness of public service delivery, the quality of the civil service, and the degree of policy independence from political pressures. In education, this dimension is concerned with, for example, the efficiency of education systems in areas such as licensing requirements; hiring procedures for teachers and school administrators; and the presence and enforcement of national and local statutes on delivering quality education for all.
Control of corruption captures the extent to which there are checks to ensure that public power is not abused for private gain or that there is no “capture” of the state by elites and private interests. In the education sector, forms of corruption include but are not limited to nepotism; purchasing of posts; irregularities in the procurement of education supplies and facilities; bribery in admission and examination; and teacher absenteeism.
61