Embed Size (px)
Citation preview
Governance e-Transformation:Public Perception, Support, and Uptake
International Donors’ MeetingChisinau, Moldova, February 25, 2016
GOVERNMENT OF REPUBLIC OF MOLDOVA
CORNELIA AMIHALACHIOAE
Moldova eGovernment Center
PUBLIC PERCEPTION INDICATORS - CORE
CITIZENS’ SAY MUST BE FOUNDAMENTAL
AND GO MUCH FURTHER THAN ELECTIONS/POWER INVESTMENTS INTO MPs,
EACH CORE REFORM NEEDS CONSTANT MEASUREMENT OF THE SOCIETY’S PULSE
PUBLIC PERCEPTION INDICATORS - CORE
PUBLIC PERSCEPTION STUDIES ARE FOUNDAMENTAL
PROVIDE REAL DATA ON CURRENT PERCEPTION
PREVENTS SELF-ILLUSIONS AND ERRORS
PUBLIC PERCEPTION INDICATORS IN THE RESULTS MATRIX
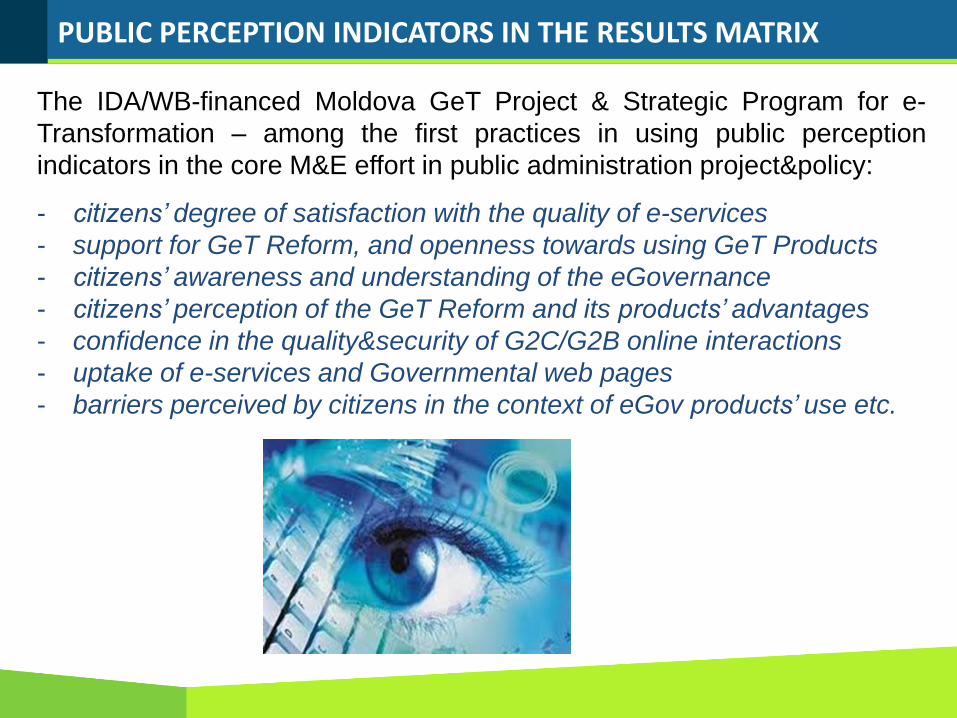
The IDA/WB-financed Moldova GeT Project & Strategic Program for e-
Transformation – among the first practices in using public perception
indicators in the core M&E effort in public administration project&policy:
- citizens’ degree of satisfaction with the quality of e-services
- support for GeT Reform, and openness towards using GeT Products
- citizens’ awareness and understanding of the eGovernance
- citizens’ perception of the GeT Reform and its products’ advantages
- confidence in the quality&security of G2C/G2B online interactions
- uptake of e-services and Governmental web pages
- barriers perceived by citizens in the context of eGov products’ use etc.
2015 NATIONAL ANNUAL SURVEY ON GET PUBLIC PERCEPTION
Methodology
Sample size: 3024 respondents aged 18 years & older
Representativeness: sample representative for the adult population of Moldova,with a maximal error margin of ± 1.8%.
Data collection period: November 2015
Location: Interviews conducted at respondents' residence.
Language: Romanian or Russian (up to respondent’s choice).
Sample: stratified sampling, probability sampling, bistadial sampling.
Randomization: 1. Location 2. Family 3. Person
2015 NATIONAL ANNUAL SURVEY ON GET PUBLIC PERCEPTION
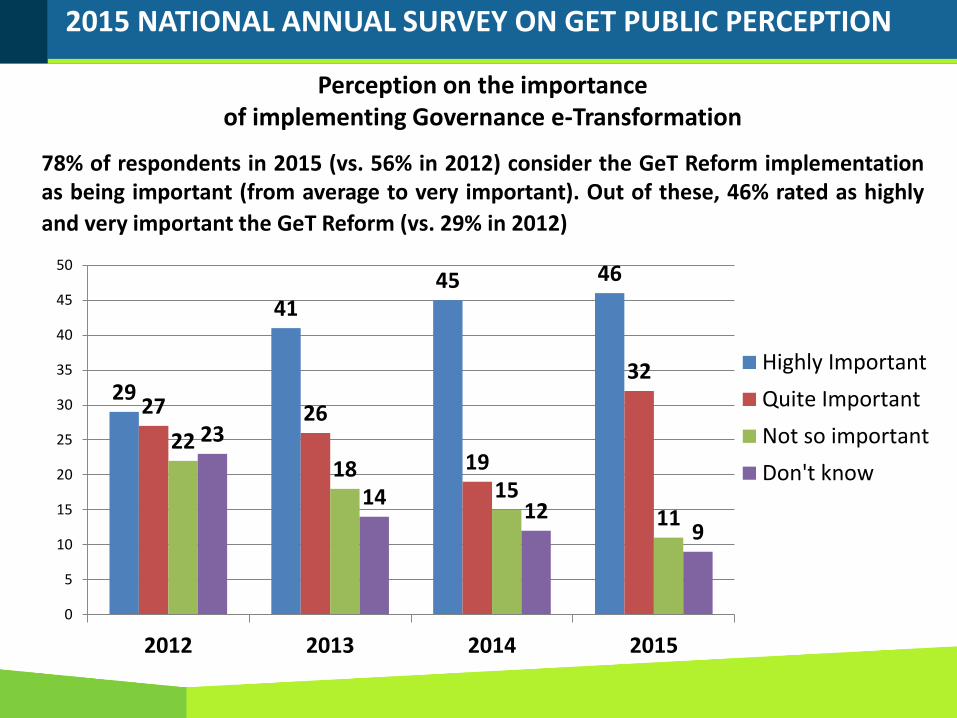
Perception on the importance of implementing Governance e-Transformation
78% of respondents in 2015 (vs. 56% in 2012) consider the GeT Reform implementationas being important (from average to very important). Out of these, 46% rated as highly
and very important the GeT Reform (vs. 29% in 2012)
29
4145 46
27 26
19
32
2218
1511
23
1412
9
0
5
10
15
20
25
30
35
40
45
50
2012 2013 2014 2015
Highly Important
Quite Important
Not so important
Don't know
2015 NATIONAL ANNUAL SURVEY ON GET PUBLIC PERCEPTION
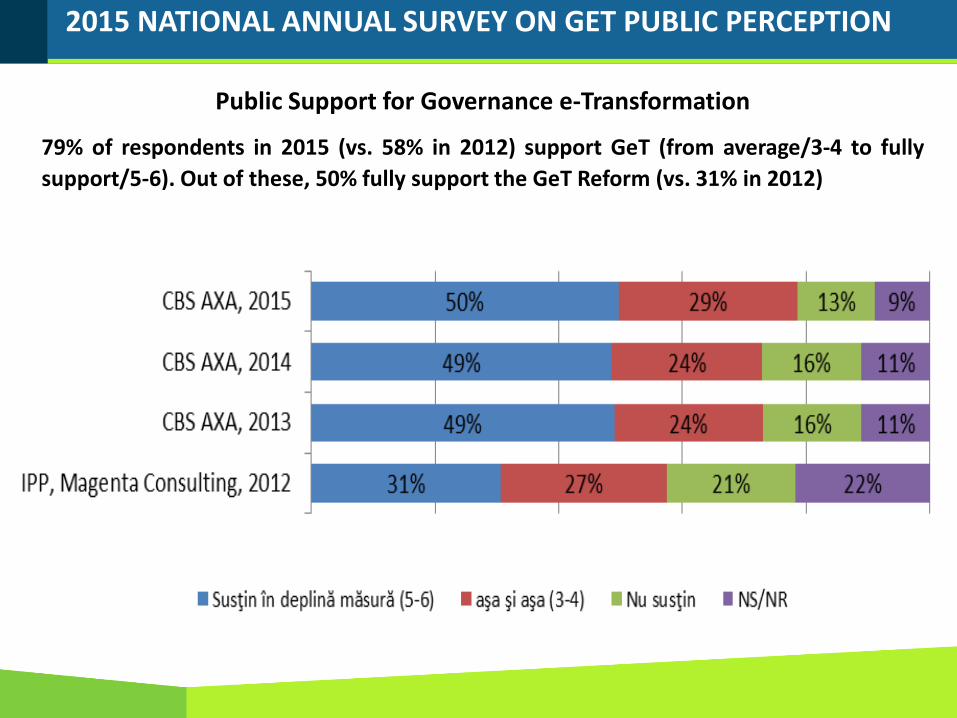
Public Support for Governance e-Transformation
79% of respondents in 2015 (vs. 58% in 2012) support GeT (from average/3-4 to fully
support/5-6). Out of these, 50% fully support the GeT Reform (vs. 31% in 2012)
2015 NATIONAL ANNUAL SURVEY ON GET PUBLIC PERCEPTION
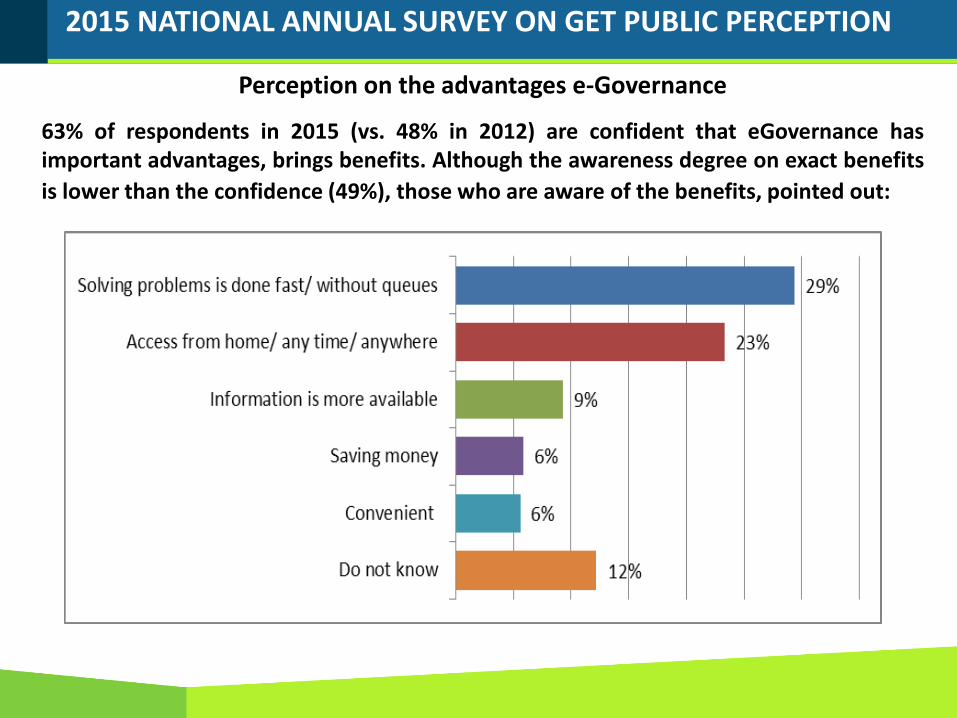
Perception on the advantages e-Governance
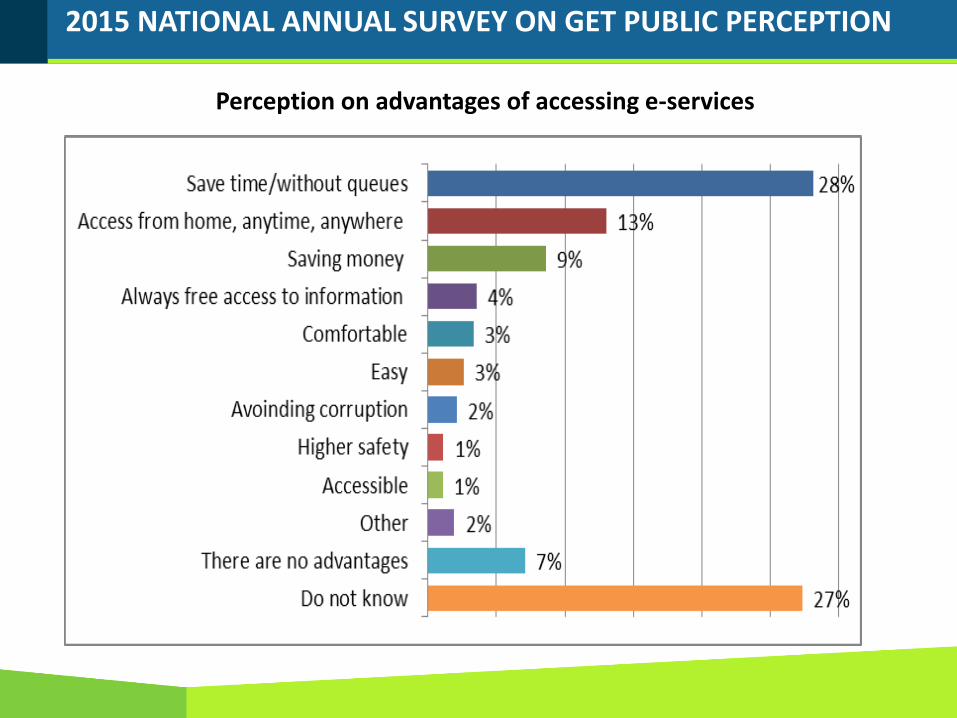
63% of respondents in 2015 (vs. 48% in 2012) are confident that eGovernance hasimportant advantages, brings benefits. Although the awareness degree on exact benefits
is lower than the confidence (49%), those who are aware of the benefits, pointed out:
2015 NATIONAL ANNUAL SURVEY ON GET PUBLIC PERCEPTION
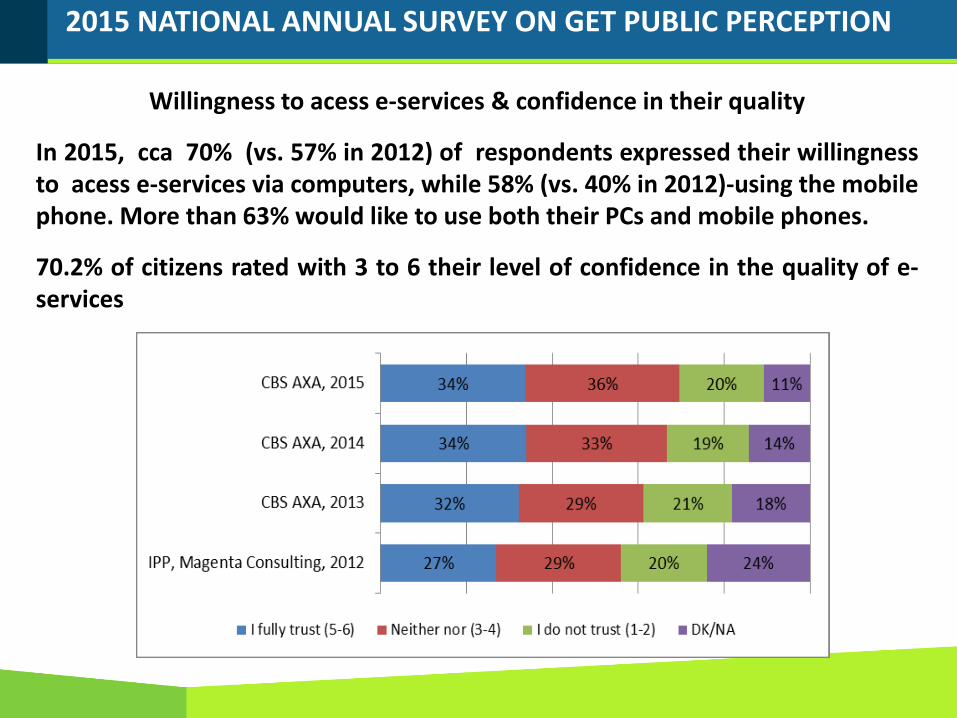
Willingness to acess e-services & confidence in their quality
In 2015, cca 70% (vs. 57% in 2012) of respondents expressed their willingnessto acess e-services via computers, while 58% (vs. 40% in 2012)-using the mobilephone. More than 63% would like to use both their PCs and mobile phones.
70.2% of citizens rated with 3 to 6 their level of confidence in the quality of e-services
2015 NATIONAL ANNUAL SURVEY ON GET PUBLIC PERCEPTION
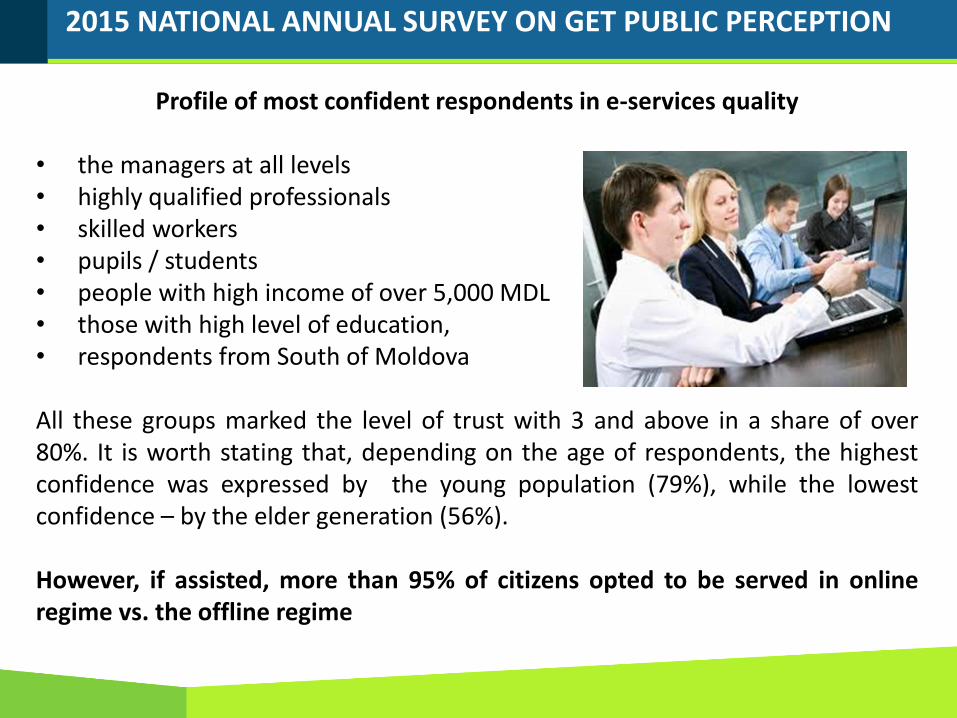
Profile of most confident respondents in e-services quality
• the managers at all levels• highly qualified professionals• skilled workers• pupils / students• people with high income of over 5,000 MDL• those with high level of education,• respondents from South of Moldova
All these groups marked the level of trust with 3 and above in a share of over80%. It is worth stating that, depending on the age of respondents, the highestconfidence was expressed by the young population (79%), while the lowestconfidence – by the elder generation (56%).
However, if assisted, more than 95% of citizens opted to be served in onlineregime vs. the offline regime
2015 NATIONAL ANNUAL SURVEY ON GET PUBLIC PERCEPTION
Level of confidence in the SAFETY of online services provision
Respondents were asked to rate their level of confidence that if requesting anonline public service it will ensure achieving the targeted service with the fullcompliance of their personal data protection – their data shall not be madeavailable to irrelevant persons or institutions.
Correlation analysis: indicator connected with the level of citizens’ trust in Govt.
2015 NATIONAL ANNUAL SURVEY ON GET PUBLIC PERCEPTION
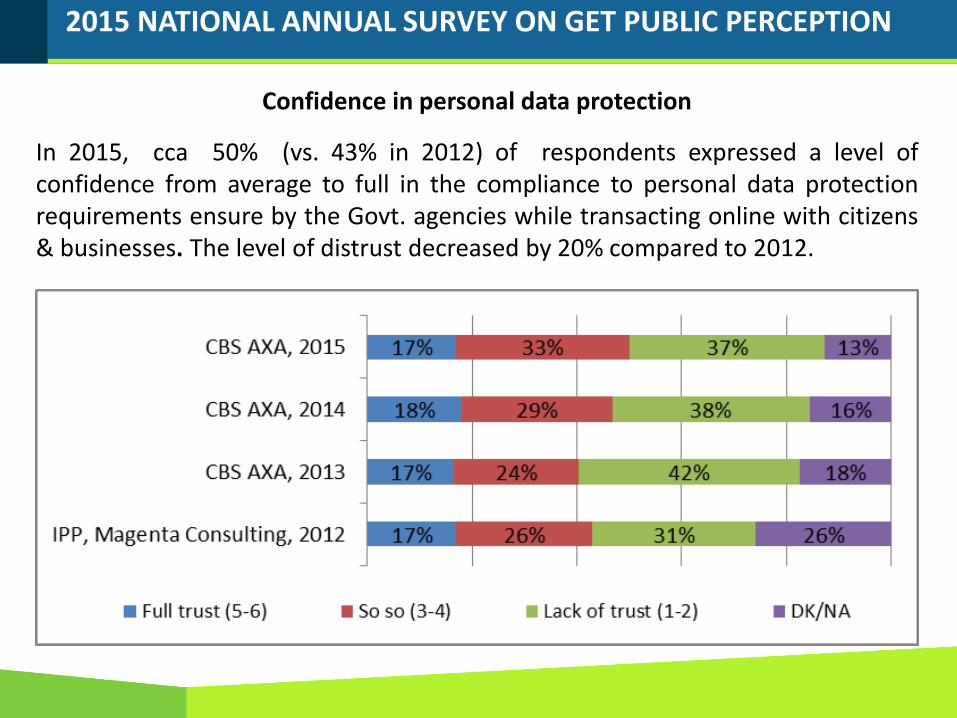
Confidence in personal data protection
In 2015, cca 50% (vs. 43% in 2012) of respondents expressed a level ofconfidence from average to full in the compliance to personal data protectionrequirements ensure by the Govt. agencies while transacting online with citizens& businesses. The level of distrust decreased by 20% compared to 2012.
2015 NATIONAL ANNUAL SURVEY ON GET PUBLIC PERCEPTION
Perception on advantages of accessing e-services
2015 NATIONAL ANNUAL SURVEY ON GET PUBLIC PERCEPTION
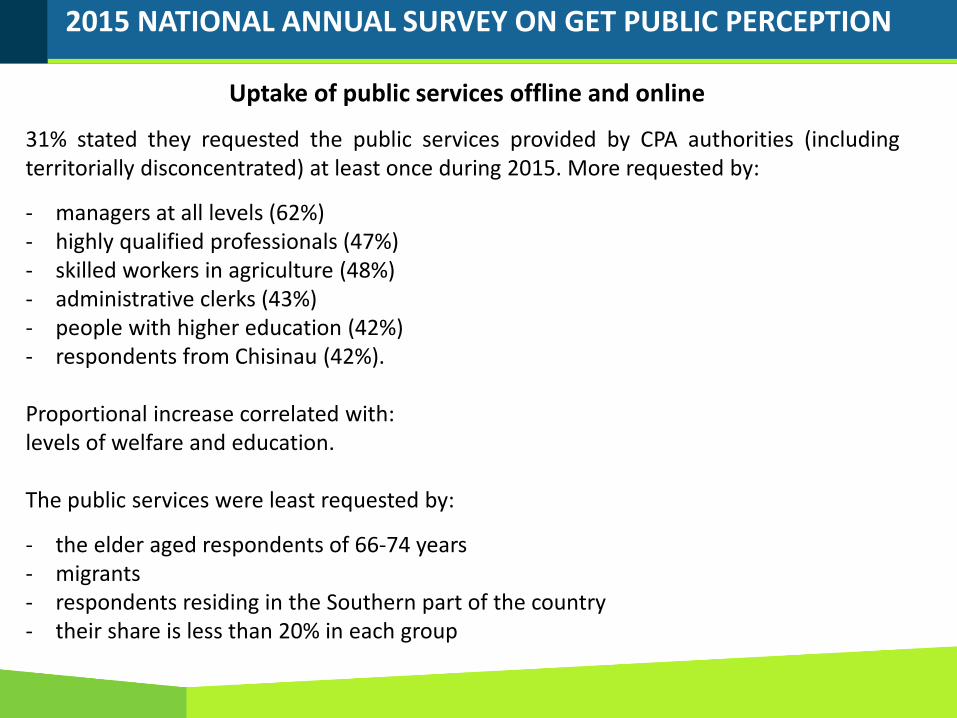
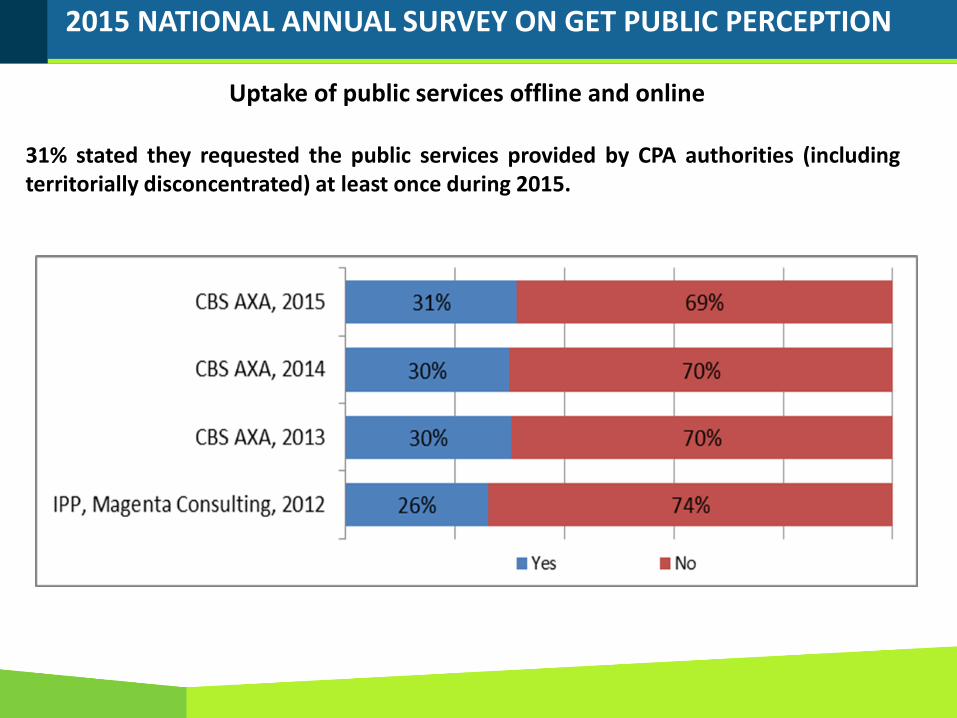
Uptake of public services offline and online
31% stated they requested the public services provided by CPA authorities (includingterritorially disconcentrated) at least once during 2015. More requested by:
- managers at all levels (62%)- highly qualified professionals (47%)- skilled workers in agriculture (48%)- administrative clerks (43%)- people with higher education (42%)- respondents from Chisinau (42%).
Proportional increase correlated with:levels of welfare and education.
The public services were least requested by:
- the elder aged respondents of 66-74 years- migrants- respondents residing in the Southern part of the country- their share is less than 20% in each group
2015 NATIONAL ANNUAL SURVEY ON GET PUBLIC PERCEPTION
Uptake of public services offline and online
31% stated they requested the public services provided by CPA authorities (includingterritorially disconcentrated) at least once during 2015.
2015 NATIONAL ANNUAL SURVEY ON GET PUBLIC PERCEPTION
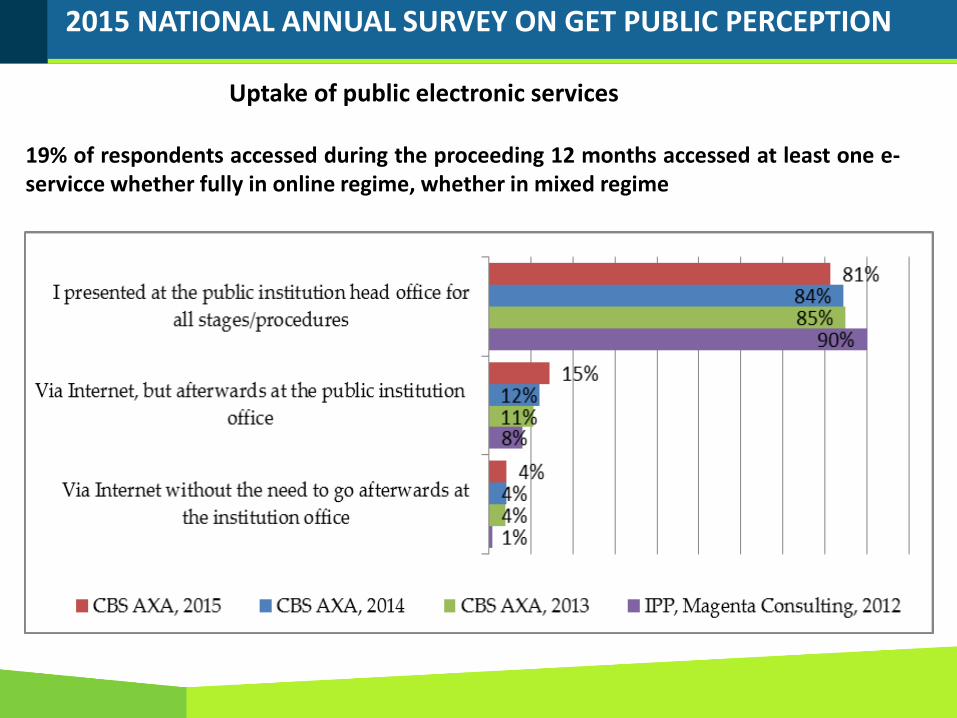
Uptake of public electronic services
19% of respondents accessed during the proceeding 12 months accessed at least one e-servicce whether fully in online regime, whether in mixed regime
2015 NATIONAL ANNUAL SURVEY ON GET PUBLIC PERCEPTION
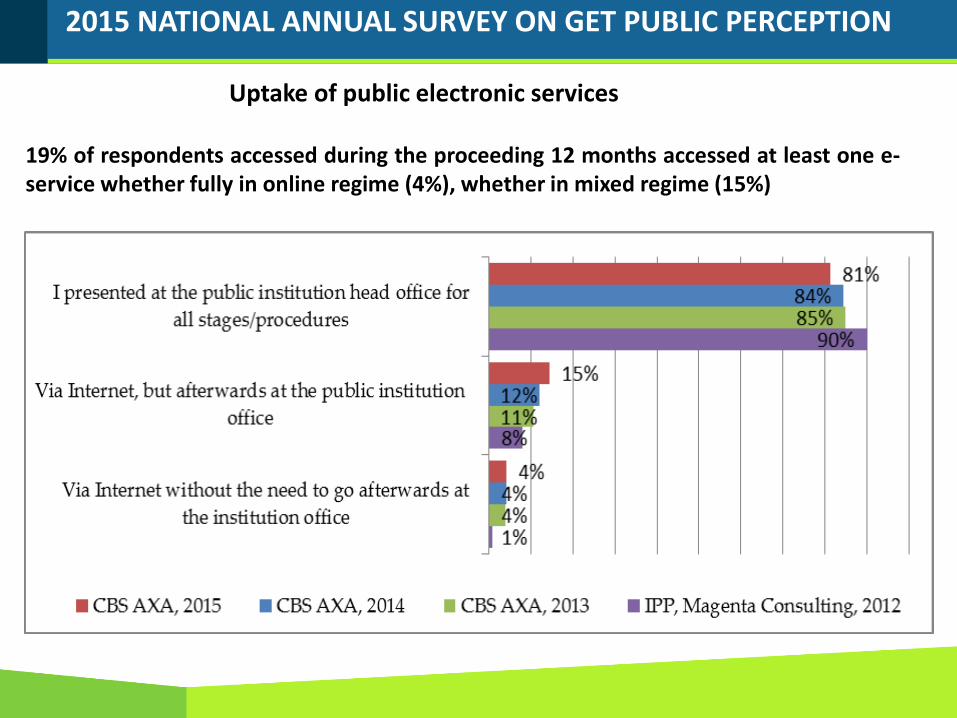
Uptake of public electronic services
19% of respondents accessed during the proceeding 12 months accessed at least one e-service whether fully in online regime (4%), whether in mixed regime (15%)
2015 NATIONAL ANNUAL SURVEY ON GET PUBLIC PERCEPTION
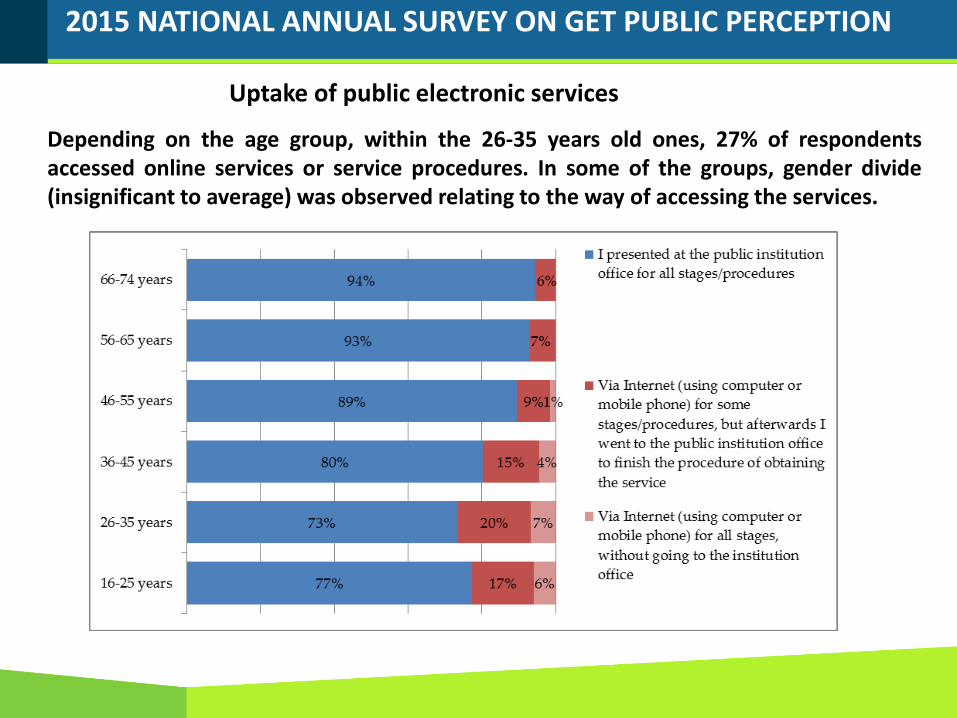
Uptake of public electronic services
Depending on the age group, within the 26-35 years old ones, 27% of respondentsaccessed online services or service procedures. In some of the groups, gender divide(insignificant to average) was observed relating to the way of accessing the services.
2015 NATIONAL ANNUAL SURVEY ON GET PUBLIC PERCEPTION
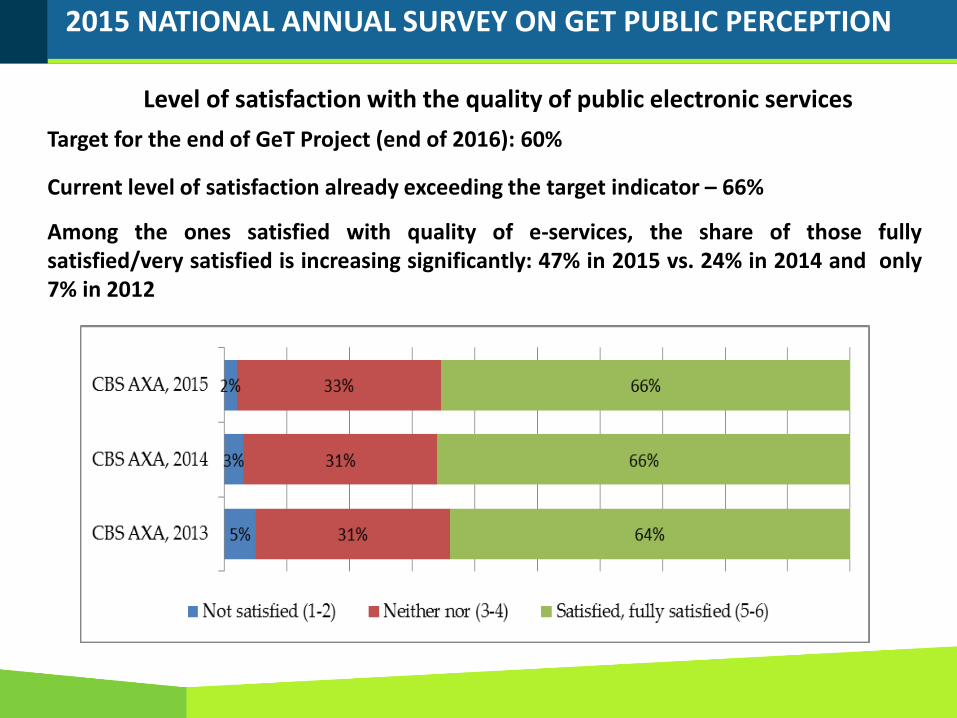
Level of satisfaction with the quality of public electronic services
Target for the end of GeT Project (end of 2016): 60%
Current level of satisfaction already exceeding the target indicator – 66%
Among the ones satisfied with quality of e-services, the share of those fullysatisfied/very satisfied is increasing significantly: 47% in 2015 vs. 24% in 2014 and only7% in 2012
2015 NATIONAL ANNUAL SURVEY ON GET PUBLIC PERCEPTION
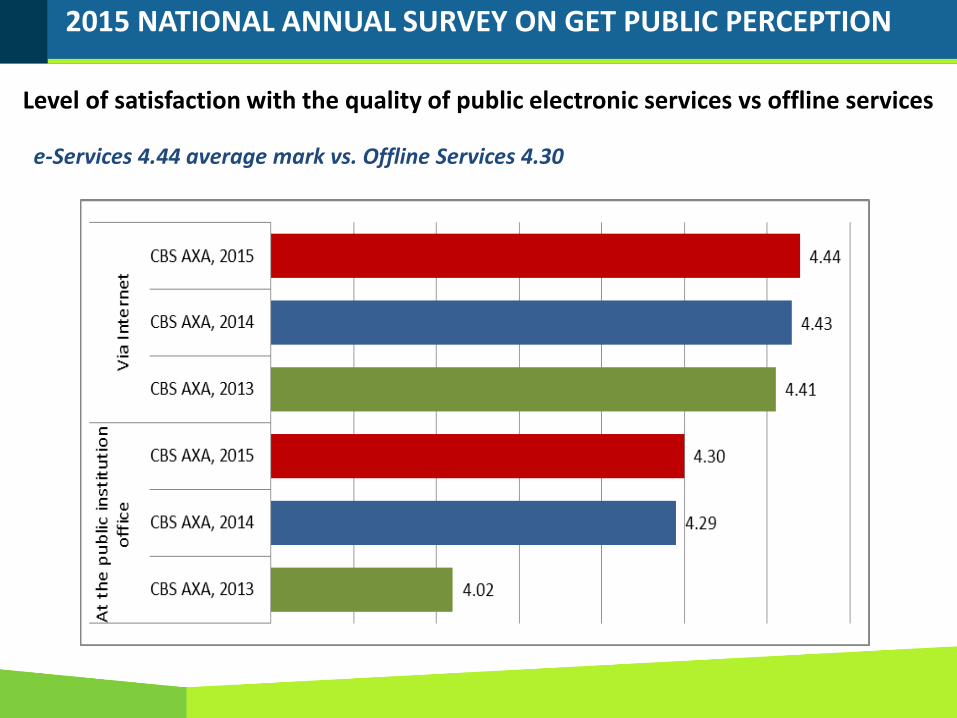
Level of satisfaction with the quality of public electronic services vs offline services
e-Services 4.44 average mark vs. Offline Services 4.30
2015 NATIONAL ANNUAL SURVEY ON GET PUBLIC PERCEPTION
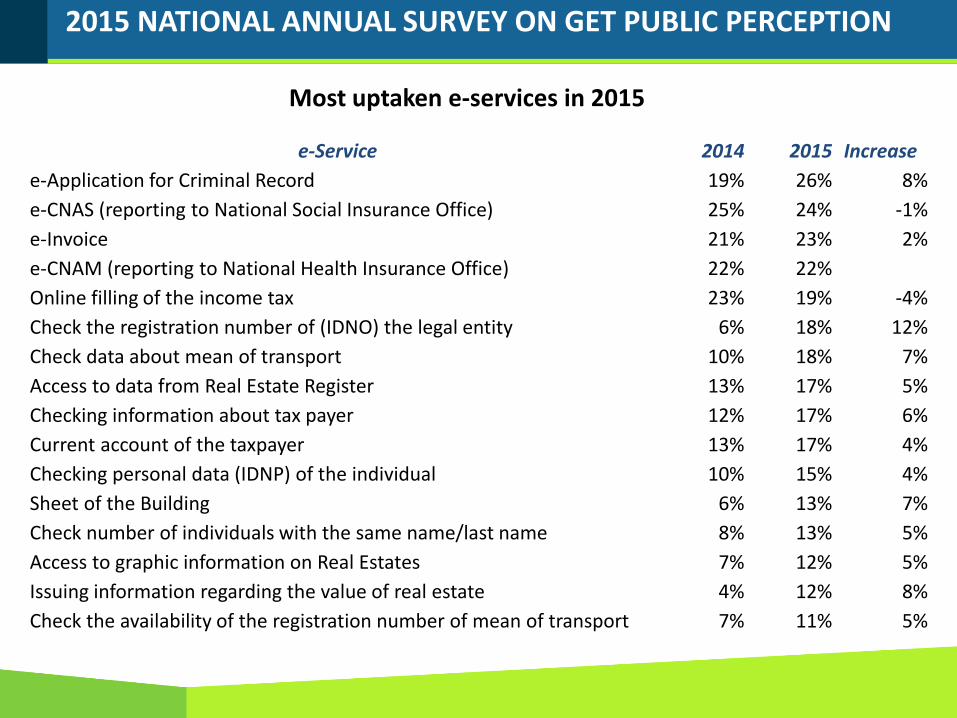
Most uptaken e-services in 2015
e-Service 2014 2015 Increase
e-Application for Criminal Record 19% 26% 8%
e-CNAS (reporting to National Social Insurance Office) 25% 24% -1%
e-Invoice 21% 23% 2%
e-CNAM (reporting to National Health Insurance Office) 22% 22%
Online filling of the income tax 23% 19% -4%
Check the registration number of (IDNO) the legal entity 6% 18% 12%
Check data about mean of transport 10% 18% 7%
Access to data from Real Estate Register 13% 17% 5%
Checking information about tax payer 12% 17% 6%
Current account of the taxpayer 13% 17% 4%
Checking personal data (IDNP) of the individual 10% 15% 4%
Sheet of the Building 6% 13% 7%
Check number of individuals with the same name/last name 8% 13% 5%
Access to graphic information on Real Estates 7% 12% 5%
Issuing information regarding the value of real estate 4% 12% 8%
Check the availability of the registration number of mean of transport 7% 11% 5%
2015 NATIONAL ANNUAL SURVEY ON GET PUBLIC PERCEPTION
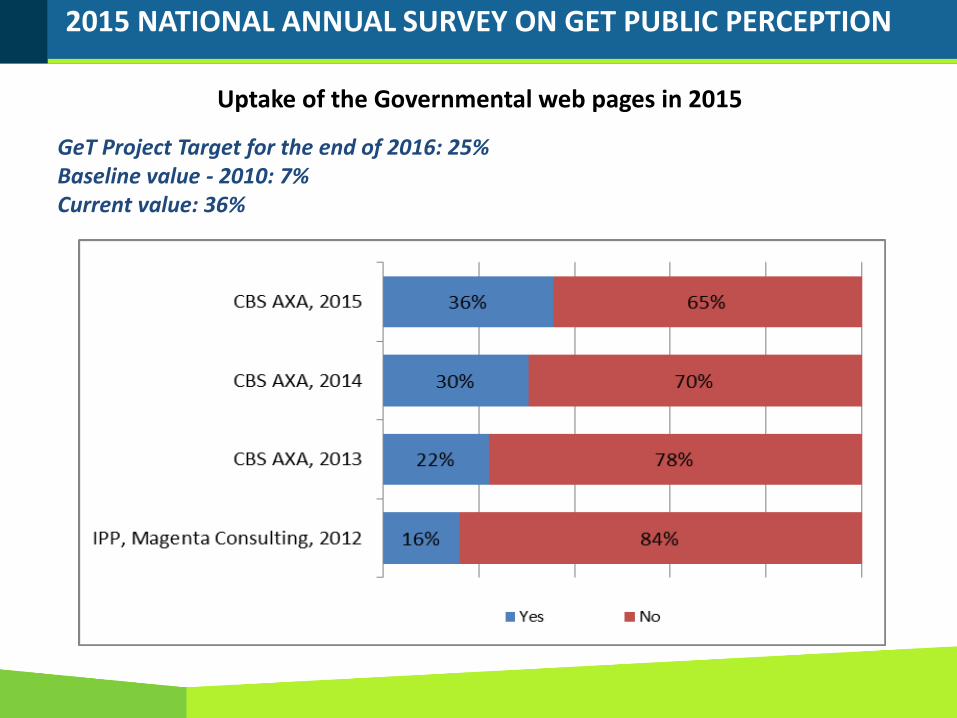
Uptake of the Governmental web pages in 2015
GeT Project Target for the end of 2016: 25%Baseline value - 2010: 7%Current value: 36%
2015 NATIONAL ANNUAL SURVEY ON GET PUBLIC PERCEPTION
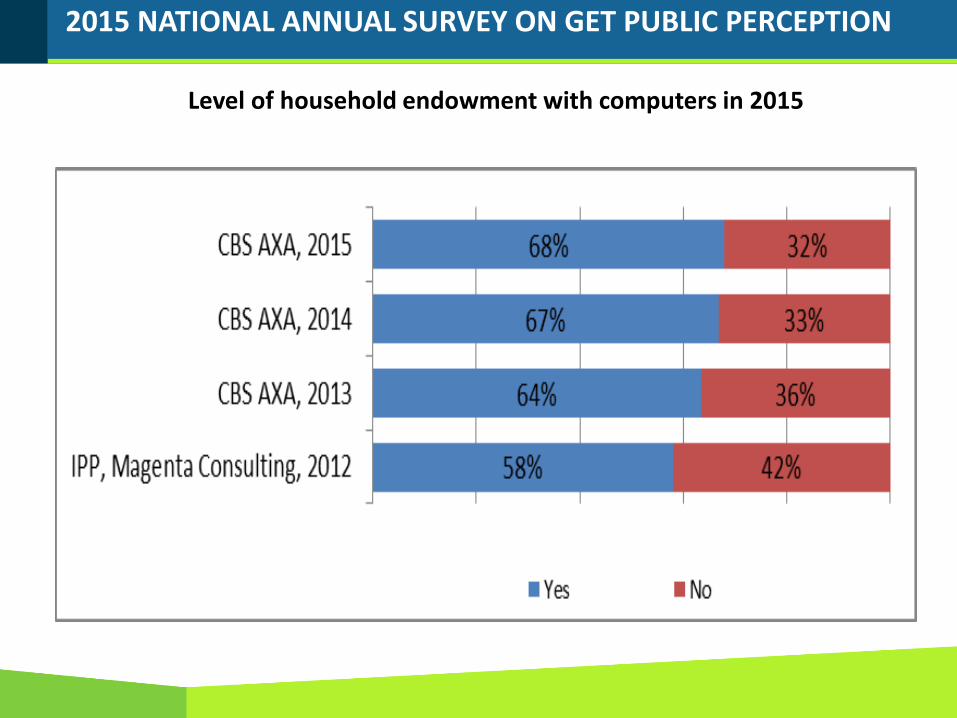
Level of household endowment with computers in 2015
2015 NATIONAL ANNUAL SURVEY ON GET PUBLIC PERCEPTION
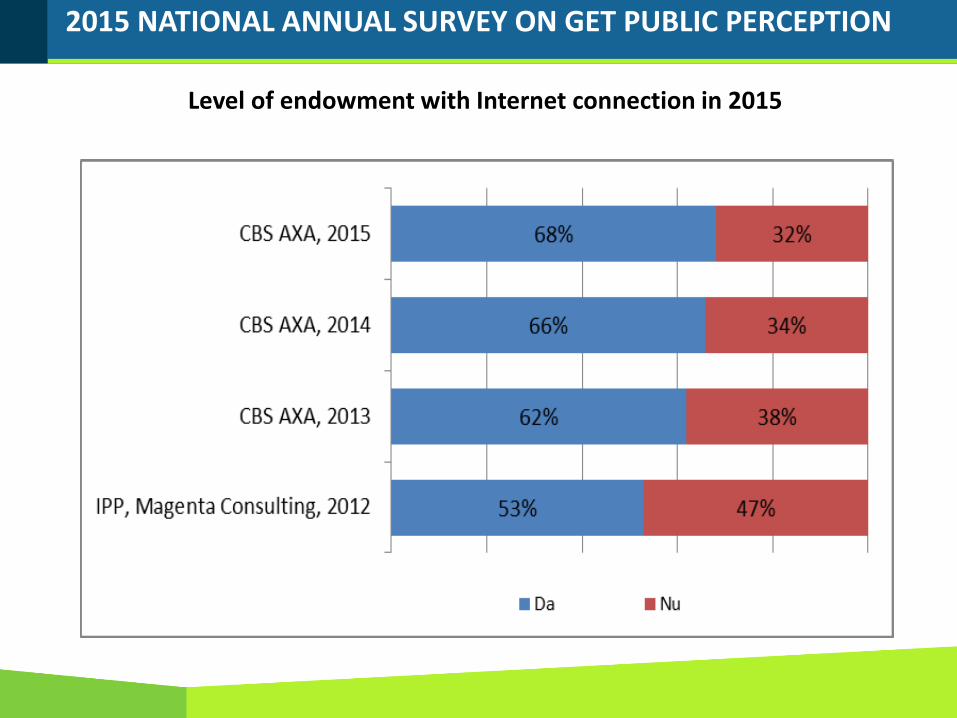
Level of endowment with Internet connection in 2015

GOVERNMENT OF REPUBLIC OF MOLDOVA
Contact information: Moldova eGovernmentCenter
www.egov.mdE-mail: [email protected]
[email protected]://egov.md/en/resources/polls
THANK YOU!