Embed Size (px)
Citation preview

Executive DirectorsNicholas Vetch, Executive Chairman, was a co-founder of Big Yellow in September 1998. Prior to that, he was joint Chief Executive of Edge Properties plc, whichhe co-founded in 1989, was subsequently listed on the Official List of the London Stock Exchange in 1996 and then sold to Grantchester Properties plc in1998. He is also a Non-Executive Director of Local Shopping REIT plc and a Trustee of Global Human Rights and Global Human Rights UK.
James Gibson, Chief Executive Officer and co-founder of Big Yellow in September 1998. He is a Chartered Accountant by background having trained with ArthurAndersen & Co. where he specialised in the property and construction sectors, before leaving in 1989. He was Finance Director of Heron Property CorporationLimited and then Edge Properties plc which he joined in 1994. Edge Properties was listed on the Official List of the London Stock Exchange in 1996 and then soldto Grantchester Properties plc in 1998. He is also a Non-Executive Director and shareholder of AnyJunk Limited, a Non-Executive Director and shareholder ofCityStasher Limited, a Non-Executive Director and investor in Moby Self Storage, a Brazilian Self Storage business, and a Trustee of the London Children’s Ballet.
Adrian Lee, Operations Director, was previously a Senior Executive at Edge Properties plc, which he joined in 1996. Prior to that he was a corporate financierat Lazard for five years, having previously qualified as a surveyor at Knight Frank. He was appointed to the Board in May 2000.
John Trotman, Chief Financial Officer, is a Chartered Accountant having trained with Deloitte LLP, where he specialised in the real estate sector and self storage.On leaving Deloitte in 2005, John worked for a subsidiary of the Kajima Corporation. He joined Big Yellow in June 2007, and was appointed to the Board inSeptember 2007. He is Chairman of the UK Self Storage Association.
Non-Executive DirectorsTim Clark, Non-Executive Director. He was a partner in Slaughter and May, one of the leading international law firms in the world, for 25 years; initially workingas a corporate and M&A adviser to a range of companies and institutions and then for the last seven years as senior partner (before retiring in April 2008).He is the Chair of WaterAid UK, and a Senior Adviser to G3, and to Chatham House. He is also a member of the International Chamber of Commerce UK GoverningBody, the Advisory Board of Uria Menendez, and is the Chair of the HighTide Theatre and is a member of the Development Committee of the National Gallery.He is Chairman of the trustees of the Economist Trust. He was appointed to the Board in August 2008.
Richard Cotton, Non-Executive Director, headed the real estate corporate finance team at JP Morgan Cazenove until April 2009, and subsequent to that was aManaging Director of Forum Partners. Richard is currently the Senior Independent Director of Helical plc as well as a Member of the Commercial DevelopmentAdvisory Group of Transport for London. Richard joined the Board in July 2012, and is the Senior Independent Director and Chairman of the Nominations Committee.
Georgina Harvey, Non-Executive Director, started her media career at Express Newspapers plc where she was appointed Advertising Director in 1994. Shejoined IPC Media Ltd in 1995 and went on to form IPC Advertising in 1998, where she was Managing Director. She was a member of the Board of IPC Media from2000 and was Managing Director of the Regionals division of Trinity Mirror from 2005 to 2012, overseeing its transition to a digital platform. She is currentlya Non-Executive Director of William Hill plc and the Senior Independent Non-Executive Director and Chair of the Remuneration Committee of McColl's RetailGroup plc. She joined the Board in July 2013 and is Chair of the Remuneration Committee.
Dr Anna Keay, Non-Executive Director, has been CEO of the Landmark Trust since 2012, operating a portfolio of 200 historic buildings let for holidays. She hasa PhD from London University, starting her career at Historic Royal Palaces and from 2002 to 2012 she was Curatorial Director of English Heritage. She was atrustee of Leeds Castle Foundation from 2009 to 2016. She writes and broadcasts widely, presenting on history and buildings for Channel 4. She is a memberof the National Trust Collection and Interpretation Advisory Group and is a Governor and Chair of the Buildings and Projects Committee at Bedales School. Shejoined the Board in March 2018.
Steve Johnson,Non-Executive Director, started his career at Bain in the 1980s before joining Asda in 1993, where he carried out a number of roles, culminatingin Marketing Director. He left Asda in 2000, to join GUS as a Sales & Marketing Director, departing in 2002 to take up his first CEO role at Focus DIY, where heremained until 2007. He joined Woolworths as part of the final turnaround team in late 2008. He has most recently been working as an operating executivefor TPG, and was also the Executive Chairman of Dreams plc between July 2011 and October 2012. He is currently Executive Chairman of Poundworld. Hejoined the Board in September 2010.
Vince Niblett,Non-Executive Director, was the Global Managing Partner Audit for Deloitte. He previously held a number of senior leadership roles within Deloitteincluding as a member of the UK Board of Partners and of the Global Executive Group and the UK Executive Group before his retirement from Deloitte in May2015. He was appointed to the Board in June 2017 and is the Chairman of the Audit Committee.
Governance
56
Company Secretary and Registered officeShauna Beavis2 The DeansBridge RoadBagshotSurreyGU19 5AT
Company Registration No. 03625199
BankersLloyds Bank plcHSBC Bank plcAviva Commercial Finance LimitedM&G Investments Limited
SolicitorsCMS Cameron McKenna Nabarro Olswang LLPLester Aldridge LLPSlaughter and May
Financial advisers and stockbrokersJ P Morgan Cazenove
Statutory AuditorKPMG LLPChartered Accountant and Statutory Auditors
ValuersCushman & Wakefield LLPJones Lang LaSalle
Directors, Officers and Advisers

The Directors present their annual report on the affairs of the Group, together with the audited financial statements and auditor’s report for the year ended 31 March 2018. The Report on Corporate Governance on pages 60 to 63 forms part of this report.
Details of significant events since the balance sheet date are included in note 25 to the financial statements. An indication of likely future developments inthe business of the Company is included in the Strategic Report.
Information about the use of financial instruments by the Company and its subsidiaries is given in note 18 to the financial statements.
DividendsThe Directors are recommending the payment of a final dividend of 15.5 pence per share for the year (2017: 14.1 pence per ordinary share). An interim dividendof 15.3 pence per share was paid in the year (2017: 13.5 pence per share).
A property income dividend of 27.5 pence is payable for the year, of which 15.3 pence per share was paid with the interim dividend, and 12.2 pence per sharewas proposed for the final dividend.
Subject to approval by shareholders at the Annual General Meeting to be held on 19 July 2018, the final dividend will be paid on 27 July 2018. The Ex-div dateis 21 June 2018 and the Record date is 22 June 2018.
From April 2016 dividend tax credits have been replaced by an annual £5,000 tax-free allowance on dividend income across an individual’s entire shareportfolio. This reduces further to £2,000 per annum from 1 April 2018. Above this amount, individuals will pay tax on their dividend income at a rate dependenton their income tax bracket and personal circumstances. The Company will continue to provide registered shareholders with a confirmation of the dividendspaid by Big Yellow Group PLC and this should be included with any other dividend income received when calculating and reporting total dividend incomereceived. It is the shareholder’s responsibility to include all dividend income when calculating any tax liability. This change was announced by the Chancellor,as part of the UK government Budget, in July 2015.
Disclosure of Greenhouse Gas (“GHG”) Emissions
Companies Act 2006; Climate Change, the GHG Emissions Director’s Reports Regulations 2013From October 2013, all listed companies are required to report annual quantities of GHG emissions (measured as Carbon Dioxide Equivalent (CO2e)) as follows:
> Scope 1 – significant direct emission sources, such as our flexi-office gas heating and air conditioner coolant replacement – currently fit out ‘gas oil’ useemissions and one Company van diesel fuel use emissions are assessed as ‘not material’;
> Scope 2 – significant indirect or offsite power station electricity supply emissions to our stores; and> Scope 3 – Electricity supplier ‘transmission and distribution’ emissions – currently, voluntary GHG emissions, from our waste and water supply chains
are assessed as ‘not material’.
Summary of Scope 1 and 2 Total Carbon Footprint (GHG carbon equivalent emissions (tCO2e))
Including store electricity, gas, coolant, generator gas oil and van diesel
Year 2013 2014 2015 2016 2017 2018
Total Scope 1 and 2 GHG Emissions (tCO2e) 6,470.0 5,681.8 4,908.0 4,456.2 4,126.9 3,520.5Scope 3 Electricity Transmission Losses 501 445 417 355 357 312Kg CO2e / Annual Revenue (£) 0.09 0.08 0.06 0.04 0.04 0.03Kg CO2e / Customer Occupancy (m2) 26.5 22.6 17.3 14.6 12.7 10.2Kg CO2e/GIFA m2 11.1 9.8 7.7 7.2 6.6 5.3
Note: Our materiality threshold for carbon emissions is > 5%
Further information on GHG emissions and on other sustainability initiatives at Big Yellow is provided in our Corporate Social Responsibility Report.
Capital structureDetails of the authorised and issued share capital, together with details of the movements in the Company's issued share capital during the year are shown in note22. The Company has one class of ordinary shares which carry no right to fixed income. Each share carries the right to one vote at general meetings of the Company.
There are no specific restrictions on the size of a holding nor on the transfer of shares, which are both governed by the general provisions of the Articles ofAssociation and prevailing legislation. The Directors are not aware of any agreements between holders of the Company's shares that may result in restrictionson the transfer of securities or on voting rights.
Details of employee share schemes are set out in note 23, and details of shares held by the Company’s Employee Benefit Trust are set out in note 22.
No person has any special rights of control over the Company's share capital and all issued shares are fully paid.
With regard to the appointment and replacement of Directors, the Company is governed by its Articles of Association, the Corporate Governance Code, theCompanies Acts and related legislation. The Articles themselves may be amended by special resolution of the shareholders. The powers of Directors aredescribed in the Report on Corporate Governance on page 60.
There are a number of agreements that take effect, alter or terminate upon a change of control of the Company such as commercial contracts, bank loanagreements, property lease arrangements and employee share plans. The Directors are not aware of any agreements between the Company and its Directorsor employees that provide for compensation for loss of office or employment that occurs because of a takeover bid.
During the year the Company issued 687,707 shares to satisfy the exercise of share options (2017: 513,580).
57
Directors’ Report

Directors The Directors of the Company who served throughout the year and to the date of approval of the financial statements, except as noted below, were as follows:
Tim Clark Non-Executive Director Richard Cotton Senior Independent DirectorJames Gibson Chief Executive OfficerGeorgina Harvey Non-Executive DirectorSteve Johnson Non-Executive DirectorAnna Keay Non-Executive Director (appointed 1 March 2018)Adrian Lee Operations DirectorVince Niblett Non-Executive Director (appointed 1 June 2017)Mark Richardson Non-Executive Director (resigned 20 July 2017)John Trotman Chief Financial OfficerNicholas Vetch Executive Chairman
Biographical details of the Executive and Non-Executive Directors standing for re-election are set out on page 56.
Directors’ indemnitiesThe Company purchases liability insurance covering the Directors and officers of the Company and its subsidiaries.
Political contributionsNo political donations were made by the Company in either the current or preceding financial year.
Substantial shareholdingsThe Company had been notified, in accordance with Chapter 5 of the Disclosure and Transparency rules, of the following voting rights as a shareholder of theCompany at 31 March 2018 and 21 May 2018.
Percentage of Percentage ofvoting rights voting rights
No. of and issued No. of and issuedordinary shares share capital ordinary shares share capital 31 March 2018 31 March 2018 21 May 2018 21 May 2018
Blackrock Inc 13,755,183 8.67% 13,748,770 8.67%Standard Life Aberdeen 8,945,746 5.64% 9,051,814 5.70%Old Mutual Plc 8,516,661 5.37% 8,129,690 5.13%Cohen & Steers Inc 7,286,788 4.59% 8,262,030 5.20%Ameriprise Financial Inc 7,269,648 4.58% 6,698,495 4.22%PGGM Investments 5,490,776 3.46% 5,531,776 3.49%The Vanguard Group Inc 5,447,394 3.44% 5,490,922 3.46%
The interest of the Directors in the share capital of the Company is shown on page 82 of the Remuneration Report.
Purchase of own sharesThe Company was granted authority at the AGM in 2017 to purchase its own shares up to a total aggregate value of 10% of the issued nominal capital. Thatauthority expires at this year’s AGM and a resolution will be proposed for its renewal. During the year the Company made no purchases of its own shares.
Employee consultationThe Group seeks to ensure employee commitment to its objectives in a number of ways. Strategic changes are communicated directly to all staff who areencouraged to address queries to the Executive Directors. The Directors’ executive meetings are frequently held in stores and in addition Directors and seniormanagement visit the stores on a regular basis. Furthermore, there are regular team briefings at store level to provide employees with information about theperformance of and initiatives in their store. A wide range of information is also communicated across the Group’s Intranet, including the e-publication of theGroup’s financial results and all press releases, the publication of a quarterly newsletter, and the publication of a weekly operations bulletin.
The Board is cognisant of the new Corporate Governance proposals for more formal employee engagement, requiring it to gather the views of the workforce.The options current proposed involve (i) having a designated Non-Executive Director to gather the views from, for example, an employee forum; or (ii) appointinga formal workforce advisory panel; or (iii) having a Director appointed from the workforce. The Group is assessing these options and will report further in nextyear’s annual report.
Employees are encouraged to participate in the Group’s performance through Employee Share Schemes and performance related bonuses. 50% of eligibleemployees participate in the Group’s Sharesave Scheme.
The Group’s recruitment policy is committed to promote equality, judging neither by race, nationality, religion, age, gender, disability, sexual orientation, norpolitical opinion and to treat all stakeholders fairly.
Directors’ Report (continued)
58

Disabled employeesApplications for employment by disabled persons are always fully considered, bearing in mind the aptitudes of the applicant concerned. In the event of membersof staff becoming disabled every effort is made to ensure that their employment with the Group continues and that appropriate training is arranged. It is the policyof the Group that the training, career development and promotion of disabled persons should, as far as possible, be identical to that of other employees.
Human Rights Big Yellow respects Human Rights and aims to provide assurance to internal and external stakeholders that we are committed to human rights and theprinciples of the Universal Declaration of Human Rights.
We are committed to creating and maintaining a positive and professional work environment that reflects and respects the basic rights of freedom to lead adignified life, free from fear or want, and where stakeholders are free to express their independent beliefs. Our employment policies and practices reflect aculture where decisions are made solely on the basis of individual capability and potential in relation to the needs of the business.
Modern Slavery ActThe Group is committed to ensuring that there is no modern slavery or human trafficking in our supply chains or in any part of our business. Our Anti-slaveryPolicy reflects our commitment to acting ethically and with integrity in all our business relationships and to implementing and enforcing effective systemsand controls to ensure slavery and human trafficking is not taking place anywhere in our supply chains. Our policy is published in full on our website.
AuditorIn respect of each Director of the Company, at the date when this report was approved, to the best of their knowledge and belief:
> so far as each Director is aware, there is no relevant audit information of which the Company’s auditor is unaware; and > each Director has taken all the steps that he/she might have reasonably been expected to take as a Director in order to make himself/herself aware of
any relevant audit information and to establish that the Company’s auditor is aware of that information.This confirmation is given and should be interpreted in accordance with s418 of the Companies Act 2006.
Approved by the Board of Directors and signed on behalf of the Board
Shauna BeavisCompany Secretary21 May 2018
59

INTRODUCTIONThe Company is committed to the principles of corporate governance contained in the UK Corporate Governance Code that was issued in 2014 by the FinancialReporting Council (“the Code”) for which the Board is accountable to shareholders. The Board also takes account of the corporate governance guidelines ofinstitutional shareholders and their representative bodies.
At Big Yellow, we aim to create a culture in which integrity, openness and fairness are rewarded.
We continue to review the composition of the Board to ensure that it has the appropriate skills, knowledge and balance for the effective stewardship of theCompany. The Board has overall responsibility for the manner in which the Company runs its affairs.
Statement of compliance with the CodeThroughout the year ended 31 March 2018, the Company has been in compliance with the Code provisions set out in section 1 of the 2014 UK CorporateGovernance Code.
Statement about applying the principles of the CodeThe Company has applied the principles set out in the Code, including both the main principles and the supporting principles, by complying with the Code asreported above. Further explanation of how the principles and supporting principles have been applied is set out below and in the Nominations CommitteeReport, the Remuneration Report and the Audit Committee Report.
LEADERSHIPThe Board’s role is to provide entrepreneurial leadership of the Company within a framework of prudent and effective controls which enables risk to be assessedand managed.
Chairman and Chief ExecutiveThe division of responsibilities between the Chairman and the Chief Executive has been agreed by the Board and encompasses the following parameters:
> the Chairman’s role is to provide continuity, experience, governance and strategic advice, while the Chief Executive provides leadership, drives the day-to-day operations of the business and works with the Chairman on overall strategy;
> the Chairman, working with the Senior Independent Non-Executive Director, is viewed by investors as the ultimate steward of the business and the guardianof the interests of all the shareholders;
> the Board believes that the Chairman and the Chief Executive work together to provide effective and complementary stewardship;> the Chairman:
> takes overall responsibility for the composition and capability of the Board; > takes overall executive responsibility for the property development team; and> consults regularly with the Chief Executive and is available on a flexible basis for providing advice, counsel and support to the Chief Executive.
> the Chief Executive:> manages the Executive Directors and the Group’s day-to-day activities;> prepares and presents to the Board strategic options for growth in shareholder value;> sets the operating plans and budgets required to deliver agreed strategy; and> ensures that the Group has in place appropriate risk management and control mechanisms.
The Directors believe it is essential for the Group to be led and controlled by an effective Board that provides entrepreneurial leadership within a framework ofsound controls which enables risk to be assessed and managed. The Board is responsible for setting the Group’s strategic aims, its values and standards andensuring the necessary financial and human resources are in place to achieve its goals. The Board ensures that its obligations to shareholders and otherstakeholders are understood and met. The Board also regularly reviews the performance of management.
EFFECTIVENESS
Composition of the BoardThe Nominations Committee is responsible for reviewing the Board Composition, and makes recommendations to the Board on the appointment of Directors.There are presently six independent Non-Executive Directors on the Board, with Richard Cotton being the Senior Independent Director. The Company complieswith the Combined Code in that at least half of The Board is comprised of independent Non-Executive Directors.
All of the Non-Executive Directors bring considerable knowledge, judgement and experience to Board deliberations. Non-Executive Directors do not participatein any of the Company’s share option or bonus schemes and their service is non-pensionable. The Non-Executive Directors are encouraged to communicatedirectly with Executive Directors between formal Board meetings. The Non-Executive Directors meet at least once a year without the Executive Directorsbeing present.
The Non-Executive Directors scrutinise the performance of management in meeting agreed goals and objectives and monitor the reporting of performance.They are required to satisfy themselves on the integrity of the financial information and that financial controls and systems of risk management are robustand defensible. They are responsible for determining appropriate levels of remuneration for Executive Directors and have a prime role in appointing and, wherenecessary, removing Executive Directors, and in succession planning.
Corporate Governance Report
60

EFFECTIVENESS (continued)Composition of the Board (continued)The tenure of the independent Non-Executive Directors at 31 March 2018 is set out below:
Changes to the Board and its CommitteesMark Richardson retired from the Board at the 2017 Annual General Meeting. Vince Niblett was appointed to the Board in June 2017, succeeding Mark Richardsonas Audit Committee Chairman.
The Board also appointed Anna Keay in March 2018 to serve as an independent Non-Executive Director.
Tim Clark has informed the Board of his decision to retire from the Board with effect from the forthcoming Annual General Meeting.
THE BOARD AND ITS COMMITTEESStanding committees of the Board The Board has Audit, Remuneration and Nominations Committees, each of which has written terms of reference. They deal clearly with the authorities and dutiesof each Committee and are formally reviewed annually. Copies of these terms of reference are available on the Company’s website. Each of these Committees iscomprised of Independent Non-Executive Directors of the Company who are appointed by the Board on the recommendation of the Nominations Committee.
All of the Committees are authorised to obtain legal or other professional advice as necessary; to secure, where appropriate, the attendance of external advisersat its meetings and to seek information required from any employee of the Company in order to perform its duties.
The Chairman of each Committee reports the outcome of the meetings to the Board. The Company Secretary is secretary to each Committee.
Attendance at meetings of the individual Directors at the Board Meetings that they were eligible to attend is shown in the table below:
Director Position Number of meetings attended
Tim Clark Non-Executive Director Richard Cotton Non-Executive Director James Gibson Chief Executive Officer Georgina Harvey Non-Executive Director Steve Johnson Non-Executive Director Anna Keay Non-Executive Director Adrian Lee Operations Director Vince Niblett Non-Executive Director Mark Richardson Non-Executive Director John Trotman Chief Financial Officer Nicholas Vetch Executive Chairman
attended absent
61
years
0.8
0.1
4.8
5.8
7.6
9.7
0 1 2 3 4 5 6 7 8 109
Vince Niblett
Anna Keay
Georgina Harvey
Richard Cotton
Steve Johnson
Tim Clark
THE BOARD AND ITS COMMITTEES (continued)Standing committees of the Board (continued)The Board meets approximately once every two months to discuss a whole range of significant matters including strategic decisions, major asset acquisitionsand performance. A procedure to enable Directors to take independent professional advice if required has been agreed by the Board and formally confirmedby all Directors.
There is a formal schedule of matters reserved for the Board’s attention including the approval of Group strategy and policies; major acquisitions and disposals,major capital projects and financing, Group budgets and material contracts entered into other than in the normal course of business. The Board also considersmatters of non-financial risk as part of its review of the Group’s risk register.
At each Board meeting, the latest available financial information is produced which consists of detailed management accounts with the relevant comparisonsto budget. A current trading appraisal is given by the Executive Directors.
Information and professional developmentAll Directors are provided with detailed financial information throughout the year. On a weekly basis they receive a detailed occupancy report showing theperformance of each of the Group’s open stores. Management accounts are circulated to the Executive monthly and a detailed Board pack is distributed aweek prior to each Board meeting.
All Directors are kept informed of changes in relevant legislation and changing commercial risks with the assistance of the Company’s legal advisers andauditor where appropriate. The professional development requirements of Executive Directors are identified and progressed as part of each individual’s annualappraisal. All new Directors are provided with a full induction programme on joining the Board.
Non-Executive Directors are encouraged to attend seminars and undertake external training at the Company’s expense in areas they consider to be appropriatefor their own professional development. Each year, the programme of senior management meetings is tailored to enable meetings to be held at the Company’sproperties. During the year, the Executive Directors made visits to all of the Group’s stores.
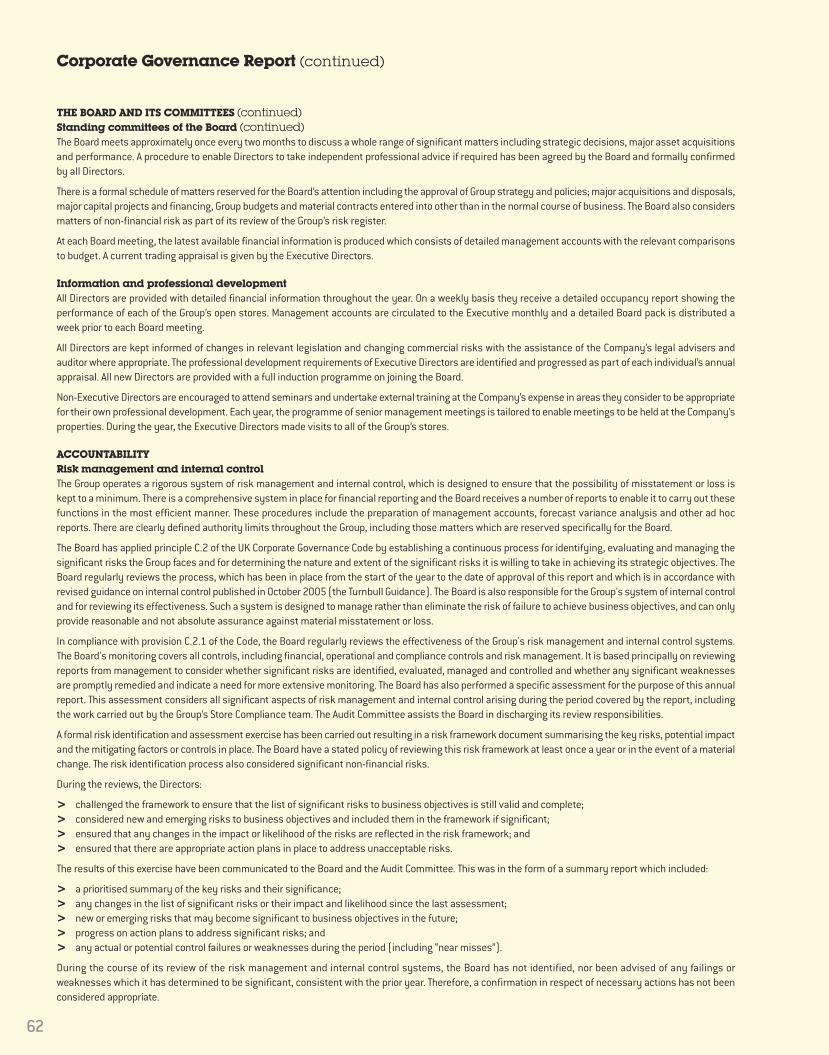
ACCOUNTABILITYRisk management and internal controlThe Group operates a rigorous system of risk management and internal control, which is designed to ensure that the possibility of misstatement or loss iskept to a minimum. There is a comprehensive system in place for financial reporting and the Board receives a number of reports to enable it to carry out thesefunctions in the most efficient manner. These procedures include the preparation of management accounts, forecast variance analysis and other ad hocreports. There are clearly defined authority limits throughout the Group, including those matters which are reserved specifically for the Board.
The Board has applied principle C.2 of the UK Corporate Governance Code by establishing a continuous process for identifying, evaluating and managing thesignificant risks the Group faces and for determining the nature and extent of the significant risks it is willing to take in achieving its strategic objectives. TheBoard regularly reviews the process, which has been in place from the start of the year to the date of approval of this report and which is in accordance withrevised guidance on internal control published in October 2005 (the Turnbull Guidance). The Board is also responsible for the Group's system of internal controland for reviewing its effectiveness. Such a system is designed to manage rather than eliminate the risk of failure to achieve business objectives, and can onlyprovide reasonable and not absolute assurance against material misstatement or loss.
In compliance with provision C.2.1 of the Code, the Board regularly reviews the effectiveness of the Group's risk management and internal control systems.The Board's monitoring covers all controls, including financial, operational and compliance controls and risk management. It is based principally on reviewingreports from management to consider whether significant risks are identified, evaluated, managed and controlled and whether any significant weaknessesare promptly remedied and indicate a need for more extensive monitoring. The Board has also performed a specific assessment for the purpose of this annualreport. This assessment considers all significant aspects of risk management and internal control arising during the period covered by the report, includingthe work carried out by the Group’s Store Compliance team. The Audit Committee assists the Board in discharging its review responsibilities.
A formal risk identification and assessment exercise has been carried out resulting in a risk framework document summarising the key risks, potential impactand the mitigating factors or controls in place. The Board have a stated policy of reviewing this risk framework at least once a year or in the event of a materialchange. The risk identification process also considered significant non-financial risks.
During the reviews, the Directors:
> challenged the framework to ensure that the list of significant risks to business objectives is still valid and complete;> considered new and emerging risks to business objectives and included them in the framework if significant;> ensured that any changes in the impact or likelihood of the risks are reflected in the risk framework; and> ensured that there are appropriate action plans in place to address unacceptable risks.
The results of this exercise have been communicated to the Board and the Audit Committee. This was in the form of a summary report which included:
> a prioritised summary of the key risks and their significance;> any changes in the list of significant risks or their impact and likelihood since the last assessment;> new or emerging risks that may become significant to business objectives in the future;> progress on action plans to address significant risks; and> any actual or potential control failures or weaknesses during the period (including “near misses”).
During the course of its review of the risk management and internal control systems, the Board has not identified, nor been advised of any failings orweaknesses which it has determined to be significant, consistent with the prior year. Therefore, a confirmation in respect of necessary actions has not beenconsidered appropriate.
Corporate Governance Report (continued)
62

GOING CONCERNThe Group’s activities, and a fair review of the business, are included in the Strategic Report on pages 16 to 28. The financial position of the Group, includingits cash flow, liquidity, and committed debt facilities are discussed in the Financial Review on pages 29 to 38.
The Directors have a reasonable expectation that the Group and Company have adequate resources to continue operations for the foreseeable future. Theyhave therefore continued to adopt the going concern basis in preparing the financial statements.
SHAREHOLDER RELATIONSThe Board aims to achieve clear reporting of financial performance to all shareholders and acknowledges the importance of an open dialogue by both Executiveand Non-Executive Directors with its institutional shareholders. The Board believes that the Annual Report and Accounts play an important part in presentingall shareholders with an assessment of the Group’s position and prospects.
The Company has an active dialogue with its shareholders through a programme of investor meetings which include formal presentation of the full and halfyear results. The Executive Directors have participated in investor conferences and meetings during the year throughout the United Kingdom, and also in theUnited States and the Netherlands. During the year ended 31 March 2018, the Chief Executive and other Executive Directors carried out 196 meetings with UKand overseas institutional shareholders and potential investors. These meetings comprised group and individual presentations and tours of our stores.
The Board also welcomes the interest of private investors and believes that, in addition to the Annual Report and the Company’s website, the Annual GeneralMeeting is an ideal forum at which to communicate with investors and the Board encourages their participation. At each Board Meeting, the Board is updatedon any shareholding meetings that have taken place, and any views expressed or issues raised by the shareholders in these meetings.
Any queries raised by a shareholder, either verbally or in writing, are answered immediately by whoever is best placed on the Board to do so. Directors areintroduced to shareholders at the AGM, including the identification of Non-Executive Directors and Committee Chairmen. The number of proxy votes cast inthe resolution is announced at the AGM.
63

Report of the Nominations Committee
64
IntroductionThe Committee is responsible for reviewing the Composition of the Board. It also makes recommendations for membership of the Board and considerssuccession planning for Directors. The Committee is also responsible for evaluating Board and Committee performance.
Committee members and attendance
Member Position Number of meetings attended
Tim Clark Member Richard Cotton Chairman and Senior Independent Director Georgina Harvey Member Steve Johnson Member Anna Keay Member (from 1 March 2018) Vince Niblett Member (from 1 June 2017) Mark Richardson Member (to 20 July 2017)
attendedabsent
The Nominations Committee is responsible for reviewing the structure, size and composition of the Board and giving consideration to succession planning forDirectors and other senior Executives. Where changes are required, it is also responsible for the identification, selection and proposal to the Board for approvalof persons suitable for appointment or reappointment to the Board, whether as Executive or Non-Executive Directors and to seek approval from the RemunerationCommittee of the remuneration and terms and conditions of service of any proposed Executive Director appointment. The Chairman of the Committee reportsto the Board as appropriate to enable the Board as a whole to agree the appointments of new Directors. The Committee meets at least once a year and otherwiseas required and as determined by its members.
The terms and conditions of appointment for the Non-Executive Directors is available for inspection at the Company’s Head Office during normal working hours.They are also available for inspection at the Company’s AGM.
During the year, Vince Niblett’s and Anna Keay’s appointments to the Board were approved by the Nominations Committee.
Board performance evaluationDuring the prior year the Board engaged Lomond Consulting to undertake an evaluation of the performance of the Board and its Committees. The aim was toseek to identify areas where the performance and the procedures of the Board may be improved. The scope of the review was agreed between the Chairmanof the Committee and the Chief Executive.
Each Director completed a questionnaire on the performance of the Board, its Committees and the Chairman. Each Director was then interviewed in personby Lomond Consulting. The responses were anonymous to enable an open and honest sharing of views. Lomond Consulting then produced a report showingthe results of the review.
The key topic discussed as part of the review was succession planning, which is further discussed in the section below, albeit the Committee considered nofurther action was necessary.
During the current year, the Executive Chairman evaluated the performance of the other Executive Directors, and the performance of the Chairman wasevaluated by the Senior Independent Non-Executive Director. It was considered that the individuals, the Committees and the Board as a whole were operatingeffectively, with appropriate procedures put in place for minor areas identified for improvement.
Succession planningThe Board comprises a team of four Executive Directors, two of whom were co-founders of the Company, complemented by Non-Executive Directors who havewide business experience and skills as well as a detailed understanding of the Group’s philosophy and strategy. Continuity of experience and knowledge,particularly of self storage, within the executive team is particularly important in a focussed long-term business such as Big Yellow.
It is a key responsibility of the Committee to advise the Board on succession planning. The Committee ensures that any future changes in the Board’scomposition are foreseen and effectively managed. In the event of unforeseen changes, the Committee ensures that management and oversight of the Group’sbusiness and long-term strategy will not be affected.
The Committee also addresses the development and continuity of the Senior Management team below Board level.
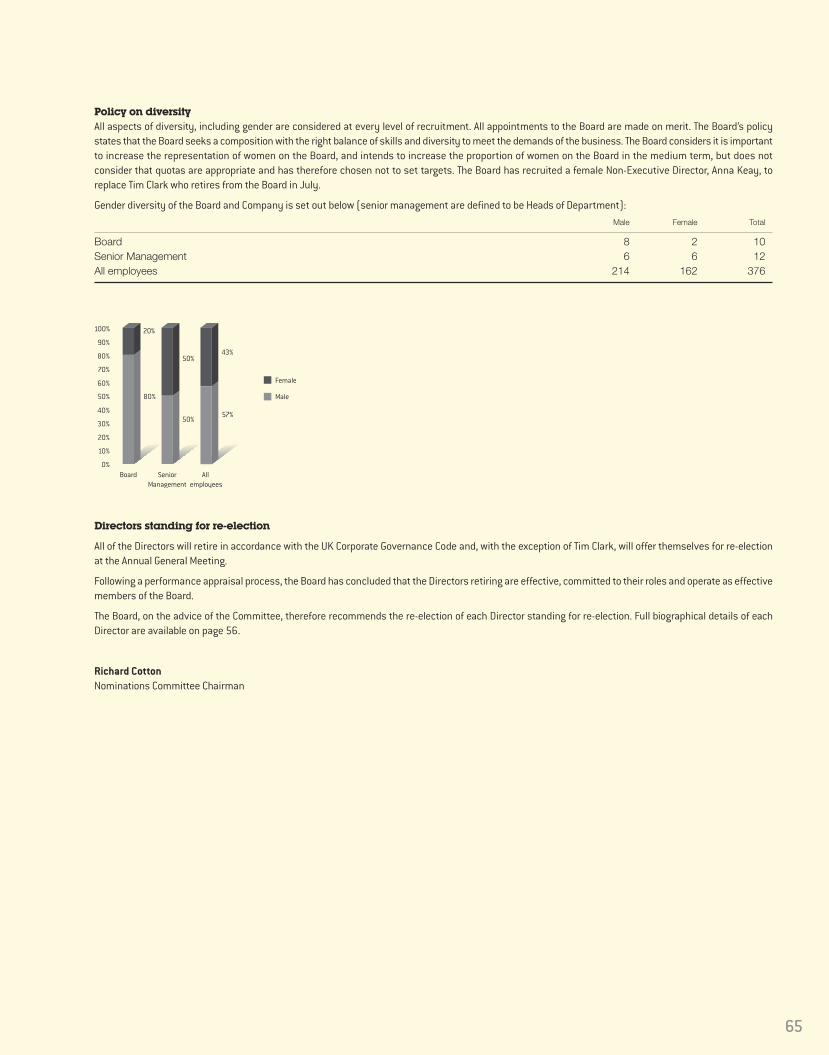
Policy on diversityAll aspects of diversity, including gender are considered at every level of recruitment. All appointments to the Board are made on merit. The Board’s policystates that the Board seeks a composition with the right balance of skills and diversity to meet the demands of the business. The Board considers it is importantto increase the representation of women on the Board, and intends to increase the proportion of women on the Board in the medium term, but does notconsider that quotas are appropriate and has therefore chosen not to set targets. The Board has recruited a female Non-Executive Director, Anna Keay, toreplace Tim Clark who retires from the Board in July.
Gender diversity of the Board and Company is set out below (senior management are defined to be Heads of Department):Male Female Total
Board 8 2 10Senior Management 6 6 12All employees 214 162 376
Directors standing for re-election
All of the Directors will retire in accordance with the UK Corporate Governance Code and, with the exception of Tim Clark, will offer themselves for re-electionat the Annual General Meeting.
Following a performance appraisal process, the Board has concluded that the Directors retiring are effective, committed to their roles and operate as effectivemembers of the Board.
The Board, on the advice of the Committee, therefore recommends the re-election of each Director standing for re-election. Full biographical details of eachDirector are available on page 56.
Richard CottonNominations Committee Chairman
65
Board SeniorManagement
All employees
0%
20%
30%
40%
50%
60%
70%
80%
90%
100%
10%
20%
80%
50%
50%
57%
43%
Female
Male

INTRODUCTIONThis report details the activities of the Remuneration Committee for the period from 1 April 2017 to 31 March 2018.
The report has been prepared by the Remuneration Committee and approved by the Board.
It sets out the proposed Remuneration Policy for which the Committee is seeking approval at the forthcoming AGM and remuneration details for the Executive andNon-Executive Directors of the Company (both in terms of how the existing Policy has been operated and how the proposed Policy will operate). It has been preparedin accordance with Schedule 8 of the Large and Medium-size Companies and Groups (Accounts and Report) (Amendment) Regulations 2013 (the “Regulations”).
The report is divided into three main sections:
> The Annual Statement – which summarises the remuneration outcomes in the year ended 31 March 2018, the proposed new Remuneration Policy andhow it will be operated in the year ending 31 March 2019;
> The Remuneration Policy Report – which sets out the proposed Remuneration Policy for which shareholder approval will be sought at the 2018 AGM; and> The Annual Report on Remuneration– which sets out how the Committee intends to operate the Remuneration Policy for the year ending 31 March 2019,
the link between Company performance and remuneration for the year ended 31 March 2018 and payments and awards made to the Directors in respectof the year just ended.
The Companies Act 2006 requires the auditor to report to the shareholders on certain parts of the Remuneration Report and to state whether, in their opinion,those parts of the report have been properly prepared in accordance with the Regulations. The parts of the Annual Report on Remuneration that are subjectto audit are indicated in the report. The Annual Statement by the Remuneration Committee Chair and the Remuneration Policy Report are not subject to audit.
Remuneration ReportYear ended 31 March 2018
66
The Committee and its Work During the YearCommittee Chair: Tim Clark (to 19 July 2017), Georgina Harvey (from 20 July 2017)
Committee members: Tim Clark (from 20 July 2017), Richard Cotton, Georgina Harvey (until 19 July 2017), Steve Johnson, Mark Richardson(until 20 July 2017), Vince Niblett (from 1 June 2017) and Anna Keay (from 1 March 2018)
Terms of Reference: www.corporate.bigyellow.co.uk/investors/governance/remuneration-policy.aspx
The Committee met four times during the year under review.
The Committee’s main activities during the year ended 31 March 2018 (full details are set out in the relevant sections of this report) included:
> Agreeing Executive Director base salary increases from 1 April 2017 (2%);> Agreeing the annual bonus pay-out for the year ended 31 March 2017 and setting the targets for the annual bonus for the year ended 31 March 2018;> Reviewing the interim performance targets in respect of the Long Term Bonus Performance Plan (“LTBPP”) awards which had a three-year
performance period ended 31 March 2018; > Reviewing the EPS and Total Shareholder Return (“TSR”) performance targets and determining the percentage vesting for the 2014 LTIP awards
which vested in 2017;> Reviewing the Company’s Gender Pay calculations and draft disclosures; and> Reviewing the Remuneration Policy and consulting with the Company’s major shareholders and representative bodies in respect of the proposed
Remuneration Policy which will be taken to shareholders for approval at the 2018 AGM.
ANNUAL STATEMENT Dear Shareholder
I am pleased to present the Directors’ Remuneration Report for the year ended 31 March 2018. This is my first report as Chair of the Committee and I wouldlike to thank Tim Clark, who chaired the Committee for nine years, for all of his hard work.
At the 2018 AGM, we will be tabling a binding resolution to seek shareholder approval to update our existing Directors’ Remuneration Policy, for which shareholderapproval was originally obtained in 2015. A binding resolution will also be tabled to seek approval for the establishment of a Deferred Share Bonus Plan toenable part of the annual bonus to be deferred into shares for a period of time. In addition, the regular advisory resolution to approve the Annual Report onRemuneration will also be tabled.
Performance, Decisions and Reward Outcomes for the year ended 31 March 2018The business conditions and performance of the Group in the year ended 31 March 2018 are described more fully in the Chairman’s Statement and the Operatingand Financial Review of this Annual Report. In summary:
> The business of the Group performed strongly;> Big Yellow is the clear UK brand leader in self storage and delivered growth in occupancy, cash flow and earnings for the ninth year in a row;> Revenue, cash flow and adjusted profit before tax increased by 7%, 13% and 12% respectively;> Like-for-like occupancy increased by 3.9 ppts; and> Dividends are being increased by 12%.
This strong performance has been reflected in the annual bonus award and share awards which vested in the year ended 31 March 2018.

67
Performance, Decisions and Reward Outcomes for the year ended 31 March 2018 (continued)Payments made to the Executive Directors under the annual bonus plan amounted to 12.9% of salary (out of a maximum of 25% of salary), based onperformance against pre-set targets for occupancy, store profitability, store audits and customer satisfaction. The targets set, and the out-turn were consistentwith the average bonus awarded across the stores and head office.
As a result of the Long Term Bonus Performance Plan (LTBPP) awards reaching the end of the three-year performance period to 31 March 2018, 93.3% of the awardsare expected to vest in August 2018 based on strong performance against financial and non-financial performance targets linked to the business plan.
In respect of the Long-Term Incentive Plan (LTIP) awards granted in 2014, which vested in July 2017, three-year EPS and TSR performance resulted in 100% ofawards vesting.
Further details of the targets, and performance against the targets, for annual bonus pay-outs and share award vesting levels are set out in the Annual Reporton Remuneration.
Remuneration Policy ReviewBig Yellow has sought to offer a remuneration policy for its Executive Directors close to, but generally below market levels. However, packages in practice andsalary levels in particular, have been significantly below market levels in recent years. In addition, the Policy has been at the more complicated end of marketpractice due to the operation of three incentive plans, being an annual bonus, a conventional LTIP granted annually and LTBPP whereby awards have beengranted every three years. It is against this background and the sensitivities surrounding the executive pay debate that the Committee has reviewed BigYellow’s Remuneration Policy, which has been in place since it was formally approved by shareholders at the 2015 AGM.
Following the completion of its review, the Committee has concluded that the current incentive arrangements are overly complicated in terms of administrationand communication and the current salary positioning is no longer sustainable (and risks creating significant issues in future in respect of both retentionand recruitment). As such, the Committee wishes to simplify the Remuneration Policy and align it to a more conventional approach in respect of fixed andvariable pay which better reflects Big Yellow (in terms of maturity, size and complexity) and individual contributions (in terms of each individual’s relativeresponsibilities and roles).
The Committee is therefore proposing: (i) a major simplification (and reduction, in percentage of salary terms) of Big Yellow’s incentive arrangements; (ii) certainadjustments to Executive Director base salary levels to more appropriate and fair levels; (iii) a reduction to Executive Director pension provision in support of theInvestment Association’s encouragement for pension alignment internally; and (iv) additional/enhanced shareholder protections to update the Policy.
Summary of the Proposed ChangesWhile details of the proposed changes to the Remuneration Policy and its implementation are set out in detail in the Directors’ Remuneration Policy and AnnualReport on Remuneration, in summary, the key changes are:
> Simplified incentive arrangements – the LTBPP, whereby awards are granted every three years, with performance targets set annually and reviewed atthe end of each financial year and end of the three-year period, will be replaced by a conventional deferred annual bonus arrangement. Rather thanenabling a grant of up to 675% of salary every three years (providing the average award level across the four Executive Directors does not exceed 450%of salary award every three years), it is proposed that going forward, subject to shareholder approval, the LTBPP is consolidated into the annual bonus(albeit with significant deferral). As such, the annual bonus will be capped at 150% of salary with the existing 25% of salary continuing to be aligned to theworkforce cash annual bonus (measured through occupancy growth, store profitability, store audits and customer satisfaction scores), and the remaining125% of salary (measured against financial, operational, real estate and strategic targets) deferred into Big Yellow shares for three years (with vestingsubject to continued employment).Full details of the performance targets set, and Big Yellow’s performance against those targets with resulting pay-outs, will normally be disclosed in therelevant Remuneration Report for the year just ended. Alternatively, if the targets are considered to be commercially sensitive, they will be disclosed atthe point the Committee considers that they have ceased to be so.
> Phased base salary increases – Executive Director base salaries will be increased over three years, to more closely reflect each Executive Director’s roleand contribution to Big Yellow and Big Yellow’s size and complexity, which has increased significantly. While the Committee has operated a policy oftargeting base salaries “close to (but generally just below) median” for some time, actual salaries have been set significantly below median levels. Followinga review of Executive Director base salary levels as part of the Remuneration Policy review, the Remuneration Committee has concluded that currentsalary levels are no longer reflective of each individual’s role and responsibilities in a company of Big Yellow’s size and complexity given the increase in:(i) the number of stores; (ii) the geographical spread, (iii) the employee base; (iv) customers; (v) revenue; and (vi) profits over the last ten years). Assuch, and in connection with the simplification and de-gearing of incentive potential as part of the Remuneration Policy review, the following base salaryincreases are proposed:
Executive Chief Financial Operations Chief Executive Chairman Officer Director (James Gibson) (Nicholas Vetch) (John Trotman) (Adrian Lee)
Current £302,000 £275,200 £223,700 £223,700From 1 April 2018 £350,000 £315,000 £260,000 £250,000From 1 April 2019 £400,000 £350,000 £300,000 £270,000From 1 April 2020 £440,000 £375,000 £325,000 £285,000
Summary of the Proposed Changes (continued)The Committee considers the proposed base salary levels to be more appropriate in light of each individual’s role and contribution to Big Yellow and BigYellow’s size and complexity (although they remain conservatively positioned against the sector and market more generally). Further, in addition to hisExecutive Chairman role, it should also be noted that Nicholas Vetch has also taken on executive responsibility for the property team in the past year,covering both property acquisitions and development.The proposed salary increases are neither post freeze catch-up awards, nor are they benchmarking driven and while the Committee had originally intendedto increase salary levels from 1 April 2018 and 1 April 2019, the Committee has decided to phase the salary increases over three years following feedbackreceived from a number of investors during consultation.
Further, in line with best practice, the increases from 1 April 2019 and 1 April 2020 are not guaranteed but will be subject to satisfactory Group and individualperformance during the years ending 31 March 2019 and 31 March 2020. Other than for a material role change, subsequent salary increases are expected tobe in line with the general workforce increases.
> Reduced pension provision – Reflecting the proposed base salary increases and the Investment Association’s recent encouragement for companypension provision to be aligned to that provided to the general workforce (as a percentage of salary), Executive Director pension provision will be reducedfrom 15% of salary (with a policy maximum of 20% of salary) to 10% of salary (being the pension provided for the Company’s Department Heads).
> Enhanced shareholder protection – A two-year post vesting holding period will be introduced on future LTIP awards granted to Executive Directorsfollowing the 2018 AGM. Further, withholding and recovery provisions (malus and clawback) will be added to the annual (and deferred) bonus plan andthe existing provisions in the LTIP will be updated and enhanced where necessary. Shareholding guidelines will remain at 200% of salary.
Shareholder Consultation Exercise and 2018 AGM ResolutionsThe Remuneration Committee has carefully considered the proposed policy on executive remuneration and the implementation of the approach underlyingthat policy during the year ending 31 March 2019. This has included an extensive consultation exercise with Big Yellow’s top 15 investors and the majorshareholder representative bodies and I would like to take this opportunity to thank them for their constructive and very positive feedback on the proposals,which the Committee considered and which helped formulate the final policy that is being put to shareholders for approval.
I therefore hope that, at the AGM on 19 July 2018, you will support:
> the binding resolution on the revised Directors’ Remuneration Policy contained within this Remuneration Report;> the binding resolution on the establishment of a Deferred Share Bonus Plan to enable a significant part of the annual bonus to be deferred into shares for
a period of time; and> the advisory resolution on the remuneration paid to the Directors in the last financial year, and implementation of the new Remuneration Policy for the
forthcoming year as set out in the Annual Remuneration Report section of this Remuneration Report.
Finally, I would like to extend my thanks to my fellow colleagues on the Committee for their support and work in 2017/18.
Georgina HarveyChair of the Remuneration Committee21 May 2018
REPORT ON DIRECTORS’ REMUNERATION POLICYThis section of the Remuneration Report contains details of the Company’s Directors’ Remuneration Policy (the “Policy”) which will govern the Company’sapproach to remuneration. Following a remuneration review conducted by the Committee, a revised Remuneration Policy is being proposed which will be putto shareholders for approval at the Company’s AGM on 19 July 2018.
It is the policy of the Company to ensure that the executive remuneration packages are designed to attract, motivate and retain Directors of a high calibre andreward the executives for enhancing value to shareholders.
As a result, a substantial element of the remuneration of the Executive Directors is structured to be dependent on the performance of the Company. The policyaims to support a performance culture where there is appropriate reward for the achievement of strong Company performance without creating incentiveswhich will encourage excessive risk-taking or unsustainable Company performance.
Policy Scope
The Policy applies to the Executive Directors and Non-Executive Directors.
Policy Duration
The new Directors’ Remuneration Policy Report will be put to a binding shareholder vote at the AGM on 19 July 2018 and, subject to receiving majority shareholdersupport, the Policy will apply from the date of approval and is intended to remain in place for a maximum of three years. That said, the Remuneration Committeewill keep the Policy under review to ensure that it continues to remain appropriate.
Remuneration Report (continued)Year ended 31 March 2018
68

Changes from 2015 Remuneration Policy
The main changes from the 2015 Remuneration Policy are summarised below:
> Simplified incentive arrangements. The Long Term Bonus Performance Plan (“LTBPP”), whereby awards are granted every three years, with performancetargets set annually and reviewed at the end of each financial year and at the end of the three year period, will be consolidated into the annual bonusarrangement albeit with significant deferral. Rather than enabling a grant of up to 675% of salary every three years (providing the average award levelacross the four Executive Directors does not exceed 450% of salary award every three years), it is proposed that going forward, subject to shareholderapproval, the annual bonus will be capped at 150% of salary with:> 25% of salary continuing to be aligned to the workforce cash annual bonus (measured against store performance, through occupancy growth, store
profitability, store audits and customer satisfaction scores); and > the remaining 125% of salary (measured against financial, operational, real estate and strategic targets) deferred into Big Yellow shares for three
years, with vesting subject to continued employment.> Reduced pension provision. Reflecting the proposed base salary increases explained in the Annual Statement and Annual Report on Remuneration and
the Investment Association’s recent encouragement for company pension provision to be aligned to that provided to the general workforce (as a percentageof salary), Executive Director pension provision will be reduced from 15% of salary (with a policy maximum of 20% of salary) to 10% of salary (being thepension provided for Big Yellow Department Heads).
> Enhanced shareholder protection. In addition to the changes above, a two-year post vesting holding period will be introduced on future LTIP awardsgranted to Executive Directors following the 2018 AGM and withholding and recovery provisions (malus and clawback) will be added to the annual (anddeferred) bonus plan and the existing provisions in the LTIP will be updated and enhanced where necessary.
To aid the administration and clarity of its operation, a number of minor changes have also been made to the wording of the Policy where appropriate.
Summary Policy table (Executive Directors)The main components of the Directors’ Remuneration Policy, and how they are linked to and support the Company’s business strategy, which will take effectsubject to approval from shareholders at the AGM on 19 July 2018, are summarised below:
Executive Directors
69
Purpose and link to strategy Operation Maximum potential value
Performance conditions and assessment
Base salary To providecompetitive fixedremuneration that will attract and retain keyemployees andreflect theirexperience andposition in theCompany.
Base salary is normally set annually on 1 April.
When considering any increases to basesalaries in the normal course (as opposedto a change in role or responsibility), theCommittee will take into consideration:
> level of skill, experience, scope ofresponsibilities and performance;
> business performance, economicclimate and market conditions;
> pay and employment conditions ofemployees throughout the Group,including increases provided to staff;and inflation; and
> increases provided to ExecutiveDirectors in comparable companies(although such data would be usedwith caution).
Salaries are typically set after consideringthe salary levels in companies of a similarsize and complexity in the FTSE 250.
Our overall policy is normally to targetsalaries at close to median levels.
Base salaries are intended to increase inline with inflation and general employeeincreases in salary.
Higher increases may apply if there is achange in role, level of responsibility orexperience or if the individual is new to the role.
There is no maximum salary cap in place.
None
Annual bonus The annual bonusaligns reward to key Group strategicobjectives anddrives short-termperformance.
Executive Directors participate in an annualperformance-related bonus scheme.
Up to 25% of salary will be paid in cash. Up to 125% of salary will be deferred into shares for three years.
Dividend equivalents may be payable on deferred share awards.
The annual bonus plan rules containclawback and malus provisions.
Bonus potential:
150% of salary.
Assessed annuallyand determined bythe Committeebased on financial,strategic and/orpersonalperformanceagainst the Group’sbusiness plan foreach financial year.

Remuneration Report (continued)Year ended 31 March 2018
70
Purpose and link to strategy Operation Maximum potential value
Performance conditions and assessment
Long TermIncentive Plan
The Long TermIncentive Planaligns ExecutiveDirector interestswith those ofshareholders and rewards value creation.
Awards are made annually to the ExecutiveDirectors (and certain senior managers whoare in a position to influence significantlythe performance of the Group) in the form ofnil-paid options.
The awards granted under the Long TermIncentive Plan are subject to performanceconditions to be met over a performanceperiod of three years.
Dividend equivalents may be payable onLTIP awards during the vesting period, to theextent awards vest.
The LTIP contains clawback and malusprovisions.
A two year post vesting holding period will beapplied to any LTIP award granted toExecutive Directors following the 2018 AGM.
Maximum annual grant is 100% of basesalary, with normal awards of 100% ofannual salary for the Executive Directors.
Minimum vesting is 25% of salary assumingachievement of threshold performance, andthe maximum vesting is 100% of salary.
Vesting under theLTIP is based onfinancial and share-price relatedperformancemeasures.
Pension To providecompetitive levelsof retirementbenefit.
Contribution made into Executive Directorspersonal pension plan, or a cashsupplement of equivalent value paid in lieuof pension contribution.
Maximum contribution of 10% of salary. None
Other benefits To providecompetitive levelsof employmentbenefits.
Benefits include:
> Private fuel> Private medical insurance> Permanent health insurance> Life assurance of four times base salary> Relocation allowances (where relevant)
Other benefits may be provided whereappropriate.
The type and level of benefits provided isreviewed annually to ensure they remainmarket competitive.
Maximum opportunity is the total cost of providing the benefits. There is nomonetary cap on benefits.
None
Shareholdingpolicy
To ensure thatExecutive Directors’interests arealigned with thoseof shareholdersover a longer timehorizon.
Requirement to build and maintain a holdingof shares in the Company, through retainingat least 50% of shares vesting indiscretionary share-based incentive plansif this guideline has not been met.
200% of salary. N/A
All EmployeeScheme
To encourage shareownership by allemployees. Thisallows them to align their interestswith those ofinvestors and alsoto share in the long-term success ofthe Company.
Executive Directors may participate in any HMRC tax favoured all employeearrangements.
In line with the prevailing HMRC limits.
None
Summary Policy table (Executive Directors)

71
Notes to the policy tableThe key principle for the short and long-term incentives is to provide a strong link between reward and individual and Group performance to align the interestsof Executive Directors with those of shareholders.
1. Annual bonus performance measures and targets
Annual bonuses for the Executive Directors are based on:
> 25% of salary cash bonus: the average of the stores’ performance against their quarterly targets providing direct alignment of the Directors’ bonusesto performance (and the bonus levels) of the staff. The four Key Performance Indicators used to assess store performance are occupancy growth,store profitability, store audits and customer satisfaction. Store targets are set every quarter and an average of the four quarters is taken.
> 125% of salary deferred share bonus: measured against pre-set financial, operational, real estate and strategic targets.
2. Long Term Incentive Plan performance measures and targets
The Committee selected the performance conditions on the LTIP as they provide a direct link between the incentive for the Executive Directors and thevalue created for shareholders. The two metrics for the outstanding and proposed 2018 awards are:
> Relative TSR against the FTSE Real Estate Index, as Big Yellow’s historic performance has been closely aligned to the performance of this Index; and> The adjusted EPS figure is as reported in the audited results of the Group for the last complete financial year ending before the start of the performance
period and the last complete financial year ending before the end of the performance period.
3. Malus and clawback
The annual bonus, deferred bonus plan and LTIP include malus and clawback provisions.
Malus is the adjustment of outstanding deferred bonus and LTIP awards as a result of the occurrence of one or more circumstances listed below. The adjustmentmay result in the value being reduced to zero. Malus will apply for the three year period from grant to vesting for the deferred bonus and LTIP awards.
Clawback is the recovery of payments/vestings under the cash bonus and LTIP as a result of the occurrence of one or more circumstances listed below.Clawback will apply for three years post payment of a cash bonus/grant of deferred share awards and three years post vesting for LTIP awards.
The circumstances in which malus and clawback could apply are as follows:
> discovery of a material misstatement resulting in an adjustment in the audited consolidated accounts of the Company; > the assessment of any performance target or condition in respect of an award was based on error, or inaccurate or misleading information; > the discovery that any information used to determine the amount of an award was based on error, or inaccurate or misleading information; > action or conduct of an award holder which, in the reasonable opinion of the Board, amounts to fraud or gross misconduct; and> events or behaviour which have led to the censure of the Company by a regulatory authority or have had a significant detrimental impact on the
reputation of any Group Company.
4. Discretion
The Committee has discretion in several areas of policy as set out in this report. The Committee may also exercise operational and administrativediscretions under relevant plan rules approved by shareholders as set out in those rules. In addition, the Committee has the discretion to amend policywith regard to minor or administrative matters where it would be, in the opinion of the Committee, disproportionate to seek or await shareholder approval.
In certain circumstances, the Committee will be required to exercise its discretion, taking into consideration the particular circumstances of an ExecutiveDirector’s departure and/or the recent performance of the Company in determining the specific level of payments to be made.
In addition to the discretions under the terms of the annual bonus plan (both cash and deferred shares) and LTIP, the Committee has discretion to determinewhether an individual is classified as a “good leaver”.
It should be noted that it is the Committee’s policy to only apply its discretion if the circumstances at the time are, in its opinion, sufficiently exceptional, and toprovide a full explanation to shareholders where discretion is exercised. The Committee does not currently intend to amend or waive any performance conditions.
5. Differences in remuneration policy for all employees
All employees are currently entitled to base salary, benefits, pensions and the Sharesave Scheme. Additionally, all employees are eligible for annualbonuses with the maximum opportunity available based on the seniority and responsibility of the role held.
The Company’s LTIPs are granted to a number of senior managers within Head Office, the area manager team and also to store managers.

Remuneration Report (continued)Year ended 31 March 2018
72
Scenario Description
Fixed Pay Chief Executive Executive Chairman Chief Financial Officer Operations Director
Base salary (1 April 2018)
£350,000 £315,000 £260,000 £250,000
Estimated Benefits
£6,000 £5,000 £2,000 £5,000
Pension (% of salary)
10% 10% 10% 10%
On-target 50% of annual bonus award being paid and 50% vesting of the LTIP.
Maximum 100% of annual bonus award being paid (i.e. 150% of salary) and 100% vesting of the LTIP.
Illustrations of application of Remuneration Policy The graphs below seek to demonstrate how pay varies with performance for the Executive Directors based on the proposed Remuneration Policy, which issubject to shareholder approval.
The assumptions used in determining the level of pay out under given scenarios are as follows:
Chief Executive Officer
Minimum Median Maximum£0
£500
£750
£1,000
£1,250
£1,500
£000
£250 47% 31%
41%32%
21%
100%
£391
£829
£1,266
28%
Minimum Median Maximum
47% 31%
41%32%
21%
100%
£352
£745
£1,139
28%
Executive Chairman
Minimum Median Maximum
47% 31%
41%32%
21%
100%
£288
£613
£938
28%
Chief Financial Officer
Minimum Median Maximum
47% 31%
41%32%
21%
100%£280
£593
£905
28%
Operations Director
Long term incentive
Annual bonus
Fixed
73
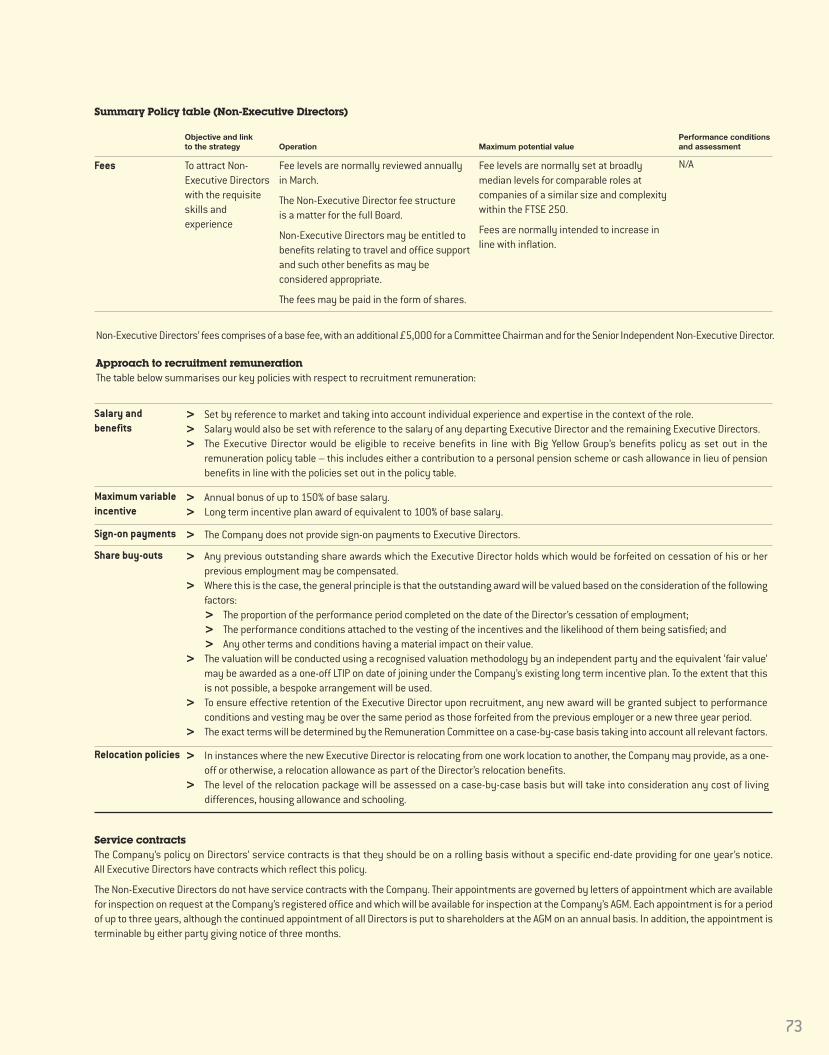
Summary Policy table (Non-Executive Directors)
Objective and link to the strategy Operation Maximum potential value
Performance conditionsand assessment
Fees To attract Non-Executive Directorswith the requisiteskills andexperience
Fee levels are normally reviewed annuallyin March.
The Non-Executive Director fee structureis a matter for the full Board.
Non-Executive Directors may be entitled tobenefits relating to travel and office supportand such other benefits as may beconsidered appropriate.
The fees may be paid in the form of shares.
Fee levels are normally set at broadlymedian levels for comparable roles atcompanies of a similar size and complexitywithin the FTSE 250.
Fees are normally intended to increase inline with inflation.
N/A
Non-Executive Directors’ fees comprises of a base fee, with an additional £5,000 for a Committee Chairman and for the Senior Independent Non-Executive Director.
Approach to recruitment remunerationThe table below summarises our key policies with respect to recruitment remuneration:
Salary andbenefits
> Set by reference to market and taking into account individual experience and expertise in the context of the role.> Salary would also be set with reference to the salary of any departing Executive Director and the remaining Executive Directors.> The Executive Director would be eligible to receive benefits in line with Big Yellow Group’s benefits policy as set out in the
remuneration policy table – this includes either a contribution to a personal pension scheme or cash allowance in lieu of pensionbenefits in line with the policies set out in the policy table.
Maximum variableincentive
> Annual bonus of up to 150% of base salary.> Long term incentive plan award of equivalent to 100% of base salary.
Sign-on payments > The Company does not provide sign-on payments to Executive Directors.
Share buy-outs > Any previous outstanding share awards which the Executive Director holds which would be forfeited on cessation of his or herprevious employment may be compensated.
> Where this is the case, the general principle is that the outstanding award will be valued based on the consideration of the followingfactors:> The proportion of the performance period completed on the date of the Director’s cessation of employment;> The performance conditions attached to the vesting of the incentives and the likelihood of them being satisfied; and> Any other terms and conditions having a material impact on their value.
> The valuation will be conducted using a recognised valuation methodology by an independent party and the equivalent ‘fair value’may be awarded as a one-off LTIP on date of joining under the Company’s existing long term incentive plan. To the extent that thisis not possible, a bespoke arrangement will be used.
> To ensure effective retention of the Executive Director upon recruitment, any new award will be granted subject to performanceconditions and vesting may be over the same period as those forfeited from the previous employer or a new three year period.
> The exact terms will be determined by the Remuneration Committee on a case-by-case basis taking into account all relevant factors.
Relocation policies > In instances where the new Executive Director is relocating from one work location to another, the Company may provide, as a one-off or otherwise, a relocation allowance as part of the Director’s relocation benefits.
> The level of the relocation package will be assessed on a case-by-case basis but will take into consideration any cost of livingdifferences, housing allowance and schooling.
Service contractsThe Company’s policy on Directors’ service contracts is that they should be on a rolling basis without a specific end-date providing for one year’s notice.All Executive Directors have contracts which reflect this policy.
The Non-Executive Directors do not have service contracts with the Company. Their appointments are governed by letters of appointment which are availablefor inspection on request at the Company’s registered office and which will be available for inspection at the Company’s AGM. Each appointment is for a periodof up to three years, although the continued appointment of all Directors is put to shareholders at the AGM on an annual basis. In addition, the appointment isterminable by either party giving notice of three months.

Payments for loss of office
Remuneration Report (continued)Year ended 31 March 2018
74
Salary and benefits Salary and benefits may be paid in lieu of notice. In cases where a contract is terminated other than on the terms of the service contract,the Company will seek to mitigate any damages payable.
There will be no compensation for normal resignation or in the event of termination by the Company due to misconduct.
Annual bonus If the individual is a good leaver, bonus will be paid on a pro-rata basis in respect of the period from the start of the financial year. Anypro-rated bonus would normally be payable in cash (i.e. no award of deferred shares would be made).
Deferred share awards would normally vest at the normal vesting date (although may vest at the date of cessation).
Good leaver is defined as an individual ceasing employment as a result of ill-health, disability, redundancy or retirement or in any othercircumstances which the Committee permits.
A bad leaver is an Executive Director who does not fall within the category of “good leaver” and bad leavers will forfeit any entitlementto a bonus payment in respect of the current financial year or any completed financial year in respect of which the bonus has not beenpaid at the cessation date.
Long term incentives(LTIP)
A proportion of the LTIP awards held by good leavers will vest at the Committee’s discretion determined by taking into account whether,and to what extent, any performance conditions have been satisfied and the length of time the LTIP award has been held at the date ofcessation of employment.
The LTIP awards will not normally vest until the end of the performance period with performance tested at that time, althoughexceptionally such awards may, at the discretion of the Committee, vest at cessation of employment.
Good leaver is defined as an individual ceasing employment as a result of ill-health, injury, disability, redundancy, retirement, or thesale out of the Group of his employing business for any other reason which the Committee in its absolute discretion permits.
A bad leaver is an Executive Director who does not fall within the category of good leaver and bad leavers will forfeit any unvested awards.
Other The Group may meet relocation and other incidental expenses on termination of employment, the fees of legal or other professionaladvisers, outplacement, compensation in respect of statutory rights under relevant employment protection legislation and accrued butuntaken holiday. It may also elect to continue to provide certain benefits rather than making payment in lieu of the benefit in question.
Element Approach
Statement of consideration of shareholders’ viewsThe views of our shareholders are very important to the Committee and we have actively consulted with our major shareholders and the main representativebodies to help formulate our amended Remuneration Policy and arrangements proposed in this report.
Any consultations on remuneration with shareholders and representative bodies will usually be led by the Chair of the Remuneration Committee.
The Remuneration Committee considers shareholder feedback received in relation to the AGM each year at its first meeting following the AGM. This feedback,as well as any additional feedback received during any other meetings with shareholders throughout the year, is then considered as part of the Company’sannual review of remuneration policy.
The Remuneration Committee notes that shareholders do not speak with a single voice, but we engage with our largest shareholders to ensure we understandthe range of views which exist on remuneration issues. When any material changes are proposed to the Remuneration Policy, the Remuneration CommitteeChair will inform major shareholders in advance, and will offer a meeting to discuss these.
Shareholder votingThe Group is committed to ongoing shareholder dialogue and takes an active interest in voting outcomes. Where there are substantial votes against resolutionsin relation to Directors’ remuneration, the reasons for that voting will be sought and any actions in response will be detailed here. There have been no significantissues raised by shareholders in respect of remuneration in the year.
The table below shows the advisory vote on the 2017 Remuneration Report and the binding vote on the Remuneration Policy at the AGM held on 21 July 2015.
2017 Remuneration Report 120,565,327 99.17 1,006,046 0.83 3,811,7972015 Remuneration Policy 124,032,466 99.22 979,331 0.78 177,620
Votes for % Votes Against % Votes withheld

ANNUAL REPORT ON REMUNERATIONThis section of the Remuneration Report contains details of how the Directors’ Remuneration Policy will, subject to shareholder approval, be implemented forthe year ending 31 March 2019 and how it was implemented during the year ended 31 March 2018.
Implementing the Policy for the Year Ending 31 March 2019
Base salaryWhile the Committee has operated a policy of targeting base salaries “close to (but generally just below) median” for some time, actual salaries have been setsignificantly below median levels.
Following a review of Executive Director base salary levels as part of the Remuneration Policy review, the Remuneration Committee has concluded that currentsalary levels are no longer reflective of each individual’s role and responsibilities in a FTSE 250 company of Big Yellow’s size and complexity given the increasein (i) the numbers of stores; (ii) the geographical spread; (iii) the employee base; (iv) customers; (v) revenue; and (vi) profits.
As such, and in connection with the simplification and de-gearing of incentive potential as part of the Remuneration Policy review, the following base salaryincreases are proposed:
Executive Chief Financial Operations Chief Executive Chairman Officer Director (James Gibson) (Nicholas Vetch) (John Trotman) (Adrian Lee)
Current £302,000 £275,200 £223,700 £223,700From 1 April 2018 £350,000 £315,000 £260,000 £250,000From 1 April 2019 £400,000 £350,000 £300,000 £270,000From 1 April 2020 £440,000 £375,000 £325,000 £285,000
The Committee considers the proposed base salary levels to be more appropriate in light of each individual’s role and contribution to Big Yellow and Big Yellow’ssize and complexity (although they remain conservatively positioned against the sector and market more generally). Further, in addition to his ExecutiveChairman role, it should also be noted that Nicholas Vetch has also taken on executive responsibility for the property team in the past year, covering bothproperty acquisitions and development.
The proposed salary increases are neither post freeze catch-up awards, nor are they benchmarking driven and while the Committee had originally intendedto increase salary levels from 1 April 2018 and 1 April 2019, the Committee has decided to phase the salary increases over three years following consultationwith investors.
Further, in line with best practice, the increases from 1 April 2019 and 1 April 2020 are not guaranteed but will be subject to satisfactory Group and individualperformance during the years ending 31 March 2019 and 31 March 2020. Other than for a material role change, subsequent salary increases are expected tobe in line with the general workforce increases.
BenefitsNo changes will be made to benefit provision (private fuel, private medical insurance, permanent health insurance, life assurance and relocation allowances,where relevant).
Annual bonusAnnual bonus potential will be capped at 150% of salary for the year ending 31 March 2019.
Up to 25% of salary will continue to be aligned to the workforce annual bonus (measured against store performance, through occupancy growth, store profitability,store audits and customer satisfaction scores). Any bonus earned under this part will be payable in cash, following the year ending 31 March 2019.
The remaining 125% of salary will be measured against financial, operational, real estate and strategic targets measured over the financial year ending31 March 2019. Any award under this part will be deferred into Big Yellow shares for three years (with vesting subject to continued employment).
PensionReflecting the proposed base salary increases and the Investment Association’s recent encouragement for company pension provision to be aligned to thatprovided to the general workforce (as a percentage of salary), Executive Director pension provision was reduced from 15% of salary to 10% of salary (beingthe pension provided for the Company’s Department Heads) from 1 April 2018.
75

Remuneration Report (continued)Year ended 31 March 2018
76
LTIPLTIP awards will continue to be granted to Executive Directors annually, over shares equal to 100% of salary. The performance conditions for awards intendedto be granted to Executive Directors in 2018 are as follows:
> 70% adjusted EPS – adjusted EPS growth of RPI+3% p.a. for 25% of this element of the award to vest with full vesting occurring for adjusted EPS growth ofRPI+8% p.a.;
> 30% – relative TSR performance vs. FTSE Real Estate Index with 25% of this element of the award vesting for median TSR comparative performance andfull vesting at upper quartile.
Subject to the new Remuneration Policy receiving shareholder approval, a two year post vesting holding period will be applied to any LTIP award granted toExecutive Directors following the 2018 AGM.
Shareholding GuidelinesThe requirement to build and maintain a holding of at least 200% of salary in shares of the Company, through retaining at least 50% of shares vesting indiscretionary share-based incentive plans if this guideline has not been met, will continue to apply.
Non-Executive DirectorsNon-Executive Director fees for the year ending 31 March 2019, together with the fees for the year ended 31 March 2018, are as follows:
Non-Executive 2018/19 fee 2017/18 fee
Richard Cotton £45,100 £44,200Tim Clark £45,100 £44,200Georgina Harvey £45,100 £44,200Steve Johnson £40,000 £39,200Anna Keay £40,000 £39,200 1
Vince Niblett £45,100 £44,200 1
1 Annual fee from appointment.
How the Policy Was Implemented for the Year Ended 31 March 2018
Single total figure of remuneration (Audited)The table below sets out the single total figure of remuneration and breakdown for each Executive Director paid in the year ended 31 March 2018.
Salary Taxable benefits1 Annual bonus Long term incentives Pensions2 Total £ £ £ £ £ £
2018 2017 2018 2017 2018 2017 2018 2017 2018 2017 2018 2017
Nicholas Vetch 275,200 269,800 5,120 5,313 35,501 26,980 1,328,117 433,011 41,280 40,470 1,685,218 775,574
James Gibson 302,000 296,000 5,120 5,713 38,958 29,600 1,786,688 474,914 45,300 44,400 2,178,066 850,627
Adrian Lee 223,700 219,300 4,313 4,806 28,857 21,930 1,253,430 329,102 33,555 32,895 1,543,855 608,033
John Trotman 223,700 219,300 1,806 2,061 28,857 21,930 1,250,216 329,102 33,555 32,895 1,538,134 605,288
Total 1,024,600 1,004,400 16,359 17,893 132,173 100,440 5,618,451 1,566,129 153,690 150,660 6,945,273 2,839,522
1 Taxable benefits comprise medical cover, permanent health insurance, life insurance and private fuel usage.2 Nicholas Vetch and James Gibson receive a cash supplement in lieu of their full pension contributions. Adrian Lee and John Trotman receive cash supplements in lieu of pension
contributions above £10,000.
The values shown in long term incentives in the current year are as follows:
> the LTIP award granted in 2014 which vested on 29 July 2017 to 100% of its maximum value and is valued using the share price on that date of 787p. The award granted for 2018 is 100% of salary for each Executive Director;
> the Long Term Bonus Performance Plan, which vested to 93.33% of its maximum value. The award is exercisable from July 2018; and > for James Gibson and John Trotman, Sharesave awards which matured in the financial year.
The average salary increase across the Group in the year was 2%; this increase was also applied to the Executive Directors from 1 April 2017.

77
Annual Bonus Plan awardsThe policy of the Company is that the cash bonus paid to the Executive Directors is the same as the average of the bonus awards (as a % of salary) paid to allthe Group’s stores on achieving their targets during the course of the year. It is an important part of the Group’s culture that the Executive team are rewardedwith the same level of annual bonus as the average for all staff.
In respect of the year under review, and in line with the average bonus as a percentage of salary paid across the stores the Executive Directors’ received acash bonus of 12.9% of salary (out of a maximum of 25% of salary).
Overview of the staff (and Executive Director) cash bonus scheme The staff bonus scheme is designed, on a quarterly basis, to reward each store with a bonus of up to 25% of their quarterly salary, made up of the followingfour key elements set out below:
Occupancy performance against targetEach store is set a quarterly target for occupancy growth. The weighting of the contribution of these metrics to the bonus varies based on store occupancy,with higher occupied stores having a lower weighting towards their performance against their occupancy target.
The bonus awarded to each store increases as the store moves further ahead of target. No bonus is awarded if the store fails to meet its target. The individualstore targets have not been disclosed as it would be impractical and commercially sensitive to disclose the targets for every one of our stores in this report.
However following feedback received from our shareholders on previous remuneration reports to increase the disclosure around the annual bonus, we haveshown the average annual distribution of performance against target for each of the bonus measures across our stores and the corresponding average pay-out as a percentage of salary which directly corresponds to the bonus percentage pay-out for the Executive Directors.
The average performance against the four key targets and the associated reward for the stores were as follows:
1 Occupancy
No of stores 37 1 4 3 2 26 73Average bonus paid 0% 0.8% 2.1% 4.2% 9.0% 12.8% 5.2%
Additionally, twelve stores were awarded bonuses for averaging 85% occupancy and above earning a total weighted average bonus of 0.7%. The weightedaverage bonus paid to stores for performance against occupancy targets is therefore 5.9% of salary for the year.
2 ProfitabilityEach store is set a quarterly target for profitability. The weighting of the contribution of these metrics to the bonus varies based on store occupancy, withhigher occupied stores having a higher weighting towards their performance against their profitability target.
The bonus awarded to each store increases as the store moves further ahead of target. No bonus is awarded if the store fails to meet its target. The performancedistribution of the store’s performance against their individual targets are provided below.
No of stores 29 12 13 9 10 73Average bonus paid 0.1% 1.3% 3.6% 4.4% 7.7% 2.5 %
The weighted average bonus paid to stores for performance against profitability targets is therefore 2.5% of salary for the year.
3 Store auditsStores receive a bonus if they receive an audit score of in excess of 85% based on visits carried out by the Group’s store compliance team. There were 51 instances of stores receiving an audit score of 85% and above across the year, leading to a weighted average bonus paid to the stores of 1.4% of salary.
Performanceagainst target Below target
0 to 10% aheadof target
10 to 20% aheadof target
20 to 30% aheadof target
30 to 40% aheadof target
> 40% aheadof target Total
Performanceagainst target Below target
0 to 1% aheadof target
1 to 2% aheadof target
2 to 3% aheadof target
>3% aheadof target Total
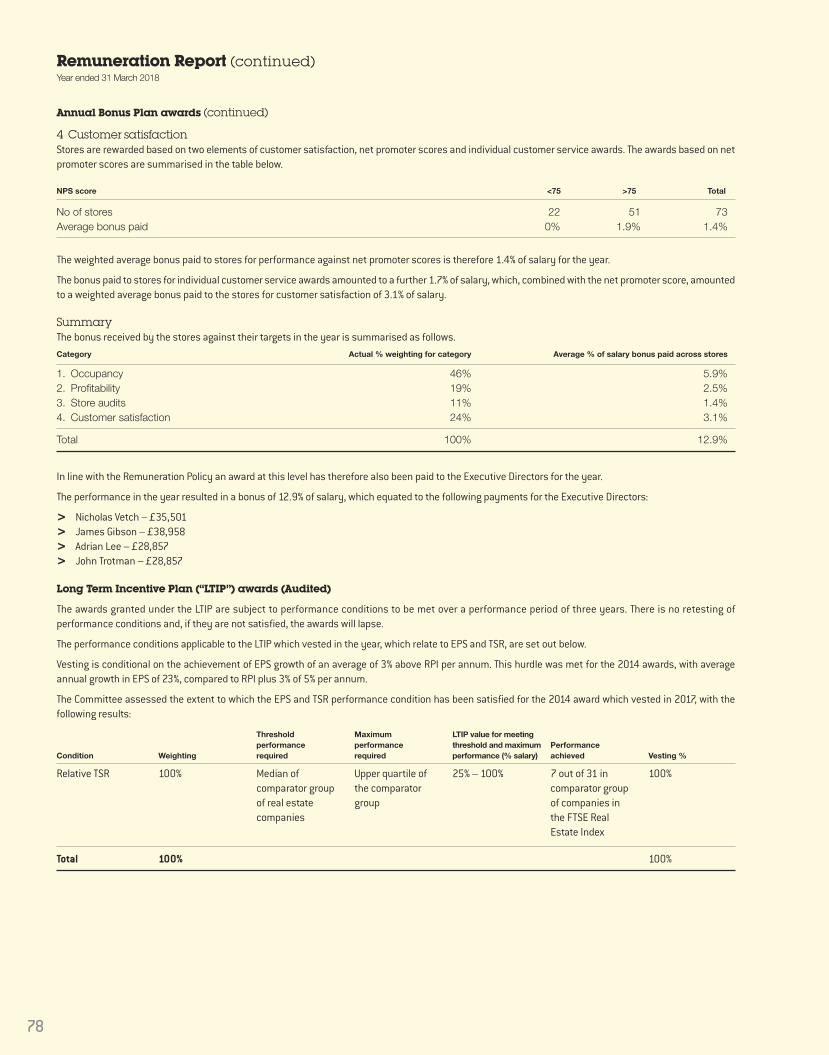
Annual Bonus Plan awards (continued)
4 Customer satisfactionStores are rewarded based on two elements of customer satisfaction, net promoter scores and individual customer service awards. The awards based on netpromoter scores are summarised in the table below.
No of stores 22 51 73Average bonus paid 0% 1.9% 1.4%
The weighted average bonus paid to stores for performance against net promoter scores is therefore 1.4% of salary for the year.
The bonus paid to stores for individual customer service awards amounted to a further 1.7% of salary, which, combined with the net promoter score, amountedto a weighted average bonus paid to the stores for customer satisfaction of 3.1% of salary.
SummaryThe bonus received by the stores against their targets in the year is summarised as follows. Category Actual % weighting for category Average % of salary bonus paid across stores
1. Occupancy 46% 5.9%2. Profitability 19% 2.5%3. Store audits 11% 1.4%4. Customer satisfaction 24% 3.1%
Total 100% 12.9%
In line with the Remuneration Policy an award at this level has therefore also been paid to the Executive Directors for the year.
The performance in the year resulted in a bonus of 12.9% of salary, which equated to the following payments for the Executive Directors:
> Nicholas Vetch – £35,501> James Gibson – £38,958> Adrian Lee – £28,857> John Trotman – £28,857
Long Term Incentive Plan (“LTIP”) awards (Audited)
The awards granted under the LTIP are subject to performance conditions to be met over a performance period of three years. There is no retesting ofperformance conditions and, if they are not satisfied, the awards will lapse.
The performance conditions applicable to the LTIP which vested in the year, which relate to EPS and TSR, are set out below.
Vesting is conditional on the achievement of EPS growth of an average of 3% above RPI per annum. This hurdle was met for the 2014 awards, with averageannual growth in EPS of 23%, compared to RPI plus 3% of 5% per annum.
The Committee assessed the extent to which the EPS and TSR performance condition has been satisfied for the 2014 award which vested in 2017, with thefollowing results:
NPS score <75 >75 Total
Condition Weighting
Thresholdperformancerequired
Maximumperformancerequired
LTIP value for meetingthreshold and maximumperformance (% salary)
Performanceachieved Vesting %
100%7 out of 31 incomparator groupof companies inthe FTSE RealEstate Index
25% – 100%Upper quartile ofthe comparatorgroup
Median ofcomparator groupof real estatecompanies
100%Relative TSR
100%100%Total
78
Remuneration Report (continued)Year ended 31 March 2018

79
The full vesting of the 2014 LTIP award in 2017, equated to the following value for the Executive Directors based on the share price at the date of vesting:
> Nicholas Vetch – £397,680 (50,467 shares)> James Gibson – £431,674 (55,352 shares)> Adrian Lee – £322,993 (40,989 shares)> John Trotman – £306,737 (38,926 shares)
LTIP awards granted in year ended 31 March 2018 (Audited)
The table below sets out the details of the long term incentive awards granted in 2017 in the year ended 31 March 2018 where vesting will be determinedaccording to the achievement of performance conditions that will be tested in future.
1 The face value of the award is calculated using the average share price three days prior to the grant date of 3 August 2017 (average share price of 773.3 pence).
The performance conditions applicable to the awards granted in 2017 are set out below. There are no changes to the performance measures, their weightingsand the targets from the awards granted in 2016:
Between threshold and maximum performance, vesting will take place on a straight-line basis.
Long Term Bonus Performance Plan (Audited)
The only outstanding LTBPP awards are those granted in 2015 which are due to vest in 2018:
Director Award typeAwards asa % of salary
Face valueof award1
Percentage of awardvesting at thresholdperformance
Maximumpercentage of facevalue that could vest
Performanceperiod end date
Performanceconditions
Nicholas Vetch
James Gibson
Adrian Lee
John Trotman
Annual cycle ofawards over nilcost options
100% of salary
£275,200
£302,000
£223,700
£223,700
25% 100% 3 August 2020Adjusted EPSgrowth andrelative TSR
Condition Weighting
Thresholdperformancerequired
Maximumperformancerequired
LTIP value for meetingthreshold and maximumperformance (% salary) Basis for measurement
Relative TSR 30% Median ofcomparator groupof real estatecompanies
Upper quartile ofthe comparatorgroup
25% to 100% The average of the Group’s closing mid-market share price over the three monthspreceding the start of the performanceperiod and preceding the end of theperformance period will be used, includingdividends re-invested.
Adjusted EPS 70% Adjusted EPSgrowth of RPI+3%per annum
Adjusted EPSgrowth of RPI+8%per annum
25% to 100% The adjusted EPS figure reported in theaudited results of the Group for the lastcomplete financial year ending before thestart of the performance period and the lastcomplete financial year ending before theend of the performance period will be used.
Total 100%
Director Award type
Awards as a % of salary at the time of grant
Face value of award
Percentage of awardvesting at thresholdperformance
Maximumpercentage of facevalue that could vest
Performanceperiod end date
Performanceconditions
Assessedannually ona basket ofmeasures
31 March 2018100%0%
£996,900
£1,440,000
£996,900
£996,900
377%
496%
464%
464%
Granted everythree years,award convertsto nil costoptions onvesting.
Nicholas Vetch
James Gibson
Adrian Lee
John Trotman

Remuneration Report (continued)Year ended 31 March 2018
80
Long Term Bonus Performance Plan (Audited) (continued)The report on the targets for the year ended 31 March 2018 (other than those which remain commercially sensitive) is summarised in the table below:
Objective Committee Comment
Grow the Group’s annual operating cash flow by £4 million for the year to31 March 2018 compared to the year to 31 March 2017.
The Group’s annual operating cash flow grew by £7.0 million in the year to 31 March 2018.
Increase the Group’s occupied space by 175,000 sq ft in the year ending 31 March 2018 compared to a net growth of 112,000 sq ft in the prior year.
Overall occupied space increased by 179,000 sq ft in the year.
Grow the occupancy of the like-for-like stores open at 31 March 2017 to 81.7%by 30 September 2017, and following the seasonal occupancy loss in the thirdquarter, recover to this level by 31 March 2018, compared to an increase of 2.8 ppts last year.
Occupancy of the like-for-like stores increased to 83.8% by 30 September 2017,a year on year increase of 5.3 ppts. The third quarter saw a slightly larger seasonaloccupancy loss than the prior year, due to the strong summer’s trading, but after areturn to growth in Q4, the closing occupancy was 81.9%, a year on year increaseof 3.9 ppts.
Grow the average net rent per square foot across the stores from £26.03 per squarefoot by 1.5% to £26.43 by 31 March 2018, compared to growth of 0.5% in 2017.
The average net rent across the portfolio at 31 March 2018 was £26.74, an increaseof 2.7% from 1 April 2017.
Meet budgeted revenue (£114.6 million) and adjusted profit before tax (£59.2 million) targets.
Revenue for the year was £116.7 million, 2% ahead of budget. Adjusted profitbefore tax was £61.4 million, 4% ahead of budget.
Meet or exceed the budgeted adjusted earnings per share of 37.2 pence. Adjusted earnings per share were 38.5 pence for the year, 3% ahead of thebudgeted amount.
Review potential sites (in London and key target towns outside of London)for store acquisition with a view of acquiring at least one new site in the year.
The Group has acquired five development sites since 1 April 2017 in Wapping(London), Uxbridge (London), Hove, Bracknell and Slough, increasing thedevelopment pipeline to 10 sites (including one extension site).
The Group continues to monitor other opportunities.
Maintain the Group’s online market share measured against the top 35 selfstorage operators by Connexity Hitwise, at on average greater than 30%.
The Group’s online market share for the year as measured by ConnexityHitwise was 31%.
The planning application for Camberwell has been rejected on design grounds.We have submitted an appeal by way of an informal hearing rather than a fullpublic inquiry. The objective is to have a planning consent by March 2018.
Planning consent has now been granted for the development of a 72,000 sq ftstores at Camberwell. We are now starting detailed design work.
Obtain planning consent for Manchester. Planning consent was granted in September 2017 for a 60,000 sq ft store. We have started construction with a view to a store in opening in spring 2019.
Maintain the net promoter score for customer satisfaction from theCustomer Experience programme in excess of 70 for move ins and 65 formove out surveys.
The move in NPS score for the year was 86, an increase from 83 in the prioryear. The move out NPS score for the year was 70, an increase from 67 in the prior year.
Maintain the Group’s brand leadership of unprompted and prompted awarenessthroughout the UK, to be measured by third party survey in the year.
The YouGov survey commissioned in April 2018 has shown our promptedawareness to be at 71% in London, over two and half times higher than ournearest competitor and 46% for the rest of the UK, over three times higherthan our nearest competitor.
For unprompted brand awareness, our recall in London is 46%, six and a halftimes higher than our nearest competitor and for the rest of the UK it is 23%,nearly eight times higher than our nearest competitor.
Reduce the carbon intensity for the year to 31 March 2018 (KgCO2/m2 ofoccupied space) by 5% from the year to 31 March 2017.
Carbon intensity was reduced by 20% for the year to 31 March 2018.

81
Long Term Bonus Performance Plan (Audited) (continued)The other targets, covering areas such as real estate, staffing and certain financial targets, were met in the majority of cases. They have not been disclosedas they are commercially sensitive.
Following careful consideration of the performance targets and actual performance of the Group and the Executive Directors, the Committee has concludedthat the award in respect of the financial year ended 31 March 2018 has vested at 100% of its potential amount for the year. For the years ended 31 March2016 and 31 March 2017, the Committee concluded that the award had provisionally vested as to 90% of its potential amount for each year.
The Committee has also then assessed the vesting for the three years of the plan and has determined an overall vesting of 93.33% for the whole period of theplan. In reaching this determination, the Committee took into account the fact that, over the three years of the plan, substantially all of the annual targets setat the outset of each year (by reference to the relevant business plan) had been met as well as the significant progress which has been made by the Groupover the past three years. By way of illustration, over the past three years, the Group’s revenue has increased by 38%, with adjusted EPS increasing by 42%and dividends declared increasing by 42%. The Committee believes that this level of vesting is therefore consistent with the Group’s performance and theshareholder experience and, as such awards under the plan will formally vest in July 2018. Once vested, part of the award will then be subject to a holdingperiod in line with the current Remuneration Policy.
Sharesave SchemeThe Group’s Sharesave Scheme is open to all UK employees (including Executive Directors) with a minimum of six months’ service and meets UK HMRCrequirements, thus giving all eligible employees the opportunity to acquire shares in the Company in a tax efficient manner. Three of the Executive Directorsparticipated in the scheme during the financial year. The details of the Sharesave scheme options are shown on page 83.
Pension entitlementsThe Company pays pension contributions into the Executive Directors’ personal pension plans or makes a cash contribution in lieu of pension contributions.They do not participate in any defined benefit scheme. For the year ended 31 March 2018, the Company contribution was 15% of salary for the ExecutiveDirectors.
Payments to past Directors (Audited)No payments of money or any other assets were made to any former Director of the Company in the financial year ended 31 March 2018 (2017: no payments).
Payments on loss of office (Audited)No payments were made to any Directors in respect of loss of office during the financial year ended 31 March 2018 (2017: no payments).
Non-Executive Directors (Audited)The table below sets out the single total figure of remuneration and breakdown for each Non-Executive Director paid in the year ended 31 March 2018:
2018 2017
Tim Clark 44,200 43,700Richard Cotton 44,200 41,000Georgina Harvey 44,200 38,400Steve Johnson 39,200 38,400Anna Keay 3,2671 –Vince Niblett 36,8332 –Mark Richardson 13,4423 41,000Total 225,342 202,500
1 From appointment on 1 March 20182 From appointment on 1 June 20173 Until retirement on 20 July 2017
For the year ended 31 March 2018, the Company reviewed the Non-Executive Director base fee and decided to adjust it to £39,200 from £38,400 (2% increase)and to harmonise the fees provided for Committee Chairs and the Senior Independent Director to £44,200. Non-Executive Directors received no taxable benefitsfor the year ended 31 March 2018.

Remuneration Report (continued)Year ended 31 March 2018
82
Fees retained for external non-executive directorshipsThe Executive Directors’ contracts do not allow them to engage in any other business outside the Group except where prior written consent from the Board isreceived. The Company recognises that Executive Directors may be invited to become Non-Executive Directors of other companies and that this can helpbroaden the skills and experience of a Director. Executive Directors are normally permitted to accept external appointments with the approval of the Boardand may retain the fees for the appointment.
Nicholas Vetch is a Non-Executive Director of The Local Shopping REIT plc for which he receives a fee of £30,000 per annum. James Gibson is a Non-ExecutiveDirector of AnyJunk Limited and of Moby Self Storage in Brazil; he does not receive any fees for his services.
Statement of Directors’ shareholding (Audited)The Executive Directors are required to build and maintain a holding of two times base salary. These requirements have been met by all Executive Directorsthroughout the year. Non-Executive Directors are not subject to a shareholding requirement. Details of the Directors’ interests in shares are set out below(all interests are beneficial interests).
No changes took place in the interests of the Directors in the shares of the Company between 31 March 2018 and the date of this report.
The table below shows, in relation to each Director, the total number of shares and share options in which they have an interest. LTBPP awards are not shownin the table below as the number of shares awarded is calculated by reference to the total vested award value divided by the Company’s share price at thevesting date.
Share LTIPownership Share Holding as awards
requirement ownership multiple of Beneficially subject to Unexercised Options(multiple of requirements March 2018 owned performance Sharesave exercised in the
Director salary) met salary shares conditions options financial year
Nicholas Vetch 2x Yes 279x 8,988,366 111,120 – 50,467James Gibson 2x Yes 70x 2,465,309 121,908 2,812 57,171Adrian Lee 2x Yes 33x 854,643 90,324 2,960 40,989John Trotman 2x Yes 7x 179,788 90,324 2,665 42,565
Non-Executive Directors’ shareholdings (Audited)
Non-Executive Beneficially owned shares
Richard Cotton 88,485Tim Clark 20,615Georgina Harvey 15,293Steve Johnson 10,000Vince Niblett 3,000Anna Keay –
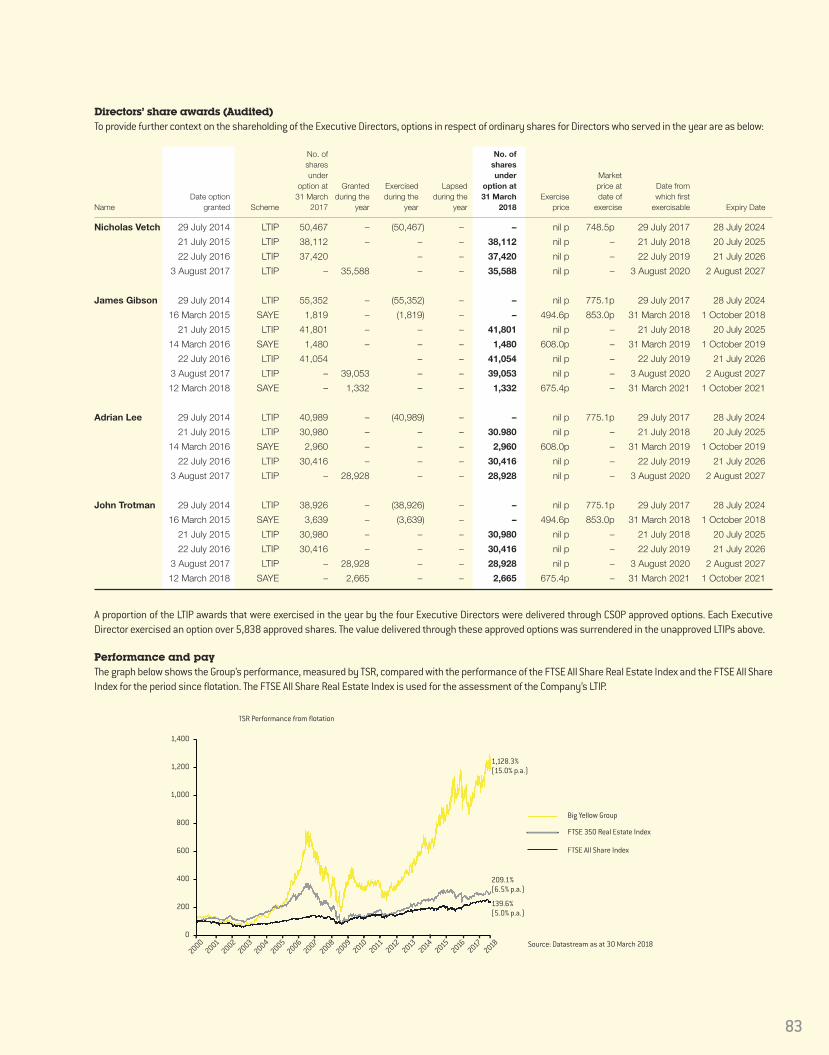
83
Directors’ share awards (Audited)To provide further context on the shareholding of the Executive Directors, options in respect of ordinary shares for Directors who served in the year are as below: No. of No. of shares shares under under Market option at Granted Exercised Lapsed option at price at Date from Date option 31 March during the during the during the 31 March Exercise date of which firstName granted Scheme 2017 year year year 2018 price exercise exercisable Expiry Date
Nicholas Vetch 29 July 2014 LTIP 50,467 – (50,467) – – nil p 748.5p 29 July 2017 28 July 2024
21 July 2015 LTIP 38,112 – – – 38,112 nil p – 21 July 2018 20 July 2025
22 July 2016 LTIP 37,420 – – 37,420 nil p – 22 July 2019 21 July 2026
3 August 2017 LTIP – 35,588 – – 35,588 nil p – 3 August 2020 2 August 2027
James Gibson 29 July 2014 LTIP 55,352 – (55,352) – – nil p 775.1p 29 July 2017 28 July 2024
16 March 2015 SAYE 1,819 – (1,819) – – 494.6p 853.0p 31 March 2018 1 October 2018
21 July 2015 LTIP 41,801 – – – 41,801 nil p – 21 July 2018 20 July 2025
14 March 2016 SAYE 1,480 – – – 1,480 608.0p – 31 March 2019 1 October 2019
22 July 2016 LTIP 41,054 – – 41,054 nil p – 22 July 2019 21 July 2026
3 August 2017 LTIP – 39,053 – – 39,053 nil p – 3 August 2020 2 August 2027
12 March 2018 SAYE – 1,332 – – 1,332 675.4p – 31 March 2021 1 October 2021
Adrian Lee 29 July 2014 LTIP 40,989 – (40,989) – – nil p 775.1p 29 July 2017 28 July 2024
21 July 2015 LTIP 30,980 – – – 30.980 nil p – 21 July 2018 20 July 2025
14 March 2016 SAYE 2,960 – – – 2,960 608.0p – 31 March 2019 1 October 2019
22 July 2016 LTIP 30,416 – – – 30,416 nil p – 22 July 2019 21 July 2026
3 August 2017 LTIP – 28,928 – – 28,928 nil p – 3 August 2020 2 August 2027
John Trotman 29 July 2014 LTIP 38,926 – (38,926) – – nil p 775.1p 29 July 2017 28 July 2024
16 March 2015 SAYE 3,639 – (3,639) – – 494.6p 853.0p 31 March 2018 1 October 2018
21 July 2015 LTIP 30,980 – – – 30,980 nil p – 21 July 2018 20 July 2025
22 July 2016 LTIP 30,416 – – – 30,416 nil p – 22 July 2019 21 July 2026
3 August 2017 LTIP – 28,928 – – 28,928 nil p – 3 August 2020 2 August 2027
12 March 2018 SAYE – 2,665 – – 2,665 675.4p – 31 March 2021 1 October 2021
A proportion of the LTIP awards that were exercised in the year by the four Executive Directors were delivered through CSOP approved options. Each ExecutiveDirector exercised an option over 5,838 approved shares. The value delivered through these approved options was surrendered in the unapproved LTIPs above.
Performance and pay The graph below shows the Group’s performance, measured by TSR, compared with the performance of the FTSE All Share Real Estate Index and the FTSE All ShareIndex for the period since flotation. The FTSE All Share Real Estate Index is used for the assessment of the Company’s LTIP.
FTSE All Share Index
Big Yellow Group
FTSE 350 Real Estate Index
Source: Datastream as at 30 March 2018
1,128.3%(15.0% p.a.)
209.1%(6.5% p.a.)
139.6%(5.0% p.a.)
TSR Performance from flotation
0
200
400
600
800
1,000
1,200
1,400
20002001200220032004200520062007200820092010201120122013201420152016
2018
2017

Remuneration Report (continued)Year ended 31 March 2018
84
CEO RemunerationThe table below sets out the details of remuneration of the CEO over the past nine financial years.
Long term incentiveCEO single figure of Annual bonus pay out weighted average vesting ratestotal remuneration % against maximum against maximum opportunity
Year (£) of 25% of salary %
2018 2,178,066 51.6% (12.9% of salary) 95%2017 850,619 40% (10% of salary) 100%2016 988,811 48% (12% of salary) 100%2015 1,756,290 50% (12.5% of salary) 98%2014 536,262 40% (10% of salary) 53%2013 335,891 40% (10% of salary) 0%2012 1,400,570 40% (10% of salary) 89%2011 325,968 40% (10% of salary) 0%2010 875,593 40% (10% of salary) 100%
The single figure of remuneration for 2018, 2015 and 2012 are higher than in other years due to the vesting of the three year Long Term Bonus PerformancePlan in those years delivering a reward of £1,343,995 (93.33% vesting), £945,750 (97% vesting) and £900,000 (90% vesting) respectively for the three yearperiod ended in that year.
Percentage increase in the CEO’s remunerationThe table below compares the percentage increase in the CEO’s remuneration (including salary, fees, benefits and annual bonus) with the remuneration ofBig Yellow Group employees.
% increase in remuneration in2018 compared with 2017
CEO Employees
Salary and fees 2% 2%All taxable benefits (10%) 2%Annual bonuses 29% 29%
Statement of consideration of employment conditions elsewhere in the GroupThe Committee reviews the reward and retention of the whole employee population periodically throughout the year to ensure that it can attract and retaintop talent. Particular consideration is given to the general basic salary increase, remuneration arrangements and employment conditions. Furthermore, thecash annual bonus awarded to Executive Directors is directly linked to the bonuses awarded to all staff.
The Directors are invited to be present at this review of the proposals for salary increase for the employee population generally and on any other changes toremuneration policy within the Company. The information presented at this review is taken into consideration when setting the pay levels of the executivepopulation. Additionally, the Committee has guidelines for the grant of all LTIP awards across the Company and responsibility for approving the total annualbonus cost of the Company. The Company does not invite employees to comment on the remuneration of Directors.
Relative importance of spend on payThe graph below sets out the relative importance of spend on pay in the year ended 31 March 2018 and 31 March 2017 compared with other disbursements from profit, being the distributions to shareholders and retained earnings (comprehensive gainfor the year less dividends).
2017
2018
Total employee pay(including Directors)
Profit distributed by way of dividend
Retained earnings
0
20,000
30,000
40,000
50,000
60,000
70,000
80,000
90,000
100,000
10,000
4%
12%
50%
£000

85
Gender payThe Group has reported on its gender pay gap for 2017. The full report can be found on the investor relations website http://corporate.bigyellow.co.uk/investors.aspx.The Group’s mean gender pay gap was 26%, with a median gap of 10%. Excluding Executive Directors (three of whom were founders of the business), the mean genderpay gap falls to 12% with a median gap of 9%. All staff are paid equally according to job role.
The Group recognises that its success stems from attracting the right people and creating a diverse and gender balanced workforce, which not only reflectsthe communities in which the Group operates but also ensures a fully motivated and engaged team. The Group will ensure that every policy and practiceencourages inclusive ways of working, in line with the Big Yellow culture.
Flexible working is promoted across the organisation, with a number of Head Office employees being home based, others working flexibly from home and allemployees being able to work from any location within the business.
The family friendly policies include enhanced maternity, paternity and adoption pay and the Group’s parental leave policy encourages both men and womento share childcare commitments.
The Group will continue to recruit based on merit and ensure that recruitment processes are bias free. The Group has recently recruited a female at seniormanagement level to replace a position previously held by a male employee and will continue to endeavour to increase the number of women in all seniorpositions. In addition, the Group intends to review our recruitment practices to actively increase the representation of women within store managementpositions, as well as better utilising internal development programmes to encourage a greater number of women to progress within the Group. The Group willalso be introducing a specific return to work programme for employees returning from maternity leave.
Advisers to the Remuneration CommitteeIn undertaking its responsibilities, the committee seeks independent external advice as necessary. To this end, FIT Remuneration Consultants LLP replacedPwC as the principal external advisers to the Committee during the financial year, following a tender process overseen by the Committee. The Committee iscomfortable that the FIT team provides independent remuneration advice to the Committee and does not have any other connections with Big Yellow that mayimpair their independence. FIT is a founding member and signatory of the Code of Conduct for Remuneration Consultants, details of which can be found atwww.remunerationconsultantsgroup.com.
During the year, FIT provided independent advice on a wide range of remuneration matters including the Remuneration Policy review. FIT provides no otherservices to the Company. The fees paid to FIT in respect of work carried out for the year under review were £55,000.
Attendance at Remuneration Committee meetingsAttendance at meetings of the individual Directors at the Remuneration Committee Meetings that they were eligible to attend is shown in the table below:Director Number of meetings attended
Tim Clark Richard Cotton Georgina Harvey Steve Johnson Anna Keay Vince Niblett Mark Richardson
attended absent
Approval
This policy report was approved by the Board of Directors on 21 May 2018 and signed on its behalf by
Georgina HarveyRemuneration Committee Chair

Audit Committee Report Year ended 31 March 2018
86
INTRODUCTIONThe Audit Committee is appointed by the Board from the Non-Executive Directors of the Group. The Audit Committee’s terms of reference include all mattersindicated by Disclosure and Transparency Rule 7.1 and the UK Corporate Governance Code. The terms of reference are considered annually by the AuditCommittee and are then referred to the Board for approval.
The Audit Committee is responsible for:
> monitoring the integrity of the financial statements of the Group and any formal announcements relating to the Group’s financial performance andreviewing significant financial reporting judgements contained therein;
> reviewing the Group’s internal financial controls and the Group’s internal control and risk management systems, including consideration of the need foran internal audit function;
> making recommendations to the Board, for a resolution to be put to the shareholders for their approval in general meetings, on the appointment of theexternal auditor and the approval of the remuneration and terms of engagement of the external auditor;
> reviewing and monitoring the external auditor’s independence and objectivity and the effectiveness of the audit process, taking into considerationrelevant UK professional and regulatory requirements; and
> developing and implementing a policy on the engagement of the external auditor to supply non-audit services, taking into account relevant guidanceregarding the provision of non-audit services by the external audit firm.
The Audit Committee is required to report its findings to the Board, identifying any matters on which it considers that action or improvement is needed, andmake recommendations on the steps to be taken.
This year the Committee has continued to focus on the narrative reporting and corporate governance disclosures in the Annual Report. The Committee wasasked by the Board to review the statement by the Directors that the Annual report presents a fair, balanced and comprehensive view of the Group’sperformance, strategy and business model.
Committee Members and Attendance
Member Position Number of meetings attended
Tim Clark Member Richard Cotton Member Georgina Harvey Member Steve Johnson Member Anna Keay Member (from 1 March 2018) Mark Richardson Chairman (until 31 May 2017) Vince Niblett Chairman (from 1 June 2017)
attendedabsent
All Audit Committee members are expected to be financially literate. Furthermore, the Audit Committee structure requires the inclusion of one financiallyqualified member (as recognised by the Consultative Committee of Accountancy Bodies). Currently Vince Niblett, as a Fellow of the Institute of CharteredAccountants of England and Wales, fulfils this requirement.
The Group provides an induction programme for new Audit Committee members and ongoing training to enable all of the Committee members to carry out theirduties. The induction programme covers the role of the Audit Committee, its terms of reference and expected time commitment by members and an overview ofthe Group’s business, including the main business and financial dynamics and risks. New Committee members also meet some of the Group’s staff.
Ongoing training includes attendance at formal conferences, internal company seminars and briefings by external advisers.
MeetingsThe Audit Committee is required to meet three times per year and has an agenda linked to events in the Group’s financial calendar. The agenda is predominantlycyclical and is therefore approved by the Audit Committee Chairman on behalf of his fellow members. Each Audit Committee member has the right to requirereports on matters of interest in addition to the cyclical items.
The Audit Committee invites the Chief Executive, Chief Financial Officer, Financial Controller, and senior representatives of the external auditor to attend all ofits meetings in full, although it reserves the right to request any of these individuals to withdraw. The Committee may meet with the external auditor withoutthe Executive Directors or senior management present. Other senior management are invited to present such reports as are required for the Committee todischarge its duties.

87
Overview of the actions taken by the Audit Committee to discharge its dutiesSince the beginning of the financial year the Audit Committee has:
> reviewed published financial information including the year end results, Annual Report, half year results and the Interim Management Statements;> considered whether the Annual Report provides a fair, balanced and comprehensive view of the Group’s performance, strategy and business model;> assessed and concluded on the Group’s viability statement;> considered the output from the Group-wide process used to identify, evaluate and mitigate risks;> reviewed the effectiveness of the Group’s internal controls and disclosures made in the annual report and financial statements on this matter;> reviewed and agreed the scope of the audit work to be undertaken by the external auditor;> agreed the fees to be paid to the external auditor for their audit of the March 2018 financial statements and September half-yearly report; > considered and agreed the approach of performing Directors’ valuations of investment properties for the half-year report;> undertaken an assessment of the qualification, expertise and resources, and independence of the external auditor and the effectiveness of the
audit process;> considered the audit partner and audit firm rotation;> undertaken an evaluation of the performance of the external auditor;> assessed the effectiveness of the external auditor;> reviewed the nature and extent of interaction with the FRC’s Corporate Reporting Review team. The Company received a letter during the year from the
FRC with suggestions for minor areas of improvement of disclosure in the financial statements. These have been addressed in these financialstatements. The FRC’s review only covered the specific disclosures relating to this review and provides no assurance that the report and accounts arecorrect in all material respects; the FRC’s role is not to verify the information provided but to consider compliance with reporting requirements;
> considered the need for an internal audit function;> reviewed the arrangements for “whistleblowing” by employees to ensure that there is a consistent policy in the Group to enable employees to voice
concerns particularly in respect of possible financial reporting improprieties. A whistleblowing policy is included in the employee handbook and duringthe year an external whistleblowing service was introduced;
> met the Group’s external valuers;> met the Group’s Store Compliance Manager;> reviewed the Audit Committee’s Report; and> reviewed its own effectiveness.
Financial reporting and significant financial judgementsThe Committee reviews all financial information published by the Group in year end and half-year financial statements, including the presentation and disclosureof the financial information. It also considers the appropriateness of the accounting policies adopted by the Group and the accounting judgements made bymanagement in the preparation of the financial information.
The Committee has considered whether the Annual Report for the year ended 31 March 2018 provides a fair, balanced and comprehensive view of the Group’sperformance, strategy and business model and whether it provides the necessary information to enable shareholders and prospective shareholders to assessthe Group’s performance, strategy and business model. The Committee is satisfied that the Annual Report for the year ended 31 March 2018 provides a fair,balanced and comprehensive view and includes the necessary information as set out above. The Committee has confirmed this to the Board, whose statementis included in the Statement of Directors’ Responsibilities on page 90.
The Committee focuses on matters it considers important in their impact on the reported results of the Group, and on matters where there is a high degree ofcomplexity and/or judgement.
The key area of judgement that the Committee focuses on at the reporting date is the valuation of the investment property portfolio. This is carried out byindependent external valuers, but by its nature it is subjective, with significant judgement applied to the valuation, particularly given the lack of transactionalevidence for prime self storage assets. The Chairman of the Committee met the external valuers to discuss the valuations, review the key judgements anddiscussed whether there were any disagreements with management. This year the Committee reviewed and challenged the valuers on the cap rates, rentalgrowth assumptions and stabilised occupancy levels, to agree on the appropriateness of the assumptions adopted. The Committee also challenged the valuersand satisfied itself on their independence, their quality control processes (including peer partner review) and qualifications to carry out the valuations.Management also have processes in place to review the external valuations. In addition, the external auditors use specialists to review the valuations andreport their findings and conclusions to the Audit Committee.
The Committee has also considered a number of other judgements made by management in the preparation of the financial statements. There have been no businesscombinations in the year. The Committee has concluded that there is not a significant level of judgements involved, other than the valuation described above.
Management have reported to the Audit Committee that they are satisfied that they are not aware of any material misstatements in the financial statements.The auditors confirmed in their report to the Audit Committee that they had not found any material misstatements during their audit work.
Based on the above, the Committee concluded that the financial statements appropriately apply the key estimates and critical judgements, in respect of thedisclosures and the amounts reported. The Committee also concluded that the annual report and financial statements, taken as a whole, are fair, balancedand comprehensive and provide the information necessary for shareholders to assess the Company’s performance, business model and strategy.

Audit Committee Report (continued)Year ended 31 March 2018
88
External auditorThe Audit Committee is responsible for the development, implementation and monitoring of the Group’s policy on external audit. The policy assigns oversightresponsibility for monitoring the independence, objectivity and compliance with ethical and regulatory requirements to the Audit Committee, and day-to-dayresponsibility to the Chief Financial Officer. The policy states that the external auditor is jointly responsible to the Board and the Audit Committee and that theAudit Committee is the primary contact.
To fulfil its responsibility regarding the independence of the external auditor, the Audit Committee reviewed:
> the external auditor’s plan for the current year, noting the role of the senior statutory audit partner, who signs the audit report and who, in accordancewith professional rules, has not held office for more than five years, and any changes in the key audit staff;
> the arrangements for day-to-day management of the audit relationship;> a report from the external auditor describing their arrangements to identify, report and manage any conflicts of interest;> the overall extent of non-audit services provided by the external auditor, in addition to its case-by-case approval of the position of non-audit services by
the external auditor; and> the past service of the auditor who was appointed in the current financial year.
Audit rotationDuring the prior year following a robust tender process, the Committee appointed KPMG LLP as auditors. As part of the tender process, the Committee reviewedKPMG’s proposals for the audit and determined that they had an appropriate plan in place to carry out an effective audit. KPMG confirmed to the Committeethat it maintained appropriate internal safeguards to ensure its independence and objectivity.
The Company is in compliance with the requirements of the Statutory Audit Services for Large Companies Market Investigation (Mandatory Use of CompetitiveTender Processes and Audit Committee Responsibilities) Order 2014 and the Code.
Annual auditor assessmentThe Audit Committee has adopted a formal framework in its review of the effectiveness of the external audit process and audit quality which include thefollowing areas:
> the arrangements for ensuring the external auditor’s independence and objectivity;> the lead audit engagement partner and the audit team;> the external auditor’s fulfilment of the agreed audit plan and variations from the plan;> the quality of the formal audit report to shareholders; > the robustness and perceptiveness of the auditor in his handling of the key accounting and audit judgements; and> the content of the external auditor’s comments on control improvement recommendations.
Regard is paid to the nature of, and remuneration received, for other services provided by KPMG LLP to the Group and, inter alia, confirmation is sought fromthem that the fee payable for the annual audit is adequate to enable them to perform their obligations in accordance with the scope of the audit. Where non-audit services are provided, the fees are based on the work undertaken and are not success related.
Non-audit workThe Group’s policy on external audit sets out the categories of non-audit services which the external auditor will and will not be allowed to provide to the Group,including those that are pre-approved by the Audit Committee and those which require specific approval before they are contracted for, subject to de minimislevels. They may not provide a service which places them in a position where they may be required to audit their own work. Specifically, they are precludedfrom providing services relating to bookkeeping, financial information system design and implementation, appraisal or evaluation services, actuarial services,any management functions, investment banking services, legal services unrelated to the audit or advocacy services.
In respect of the year ended 31 March 2018, the auditor’s remuneration comprised £188,000 for audit work and £30,000 for other work, solely relating to theinterim review. Over a three year rolling period, the level of non-audit fees is below the audit fee, with non-audit fees representing 45% of audit fees in 2017and 61% in 2016, in both cases payable to the predecessor auditor Deloitte LLP.
Risk management and internal controlThe Committee and the Board reviewed the internal control processes of the business and the Group’s risk register during the year. The risks and uncertaintiesfacing the Group, and its internal control processes are considered in the Strategic Report on page 34.

89
Internal auditThe Committee has considered the Board’s view that, given the relatively straightforward nature of the Group’s business and the control environment in place,no formal internal audit function is required. The Group has a store compliance team, which effectively carries out an internal audit role for the Group’s stores.Additionally, the Board will appoint external consultants to assess specific business areas of risk and provide a report to the Board and the Committee on thisarea. For example, the construction programme was assessed by an external consultant in 2016 with satisfactory results. Similarly, the Board intends toappoint a consultant to review the Group’s tax procedures during the year ending 31 March 2019.
The Committee concurs with management’s view that, in view of these arrangements, no formal internal audit function is necessary for the business at this time.
OverviewAs a result of its work during the year, the Audit Committee has concluded that it has acted in accordance with its terms of reference and has ensured theindependence and objectivity of the external auditor.
The Chairman of the Audit Committee will be available at the Annual General Meeting to answer any questions about the work of the Committee.
Approved by the Audit Committee and signed on its behalf by:
Vince NiblettAudit Committee Chairman21 May 2018

Directors’ responsibilitiesThe Directors are responsible for preparing the Annual Report and the financial statements in accordance with applicable laws and regulations.
Company law requires the Directors to prepare Group and parent Company financial statements for each financial year. Under that law they are required toprepare the Group financial statements in accordance with International Financial Reporting Standards as adopted by the European Union (IFRSs as adoptedby the EU) and applicable law and have elected to prepare the parent Company financial statements on the same basis.
Under company law the Directors must not approve the financial statements unless they are satisfied that they give a true and fair view of the state of affairsof the Group and parent Company and of their profit or loss for that period. In preparing each of the Group and parent Company financial statements, theDirectors are required to:
> select suitable accounting policies and then apply them consistently;> make judgements and estimates that are reasonable, relevant and reliable;> state whether they have been prepared in accordance with IFRSs as adopted by the EU;> assess the Group and parent Company’s ability to continue as a going concern, disclosing, as applicable, matters related to going concern; and> use the going concern basis of accounting unless they either intend to liquidate the Group or the parent Company or to cease operations, or have no
realistic alternative but to do so.
The Directors are responsible for keeping adequate accounting records that are sufficient to show and explain the parent Company’s transactions and disclosewith reasonable accuracy at any time the financial position of the parent Company and enable them to ensure that its financial statements comply with theCompanies Act 2006. They are responsible for such internal control as they determine is necessary to enable the preparation of financial statements that arefree from material misstatement, whether due to fraud or error, and have general responsibility for taking such steps as are reasonably open to them tosafeguard the assets of the Group and to prevent and detect fraud and other irregularities.
Under applicable law and regulations, the Directors are also responsible for preparing a Strategic Report, Directors’ Report, Directors’ Remuneration Reportand Corporate Governance Statement that complies with that law and those regulations.
The Directors are responsible for the maintenance and integrity of the corporate and financial information included on the company’s website. Legislation inthe UK governing the preparation and dissemination of financial statements may differ from legislation in other jurisdictions.
Responsibility statement of the Directors in respect of the annual financial reportWe confirm that to the best of our knowledge:
> the financial statements, prepared in accordance with the applicable set of accounting standards, give a true and fair view of the assets, liabilities, financialposition and profit or loss of the Company and the undertakings included in the consolidation taken as a whole; and
> the strategic report includes a fair review of the development and performance of the business and the position of the issuer and the undertakingsincluded in the consolidation taken as a whole, together with a description of the principal risks and uncertainties that they face.
We consider the annual report and accounts, taken as a whole, is fair, balanced and understandable and provides the information necessary for shareholdersto assess the Group’s position and performance, business model and strategy.
This responsibility statement was approved by the Board of Directors on 21 May 2018 and is signed on its behalf by:
James Gibson John TrotmanChief Executive Officer Chief Financial Officer
Statement of Directors’ Responsibilities
90
1. Our opinion is unmodifiedWe have audited the financial statements of Big Yellow Group PLC (“the Company”) for the year ended 31 March 2018 which comprise the ConsolidatedStatement of Comprehensive Income, Consolidated and Parent Company Balance Sheets, Consolidated and Parent Company Statements of Changes inEquity, Consolidated and Parent Company Cash Flow Statements, and the related notes, including the accounting policies in notes 2 and 29.
In our opinion:
> the financial statements give a true and fair view of the state of the Group’s and of the parent Company’s affairs as at 31 March 2018 and of the Group’sprofit for the year then ended;
> the Group financial statements have been properly prepared in accordance with International Financial Reporting Standards as adopted by the EuropeanUnion (IFRSs as adopted by the EU);
> the parent Company financial statements have been properly prepared in accordance with IFRSs as adopted by the EU; and > the financial statements have been prepared in accordance with the requirements of the Companies Act 2006 and, as regards the Group financial
statements, Article 4 of the IAS Regulation.
Basis for opinionWe conducted our audit in accordance with International Standards on Auditing (UK) (“ISAs (UK)”) and applicable law. Our responsibilities are describedbelow. We believe that the audit evidence we have obtained is a sufficient and appropriate basis for our opinion. Our audit opinion is consistent with ourreport to the audit committee.
We were appointed as auditor by the shareholders on 20 July 2017. The period of total uninterrupted engagement is eight months for the financial yearended 31 March 2018. We have fulfilled our ethical responsibilities under, and we remain independent of the Group in accordance with, UK ethicalrequirements including the FRC Ethical Standard as applied to listed public interest entities. No non-audit services prohibited by that standard wereprovided.
91
Independent Auditor’s Report to the Members of Big Yellow Group PLC
Overview
Materiality:Group financial statements as a whole
£9.5m0.69% of Total Assets
Coverage 100% of Total Assets
Risks of material misstatement
Recurring Risks Valuation of Investment Property, including Investment Property under Construction
Parent Company: Amounts owed by Group Undertakings
2. Key audit matters: our assessment of risks of material misstatementKey audit matters are those matters that, in our professional judgment, were of most significance in the audit of the financial statements and include themost significant assessed risks of material misstatement (whether or not due to fraud) identified by us, including those which had the greatest effecton: the overall audit strategy; the allocation of resources in the audit; and directing the efforts of the engagement team. We summarise below the keyaudit matters in decreasing order of audit significance, in arriving at our audit opinion above, together with our key audit procedures to address thosematters and, as required for public interest entities, our results from those procedures. These matters were addressed, and our results are based onprocedures undertaken, in the context of, and solely for the purpose of, our audit of the financial statements as a whole, and in forming our opinion thereon,and consequently are incidental to that opinion, and we do not provide a separate opinion on these matters.

92
The risk Our response
Valuation of Investment Property,including Investment Propertyunder Construction
Investment Property £1,245.1m(2017: £1,154.4m)
Investment Property UnderConstruction £58.2m (2017: £36.1m)
Refer to page 87 (AuditCommittee Report), note 2(accounting policy) and note 15(financial disclosures).
Subjective Valuation
Investment property fair values are calculated usingactual and subjective assumptions inputs such asstore occupancy, net rent per square foot, discountrates and exit capitalisation rates. For investmentproperty under construction additional estimatesinclude expected costs to complete and the risk ofnot obtaining planning permission for non-consented sites.
The Group employs external valuers to applyprofessional judgement concerning marketconditions and factors impacting individualproperties.
Investment property valuation is a significant andkey risk of material misstatement as the valuationprocess is subjective and inherently judgementalin nature.
The investment market for prime self storage issubject to market uncertainty due to the low volumeof comparable transactions.
Our procedures included:
> Assessing valuer’s credentials: We assessed theexternal valuer’s qualifications and expertise and readtheir terms of engagement with the Group to determinewhether there were any matters that might haveaffected their objectivity or may have imposed scopelimitations upon their work.
> Methodology choice: We read the external valuationreports for 100% of the properties and assessedwhether the valuation approach was in accordance withRICS standards and suitable for use in determining thefinal value for the purpose of the financial statements.
> Personnel interview: We met with the external valuerand the audit committee chairman with our own internalreal estate specialist to discuss the valuation process,key assumptions such as occupancy, capitalisation anddiscount rates, and the rationale behind the moresignificant or unusual valuation movements during theyear.
> Our sector experience: We used our knowledge of theentity, our experience of the real estate industry andobserved industry norms when assessing the keyassumptions and the significant or unusual valuationmovements and for investment property underconstruction we considered the judgement made by thedirectors and external valuers for planning risk for non-consented sites.
> Data provided to the valuer: We performed propertyvisits and tested the current and historical accuracy ofinformation used to generate key inputs to the valuationsuch as store occupancy and net rental income byphysically inspecting a sample of storage units andreviewing a sample of customer storage licenseagreements.
> Independent re-performance: Using our own internallyproduced model and the external valuer andmanagement’s inputs we assessed the reasonablenessof valuation as produced by the external valuer.
> Tests of detail: For investment property underconstruction we tested that the supporting informationfor construction contracts and budgets, which was alsosupplied to the valuer, was consistent with the Group’srecords for example by inspecting original constructioncontracts. We also obtained evidence that planningpermission had been obtained for development sites.
> Assessing Transparency: We assessed the Group’sdisclosures discussing the investment property andinvestment property under construction valuation andtheir sensitivities.
Our results> We found the valuation of investment property and
investment property under construction to beacceptable.
Independent Auditor’s Report to the Members of Big Yellow Group PLC (continued)

93
The risk Our response
Amounts owed by GroupUndertakings
£470.6m (2017: £481.2m)
Refer to note 29 (accountingpolicy) and note 31 (financialdisclosures).
Low risk, high value
The carrying amount of the intra-group debtorbalance represents 95.3% of the Company’s totalassets at 31 March 2018.
Their recoverability is not at a high risk of significantmisstatement or subject to significant judgement.However, due to their materiality in the context ofthe Company financial statements, this isconsidered to be the area that had the greatesteffect on our overall Company audit.
Our procedures included:
> Test of details: We assessed 100% of Group debtors toidentify, with reference to the relevant debtor’s financialstatements/draft balance sheet, whether they have apositive net asset value and therefore coverage of thedebt owed, as well as assessing whether those subsidiarycompanies have historically been profit-making.
> Assessing subsidiary audits: We considered the resultsof the work performed on the subsidiary audits, includingassessing the liquidity of the assets and therefore theability of the subsidiaries to fund the repayment of thereceivable.
Our results> We found the assessment of the recoverability of the
Group debtor balance to be acceptable.
3. Our application of materiality and an overview of the scope of our audit The materiality for the Group financial statements as a whole was set at £9.5m determined with reference to a benchmark of total assets, of which itrepresents 0.69%.
In addition, we applied materiality of £3.0m to all balances and classes of transactions impacting adjusted profit before tax (as reconciled to profit beforetax in note 10 of the financial statements) for which we believe misstatements of lesser amounts than materiality for the financial statements as a wholecould be reasonably expected to influence the Company's members' assessment of the financial performance of the group.
Materiality for the parent Company financial statements as a whole was set at £4.9m, determined with reference to a benchmark of Company total assetsof £493.8m, of which it represents 0.99%.
We agreed to report to the Audit Committee any corrected or uncorrected identified misstatements relating to line items above group profit before taxexceeding £475,000 and those relating to Balance Sheet classification exceeding £1.0m, in addition to other identified misstatements that warrantedreporting on qualitative grounds.
Of the Group’s 22 reporting components, we subjected six to audits for group reporting purposes These group procedures covered 99% of total grouprevenue; 99% of the total profits and losses that made up group profit before tax; and 100% of total group assets.
The remaining 1% total group revenue, 1% of the total profits and losses that made up group profit before tax and 0% of total group assets is representedby 16 reporting components, none of which individually represented more than 1% of any of total group revenue, group profit before tax or total groupassets. For the residual components, we performed analysis at an aggregated Group level to re-examine our assessment that there were no significantrisks of material misstatement within these.
The work on all the components, including the audit of the parent Company, was performed by the Group team at the head office in Bagshot, Surrey.
The Group team used component materialities, which ranged from £0.5m to £7.1m, having regard to the mix of size and risk profile of the Group acrossthe components.
Net Assets
Group materiality
Whole financialstatement materiality£9.5m
Componentmaterialities£7.1m
Misstatementthreshold£0.48m
Net Assets £1,369.8m

Independent Auditor’s Report to the Members of Big Yellow Group PLC (continued)
94
Full scope for group audit purposes 2018
Specified risk-focussed audit procedures 2018
Residual components
99%
4. We have nothing to report on going concern We are required to report to you if:
> we have anything material to add or draw attention to in relation to the Directors’ statement in note 2 to the financial statements on the use of thegoing concern basis of accounting with no material uncertainties that may cast significant doubt over the Group and Company’s use of that basis fora period of at least twelve months from the date of approval of the financial statements; or
> the related statement under the Listing Rules set out on page 38 is materially inconsistent with our audit knowledge.
We have nothing to report in these respects.
5. We have nothing to report on the other information in the Annual Report The Directors are responsible for the other information presented in the Annual Report together with the financial statements. Our opinion on the financialstatements does not cover the other information and, accordingly, we do not express an audit opinion or, except as explicitly stated below, any form ofassurance conclusion thereon.
Our responsibility is to read the other information and, in doing so, consider whether, based on our financial statements audit work, the information thereinis materially misstated or inconsistent with the financial statements or our audit knowledge. Based solely on that work we have not identified materialmisstatements in the other information.
Strategic report and Directors’ report Based solely on our work on the other information:
> we have not identified material misstatements in the strategic report and the Directors’ report; > in our opinion the information given in those reports for the financial year is consistent with the financial statements; and > in our opinion those reports have been prepared in accordance with the Companies Act 2006.
Directors’ remuneration report In our opinion the part of the Directors’ Remuneration Report to be audited has been properly prepared in accordance with the Companies Act 2006.
Disclosures of principal risks and longer-term viability Based on the knowledge we acquired during our financial statements audit, we have nothing material to add or draw attention to in relation to:
> the Directors’ confirmation within the Viability statement on page 38 that they have carried out a robust assessment of the principal risks facing theGroup, including those that would threaten its business model, future performance, solvency and liquidity;
> the Principal Risks and Uncertainties disclosures describing these risks and explaining how they are being managed and mitigated; and > the Directors’ explanation in the Viability statement of how they have assessed the prospects of the Group, over what period they have done so and
why they considered that period to be appropriate, and their statement as to whether they have a reasonable expectation that the Group will be ableto continue in operation and meet its liabilities as they fall due over the period of their assessment, including any related disclosures drawing attentionto any necessary qualifications or assumptions.
Under the Listing Rules we are required to review the Viability statement. We have nothing to report in this respect.
Corporate governance disclosures We are required to report to you if:
> we have identified material inconsistencies between the knowledge we acquired during our financial statements audit and the Directors’ statementthat they consider that the annual report and financial statements taken as a whole is fair, balanced and understandable and provides the informationnecessary for shareholders to assess the Group’s position and performance, business model and strategy; or
> the section of the annual report describing the work of the Audit Committee does not appropriately address matters communicated by us to the AuditCommittee.
Full scope for group audit purposes 2018
Specified risk-focussed audit procedures 2018
Residual components
99%
Full scope for group audit purposes 2018
Specified risk-focussed audit procedures 2018
Residual components
100%
95
We are required to report to you if the Corporate Governance Report does not properly disclose a departure from the eleven provisions of the UK CorporateGovernance Code specified by the Listing Rules for our review.
We have nothing to report in these respects.
6. We have nothing to report on the other matters on which we are required to report by exceptionUnder the Companies Act 2006, we are required to report to you if, in our opinion:
> adequate accounting records have not been kept by the parent Company, or returns adequate for our audit have not been received from branchesnot visited by us; or
> the parent Company financial statements and the part of the Directors’ Remuneration Report to be audited are not in agreement with the accountingrecords and returns; or
> certain disclosures of Directors’ remuneration specified by law are not made; or > we have not received all the information and explanations we require for our audit.
We have nothing to report in these respects.
7. Respective responsibilities Directors’ responsibilitiesAs explained more fully in their statement set out on page 90, the Directors are responsible for: the preparation of the financial statements includingbeing satisfied that they give a true and fair view; such internal control as they determine is necessary to enable the preparation of financial statementsthat are free from material misstatement, whether due to fraud or error; assessing the Group and parent Company’s ability to continue as a going concern,disclosing, as applicable, matters related to going concern; and using the going concern basis of accounting unless they either intend to liquidate theGroup or the parent Company or to cease operations, or have no realistic alternative but to do so.
Auditor’s responsibilities Our objectives are to obtain reasonable assurance about whether the financial statements as a whole are free from material misstatement, whether dueto fraud or other irregularities (see below), or error, and to issue our opinion in an auditor’s report. Reasonable assurance is a high level of assurance, butdoes not guarantee that an audit conducted in accordance with ISAs (UK) will always detect a material misstatement when it exists. Misstatements canarise from fraud, other irregularities or error and are considered material if, individually or in aggregate, they could reasonably be expected to influencethe economic decisions of users taken on the basis of the financial statements.
A fuller description of our responsibilities is provided on the FRC’s website at www.frc.org.uk/auditorsresponsibilities.
Irregularities – ability to detectWe identified areas of laws and regulations that could reasonably be expected to have a material effect on the financial statements from our sectorexperience, and through discussion with the Directors and other management (as required by auditing standards), and from inspection of the group’sregulatory and legal correspondence.
We had regard to laws and regulations in areas that directly affect the financial statements including financial reporting (including related Companylegislation) and taxation legislation. We considered the extent of compliance with those laws and regulations as part of our procedures on the relatedfinancial statement items.
We communicated identified laws and regulations throughout our team and remained alert to any indications of non-compliance throughout the audit.
As with any audit, there remained a higher risk of non-detection of non-compliance with relevant laws and regulations, as these may involve collusion,forgery, intentional omissions, misrepresentations, or the override of internal controls.
8. The purpose of our audit work and to whom we owe our responsibilities This report is made solely to the Company’s members, as a body, in accordance with Chapter 3 of Part 16 of the Companies Act 2006. Our audit work hasbeen undertaken so that we might state to the Company’s members those matters we are required to state to them in an auditor’s report and for no otherpurpose. To the fullest extent permitted by law, we do not accept or assume responsibility to anyone other than the Company and the Company’s members,as a body, for our audit work, for this report, or for the opinions we have formed.
Steve Masters (Senior Statutory Auditor) for and on behalf of KPMG LLP, Statutory Auditor Chartered Accountants Arlington Business Park, Theale, RG7 4SD21 May 2018

Consolidated Statement of Comprehensive IncomeYear ended 31 March 2018
2018 2017Note £000 £000
Revenue 3 116,660 109,070Cost of sales (35,674) (34,075)
Gross profit 80,986 74,995Administrative expenses (10,065) (9,679)
Operating profit before gains on property assets 70,921 65,316Gain on the revaluation of investment properties 14a,15 71,635 43,706Gain on part disposal of investment property 14a 650 –
Operating profit 143,206 109,022Share of profit of associates 14d 1,370 1,442Investment income – interest receivable 7 244 356 – fair value movement on derivatives 7, 18 1,294 719Finance costs 8 (11,975) (11,756)
Profit before taxation 134,139 99,783Taxation 9 (597) (272)
Profit for the year (attributable to equity shareholders) 5 133,542 99,511
Total comprehensive income for the year (attributable to equity shareholders) 133,542 99,511
Basic earnings per share 12 85.0p 63.6p
Diluted earnings per share 12 84.4p 63.1p
EPRA earnings per share are shown in Note 12.
All items in the consolidated statement of comprehensive income relate to continuing operations.
96

97
Consolidated Balance SheetYear ended 31 March 2018
2018 2017Note £000 £000
Non-current assetsInvestment property 14a 1,245,142 1,154,390Investment property under construction 14a 58,157 36,115Interests in leasehold property 14a 22,929 23,601Plant, equipment and owner-occupied property 14b 3,092 3,216Intangible assets 14c 1,433 1,433Investment in associates 14d 9,276 7,452Capital Goods Scheme receivable 16 2,385 4,091Derivative financial instruments 18c 1,704 –
1,344,118 1,230,298
Current assetsInventories 283 283Trade and other receivables 16 18,586 18,042Cash and cash equivalents 6,853 6,906
25,722 25,231
Total assets 1,369,840 1,255,529
Current liabilitiesTrade and other payables 17 (36,828) (36,935)Borrowings 19 (2,474) (2,356)Obligations under finance leases 21 (2,061) (2,005)
(41,363) (41,296)
Non-current liabilitiesDerivative financial instruments 18c – (2,964)Borrowings 19 (326,461) (299,323)Obligations under finance leases 21 (20,868) (21,596)
(347,329) (323,883)
Total liabilities (388,692) (365,179)
Net assets 981,148 890,350
EquityShare capital 22 15,857 15,788Share premium account 46,362 45,462Reserves 918,929 829,100
Equity shareholders’ funds 981,148 890,350
The financial statements were approved by the Board of Directors and authorised for issue on 21 May 2018. They were signed on its behalf by:
James Gibson John TrotmanDirector Director
Company Registration No. 03625199

Consolidated Statement of Changes in EquityYear ended 31 March 2018
Share Other non- CapitalShare premium distributable redemption Retained Owncapital account reserve reserve earnings shares Total£000 £000 £000 £000 £000 £000 £000
At 1 April 2017 15,788 45,462 74,950 1,795 753,374 (1,019) 890,350Total comprehensive income for the year – – – – 133,542 – 133,542Issue of share capital 69 900 – – – – 969Dividend – – – – (46,183) – (46,183)Credit to equity for equity-settledshare based payments – – – – 2,470 – 2,470
At 31 March 2018 15,857 46,362 74,950 1,795 843,203 (1,019) 981,148
The other non-distributable reserve arose in the year ended 31 March 2015 following the placing of 14.35 million ordinary shares.
Year ended 31 March 2017Share Other non- Capital
Share premium distributable redemption Retained Owncapital account reserve reserve earnings shares Total
£000 £000 £000 £000 £000 £000 £000
At 1 April 2016 15,737 45,227 74,950 1,795 692,697 (1,019) 829,387Total comprehensive income for the year – – – – 99,511 – 99,511Issue of share capital 51 235 – – – – 286Dividend – – – – (41,158) – (41,158)Credit to equity for equity-settledshare based payments – – – – 2,324 – 2,324
At 31 March 2017 15,788 45,462 74,950 1,795 753,374 (1,019) 890,350
98

99
Consolidated Cash Flow StatementYear ended 31 March 2018
2018 2017Note £000 £000
Cash generated from operations 26 73,457 67,209Interest paid (9,724) (10,980)Interest received 13 16Tax paid (769) (271)
Cash flows from operating activities 62,977 55,974
Investing activitiesSale of surplus land – 300Acquisition of Lock and Leave (net of cash acquired) – (14,239)Purchase of non-current assets (41,959) (6,338)Proceeds on part disposal of investment property 650 –Receipts from Capital Goods Scheme 2,786 2,917Investment in associate 14d (900) –Dividend received from associates 14d 446 396
Cash flows from investing activities (38,977) (16,964)
Financing activitiesIssue of share capital 969 286Payment of finance lease liabilities (1,109) (1,196)Equity dividends paid 11 (46,183) (41,158)Payment to cancel interest rate derivative (3,374) –Increase/(decrease) in borrowings 25,644 (7,243)
Cash flows from financing activities (24,053) (49,311)
Net decrease in cash and cash equivalents (53) (10,301)Opening cash and cash equivalents 6,906 17,207
Closing cash and cash equivalents 6,853 6,906

1. GENERAL INFORMATIONBig Yellow Group PLC is a Company incorporated in the United Kingdom under the Companies Act 2006. The address of the registered office is 2 The Deans,Bridge Road, Bagshot, Surrey, GU19 5AT. The nature of the Group’s operations and its principal activities are set out in note 4 and in the Strategic Reporton pages 16 to 28.
2. SIGNIFICANT ACCOUNTING POLICIESBasis of preparation of financial statementsThe financial statements have been prepared in accordance with International Financial Reporting Standards (“IFRS”) as adopted for use in the EuropeanUnion in accordance with EU law (IAS regulation EC1606/2002) and those parts of the Companies Act 2006 applicable to companies reporting under IFRS,and therefore the Group financial statements comply with Article 4 of the EU IAS Regulation.
The financial statements are presented in Sterling, being the currency of the primary economic environment in which the Group operates. Unless otherwisestated, figures are rounded to the nearest thousand.
The accounting policies adopted are consistent with those of the previous financial year, except as described in the following sections.
Amendments to IFRSs that are mandatorily effective for the current yearIn the current year, the Group has applied a number of amendments to IFRSs issued by the International Accounting Standards Board (IASB). Their adoptionhas not had any material impact on the disclosures or on the amounts reported in these financial statements.
Amendments to IAS 7 Statement of Cash FlowAmendments to IAS 12 Income TaxesIFRS 12 Disclosure of interests in other entities
New and revised IFRSs in issue but not yet effectiveAt the date of authorisation of these financial statements, the Group has not applied the following new and revised IFRSs that have been issued but arenot yet effective:
IFRS 9 Financial InstrumentsIFRS 15 Revenue from Contracts with CustomersIFRS 16 LeasesIFRS 2 (amendments) Classification and Measurement of Share-based Payment TransactionsIAS 7 (amendments) Disclosure InitiativeIAS 12 (amendments) Recognition of Deferred Tax Assets for Unrealised LossesIFRS 10 and IAS 28 (amendments) Sale or Contribution of Assets between an Investor and its Associate or Joint Venture
None of these standards not yet effective are expected to have a significant impact on the Financial Statements of the Group or Company. Certain Standardswhich might have an impact are discussed below.
IFRS 9 – Financial InstrumentsIFRS 9 covers the classification, measurement and derecognition of financial assets and liabilities. It also introduces a new impairment model for financialassets and new rules for hedge accounting. The standard is applicable for financial years commencing on or after 1 January 2018, and hence the yearending 31 March 2019 will be the first applicable year for the Group.
There will be no impact on the Group’s accounting for financial liabilities, as the new requirements only affect the accounting for financial liabilities thatare designated at fair value through the income statement and the Group does not have any such liabilities.
The impairment model under IFRS 9 requires the recognition of impairment provisions based on expected credit losses (“ECL”) rather than only incurredcredit losses as is the case under IAS 39. The significant financial assets held by the Group that will be impacted by the impairment losses recognisedunder IFRS 9 are trade receivables.
Trade receivables in the balance sheet at 31 March 2018 were £3.7 million with an impairment provision recognised under IAS 39 of £0.01 million. Asdescribed in note 16, the Group’s exposure to credit risk is low. The Directors have assessed the impact of impairment losses recognised for tradereceivables under IFRS 9 at 31 March 2018 based on actual losses experienced over the past five years. Following this assessment, the impact andvolatility on impairment losses recognised under IFRS 9 is estimated to be immaterial.
The Company holds intercompany loan and receivables balances with the subsidiaries of the Group as disclosed in Note 31. The Directors do not estimatethere to be a material impact on the Company only Financial Statements from the recognition of impairment provisions for the loans and receivablesunder IFRS 9 compared to accounting for it held under IAS 39.
The new standard introduces enhanced disclosure requirements and changes in presentation.
Notes to the Financial StatementsYear ended 31 March 2018
100

101
2. SIGNIFICANT ACCOUNTING POLICIES (continued)
IFRS 15 – Revenue RecognitionIFRS 15 replaces IAS 18 and governs the recognition of revenue. The standard is applicable for financial years commencing on or after 1 January 2018,and hence the year ending 31 March 2019 will be the first applicable year for the Group. The standard is based on the principle that revenue is recognisedwhen control of a good or service transfers to a customer.
The Group’s assessment is that IFRS 15 will apply to all its streams of revenue, although it is estimated that there will not be a material change in theamounts and timing of revenue recognised following the adoption of the standard. Each customer license agreement is terminable on seven days’ noticeby the customer at any time and in specific circumstances by the Group. This is an indicator IFRS 16 would not apply. Each licence has a discreteperformance obligation with revenue recognised from day one. The opening offer discount was also assessed under IFRS 15 and the Group has concludedthat the accounting for this will be unchanged following the introduction of IFRS 15 that is to spread it evenly over the period of the opening offer discount.
The standard also introduces enhanced disclosure requirements and changes in presentation.
IFRS 16 – LeasesIFRS 16 results in almost all leases being recognised on the balance sheet for a lessee, as the distinction between operating and finance leases is removed.The standard is applicable for financial years commencing on or after 1 January 2019, and hence the year ending 31 March 2020 will be the first applicableyear for the Group.
Under the standard, an asset, representing the right to use the leased item, and a financial liability to pay rentals are recognised. The only exceptions areshort-term and low-value leases. The new standard changes the allocation of the finance lease payments over the length of the lease, resulting in therental payments paid being more front ended in the income statement. The accounting for lessors will not significantly change.
The Group already classifies its leasehold stores as finance leases. The income statement charge for these leases in the year was £2.1 million. On adoptingIFRS 16, the changes in the way the standard allocates the finance lease payments, would, we estimate, increase the rent charge in the first year ofadoption by £0.3 million to £2.4 million. The Group has a limited number of operating leases, with non-cancellable future lease payments of £1.1 millionat 31 March 2018. These will be brought onto balance sheet on adoption of the standard.
Basis of accountingThe financial statements have been prepared on the historical cost basis, except for the revaluation of investment properties and derivative financialinstruments. Historical cost is generally based on the fair value of the consideration given in exchange for the assets. The principal accounting policiesadopted, which have been applied consistently to the results, other gains and losses, assets, liabilities and cash flows of entities included in theconsolidated financial statements in the current and preceding year, are set out below:
Going concernA review of the Group’s business activities, together with the factors likely to affect its future development, performance and position are set out in theStrategic Report. The financial position of the Group, its cash flows, liquidity position and borrowing facilities are shown in the balance sheet, cash flowstatement and accompanying notes to the financial statements. Further information concerning the Group’s objectives, policies and processes for managingits capital; its financial risk management objectives; details of its financial instruments and hedging activities; and its exposures to credit risk and liquidityrisk can be found in the Strategic Report and in the notes to the financial statements.
After reviewing Group and Company cash balances, borrowing facilities, forecast valuation movements and projected cash flows, the Directors believethat the Group and Company have adequate resources to continue operations for the foreseeable future. In reaching this conclusion the Directors havehad regard to the Group’s operating plan and budget for the year ending 31 March 2019 and projections contained in the longer term business plan whichcovers the period to March 2022. The Directors have carefully considered the Group’s trading performance and cash flows as a result of the uncertainglobal economic environment and the other principal risks to the Group’s performance, and are satisfied with the Group’s positioning. For this reason,they continue to adopt the going concern basis in preparing the financial statements.
Basis of consolidationThe consolidated financial statements incorporate the financial statements of the Company and entities controlled by the Company made up to 31 March eachyear. Control is achieved where the Company has the power to direct the relevant activities of an investee entity so as to obtain benefits from its activities.
The Group consolidates the financial results and balance sheets of Big Yellow Group PLC and all of its subsidiaries at the year end using acquisitionaccounting principles. All intra-group transactions, balances, income and expenses are eliminated on consolidation. Where necessary, adjustments aremade to the financial statements of subsidiaries to bring the accounting policies used into line with those used by the Group. The results of subsidiariesacquired or disposed of during the year are included in the consolidated statement of comprehensive income from the effective date of acquisition or upto the effective date of disposal, as appropriate.
The acquisition of subsidiaries is accounted for using the purchase method. The cost of the acquisition is measured at the aggregate of the fair values, atthe date of exchange, of assets given, liabilities incurred or assumed, and equity instruments issued by the Group in exchange for control of the acquiree.Any costs directly attributable to the business combination are recognised in the income statement. The acquiree’s identifiable assets, liabilities andcontingent liabilities that meet the conditions for recognition under IFRS 3 are recognised at their fair value at the acquisition date, except for non-currentassets (or disposal groups) that are classified as held for sale in accordance with IFRS 5 Non-Current Assets Held for Sale and Discontinued Operations,which are recognised and measured at the lower of their carrying amount and fair value less costs to sell (excluding investment property which ismeasured at fair value).
2. SIGNIFICANT ACCOUNTING POLICIES (continued)
GoodwillGoodwill arising on acquisition is recognised as an asset and initially measured at cost, being the excess of the cost of the business combination overthe Group’s interest in the net fair value of the identifiable assets, liabilities and contingent liabilities recognised. If, after reassessment, the Group’s interestin the net fair value of the acquiree’s identifiable assets, liabilities and contingent liabilities exceeds the cost of the business combination, the excess isrecognised immediately in the statement of comprehensive income. Goodwill is reviewed for impairment at least annually. Any impairment is recognisedimmediately in the statement of comprehensive income and is not subsequently reversed.
Intangible assetsIntangible assets acquired in a business combination and recognised separately from goodwill are initially recognised at their fair value at their acquisitiondate (which is typically regarded as their cost). Subsequent to their initial recognition, intangible assets with indefinite useful lives are carried at costless accumulated impairment losses. Intangible assets with finite useful lives that are acquired separately are carried at cost less accumulatedamortisation and accumulated impairment losses. Amortisation is recognised on a straight line basis over their estimated useful lives. The estimateduseful life and amortisation method are reviewed at the end of each reporting period with the effect of any changes in estimate being accounted for on aprospective basis.
Investment in associatesAn associate is an entity over which the Group is in a position to exercise significant influence, but not control or joint control, through participation in thefinancial and operating policy decisions of the investee. Significant influence is the power to participate in the financial and operating policy decisions ofthe investee but is not control or joint control over those policies.
The results and assets and liabilities of associates are incorporated in these financial statements using the equity method of accounting except whenclassified as held for sale. Investments in associates are carried in the balance sheet at cost as adjusted by post-acquisition changes in the Group’s shareof the net assets of the associate, less any impairment in the value of individual investments. Losses of an associate in excess of the Group’s interest inthat associate (which includes any long-term interests that, in substance, form part of the Group’s net investment in the associate) are recognised onlyto the extent that the Group has incurred legal or constructive obligations or made payments on behalf of the associate. Where necessary, adjustmentsare made to the financial statements of associates to bring the accounting policies used into line with those used by the Group. Where a Group Companytransacts with an associate of the Group, profits and losses are eliminated to the extent of the Group’s interest in the relevant associate. Losses mayprovide evidence of an impairment of the asset transferred in which case appropriate provision is made for impairment.
Revenue recognitionRevenue represents amounts derived from the provision of services which fall within the Group’s ordinary activities after deduction of trade discountsand any applicable value added tax. Self storage income is recognised over the period for which the storage room is occupied by the customer on a straight-line basis. The opening offer discount of 50% off for up to 8 weeks is spread evenly over the term of the discount period.
Other storage related income comprises:
> insurance income which is recognised on a straight line basis over the period a customer occupies their room; and> packing material sales are recognised at the point of sale, as there is no further ongoing performance obligation beyond the point of sale.
The Group recognises non-storage income, which is principally rental income from tenants of properties awaiting development, on a straight-line basisover the period in which it is earned.
Management fees earned are recognised on a straight-line basis over the period for which the services are provided. Fees earned from associates arerecognised in full in the income statement through revenue with the proportionate debit shown in the share of profit of associate.
Operating leasesRentals payable under operating leases are charged to the statement of comprehensive income on a straight-line basis over the term of the relevant lease.In the event that lease incentives are received to enter into operating leases, such incentives are recognised as a liability. The aggregate benefit ofincentives is recognised as a reduction of rental expense on a straight-line basis, except where another systematic basis is more representative of thetime pattern in which economic benefits from the leased asset are consumed.
BorrowingsInterest-bearing loans and overdrafts are measured at fair value, net of direct issue costs. Premiums payable on settlement or redemption and directissue costs are accounted for on an accruals basis in the statement of comprehensive income using the effective interest rate method and are added tothe carrying value amount of the instrument to the extent that they are not settled in the period in which they arise. Borrowings are subsequently heldat amortised cost.
Notes to the Financial Statements (continued)Year ended 31 March 2018
102

103
2. SIGNIFICANT ACCOUNTING POLICIES (continued)
Finance costs and incomeAll borrowing costs are recognised in the statement of comprehensive income in the period in which they are incurred, unless the costs are incurred aspart of the development of a qualifying asset, when they will be capitalised. Commencement of capitalisation is the date when the Group incurs expenditurefor the qualifying asset, incurs borrowing costs and undertakes activities that are necessary to prepare the assets for their intended use when it isprobable that they will result in future economic benefits to the entity and the costs can be measured reliably. In the case of suspension of activitiesduring extended periods, the Group suspends capitalisation. The Group ceases capitalisation of borrowing costs when substantially all of the activitiesnecessary to prepare the asset for use are complete, typically when a store opens.
Interest income is accrued on a time basis, by reference to the principal outstanding and the effective interest rate applicable, which is the rate thatexactly discounts estimated future cash receipts through the expected life of the financial asset to that asset’s net carrying amount.
Debt modificationA change in debt carried at amortised cost that is considered substantial is accounted for as an extinguishment, which means that the original debt isderecognised, with a gain or loss is recorded in the income statement, and a new financial liability recorded based on the new terms. If the change is notconsidered to be substantial (substantial is defined as a change in the net present value of the cash flows of more than 10%), the original debt remainson the books and there is no current income statement impact.
Non-recurring items of income and expenditureNon-recurring items of income and expenditure are recognised on the basis that they are unusual in nature and large in scale.
Operating profitOperating profit is stated after gains and losses on surplus land, movements on the revaluation of investment properties and before the share of resultsof associates, investment income and finance costs.
TaxationThe tax expense represents the sum of the tax currently payable and deferred tax.
The tax currently payable is based on taxable profit for the year. Taxable profit differs from the net profit as reported in the statement of comprehensiveincome because it excludes items of income or expense that are taxable or deductible in other years and it further excludes items that are never taxableor deductible. The Group’s liability for current tax is calculated using tax rates that have been enacted or substantively enacted by the balance sheet date.
Deferred tax is the tax expected to be payable or recoverable on differences between the carrying amounts of assets and liabilities in the financialstatements and the corresponding tax bases used in the computation of taxable profit, and is accounted for using the balance sheet liability method.Deferred tax liabilities are generally recognised for taxable temporary differences and deferred tax assets are recognised to the extent that it is probablethat taxable profits will be available against which deductible temporary differences can be utilised. Such assets and liabilities are not recognised if thetemporary differences arise from goodwill or from the initial recognition (other than in a business combination) of other assets and liabilities in a transactionthat affects neither the tax profit nor the accounting profit.
Deferred tax liabilities are recognised for taxable temporary differences arising on investments in subsidiaries and associates except where the Group isable to control the reversal of the temporary difference and it is probable that the temporary difference will not reverse in the foreseeable future.
The carrying amount of deferred tax assets is reviewed at each balance sheet date and reduced to the extent that it is no longer probable that sufficienttaxable profits will be available to allow all or part of the asset to be recovered.
Deferred tax is calculated at the tax rates substantively enacted at the balance sheet date that are expected to apply in the period when the liability issettled or the asset is realised. Deferred tax is charged or credited in the statement of comprehensive income, except when it relates to items charged orcredited directly to equity, in which case the deferred tax is also dealt with in equity.
Deferred tax assets and liabilities are offset as there is a legally enforceable right to set off current tax assets against current tax liabilities.
Plant, equipment and owner occupied propertyAll property, plant and equipment, not classified as investment property, is carried at historic cost less depreciation and any recognised impairment loss.
Depreciation is charged so as to write off the cost or valuation of assets, other than land and investment properties, less any residual value over theirestimated useful lives, using the straight-line method, on the following bases:
Freehold property 50 yearsLeasehold improvements over period of the leasePlant and machinery 10 yearsMotor vehicles 4 yearsFixtures and fittings 5 yearsComputer equipment 3 to 5 years
The gain or loss arising on the disposal or retirement of an asset is determined as the difference between the sales proceeds and the carrying amount ofthe asset and is recognised in the income statement.

2. SIGNIFICANT ACCOUNTING POLICIES (continued)
Investment propertyThe criteria used to distinguish investment property from owner-occupied property is to consider whether the property is held for rental income and/orfor capital appreciation. Where this is the case, the Group recognises these owned or leased properties as investment properties. Investment property isinitially recognised at cost and revalued at the balance sheet date to fair value as determined by professionally qualified external valuers. In accordancewith IAS 40, investment property held as a leasehold is stated gross of the recognised finance lease liability.
Gains or losses arising from the changes in fair value of investment property are included in the statement of comprehensive income for the period inwhich they arise. In accordance with IAS 40, as the Group uses the fair value model, no depreciation is provided in respect of investment propertiesincluding integral plant.
Leasehold properties that are leased under operating leases are classified as investment properties and included in the balance sheet at fair value. Theobligation to the lessor for the buildings element of the leasehold is included in the balance sheet at the present value of the minimum lease paymentsat inception, and is shown within note 21. Lease payments are apportioned between finance charges and a reduction of the outstanding lease obligationso as to achieve a constant rate of interest on the remaining balance of the liability.
Investment property under constructionInvestment property under construction is initially recognised at cost and revalued at the balance sheet date to fair value as determined by professionallyqualified external valuers.
Gains or losses arising from the changes in fair value of investment property under construction are included in the statement of comprehensive incomein the period in which they arise.
Impairment of assetsAt each balance sheet date, the Group reviews the carrying amounts of its assets (excluding investment property and derivative financial instrumentswhich are carried at fair value) to determine whether there is any indication that those assets have suffered an impairment loss. If any such indicationexists, the recoverable amount of the asset is estimated in order to determine the extent of the impairment loss (if any). The recoverable amount is thehigher of an asset’s net selling price and its value-in-use (i.e. the net present value of its future cash flows discounted at the Group’s average pre-taxinterest rate that reflects the borrowing costs and risk for the asset).
InventoriesInventories, representing the cost of packing materials, are stated at the lower of cost and net realisable value.
Financial instrumentsFinancial assets and financial liabilities are recognised on the Group’s balance sheet when the Group becomes a party to the contractual provisions ofthe instrument. Financial assets at FVTPL are stated at fair value, with any gains or losses arising on re-measurement recognised in the income statement.The net gain or loss recognised in the income statement incorporates any dividend or interest earned on the financial asset and is included in the ‘othergains and losses’ line item in the income statement.
A – Derivative financial instruments and hedge accountingThe Group’s activities expose it primarily to the financial risks of interest rates. The Group uses interest rate swap contracts to hedge these exposures.The Group does not use derivative financial instruments for speculative purposes. The use of financial derivatives is governed by the Group’s policiesapproved by the Board of Directors. The policy in respect of interest rates is to maintain a balance between flexibility and the hedging of interest rate risk.
Derivatives are initially recognised at fair value and are subsequently reviewed at each balance sheet date. The fair value of interest rate derivatives atthe reporting date is determined by discounting the future cash flows using the forward curves at the reporting date and the credit risk inherent in thecontract.
Changes in the fair value of derivative financial instruments are recognised in the statement of comprehensive income as they arise. The Group has notadopted hedge accounting. Derivatives embedded in other financial instruments or other host contracts are treated as separate derivatives when theirrisks and characteristics are not closely related to those of host contracts and the host contracts are not carried at fair value with unrealised gains orlosses reported in the statement of comprehensive income.
B – Loans and receivablesTrade receivables, loans, and other receivables that have fixed or determinable payments that are not quoted in an active market are classified as loansand receivables. Loans and receivables are initially recognised at fair value and subsequently measured at amortised cost using the effective interestmethod, less any impairment. Interest income is recognised by applying the effective interest rate, except for short-term receivables when the recognitionof interest would be immaterial.
Notes to the Financial Statements (continued)Year ended 31 March 2018
104

105
2. SIGNIFICANT ACCOUNTING POLICIES (continued)
C – Impairment of financial assetsFinancial assets are assessed for indicators of impairment at each balance sheet date. Financial assets are impaired where there is objective evidencethat, as a result of one or more events that occurred after the initial recognition of the financial asset, the estimated future cash flows of the investmenthave been impacted. The carrying amount of the financial asset is reduced by the impairment loss directly for all financial assets with the exception oftrade receivables, where the carrying amount is reduced through the use of an allowance account. When a trade receivable is considered uncollectible,it is written off against the allowance account. Subsequent recoveries of amounts previously written off are credited against the allowance account.Changes in the carrying amount of the allowance account are recognised in the income statement.
D – Cash and cash equivalentsCash and cash equivalents comprises cash on hand and demand deposits, and other short term highly liquid investments that are readily convertible toa known amount of cash and are subject to an insignificant risk of changes in value. The carrying amounts of these assets approximates to the fair value.
E – Financial liabilities and equityFinancial liabilities and equity instruments are classified according to the substance of the contractual arrangements entered into.
F – Equity instrumentsEquity instruments issued by the Company are recorded at the proceeds received, net of direct issue costs.
G – Trade payablesTrade payables are not interest bearing and are initially stated at fair value and subsequently recorded measured at amortised cost.
Retirement benefit costsPension costs represent contributions payable to defined contribution schemes and are charged as an expense to the statement of comprehensive incomeas they fall due. The assets of the schemes are held separately from those of the Group.
Share-based paymentsThe Group issues equity-settled share-based payments to certain employees. These are measured at fair value at the date of grant. The fair valuedetermined at the grant date of the share-based payment is expensed on a straight-line basis over the vesting period, based on the Group’s estimate ofshares that will eventually vest.
Fair value is measured by use of the Black-Scholes model and excludes the effect of non-market based vesting conditions. The expected life used in themodel has been adjusted, based on management’s best estimate, for the effects of non-transferability, exercise restrictions, and behavioural considerations.At each balance sheet date, the Group revises its estimate of the number of equity instruments expected to vest as a result of the effect of non-marketbased vesting conditions. The impact of the revision of the original estimates, if any, is recovered in the income statement such that the cumulativeexpenses reflects the revised estimate with a corresponding adjustment to equity reserves.
For cash-settled share-based payments, a liability is recognised for the goods or services acquired, measured initially at the fair value of the liability. Ateach balance sheet date until the liability is settled, and at the date of settlement, the fair value of the liability is re-measured, with any changes in fairvalue recognised in the income statement for the year.
Critical accounting estimates and judgementsIn the application of the Group’s accounting policies, which are described above, the Directors are required to make judgements, estimates and assumptionsabout the carrying amounts of assets and liabilities that are not readily apparent from other sources. The estimates and associated assumptions arebased on historical experience and other factors that are considered to be relevant. Actual results may differ from these estimates.
The estimates and underlying assumptions are reviewed on an ongoing basis. Revisions to accounting estimates are recognised in the period in whichthe estimate is revised if the revision affects only that period, or in the period of the revision and future periods if the revision affects both current andfuture periods.
Estimate of fair value of Investment Properties and Investment Property under Construction(critical accounting estimate)The Group’s self storage centres and stores under development are valued using a discounted cash flow methodology which is based on projections of netoperating income. The Group employs expert external valuers, Cushman & Wakefield LLP, who report on the values of the Group’s stores on an annual basis.The stores within the Armadillo Partnerships are valued by Jones Lang LaSalle. The principal assumptions underlying the estimation of the fair value arethose related to: stabilised occupancy levels; expected future growth in storage rents; capitalisation rates; and discount rates. A more detailed explanationof the background and methodology adopted in the valuation of the Group’s investment properties is set out in note 15 to the financial statements.
Judgement of business combinationsThe Directors assess whether the acquisition of property through the purchase of a corporate vehicle should be accounted for as an asset purchase or abusiness combination. Where the acquired corporate vehicle is an integrated set of activities and assets that is capable of being conducted and managedto provide a return to investors, the transaction is accounted for as a business combination. Where there are no such significant items, the transaction istreated as an asset purchase. The Directors assess when the risks and rewards associated with an acquisition or disposal have transferred. There havebeen no business combinations in the year.

Notes to the Financial Statements (continued)Year ended 31 March 2018
106
3. REVENUEAnalysis of the Group’s operating revenue can be found below and in the Portfolio Summary on page 20.
2018 2017£000 £000
Open storesSelf storage income 97,717 91,600Other storage related income 16,494 15,189Ancillary store rental income 524 526
114,735 107,315Other revenueNon-storage income 950 885Management fees earned 975 870
Total revenue 116,660 109,070
Non-storage income derives principally from rental income earned from tenants of properties awaiting development.
4. SEGMENTAL INFORMATIONIFRS 8 requires operating segments to be identified on the basis of internal reports about components of the Group that are regularly reviewed by theChief Executive to allocate resources to the segments and to assess their performance. Given the nature of the Group’s business, there is one segment,which is the provision of self storage and related services.
Revenue represents amounts derived from the provision of self storage and related services which fall within the Group's ordinary activities after deductionof trade discounts and value added tax. The Group’s net assets, revenue and profit before tax are attributable to one activity, the provision of self storageand related services. These all arise in the United Kingdom in the current year and prior year.
5. PROFIT FOR THE YEARa) Profit for the year has been arrived at after charging/(crediting):
2018 2017£000 £000
Depreciation of plant, equipment and owner-occupied property 729 738Depreciation of finance lease capital obligations 1,109 1,196Gain on the revaluation of investment property (71,635) (43,706)Profit on part disposal of investment property (650) –Cost of inventories recognised as an expense 1,043 1,035Employee costs (see note 6) 16,306 15,622Operating lease rentals 127 133
b) Analysis of auditor’s remuneration:2018 2017£000 £000
Fees payable to the Company’s auditor for the audit of the Company’s annual accounts 156 156Fess payable to the Company’s auditor for the subsidiaries’ annual accounts 32 30
Total audit fees 188 186
Audit related assurance services – interim review 30 31Tax advisory services – 19Other assurance services – assurance of CSR report – 22Other services – planning consultancy – 11Other services – 2
Total non-audit fees 30 85
Fees payable to KPMG LLP and their associates for non-audit services to the Company are not required to be disclosed because the consolidatedfinancial statements are required to disclose such fees on a consolidated basis. Fees charged by KPMG LLP to the Group’s associates, ArmadilloStorage Holding Company Limited and Armadillo Storage Holding Company 2 Limited in the year amounted to £45,000 which all related to auditservices. The prior year audit fees and non-audit fees disclosed were payable to Deloitte LLP.

107
6. EMPLOYEE COSTSThe average monthly number of full-time equivalent employees (including Executive Directors) was:
2018 2017Number Number
Sales 284 279Administration 51 50
335 329
At 31 March 2018 the total number of Group employees was 375 (2017: 361).2018 2017£000 £000
Their aggregate remuneration comprised:Wages and salaries 11,377 10,990Social security costs 1,913 1,783Other pension costs 546 525Share-based payments 2,470 2,324
16,306 15,622
Details of Directors’ Remuneration is given on pages 66 to 85. The Directors are the only employees assessed as key management personnel.
7. INVESTMENT INCOME2018 2017£000 £000
Bank interest receivable 13 16Unwinding of discount on Capital Goods Scheme receivable 231 340
Total interest receivable 244 356
Change in fair value of interest rate derivatives 1,294 719
Total investment income 1,538 1,075
8. FINANCE COSTS2018 2017£000 £000
Interest on bank borrowings 9,817 10,953Capitalised interest (360) (128)Interest on obligations under finance leases 992 931
Total interest payable 10,449 11,756
Refinancing costs 1,526 –
Total finance costs 11,975 11,756
The refinancing costs relate to the unamortised loan arrangement costs of the previous bank facility which was extinguished, and the write-off of thecosts of the new bank facility in accordance with IAS 39.

Notes to the Financial Statements (continued)Year ended 31 March 2018
108
9. TAXATIONThe Group converted to a REIT in January 2007. As a result the Group does not pay UK corporation tax on the profits and gains from its qualifying rentalbusiness in the UK provided that it meets certain conditions. Non-qualifying profits and gains of the Group are subject to corporation tax as normal.The Group monitors its compliance with the REIT conditions. There have been no breaches of the conditions to date.
Finance (No.2) Bill 2015 provides that the rate of corporation tax for the 2017 Financial Year (commencing 1 April 2017) would be 19% and that the ratefrom 1 April 2020 will be 18%. At Budget 2016, the government announced a further reduction to the Corporation Tax main rate (for all profits except ringfence profits) for the year starting 1 April 2020, setting the rate at 17%. This rate was incorporated in Finance Act 2016 which was fully enacted on15 September 2016.
2018 2017£000 £000
UK current tax:– Current year 546 417– Prior year 51 (145)
597 272
A reconciliation of the tax charge is shown below:2018 2017£000 £000
Profit before tax 134,139 99,783
Tax charge at 19% (2017 – 20%) thereon 25,486 19,957Effects of:Revaluation of investment properties (13,734) (8,741)Share of profit of associates (260) (288)Other permanent differences (1,374) (1,242)Profits from the tax exempt business (9,176) (8,791)Utilisation of brought forward losses (11) –Movement on other unrecognised deferred tax assets (385) (478)
Current year tax charge 546 417Prior year adjustment 51 (145)
Total tax charge 597 272
At 31 March 2018 the Group has unutilised tax losses of £32.1 million (2017: £32.6 million) available for offset against certain types of future taxableprofits. All losses can be carried forward indefinitely.
10. ADJUSTED PROFIT2018 2017£000 £000
Profit before tax 134,139 99,783Gain on revaluation of investment properties – wholly owned (71,635) (43,706) – in associate (net of deferred tax) (724) (756)Change in fair value of interest rate derivatives – Group (1,294) (719) – in associate (60) 8Gain on part disposal of investment property (650) –Prior period VAT recovery – (328)Acquisition costs written off – 296Refinancing costs 1,526 –Share of associate acquisition costs written off 120 63
Adjusted profit before tax 61,422 54,641Tax (597) (272)
Adjusted profit after tax 60,825 54,369

109
10. ADJUSTED PROFIT (continued)Adjusted profit before tax which excludes gains and losses on the revaluation of investment properties, changes in fair value of interest rate derivatives,net gains and losses on disposal of investment property, and non-recurring items of income and expenditure have been disclosed as, in the Board’s view,this provides a clearer understanding of the Group’s underlying trading performance.
The refinancing costs of £1.5 million relate to the unamortised loan arrangement costs of the previous bank facility, and the write-off of the costs of thenew bank facility in accordance with IAS 39.
11. DIVIDENDS2018 2017£000 £000
Amounts recognised as distributions to equity holders in the year:Final dividend for the year ended 31 March 2017 of 14.1p (2016: 12.8p) per share. 22,107 20,003Interim dividend for the year ended 31 March 2018 of 15.3p (2017: 13.5p) per share. 24,076 21,155
46,183 41,158
Proposed final dividend for the year ended 31 March 2018 of 15.5p (2017: 14.1p) per share. 24,417 22,107
Subject to approval by shareholders at the Annual General Meeting to be held on 19 July 2018, the final dividend will be paid on 27 July 2018. The ex-divdate is 21 June 2018 and the record date is 22 June 2018.
The Property Income Dividend (“PID”) payable for the year is 27.5 pence per share (2017: 24.0 pence per share).
12. EARNINGS PER SHARE
Year ended 31 March 2018 Year ended 31 March 2017Earnings Shares Pence per Earnings Shares Pence per
£m million share £m million share
Basic 133.5 157.1 85.0 99.5 156.5 63.6Dilutive share options – 1.0 (0.6) – 1.2 (0.5)
Diluted 133.5 158.1 84.4 99.5 157.7 63.1
Adjustments:Gain on revaluation of investment properties (71.6) – (45.3) (43.7) – (27.7)Change in fair value of interest rate derivatives (1.3) – (0.8) (0.7) – (0.4)Gain on part disposal of investment property (0.6) – (0.4) – – –Acquisition costs written off – – – 0.3 – 0.2Prior period VAT recovery – – – (0.3) – (0.2)Refinancing costs 1.5 – 1.0 – – –Share of associate non-recurring gains and losses (0.7) – (0.4) (0.7) – (0.5)
EPRA – diluted 60.8 158.1 38.5 54.4 157.7 34.5
EPRA – basic 60.8 157.1 38.7 54.4 156.5 34.8
The calculation of basic earnings is based on profit after tax for the year. The weighted average number of shares used to calculate diluted earnings pershare has been adjusted for the conversion of share options.
EPRA earnings and earnings per ordinary share have been disclosed to give a clearer understanding of the Group’s underlying trading performance.
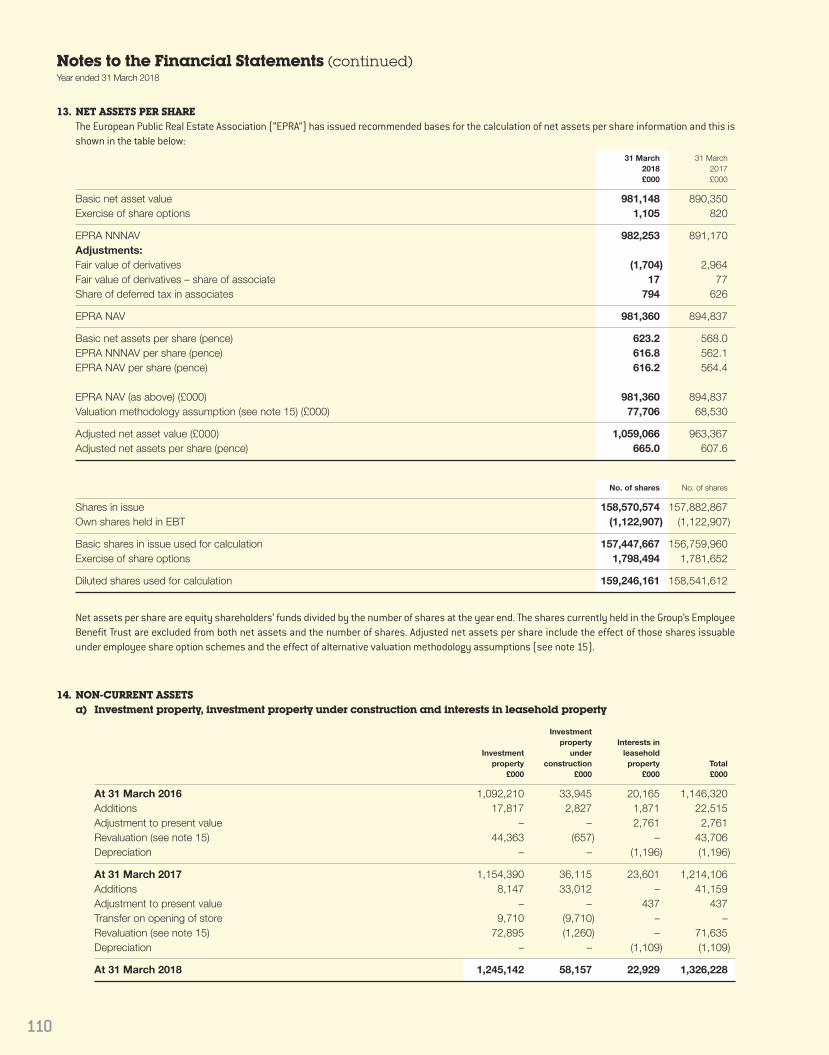
Notes to the Financial Statements (continued)Year ended 31 March 2018
110
13. NET ASSETS PER SHAREThe European Public Real Estate Association (“EPRA”) has issued recommended bases for the calculation of net assets per share information and this isshown in the table below:
31 March 31 March2018 2017£000 £000
Basic net asset value 981,148 890,350Exercise of share options 1,105 820
EPRA NNNAV 982,253 891,170Adjustments:Fair value of derivatives (1,704) 2,964Fair value of derivatives – share of associate 17 77Share of deferred tax in associates 794 626
EPRA NAV 981,360 894,837
Basic net assets per share (pence) 623.2 568.0EPRA NNNAV per share (pence) 616.8 562.1EPRA NAV per share (pence) 616.2 564.4
EPRA NAV (as above) (£000) 981,360 894,837Valuation methodology assumption (see note 15) (£000) 77,706 68,530
Adjusted net asset value (£000) 1,059,066 963,367Adjusted net assets per share (pence) 665.0 607.6
No. of shares No. of shares
Shares in issue 158,570,574 157,882,867Own shares held in EBT (1,122,907) (1,122,907)
Basic shares in issue used for calculation 157,447,667 156,759,960Exercise of share options 1,798,494 1,781,652
Diluted shares used for calculation 159,246,161 158,541,612
Net assets per share are equity shareholders’ funds divided by the number of shares at the year end. The shares currently held in the Group’s EmployeeBenefit Trust are excluded from both net assets and the number of shares. Adjusted net assets per share include the effect of those shares issuableunder employee share option schemes and the effect of alternative valuation methodology assumptions (see note 15).
14. NON-CURRENT ASSETSa) Investment property, investment property under construction and interests in leasehold property
Investmentproperty Interests in
Investment under leaseholdproperty construction property Total
£000 £000 £000 £000
At 31 March 2016 1,092,210 33,945 20,165 1,146,320Additions 17,817 2,827 1,871 22,515Adjustment to present value – – 2,761 2,761Revaluation (see note 15) 44,363 (657) – 43,706Depreciation – – (1,196) (1,196)
At 31 March 2017 1,154,390 36,115 23,601 1,214,106Additions 8,147 33,012 – 41,159Adjustment to present value – – 437 437Transfer on opening of store 9,710 (9,710) – –Revaluation (see note 15) 72,895 (1,260) – 71,635Depreciation – – (1,109) (1,109)
At 31 March 2018 1,245,142 58,157 22,929 1,326,228

111
14. NON-CURRENT ASSETS (continued)a) Investment property, investment property under construction and interests in leasehold property (continued)
During the year the Group sold land at its Richmond store to an adjoining landowner for £650,000. The valuation of the store was not impacted bythis disposal, hence the full proceeds have been recorded as profit on part disposal of investment property. This has been eliminated from the Group’sadjusted profit for the year.
Additions to the interests in leasehold properties in the prior year relate to the lease at Twickenham 2, acquired from Lock and Leave in April 2016.
The income from self storage accommodation earned by the Group from its investment property is disclosed in note 3. Direct operating expenses,which are all applied to generating rental income, arising on the investment property in the year are disclosed in the Portfolio Summary on page 20.Included within additions is £0.4 million of capitalised interest (2017: £0.1 million), calculated at the Group’s average borrowing cost for the year of2.9%. 55 of the Group’s investment properties are pledged as security for loans, with a total external value of £1,076.2 million.
b) Plant, equipment and owner occupied propertyFixtures,
Freehold Leasehold Plant and Motor fittings & officeproperty improvements machinery vehicles equipment Total
£000 £000 £000 £000 £000 £000
CostAt 31 March 2016 2,183 101 592 25 1,498 4,399Retirement of fully depreciated assets – (4) (34) – (489) (527)Additions 6 – 91 30 422 549Disposals – – – (23) – (23)
At 31 March 2017 2,189 97 649 32 1,431 4,398Retirement of fully depreciated assets – (30) (79) – (584) (693)Additions 8 7 121 – 469 605
At 31 March 2018 2,197 74 691 32 1,316 4,310
DepreciationAt 31 March 2016 (367) (52) (197) (25) (353) (994)Retirement of fully depreciated assets – 4 34 – 489 527Charge for the year (42) (2) (102) (5) (587) (738)Disposals – – – 23 – 23
At 31 March 2017 (409) (50) (265) (7) (451) (1,182)Retirement of fully depreciated assets – 30 79 – 584 693Charge for the year (42) (2) (123) (7) (555) (729)
At 31 March 2018 (451) (22) (309) (14) (422) (1,218)
Net book valueAt 31 March 2018 1,746 52 382 18 894 3,092
At 31 March 2017 1,780 47 384 25 980 3,216
c) Intangible assetsThe intangible asset relates to the Big Yellow brand, which was acquired through the acquisition of Big Yellow Self Storage Company Limited in 1999.The carrying value remains unchanged from the prior year as there is considered to be no impairment in the value of the asset. The asset has anindefinite life and is tested annually for impairment or more frequently if there are indicators of impairment.
This was shown as goodwill in the prior year, but this has been restated to treat it as an intangible asset in both years, as this more fairly reflects thenature of the asset.
d) Investment in associatesArmadilloThe Group has a 20% interest in Armadillo Storage Holding Company Limited (“Armadillo 1”) and a 20% interest in Armadillo Storage Holding Company2 Limited (“Armadillo 2”). Both interests are accounted for as associates, using the equity method of accounting. Both companies are incorporated,registered and operate in England and Wales.

Notes to the Financial Statements (continued)Year ended 31 March 2018
112
14. NON-CURRENT ASSETS (continued)d) Investment in associates (continued)
Armadillo 1 Armadillo 2 Total
31 March 31 March 31 March 31 March 31 March 31 March 2018 2017 2018 2017 2018 2017 £000 £000 £000 £000 £000 £000
At the beginning of the year 5,048 4,173 2,404 2,233 7,452 6,406Subscription for capital – – 900 – 900 –Share of results (see below) 937 1,093 433 349 1,370 1,442Dividends (255) (218) (191) (178) (446) (396)
Share of net assets 5,730 5,048 3,546 2,404 9,276 7,452
In March 2018, Armadillo 2 raised £4.5 million of equity, which alongside additional debt from Lloyds, funded the acquisition of 1st Storage Centres.Big Yellow’s equity invested was £0.9 million (20% of the total raised), with the balance funded by our partners. The Group’s total subscription forpartnership capital and advances in Armadillo 1 is £1,920,000 and £2,689,000 in Armadillo 2.
The investment properties owned by Armadillo 1 and Armadillo 2 have been valued at 31 March 2018 by Jones Lang LaSalle.
The figures below show the trading results of the Armadillo Partnerships, and the Group’s share of the results and the net assets of the ArmadilloPartnerships. Armadillo 1 Armadillo 2
Year ended Year ended Year ended Year ended31 March 31 March 31 March 31 March
2018 2017 2018 2017£000 £000 £000 £000
Income statement (100%)Revenue 8,188 6,324 4,576 4,159Cost of sales (4,247) (3,270) (1,919) (1,763)Administrative expenses (282) (207) (136) (88)
Operating profit 3,659 2,847 2,521 2,308Gain on the revaluation of investment properties 3,264 3,725 1,196 322Net interest payable (938) (718) (813) (729)Acquisition costs written off (375) (316) (227) –Fair value movement of interest rate derivatives 147 8 154 (49)Deferred and current tax (1,074) (78) (664) (109)
Profit attributable to shareholders 4,683 5,468 2,167 1,743Dividends paid (1,275) (1,091) (957) (890)
Retained profit 3,408 4,377 1,210 853
Balance sheet (100%)Investment property 53,176 43,375 38,205 25,900Interest in leasehold properties 1,403 – 3,233 3,526Other non-current assets 1,149 1,125 1,989 1,487Current assets 1,177 1,177 1,480 867Current liabilities (2,842) (1,895) (2,367) (1,821)Derivative financial instruments (52) (199) (34) (188)Non-current liabilities (25,361) (18,341) (24,778) (17,753)
Net assets (100%) 28,650 25,242 17,728 12,018
Group shareOperating profit 732 569 504 462Gain on the revaluation of investment properties 653 745 239 64Net interest payable (187) (144) (163) (146)Acquisition costs written off (75) (63) (45) –Fair value movement of interest rate derivatives 29 2 31 (10)Deferred and current tax (215) (16) (133) (21)
Profit attributable to shareholders 937 1,093 433 349Dividends paid (255) (218) (191) (178)
Retained profit 682 875 242 171
Associates’ net assets 5,730 5,048 3,546 2,404

113
15. VALUATION OF INVESTMENT PROPERTYRevaluation on
Deemed cost deemed cost Valuation£000 £000 £000
Freehold storesAt 31 March 2017 583,297 527,613 1,110,910Transfer from investment property under construction 11,763 (2,053) 9,710Movement in year 7,780 73,452 81,232
At 31 March 2018 602,840 599,012 1,201,852
Leasehold storesAt 31 March 2017 16,210 27,270 43,480Movement in year 367 (557) (190)
At 31 March 2018 16,577 26,713 43,290
Total of open storesAt 31 March 2017 599,507 554,883 1,154,390Transfer from investment property under construction 11,763 (2,053) 9,710Movement in year 8,147 72,895 81,042
At 31 March 2018 619,417 625,725 1,245,142
Investment property under constructionAt 31 March 2017 45,477 (9,362) 36,115Transfer to investment property (11,763) 2,053 (9,710)Movement in year 33,012 (1,260) 31,752
At 31 March 2018 66,726 (8,569) 58,157
Valuation of all investment propertyAt 31 March 2017 644,984 545,521 1,190,505Movement in year 41,159 71,635 112,794
At 31 March 2018 686,143 617,156 1,303,299
The Group has classified the fair value investment property and the investment property under construction within Level 3 of the fair value hierarchy.There has been no transfer to or from Level 3 in the year.
The wholly owned freehold and leasehold investment properties have been valued at 31 March 2018 by external valuers, Cushman & Wakefield (“C&W”).The valuation has been carried out in accordance with the RICS Valuation – Global Standards, published by The Royal Institution of Chartered Surveyors(“the Red Book”). The valuation of each of the investment properties and the investment properties under construction has been prepared on the basisof either Fair Value or Fair Value as a fully equipped operational entity, having regard to trading potential, as appropriate.
The valuation has been provided for accounts purposes and as such, is a Regulated Purpose Valuation as defined in the Red Book. In compliance with thedisclosure requirements of the Red Book, C&W have confirmed that:
> one of the members of the RICS who has been a signatory to the valuations provided to the Group for the same purposes as this valuation, has doneso since September 2004. This is the third occasion on which the other member has been a signatory;
> C&W have been carrying out this annual valuation for the same purposes as this valuation on behalf of the Group since September 2004;> C&W do not provide other significant professional or agency services to the Group;> in relation to the preceding financial year of C&W, the proportion of the total fees payable by the Group to the total fee income of the firm is less than
5%; and> the fee payable to C&W is a fixed amount per store, and is not contingent on the appraised value.
Market uncertaintyC&W’s valuation report comments on valuation uncertainty resulting from low liquidity in the market for self storage property. C&W note that in the UKsince Q1 2015 there have only been thirteen transactions involving multiple assets and ten single asset transactions. C&W state that due to the lack ofcomparable market information in the self storage sector, there is greater uncertainty attached to their opinion of value than would be anticipated duringmore active market conditions.
Portfolio PremiumC&W’s valuation report further confirms that the properties have been valued individually but that if the portfolio was to be sold as a single lot or inselected groups of properties, the total value could differ significantly. C&W state that in current market conditions they are of the view that there couldbe a material portfolio premium.

15. VALUATION OF INVESTMENT PROPERTY (continued)
AssumptionsA. Net operating income is based on projected revenue received less projected operating costs together with a central administration charge of 6% of
the estimated annual revenue subject to a cap and a collar. The initial net operating income is calculated by estimating the net operating income inthe first 12 months following the valuation date.
B. The net operating income in future years is calculated assuming either straight-line absorption from day one actual occupancy or variable absorptionover years one to four of the cash flow period, to an estimated stabilised/mature occupancy level. In the valuation the assumed stabilised occupancylevel for the 74 trading stores (both freeholds and leaseholds) open at 31 March 2018 averages 83.6% (31 March 2017: 82.8%). The projected revenuesand costs have been adjusted for estimated cost inflation and revenue growth. The average time assumed for the 74 stores to trade at their maturitylevels is 16 months (31 March 2017: 22 months).
C. The capitalisation rates applied to existing and future net cash flow have been estimated by reference to underlying yields for industrial and retailwarehouse property, yields for other trading property types such as student housing and hotels, bank base rates, ten-year money rates, inflationand the available evidence of transactions in the sector. The valuation included in the accounts assumes rental growth in future periods.If an assumption of no rental growth is applied to the external valuation, the net initial yield pre-administration expenses for the 74 stores is 6.5%(31 March 2017: 6.5%) rising to a stabilised net yield pre-administration expenses of 6.9% (31 March 2017: 7.2%). The weighted average exitcapitalisation rate adopted (for both freeholds and leaseholds) is 6.3% (31 March 2017: 6.6%).
D. The future net cash flow projections (including revenue growth and cost inflation) have been discounted at a rate that reflects the risk associatedwith each asset. The weighted average annual discount rate adopted (for both freeholds and leaseholds) is 9.4% (31 March 2017: 9.7%).
E. Purchaser’s costs in the range of circa 6.1% to circa 6.8% (see below) have been assumed initially, reflecting the progressive SLDT rates brought intoforce in March 2016 and sale plus purchaser’s costs totalling circa 7.1% to 7.8% are assumed on the notional sales in the tenth year in relation to thefreehold and long leasehold stores.
Short leaseholdThe same methodology has been used as for freeholds, except that no sale of the assets in the tenth year is assumed but the discounted cash flow isextended to the expiry of the lease. The average unexpired term of the Group’s seven short leasehold properties is 14.0 years (31 March 2017: 15.0 yearsunexpired).
SensitivitiesAs noted in ‘Significant judgements and key estimates’ on page 105, self storage valuations are complex, derived from data which is not widely publiclyavailable and involve a degree of judgement. For these reasons we have classified the valuations of our property portfolio as Level 3 as defined byIFRS 13. Inputs to the valuations, some of which are ‘unobservable’ as defined by IFRS 13, include capitalisation yields, stable occupancy rates, and rentalgrowth rates. The existence of an increase of more than one unobservable input would augment the impact on valuation. The impact on the valuationwould be mitigated by the inter-relationship between unobservable inputs moving in opposite directions. For example, an increase in stable occupancymay be offset by an increase in yield, resulting in no net impact on the valuation. A sensitivity analysis showing the impact on valuations of changes inyields and stable occupancy is shown below. Impact of a change Impact of a change in in stabilised capitalisation rates occupancy assumption
25 bps decrease 25 bps increase 1% increase 1% decrease
Reported group £48.6m (£44.9m) £18.3m (£19.1m)
A sensitivity analysis has not been provided for a change in the rental growth rate adopted as there is a relationship between this measure and thediscount rate adopted. So, in theory, an increase in the rental growth rate would give rise to a corresponding increase in the discount rate and the resultingvalue impact would be limited.
Investment properties under constructionC&W have valued the stores in development adopting the same methodology as set out above but on the basis of the cash flow projection expected forthe store at opening and after allowing for the outstanding costs to take each scheme from its current state to completion and full fit-out. C&W haveallowed for holding costs and construction contingency, as appropriate. Four schemes do not yet have planning consent and C&W have reflected theplanning risk in their valuation.
Notes to the Financial Statements (continued)Year ended 31 March 2018
114

115
15. VALUATION OF INVESTMENT PROPERTY (continued)
Immature stores: value uncertaintyC&W have assessed the value of each property individually. However, two of the Group’s stores are relatively immature and have low initial cash flows.C&W have endeavoured to reflect the nature of the cash flow profile for these properties in their valuation, and the higher associated risks relating to theas yet unproven future cash flows, by adjustment to the capitalisation rates and discount rates adopted. However, immature low cash flow stores of thisnature are rarely, if ever, traded individually in the market, unless as part of a distressed sale or similar situation. Although, there is more evidence ofimmature low cash flow stores being traded as part of a group or portfolio transaction. Please note C&W’s comments in relation to market uncertainty inthe self storage sector due to the lack of comparable market transactions and information. The degree of uncertainty relating to the immature stores isgreater than in relation to the balance of the properties due to there being even less market evidence that might be available for more mature propertiesand portfolios. C&W state that in practice, if an actual sale of the properties were to be contemplated then any immature low cash flow stores wouldnormally be presented to the market for sale lotted or grouped with other more mature assets owned by the same entity, in order to alleviate the issue ofnegative or low short-term cash flow. This approach would enhance the marketability of the group of assets and assist in achieving the best price availablein the market by diluting the cash flow risk.
C&W have not adjusted their opinion of Fair Value to reflect such a grouping of the immature assets with other properties in the portfolio and all storeshave been valued individually. However, they highlight the matter to alert the Group to the manner in which the properties might be grouped or lotted inorder to maximise their attractiveness to the market place. C&W consider this approach to be a valuation assumption but not a Special Assumption, thelatter being an assumption that assumes facts that differ from the actual facts existing at the valuation date and which, if not adopted, could produce amaterial difference in value. As noted above, C&W have not assumed that the entire portfolio of properties owned by the entity would be sold as a singlelot and the value for the whole portfolio in the context of a sale as a single lot may differ significantly from the aggregate of the individual values for eachproperty in the portfolio, reflecting the lotting assumption described above.
Valuation assumption for purchaser’s costsThe Group’s investment property assets have been valued for the purposes of the financial statements after deducting notional purchaser’s cost of circa6.1% to 6.8% of gross value, as if they were sold directly as property assets. The valuation is an asset valuation which is entirely linked to the operatingperformance of the business. The assets would have to be sold with the benefit of operational contracts, employment contracts and customer contracts,which would be very difficult to achieve except in a corporate structure. This approach follows the logic of the valuation methodology in that the valuationis based on a capitalisation of the net operating income after allowing a deduction for operational cost and an allowance for central administration costs.Sale in a corporate structure would result in a reduction in the assumed Stamp Duty Land Tax but an increase in other transaction costs reflecting additionaldue diligence resulting in a reduced notional purchaser’s cost of 2.75% of gross value. All the significant sized transactions that have been concluded inthe UK in recent years were completed in a corporate structure. The Group therefore instructed C&W to carry out an additional valuation on the abovebasis, and this results in a higher property valuation at 31 March 2018 of £1,380.3 million (£77.0 million higher than the value recorded in the financialstatements). The total valuations in the two Armadillo Partnerships performed by Jones Lang LaSalle are £3.3 million higher than the value recorded inthe financial statements, of which the Group’s share is £0.7 million. The sum of these is £77.7 million and translates to 48.8 pence per share. We haveincluded this revised valuation in the adjusted diluted net asset calculation (see note 13).
16. TRADE AND OTHER RECEIVABLES31 March 31 March
2018 2017£000 £000
CurrentTrade receivables 3,684 3,174Capital Goods Scheme receivable 1,876 2,725Other receivables 287 266Prepayments and accrued income 12,739 11,877
18,586 18,042
Non-currentCapital Goods Scheme receivable 2,385 4,091
Trade receivables are net of a bad debt provision of £14,000 (2017: £7,000). The Directors consider that the carrying amount of trade and other receivablesapproximates their fair value.
The Financial Review contains commentary on the Capital Goods Scheme receivable.
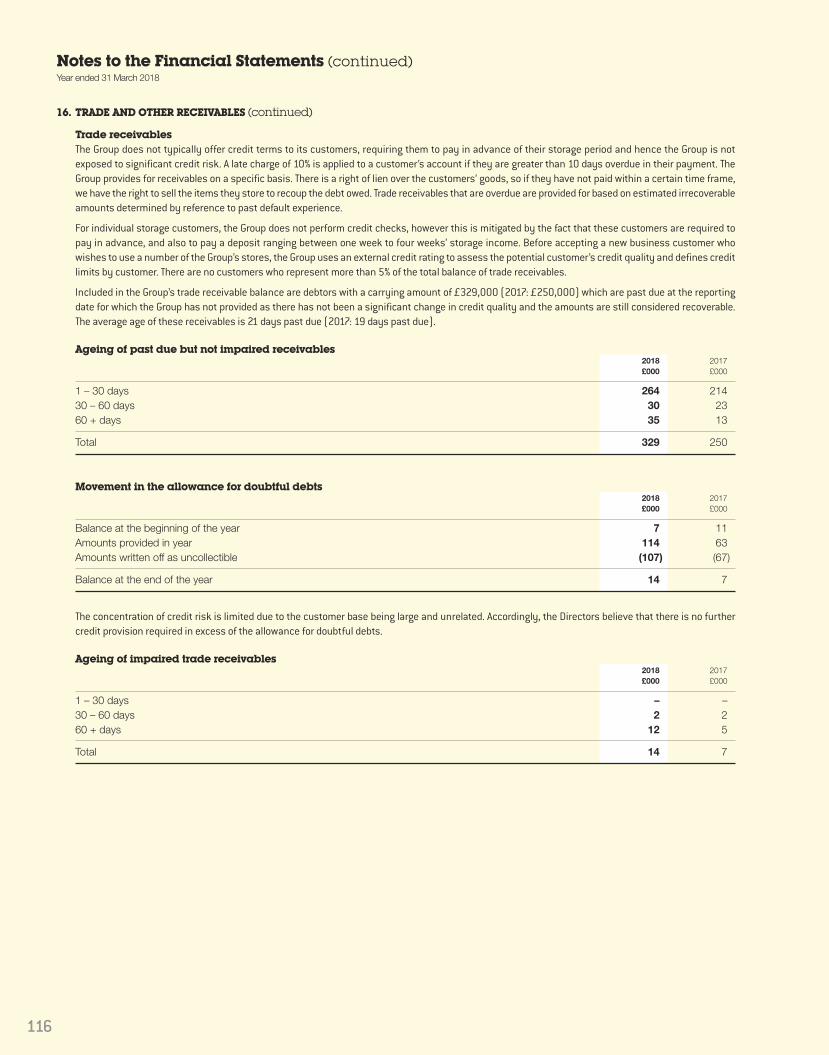
Notes to the Financial Statements (continued)Year ended 31 March 2018
116
16. TRADE AND OTHER RECEIVABLES (continued)
Trade receivablesThe Group does not typically offer credit terms to its customers, requiring them to pay in advance of their storage period and hence the Group is notexposed to significant credit risk. A late charge of 10% is applied to a customer’s account if they are greater than 10 days overdue in their payment. TheGroup provides for receivables on a specific basis. There is a right of lien over the customers’ goods, so if they have not paid within a certain time frame,we have the right to sell the items they store to recoup the debt owed. Trade receivables that are overdue are provided for based on estimated irrecoverableamounts determined by reference to past default experience.
For individual storage customers, the Group does not perform credit checks, however this is mitigated by the fact that these customers are required topay in advance, and also to pay a deposit ranging between one week to four weeks’ storage income. Before accepting a new business customer whowishes to use a number of the Group’s stores, the Group uses an external credit rating to assess the potential customer’s credit quality and defines creditlimits by customer. There are no customers who represent more than 5% of the total balance of trade receivables.
Included in the Group’s trade receivable balance are debtors with a carrying amount of £329,000 (2017: £250,000) which are past due at the reportingdate for which the Group has not provided as there has not been a significant change in credit quality and the amounts are still considered recoverable.The average age of these receivables is 21 days past due (2017: 19 days past due).
Ageing of past due but not impaired receivables2018 2017£000 £000
1 – 30 days 264 21430 – 60 days 30 2360 + days 35 13
Total 329 250
Movement in the allowance for doubtful debts2018 2017£000 £000
Balance at the beginning of the year 7 11Amounts provided in year 114 63Amounts written off as uncollectible (107) (67)
Balance at the end of the year 14 7
The concentration of credit risk is limited due to the customer base being large and unrelated. Accordingly, the Directors believe that there is no furthercredit provision required in excess of the allowance for doubtful debts.
Ageing of impaired trade receivables2018 2017£000 £000
1 – 30 days – –30 – 60 days 2 260 + days 12 5
Total 14 7
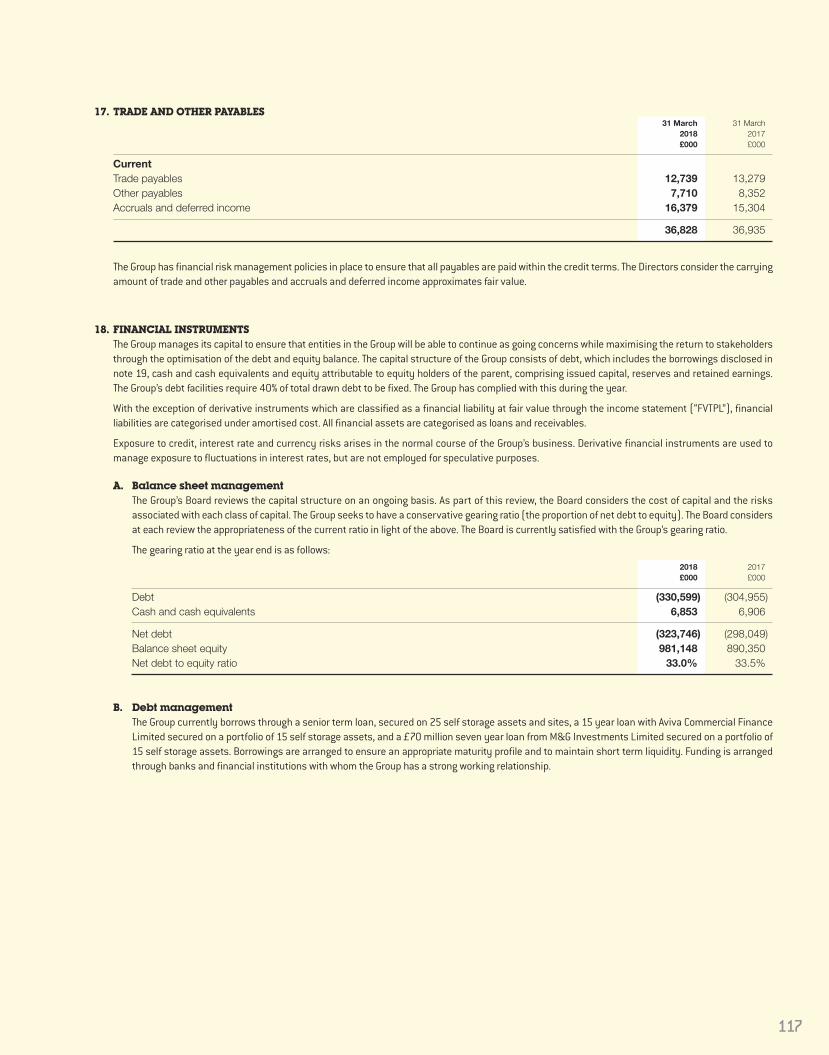
117
17. TRADE AND OTHER PAYABLES31 March 31 March
2018 2017£000 £000
CurrentTrade payables 12,739 13,279Other payables 7,710 8,352Accruals and deferred income 16,379 15,304
36,828 36,935
The Group has financial risk management policies in place to ensure that all payables are paid within the credit terms. The Directors consider the carryingamount of trade and other payables and accruals and deferred income approximates fair value.
18. FINANCIAL INSTRUMENTSThe Group manages its capital to ensure that entities in the Group will be able to continue as going concerns while maximising the return to stakeholdersthrough the optimisation of the debt and equity balance. The capital structure of the Group consists of debt, which includes the borrowings disclosed innote 19, cash and cash equivalents and equity attributable to equity holders of the parent, comprising issued capital, reserves and retained earnings.The Group’s debt facilities require 40% of total drawn debt to be fixed. The Group has complied with this during the year.
With the exception of derivative instruments which are classified as a financial liability at fair value through the income statement (“FVTPL”), financialliabilities are categorised under amortised cost. All financial assets are categorised as loans and receivables.
Exposure to credit, interest rate and currency risks arises in the normal course of the Group’s business. Derivative financial instruments are used tomanage exposure to fluctuations in interest rates, but are not employed for speculative purposes.
A. Balance sheet managementThe Group’s Board reviews the capital structure on an ongoing basis. As part of this review, the Board considers the cost of capital and the risksassociated with each class of capital. The Group seeks to have a conservative gearing ratio (the proportion of net debt to equity). The Board considersat each review the appropriateness of the current ratio in light of the above. The Board is currently satisfied with the Group’s gearing ratio.
The gearing ratio at the year end is as follows:2018 2017£000 £000
Debt (330,599) (304,955)Cash and cash equivalents 6,853 6,906
Net debt (323,746) (298,049)Balance sheet equity 981,148 890,350Net debt to equity ratio 33.0% 33.5%
B. Debt managementThe Group currently borrows through a senior term loan, secured on 25 self storage assets and sites, a 15 year loan with Aviva Commercial FinanceLimited secured on a portfolio of 15 self storage assets, and a £70 million seven year loan from M&G Investments Limited secured on a portfolio of15 self storage assets. Borrowings are arranged to ensure an appropriate maturity profile and to maintain short term liquidity. Funding is arrangedthrough banks and financial institutions with whom the Group has a strong working relationship.

Notes to the Financial Statements (continued)Year ended 31 March 2018
118
18. FINANCIAL INSTRUMENTS (continued)
C. Interest rate risk managementThe Group is exposed to interest rate risk as entities in the Group borrow funds at both fixed and floating interest rates. The risk is managed by theGroup by maintaining an appropriate mix between fixed and floating rate borrowings, and by the use of interest rate swap contracts. Hedging activitiesare evaluated regularly to align with interest rate views and defined risk appetite; ensuring optimal hedging strategies are applied, by either positioningthe balance sheet or protecting interest expense through different interest rate cycles.
At 31 March 2018 the Group had two interest rate derivatives in place; £30 million fixed at 0.4% (excluding the margin on the underlying debtinstrument) until October 2021, and £35 million fixed at 0.76% (excluding the margin on the underlying debt instrument) until June 2023.
Under interest rate swap contracts, the Group agrees to exchange the difference between fixed and floating rate interest amounts calculated onagreed notional principal amounts. Such contracts enable the Group to mitigate the risk of changing interest rates on the fair value of issued fixedrate debt held and the cash flow exposures on the issued variable rate debt held. The fair value of interest rate swaps at the reporting date is determinedby discounting the future cash flows using the curves at the reporting date and the credit risk inherent in the contract, and is disclosed below. Theaverage interest rate is based on the outstanding balances at the end of the financial year.
The £30 million interest rate swap settles on a monthly basis. The floating rate on the interest rate swap is one month LIBOR. The Group settles thedifference between the fixed and floating interest rate on a net basis.
The £35 million interest rate swap settles on a three-monthly basis. The floating rate on the interest rate swap is three month LIBOR. The Group settlesthe difference between the fixed and floating interest rate on a net basis.
The Group does not hedge account for its interest rate swaps and states them at fair value, with changes in fair value included in the statement ofcomprehensive income. A reconciliation of the movement in derivatives is provided in the table below:
2018 2017£000 £000
At 1 April (2,964) (3,683)Fair value movement in the year 1,294 719Cancellation of interest rate derivative 3,374 –
At 31 March 1,704 (2,964)
The table below reconciles the opening and closing balances of the Group’s finance related liabilities.Finance Interest rate
Loans leases derivatives Total
At 1 April 2017 (304,955) (23,601) (2,964) (331,520)Cash movement in the year (25,644) 1,109 3,374 (21,161)Non-cash movements – (437) 1,294 857
At 31 March 2018 (330,599) (22,929) 1,704 (351,824)
D. Interest rate sensitivity analysisIn managing interest rate risks the Group aims to reduce the impact of short-term fluctuations on the Group’s earnings, without jeopardising itsflexibility. Over the longer term, permanent changes in interest rates may have an impact on consolidated earnings.
At 31 March 2018, it is estimated that an increase of 0.25 percentage points in interest rates would have reduced the Group’s adjusted profit beforetax and net equity by £445,000 (2017: reduced adjusted profit before tax by £375,000) and a decrease of 0.25 percentage points in interest rateswould have increased the Group’s adjusted profit before tax and net equity by £445,000 (2017: increased adjusted profit before tax by £375,000).The sensitivity has been calculated by applying the interest rate change to the variable rate borrowings, net of interest rate swaps, at the year end.
The Group’s sensitivity to interest rates has increased during the year, following the increase in the amount of floating rate debt. The Board monitorsclosely the exposure to the floating rate element of our debt.
E. Cash management and liquidityUltimate responsibility for liquidity risk management rests with the Board of Directors, which has built an appropriate liquidity risk managementframework for the management of the Group’s short, medium and long-term funding and liquidity management requirements. The Group managesliquidity risk by maintaining adequate reserves, banking facilities and reserve borrowing facilities by continuously monitoring forecast and actualcash flows and matching the maturity profiles of financial assets and liabilities. Included in note 19 is a description of additional undrawn facilitiesthat the Group has at its disposal to further reduce liquidity risk.
Short term money market deposits are used to manage liquidity whilst maximising the rate of return on cash resources, giving due considerationto risk.

119
18. FINANCIAL INSTRUMENTS (continued)
F. Foreign currency managementThe Group does not have any foreign currency exposure.
G. Credit riskThe credit risk management policies of the Group with respect to trade receivables are discussed in note 16. The Group has no significant concentrationof credit risk, with exposure spread over 55,000 customers in our stores.
The credit risk on liquid funds is limited because the counterparties are banks with high credit-ratings assigned by international credit-rating agencies.
H. Financial maturity analysisIn respect of interest-bearing financial liabilities, the following table provides a maturity analysis for individual elements.
Less than One to Two to More thanTotal one year two years five years five years
2018 maturity £000 £000 £000 £000 £000
DebtAviva loan 87,599 2,474 2,598 8,601 73,926M&G loan payable at variable rate 35,000 – – – 35,000M&G loan fixed by interest rate derivatives 35,000 – – – 35,000Bank loan payable at variable rate 143,000 – – 143,000 –Debt fixed by interest rate derivatives 30,000 – – 30,000 –
Total 330,599 2,474 2,598 181,601 143,926
Less than One to Two to More thanTotal one year two years five years five years
2017 maturity £000 £000 £000 £000 £000
DebtAviva loan 89,955 2,356 2,474 8,190 76,935M&G loan payable at variable rate 35,000 – – – 35,000M&G loan fixed by interest rate derivatives 35,000 – – – 35,000Bank loan payable at variable rate 115,000 – – 115,000 –Debt fixed by interest rate derivatives 30,000 – – 30,000 –
Total 304,955 2,356 2,474 153,190 146,935
I. Fair values of financial instrumentsThe fair values of the Group’s cash and short term deposits and those of other financial assets equate to their book values. Details of the Group’sreceivables at amortised cost are set out in note 16. The amounts are presented net of provisions for doubtful receivables, and allowances forimpairment are made where appropriate. Trade and other payables, including bank borrowings, are carried at amortised cost. Finance lease liabilitiesare included at the fair value of their minimum lease payments. Derivatives are carried at fair value.
For those financial instruments held at valuation, the Group has categorised them into a three level fair value hierarchy based on the priority of theinputs to the valuation technique in accordance with IFRS 7. The hierarchy gives the highest priority to quoted prices in active markets for identicalassets or liabilities (Level 1) and the lowest priority to unobservable inputs (Level 3). If the inputs used to measure fair value fall within differentlevels of the hierarchy, the category level is based on the lowest priority level input that is significant to the fair value measurement of the instrumentin its entirety. The fair value of the Group’s outstanding interest rate derivative, as detailed in note 18C, has been estimated by calculating the presentvalue of future cash flows, using appropriate market discount rates, representing Level 2 fair value measurements as defined by IFRS 7. There are nofinancial instruments which have been categorised as Level 1 or Level 3. The fair value of the Group’s debt equates to its book value.

Notes to the Financial Statements (continued)Year ended 31 March 2018
120
18. FINANCIAL INSTRUMENTS (continued)
J. Maturity analysis of financial liabilitiesThe contractual maturities based on market conditions and expected yield curves prevailing at the year end date are as follows:
Tradeand other Interest rate Borrowings Financepayables swaps and interest leases Total
2018 £000 £000 £000 £000 £000
From five to twenty years – (63) 159,548 23,709 183,194From two to five years – (1,139) 207,092 6,285 212,238From one to two years – (381) 11,855 2,095 13,569
Due after more than one year – (1,583) 378,495 32,089 409,001Due within one year 20,449 (195) 11,855 2,095 34,204
Total 20,449 (1,778) 390,350 34,184 443,205
Tradeand other Interest rate Borrowings Financepayables swaps and interest leases Total
2017 £000 £000 £000 £000 £000
From five to twenty years – 127 166,652 25,556 192,335From two to five years – 1,493 180,928 6,116 188,537From one to two years – 692 11,930 2,039 14,661
Due after more than one year – 2,312 359,510 33,711 395,533Due within one year 21,631 816 11,930 2,039 36,416
Total 21,631 3,128 371,440 35,750 431,949
K. Reconciliation of maturity analysesThe maturity analysis in note 18J shows non-discounted cash flows for all financial liabilities including interest payments. The table below reconcilesthe borrowings column in note 19 with the borrowings and interest column in the maturity analysis presented in note 18J.
Unamortisedborrowing Borrowings
Borrowings Interest costs and interest2018 £000 £000 £000 £000
From five to twenty years 143,926 13,958 1,664 159,548From two to five years 181,601 25,491 – 207,092From one to two years 2,598 9,257 – 11,855
Due after more than one year 328,125 48,706 1,664 378,495Due within one year 2,474 9,381 – 11,855
Total 330,599 58,087 1,664 390,350
Unamortisedborrowing Borrowings
Borrowings Interest costs and interest2017 £000 £000 £000 £000
From five to twenty years 146,935 17,806 1,911 166,652From two to five years 153,190 26,373 1,365 180,928From one to two years 2,474 9,456 – 11,930
Due after more than one year 302,599 53,635 3,276 359,510Due within one year 2,356 9,574 – 11,930
Total 304,955 63,209 3,276 371,440

121
19. BORROWINGS31 March 31 March
2018 2017Secured borrowings at amortised cost £000 £000
Current liabilitiesAviva loan 2,474 2,356
2,474 2,356Non-current liabilitiesBank borrowings 173,000 145,000Aviva loan 85,125 87,599M&G loan 70,000 70,000Unamortised loan arrangement costs (1,664) (3,276)
Total non-current borrowings 326,461 299,323
Total borrowings 328,935 301,679
The weighted average interest rate paid on the borrowings during the year was 2.9% (2017: 3.3%).
The Group has £37,000,000 in undrawn committed bank borrowing facilities at 31 March 2018, which expire between four and five years (2017:£45,000,000 expiring between four and five years).
The Group has a £100 million 15 year fixed rate loan with Aviva Commercial Finance Limited. The loan is secured over a portfolio of 15 freehold self storagecentres. The annual fixed interest rate on the loan is 4.9%. The loan amortises to £60 million over the course of the 15 years. The debt service is payablemonthly based on fixed annual amounts.
The Group has a £210 million five year revolving bank facility with Lloyds and HSBC expiring in October 2022, with a margin of 1.25%. The Group has anoption to increase the amount of the loan facility by a further £60 million during the course of the loan’s term, and an option to increase the term of theloan by a further two years.
The Group has a £70 million seven year loan with M&G Investments Limited, with a bullet repayment in June 2023. The loan is secured over a portfolio of15 freehold self storage centres. Half of the loan is variable and half is subject to an interest rate derivative.
The Group was in compliance with its banking covenants at 31 March 2018 and throughout the year. The main covenants are summarised in the tablebelow:
Covenant Covenant level At 31 March 2018
Consolidated EBITDA Minimum 1.5x 7.9xConsolidated net tangible assets Minimum £250m £981.1mBank loan income cover Minimum 1.75x 14.2xAviva loan interest service cover ratio Minimum 1.5x 4.1xAviva loan debt service cover ratio Minimum 1.2x 2.7xM&G income cover Minimum 1.5x 7.5x
Interest rate profile of financial liabilitiesWeighted
Weighted Period for averageFloating Fixed average which the period
Total rate rate interest rate is until£000 £000 £000 rate fixed maturity
At 31 March 2018Gross financial liabilities 330,599 178,000 152,599 2.9% 6.5 years 5.5 years
At 31 March 2017Gross financial liabilities 304,955 150,000 154,955 3.2% 7.0 years 5.9 years
All monetary liabilities, including short term receivables and payables are denominated in sterling. The weighted average interest rate includes the effectof the Group’s interest rate derivatives. The Directors have concluded that the carrying value of borrowings approximates to its fair value.
Narrative disclosures on the Group’s policy for financial instruments are included within the Strategic Report and in note 18.

Notes to the Financial Statements (continued)Year ended 31 March 2018
122
20. DEFERRED TAXDeferred tax assets in respect of share based payments (£0.1 million), corporation tax losses (£4.5 million), capital allowances in excess of depreciation(£0.3 million) and capital losses (£1.4 million) in respect of the non-REIT taxable business have not been recognised due to uncertainty over the projectedtax liabilities arising in the short term within the non-REIT taxable business. A deferred tax liability in respect of interest rate swaps (£0.3 million) arisingin the non-REIT taxable business has also not been recognised as the relevant entity has the legal right to settle the potential tax amounts on a net basisand these taxes are levied by the same taxing authority.
21. OBLIGATIONS UNDER FINANCE LEASES Present value minimum Minimum lease payments of lease payments
2018 2017 2018 2017£000 £000 £000 £000
Amounts payable under finance leases:Within one year 2,095 2,039 2,061 2,005Within two to five years inclusive 8,380 8,155 7,390 7,193Greater than five years 23,709 25,556 13,478 14,403
34,184 35,750 22,929 23,601
Less: future finance charges (11,255) (12,149)
Present value of lease obligations 22,929 23,601
All lease obligations are denominated in sterling. Interest rates are fixed at the contract date. All leases are on a fixed repayment basis and no arrangementshave been entered into for contingent rental payments. The carrying amount of the Group’s lease obligations approximates their fair value.
22. SHARE CAPITAL Called up, allotted and fully paid
2018 2017£000 £000
Ordinary shares of 10 pence each 15,857 15,788
Movement in issued share capitalNumber of shares at 31 March 2016 157,369,287Exercise of share options – Share option schemes 513,580
Number of shares at 31 March 2017 157,882,867Exercise of share options – Share option schemes 687,707
Number of shares at 31 March 2018 158,570,574
The Company has one class of ordinary shares which carry no right to fixed income.

123
22. SHARE CAPITAL (continued)At 31 March 2018 options in issue to Directors and employees were as follows:
Option Number of Number of price per ordinary ordinary
Date option ordinary Date first Date on which the shares sharesGranted share exercisable exercise period expires 2018 2017
19 July 2011 nil p ** 19 July 2013 19 July 2021 – 2,40011 July 2012 nil p ** 11 July 2015 10 July 2022 5,359 8,55919 July 2013 nil p ** 19 July 2016 19 July 2023 7,059 78,46925 February 2014 442.6p* 1 April 2017 1 October 2017 – 21,62429 July 2014 nil p** 29 July 2017 29 July 2024 10,155 485,03216 March 2015 494.6p* 1 April 2018 1 October 2018 94,654 95,01621 July 2015 nil p** 21 July 2018 21 July 2025 373,093 379,29314 March 2016 608.0p* 1 April 2019 1 October 2019 37,489 41,80922 July 2016 nil p** 22 July 2019 21 July 2026 398,825 402,22515 March 2017 580.0p* 1 April 2020 1 October 2020 59,550 65,3742 August 2017 nil p** 2 August 2020 1 August 2027 407,311 –13 March 2018 675.4p* 1 April 2021 1 October 2021 108,335 –
1,501,830 1,579,801
* SAYE (see note 23) ** LTIP (see note 23)
OWN SHARESThe own shares reserve represents the cost of shares in Big Yellow Group PLC purchased in the market, and held by the Big Yellow Group PLC EmployeeBenefit Trust, along with shares issued directly to the Employee Benefit Trust. 1,122,907 shares are held in the Employee Benefit Trust (2017: 1,122,907),and no shares are held in treasury.
23. SHARE-BASED PAYMENTSThe Company has three equity share-based payment arrangements, namely an LTIP scheme (with approved and unapproved components), an EmployeeShare Save Scheme (“SAYE”) and a Long Term Bonus Performance Plan. The Group recognised a total expense in the year related to equity-settled share-based payment transactions of £2,470,000 (2017: £2,324,000).
Equity-settled share option plansSince 2004 the Group has operated an Employee Share Save Scheme (“SAYE”) which allows any employee who has more than six months service topurchase shares at a 20% discount to the average quoted market price of the Group shares at the date of grant. The associated savings contracts arethree years at which point the employee can exercise their option to purchase the shares or take the amount saved, including interest, in cash. The schemeis administered by Yorkshire Building Society.
On an annual basis since 2004 the Group awarded nil-paid options to senior management under the Group’s Long Term Incentive Plan (“LTIP”). The awardsare conditional on the achievement of challenging performance targets as described on page 76 of the Remuneration Report. The awards granted in 2004,2005 and 2006 vested in full. The awards granted in 2007 and 2009 lapsed, and the awards granted in 2008 and 2010 partially vested. The awardsgranted in 2011, 2012, 2013 and 2014 fully vested. The weighted average share price at the date of exercise for options exercised in the year was £7.25(2017: £7.38).
2018 2017LTIP scheme No. of options No. of options
Outstanding at beginning of year 1,355,978 1,444,221Granted during the year 582,341 455,331Lapsed during the year (70,434) (59,094)Exercised during the year (666,083) (484,480)
Outstanding at the end of the year 1,201,802 1,355,978
Exercisable at the end of the year 22,573 89,428
The weighted average fair value of options granted during the year was £1,219,000 (2017: £1,017,000).

Notes to the Financial Statements (continued)Year ended 31 March 2018
124
23. SHARE-BASED PAYMENTS (continued)
2018 2017Weighted Weighted
2018 average 2017 averageNo. of exercise price No. of exercise price
Employee Share Save Scheme (“SAYE”) options (£) options (£)
Outstanding at beginning of year 223,823 5.36 205,330 4.87Granted during the year 108,335 6.75 65,374 5.80Forfeited during the year (10,506) 5.89 (17,781) 5.07Exercised during the year (21,624) 4.43 (29,100) 3.07
Outstanding at the end of the year 300,028 5.91 223,823 5.36
Exercisable at the end of the year – – – –
Options outstanding at 31 March 2018 had a weighted average contractual life of 2.0 years (2017: 2.1 years).
The inputs into the Black-Scholes model for the options granted during the year are as follows:
LTIP SAYE
Expected volatility n/a 27%Expected life 3 years 3 yearsRisk-free rate 0.1% 0.1%Expected dividends 4.6% 4.6%
Expected volatility was determined by calculating the historical volatility of the Group’s share price over the year prior to grant.
Long Term bonus performance planThe Executive Directors receive awards under the Long Term Bonus Performance Plan. This is accounted for as an equity instrument. The plan was set upin July 2015. The vesting criteria and scheme mechanics are set out in the Directors’ Remuneration Report. At 31 March 2018 the weighted averagecontractual life was 0.3 years.
24. CAPITAL COMMITMENTSAt 31 March 2018 the Group had £13.7 million of amounts contracted but not provided in respect of the Group’s properties (2017: £8.6 million of capitalcommitments).
25. EVENTS AFTER THE BALANCE SHEET DATEOn 5 April 2018, the Group exchanged contracts to acquire a property in Uxbridge for a new 55,000 sq ft store.

125
26. CASH FLOW NOTESa) Reconciliation of profit after tax to cash generated from operations
2018 2017Note £000 £000
Profit after tax 133,542 99,511Taxation 597 272Share of profit of associates (1,370) (1,442)Investment income (1,538) (1,075)Finance costs 11,975 11,756
Operating profit 143,206 109,022Gain on the revaluation of investment properties 14a, 15 (71,635) (43,706)Gain on part disposal of investment property (650) –Depreciation of plant, equipment and owner-occupied property 14b 729 738Depreciation of finance lease capital obligations 14a 1,109 1,196Employee share options 6 2,470 2,324
Cash generated from operations pre working capital movements 75,229 69,574Increase in inventories – (17)Increase in receivables (1,352) (1,456)Decrease in payables (420) (892)
Cash generated from operations 73,457 67,209
b) Reconciliation of net cash flow movement to net debt2018 2017
Note £000 £000
Net decrease in cash and cash equivalents in the year (53) (10,301)Cash flow from (increase)/decrease in debt financing (25,644) 7,243
Change in net debt resulting from cash flows (25,697) (3,058)
Movement in net debt in the year (25,697) (3,058)Net debt at the start of the year (298,049) (294,991)
Net debt at the end of the year 18A (323,746) (298,049)

Notes to the Financial Statements (continued)Year ended 31 March 2018
126
27. RELATED PARTY TRANSACTIONSTransactions between the Company and its subsidiaries, which are related parties, have been eliminated on consolidation and are not disclosedin this note.
Transactions with Armadillo Storage Holding Company LimitedAs described in note 14, the Group has a 20% interest in Armadillo Storage Holding Company Limited (“Armadillo 1”), and entered into transactions withArmadillo 1 during the period on normal commercial terms as shown in the table below.
Transactions with Armadillo Storage Holding Company 2 LimitedAs described in note 14, the Group has a 20% interest in Armadillo Storage Holding Company 2 Limited (“Armadillo 2”), and entered into transactions withArmadillo 2 during the year on normal commercial terms as shown in the table below.
31 March 31 March2018 2017£000 £000
Fees earned from Armadillo 1 705 574Fees earned from Armadillo 2 270 253Balance due from Armadillo 1 89 86Balance due from Armadillo 2 33 48
The remuneration of the Executive and Non-Executive Directors, who are the key management personnel of the Group, is set out below in aggregate.Further information on the remuneration of individual Directors is found in the audited part of the Directors’ Remuneration Report on pages 75 to 85.
31 March 31 March2018 2017£000 £000
Short term employee benefits 1,398 1,325Post-employment benefits 154 151Share based payments 5,618 1,566
7,170 3,042
AnyJunk LimitedJames Gibson is a Non-Executive Director and shareholder in AnyJunk Limited and Adrian Lee is a shareholder in AnyJunk Limited. During the yearAnyJunk Limited provided waste disposal services to the Group on normal commercial terms, amounting to £37,000 (2017: £36,000).
No other related party transactions took place during the years ended 31 March 2018 and 31 March 2017.

127
Company Balance SheetYear ended 31 March 2018
2018 2017Note £000 £000
Non-current assetsPlant, equipment and owner-occupied property 30a 1,815 1,840Investment in subsidiary companies 30b 20,490 18,020
22,305 19,860
Current assetsTrade and other receivables 31 470,716 481,294Derivative financial instruments 33 751 297Cash and cash equivalents 1 1
471,468 481,592
Total assets 493,773 501,452
Current liabilitiesTrade and other payables 32 (3,539) (3,137)
(3,539) (3,137)
Non-current liabilitiesBank borrowings 33 (173,000) (143,635)
(173,000) (143,635)
Total liabilities (176,539) (146,772)
Net assets 317,234 354,680
EquityShare capital 22 15,857 15,788Share premium account 46,362 45,462Reserves 28 255,015 293,430
Equity shareholders’ funds 317,234 354,680
The Company reported a profit for the financial year ended 31 March 2018 of £5.3 million (2017: loss of £0.3 million). The financial statements were approvedby the Board of Directors and authorised for issue on 21 May 2018. They were signed on its behalf by:
James Gibson John TrotmanDirector Director
Company Registration No. 03625199

128
Company Statement of Changes in EquityYear ended 31 March 2018
Share Other non- CapitalShare premium distributable redemption Retained Owncapital account reserve reserve earnings shares Total£000 £000 £000 £000 £000 £000 £000
At 1 April 2017 15,788 45,462 74,950 1,795 217,704 (1,019) 354,680Total comprehensive income for the year – – – – 5,298 – 5,298Issue of share capital 69 900 – – – – 969Dividend – – – – (46,183) – (46,183)Credit to equity for equity-settledshare based payments – – – – 2,470 – 2,470
At 31 March 2018 15,857 46,362 74,950 1,795 179,289 (1,019) 317,234
The Company’s share capital is disclosed in note 22.
The own shares balance represents amounts held by the Employee Benefit Trust (see note 22).
Year ended 31 March 2017
Share Other non- CapitalShare premium distributable redemption Retained Own
capital account reserve reserve earnings shares Total£000 £000 £000 £000 £000 £000 £000
At 1 April 2016 15,737 45,227 74,950 1,795 256,877 (1,019) 393,567Total comprehensive loss for the year – – – – (339) – (339)Issue of share capital 51 235 – – – – 286Dividend – – – – (41,158) – (41,158)Credit to equity for equity-settledshare based payments – – – – 2,324 – 2,324
At 31 March 2017 15,788 45,462 74,950 1,795 217,704 (1,019) 354,680

129
Company Cash Flow StatementYear ended 31 March 2018
2018 2017Note £000 £000
Cash generated by operations 36 10,156 45,862
Interest paid (3,307) (3,572)Interest received 4,646 3,585
Cash flows from operating activities 11,495 45,875
Investing activitiesPurchase of non-current assets (30) (3)
Cash flows from investing activities (30) (3)
Financing activitiesIssue of share capital 969 286Dividends received 5,749 –Equity dividends paid (46,183) (41,158)Increase/(decrease) in borrowings 28,000 (5,000)
Cash flows from financing activities (11,465) (45,872)
Net movement in cash and cash equivalents – –Opening cash and cash equivalents 1 1
Closing cash and cash equivalents 1 1

130
Notes to the Financial Statements (continued)Year ended 31 March 2018
28. PROFIT/(LOSS) FOR THE YEARAs permitted by section 408 of the Companies Act 2006, the statement of comprehensive income of the Company is not presented as part of thesefinancial statements. The profit for the year attributable to equity shareholders dealt with in the financial statements of the Company was £5.3 million(2017: loss of £0.3 million).
29. BASIS OF ACCOUNTINGThe separate financial statements of the Company are presented as required by the Companies Act 2006. As permitted by that Act, the separate financialstatements have been prepared in accordance with International Financial Reporting Standards as endorsed by the EU.
The financial statements have been prepared on the historic cost basis except that derivative financial instruments are stated at fair value.
The Company’s principal accounting policies are the same as those applied in the Group financial statements. See note 23 for details of share basedpayments affecting the Company.
Going concernSee note 2 for the review of going concern for the Group and the Company.
Investment in subsidiariesThese are recognised at cost less provision for any impairment.
IFRIC 11, IFRS 2 Group and Treasury Share TransactionsThe Company makes equity settled share based payments to certain employees of certain subsidiary undertakings. Equity settled share based paymentsthat are made to the employees of the Company’s subsidiaries are treated as increases in equity over the vesting period of the award, with a correspondingincrease in the Company’s investments in subsidiaries, based on an estimate of the number of shares that will eventually vest. This is the only additionto investment in subsidiaries in the current year. The Company does not have any employees.
30. NON-CURRENT ASSETSa) Plant, equipment and owner occupied property
Fixtures,fittings
Freehold Leasehold & officeproperty improvements equipment Total
£000 £000 £000 £000
CostAt 31 March 2017 2,186 64 30 2,280Additions 8 – 23 31
At 31 March 2018 2,194 64 53 2,311
Accumulated depreciationAt 31 March 2017 (408) (20) (12) (440)Charge for the year (42) (1) (13) (56)
At 31 March 2018 (450) (21) (25) (496)
Net book valueAt 31 March 2018 1,744 43 28 1,815
At 31 March 2017 1,778 44 18 1,840

131
30. NON-CURRENT ASSETS (continued)b) Investments in subsidiary companies
Investment insubsidiary
undertakings£000
CostAt 31 March 2017 18,020Additions 2,470
At 31 March 2018 20,490
The Group subsidiaries are all wholly-owned, the Group holds 100% of the voting power and the companies are incorporated, registered and operatein England and Wales. The registered office of all subsidiaries is 2 The Deans, Bridge Road, Bagshot, Surrey, GU19 5AT. The subsidiaries at 31 March2018 are listed below:
Name of subsidiary Principal activity
.Big Yellow Self Storage (GP) Limited General Partner
.Big Yellow Self Storage Company Limited Self storageBig Yellow (Battersea) Limited Self storageThe Big Yellow Construction Company Limited Construction managementThe Big Yellow Holding Company Limited Holding CompanyBig Yellow Limited Partnership Self storageBig Yellow Nominee No. 1 Limited DormantBig Yellow Nominee No. 2 Limited DormantBig Yellow Self Storage (Chester) Limited Application to strike offBig Yellow Self Storage Company 1 Limited DormantBig Yellow Self Storage Company 2 Limited DormantBig Yellow Self Storage Company 3 Limited DormantBig Yellow Self Storage Company 4 Limited DormantBig Yellow Self Storage Company 8 Limited Self storageBig Yellow Self Storage Company A Limited Self storageBig Yellow Self Storage Company M Limited Self storageBYRCo Limited Property managementBYSSCo A Limited DormantBYSSCo Limited Self storageKator Storage Limited Self storageThe Last Mile Company Limited Holding CompanyLock & Leave Limited Self storageLock & Leave (Twickenham) Limited Self storage
In addition the Group has a 100% interest in Pramerica Bell Investment Trust Jersey, a trust registered in Jersey.
Audit exemption statementFor its most recent year end the companies listed below were entitled to exemption from audit under section 479A of the Companies Act 2006 relatingto subsidiary companies. The members of these companies have not required them to obtain an audit of their financial statements for the year ended31 March 2018.
.Big Yellow Self Storage (GP) Limited Big Yellow Self Storage Company 8 LimitedThe Big Yellow Construction Company Limited BYRCo LimitedBig Yellow Holding Company Limited BYSSCo LimitedBig Yellow Nominee No. 1 Limited BYSSCo A LimitedBig Yellow Nominee No. 2 Limited Kator Storage LimitedBig Yellow Self Storage Company 1 Limited The Last Mile Company LimitedBig Yellow Self Storage Company 2 Limited Lock & Leave LimitedBig Yellow Self Storage Company 3 Limited Lock & Leave (Twickenham) LimitedBig Yellow Self Storage Company 4 Limited

132
Notes to the Financial Statements (continued)Year ended 31 March 2018
31. TRADE AND OTHER RECEIVABLES31 March 31 March
2018 2017£000 £000
Amounts owed by Group undertakings 470,597 481,188Prepayments and accrued income 119 106
470,716 481,294
Amounts owed by Group undertakings are unsecured and are repayable on demand. The Company recharges its external interest cost to its subsidiaries.
32. TRADE AND OTHER PAYABLES31 March 31 March
2018 2017£000 £000
CurrentOther payables 3,247 2,992Accruals and deferred income 292 145
3,539 3,137
33. BANK BORROWINGS AND FINANCIAL INSTRUMENTS
Interest rate derivativesThe Company has one interest rate swap in place at the year end; £30 million fixed at 0.4% (excluding the margin on the underlying debt instrument)until October 2021. The floating rate at 31 March 2018 was paying a margin of 1.25% above one month LIBOR, the fixed rate debt was paying a margin of1.25%. The Group’s policy on risk management is set out in the Report on Corporate Governance on page 62 and in note 18.
31 March 31 March2018 2017£000 £000
Bank borrowings 173,000 145,000Unamortised loan arrangement fees – (1,365)
173,000 143,635
Maturity profile of financial liabilities2018 2017
Financial Financialliabilities liabilities
£000 £000
Between one and two years – –Between two and five years 173,000 145,000
Gross financial liabilities 173,000 145,000
The fair value of interest rate derivatives at 31 March 2018 was an asset of £751,000 (2017: asset of £297,000). See note 18 for detail of the interest rateprofile of financial liabilities.

133
34. FINANCIAL INSTRUMENTSThe disclosure relating to the Company’s financial instruments are detailed in note 18 to the Group financial statements. These disclosures are relevantto the Company’s bank borrowings and derivative financial instruments. In addition, the Company has trade and other payables of £3,539,000 in thecurrent year (of which the financial liability is £292,000 (2017: £3,137,000, of which the financial liability was £145,000), which are held at amortisedcost in the financial statements.
35. RELATED PARTY TRANSACTIONSIncluded within these financial statements are amounts owing from Group undertakings of £470,597,000 (2017: £481,188,000), including intercompanyinterest receivable of £5,101,000 (2017: £3,585,000) and dividends receivable of £5,749,000 (2017: £nil).
36. NOTES TO THE COMPANY CASH FLOW STATEMENT
Reconciliation of profit after tax to cash generated from operations2018 2017£000 £000
Profit/(loss) after tax 5,298 (339)Investment income (10,850) (3,585)Finance costs 4,647 2,975
Operating profit (905) (949)Depreciation 56 53Decrease in receivables 10,578 46,831Decrease in payables 427 (73)
Cash generated from operations 10,156 45,862
37. GLOSSARY
Adjusted eps Adjusted profit after tax divided by the diluted weighted average number of shares in issue during the period.
Adjusted NAV EPRA NAV adjusted for an investment property valuation carried out at purchasers’ costs of 2.75%.
Adjusted Profit Before Tax The Company’s pre-tax EPRA earnings measure with additional Company adjustments.
Average net achieved rent per sq ft Storage revenue divided by average occupied space over a defined period.
BREEAM An environmental rating assessed under the Building Research Establishment’s Environmental AssessmentMethod.
Carbon intensity Carbon emissions divided by the Group’s average occupied space.
Closing net rent per sq ft Annual storage revenue generated from in-place customers divided by occupied space at the balance sheet date.
Debt Long-term and short-term borrowings, as detailed in note 19, excluding finance leases and debt issue costs.
Earnings per share (eps) Profit for the period attributable to equity shareholders divided by the average number of shares in issue duringthe period.
EBITDA Earnings before interest, tax, depreciation and amortisation.
EPRA The European Public Real Estate Association, a real estate industry body. This organisation has issued Best PracticeRecommendations with the intention of improving the transparency, comparability and relevance of the publishedresults of listed real estate companies in Europe.
EPRA earnings The IFRS profit after taxation attributable to shareholders of the Company excluding investment propertyrevaluations, gains/losses on investment property disposals and changes in the fair value of financial instruments.
EPRA earnings per share EPRA earnings divided by the average number of shares in issue during the period.
EPRA NAV per share EPRA NAV divided by the diluted number of shares at the period end.
EPRA net asset value IFRS net assets excluding the mark-to-market on interest rate derivatives effective cash flow as deferred taxationon property valuations where it arises. It is adjusted for the dilutive impact of share options.
EPRA NNNAV The EPRA NAV adjusted to reflect the fair value of debt and derivatives and to include deferred taxation onrevaluations.
Equity All capital and reserves of the Group attributable to equity holders of the Company.

Notes to the Financial Statements (continued)Year ended 31 March 2018
134
37. GLOSSARY (continued)
Gross property assets The sum of investment property and investment property under construction.
Gross value added The measure of the value of goods and services produced in an area, industry or sector of an economy.
Income statement Statement of Comprehensive Income.
Interest cover The ratio of operating cash flow excluding working capital movements divided by interest paid (before exceptionalfinance costs, capitalised interest and changes in fair value of interest rate derivatives). This metric is providedto give readers a clear view of the Group’s financial position.
Like-for-like occupancy Excludes the closing occupancy of new stores acquired or opened in the current period.
Like-for-like revenue Excludes the impact of new stores acquired or opened in the current or preceding financial year in both the currentyear and comparative figures. This excludes Nine Elms and Twickenham 2 (both acquired in April 2016) andGuildford Central (opened in March 2018).
LTV (loan to value) Net debt expressed as a percentage of the external valuation of the Group’s investment properties.
Maximum lettable area (MLA) The total square foot (sq ft) available to rent to customers.
Move-ins The number of customers taking a storage room in the defined period.
Move-outs The number of customers vacating a storage room in the defined period.
NAV Net asset value.
Net debt Gross borrowings less cash and cash equivalents.
Net initial yield The forthcoming year’s net operating income expressed as a percentage of capital value, after adding notionalpurchaser’s costs.
Net promoter score (NPS) The Net Promoter Score is an index ranging from -100 to 100 that measures the willingness of customers torecommend a company’s products or services to others. The Company measures NPS based on surveys sent toall of its move-ins and move-outs.
Net rent per sq ft Storage revenue generated from in place customers divided by occupancy.
Occupancy The space occupied by customers divided by the MLA expressed as a %.
Occupied space The space occupied by customers in sq ft.
Pipeline The Group’s development sites.
Property Income Distribution (PID) A dividend, generally subject to withholding tax, that a UK REIT is required to pay from its tax exempt propertyrental business and which is taxable for UK-resident shareholders at their marginal tax rate.
REIT Real Estate Investment Trust. A tax regime which in the UK exempts participants from corporation tax both on UKrental income and gains arising on UK investment property sales, subject to certain conditions.
REVPAF Total store revenue divided by the average maximum lettable area in the year.
Store EBITDA Store earnings before interest, tax, depreciation and amortisation.
Total shareholder return (TSR) The growth in value of a shareholding over a specified period, assuming dividends are reinvested to purchaseadditional units of shares.

Ten Year SummaryYear ended 31 March 2018
2018 2017 2016 2015 2014 2013 2012 2011 2010 2009Results £000 £000 £000 £000 £000 £000 £000 £000 £000 £000
Revenue 116,660 109,070 101,382 84,276 72,196 69,671 65,663 61,885 57,995 58,487
Operating profit beforegains and losses onproperty assets 70,921 65,316 59,854 48,420 39,537 37,454 35,079 32,058 29,068 30,946
Cash flow fromoperating activities 62,977 55,974 55,467 42,397 32,752 30,186 27,388 23,534 19,063 10,203
Profit/(loss) beforetaxation 134,139 99,783 112,246 105,236 59,848 31,876 (35,551) 6,901 10,209 (71,489)
Adjusted profit beforetaxation 61,422 54,641 48,952 39,405 29,221 25,471 23,643 20,207 16,514 13,791
Net assets 981,148 890,350 829,387 750,914 594,064 552,628 494,500 544,949 547,285 502,317
EPRA earnings per share 38.5p 34.5p 31.1p 27.1p 20.5p 19.3p 18.2p 15.5p 13.0p 11.9pDeclared total dividend
per share 30.8p 27.6p 24.9p 21.7p 16.4p 11.0p 10.0p 9.0p 4.0p 0p
Key statisticsNumber of stores open 74 73 71 69 66 66 65 62 60 54Sq ft occupied (000) 3,730 3,551 3,363 3,178 2,832 2,632 2,458 2,130 1,915 1,775Occupancy increase
in year 000 sq ft)* 179 188 185 346 200 174 328 215 140 (75)Number of customers 55,000 52,500 50,000 47,250 41,800 38,500 36,300 32,800 30,500 28,500Average number of
employees duringthe year 335 329 318 300 289 286 279 273 252 239
* The occupancy growth in 2015 and 2017 includes the acquisition of existing stores
The paper used in this report is produced with FSC® mixed sources pulp which is partially recyclable, biodegradable, pH Neutral, heavy metal absence and acid-free. It is manufactured within a mill which complies with the international environmental ISO 14001 standard.
Pureprint Ltd is FSC certified, PEFC certified and ISO 14001 certified showing that it is committed to all round excellence and improving environmental performance is an important part of this strategy. We aim to reduce at source the effect our operations have on the environment, and are committed to continual improvement, prevention of pollution and compliance with any legislation or industry standards.
Pureprint Ltd is a Carbon Neutral® Printing Company.
Designed and produced by MAGEEwww.magee.co.uk
Printed by Pureprint Ltd