Embed Size (px)
Citation preview
This PDF is a section of the Unilever Annual Report and Accounts 2014. It does not contain sufficient information to allow a full understanding of the results of the Unilever Group and the state of affairs of Unilever N.V., Unilever PLC or the Unilever Group. For further information the Unilever Annual Report and Accounts 2014 should be consulted.
Certain sections of the Unilever Annual Report and Accounts 2014 have been audited. These are on pages 84 to 135, 137 to 139, and those parts noted as audited within the Directors’ Remuneration Report on pages 65 to 77.
The maintenance and integrity of the Unilever website is the responsibility of the Directors; the work carried out by the auditors does not involve consideration of these matters. Accordingly, the auditors accept no responsibility for any changes that may have occurred to the financial statements since they were initially placed on the website.
Legislation in the United Kingdom and the Netherlands governing the preparation and dissemination of financial statements may differ from legislation in other jurisdictions.
Except where you are a shareholder, this material is provided for information purposes only and is not, in particular, intended to confer any legal rights on you.
The Annual Report and Accounts does not constitute an invitation to invest in Unilever shares. Any decisions you make in reliance on this information are solely your responsibility.
The information is given as of the dates specified, is not updated, and any forward-looking statements are made subject to the reservations specified in the cautionary statement on the inside back cover of this PDF.
Unilever accepts no responsibility for any information on other websites that may be accessed from this site by hyperlinks.
DISCLAIMER
MAKINGSUSTAINABLE
LIVING COMMONPLACE
ANNUAL REPORT AND ACCOUNTS 2014 GOVERNANCE AND FINANCIAL REPORT
Notes to the consolidated financial statements (continued)
13 Trade and other current receivables 107
14 Trade payables and other liabilities 108
15 Capital and funding 109 15A Share capital 110 15B Equity 111 15C Financial liabilities 112
16 Treasury risk management 114 16A Management of liquidity risk 114 16B Management of market risk 116 16C Derivatives and hedging 118
17 Investment and return 119 17A Financial assets 120 17B Credit risk 121
18 Financial instruments fair value risk 121
19 Provisions 123
20 Commitments and contingent liabilities 124
21 Acquisitions and disposals 125
22 Assets and liabilities held for sale 127
23 Related party transactions 127
24 Purchase of Estate shares convertible to Unilever PLC shares in 2038 128
25 Remuneration of auditors 128
26 Events after the balance sheet date 128
27 Principal group companies and non-current investments 129
Company accounts – Unilever N.V. 131
Notes to the Company accounts – Unilever N.V. 132
Further statutory and other information – Unilever N.V. 135
Responsibilities of KPMG Accountants N.V. 136
Company accounts – Unilever PLC 137
Notes to the Company accounts – Unilever PLC 138
Index 140
GOVERNANCECorporate governance 41
Risks 49
Biographies 54
Report of the Audit Committee 56
Report of the Corporate Responsibility Committee 58
Report of the Nominating and Corporate Governance Committee 60
Directors’ Remuneration Report 62
FINANCIAL STATEMENTSStatement of Directors’ responsibilities 78
Independent auditors’ reports 79
Consolidated income statement 84
Consolidated statement of comprehensive income 84
Consolidated statement of changes in equity 85
Consolidated balance sheet 86
Consolidated cash flow statement 87
Notes to the consolidated financial statements 88
1 Accounting information and policies 88
2 Segment information 90
3 Gross profit and operating costs 92
4 Employees 93 4A Staff and management costs 93 4B Pensions and similar obligations 93 4C Share-based compensation plans 98
5 Net finance costs 99
6 Taxation 100 6A Income tax 100 6B Deferred tax 100 6C Tax on other comprehensive income 102
7 Combined earnings per share 102
8 Dividends on ordinary capital 103
9 Goodwill and intangible assets 103
10 Property, plant and equipment 105
11 Other non-current assets 106
12 Inventories 107
CONTENTS
OUR ANNUAL REPORT AND ACCOUNTS 2014 IS IN TWO PARTS:OUR STRATEGIC REPORTThe Strategic Report contains information about us, how we make money and how we run our business. It includes our strategy, business model, markets and Key Performance Indicators, as well as our approach to sustainability and risk.GOVERNANCE AND FINANCIAL REPORTThe Governance and Financial Report contains detailed corporate governance information, how we mitigate risk, our Committee reports and how we remunerate our Directors, plus our Financial Statements and Notes.
ANNUAL REPORT AND ACCOUNTS 2014
You can find more information about Unilever online at www.unilever.com. For the latest information on the USLP visit www.unilever.com/sustainable-living. Our Strategic Report and Governance and Financial Report, along with other relevant documents, can be downloaded at www.unilever.com/ara2014/downloads.
ONLINE
The Directors’ Report of Unilever PLC on pages 41-61, 78 (Statement of Directors’ responsibilities), 103 (Dividends on ordinary capital), 114-119 (Treasury risk management) and 135 and 139 (Post balance sheet event) has been approved by the PLC Board and signed on its behalf by Tonia Lovell – Group Secretary.
The Strategic Report, together with the governance section of the Governance and Financial Report, constitutes the report of the Directors within the meaning of Section 2:391 of the Dutch Civil Code and has been approved by the NV Board and signed on its behalf by Tonia Lovell – Group Secretary.
GOVERNANCE OF UNILEVERABOUT UNILEVERUnilever N.V. (NV) and Unilever PLC (PLC), together with their group companies have, since the Unilever Group was formed in 1930, operated as nearly as practicable as a single economic entity. This is achieved by special provisions in the Articles of Association of NV and PLC, together with a series of agreements between NV and PLC which are together known as the Foundation Agreements (described below). These agreements enable Unilever to achieve unity of management, operations, shareholders’ rights, purpose and mission and can be found on our website.
The Equalisation Agreement makes the economic position of the shareholders of NV and PLC, as far as possible, the same as if they held shares in a single company. The Equalisation Agreement regulates the mutual rights of the shareholders of NV and PLC. Under the Equalisation Agreement, NV and PLC must adopt the same financial periods and accounting policies.
The Deed of Mutual Covenants provides that NV and PLC and their respective subsidiary companies shall co-operate in every way for the purpose of maintaining a common operating policy. They shall exchange all relevant information about their respective businesses – the intention being to create and maintain a common operating platform for the Group throughout the world. The Deed also contains provisions for the allocation of assets between NV and PLC.
Under the Agreement for Mutual Guarantees of Borrowing between NV and PLC, each company will, if asked by the other, guarantee the borrowings of the other and the other’s subsidiaries. These arrangements are used, as a matter of financial policy, for certain significant borrowings. They enable lenders to rely on our combined financial strength.
NV’s Articles of Association contain, among other things, the objects clause, which sets out the scope of activities that NV is authorised to undertake. They are drafted to give a wide scope and provide that the primary objectives are: to carry on business as a holding company, to manage any companies in which it has an interest and to operate and carry into effect the Equalisation Agreement. At the 2010 PLC AGM, the shareholders agreed that the objects clause be removed from PLC’s Articles of Association so that there are no restrictions on its objects.
Each NV ordinary share represents the same underlying economic interest in the Unilever Group as each PLC ordinary share. However, NV and PLC remain separate legal entities with different shareholder constituencies and separate stock exchange listings. Shareholders cannot convert or exchange the shares of one for the shares of the other.
www.unilever.com/legalstructure
BOARDSThe Boards of NV and PLC have ultimate responsibility for the management, general affairs, direction, performance and long-term success of our business as a whole. The Boards are one-tier boards, the same people are on both Boards and the responsibility of the Directors is collective, taking into account their respective roles as Executive Directors and Non-Executive Directors. During 2014, Unilever continued to have two Executive Directors, the Chief Executive Officer (CEO) and Chief Financial Officer (CFO), who are also members of the Unilever Leadership Executive (ULE) and are full-time employees of Unilever. The majority of the Directors are Non-Executive Directors who essentially have a supervisory role.
A list of our current Directors, their roles on the Boards, their dates of appointments and their other major appointments is set out on page 54.
The Boards have delegated the operational running of the Group to the CEO with the exception of the following matters which are reserved for the Boards: structural and constitutional matters, corporate governance, approval of dividends, approval of overall strategy for the Group and approval of significant transactions or arrangements in relation to mergers, acquisitions, joint ventures and disposals, capital expenditure, contracts, litigation, financing and pensions. The CEO is responsible to the Boards and is able to delegate any of his powers and discretions which he does to members of the ULE. The ULE is chaired by and reports to the CEO. The biographies of ULE members are on page 55.
BOARD COMMITTEESThe Boards have established four Board Committees: the Audit Committee, the Compensation Committee, the Corporate Responsibility Committee and the Nominating and Corporate Governance Committee. The terms of reference of these Committees can be found on our website and the reports of each Committee can be found on pages 56 to 77. Attendance tables can be found within each Committee Report.
www.unilever.com/committees
THE GOVERNANCE OF UNILEVERFurther details of the roles and responsibilities of the Chairman, Vice Chairman, CEO and other corporate officers and how our Boards effectively operate as one board, govern themselves and delegate their authorities are set out in the document entitled ‘The Governance of Unilever’, which can be found on our website.
The Governance of Unilever also describes the Foundation Agreements, Directors’ appointment, tenure, induction and training, Directors’ ability to seek independent advice at Unilever’s expense and details about Board and Management Committees (including the Disclosure Committee).
www.unilever.com/corporategovernance
BOARD EFFECTIVENESSBOARD MEETINGSA minimum of five face-to-face meetings are planned throughout the calendar year to consider, for example, the half-year and full-year results announcements of the Group and the Annual Report and Accounts. Other Board meetings and telephone conferences are held to discuss matters that arise as well as Group strategic issues. Meetings of the Boards may be held either in London or in Rotterdam or such other locations as the Boards think fit, with one or two off-site Board meetings a year. The Chairman sets the Boards’ agenda, ensures the Directors receive accurate, timely and clear information, and promotes effective relationships and open communication between the Executive and Non-Executive Directors.
41Unilever Annual Report and Accounts 2014 Governance
CORPORATE GOVERNANCE
In 2014 the Boards met physically in January, March, May, July, September and November and considered important corporate events and actions, such as: • developing and approval of the overall strategy; • oversight of the performance of the business; • review of risks and internal risk management and
control systems; • authorisation of major transactions; • declaration of dividends; • convening of shareholders’ meetings; • nominations for Board appointments; • review of Directors’ remuneration policy; • review of the functioning of the Boards and their Committees; and • review of corporate responsibility and sustainability,
in particular the Unilever Sustainable Living Plan.
ATTENDANCEThe following table shows the attendance of Directors at Board meetings in 2014. If Directors are unable to attend a Board meeting they have the opportunity beforehand to discuss any agenda items with the Chairman. Attendance is expressed as the number of meetings attended out of the number eligible to be attended.
Main Board
Michael Treschow(a) 7/7Kees Storm(b) 6/7Paul Polman(c) 7/7Jean-Marc Huët(c) 7/7Laura Cha 7/7Louise Fresco 7/7Ann Fudge 7/7Charles Golden(d) 3/3Byron Grote 7/7Mary Ma 7/7Hixonia Nyasulu 7/7Sir Malcolm Rifkind 6/7John Rishton 7/7Feike Sijbesma(e) 1/1Paul Walsh 7/7(a) Chairman(b) Vice-Chairman/Senior Independent Director(c) Executive Director(d) Retired from the Boards on 14 May 2014(e) Appointed to the Boards with effect from 1 November 2014
NON-EXECUTIVE DIRECTOR MEETINGSThe Non-Executive Directors meet as a group, without the Executive Directors present, to consider specific agenda items set by them, usually four or five times a year. In 2014 they met five times. The Chairman, or in his absence the Vice-Chairman/Senior Independent Director, chairs such meetings.
BOARD EVALUATIONEach year the Boards formally assess their own performance with the aim of helping to improve the effectiveness of both the Boards and the Committees and at least once every three years an independent third party facilitates the evaluation. The evaluation consists of individual interviews with the Directors by the Chairman and also, every three years, by the external evaluator. These interviews complement our annual process of completion by all Directors of three full and confidential online evaluation questionnaires on our Boards, CEO and Chairman. The detailed Board questionnaire invites comments on a number of key areas including Board responsibility, operations, effectiveness, training and knowledge.
As in 2011 Mr J. de Leeuw, an independent external consultant, facilitated the 2014 Board evaluation. Mr J. de Leeuw has no other connection with the Unilever Group. The Chairman’s Statement on page 2 describes the key actions agreed by the Boards following that evaluation.
page 2 of the Strategic Report
In addition to the evaluation of the Boards’ effectiveness, each year the Chairman conducts a process of evaluating the performance and contribution of each Director which includes a one-to-one performance and feedback discussion with each Director. The evaluation of the performance of the Chairman is led by the Vice-Chairman/Senior Independent Director and the Chairman leads the evaluation of the CEO, both using bespoke questionnaires. Committees of the Boards evaluate themselves annually under supervision of their respective Chairmen taking into account the views of respective Committee members and the Boards.
APPOINTMENTIn seeking to ensure that NV and PLC have the same Directors, the Articles of Association of NV and PLC contain provisions which are designed to ensure that both NV and PLC shareholders are presented with the same candidates for election as Directors. Anyone being elected as a Director of NV must also be elected as a Director of PLC and vice versa. Therefore, if an individual fails to be elected to both companies he or she will be unable to take his or her place on either Board. These provisions of the Articles cannot be changed without the permission, in the case of NV, of the holders of the NV special ordinary shares and, in the case of PLC, of the holders of the PLC deferred stock.
The report of the Nominating and Corporate Governance Committee (NCGC) on pages 60 and 61 describes the work of the NCGC in Board appointments and recommendations for re-election. In addition, shareholders are able to nominate Directors. The procedure for shareholders to nominate Directors can be found in the ‘Appointment procedure for NV & PLC Directors’ document under ‘download links’ on our website. To do so they must put a resolution to both the NV and PLC AGMs in line with local requirements. Directors are appointed by shareholders by a simple majority vote at each AGM.
www.unilever.com/boardsofunilever
DIRECTOR INDUCTION AND TRAININGAll Directors receive induction on joining the Boards and the Chairman ensures that ongoing training is provided for Directors by way of site visits, presentations and circulated updates at (and between) Board and Board Committee meetings on, among other things, Unilever’s business, environmental, social and corporate governance, regulatory developments and investor relations matters. Details of the training provided to the Directors in 2014 can be found in the Chairman’s Statement on page 2.
page 2 of the Strategic Report
INDEPENDENCE AND CONFLICTSAs the Non-Executive Directors make up the Committees of the Boards, it is important that they can be considered to be independent. Each year the Boards conduct a thorough review of the Non-Executive Directors’, and their related or connected persons’, relevant relationships referencing the criteria set out in ‘The Governance of Unilever’ which is derived from the relevant best practice guidelines in the Netherlands, UK and US.
42 Unilever Annual Report and Accounts 2014Governance
CORPORATE GOVERNANCE CONTINUED
The Boards currently consider all our Non-Executive Directors to be independent of Unilever. Furthermore, the Boards have determined that Byron Grote’s current position of serving on the audit committees of more than three public companies does not impair his ability to effectively serve on the Audit Committee.
We attach special importance to avoiding conflicts of interest between NV and PLC and their respective Directors. The Boards ensure that there are effective procedures in place to avoid conflicts of interest by Board members. If appropriate, authorisation of situational conflicts is given by the Boards to the relevant Director. The authorisation includes conditions relating to keeping Unilever information confidential and to the Director’s exclusion from receiving and discussing relevant information at Board meetings. Situational conflicts are reviewed annually by the Boards as part of the determination of Director independence. In between those reviews Directors have a duty to inform the Boards of any relevant changes to the situation. A Director may not vote on, or be counted in a quorum in relation to, any resolution of the Boards in respect of any situation in which he or she has a conflict of interest. The procedures that Unilever has put in place to deal with conflicts of interest operate effectively.
Unilever recognises the benefit to the individual and the Group of senior executives acting as directors of other companies but, to ensure outside directorships of our Executive Directors do not involve an excessive commitment or conflict of interest, the number of outside directorships of listed companies is generally limited to one per Executive Director and approval is required from the Chairman.
INDEMNIFICATIONThe terms of NV Directors’ indemnification are provided for in NV’s Articles of Association. The power to indemnify PLC Directors is provided for in PLC’s Articles of Association and deeds of indemnity have been issued to all PLC Directors. Appropriate qualifying third party directors’ and officers’ liability insurance was in place for all Unilever Directors throughout 2014 and is currently in force.
In addition, PLC provides indemnities (including, where applicable, a qualifying pension scheme indemnity provision) to the Directors of three subsidiaries which each acts as trustee of a Unilever UK pension fund. Appropriate trustee liability insurance is also in place.
OUR SHARESNV SHARES
SHARE CAPITALNV’s issued share capital on 31 December 2014 was made up of: • €274,356,432 split into 1,714,727,700 ordinary shares of
€0.16 each;• €1,028,568 split into 2,400 ordinary shares numbered 1 to
2,400 known as special shares; and• €81,454,014 split into two classes (6% and 7%) of cumulative
preference shares (financing preference shares)*.
* These shares are included within liabilities (note 15C).
LISTINGSNV has listings of shares and depositary receipts for shares on Euronext Amsterdam and of New York Registry Shares on the New York Stock Exchange.
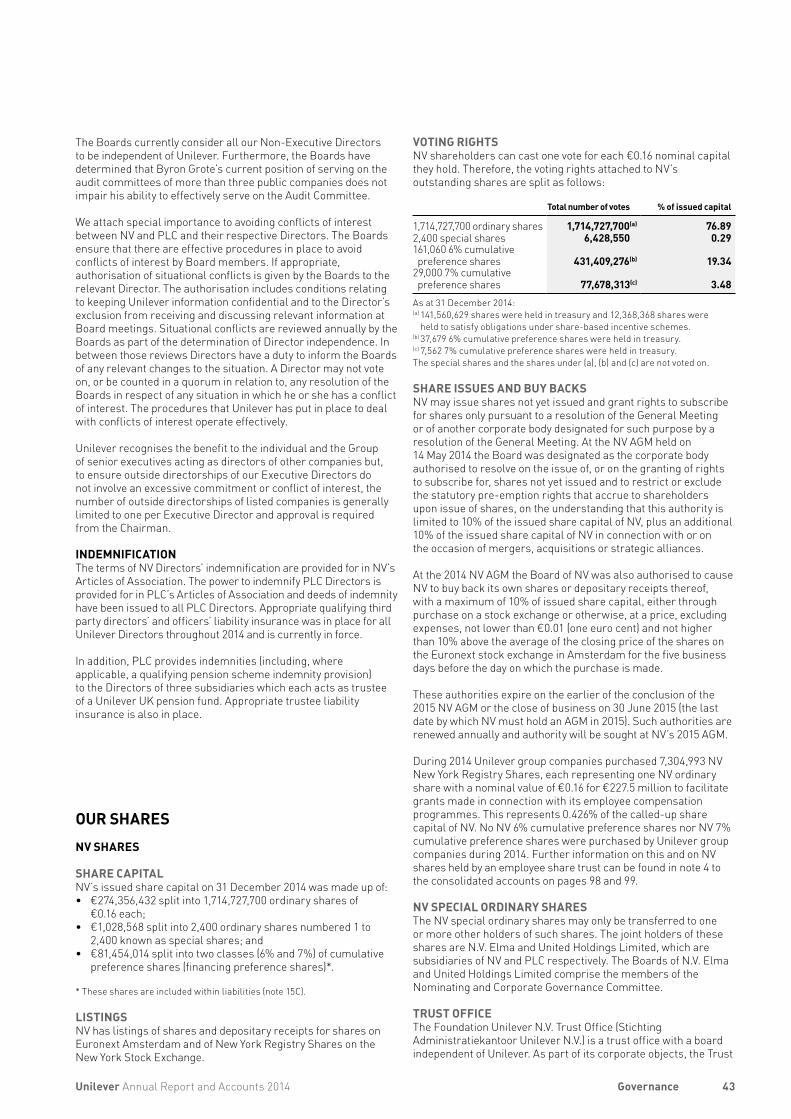
VOTING RIGHTSNV shareholders can cast one vote for each €0.16 nominal capital they hold. Therefore, the voting rights attached to NV’s outstanding shares are split as follows:
Total number of votes % of issued capital
1,714,727,700 ordinary shares 1,714,727,700(a) 76.892,400 special shares 6,428,550 0.29161,060 6% cumulative preference shares 431,409,276(b) 19.34
29,000 7% cumulative preference shares 77,678,313(c) 3.48
As at 31 December 2014:(a) 141,560,629 shares were held in treasury and 12,368,368 shares were
held to satisfy obligations under share-based incentive schemes.(b) 37,679 6% cumulative preference shares were held in treasury.(c) 7,562 7% cumulative preference shares were held in treasury.The special shares and the shares under (a), (b) and (c) are not voted on.
SHARE ISSUES AND BUY BACKSNV may issue shares not yet issued and grant rights to subscribe for shares only pursuant to a resolution of the General Meeting or of another corporate body designated for such purpose by a resolution of the General Meeting. At the NV AGM held on 14 May 2014 the Board was designated as the corporate body authorised to resolve on the issue of, or on the granting of rights to subscribe for, shares not yet issued and to restrict or exclude the statutory pre-emption rights that accrue to shareholders upon issue of shares, on the understanding that this authority is limited to 10% of the issued share capital of NV, plus an additional 10% of the issued share capital of NV in connection with or on the occasion of mergers, acquisitions or strategic alliances.
At the 2014 NV AGM the Board of NV was also authorised to cause NV to buy back its own shares or depositary receipts thereof, with a maximum of 10% of issued share capital, either through purchase on a stock exchange or otherwise, at a price, excluding expenses, not lower than €0.01 (one euro cent) and not higher than 10% above the average of the closing price of the shares on the Euronext stock exchange in Amsterdam for the five business days before the day on which the purchase is made.
These authorities expire on the earlier of the conclusion of the 2015 NV AGM or the close of business on 30 June 2015 (the last date by which NV must hold an AGM in 2015). Such authorities are renewed annually and authority will be sought at NV’s 2015 AGM.
During 2014 Unilever group companies purchased 7,304,993 NV New York Registry Shares, each representing one NV ordinary share with a nominal value of €0.16 for €227.5 million to facilitate grants made in connection with its employee compensation programmes. This represents 0.426% of the called-up share capital of NV. No NV 6% cumulative preference shares nor NV 7% cumulative preference shares were purchased by Unilever group companies during 2014. Further information on this and on NV shares held by an employee share trust can be found in note 4 to the consolidated accounts on pages 98 and 99.
NV SPECIAL ORDINARY SHARESThe NV special ordinary shares may only be transferred to one or more other holders of such shares. The joint holders of these shares are N.V. Elma and United Holdings Limited, which are subsidiaries of NV and PLC respectively. The Boards of N.V. Elma and United Holdings Limited comprise the members of the Nominating and Corporate Governance Committee.
TRUST OFFICEThe Foundation Unilever N.V. Trust Office (Stichting Administratiekantoor Unilever N.V.) is a trust office with a board independent of Unilever. As part of its corporate objects, the Trust
43Unilever Annual Report and Accounts 2014 Governance
up to a maximum of £13,300,000 nominal value (which at the time represented approximately 33% of PLC’s issued ordinary share capital) and to disapply pre-emption rights up to approximately 5% of PLC’s issued ordinary share capital.
In addition, at PLC’s 2014 AGM the PLC Board was authorised by a resolution of PLC to make market purchases of its ordinary shares, up to a maximum of 128,345,000 shares representing just under 10% of PLC’s issued ordinary share capital and within the limits prescribed in the resolution until the earlier of the conclusion of PLC’s 2015 AGM and 30 June 2015. These authorities are renewed annually and authority will be sought at PLC’s 2015 AGM.
During 2014 Unilever group companies purchased 6,058,733 PLC American Depositary Receipt of shares, each representing one PLC ordinary share with a nominal value of 31/9p for €201.07 million to facilitate grants made in connection with its employee compensation programmes. This represents 0.462% of the called-up share capital of PLC. Further information on this and on PLC shares held by an employee share trust can be found in note 4 to the consolidated accounts on pages 98 and 99.
PLC DEFERRED STOCKThe joint holders of the PLC deferred stock are N.V. Elma and United Holdings Limited, which are subsidiaries of NV and PLC respectively. The Boards of N.V. Elma and United Holdings Limited comprise the members of the Nominating and Corporate Governance Committee.
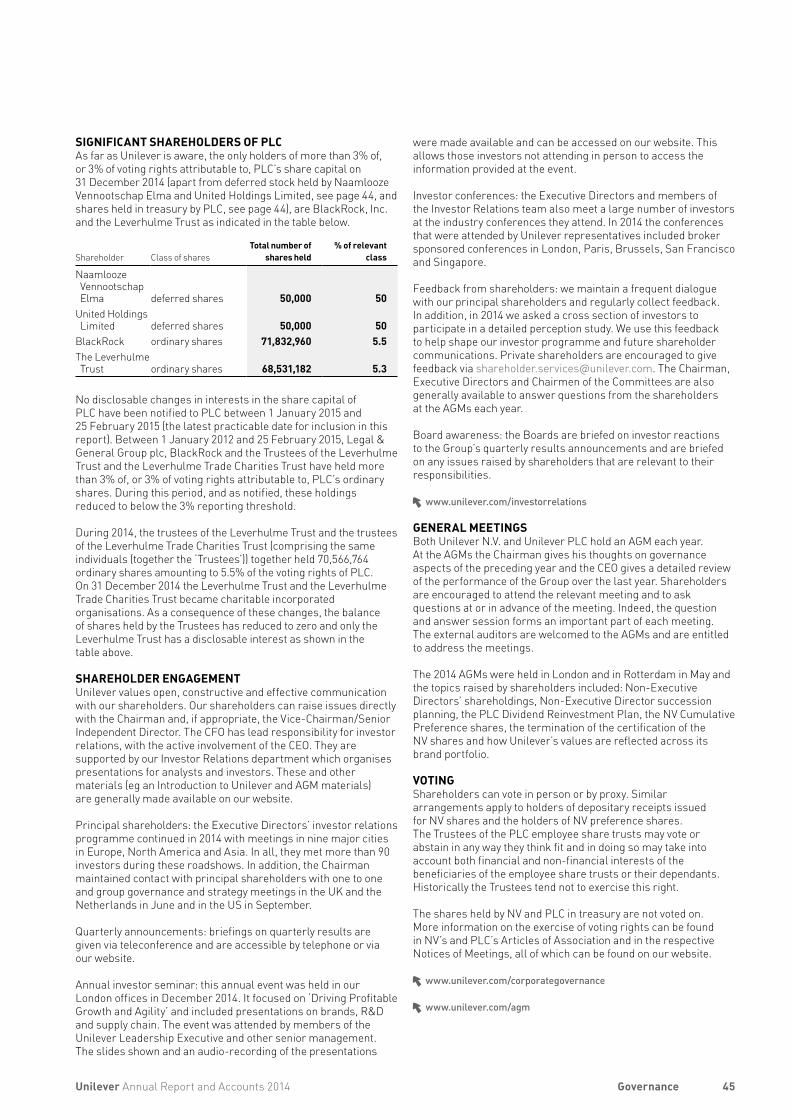
OUR SHAREHOLDERSSIGNIFICANT SHAREHOLDERS OF NVAs far as Unilever is aware, the only holders of more than 3% of, or 3% of voting rights attributable to, NV’s share capital on 31 December 2014 (apart from the Foundation Unilever N.V. Trust Office, see pages 43 and 44, and shares held in treasury by NV, see page 43), are ING Groep N.V. (ING), ASR Nederland N.V. (ASR) and BlackRock, Inc. (BlackRock) as indicated in the table below.
Shareholder Class of sharesTotal number of
shares held% of relevant
class
ING ordinary shares 5,653,749 0.337% cumulative preference shares 20,665 71.26
6% cumulative preference shares 74,088 46.0
ASR ordinary shares 3,169,339 0.186% cumulative preference shares 46,000 28.56
BlackRock ordinary shares 66,568,832 3.88(a)
(a) Representing 2.98% capital interest and 3.71% voting rights in the NV share capital.
As far as Unilever is aware, no disclosable changes in interests in the share capital of NV have been notified to the AFM between 1 January 2015 and 25 February 2015 (the latest practicable date for inclusion in this report). Between 1 January 2012 and 25 February 2015, ING, BlackRock and ASR have held more than 3% in the share capital of NV. Deutsche Bank, Bank of America Corporation and UBS AG also held more than 3% in the share capital of NV, however, during this period, and as notified, these holdings reduced to below the 3% reporting threshold.
Office issues depositary receipts in exchange for the NV ordinary shares and NV 7% preference shares. These depositary receipts are listed on Euronext Amsterdam, as are the NV ordinary and 7% preference shares themselves.
Holders of depositary receipts can under all circumstances exchange their depositary receipts for the underlying shares (and vice versa) and are entitled to dividends and all economic benefits on the underlying shares held by the Trust Office. There are no limitations on the holders’ voting rights, they can attend all General Meetings of NV, either personally or by proxy, and have the right to speak. The Trust Office only votes shares that are not represented at a General Meeting. The Trust Office votes in such a way as it deems to be in the interests of the holders of the depositary receipts. This voting policy is laid down in the Conditions of Administration that apply to the depositary receipts.
The Trust Office’s shareholding fluctuates daily. Its holdings on 31 December 2014 were 1,331,829,935 NV ordinary shares (77.67%) and 9,776 NV 7% cumulative preference shares (33.71%).
The members of the board at the Trust Office are Mr J H Schraven (chairman), Mr P P de Koning, Ms C M S Smits-Nusteling and Mr A A Olijslager. Prof Emeritus Dr L. Koopmans retired on 11 February 2015. The Trust Office reports periodically on its activities. Further information on the Trust Office, including its Articles of Association and Conditions of Administration, can be found on its website.
Unilever considers the arrangements of the Trust Office to be appropriate and in the interests of NV and its shareholders given the size of the voting rights attached to the financing preference shares and the relatively low attendance of holders of ordinary shares at the General Meetings of NV.
www.administratiekantoor-unilever.nl
PLC SHARES
SHARE CAPITALPLC’s issued share capital on 31 December 2014 was made up of: • £40,760,420 split into 1,310,156,361 ordinary shares of 31/9p
each; and • £100,000 of deferred stock of £1 each.
LISTINGSPLC has shares listed on the London Stock Exchange and, as American Depositary Receipts, on the New York Stock Exchange.
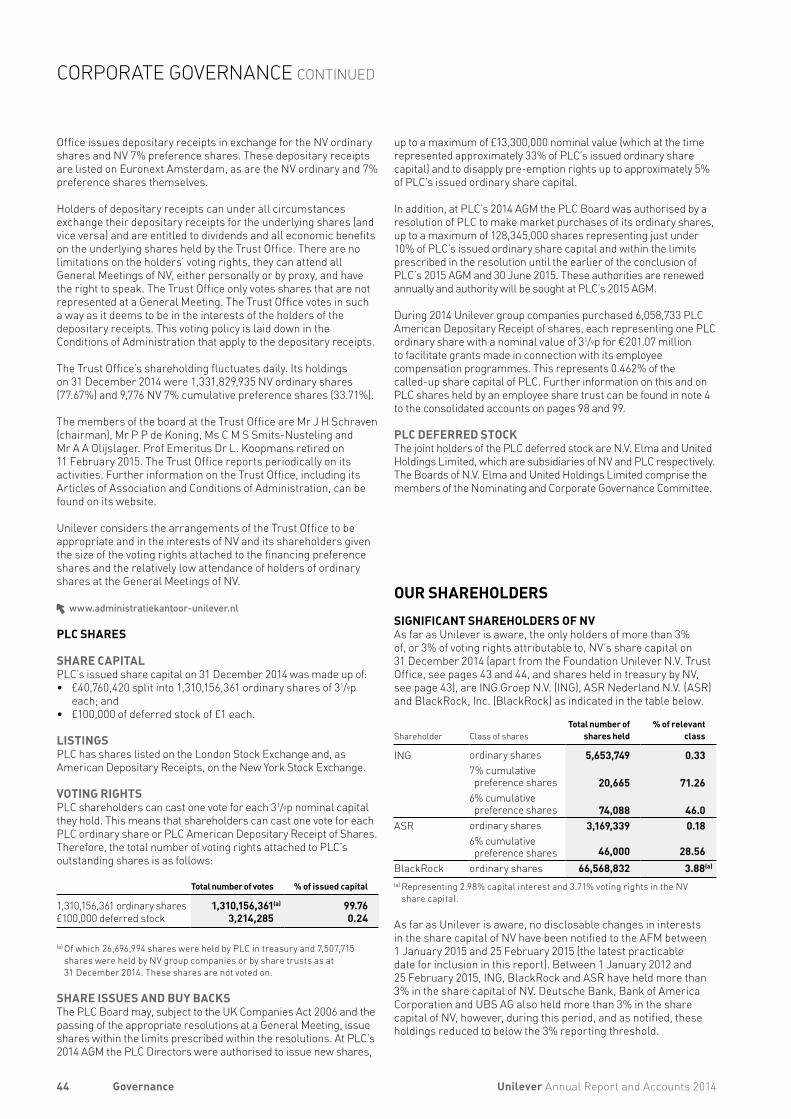
VOTING RIGHTSPLC shareholders can cast one vote for each 31/9p nominal capital they hold. This means that shareholders can cast one vote for each PLC ordinary share or PLC American Depositary Receipt of Shares. Therefore, the total number of voting rights attached to PLC’s outstanding shares is as follows:
Total number of votes % of issued capital
1,310,156,361 ordinary shares 1,310,156,361(a) 99.76£100,000 deferred stock 3,214,285 0.24
(a) Of which 26,696,994 shares were held by PLC in treasury and 7,507,715 shares were held by NV group companies or by share trusts as at 31 December 2014. These shares are not voted on.
SHARE ISSUES AND BUY BACKSThe PLC Board may, subject to the UK Companies Act 2006 and the passing of the appropriate resolutions at a General Meeting, issue shares within the limits prescribed within the resolutions. At PLC’s 2014 AGM the PLC Directors were authorised to issue new shares,
44 Unilever Annual Report and Accounts 2014Governance
CORPORATE GOVERNANCE CONTINUED
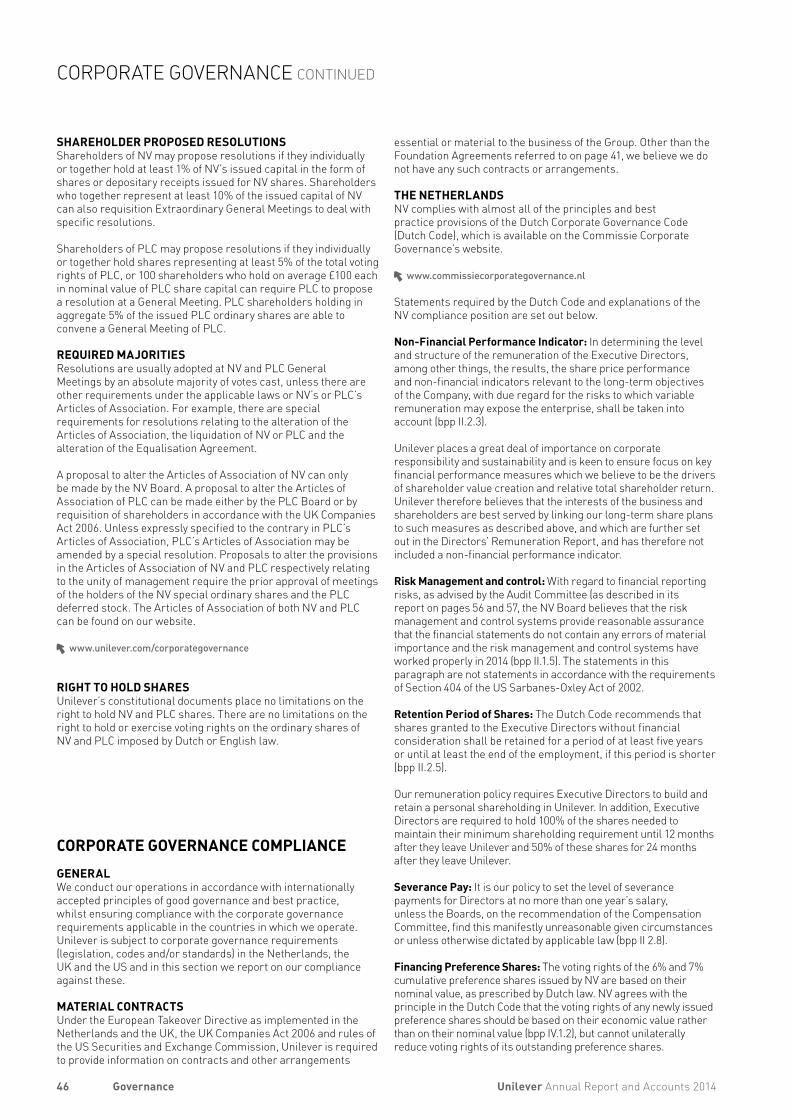
SIGNIFICANT SHAREHOLDERS OF PLCAs far as Unilever is aware, the only holders of more than 3% of, or 3% of voting rights attributable to, PLC’s share capital on 31 December 2014 (apart from deferred stock held by Naamlooze Vennootschap Elma and United Holdings Limited, see page 44, and shares held in treasury by PLC, see page 44), are BlackRock, Inc. and the Leverhulme Trust as indicated in the table below.
Shareholder Class of sharesTotal number of
shares held% of relevant
class
Naamlooze Vennootschap Elma deferred shares 50,000 50
United Holdings Limited deferred shares 50,000 50
BlackRock ordinary shares 71,832,960 5.5The Leverhulme Trust ordinary shares 68,531,182 5.3
No disclosable changes in interests in the share capital of PLC have been notified to PLC between 1 January 2015 and 25 February 2015 (the latest practicable date for inclusion in this report). Between 1 January 2012 and 25 February 2015, Legal & General Group plc, BlackRock and the Trustees of the Leverhulme Trust and the Leverhulme Trade Charities Trust have held more than 3% of, or 3% of voting rights attributable to, PLC’s ordinary shares. During this period, and as notified, these holdings reduced to below the 3% reporting threshold.
During 2014, the trustees of the Leverhulme Trust and the trustees of the Leverhulme Trade Charities Trust (comprising the same individuals (together the ‘Trustees’)) together held 70,566,764 ordinary shares amounting to 5.5% of the voting rights of PLC. On 31 December 2014 the Leverhulme Trust and the Leverhulme Trade Charities Trust became charitable incorporated organisations. As a consequence of these changes, the balance of shares held by the Trustees has reduced to zero and only the Leverhulme Trust has a disclosable interest as shown in the table above.
SHAREHOLDER ENGAGEMENT Unilever values open, constructive and effective communication with our shareholders. Our shareholders can raise issues directly with the Chairman and, if appropriate, the Vice-Chairman/Senior Independent Director. The CFO has lead responsibility for investor relations, with the active involvement of the CEO. They are supported by our Investor Relations department which organises presentations for analysts and investors. These and other materials (eg an Introduction to Unilever and AGM materials) are generally made available on our website.
Principal shareholders: the Executive Directors’ investor relations programme continued in 2014 with meetings in nine major cities in Europe, North America and Asia. In all, they met more than 90 investors during these roadshows. In addition, the Chairman maintained contact with principal shareholders with one to one and group governance and strategy meetings in the UK and the Netherlands in June and in the US in September.
Quarterly announcements: briefings on quarterly results are given via teleconference and are accessible by telephone or via our website.
Annual investor seminar: this annual event was held in our London offices in December 2014. It focused on ‘Driving Profitable Growth and Agility’ and included presentations on brands, R&D and supply chain. The event was attended by members of the Unilever Leadership Executive and other senior management. The slides shown and an audio-recording of the presentations
were made available and can be accessed on our website. This allows those investors not attending in person to access the information provided at the event.
Investor conferences: the Executive Directors and members of the Investor Relations team also meet a large number of investors at the industry conferences they attend. In 2014 the conferences that were attended by Unilever representatives included broker sponsored conferences in London, Paris, Brussels, San Francisco and Singapore.
Feedback from shareholders: we maintain a frequent dialogue with our principal shareholders and regularly collect feedback. In addition, in 2014 we asked a cross section of investors to participate in a detailed perception study. We use this feedback to help shape our investor programme and future shareholder communications. Private shareholders are encouraged to give feedback via [email protected]. The Chairman, Executive Directors and Chairmen of the Committees are also generally available to answer questions from the shareholders at the AGMs each year.
Board awareness: the Boards are briefed on investor reactions to the Group’s quarterly results announcements and are briefed on any issues raised by shareholders that are relevant to their responsibilities.
www.unilever.com/investorrelations
GENERAL MEETINGS Both Unilever N.V. and Unilever PLC hold an AGM each year. At the AGMs the Chairman gives his thoughts on governance aspects of the preceding year and the CEO gives a detailed review of the performance of the Group over the last year. Shareholders are encouraged to attend the relevant meeting and to ask questions at or in advance of the meeting. Indeed, the question and answer session forms an important part of each meeting. The external auditors are welcomed to the AGMs and are entitled to address the meetings.
The 2014 AGMs were held in London and in Rotterdam in May and the topics raised by shareholders included: Non-Executive Directors’ shareholdings, Non-Executive Director succession planning, the PLC Dividend Reinvestment Plan, the NV Cumulative Preference shares, the termination of the certification of the NV shares and how Unilever’s values are reflected across its brand portfolio.
VOTING Shareholders can vote in person or by proxy. Similar arrangements apply to holders of depositary receipts issued for NV shares and the holders of NV preference shares. The Trustees of the PLC employee share trusts may vote or abstain in any way they think fit and in doing so may take into account both financial and non-financial interests of the beneficiaries of the employee share trusts or their dependants. Historically the Trustees tend not to exercise this right.
The shares held by NV and PLC in treasury are not voted on. More information on the exercise of voting rights can be found in NV’s and PLC’s Articles of Association and in the respective Notices of Meetings, all of which can be found on our website.
www.unilever.com/corporategovernance
www.unilever.com/agm
45Unilever Annual Report and Accounts 2014 Governance
SHAREHOLDER PROPOSED RESOLUTIONS Shareholders of NV may propose resolutions if they individually or together hold at least 1% of NV’s issued capital in the form of shares or depositary receipts issued for NV shares. Shareholders who together represent at least 10% of the issued capital of NV can also requisition Extraordinary General Meetings to deal with specific resolutions.
Shareholders of PLC may propose resolutions if they individually or together hold shares representing at least 5% of the total voting rights of PLC, or 100 shareholders who hold on average £100 each in nominal value of PLC share capital can require PLC to propose a resolution at a General Meeting. PLC shareholders holding in aggregate 5% of the issued PLC ordinary shares are able to convene a General Meeting of PLC.
REQUIRED MAJORITIES Resolutions are usually adopted at NV and PLC General Meetings by an absolute majority of votes cast, unless there are other requirements under the applicable laws or NV’s or PLC’s Articles of Association. For example, there are special requirements for resolutions relating to the alteration of the Articles of Association, the liquidation of NV or PLC and the alteration of the Equalisation Agreement.
A proposal to alter the Articles of Association of NV can only be made by the NV Board. A proposal to alter the Articles of Association of PLC can be made either by the PLC Board or by requisition of shareholders in accordance with the UK Companies Act 2006. Unless expressly specified to the contrary in PLC’s Articles of Association, PLC’s Articles of Association may be amended by a special resolution. Proposals to alter the provisions in the Articles of Association of NV and PLC respectively relating to the unity of management require the prior approval of meetings of the holders of the NV special ordinary shares and the PLC deferred stock. The Articles of Association of both NV and PLC can be found on our website.
www.unilever.com/corporategovernance
RIGHT TO HOLD SHARES Unilever’s constitutional documents place no limitations on the right to hold NV and PLC shares. There are no limitations on the right to hold or exercise voting rights on the ordinary shares of NV and PLC imposed by Dutch or English law.
CORPORATE GOVERNANCE COMPLIANCEGENERAL We conduct our operations in accordance with internationally accepted principles of good governance and best practice, whilst ensuring compliance with the corporate governance requirements applicable in the countries in which we operate. Unilever is subject to corporate governance requirements (legislation, codes and/or standards) in the Netherlands, the UK and the US and in this section we report on our compliance against these.
MATERIAL CONTRACTSUnder the European Takeover Directive as implemented in the Netherlands and the UK, the UK Companies Act 2006 and rules of the US Securities and Exchange Commission, Unilever is required to provide information on contracts and other arrangements
essential or material to the business of the Group. Other than the Foundation Agreements referred to on page 41, we believe we do not have any such contracts or arrangements.
THE NETHERLANDSNV complies with almost all of the principles and best practice provisions of the Dutch Corporate Governance Code (Dutch Code), which is available on the Commissie Corporate Governance’s website.
www.commissiecorporategovernance.nl
Statements required by the Dutch Code and explanations of the NV compliance position are set out below.
Non-Financial Performance Indicator: In determining the level and structure of the remuneration of the Executive Directors, among other things, the results, the share price performance and non-financial indicators relevant to the long-term objectives of the Company, with due regard for the risks to which variable remuneration may expose the enterprise, shall be taken into account (bpp II.2.3).
Unilever places a great deal of importance on corporate responsibility and sustainability and is keen to ensure focus on key financial performance measures which we believe to be the drivers of shareholder value creation and relative total shareholder return. Unilever therefore believes that the interests of the business and shareholders are best served by linking our long-term share plans to such measures as described above, and which are further set out in the Directors’ Remuneration Report, and has therefore not included a non-financial performance indicator.
Risk Management and control: With regard to financial reporting risks, as advised by the Audit Committee (as described in its report on pages 56 and 57, the NV Board believes that the risk management and control systems provide reasonable assurance that the financial statements do not contain any errors of material importance and the risk management and control systems have worked properly in 2014 (bpp II.1.5). The statements in this paragraph are not statements in accordance with the requirements of Section 404 of the US Sarbanes-Oxley Act of 2002.
Retention Period of Shares: The Dutch Code recommends that shares granted to the Executive Directors without financial consideration shall be retained for a period of at least five years or until at least the end of the employment, if this period is shorter (bpp II.2.5).
Our remuneration policy requires Executive Directors to build and retain a personal shareholding in Unilever. In addition, Executive Directors are required to hold 100% of the shares needed to maintain their minimum shareholding requirement until 12 months after they leave Unilever and 50% of these shares for 24 months after they leave Unilever.
Severance Pay: It is our policy to set the level of severance payments for Directors at no more than one year’s salary, unless the Boards, on the recommendation of the Compensation Committee, find this manifestly unreasonable given circumstances or unless otherwise dictated by applicable law (bpp II 2.8).
Financing Preference Shares: The voting rights of the 6% and 7% cumulative preference shares issued by NV are based on their nominal value, as prescribed by Dutch law. NV agrees with the principle in the Dutch Code that the voting rights of any newly issued preference shares should be based on their economic value rather than on their nominal value (bpp IV.1.2), but cannot unilaterally reduce voting rights of its outstanding preference shares.
46 Unilever Annual Report and Accounts 2014Governance
CORPORATE GOVERNANCE CONTINUED
Anti-takeover constructions and control over the company: NV confirms that it has no anti-takeover constructions, in the sense of constructions that are intended solely, or primarily to block future hostile public offers for its shares (bpp IV.3.11). Nor does NV have any constructions whose specific purpose is to prevent a bidder, after acquiring 75% of the capital, from appointing or dismissing members of the Board and subsequently altering the Articles of Association. The acquisition through a public offer of a majority of the shares in a company does not, under Dutch law, preclude the continued right of the board of the company to exercise its powers.
Corporate Governance Statement: NV is required to make a statement concerning corporate governance as referred to in article 2a of the decree on additional requirements for annual reports (Vaststellingsbesluit nadere voorschriften inhoud jaarverslag) with effect from 1 January 2010 (the Decree). The information required to be included in this corporate governance statement as described in articles 3, 3a and 3b of the Decree can be found on our website.
www.unilever.com/corporategovernance
THE UNITED KINGDOMPLC, being a company that is incorporated in the UK and listed on the London Stock Exchange, is required to state how it has applied the main principles and how far it has complied with the provisions set out in the 2012 UK Corporate Governance Code (UK Code), which is available on the Financial Reporting Council’s (FRC) website. In 2014 PLC complied with all UK Code provisions.
www.frc.org.uk
Risk Management and Control: Our approach to risk management and systems of internal control is in line with the recommendations in the report on ‘Internal Control – Revised Guidance for Directors on the UK Combined Code’ (The Turnbull guidance). It is Unilever’s practice to bring acquired companies within the Group’s governance procedures as soon as is practicable and in any event by the end of the first full year of operation.
Greenhouse Gas (GHG) Emissions: As part of our Unilever Sustainable Living Plan (USLP), we have set ambitious eco-efficiency targets which include carbon dioxide (CO2) emissions from energy used in manufacturing as well as water and waste and targets for the new factories we are building.
In line with the Companies Act 2006 (Strategic Report and Directors’ Report) Regulations 2013 our greenhouse gas performance is set out below. We have used the Greenhouse Gas (GHG) Protocol Corporate Accounting and Reporting Standard (GHG Protocol) to calculate emissions of carbon dioxide from the combustion of fuels and the operation of facilities (Scope 1) and from purchased electricity, heat, steam and cooling (Scope 2) for our manufacturing facilities.
Carbon emission factors are used to convert energy used in manufacturing to emissions of CO2. Carbon emission factors for fuels are provided by the Intergovernmental Panel on Climate Change (IPCC).
Carbon emission factors for electricity reflect the country or sub-region where each manufacturing site is located and are provided by the International Energy Agency (IEA) and local regulatory authorities, for example the United States Environmental Protection Agency (US EPA). We have selected an intensity ratio based on production; this aligns with our long-standing reporting of manufacturing performance.
The GHG data relates to emissions during the 12-month period from 1 October 2013 to 30 September 2014. This period is different
from that for which the remainder of the Directors’ Report is prepared (which is the calendar year 2014).
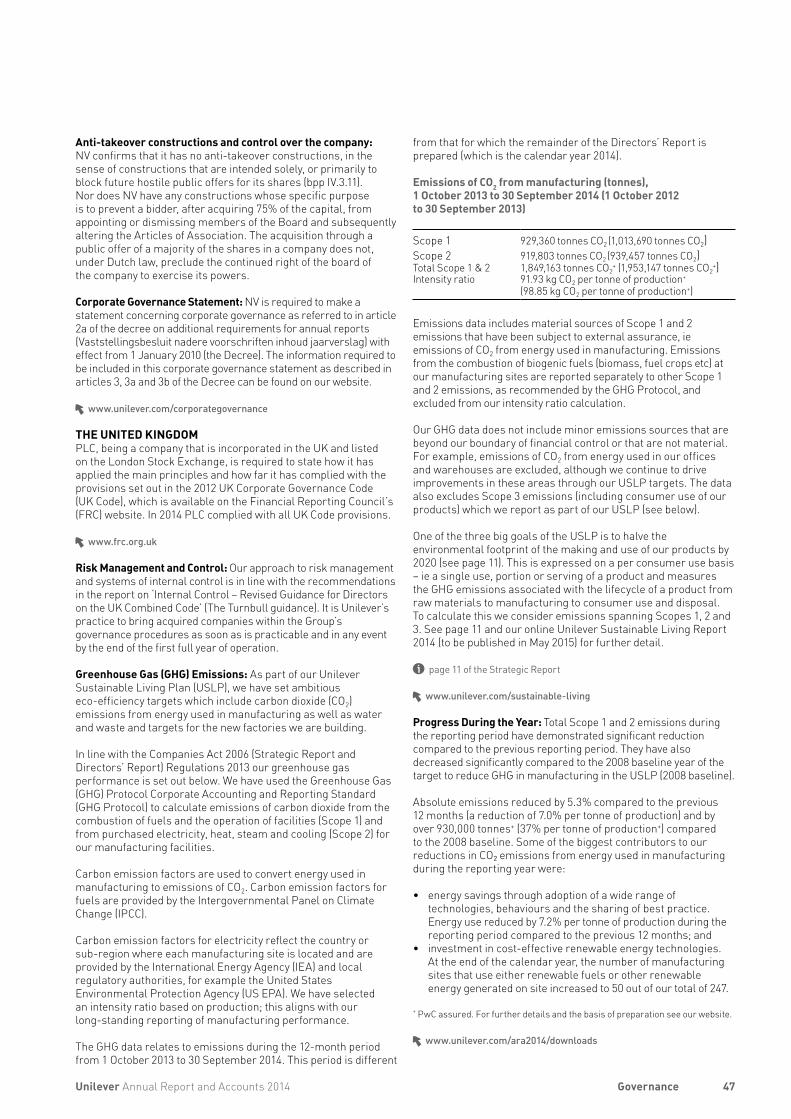
Emissions of CO2 from manufacturing (tonnes), 1 October 2013 to 30 September 2014 (1 October 2012 to 30 September 2013)
Scope 1 929,360 tonnes CO2 (1,013,690 tonnes CO2)Scope 2 919,803 tonnes CO2 (939,457 tonnes CO2)Total Scope 1 & 2 1,849,163 tonnes CO2
+ (1,953,147 tonnes CO2+)
Intensity ratio 91.93 kg CO2 per tonne of production+ (98.85 kg CO2 per tonne of production+)
Emissions data includes material sources of Scope 1 and 2 emissions that have been subject to external assurance, ie emissions of CO2 from energy used in manufacturing. Emissions from the combustion of biogenic fuels (biomass, fuel crops etc) at our manufacturing sites are reported separately to other Scope 1 and 2 emissions, as recommended by the GHG Protocol, and excluded from our intensity ratio calculation.
Our GHG data does not include minor emissions sources that are beyond our boundary of financial control or that are not material. For example, emissions of CO2 from energy used in our offices and warehouses are excluded, although we continue to drive improvements in these areas through our USLP targets. The data also excludes Scope 3 emissions (including consumer use of our products) which we report as part of our USLP (see below).
One of the three big goals of the USLP is to halve the environmental footprint of the making and use of our products by 2020 (see page 11). This is expressed on a per consumer use basis – ie a single use, portion or serving of a product and measures the GHG emissions associated with the lifecycle of a product from raw materials to manufacturing to consumer use and disposal. To calculate this we consider emissions spanning Scopes 1, 2 and 3. See page 11 and our online Unilever Sustainable Living Report 2014 (to be published in May 2015) for further detail.
page 11 of the Strategic Report
www.unilever.com/sustainable-living
Progress During the Year: Total Scope 1 and 2 emissions during the reporting period have demonstrated significant reduction compared to the previous reporting period. They have also decreased significantly compared to the 2008 baseline year of the target to reduce GHG in manufacturing in the USLP (2008 baseline).
Absolute emissions reduced by 5.3% compared to the previous 12 months (a reduction of 7.0% per tonne of production) and by over 930,000 tonnes+ (37% per tonne of production+) compared to the 2008 baseline. Some of the biggest contributors to our reductions in CO₂ emissions from energy used in manufacturing during the reporting year were:
• energy savings through adoption of a wide range of technologies, behaviours and the sharing of best practice. Energy use reduced by 7.2% per tonne of production during the reporting period compared to the previous 12 months; and
• investment in cost-effective renewable energy technologies. At the end of the calendar year, the number of manufacturing sites that use either renewable fuels or other renewable energy generated on site increased to 50 out of our total of 247.
+ PwC assured. For further details and the basis of preparation see our website.
www.unilever.com/ara2014/downloads
47Unilever Annual Report and Accounts 2014 Governance
Employee Involvement and Communication: Unilever’s UK companies maintain formal processes to inform, consult and involve employees and their representatives. A National Consultative Forum comprising employees and management representatives meets regularly to provide a forum for discussing issues relating to all Unilever sites in the United Kingdom. We recognise collective bargaining on a number of sites and engage with employees via the Sourcing Unit Forum, which includes national officer representation from the three recognised trade unions. A European Works Council, embracing employee and management representatives from countries within Europe, has been in existence for several years and provides a forum for discussing issues that extend across national boundaries.
The Directors’ Reports of the United Kingdom operating companies contain more details about how they have communicated with their employees during 2014.
Equal Opportunities and Diversity: In accordance with our Code of Business Principles, Unilever aims to ensure that applications for employment from everyone are given full and fair consideration and that everyone is given access to training, development and career opportunities. Every effort is also made to retrain and support employees who become disabled while working within the Group.
Independent Auditors and Disclosure of Information to Auditors: To the best of each of the Directors’ knowledge and belief, and having made appropriate enquiries, all information relevant to enabling the auditors to provide their opinions on PLC’s consolidated and parent company accounts has been provided. Each of the Directors has taken all reasonable steps to ensure their awareness of any relevant audit information and to establish that Unilever PLC’s auditors are aware of any such information.
THE UNITED STATESBoth NV and PLC are listed on the New York Stock Exchange (NYSE). As such, both companies must comply with the requirements of US legislation, such as the Sarbanes-Oxley Act of 2002, regulations enacted under US securities laws and the Listing Standards of the NYSE, that are applicable to foreign private issuers, copies of which are available on their websites.
www.sec.gov
www.nyse.com
We are substantially compliant with the Listing Standards of the NYSE applicable to foreign private issuers except as set out below.
We are required to disclose any significant ways in which our corporate governance practices differ from those typically followed by US companies listed on the NYSE. Our corporate governance practices are primarily based on the requirements of the UK Listing Rules, the UK Code and the Dutch Code but substantially conform to those required of US companies listed on the NYSE. The only significant way in which our corporate governance practices differ from those followed by domestic companies under Section 303A Corporate Governance Standards of the NYSE is that the NYSE rules require that shareholders must be given the opportunity to vote on all equity-compensation plans and material revisions thereto, with certain limited exemptions. The UK Listing Rules require shareholder approval of equity-compensation plans only if new or treasury shares are issued for the purpose of satisfying obligations under the plan or if the plan is a long-term incentive plan in which a director may participate. Amendments to plans approved by shareholders generally only require approval if they are to the advantage of the
plan participants. Furthermore, Dutch law and NV’s Articles of Association require shareholder approval of equity-compensation plans only if the Executive Directors are able to participate in such plans. Under Dutch law, shareholder approval is not required for material revisions to equity-compensation plans unless the Executive Directors participate in a plan and the plan does not contain its own procedure for revisions.
Attention is drawn to the Report of the Audit Committee on pages 56 and 57. In addition, further details about our corporate governance are provided in the document entitled ‘The Governance of Unilever’ which can be found on our website.
All senior executives and senior financial officers have declared their understanding of and compliance with Unilever’s Code of Business Principles and the related Code Policies. No waiver from any provision of the Code of Business Principles or Code Policies was granted in 2014 to any of the persons falling within the scope of the SEC requirements. Our Code of Business Principles can be found on our website.
www.unilever.com/corporategovernance
Risk Management and Control: Following a review by the Disclosure Committee, Audit Committee and Boards, the CEO and the CFO concluded that the design and operation of the Group’s disclosure controls and procedures, including those defined in the United States Securities Exchange Act of 1934 – Rule 13a – 15(e), as at 31 December 2014 were effective, and that subsequently until 3 March 2015, the date of the approval of the Annual Report and Accounts by the Boards, there have been no significant changes in the Group’s internal controls, or in other factors that could significantly affect those controls.
Unilever is required by Section 404 of the US Sarbanes-Oxley Act of 2002 to report on the effectiveness of its internal control over financial reporting. This requirement will be reported on separately and will form part of Unilever’s Annual Report on Form 20-F.
48 Unilever Annual Report and Accounts 2014Governance
CORPORATE GOVERNANCE CONTINUED
OUR RISK APPETITE AND APPROACH TO RISK MANAGEMENT Risk management is integral to Unilever’s strategy and to the achievement of Unilever’s long-term goals. Our success as an organisation depends on our ability to identify and exploit the opportunities generated by our business and the markets we are in. In doing this we take an embedded approach to risk management which puts risk and opportunity assessment at the core of the leadership team agenda, which is where we believe it should be.
Unilever adopts a risk profile that is aligned to our Vision to double the size of our business while reducing our environmental footprint and increasing our positive social impact. Our available capital and other resources are applied to underpin our priorities. We aim to maintain a strong single A credit rating on a long-term basis.
Our approach to risk management is designed to provide reasonable, but not absolute, assurance that our assets are safeguarded, the risks facing the business are being assessed and mitigated and all information that may be required to be disclosed is reported to Unilever’s senior management including, where appropriate, the Chief Executive Officer and Chief Financial Officer.
ORGANISATIONThe Unilever Boards assume overall accountability for the management of risk and for reviewing the effectiveness of Unilever’s risk management and internal control systems.
The Boards have established a clear organisational structure with well defined accountabilities for the principal risks that Unilever faces in the short, medium and long term. This organisational structure and distribution of accountabilities and responsibilities ensures that every country in which we operate has specific resources and processes for risk review and risk mitigation. This is supported by the Unilever Leadership Executive, which takes an active responsibility for focusing on the principal areas of risk to Unilever. The Boards regularly review these risk areas, including consideration of environmental, social and governance matters, and retain responsibility for determining the nature and extent of the significant risks that Unilever is prepared to take to achieve its strategic objectives.
FOUNDATION AND PRINCIPLESUnilever’s approach to doing business is framed by our Purpose. Our Code of Business Principles sets out the standards of behaviour that we expect all employees to adhere to. Day-to-day responsibility for ensuring these principles are applied throughout Unilever rests with senior management across categories, geographies and functions. A network of Code Officers and Committees supports the activities necessary to communicate the Code, deliver training, maintain processes and procedures (including support lines) to report and respond to alleged breaches, and to capture and communicate learnings.
We have a framework of Code Policies that underpin the Code of Business Principles and set out the non-negotiable standards of behaviour expected from all our employees.
For each of our principal risks we have a risk management framework detailing the controls we have in place and who is responsible for both managing the overall risk and the individual controls mitigating that risk.
Unilever’s functional standards define mandatory requirements across a range of specialist areas such as health and safety, accounting and reporting and financial risk management.
PROCESSES Unilever operates a wide range of processes and activities across all its operations covering strategy, planning, execution and performance management. Risk management is integrated into every stage of this business cycle. These procedures are formalised and documented and are increasingly being centralised and automated into transactional and other information technology systems.
ASSURANCE AND RE-ASSURANCEAssurance on compliance with the Code of Business Principles and all of our Code Policies is obtained annually from Unilever management via a formal Code declaration. In addition, there are specialist compliance programmes which run during the year and vary depending on the business priorities. These specialist compliance programmes supplement the Code declaration. Our Corporate Audit function plays a vital role in providing to both management and the Boards an objective and independent review of the effectiveness of risk management and internal control systems throughout Unilever.
BOARDS’ ASSESSMENT OF COMPLIANCE WITH THE RISK MANAGEMENT FRAMEWORKSThe Boards, advised by the Committees where appropriate, regularly review the significant risks and decisions that could have a material impact on Unilever. These reviews consider the level of risk that Unilever is prepared to take in pursuit of the business strategy and the effectiveness of the management controls in place to mitigate the risk exposure.
The Boards, through the Audit Committee, have reviewed the assessment of risks, internal controls and disclosure controls and procedures in operation within Unilever. They have also considered the effectiveness of any remedial actions taken for the year covered by this report and up to the date of its approval by the Boards.
Details of the activities of the Audit Committee in relation to this can be found in the Report of the Audit Committee on pages 56 to 57.
Further statements on compliance with the specific risk management and control requirements in the Dutch Corporate Governance Code, the UK Corporate Governance Code, the US Securities Exchange Act (1934) and the Sarbanes-Oxley (2002) Act can be found on pages 46, 47 and 48.
PRINCIPAL RISK FACTORSOur business is subject to risks and uncertainties. On the following pages we have identified the risks that we regard as the most relevant to our business. These are the risks that we see as most material to Unilever’s business and performance at this time. There may be other risks that could emerge in the future. We have also commented below on certain mitigating actions that we believe help us to manage these risks. However, we may not be successful in deploying some or all of these mitigating actions. If the circumstances in these risks occur or are not successfully mitigated, our cash flow, operating results, financial position, business and reputation could be materially adversely affected. In addition, risks and uncertainties could cause actual results to vary from those described, which may include forward-looking statements, or could impact on our ability to meet our targets or be detrimental to our profitability or reputation.
49Unilever Annual Report and Accounts 2014 Governance
RISKS
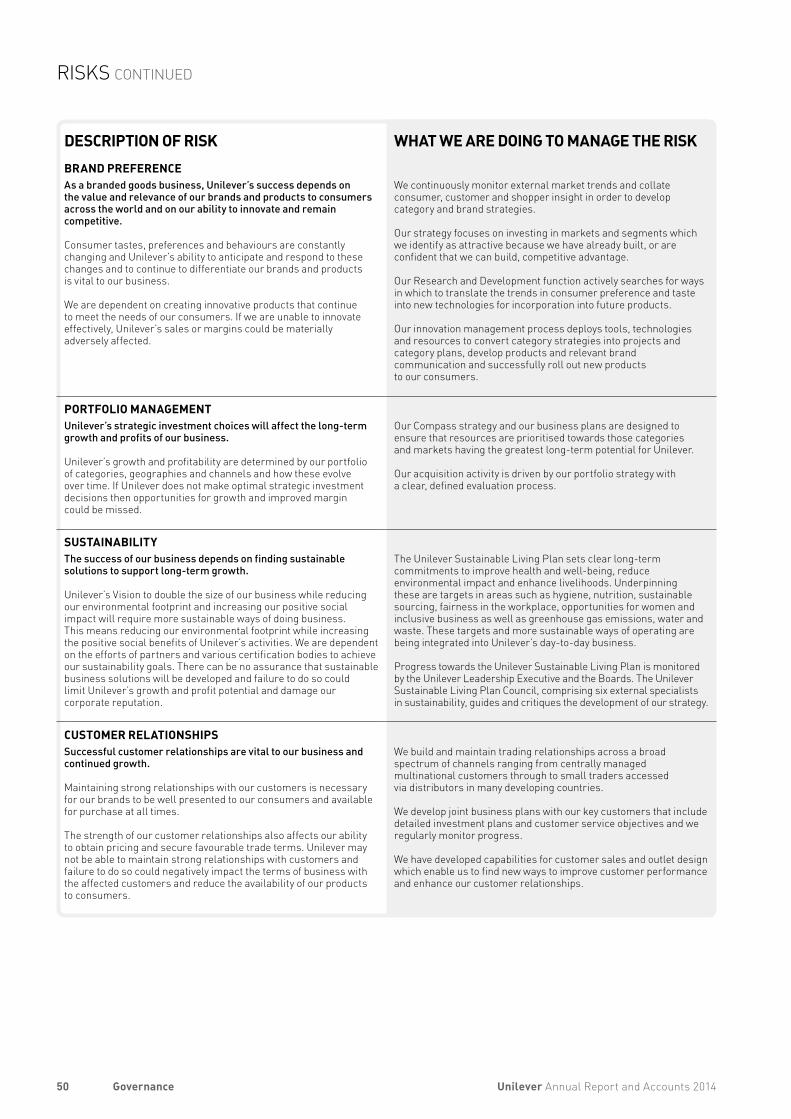
DESCRIPTION OF RISK WHAT WE ARE DOING TO MANAGE THE RISKBRAND PREFERENCEAs a branded goods business, Unilever’s success depends on the value and relevance of our brands and products to consumers across the world and on our ability to innovate and remain competitive.
Consumer tastes, preferences and behaviours are constantly changing and Unilever’s ability to anticipate and respond to these changes and to continue to differentiate our brands and products is vital to our business.
We are dependent on creating innovative products that continue to meet the needs of our consumers. If we are unable to innovate effectively, Unilever’s sales or margins could be materially adversely affected.
We continuously monitor external market trends and collate consumer, customer and shopper insight in order to develop category and brand strategies.
Our strategy focuses on investing in markets and segments which we identify as attractive because we have already built, or are confident that we can build, competitive advantage.
Our Research and Development function actively searches for ways in which to translate the trends in consumer preference and taste into new technologies for incorporation into future products.
Our innovation management process deploys tools, technologies and resources to convert category strategies into projects and category plans, develop products and relevant brand communication and successfully roll out new products to our consumers.
PORTFOLIO MANAGEMENTUnilever’s strategic investment choices will affect the long-term growth and profits of our business.
Unilever’s growth and profitability are determined by our portfolio of categories, geographies and channels and how these evolve over time. If Unilever does not make optimal strategic investment decisions then opportunities for growth and improved margin could be missed.
Our Compass strategy and our business plans are designed to ensure that resources are prioritised towards those categories and markets having the greatest long-term potential for Unilever.
Our acquisition activity is driven by our portfolio strategy with a clear, defined evaluation process.
SUSTAINABILITYThe success of our business depends on finding sustainable solutions to support long-term growth.
Unilever’s Vision to double the size of our business while reducing our environmental footprint and increasing our positive social impact will require more sustainable ways of doing business. This means reducing our environmental footprint while increasing the positive social benefits of Unilever’s activities. We are dependent on the efforts of partners and various certification bodies to achieve our sustainability goals. There can be no assurance that sustainable business solutions will be developed and failure to do so could limit Unilever’s growth and profit potential and damage our corporate reputation.
The Unilever Sustainable Living Plan sets clear long-term commitments to improve health and well-being, reduce environmental impact and enhance livelihoods. Underpinning these are targets in areas such as hygiene, nutrition, sustainable sourcing, fairness in the workplace, opportunities for women and inclusive business as well as greenhouse gas emissions, water and waste. These targets and more sustainable ways of operating are being integrated into Unilever’s day-to-day business.
Progress towards the Unilever Sustainable Living Plan is monitored by the Unilever Leadership Executive and the Boards. The Unilever Sustainable Living Plan Council, comprising six external specialists in sustainability, guides and critiques the development of our strategy.
CUSTOMER RELATIONSHIPSSuccessful customer relationships are vital to our business and continued growth.
Maintaining strong relationships with our customers is necessary for our brands to be well presented to our consumers and available for purchase at all times.
The strength of our customer relationships also affects our ability to obtain pricing and secure favourable trade terms. Unilever may not be able to maintain strong relationships with customers and failure to do so could negatively impact the terms of business with the affected customers and reduce the availability of our products to consumers.
We build and maintain trading relationships across a broad spectrum of channels ranging from centrally managed multinational customers through to small traders accessed via distributors in many developing countries.
We develop joint business plans with our key customers that include detailed investment plans and customer service objectives and we regularly monitor progress.
We have developed capabilities for customer sales and outlet design which enable us to find new ways to improve customer performance and enhance our customer relationships.
50 Unilever Annual Report and Accounts 2014Governance
RISKS CONTINUED
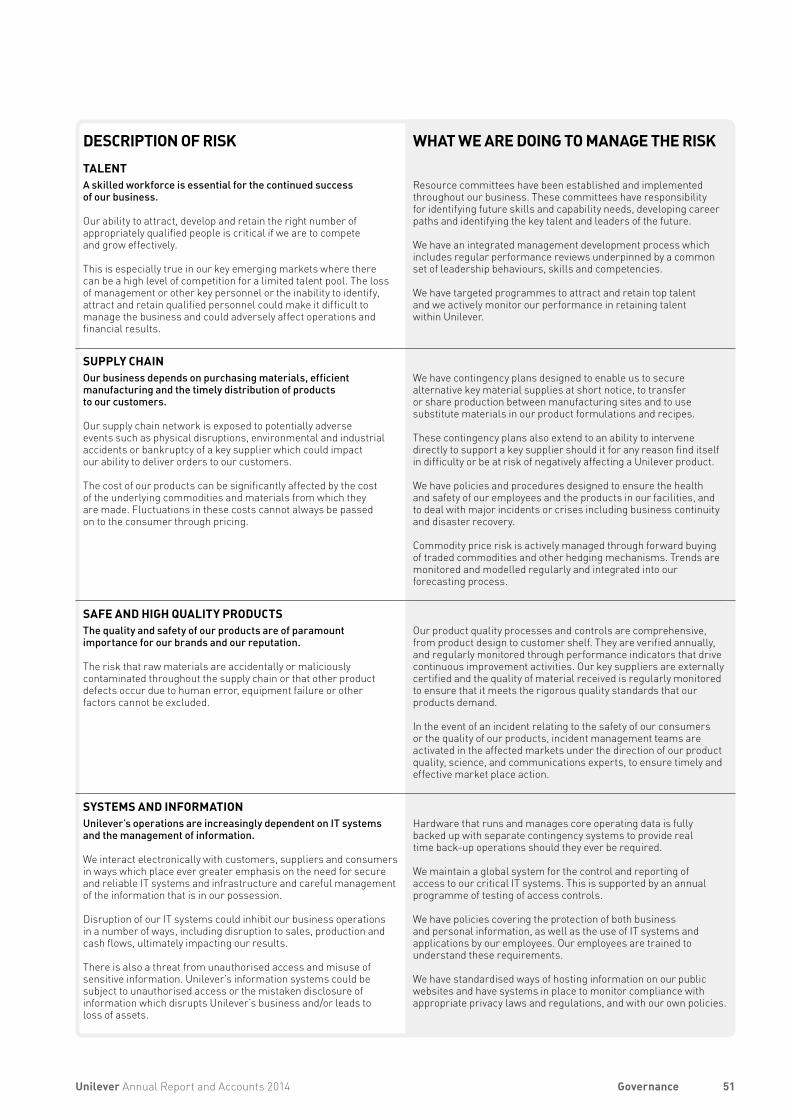
DESCRIPTION OF RISK WHAT WE ARE DOING TO MANAGE THE RISKTALENTA skilled workforce is essential for the continued success of our business.
Our ability to attract, develop and retain the right number of appropriately qualified people is critical if we are to compete and grow effectively.
This is especially true in our key emerging markets where there can be a high level of competition for a limited talent pool. The loss of management or other key personnel or the inability to identify, attract and retain qualified personnel could make it difficult to manage the business and could adversely affect operations and financial results.
Resource committees have been established and implemented throughout our business. These committees have responsibility for identifying future skills and capability needs, developing career paths and identifying the key talent and leaders of the future.
We have an integrated management development process which includes regular performance reviews underpinned by a common set of leadership behaviours, skills and competencies.
We have targeted programmes to attract and retain top talent and we actively monitor our performance in retaining talent within Unilever.
SUPPLY CHAINOur business depends on purchasing materials, efficient manufacturing and the timely distribution of products to our customers.
Our supply chain network is exposed to potentially adverse events such as physical disruptions, environmental and industrial accidents or bankruptcy of a key supplier which could impact our ability to deliver orders to our customers.
The cost of our products can be significantly affected by the cost of the underlying commodities and materials from which they are made. Fluctuations in these costs cannot always be passed on to the consumer through pricing.
We have contingency plans designed to enable us to secure alternative key material supplies at short notice, to transfer or share production between manufacturing sites and to use substitute materials in our product formulations and recipes.
These contingency plans also extend to an ability to intervene directly to support a key supplier should it for any reason find itself in difficulty or be at risk of negatively affecting a Unilever product.
We have policies and procedures designed to ensure the health and safety of our employees and the products in our facilities, and to deal with major incidents or crises including business continuity and disaster recovery.
Commodity price risk is actively managed through forward buying of traded commodities and other hedging mechanisms. Trends are monitored and modelled regularly and integrated into our forecasting process.
SAFE AND HIGH QUALITY PRODUCTSThe quality and safety of our products are of paramount importance for our brands and our reputation.
The risk that raw materials are accidentally or maliciously contaminated throughout the supply chain or that other product defects occur due to human error, equipment failure or other factors cannot be excluded.
Our product quality processes and controls are comprehensive, from product design to customer shelf. They are verified annually, and regularly monitored through performance indicators that drive continuous improvement activities. Our key suppliers are externally certified and the quality of material received is regularly monitored to ensure that it meets the rigorous quality standards that our products demand.
In the event of an incident relating to the safety of our consumers or the quality of our products, incident management teams are activated in the affected markets under the direction of our product quality, science, and communications experts, to ensure timely and effective market place action.
SYSTEMS AND INFORMATIONUnilever’s operations are increasingly dependent on IT systems and the management of information.
We interact electronically with customers, suppliers and consumers in ways which place ever greater emphasis on the need for secure and reliable IT systems and infrastructure and careful management of the information that is in our possession.
Disruption of our IT systems could inhibit our business operations in a number of ways, including disruption to sales, production and cash flows, ultimately impacting our results. There is also a threat from unauthorised access and misuse of sensitive information. Unilever’s information systems could be subject to unauthorised access or the mistaken disclosure of information which disrupts Unilever’s business and/or leads to loss of assets.
Hardware that runs and manages core operating data is fully backed up with separate contingency systems to provide real time back-up operations should they ever be required.
We maintain a global system for the control and reporting of access to our critical IT systems. This is supported by an annual programme of testing of access controls.
We have policies covering the protection of both business and personal information, as well as the use of IT systems and applications by our employees. Our employees are trained to understand these requirements.
We have standardised ways of hosting information on our public websites and have systems in place to monitor compliance with appropriate privacy laws and regulations, and with our own policies.
51Unilever Annual Report and Accounts 2014 Governance
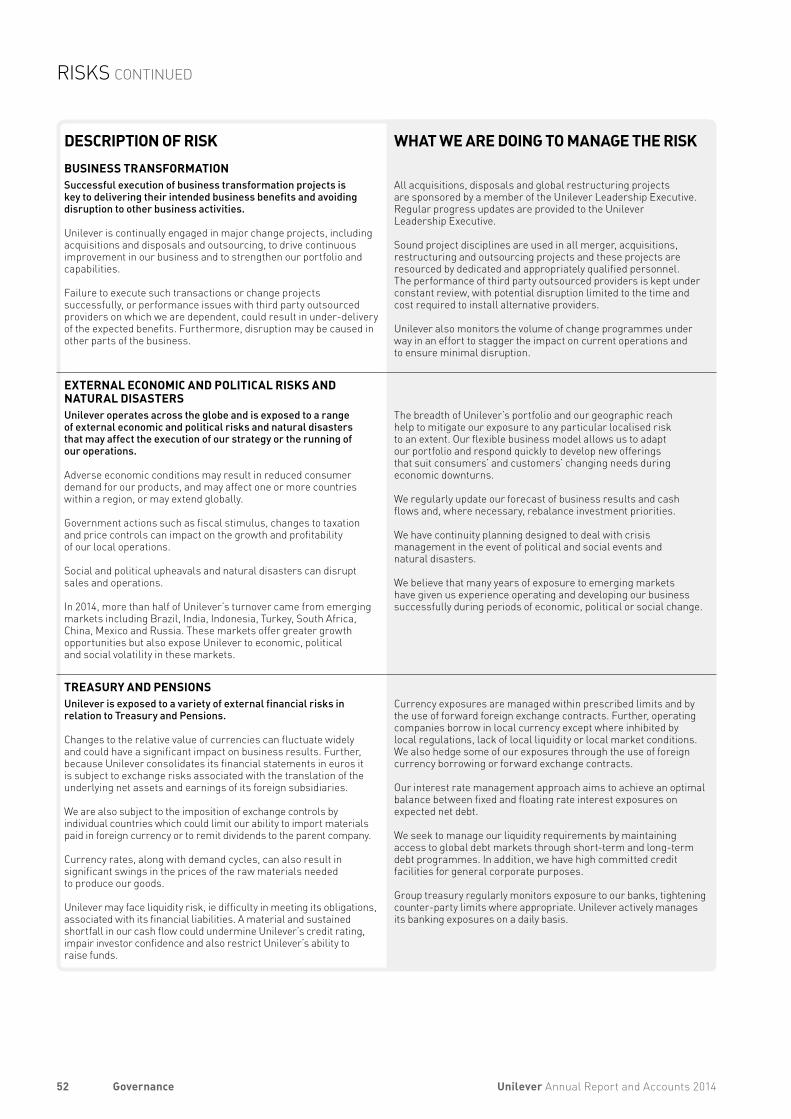
DESCRIPTION OF RISK WHAT WE ARE DOING TO MANAGE THE RISKBUSINESS TRANSFORMATIONSuccessful execution of business transformation projects is key to delivering their intended business benefits and avoiding disruption to other business activities.
Unilever is continually engaged in major change projects, including acquisitions and disposals and outsourcing, to drive continuous improvement in our business and to strengthen our portfolio and capabilities.
Failure to execute such transactions or change projects successfully, or performance issues with third party outsourced providers on which we are dependent, could result in under-delivery of the expected benefits. Furthermore, disruption may be caused in other parts of the business.
All acquisitions, disposals and global restructuring projects are sponsored by a member of the Unilever Leadership Executive. Regular progress updates are provided to the Unilever Leadership Executive.
Sound project disciplines are used in all merger, acquisitions, restructuring and outsourcing projects and these projects are resourced by dedicated and appropriately qualified personnel. The performance of third party outsourced providers is kept under constant review, with potential disruption limited to the time and cost required to install alternative providers.
Unilever also monitors the volume of change programmes under way in an effort to stagger the impact on current operations and to ensure minimal disruption.
EXTERNAL ECONOMIC AND POLITICAL RISKS AND NATURAL DISASTERSUnilever operates across the globe and is exposed to a range of external economic and political risks and natural disasters that may affect the execution of our strategy or the running of our operations.
Adverse economic conditions may result in reduced consumer demand for our products, and may affect one or more countries within a region, or may extend globally.
Government actions such as fiscal stimulus, changes to taxation and price controls can impact on the growth and profitability of our local operations.
Social and political upheavals and natural disasters can disrupt sales and operations.
In 2014, more than half of Unilever’s turnover came from emerging markets including Brazil, India, Indonesia, Turkey, South Africa, China, Mexico and Russia. These markets offer greater growth opportunities but also expose Unilever to economic, political and social volatility in these markets.
The breadth of Unilever’s portfolio and our geographic reach help to mitigate our exposure to any particular localised risk to an extent. Our flexible business model allows us to adapt our portfolio and respond quickly to develop new offerings that suit consumers’ and customers’ changing needs during economic downturns.
We regularly update our forecast of business results and cash flows and, where necessary, rebalance investment priorities.
We have continuity planning designed to deal with crisis management in the event of political and social events and natural disasters.
We believe that many years of exposure to emerging markets have given us experience operating and developing our business successfully during periods of economic, political or social change.
TREASURY AND PENSIONSUnilever is exposed to a variety of external financial risks in relation to Treasury and Pensions.
Changes to the relative value of currencies can fluctuate widely and could have a significant impact on business results. Further, because Unilever consolidates its financial statements in euros it is subject to exchange risks associated with the translation of the underlying net assets and earnings of its foreign subsidiaries.
We are also subject to the imposition of exchange controls by individual countries which could limit our ability to import materials paid in foreign currency or to remit dividends to the parent company.
Currency rates, along with demand cycles, can also result in significant swings in the prices of the raw materials needed to produce our goods.
Unilever may face liquidity risk, ie difficulty in meeting its obligations, associated with its financial liabilities. A material and sustained shortfall in our cash flow could undermine Unilever’s credit rating, impair investor confidence and also restrict Unilever’s ability to raise funds.
Currency exposures are managed within prescribed limits and by the use of forward foreign exchange contracts. Further, operating companies borrow in local currency except where inhibited by local regulations, lack of local liquidity or local market conditions. We also hedge some of our exposures through the use of foreign currency borrowing or forward exchange contracts.
Our interest rate management approach aims to achieve an optimal balance between fixed and floating rate interest exposures on expected net debt.
We seek to manage our liquidity requirements by maintaining access to global debt markets through short-term and long-term debt programmes. In addition, we have high committed credit facilities for general corporate purposes.
Group treasury regularly monitors exposure to our banks, tightening counter-party limits where appropriate. Unilever actively manages its banking exposures on a daily basis.
52 Unilever Annual Report and Accounts 2014Governance
RISKS CONTINUED
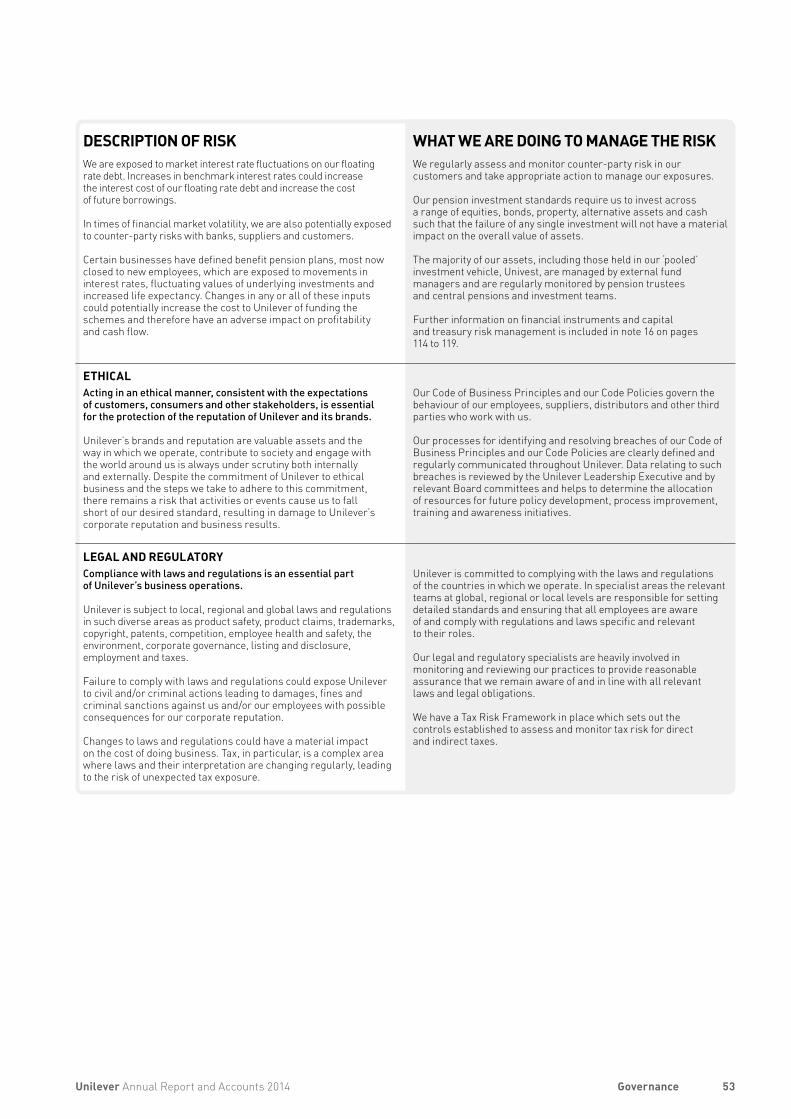
DESCRIPTION OF RISK WHAT WE ARE DOING TO MANAGE THE RISKWe are exposed to market interest rate fluctuations on our floating rate debt. Increases in benchmark interest rates could increase the interest cost of our floating rate debt and increase the cost of future borrowings.
In times of financial market volatility, we are also potentially exposed to counter-party risks with banks, suppliers and customers.
Certain businesses have defined benefit pension plans, most now closed to new employees, which are exposed to movements in interest rates, fluctuating values of underlying investments and increased life expectancy. Changes in any or all of these inputs could potentially increase the cost to Unilever of funding the schemes and therefore have an adverse impact on profitability and cash flow.
We regularly assess and monitor counter-party risk in our customers and take appropriate action to manage our exposures.
Our pension investment standards require us to invest across a range of equities, bonds, property, alternative assets and cash such that the failure of any single investment will not have a material impact on the overall value of assets.
The majority of our assets, including those held in our ‘pooled’ investment vehicle, Univest, are managed by external fund managers and are regularly monitored by pension trustees and central pensions and investment teams.
Further information on financial instruments and capital and treasury risk management is included in note 16 on pages 114 to 119.
ETHICALActing in an ethical manner, consistent with the expectations of customers, consumers and other stakeholders, is essential for the protection of the reputation of Unilever and its brands.
Unilever’s brands and reputation are valuable assets and the way in which we operate, contribute to society and engage with the world around us is always under scrutiny both internally and externally. Despite the commitment of Unilever to ethical business and the steps we take to adhere to this commitment, there remains a risk that activities or events cause us to fall short of our desired standard, resulting in damage to Unilever’s corporate reputation and business results.
Our Code of Business Principles and our Code Policies govern the behaviour of our employees, suppliers, distributors and other third parties who work with us.
Our processes for identifying and resolving breaches of our Code of Business Principles and our Code Policies are clearly defined and regularly communicated throughout Unilever. Data relating to such breaches is reviewed by the Unilever Leadership Executive and by relevant Board committees and helps to determine the allocation of resources for future policy development, process improvement, training and awareness initiatives.
LEGAL AND REGULATORYCompliance with laws and regulations is an essential part of Unilever’s business operations.
Unilever is subject to local, regional and global laws and regulations in such diverse areas as product safety, product claims, trademarks, copyright, patents, competition, employee health and safety, the environment, corporate governance, listing and disclosure, employment and taxes.
Failure to comply with laws and regulations could expose Unilever to civil and/or criminal actions leading to damages, fines and criminal sanctions against us and/or our employees with possible consequences for our corporate reputation.
Changes to laws and regulations could have a material impact on the cost of doing business. Tax, in particular, is a complex area where laws and their interpretation are changing regularly, leading to the risk of unexpected tax exposure.
Unilever is committed to complying with the laws and regulations of the countries in which we operate. In specialist areas the relevant teams at global, regional or local levels are responsible for setting detailed standards and ensuring that all employees are aware of and comply with regulations and laws specific and relevant to their roles.
Our legal and regulatory specialists are heavily involved in monitoring and reviewing our practices to provide reasonable assurance that we remain aware of and in line with all relevant laws and legal obligations.
We have a Tax Risk Framework in place which sets out the controls established to assess and monitor tax risk for direct and indirect taxes.
53Unilever Annual Report and Accounts 2014 Governance
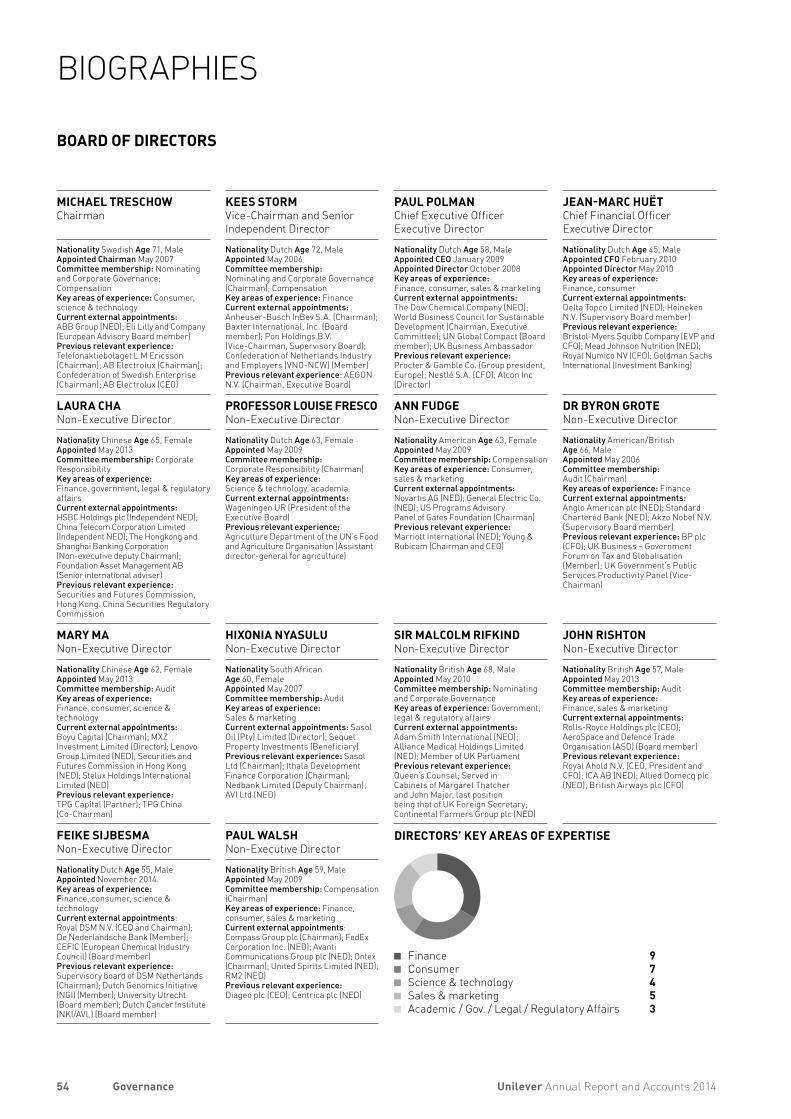
DIRECTORS’ KEY AREAS OF EXPERTISE
FinanceConsumerScience & technologySales & marketingAcademic / Gov. / Legal / Regulatory Affairs
97453
BOARD OF DIRECTORS
MICHAEL TRESCHOWChairman
KEES STORMVice-Chairman and Senior Independent Director
PAUL POLMANChief Executive OfficerExecutive Director
JEAN-MARC HUËTChief Financial OfficerExecutive Director
Nationality Swedish Age 71, MaleAppointed Chairman May 2007Committee membership: Nominating and Corporate Governance; Compensation Key areas of experience: Consumer, science & technologyCurrent external appointments: ABB Group (NED); Eli Lilly and Company (European Advisory Board member)Previous relevant experience: Telefonaktiebolaget L M Ericsson (Chairman); AB Electrolux (Chairman); Confederation of Swedish Enterprise (Chairman); AB Electrolux (CEO)
Nationality Dutch Age 72, MaleAppointed May 2006Committee membership:Nominating and Corporate Governance (Chairman); Compensation Key areas of experience: FinanceCurrent external appointments: Anheuser-Busch InBev S.A. (Chairman); Baxter International, Inc. (Board member); Pon Holdings B.V. (Vice-Chairman, Supervisory Board); Confederation of Netherlands Industry and Employers (VNO-NCW) (Member) Previous relevant experience: AEGON N.V. (Chairman, Executive Board)
Nationality Dutch Age 58, MaleAppointed CEO January 2009Appointed Director October 2008Key areas of experience: Finance, consumer, sales & marketingCurrent external appointments: The Dow Chemical Company (NED); World Business Council for Sustainable Development (Chairman, Executive Committee); UN Global Compact (Board member); UK Business AmbassadorPrevious relevant experience: Procter & Gamble Co. (Group president, Europe); Nestlé S.A. (CFO); Alcon Inc (Director)
Nationality Dutch Age 45, MaleAppointed CFO February 2010Appointed Director May 2010Key areas of experience: Finance, consumerCurrent external appointments: Delta Topco Limited (NED); Heineken N.V. (Supervisory Board member)Previous relevant experience: Bristol-Myers Squibb Company (EVP and CFO); Mead Johnson Nutrition (NED); Royal Numico NV (CFO); Goldman Sachs International (Investment Banking)
LAURA CHANon-Executive Director
PROFESSOR LOUISE FRESCONon-Executive Director
ANN FUDGENon-Executive Director
DR BYRON GROTENon-Executive Director
Nationality Chinese Age 65, FemaleAppointed May 2013Committee membership: Corporate ResponsibilityKey areas of experience: Finance, government, legal & regulatory affairsCurrent external appointments: HSBC Holdings plc (Independent NED); China Telecom Corporation Limited (Independent NED); The Hongkong and Shanghai Banking Corporation (Non-executive deputy Chairman); Foundation Asset Management AB (Senior international adviser)Previous relevant experience: Securities and Futures Commission, Hong Kong. China Securities Regulatory Commission
Nationality Dutch Age 63, FemaleAppointed May 2009Committee membership: Corporate Responsibility (Chairman)Key areas of experience: Science & technology, academiaCurrent external appointments: Wageningen UR (President of the Executive Board)Previous relevant experience: Agriculture Department of the UN’s Food and Agriculture Organisation (Assistant director-general for agriculture)
Nationality American Age 63, FemaleAppointed May 2009Committee membership: Compensation Key areas of experience: Consumer, sales & marketingCurrent external appointments: Novartis AG (NED); General Electric Co. (NED); US Programs Advisory Panel of Gates Foundation (Chairman)Previous relevant experience: Marriott International (NED); Young & Rubicam (Chairman and CEO)
Nationality American/British Age 66, MaleAppointed May 2006Committee membership: Audit (Chairman)Key areas of experience: FinanceCurrent external appointments: Anglo American plc (NED); Standard Chartered Bank (NED); Akzo Nobel N.V. (Supervisory Board member)Previous relevant experience: BP plc (CFO); UK Business – Government Forum on Tax and Globalisation (Member); UK Government’s Public Services Productivity Panel (Vice-Chairman)
MARY MANon-Executive Director
HIXONIA NYASULUNon-Executive Director
SIR MALCOLM RIFKINDNon-Executive Director
JOHN RISHTONNon-Executive Director
Nationality Chinese Age 62, FemaleAppointed May 2013Committee membership: AuditKey areas of experience: Finance, consumer, science & technologyCurrent external appointments: Boyu Capital (Chairman); MXZ Investment Limited (Director); Lenovo Group Limited (NED); Securities and Futures Commission in Hong Kong (NED); Stelux Holdings International Limited (NED)Previous relevant experience: TPG Capital (Partner); TPG China (Co-Chairman)
Nationality South African Age 60, FemaleAppointed May 2007Committee membership: Audit Key areas of experience: Sales & marketingCurrent external appointments: Sasol Oil (Pty) Limited (Director); Sequel Property Investments (Beneficiary) Previous relevant experience: Sasol Ltd (Chairman); Ithala Development Finance Corporation (Chairman); Nedbank Limited (Deputy Chairman); AVI Ltd (NED)
Nationality British Age 68, MaleAppointed May 2010Committee membership: Nominating and Corporate GovernanceKey areas of experience: Government, legal & regulatory affairsCurrent external appointments: Adam Smith International (NED); Alliance Medical Holdings Limited (NED); Member of UK ParliamentPrevious relevant experience: Queen’s Counsel; Served in Cabinets of Margaret Thatcher and John Major, last position being that of UK Foreign Secretary; Continental Farmers Group plc (NED)
Nationality British Age 57, MaleAppointed May 2013 Committee membership: AuditKey areas of experience: Finance, sales & marketingCurrent external appointments: Rolls-Royce Holdings plc (CEO); AeroSpace and Defence Trade Organisation (ASD) (Board member)Previous relevant experience: Royal Ahold N.V. (CEO, President and CFO); ICA AB (NED); Allied Domecq plc (NED); British Airways plc (CFO)
FEIKE SIJBESMANon-Executive Director
PAUL WALSHNon-Executive Director
Nationality Dutch Age 55, Male Appointed November 2014. Key areas of experience: Finance, consumer, science & technologyCurrent external appointments: Royal DSM N.V. (CEO and Chairman); De Nederlandsche Bank (Member); CEFIC (European Chemical Industry Council) (Board member)Previous relevant experience: Supervisory board of DSM Netherlands (Chairman); Dutch Genomics Initiative (NGI) (Member); University Utrecht (Board member); Dutch Cancer Institute (NKI/AVL) (Board member)
Nationality British Age 59, MaleAppointed May 2009Committee membership: Compensation (Chairman)Key areas of experience: Finance, consumer, sales & marketingCurrent external appointments: Compass Group plc (Chairman); FedEx Corporation Inc. (NED); Avanti Communications Group plc (NED); Ontex (Chairman); United Spirits Limited (NED); RM2 (NED)Previous relevant experience: Diageo plc (CEO); Centrica plc (NED)
54 Unilever Annual Report and Accounts 2014Governance
BIOGRAPHIES
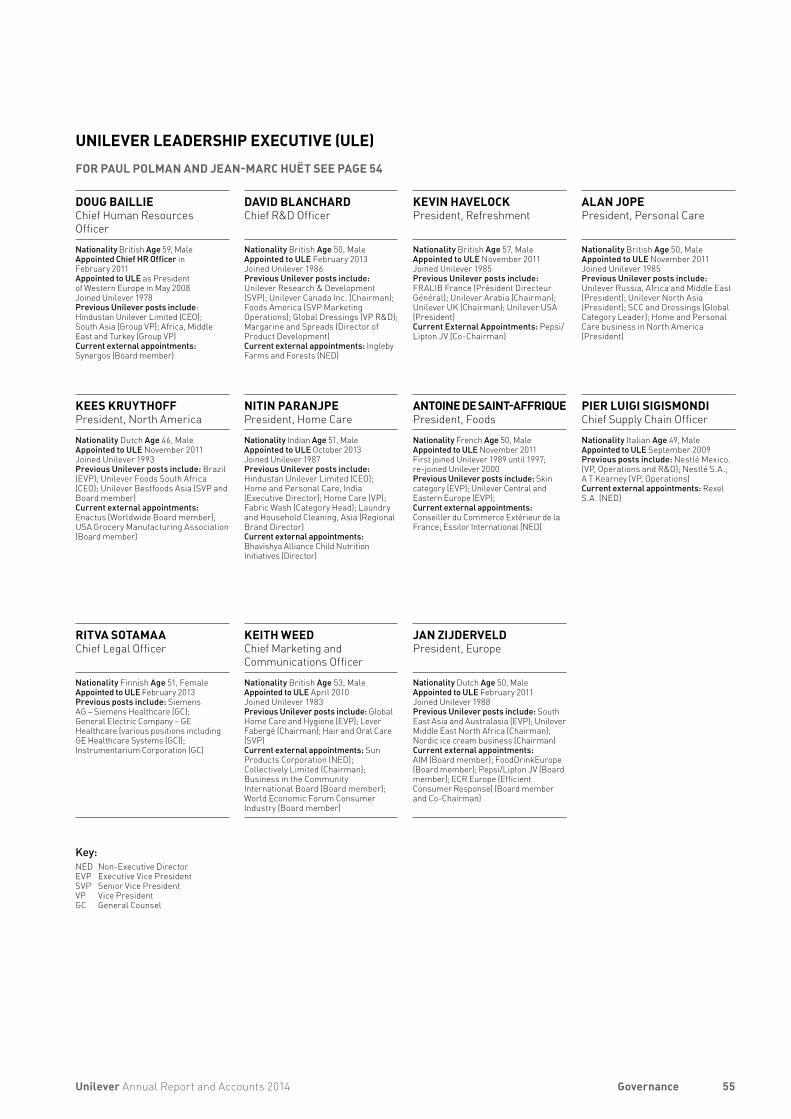
UNILEVER LEADERSHIP EXECUTIVE (ULE)FOR PAUL POLMAN AND JEAN-MARC HUËT SEE PAGE 54
DOUG BAILLIEChief Human Resources Officer
DAVID BLANCHARDChief R&D Officer
KEVIN HAVELOCKPresident, Refreshment
ALAN JOPEPresident, Personal Care
Nationality British Age 59, MaleAppointed Chief HR Officer in February 2011 Appointed to ULE as President of Western Europe in May 2008 Joined Unilever 1978 Previous Unilever posts include: Hindustan Unilever Limited (CEO); South Asia (Group VP); Africa, Middle East and Turkey (Group VP)Current external appointments: Synergos (Board member)
Nationality British Age 50, MaleAppointed to ULE February 2013 Joined Unilever 1986 Previous Unilever posts include: Unilever Research & Development (SVP); Unilever Canada Inc. (Chairman); Foods America (SVP Marketing Operations); Global Dressings (VP R&D); Margarine and Spreads (Director of Product Development)Current external appointments: Ingleby Farms and Forests (NED)
Nationality British Age 57, MaleAppointed to ULE November 2011Joined Unilever 1985 Previous Unilever posts include: FRALIB France (Président Directeur Général); Unilever Arabia (Chairman); Unilever UK (Chairman); Unilever USA (President)Current External Appointments: Pepsi/Lipton JV (Co-Chairman)
Nationality British Age 50, MaleAppointed to ULE November 2011 Joined Unilever 1985 Previous Unilever posts include: Unilever Russia, Africa and Middle East (President); Unilever North Asia (President); SCC and Dressings (Global Category Leader); Home and Personal Care business in North America (President)
KEES KRUYTHOFFPresident, North America
NITIN PARANJPEPresident, Home Care
ANTOINE DE SAINT-AFFRIQUEPresident, Foods
PIER LUIGI SIGISMONDIChief Supply Chain Officer
Nationality Dutch Age 46, Male Appointed to ULE November 2011Joined Unilever 1993 Previous Unilever posts include: Brazil (EVP); Unilever Foods South Africa (CEO); Unilever Bestfoods Asia (SVP and Board member)Current external appointments: Enactus (Worldwide Board member); USA Grocery Manufacturing Association (Board member)
Nationality Indian Age 51, MaleAppointed to ULE October 2013Joined Unilever 1987Previous Unilever posts include: Hindustan Unilever Limited (CEO); Home and Personal Care, India (Executive Director); Home Care (VP); Fabric Wash (Category Head); Laundry and Household Cleaning, Asia (Regional Brand Director)Current external appointments: Bhavishya Alliance Child Nutrition Initiatives (Director)
Nationality French Age 50, MaleAppointed to ULE November 2011 First joined Unilever 1989 until 1997; re-joined Unilever 2000 Previous Unilever posts include: Skin category (EVP); Unilever Central and Eastern Europe (EVP);Current external appointments: Conseiller du Commerce Extérieur de la France; Essilor International (NED)
Nationality Italian Age 49, MaleAppointed to ULE September 2009 Previous posts include: Nestlé Mexico. (VP, Operations and R&D); Nestlé S.A.; A T Kearney (VP, Operations)Current external appointments: Rexel S.A. (NED)
RITVA SOTAMAAChief Legal Officer
KEITH WEEDChief Marketing and Communications Officer
JAN ZIJDERVELDPresident, Europe
Nationality Finnish Age 51, FemaleAppointed to ULE February 2013Previous posts include: Siemens AG – Siemens Healthcare (GC); General Electric Company – GE Healthcare (various positions including GE Healthcare Systems (GC)); Instrumentarium Corporation (GC)
Nationality British Age 53, Male Appointed to ULE April 2010 Joined Unilever 1983 Previous Unilever posts include: Global Home Care and Hygiene (EVP); Lever Fabergé (Chairman); Hair and Oral Care (SVP)Current external appointments: Sun Products Corporation (NED); Collectively Limited (Chairman); Business in the Community International Board (Board member); World Economic Forum Consumer Industry (Board member)
Nationality Dutch Age 50, Male Appointed to ULE February 2011 Joined Unilever 1988 Previous Unilever posts include: South East Asia and Australasia (EVP); Unilever Middle East North Africa (Chairman); Nordic ice cream business (Chairman)Current external appointments: AIM (Board member); FoodDrinkEurope (Board member); Pepsi/Lipton JV (Board member); ECR Europe (Efficient Consumer Response) (Board member and Co-Chairman)
Key:NED Non-Executive DirectorEVP Executive Vice PresidentSVP Senior Vice PresidentVP Vice PresidentGC General Counsel
55Unilever Annual Report and Accounts 2014 Governance
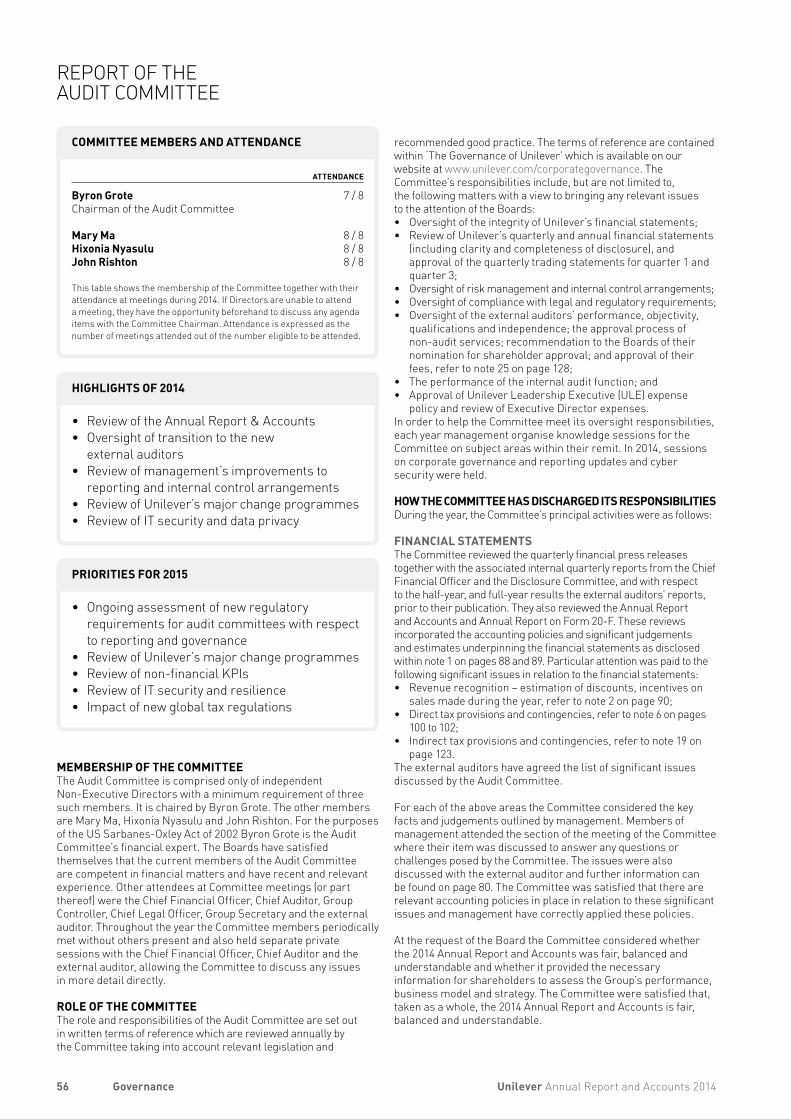
ATTENDANCE
Byron Grote 7 / 8Chairman of the Audit Committee
Mary Ma 8 / 8Hixonia Nyasulu 8 / 8John Rishton 8 / 8
This table shows the membership of the Committee together with their attendance at meetings during 2014. If Directors are unable to attend a meeting, they have the opportunity beforehand to discuss any agenda items with the Committee Chairman. Attendance is expressed as the number of meetings attended out of the number eligible to be attended.
• Review of the Annual Report & Accounts • Oversight of transition to the new
external auditors • Review of management’s improvements to
reporting and internal control arrangements • Review of Unilever’s major change programmes • Review of IT security and data privacy
• Ongoing assessment of new regulatory requirements for audit committees with respect to reporting and governance
• Review of Unilever’s major change programmes • Review of non-financial KPIs• Review of IT security and resilience• Impact of new global tax regulations
COMMITTEE MEMBERS AND ATTENDANCE
HIGHLIGHTS OF 2014
PRIORITIES FOR 2015
MEMBERSHIP OF THE COMMITTEEThe Audit Committee is comprised only of independent Non-Executive Directors with a minimum requirement of three such members. It is chaired by Byron Grote. The other members are Mary Ma, Hixonia Nyasulu and John Rishton. For the purposes of the US Sarbanes-Oxley Act of 2002 Byron Grote is the Audit Committee’s financial expert. The Boards have satisfied themselves that the current members of the Audit Committee are competent in financial matters and have recent and relevant experience. Other attendees at Committee meetings (or part thereof) were the Chief Financial Officer, Chief Auditor, Group Controller, Chief Legal Officer, Group Secretary and the external auditor. Throughout the year the Committee members periodically met without others present and also held separate private sessions with the Chief Financial Officer, Chief Auditor and the external auditor, allowing the Committee to discuss any issues in more detail directly.
ROLE OF THE COMMITTEEThe role and responsibilities of the Audit Committee are set out in written terms of reference which are reviewed annually by the Committee taking into account relevant legislation and
recommended good practice. The terms of reference are contained within ‘The Governance of Unilever’ which is available on our website at www.unilever.com/corporategovernance. The Committee’s responsibilities include, but are not limited to, the following matters with a view to bringing any relevant issues to the attention of the Boards: • Oversight of the integrity of Unilever’s financial statements; • Review of Unilever’s quarterly and annual financial statements
(including clarity and completeness of disclosure), and approval of the quarterly trading statements for quarter 1 and quarter 3;
• Oversight of risk management and internal control arrangements;• Oversight of compliance with legal and regulatory requirements;• Oversight of the external auditors’ performance, objectivity,
qualifications and independence; the approval process of non-audit services; recommendation to the Boards of their nomination for shareholder approval; and approval of their fees, refer to note 25 on page 128;
• The performance of the internal audit function; and • Approval of Unilever Leadership Executive (ULE) expense
policy and review of Executive Director expenses. In order to help the Committee meet its oversight responsibilities, each year management organise knowledge sessions for the Committee on subject areas within their remit. In 2014, sessions on corporate governance and reporting updates and cyber security were held.
HOW THE COMMITTEE HAS DISCHARGED ITS RESPONSIBILITIESDuring the year, the Committee’s principal activities were as follows:
FINANCIAL STATEMENTS The Committee reviewed the quarterly financial press releases together with the associated internal quarterly reports from the Chief Financial Officer and the Disclosure Committee, and with respect to the half-year, and full-year results the external auditors’ reports, prior to their publication. They also reviewed the Annual Report and Accounts and Annual Report on Form 20-F. These reviews incorporated the accounting policies and significant judgements and estimates underpinning the financial statements as disclosed within note 1 on pages 88 and 89. Particular attention was paid to the following significant issues in relation to the financial statements:• Revenue recognition – estimation of discounts, incentives on
sales made during the year, refer to note 2 on page 90;• Direct tax provisions and contingencies, refer to note 6 on pages
100 to 102;• Indirect tax provisions and contingencies, refer to note 19 on
page 123.The external auditors have agreed the list of significant issues discussed by the Audit Committee.
For each of the above areas the Committee considered the key facts and judgements outlined by management. Members of management attended the section of the meeting of the Committee where their item was discussed to answer any questions or challenges posed by the Committee. The issues were also discussed with the external auditor and further information can be found on page 80. The Committee was satisfied that there are relevant accounting policies in place in relation to these significant issues and management have correctly applied these policies.
At the request of the Board the Committee considered whether the 2014 Annual Report and Accounts was fair, balanced and understandable and whether it provided the necessary information for shareholders to assess the Group’s performance, business model and strategy. The Committee were satisfied that, taken as a whole, the 2014 Annual Report and Accounts is fair, balanced and understandable.
56 Unilever Annual Report and Accounts 2014Governance
REPORT OF THE AUDIT COMMITTEE
RISK MANAGEMENT AND INTERNAL CONTROL ARRANGEMENTSThe Committee reviewed Unilever’s overall approach to risk management and control, and its processes, outcomes and disclosure. It reviewed:• the Controller’s Quarterly Risk and Control Status Report,
including Code of Business Principles cases relating to frauds and financial crimes and significant complaints received through the Unilever Code Support Line;
• the 2014 corporate risks for which the Audit Committee had oversight and the proposed 2015 corporate risks identified by the ULE;
• management’s improvements to reporting and internal financial control arrangements;
• processes related to cyber security, information management and privacy;
• tax planning, insurance arrangements and related risk management;
• treasury policies, including debt issuance and hedging; and• litigation and regulatory investigations.
The Committee reviewed the application of the requirements under Section 404 of the US Sarbanes-Oxley Act of 2002 with respect to internal controls over financial reporting. In addition, the Committee reviewed the annual financial plan and Unilever’s dividend policy and dividend proposals.
During 2014 the Committee oversaw the independent assurance work that is performed on a number of our Unilever Sustainable Living Plan (USLP) metrics (selected on the basis of their materiality to the USLP).
In fulfilling its oversight responsibilities in relation to risk management, internal control and the financial statements, the Committee met regularly with senior members of management and is fully satisfied with the key judgements taken.
INTERNAL AUDIT FUNCTIONThe Committee reviewed Corporate Audit’s audit plan for the year and agreed its budget and resource requirements. It reviewed interim and year-end summary reports and management’s response. The Committee carried out an evaluation of the performance of the internal audit function and was satisfied with the effectiveness of the function. The Committee met independently with the Chief Auditor during the year and discussed the results of the audits performed during the year.
AUDIT OF THE ANNUAL ACCOUNTSKPMG, Unilever’s external auditors and independent registered public accounting firm, reported in depth to the Committee on the scope and outcome of the annual audit, including their audit of internal controls over financial reporting as required by Section 404 of the US Sarbanes-Oxley Act of 2002. Their reports included accounting matters, governance and control, and accounting developments.
The Committee held independent meetings with the external auditors during the year and reviewed, agreed, discussed and challenged their audit plan, including their assessment of the financial reporting risk profile of the Group. The Committee discussed the views and conclusions of KPMG regarding management’s treatment of significant transactions and areas of judgement during the year and KPMG confirmed they were satisfied that these had been treated appropriately in the financial statements.
EXTERNAL AUDITORS As a result of the tender performed in 2013, shareholders approved the appointment of KPMG as the Group’s external auditor at the 2014 AGMs in May and throughout the year the Committee oversaw and helped facilitate a smooth transition from the former auditors. The Committee has approved the extension of the current external
audit contract by one year, and recommended to the Boards the re-appointment of the external auditors. On the recommendation of the Committee, the Directors will be proposing the re-appointment of KPMG at the AGMs in April 2015.
Both Unilever and KPMG have safeguards in place to avoid the possibility that the auditors’ objectivity and independence could be compromised, such as audit partner rotation and the restriction on non-audit services that the external auditors can perform as described below. The Committee reviewed the report from KPMG on the actions they take to comply with the professional and regulatory requirements and best practice designed to ensure their independence from Unilever.
Each year, the Committee assesses the effectiveness of the external audit process which includes gaining feedback from key stakeholders at all levels across Unilever.
The Committee also reviewed the statutory audit, audit related and non-audit related services provided by KPMG and compliance with Unilever’s documented approach, which prescribes in detail the types of engagements, listed below, for which the external auditors can be used: • statutory audit services, including audit of subsidiaries;• audit related engagements – services that involve attestation,
assurance or certification of factual information that may be required by external parties;
• non-audit related services – work that our auditors are best placed to undertake, which may include: – tax services – all significant tax work is put to tender; – acquisition and disposal services, including related due
diligence, audits and accountants’ reports; and – internal control reviews.
Several types of engagements are prohibited, including:• bookkeeping or similar services; • systems design and implementation related to financial
information or risk management; • valuation services; • actuarial services; • internal audit;• broker, dealer, investment adviser or investment bank
services;• legal services;• design and/or implementation of risk management processes
and systems; and • staff secondments to a management function.
All audit related engagements over €250,000 and non-audit related engagements over €100,000 required specific advance approval by the Audit Committee Chairman. The Committee further approved all engagements below these levels which have been authorised by the Group Controller. These authorities are reviewed regularly and, where necessary, updated in the light of internal developments, external developments and best practice.
EVALUATION OF THE AUDIT COMMITTEEAs part of the external Board evaluation carried out in 2014, the Boards evaluated the performance of the Committee. The Committee also carried out an assessment of its own performance. Each concluded that the Committee is performing effectively. Nevertheless, the Committee agreed that to enhance its effectiveness it would seek opportunities for all Committee members to visit a key accounting and reporting centre.
Byron Grote Chairman of the Audit CommitteeMary MaHixonia NyasuluJohn Rishton
57Unilever Annual Report and Accounts 2014 Governance
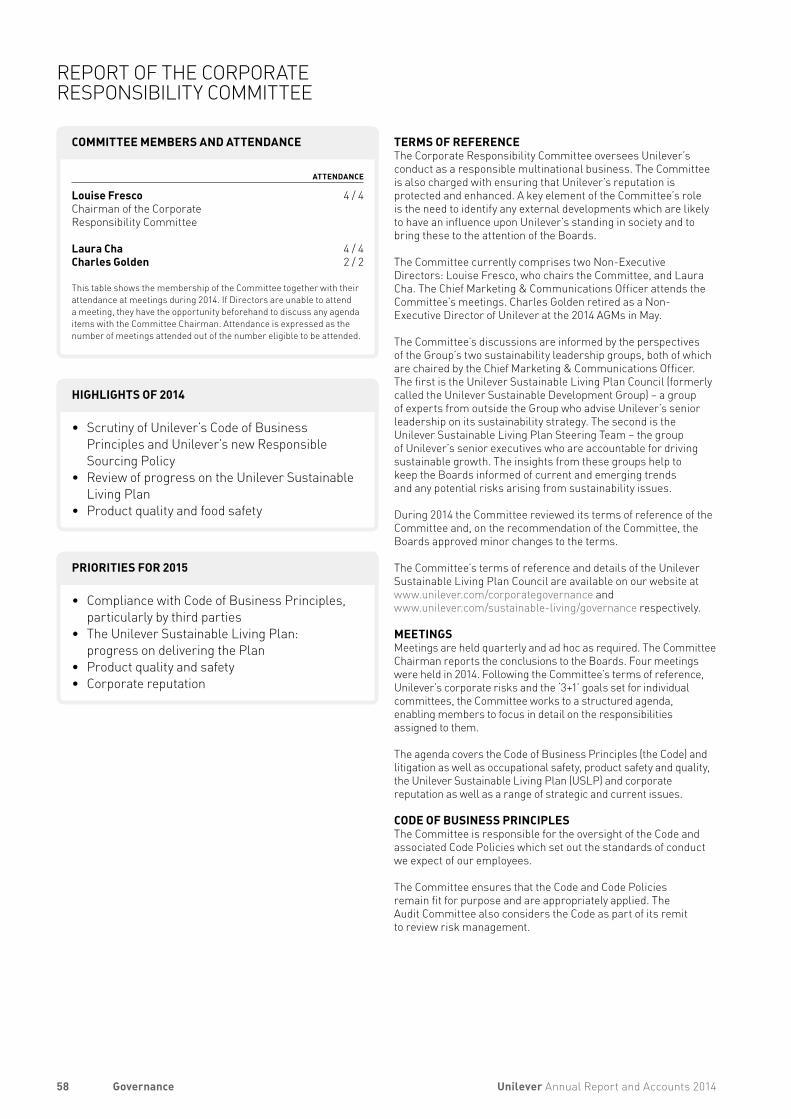
TERMS OF REFERENCEThe Corporate Responsibility Committee oversees Unilever’s conduct as a responsible multinational business. The Committee is also charged with ensuring that Unilever’s reputation is protected and enhanced. A key element of the Committee’s role is the need to identify any external developments which are likely to have an influence upon Unilever’s standing in society and to bring these to the attention of the Boards.
The Committee currently comprises two Non-Executive Directors: Louise Fresco, who chairs the Committee, and Laura Cha. The Chief Marketing & Communications Officer attends the Committee’s meetings. Charles Golden retired as a Non-Executive Director of Unilever at the 2014 AGMs in May.
The Committee’s discussions are informed by the perspectives of the Group’s two sustainability leadership groups, both of which are chaired by the Chief Marketing & Communications Officer. The first is the Unilever Sustainable Living Plan Council (formerly called the Unilever Sustainable Development Group) – a group of experts from outside the Group who advise Unilever’s senior leadership on its sustainability strategy. The second is the Unilever Sustainable Living Plan Steering Team – the group of Unilever’s senior executives who are accountable for driving sustainable growth. The insights from these groups help to keep the Boards informed of current and emerging trends and any potential risks arising from sustainability issues.
During 2014 the Committee reviewed its terms of reference of the Committee and, on the recommendation of the Committee, the Boards approved minor changes to the terms.
The Committee’s terms of reference and details of the Unilever Sustainable Living Plan Council are available on our website at www.unilever.com/corporategovernance and www.unilever.com/sustainable-living/governance respectively.
MEETINGSMeetings are held quarterly and ad hoc as required. The Committee Chairman reports the conclusions to the Boards. Four meetings were held in 2014. Following the Committee’s terms of reference, Unilever’s corporate risks and the ‘3+1’ goals set for individual committees, the Committee works to a structured agenda, enabling members to focus in detail on the responsibilities assigned to them.
The agenda covers the Code of Business Principles (the Code) and litigation as well as occupational safety, product safety and quality, the Unilever Sustainable Living Plan (USLP) and corporate reputation as well as a range of strategic and current issues.
CODE OF BUSINESS PRINCIPLESThe Committee is responsible for the oversight of the Code and associated Code Policies which set out the standards of conduct we expect of our employees.
The Committee ensures that the Code and Code Policies remain fit for purpose and are appropriately applied. The Audit Committee also considers the Code as part of its remit to review risk management.
ATTENDANCE
Louise Fresco 4 / 4Chairman of the Corporate Responsibility Committee
Laura Cha 4 / 4Charles Golden 2 / 2
This table shows the membership of the Committee together with their attendance at meetings during 2014. If Directors are unable to attend a meeting, they have the opportunity beforehand to discuss any agenda items with the Committee Chairman. Attendance is expressed as the number of meetings attended out of the number eligible to be attended.
• Scrutiny of Unilever’s Code of Business Principles and Unilever’s new Responsible Sourcing Policy
• Review of progress on the Unilever Sustainable Living Plan
• Product quality and food safety
• Compliance with Code of Business Principles, particularly by third parties
• The Unilever Sustainable Living Plan: progress on delivering the Plan
• Product quality and safety• Corporate reputation
COMMITTEE MEMBERS AND ATTENDANCE
HIGHLIGHTS OF 2014
PRIORITIES FOR 2015
58 Unilever Annual Report and Accounts 2014Governance
REPORT OF THE CORPORATE RESPONSIBILITY COMMITTEE
The Committee maintains close scrutiny of the mechanisms for compliance with the Code and Code Policies as ongoing compliance is essential to promote and protect Unilever’s values and standards, and hence the good reputation of the Group. At each meeting the Committee reviews the completion of investigations into non-compliance with the Code and Code Policies and progress on training programmes as well as any trends which may emerge from reports of Code non-compliance.
Third parties’ compliance with the Code is essential for the protection of the reputation of Unilever and its brands. This was a priority for the Committee in 2014 and remains high on its agenda for 2015.
LITIGATION REVIEWThe Chief Legal Officer reports to the Committee on litigation and regulatory matters which may have a reputational impact including environmental issues, bribery and corruption compliance and competition law compliance. For further information on ‘legal proceedings’ please see note 20 on page 125.
SAFETYThe Committee reviews a scorecard analysis of progress on occupational safety and product safety and quality at each meeting. These quarterly scorecards are complemented by regular in-depth discussions to reassure committee members that systems and processes remain robust.
Occupational safety, particularly road safety, remains a high priority for Unilever and the Committee noted considerable effort has been made to counter a slight dip in performance at the beginning of 2014.
Having discussed Unilever’s policies and processes for product safety, including incident management, members considered that Unilever adopts a systematic approach that focuses on prevention.
UNILEVER SUSTAINABLE LIVING PLANThe USLP is at the heart of Unilever’s Vision to double the size of its business while reducing its environmental footprint and increasing its positive social impact. By making sustainability integral to how Unilever does business, the USLP provides the differentiator in Unilever’s business model. Given its strategic importance, the Committee monitors progress on the USLP and reviews any potential risks that could affect Unilever’s reputation.
One of the Committee’s ongoing priorities is to ensure that delivery of the USLP is maintained through appropriate business strategies.
The USLP was launched at the end of 2010 and much has been learned in implementing the plan since then. In 2014 Unilever reviewed its strategy and approach to focus its attention on the areas that matter most to the business and where its contribution can achieve the greatest impact on society.
An important outcome of this review is the expansion of the Enhancing Livelihoods pillar of the USLP to embrace commitments on fairness in the workplace, opportunities for women and inclusive business. The promotion of human rights is an important component in these new commitments and the Committee studied the implications of the UN Guiding Principles on Human Rights. It also welcomed the launch of Unilever’s new Responsible Sourcing Policy as a crucial step in promoting human rights with Unilever’s suppliers (see page 8).
The Committee also discussed Unilever’s ambitions to achieve systemic change in areas that support its business priorities. Unilever has defined three areas where it has the scale and resources to create transformational change. It is deepening its efforts to work towards eliminating deforestation from supply chains; championing sustainable agriculture and the development of smallholder farmers; and improving hygiene through handwashing, safe drinking water and sanitation.
FURTHER ITEMSOther discussions during the year focused on obesity, progress on alternatives to animal testing and consumer confidence in the use of chemicals. The systems and processes in place for managing issues such as these were also scrutinised as they are essential in helping to maintain Unilever’s good reputation.
EVALUATION OF THE CORPORATE RESPONSIBILITY COMMITTEEAs part of the external Board evaluation carried out in 2014, the Boards evaluated the performance of the Committee. The Committee also carried out an assessment of its own performance. Each concluded that the Committee is performing effectively. The Committee agreed that the structure of its meetings and its focus on priority topics were working well and should be continued.
Louise FrescoChairman of the Corporate Responsibility CommitteeLaura Cha
Further details on the USLP can be found in Unilever’s online Sustainable Living Report 2014 to be published in May 2015.
www.unilever.com/sustainable-living
59Unilever Annual Report and Accounts 2014 Governance
ATTENDANCE
Kees Storm 7/7Chairman of the Nominating and Corporate Governance Committee
Sir Malcolm Rifkind 7/7Michael Treschow 7/7
This table shows the membership of the Committee together with their attendance at meetings during 2014. If Directors are unable to attend a meeting, they have the opportunity beforehand to discuss any agenda items with the Committee Chairman. Attendance is expressed as the number of meetings attended out of the number eligible to be attended.
• Director and Unilever Leadership Executive Succession Planning
• External Board evaluation
• Recommendations for new Non-Executive Directors
• Planning for Chairman succession• Monitoring of emerging Corporate Governance
developments• Active participation in relevant Corporate
Governance consultations
COMMITTEE MEMBERS, MEMBERSHIP STATUS AND ATTENDANCE
HIGHLIGHTS OF 2014
PRIORITIES FOR 2015
ROLE AND MEMBERSHIP OF THE COMMITTEEThe Nominating and Corporate Governance Committee is responsible for evaluating the balance of skills, experience, independence and knowledge on the Boards and for drawing up selection criteria, ongoing succession planning and appointment procedures. It also has oversight of all matters relating to corporate governance and brings any issues in this respect to the attention of the Boards.
The Committee’s terms of reference are set out in ‘The Governance of Unilever’ which can be found on our website at www.unilever.com/corporategovernance. During the year, the Committee reviewed the Committee’s terms of reference to ensure they remained in line with relevant corporate governance guidelines and to determine whether its responsibilities are properly described. The amended terms became effective on 1 January 2015.
The Committee is comprised of two Non-Executive Directors and the Chairman. The Group Secretary acts as secretary to the Committee. Other attendees at Committee meetings in 2014 (or part thereof) were the Chief Executive Officer, the Chief HR Officer and the Group Secretary.
In 2014 the Committee met seven times. At the start of the year the Committee considered the results of the Committee’s annual self-evaluation for 2013 and used these to help create an annual plan for meetings for 2014.
APPOINTMENT AND RE-APPOINTMENT OF DIRECTORS Re-appointment: Non-Executive Directors normally serve for a maximum of nine years. The schedule the Committee uses for orderly succession planning of Non-Executive Directors can be found on our website at www.unilever.com/committees. All existing Executive and Non-Executive Directors, unless they are retiring, submit themselves for evaluation by the Committee every year. An Executive Director stops holding executive office on ceasing to be a Director. The Chairman will inform the Committee of the outcomes of his discussions with each Director on individual performance. Based upon the evaluation of the Boards, its Committees and the continued good performance of individual Directors, the Committee recommends to each Board a list of Directors for re-election at the relevant company’s AGMs. In 2014, Charles Golden decided not to put himself forward for re-election at the 2014 AGMs in May 2014. The Committee proposed the nomination of all other Directors. Directors are appointed by shareholders by a simple majority vote at the AGMs.
Appointment: Where a vacancy arises on the Boards, the Committee may seek the services of specialist recruitment firms and other external experts to assist in finding individuals with the appropriate skills and expertise. The Committee reviews candidates presented by the recruitment firm, or recommended by Directors and members of the Unilever Leadership Executive (ULE), and all members of the Committee are involved in the interview process before making their recommendations to the Boards for approval. The Committee also recommends to the Boards candidates for election as Chairman and Vice-Chairman/Senior Independent Director.
When recruiting the Committee will take into account the profile of Unilever’s Boards of Directors set out in the ‘The Governance of Unilever’ which is in line with the recommendations of applicable governance regulations and best practice. Pursuant to the profile the Boards should comprise a majority of Non-Executive Directors who are independent of Unilever, free from any conflicts of interest and are able to allocate sufficient time to perform their responsibilities effectively. With respect to composition and qualities, the Boards should be in keeping with the size of Unilever, its portfolio, culture and geographical spread and its status as a
60 Unilever Annual Report and Accounts 2014Governance
REPORT OF THE NOMINATING AND CORPORATE GOVERNANCE COMMITTEE
listed company. The objective pursued by the Boards is to have a variety of age, gender, expertise, social background and nationality and, wherever possible, the Boards should reflect Unilever’s consumer base and take into account the footprint and strategy of the Group.
In 2014, the Committee engaged the services of Russell Reynolds Associates, an executive search agency, to assist with the recruitment of a new Non-Executive Director. Russell Reynolds Associates, who also assist Unilever with the recruitment of senior executives, helped to identify Feike Sijbesma as a potential candidate. The Committee recommended to the Boards that Feike Sijbesma be nominated as a new Non-Executive Director at the 2014 AGMs. In May 2014 the AGMs resolved to appoint Feike and his appointment took effect on 1 November 2014. Feike is a leading business figure and brings significant additional expertise to the Boards, including in the important areas of food, nutrition and sustainability.
Succession planning: In consultation with the Committee, the Boards review both the adequacy of succession planning processes and the actual succession planning at each of Board and ULE level.
The Committee, on behalf of the Boards, continued during 2014 to consider succession planning for the Boards given that Byron Grote and Kees Storm (Vice-Chairman/Senior Independent Director) are expected to retire at the AGMs in May 2015 and Michael Treschow (the Chairman), and Hixonia Nyasulu are expected to retire in May 2016. The Committee actively engaged with the Boards in 2014 on potential Non-Executive Director candidates and on the profile of a future Chairman.
In addition, during 2014, the Committee consulted with the Chief Executive Officer on the selection criteria and appointment procedures for senior management changes including changes to the ULE.
DIVERSITY POLICY Unilever has long understood the importance of diversity within our workforce because of the wide range of consumers we connect with globally. This goes right through our organisation, starting with the Boards. The Boards feel that gender is only one part of diversity, and Unilever Directors will continue to be selected on the basis of their wide-ranging experience, backgrounds, skills, knowledge and insight.
Unilever’s Board Diversity Policy, which is reviewed by the Committee each year, can be found on our website at www.unilever.com/boardsofunilever. The Committee also reviewed and considered relevant recommendations on diversity and remains pleased that over 40% of our Non-Executive Directors are women.
EVALUATIONAs part of the external Board evaluation carried out in 2014, the Boards evaluated the performance of the Committee. The Committee also carried out an assessment of its own performance, Each concluded that the Committee is performing effectively. Nevertheless, the Committee agreed that, to enhance its effectiveness, it would give fuller feedback to the Boards on the appointment process of Non-Executive Directors and arrange for the external recruitment firm used to present to the Boards.
Kees StormChairman of the Nominating and CorporateGovernance CommitteeSir Malcolm RifkindMichael Treschow
PROFILE OF UNILEVER’S BOARDS OF DIRECTORS
DESIRED EXPERTISE AND EXPERIENCEIn view of Unilever’s objectives and activities, it is important that the Boards have sufficient financial literacy, have at least one financial expert and are composed in such a way that the following expertise and experience are present in one ormore of its members:• Executive management experience and knowledge of
corporate governance issues at main board level with a company comparable in size and international spread of activities with multiple stock exchange listings;
• Understanding of human resources and remuneration in large international companies;
• Experience in financial administration, accounting policies and internal control;
• Risk management of multinationals with share listings;• Understanding of the markets where Unilever is active;• Experience in and understanding of the fast-moving
consumer goods (FMCG) market;• Knowledge of marketing and commercial expertise;• Awareness of corporate social responsibility issues; and• Experience with R&D in those fields where Unilever
is active.
PROFILEThis profile guides the Nominating and CorporateGovernance Committee and the Boards on the occasionof the nomination of Directors. It is reviewed and updated by the Boards periodically.
61Unilever Annual Report and Accounts 2014 Governance
ATTENDANCE
Paul Walsh 5 / 5Chairman of the Compensation Committee (previously called the Compensation and Management Resources Committee)
Ann Fudge 5 / 5Kees Storm 4 / 5Michael Treschow 5 / 5
This table shows the attendance of Directors at Committee meetings held in the year ended 31 December 2014. If Directors are unable to attend a meeting, they have the opportunity beforehand to discuss any agenda items with the Committee Chairman. Attendance is expressed as the number of meetings attended out of the number eligible to be attended.
COMMITTEE MEMBERS AND ATTENDANCE
• No changes have been made to the remuneration policy during the year.
• The Committee approved the implementation and roll-out of the new global employee share plan ‘SHARES’ for employees below management level.
• The Committee reviewed the remuneration framework and concluded that it continues to serve Unilever well, particularly in light of the strong level of shareholder support for Unilever’s remuneration policy at the 2014 AGMs.
• Review of the global reward structure for Unilever’s ‘Top 100’ executive management population below Executive Director level, two years after implementation, has proven that it is delivering effectively against the objectives that had been set for it.
• Further review and shaping of Unilever’s future reward framework to ensure that it remains aligned with strategy and long-term shareholder value creation.
• Review of relative competitive position of reward levels for Unilever’s ‘Top 100’ executive management population.
• Review of progress in implementing SHARES.
HIGHLIGHTS OF 2014
PRIORITIES FOR 2015
FORMAT OF THE DIRECTORS’ REMUNERATION REPORT Our Directors’ Remuneration Report is split into the following sections:
• Chairman’s letter – page 62 to 63• Remuneration Principles – page 63 to 64• Annual Remuneration Report – page 65 to 77
CHAIRMAN’S LETTER DEAR SHAREHOLDERS,I am pleased to report that our Remuneration Policy was adopted at the 2014 NV and PLC AGMs with strong levels of support and remains unchanged for 2015.
REMUNERATION POLICY – AVAILABLE ON OUR WEBSITETo simplify this year’s report we have chosen not to repeat our Remuneration Policy, which is available on our website. To reflect the reward decisions taken for 2015 by the Compensation Committee we have updated the supporting information in the remuneration policy table and other contextual information.
www.unilever.com/ara2014/downloads
BUSINESS PERFORMANCE AND REMUNERATION OUTCOMES FOR 2014
Annual bonus – a year of resilient performanceDuring the year Unilever faced an increasingly challenging external environment. In addition to fierce competition, we also saw weakening consumer demand across many parts of the world and increasing external volatility. The business responded to the combination of these events with resilience by heightening focus on cost control and margin improvement. Although our overall underlying sales growth lowered to 2.9% we continued to outperform our markets, as we have done consistently since Paul Polman’s appointment as CEO. Through rigorous control of overheads, we delivered a core operating margin improvement of 0.4 percentage points despite adverse currency movements. With the quality of these results in mind, the Committee exercised its judgement to uplift the annual bonus outcome from 68% to 80% of target and decided to pay a bonus of 132% of salary (66% of maximum) to the CEO, Paul Polman, and a bonus of 88% of salary (59% of maximum) to the CFO, Jean-Marc Huët. The Committee believes that these awards fairly reflect the performance delivered in 2014. This consistency in performance delivery, now established over the last six years, shows that Unilever is building a more resilient company. We are better able to withstand the challenges of an increasingly uncertain business environment because we are moving towards a business model with long-term sustainability at its core.
GSIP and MCIP – strong financial performance over the last three yearsOver the past three years, Unilever has again delivered very strong financial performance. Underlying sales growth during this period was 4.7% per annum. Core operating margin improvement over the period was an average of 0.37 percentage points per year, demonstrating management’s drive for consistent top and bottom line growth. Unilever has also generated very strong operating cash in the period, with cumulative operating cash flow of €15.5 billion. Total shareholder return (TSR) over this three-year period was below the performance of our peers, and, as a result, no part of the GSIP and MCIP awards related to TSR will vest. The Committee believes the outcomes of the long-term share incentive plans represent a fair reflection of Unilever’s underlying performance over the last three years. On the basis of this performance, the Committee determined that the GSIP awards to the end of 2014 together with MCIP awards, which were granted to Executive Directors for the first time in 2012, will vest at 121% of initial award levels (ie 61% of maximum for GSIP and 81% of maximum awards for MCIP, which is capped at 150%).
62 Unilever Annual Report and Accounts 2014Governance
DIRECTORS’ REMUNERATION REPORT
REMUNERATION PRINCIPLES SUPPORTING THE DELIVERY OF OUR STRATEGY THROUGH REMUNERATION ARRANGEMENTSOur business vision is to double the size of Unilever while reducing our environmental footprint and increasing our positive social impact through a focus on our brands, our operations and our people, and the Unilever Sustainable Living Plan (USLP). Remuneration is one of the key tools that we have as a business to help us to motivate our people to achieve our goals.
Our remuneration arrangements are designed to support our business vision and the implementation of our strategy. The key elements of our remuneration package for Executive Directors are summarised below:
FIXED ELEMENTS
PERFORMANCE-RELATED ELEMENTS
Base salaryFixed allowance
and other benefits
Annual bonus Longer-term:GSIP
Longer-term:MCIP
EXECUTIVE DIRECTORS TURN DOWN SALARY INCREASES FOR 2015 In our 2011 Directors’ Remuneration Report, the Committee drew shareholders’ attention to our concern that the CEO’s salary was positioned at the lower end of market practice compared to similar sized UK and European companies. At that time the Committee stated that it would look to make further increases, as appropriate, to address this over the next few years. Since then, largely at the CEO and CFO’s own insistence, we have consistently awarded less of a salary increase than we believed was merited by the performance of the Executive Directors. Having held their salaries steady for longer than intended and in view of the sustained track record of performance delivery, the Committee recommended, and the Boards approved, salary increases for the CEO and CFO with effect from January 2015. In making these recommendations the Committee considered the strong performance of Unilever and alignment, both to increases in pay for the broader employee population and externally. The CEO and CFO have turned down the salary increases recommended by the Committee for 2015.
STRATEGIC LINKAGE OF REWARD TO BUSINESS PERFORMANCEAs in previous years, the Committee continues to use performance-based incentives to drive the business towards delivering sustainable long-term value for shareholders. For 2015, the Committee has decided to focus on the importance of cash generation in an environment of lower global growth rates by replacing underlying volume growth with growth in free cash flow (FCF) as a performance measure for the annual bonus, in alignment with our strategy as set out in the Strategic Report (www.unilever.com/ara2014/downloads). FCF is a widely reported metric used to evaluate Unilever’s in-year performance. For our shareholders, cash is an important driver of value creation, allowing us to pay attractive and sustainable dividends while continuing to invest in the business.
The performance measures for our long-term share incentive plans remain unchanged for the 2015-2017 performance cycle. Even though FCF is our primary cash measure, we use operating cash flow (OCF) as the cash measure in our long-term incentive plans as it better represents underlying long-term performance at constant exchange rates. To better describe long-term management performance, OCF is also adjusted to exclude the impact of cash inflows and outflows resulting from M&A activity and the impact of pension contributions and interest costs on external borrowings.
For reasons of commercial sensitivity, our practice is to disclose the target ranges for performance measures together with the outcomes of incentive plans at the end of the respective performance period.
In 2015 the Committee plans to undertake a further review of our remuneration framework to ensure that it continues to be fully aligned with Unilever’s business strategy and enables us to respond quickly to the rapidly changing markets in which we operate. Specifically, we will be looking for opportunities to simplify reward arrangements and also to strengthen the linkage between executive pay and the creation of sustainable longer- term shareholder value. To the extent that changes are proposed, the Committee will consult with key shareholders to get their feedback in advance of recommending changes to shareholders.
Paul Walsh Chairman of the Compensation Committee
63Unilever Annual Report and Accounts 2014 Governance
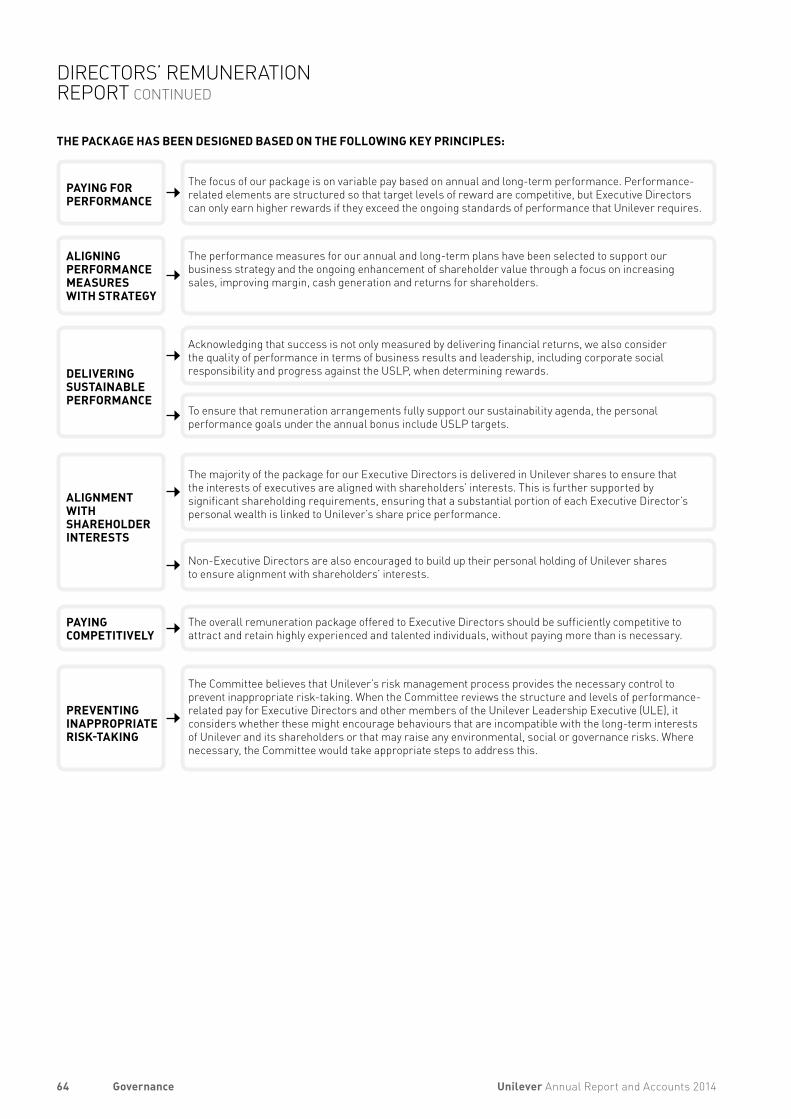
PAYING FOR PERFORMANCE
The focus of our package is on variable pay based on annual and long-term performance. Performance-related elements are structured so that target levels of reward are competitive, but Executive Directors can only earn higher rewards if they exceed the ongoing standards of performance that Unilever requires.
ALIGNING PERFORMANCE MEASURES WITH STRATEGY
The performance measures for our annual and long-term plans have been selected to support our business strategy and the ongoing enhancement of shareholder value through a focus on increasing sales, improving margin, cash generation and returns for shareholders.
DELIVERING SUSTAINABLE PERFORMANCE
Acknowledging that success is not only measured by delivering financial returns, we also consider the quality of performance in terms of business results and leadership, including corporate social responsibility and progress against the USLP, when determining rewards.
To ensure that remuneration arrangements fully support our sustainability agenda, the personal performance goals under the annual bonus include USLP targets.
ALIGNMENT WITH SHAREHOLDER INTERESTS
The majority of the package for our Executive Directors is delivered in Unilever shares to ensure that the interests of executives are aligned with shareholders’ interests. This is further supported by significant shareholding requirements, ensuring that a substantial portion of each Executive Director’s personal wealth is linked to Unilever’s share price performance.
Non-Executive Directors are also encouraged to build up their personal holding of Unilever shares to ensure alignment with shareholders’ interests.
PAYING COMPETITIVELY
The overall remuneration package offered to Executive Directors should be sufficiently competitive to attract and retain highly experienced and talented individuals, without paying more than is necessary.
PREVENTING INAPPROPRIATE RISK-TAKING
The Committee believes that Unilever’s risk management process provides the necessary control to prevent inappropriate risk-taking. When the Committee reviews the structure and levels of performance-related pay for Executive Directors and other members of the Unilever Leadership Executive (ULE), it considers whether these might encourage behaviours that are incompatible with the long-term interests of Unilever and its shareholders or that may raise any environmental, social or governance risks. Where necessary, the Committee would take appropriate steps to address this.
THE PACKAGE HAS BEEN DESIGNED BASED ON THE FOLLOWING KEY PRINCIPLES:
64 Unilever Annual Report and Accounts 2014Governance
DIRECTORS’ REMUNERATION REPORT CONTINUED
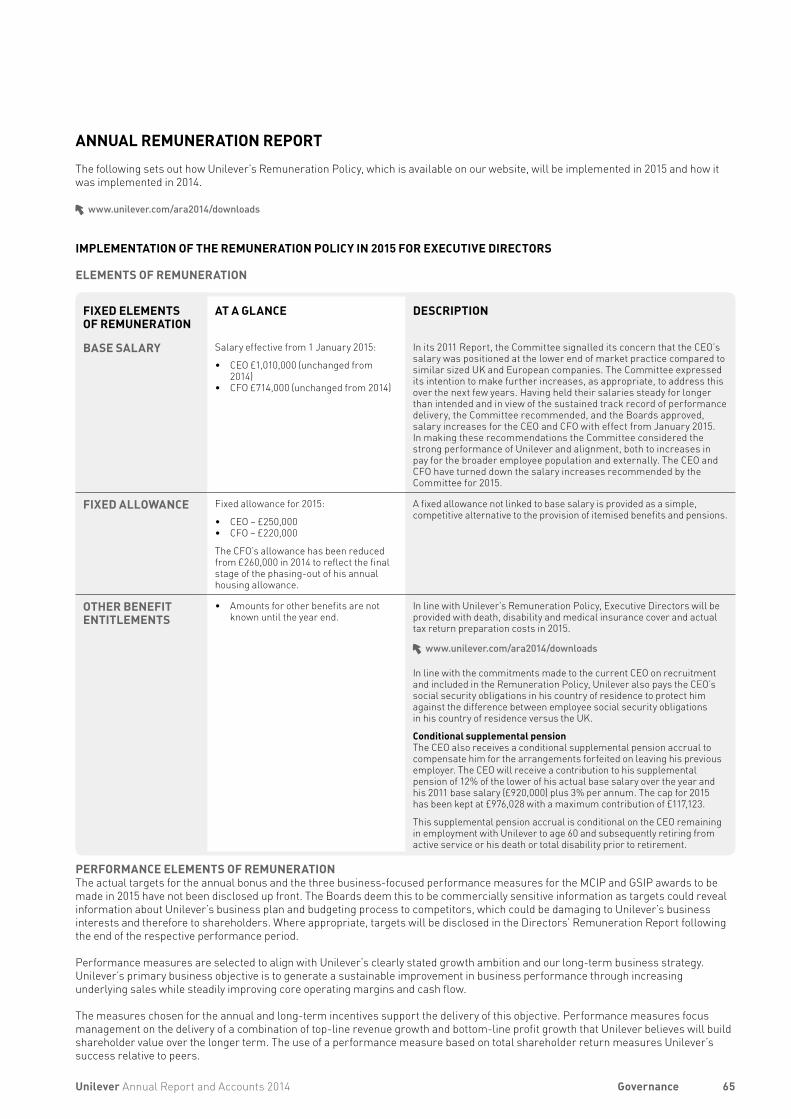
ANNUAL REMUNERATION REPORTThe following sets out how Unilever’s Remuneration Policy, which is available on our website, will be implemented in 2015 and how it was implemented in 2014.
www.unilever.com/ara2014/downloads
IMPLEMENTATION OF THE REMUNERATION POLICY IN 2015 FOR EXECUTIVE DIRECTORS
ELEMENTS OF REMUNERATION
FIXED ELEMENTS OF REMUNERATION
AT A GLANCE DESCRIPTION
BASE SALARY Salary effective from 1 January 2015:
• CEO £1,010,000 (unchanged from 2014)
• CFO £714,000 (unchanged from 2014)
In its 2011 Report, the Committee signalled its concern that the CEO’s salary was positioned at the lower end of market practice compared to similar sized UK and European companies. The Committee expressed its intention to make further increases, as appropriate, to address this over the next few years. Having held their salaries steady for longer than intended and in view of the sustained track record of performance delivery, the Committee recommended, and the Boards approved, salary increases for the CEO and CFO with effect from January 2015. In making these recommendations the Committee considered the strong performance of Unilever and alignment, both to increases in pay for the broader employee population and externally. The CEO and CFO have turned down the salary increases recommended by the Committee for 2015.
FIXED ALLOWANCE Fixed allowance for 2015:
• CEO – £250,000• CFO – £220,000
The CFO’s allowance has been reduced from £260,000 in 2014 to reflect the final stage of the phasing-out of his annual housing allowance.
A fixed allowance not linked to base salary is provided as a simple, competitive alternative to the provision of itemised benefits and pensions.
OTHER BENEFIT ENTITLEMENTS
• Amounts for other benefits are not known until the year end.
In line with Unilever’s Remuneration Policy, Executive Directors will be provided with death, disability and medical insurance cover and actual tax return preparation costs in 2015.
www.unilever.com/ara2014/downloads
In line with the commitments made to the current CEO on recruitment and included in the Remuneration Policy, Unilever also pays the CEO’s social security obligations in his country of residence to protect him against the difference between employee social security obligations in his country of residence versus the UK.
Conditional supplemental pensionThe CEO also receives a conditional supplemental pension accrual to compensate him for the arrangements forfeited on leaving his previous employer. The CEO will receive a contribution to his supplemental pension of 12% of the lower of his actual base salary over the year and his 2011 base salary (£920,000) plus 3% per annum. The cap for 2015 has been kept at £976,028 with a maximum contribution of £117,123.
This supplemental pension accrual is conditional on the CEO remaining in employment with Unilever to age 60 and subsequently retiring from active service or his death or total disability prior to retirement.
PERFORMANCE ELEMENTS OF REMUNERATIONThe actual targets for the annual bonus and the three business-focused performance measures for the MCIP and GSIP awards to be made in 2015 have not been disclosed up front. The Boards deem this to be commercially sensitive information as targets could reveal information about Unilever’s business plan and budgeting process to competitors, which could be damaging to Unilever’s business interests and therefore to shareholders. Where appropriate, targets will be disclosed in the Directors’ Remuneration Report following the end of the respective performance period.
Performance measures are selected to align with Unilever’s clearly stated growth ambition and our long-term business strategy. Unilever’s primary business objective is to generate a sustainable improvement in business performance through increasing underlying sales while steadily improving core operating margins and cash flow.
The measures chosen for the annual and long-term incentives support the delivery of this objective. Performance measures focus management on the delivery of a combination of top-line revenue growth and bottom-line profit growth that Unilever believes will build shareholder value over the longer term. The use of a performance measure based on total shareholder return measures Unilever’s success relative to peers.
65Unilever Annual Report and Accounts 2014 Governance
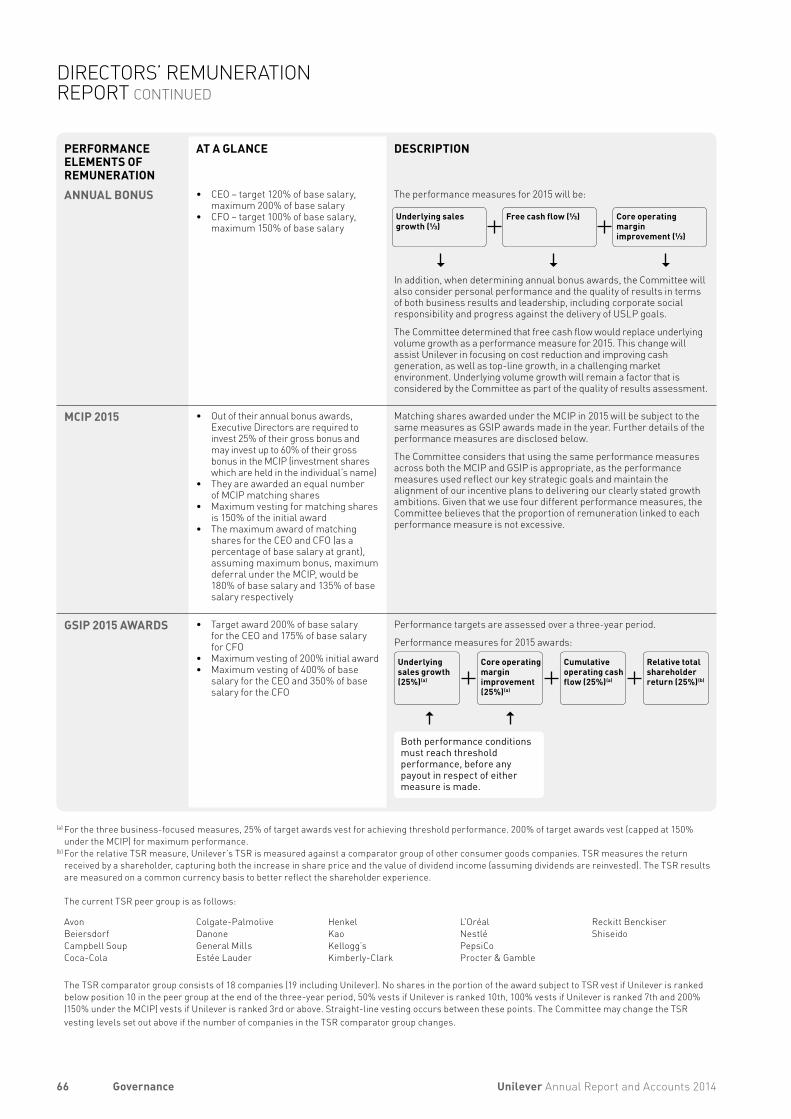
PERFORMANCE ELEMENTS OF REMUNERATION
AT A GLANCE DESCRIPTION
ANNUAL BONUS • CEO – target 120% of base salary, maximum 200% of base salary
• CFO – target 100% of base salary, maximum 150% of base salary
The performance measures for 2015 will be:
In addition, when determining annual bonus awards, the Committee will also consider personal performance and the quality of results in terms of both business results and leadership, including corporate social responsibility and progress against the delivery of USLP goals.
The Committee determined that free cash flow would replace underlying volume growth as a performance measure for 2015. This change will assist Unilever in focusing on cost reduction and improving cash generation, as well as top-line growth, in a challenging market environment. Underlying volume growth will remain a factor that is considered by the Committee as part of the quality of results assessment.
MCIP 2015 • Out of their annual bonus awards, Executive Directors are required to invest 25% of their gross bonus and may invest up to 60% of their gross bonus in the MCIP (investment shares which are held in the individual’s name)
• They are awarded an equal number of MCIP matching shares
• Maximum vesting for matching shares is 150% of the initial award
• The maximum award of matching shares for the CEO and CFO (as a percentage of base salary at grant), assuming maximum bonus, maximum deferral under the MCIP, would be 180% of base salary and 135% of base salary respectively
Matching shares awarded under the MCIP in 2015 will be subject to the same measures as GSIP awards made in the year. Further details of the performance measures are disclosed below.
The Committee considers that using the same performance measures across both the MCIP and GSIP is appropriate, as the performance measures used reflect our key strategic goals and maintain the alignment of our incentive plans to delivering our clearly stated growth ambitions. Given that we use four different performance measures, the Committee believes that the proportion of remuneration linked to each performance measure is not excessive.
GSIP 2015 AWARDS • Target award 200% of base salary for the CEO and 175% of base salary for CFO
• Maximum vesting of 200% initial award • Maximum vesting of 400% of base
salary for the CEO and 350% of base salary for the CFO
Performance targets are assessed over a three-year period.
Performance measures for 2015 awards:
(a) For the three business-focused measures, 25% of target awards vest for achieving threshold performance. 200% of target awards vest (capped at 150% under the MCIP) for maximum performance.
(b) For the relative TSR measure, Unilever’s TSR is measured against a comparator group of other consumer goods companies. TSR measures the return received by a shareholder, capturing both the increase in share price and the value of dividend income (assuming dividends are reinvested). The TSR results are measured on a common currency basis to better reflect the shareholder experience.
The current TSR peer group is as follows:
Avon Colgate-Palmolive Henkel L’Oréal Reckitt BenckiserBeiersdorf Danone Kao Nestlé Shiseido Campbell Soup General Mills Kellogg’s PepsiCoCoca-Cola Estée Lauder Kimberly-Clark Procter & Gamble
The TSR comparator group consists of 18 companies (19 including Unilever). No shares in the portion of the award subject to TSR vest if Unilever is ranked
below position 10 in the peer group at the end of the three-year period, 50% vests if Unilever is ranked 10th, 100% vests if Unilever is ranked 7th and 200% (150% under the MCIP) vests if Unilever is ranked 3rd or above. Straight-line vesting occurs between these points. The Committee may change the TSR vesting levels set out above if the number of companies in the TSR comparator group changes.
Underlying sales growth (⅓)
Free cash flow (⅓) Core operating margin improvement (⅓)
Underlying sales growth (25%)(a)
Core operating margin improvement (25%)(a)
Cumulative operating cash flow (25%)(a)
Relative total shareholder return (25%)(b)
Both performance conditions must reach threshold performance, before any payout in respect of either measure is made.
66 Unilever Annual Report and Accounts 2014Governance
DIRECTORS’ REMUNERATION REPORT CONTINUED
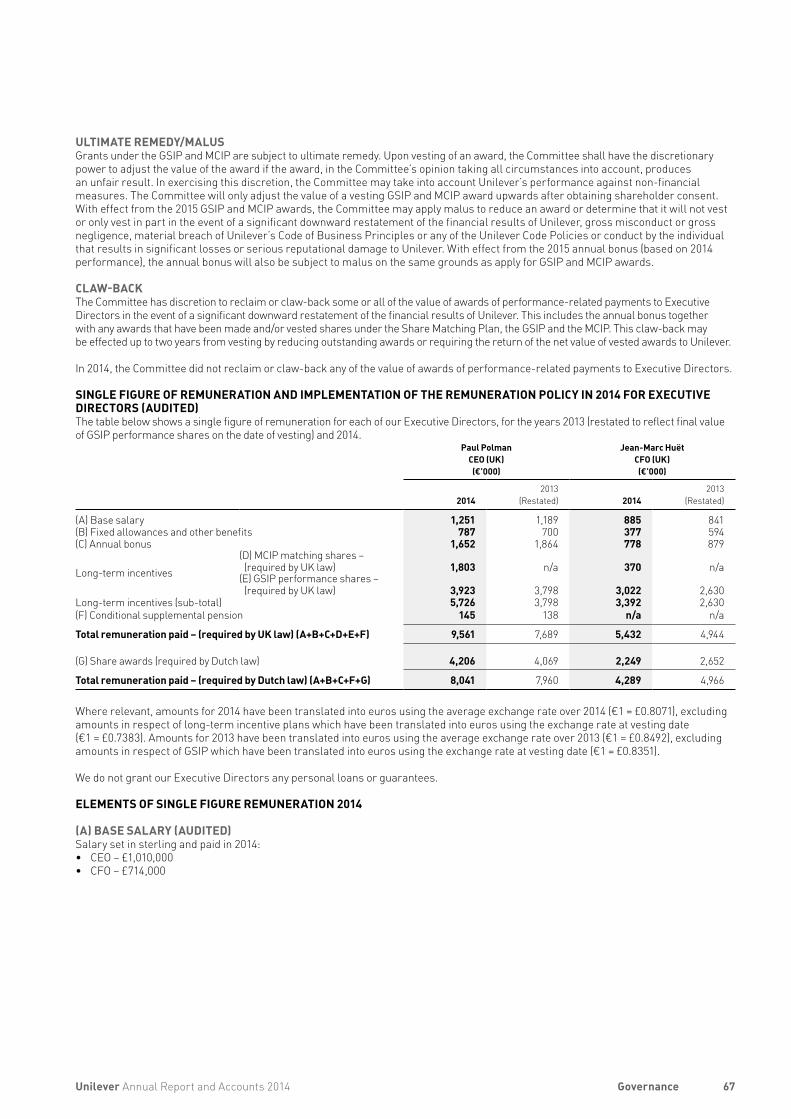
ULTIMATE REMEDY/MALUSGrants under the GSIP and MCIP are subject to ultimate remedy. Upon vesting of an award, the Committee shall have the discretionary power to adjust the value of the award if the award, in the Committee’s opinion taking all circumstances into account, produces an unfair result. In exercising this discretion, the Committee may take into account Unilever’s performance against non-financial measures. The Committee will only adjust the value of a vesting GSIP and MCIP award upwards after obtaining shareholder consent.With effect from the 2015 GSIP and MCIP awards, the Committee may apply malus to reduce an award or determine that it will not vest or only vest in part in the event of a significant downward restatement of the financial results of Unilever, gross misconduct or gross negligence, material breach of Unilever’s Code of Business Principles or any of the Unilever Code Policies or conduct by the individual that results in significant losses or serious reputational damage to Unilever. With effect from the 2015 annual bonus (based on 2014 performance), the annual bonus will also be subject to malus on the same grounds as apply for GSIP and MCIP awards.
CLAW-BACKThe Committee has discretion to reclaim or claw-back some or all of the value of awards of performance-related payments to Executive Directors in the event of a significant downward restatement of the financial results of Unilever. This includes the annual bonus together with any awards that have been made and/or vested shares under the Share Matching Plan, the GSIP and the MCIP. This claw-back may be effected up to two years from vesting by reducing outstanding awards or requiring the return of the net value of vested awards to Unilever.
In 2014, the Committee did not reclaim or claw-back any of the value of awards of performance-related payments to Executive Directors.
SINGLE FIGURE OF REMUNERATION AND IMPLEMENTATION OF THE REMUNERATION POLICY IN 2014 FOR EXECUTIVE DIRECTORS (AUDITED)The table below shows a single figure of remuneration for each of our Executive Directors, for the years 2013 (restated to reflect final value of GSIP performance shares on the date of vesting) and 2014.
Paul Polman CEO (UK)(€’000)
Jean-Marc Huët CFO (UK)(€’000)
20142013
(Restated) 20142013
(Restated)
(A) Base salary 1,251 1,189 885 841(B) Fixed allowances and other benefits 787 700 377 594(C) Annual bonus 1,652 1,864 778 879
Long-term incentives(D) MCIP matching shares – (required by UK law) 1,803 n/a 370 n/a
(E) GSIP performance shares – (required by UK law) 3,923 3,798 3,022 2,630
Long-term incentives (sub-total) 5,726 3,798 3,392 2,630(F) Conditional supplemental pension 145 138 n/a n/a
Total remuneration paid – (required by UK law) (A+B+C+D+E+F) 9,561 7,689 5,432 4,944
(G) Share awards (required by Dutch law) 4,206 4,069 2,249 2,652
Total remuneration paid – (required by Dutch law) (A+B+C+F+G) 8,041 7,960 4,289 4,966
Where relevant, amounts for 2014 have been translated into euros using the average exchange rate over 2014 (€1 = £0.8071), excluding amounts in respect of long-term incentive plans which have been translated into euros using the exchange rate at vesting date (€1 = £0.7383). Amounts for 2013 have been translated into euros using the average exchange rate over 2013 (€1 = £0.8492), excluding amounts in respect of GSIP which have been translated into euros using the exchange rate at vesting date (€1 = £0.8351).
We do not grant our Executive Directors any personal loans or guarantees.
ELEMENTS OF SINGLE FIGURE REMUNERATION 2014
(A) BASE SALARY (AUDITED)Salary set in sterling and paid in 2014:• CEO – £1,010,000 • CFO – £714,000
67Unilever Annual Report and Accounts 2014 Governance
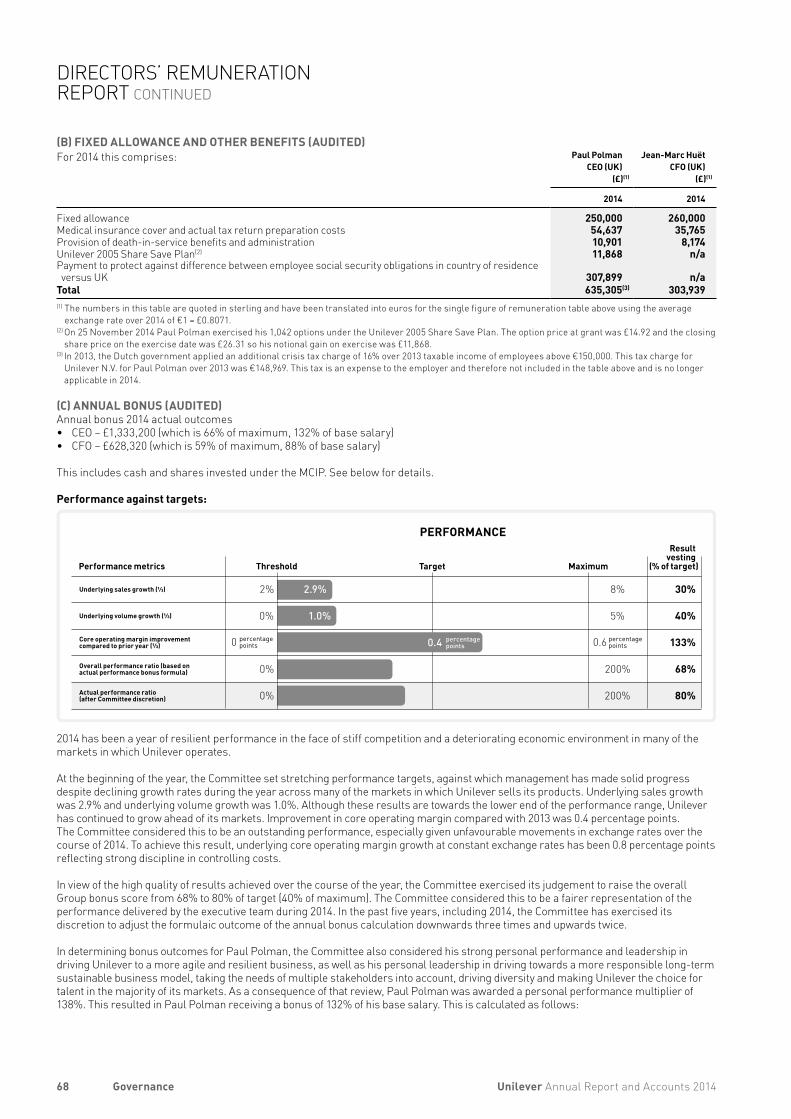
(B) FIXED ALLOWANCE AND OTHER BENEFITS (AUDITED)For 2014 this comprises: Paul Polman
CEO (UK)(£)(1)
Jean-Marc Huët CFO (UK)
(£)(1)
2014 2014
Fixed allowance 250,000 260,000Medical insurance cover and actual tax return preparation costs 54,637 35,765Provision of death-in-service benefits and administration 10,901 8,174Unilever 2005 Share Save Plan(2) 11,868 n/aPayment to protect against difference between employee social security obligations in country of residence versus UK 307,899 n/a
Total 635,305(3) 303,939(1) The numbers in this table are quoted in sterling and have been translated into euros for the single figure of remuneration table above using the average
exchange rate over 2014 of €1 = £0.8071.(2) On 25 November 2014 Paul Polman exercised his 1,042 options under the Unilever 2005 Share Save Plan. The option price at grant was £14.92 and the closing
share price on the exercise date was £26.31 so his notional gain on exercise was £11,868.(3) In 2013, the Dutch government applied an additional crisis tax charge of 16% over 2013 taxable income of employees above €150,000. This tax charge for
Unilever N.V. for Paul Polman over 2013 was €148,969. This tax is an expense to the employer and therefore not included in the table above and is no longer applicable in 2014.
(C) ANNUAL BONUS (AUDITED)Annual bonus 2014 actual outcomes • CEO – £1,333,200 (which is 66% of maximum, 132% of base salary) • CFO – £628,320 (which is 59% of maximum, 88% of base salary)
This includes cash and shares invested under the MCIP. See below for details.
Performance against targets:
Target
PERFORMANCE
Performance metrics Threshold
Result vesting
(% of target) Maximum
Core operating margin improvementcompared to prior year (⅓)
Underlying volume growth (⅓)
Underlying sales growth (⅓) 2.9%
1.0%
30%8%
5%
2%
0% 40%
133%
Overall performance ratio (based on actual performance bonus formula) 200%0% 68%
Actual performance ratio (after Committee discretion) 200%0% 80%
0 percentage points 0.6 percentage
points0.4 percentage points
2014 has been a year of resilient performance in the face of stiff competition and a deteriorating economic environment in many of the markets in which Unilever operates.
At the beginning of the year, the Committee set stretching performance targets, against which management has made solid progress despite declining growth rates during the year across many of the markets in which Unilever sells its products. Underlying sales growth was 2.9% and underlying volume growth was 1.0%. Although these results are towards the lower end of the performance range, Unilever has continued to grow ahead of its markets. Improvement in core operating margin compared with 2013 was 0.4 percentage points. The Committee considered this to be an outstanding performance, especially given unfavourable movements in exchange rates over the course of 2014. To achieve this result, underlying core operating margin growth at constant exchange rates has been 0.8 percentage points reflecting strong discipline in controlling costs.
In view of the high quality of results achieved over the course of the year, the Committee exercised its judgement to raise the overall Group bonus score from 68% to 80% of target (40% of maximum). The Committee considered this to be a fairer representation of the performance delivered by the executive team during 2014. In the past five years, including 2014, the Committee has exercised its discretion to adjust the formulaic outcome of the annual bonus calculation downwards three times and upwards twice.
In determining bonus outcomes for Paul Polman, the Committee also considered his strong personal performance and leadership in driving Unilever to a more agile and resilient business, as well as his personal leadership in driving towards a more responsible long-term sustainable business model, taking the needs of multiple stakeholders into account, driving diversity and making Unilever the choice for talent in the majority of its markets. As a consequence of that review, Paul Polman was awarded a personal performance multiplier of 138%. This resulted in Paul Polman receiving a bonus of 132% of his base salary. This is calculated as follows:
68 Unilever Annual Report and Accounts 2014Governance
DIRECTORS’ REMUNERATION REPORT CONTINUED
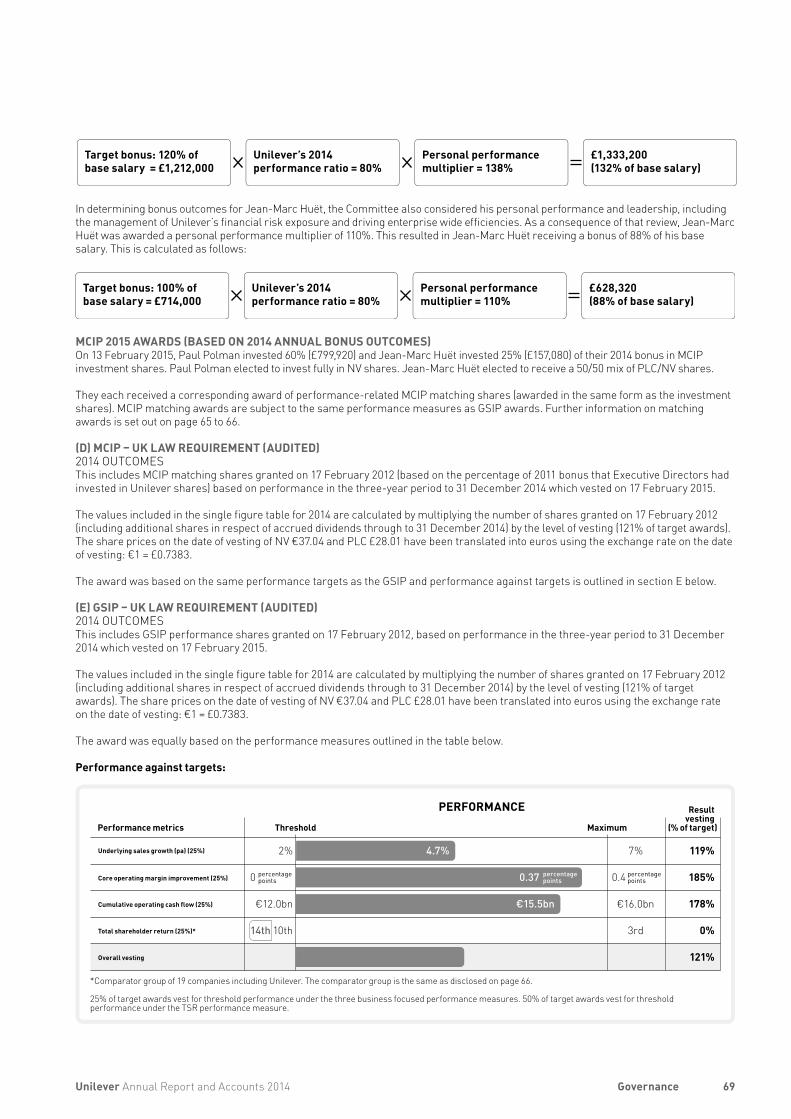
Target bonus: 120% of base salary = £1,212,000
Unilever’s 2014 performance ratio = 80%
Personal performance multiplier = 138%
£1,333,200 (132% of base salary)
In determining bonus outcomes for Jean-Marc Huët, the Committee also considered his personal performance and leadership, including the management of Unilever’s financial risk exposure and driving enterprise wide efficiencies. As a consequence of that review, Jean-Marc Huët was awarded a personal performance multiplier of 110%. This resulted in Jean-Marc Huët receiving a bonus of 88% of his base salary. This is calculated as follows:
Target bonus: 100% of base salary = £714,000
Unilever’s 2014 performance ratio = 80%
Personal performance multiplier = 110%
£628,320(88% of base salary)
MCIP 2015 AWARDS (BASED ON 2014 ANNUAL BONUS OUTCOMES)On 13 February 2015, Paul Polman invested 60% (£799,920) and Jean-Marc Huët invested 25% (£157,080) of their 2014 bonus in MCIP investment shares. Paul Polman elected to invest fully in NV shares. Jean-Marc Huët elected to receive a 50/50 mix of PLC/NV shares.
They each received a corresponding award of performance-related MCIP matching shares (awarded in the same form as the investment shares). MCIP matching awards are subject to the same performance measures as GSIP awards. Further information on matching awards is set out on page 65 to 66.
(D) MCIP – UK LAW REQUIREMENT (AUDITED)2014 OUTCOMESThis includes MCIP matching shares granted on 17 February 2012 (based on the percentage of 2011 bonus that Executive Directors had invested in Unilever shares) based on performance in the three-year period to 31 December 2014 which vested on 17 February 2015.
The values included in the single figure table for 2014 are calculated by multiplying the number of shares granted on 17 February 2012 (including additional shares in respect of accrued dividends through to 31 December 2014) by the level of vesting (121% of target awards). The share prices on the date of vesting of NV €37.04 and PLC £28.01 have been translated into euros using the exchange rate on the date of vesting: €1 = £0.7383.
The award was based on the same performance targets as the GSIP and performance against targets is outlined in section E below.
(E) GSIP – UK LAW REQUIREMENT (AUDITED)2014 OUTCOMESThis includes GSIP performance shares granted on 17 February 2012, based on performance in the three-year period to 31 December 2014 which vested on 17 February 2015.
The values included in the single figure table for 2014 are calculated by multiplying the number of shares granted on 17 February 2012 (including additional shares in respect of accrued dividends through to 31 December 2014) by the level of vesting (121% of target awards). The share prices on the date of vesting of NV €37.04 and PLC £28.01 have been translated into euros using the exchange rate on the date of vesting: €1 = £0.7383.
The award was equally based on the performance measures outlined in the table below.
Performance against targets:
*Comparator group of 19 companies including Unilever. The comparator group is the same as disclosed on page 66.
25% of target awards vest for threshold performance under the three business focused performance measures. 50% of target awards vest for threshold performance under the TSR performance measure.
PERFORMANCEPerformance metrics Threshold
Result vesting
(% of target) Maximum
Cumulative operating cash flow (25%)
Core operating margin improvement (25%)
Underlying sales growth (pa) (25%) 4.7%
€15.5bn
119%7%
€16.0bn€12.0bn
2%
185%
178%
Total shareholder return (25%)* 3rd10th 0%
Overall vesting 121%
14th
0 percentage points 0.37 percentage
points 0.4 percentage points
69Unilever Annual Report and Accounts 2014 Governance
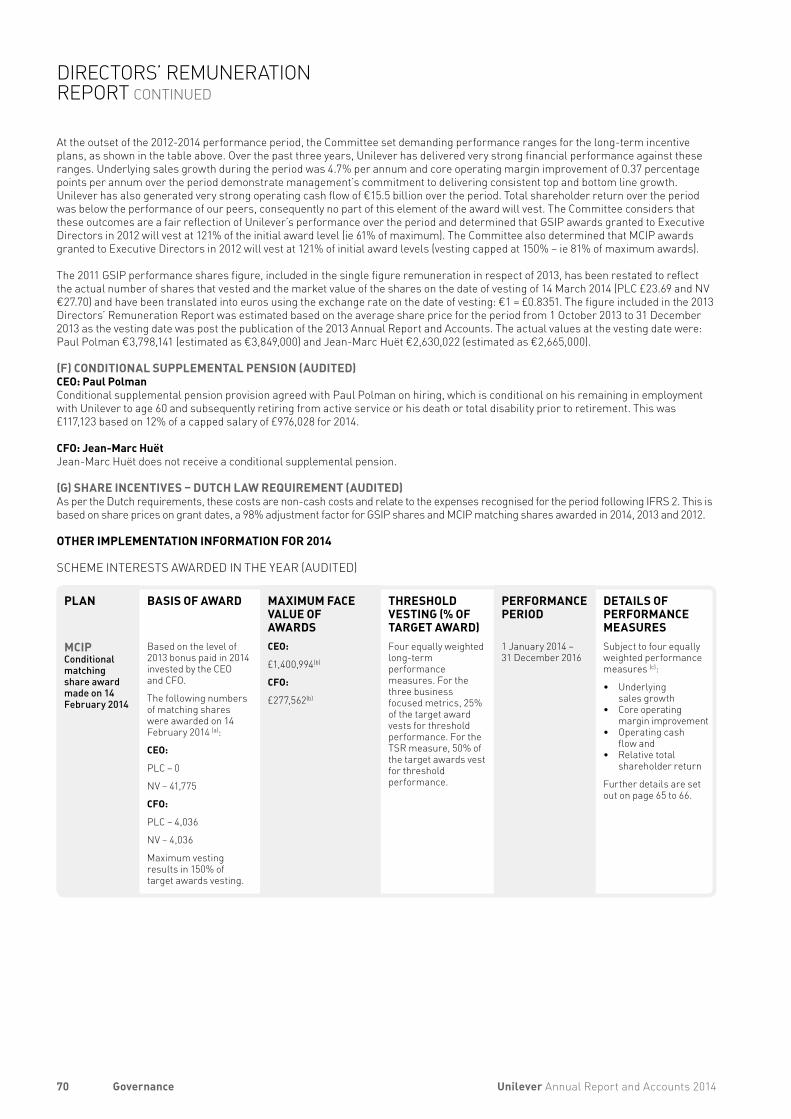
At the outset of the 2012-2014 performance period, the Committee set demanding performance ranges for the long-term incentive plans, as shown in the table above. Over the past three years, Unilever has delivered very strong financial performance against these ranges. Underlying sales growth during the period was 4.7% per annum and core operating margin improvement of 0.37 percentage points per annum over the period demonstrate management’s commitment to delivering consistent top and bottom line growth. Unilever has also generated very strong operating cash flow of €15.5 billion over the period. Total shareholder return over the period was below the performance of our peers, consequently no part of this element of the award will vest. The Committee considers that these outcomes are a fair reflection of Unilever’s performance over the period and determined that GSIP awards granted to Executive Directors in 2012 will vest at 121% of the initial award level (ie 61% of maximum). The Committee also determined that MCIP awards granted to Executive Directors in 2012 will vest at 121% of initial award levels (vesting capped at 150% – ie 81% of maximum awards).
The 2011 GSIP performance shares figure, included in the single figure remuneration in respect of 2013, has been restated to reflect the actual number of shares that vested and the market value of the shares on the date of vesting of 14 March 2014 (PLC £23.69 and NV €27.70) and have been translated into euros using the exchange rate on the date of vesting: €1 = £0.8351. The figure included in the 2013 Directors’ Remuneration Report was estimated based on the average share price for the period from 1 October 2013 to 31 December 2013 as the vesting date was post the publication of the 2013 Annual Report and Accounts. The actual values at the vesting date were: Paul Polman €3,798,141 (estimated as €3,849,000) and Jean-Marc Huët €2,630,022 (estimated as €2,665,000).
(F) CONDITIONAL SUPPLEMENTAL PENSION (AUDITED)CEO: Paul PolmanConditional supplemental pension provision agreed with Paul Polman on hiring, which is conditional on his remaining in employment with Unilever to age 60 and subsequently retiring from active service or his death or total disability prior to retirement. This was £117,123 based on 12% of a capped salary of £976,028 for 2014.
CFO: Jean-Marc HuëtJean-Marc Huët does not receive a conditional supplemental pension.
(G) SHARE INCENTIVES – DUTCH LAW REQUIREMENT (AUDITED)As per the Dutch requirements, these costs are non-cash costs and relate to the expenses recognised for the period following IFRS 2. This is based on share prices on grant dates, a 98% adjustment factor for GSIP shares and MCIP matching shares awarded in 2014, 2013 and 2012.
OTHER IMPLEMENTATION INFORMATION FOR 2014
SCHEME INTERESTS AWARDED IN THE YEAR (AUDITED)
PLAN BASIS OF AWARD MAXIMUM FACE VALUE OF AWARDS
THRESHOLD VESTING (% OF TARGET AWARD)
PERFORMANCE PERIOD
DETAILS OF PERFORMANCE MEASURES
MCIPConditional matching share award made on 14 February 2014
Based on the level of 2013 bonus paid in 2014 invested by the CEO and CFO.
The following numbers of matching shares were awarded on 14 February 2014 (a):
CEO:
PLC – 0
NV – 41,775
CFO:
PLC – 4,036
NV – 4,036
Maximum vesting results in 150% of target awards vesting.
CEO:
£1,400,994(b)
CFO:
£277,562(b)
Four equally weighted long-term performance measures. For the three business focused metrics, 25% of the target award vests for threshold performance. For the TSR measure, 50% of the target awards vest for threshold performance.
1 January 2014 – 31 December 2016
Subject to four equally weighted performance measures (c):
• Underlying sales growth
• Core operating margin improvement
• Operating cash flow and
• Relative total shareholder return
Further details are set out on page 65 to 66.
70 Unilever Annual Report and Accounts 2014Governance
DIRECTORS’ REMUNERATION REPORT CONTINUED
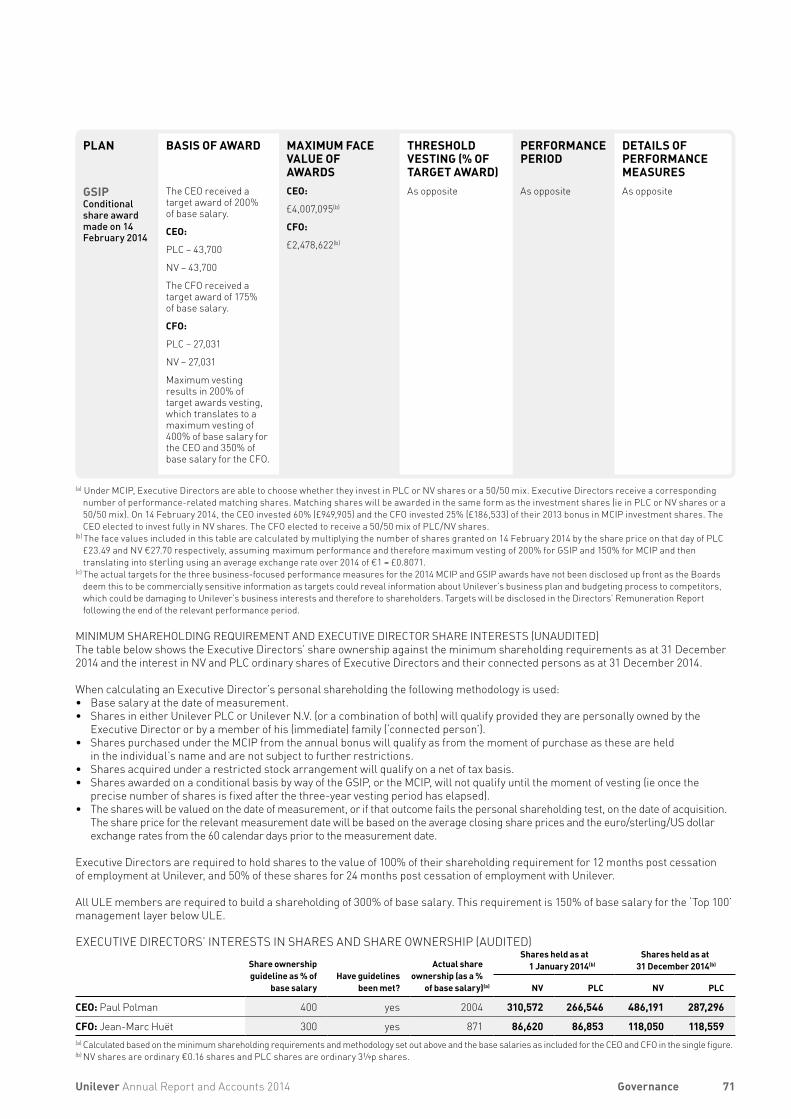
PLAN BASIS OF AWARD MAXIMUM FACE VALUE OF AWARDS
THRESHOLD VESTING (% OF TARGET AWARD)
PERFORMANCE PERIOD
DETAILS OF PERFORMANCE MEASURES
GSIP Conditional share award made on 14 February 2014
The CEO received a target award of 200% of base salary.
CEO:
PLC – 43,700
NV – 43,700
The CFO received a target award of 175% of base salary.
CFO:
PLC – 27,031
NV – 27,031
Maximum vesting results in 200% of target awards vesting, which translates to a maximum vesting of 400% of base salary for the CEO and 350% of base salary for the CFO.
CEO:
£4,007,095(b)
CFO:
£2,478,622(b)
As opposite As opposite As opposite
(a) Under MCIP, Executive Directors are able to choose whether they invest in PLC or NV shares or a 50/50 mix. Executive Directors receive a corresponding number of performance-related matching shares. Matching shares will be awarded in the same form as the investment shares (ie in PLC or NV shares or a 50/50 mix). On 14 February 2014, the CEO invested 60% (£949,905) and the CFO invested 25% (£186,533) of their 2013 bonus in MCIP investment shares. The CEO elected to invest fully in NV shares. The CFO elected to receive a 50/50 mix of PLC/NV shares.
(b) The face values included in this table are calculated by multiplying the number of shares granted on 14 February 2014 by the share price on that day of PLC £23.49 and NV €27.70 respectively, assuming maximum performance and therefore maximum vesting of 200% for GSIP and 150% for MCIP and then translating into sterling using an average exchange rate over 2014 of €1 = £0.8071.
(c) The actual targets for the three business-focused performance measures for the 2014 MCIP and GSIP awards have not been disclosed up front as the Boards deem this to be commercially sensitive information as targets could reveal information about Unilever’s business plan and budgeting process to competitors, which could be damaging to Unilever’s business interests and therefore to shareholders. Targets will be disclosed in the Directors’ Remuneration Report following the end of the relevant performance period.
MINIMUM SHAREHOLDING REQUIREMENT AND EXECUTIVE DIRECTOR SHARE INTERESTS (UNAUDITED)The table below shows the Executive Directors’ share ownership against the minimum shareholding requirements as at 31 December 2014 and the interest in NV and PLC ordinary shares of Executive Directors and their connected persons as at 31 December 2014.
When calculating an Executive Director’s personal shareholding the following methodology is used:• Base salary at the date of measurement.• Shares in either Unilever PLC or Unilever N.V. (or a combination of both) will qualify provided they are personally owned by the
Executive Director or by a member of his (immediate) family (‘connected person’).• Shares purchased under the MCIP from the annual bonus will qualify as from the moment of purchase as these are held
in the individual’s name and are not subject to further restrictions. • Shares acquired under a restricted stock arrangement will qualify on a net of tax basis. • Shares awarded on a conditional basis by way of the GSIP, or the MCIP, will not qualify until the moment of vesting (ie once the
precise number of shares is fixed after the three-year vesting period has elapsed).• The shares will be valued on the date of measurement, or if that outcome fails the personal shareholding test, on the date of acquisition.
The share price for the relevant measurement date will be based on the average closing share prices and the euro/sterling/US dollar exchange rates from the 60 calendar days prior to the measurement date.
Executive Directors are required to hold shares to the value of 100% of their shareholding requirement for 12 months post cessation of employment at Unilever, and 50% of these shares for 24 months post cessation of employment with Unilever.
All ULE members are required to build a shareholding of 300% of base salary. This requirement is 150% of base salary for the ‘Top 100’ management layer below ULE.
EXECUTIVE DIRECTORS’ INTERESTS IN SHARES AND SHARE OWNERSHIP (AUDITED)
Share ownership guideline as % of
base salaryHave guidelines
been met?
Actual share ownership (as a %
of base salary)(a)
Shares held as at1 January 2014(b)
Shares held as at31 December 2014(b)
NV PLC NV PLC
CEO: Paul Polman 400 yes 2004 310,572 266,546 486,191 287,296
CFO: Jean-Marc Huët 300 yes 871 86,620 86,853 118,050 118,559(a) Calculated based on the minimum shareholding requirements and methodology set out above and the base salaries as included for the CEO and CFO in the single figure.(b) NV shares are ordinary €0.16 shares and PLC shares are ordinary 3⅟9p shares.
71Unilever Annual Report and Accounts 2014 Governance
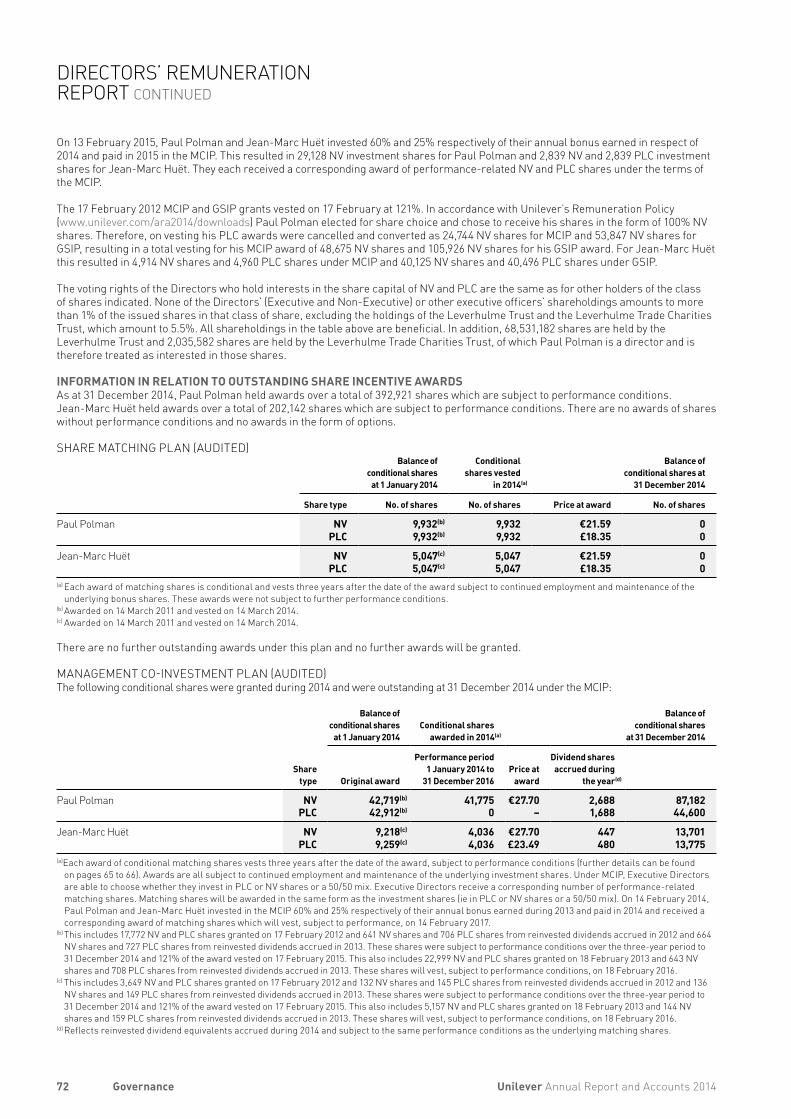
On 13 February 2015, Paul Polman and Jean-Marc Huët invested 60% and 25% respectively of their annual bonus earned in respect of 2014 and paid in 2015 in the MCIP. This resulted in 29,128 NV investment shares for Paul Polman and 2,839 NV and 2,839 PLC investment shares for Jean-Marc Huët. They each received a corresponding award of performance-related NV and PLC shares under the terms of the MCIP.
The 17 February 2012 MCIP and GSIP grants vested on 17 February at 121%. In accordance with Unilever’s Remuneration Policy (www.unilever.com/ara2014/downloads) Paul Polman elected for share choice and chose to receive his shares in the form of 100% NV shares. Therefore, on vesting his PLC awards were cancelled and converted as 24,744 NV shares for MCIP and 53,847 NV shares for GSIP, resulting in a total vesting for his MCIP award of 48,675 NV shares and 105,926 NV shares for his GSIP award. For Jean-Marc Huët this resulted in 4,914 NV shares and 4,960 PLC shares under MCIP and 40,125 NV shares and 40,496 PLC shares under GSIP.
The voting rights of the Directors who hold interests in the share capital of NV and PLC are the same as for other holders of the class of shares indicated. None of the Directors’ (Executive and Non-Executive) or other executive officers’ shareholdings amounts to more than 1% of the issued shares in that class of share, excluding the holdings of the Leverhulme Trust and the Leverhulme Trade Charities Trust, which amount to 5.5%. All shareholdings in the table above are beneficial. In addition, 68,531,182 shares are held by the Leverhulme Trust and 2,035,582 shares are held by the Leverhulme Trade Charities Trust, of which Paul Polman is a director and is therefore treated as interested in those shares.
INFORMATION IN RELATION TO OUTSTANDING SHARE INCENTIVE AWARDSAs at 31 December 2014, Paul Polman held awards over a total of 392,921 shares which are subject to performance conditions. Jean-Marc Huët held awards over a total of 202,142 shares which are subject to performance conditions. There are no awards of shares without performance conditions and no awards in the form of options.
SHARE MATCHING PLAN (AUDITED)Balance of
conditional shares at 1 January 2014
Conditional shares vested
in 2014(a)
Balance of conditional shares at
31 December 2014
Share type No. of shares No. of shares Price at award No. of shares
Paul Polman NV 9,932(b) 9,932 €21.59 0PLC 9,932(b) 9,932 £18.35 0
Jean-Marc Huët NV 5,047(c) 5,047 €21.59 0PLC 5,047(c) 5,047 £18.35 0
(a) Each award of matching shares is conditional and vests three years after the date of the award subject to continued employment and maintenance of the underlying bonus shares. These awards were not subject to further performance conditions.
(b) Awarded on 14 March 2011 and vested on 14 March 2014.(c) Awarded on 14 March 2011 and vested on 14 March 2014.
There are no further outstanding awards under this plan and no further awards will be granted.
MANAGEMENT CO-INVESTMENT PLAN (AUDITED)The following conditional shares were granted during 2014 and were outstanding at 31 December 2014 under the MCIP:
Balance of conditional shares
at 1 January 2014Conditional shares
awarded in 2014(a)
Balance of conditional shares
at 31 December 2014
Share
type Original award
Performance period 1 January 2014 to
31 December 2016Price at
award
Dividend shares accrued during
the year(d)
Paul Polman NV 42,719(b) 41,775 €27.70 2,688 87,182PLC 42,912(b) 0 – 1,688 44,600
Jean-Marc Huët NV 9,218(c) 4,036 €27.70 447 13,701 PLC 9,259(c) 4,036 £23.49 480 13,775(a)Each award of conditional matching shares vests three years after the date of the award, subject to performance conditions (further details can be found
on pages 65 to 66). Awards are all subject to continued employment and maintenance of the underlying investment shares. Under MCIP, Executive Directors are able to choose whether they invest in PLC or NV shares or a 50/50 mix. Executive Directors receive a corresponding number of performance-related matching shares. Matching shares will be awarded in the same form as the investment shares (ie in PLC or NV shares or a 50/50 mix). On 14 February 2014, Paul Polman and Jean-Marc Huët invested in the MCIP 60% and 25% respectively of their annual bonus earned during 2013 and paid in 2014 and received a corresponding award of matching shares which will vest, subject to performance, on 14 February 2017.
(b) This includes 17,772 NV and PLC shares granted on 17 February 2012 and 641 NV shares and 706 PLC shares from reinvested dividends accrued in 2012 and 664 NV shares and 727 PLC shares from reinvested dividends accrued in 2013. These shares were subject to performance conditions over the three-year period to 31 December 2014 and 121% of the award vested on 17 February 2015. This also includes 22,999 NV and PLC shares granted on 18 February 2013 and 643 NV shares and 708 PLC shares from reinvested dividends accrued in 2013. These shares will vest, subject to performance conditions, on 18 February 2016.
(c) This includes 3,649 NV and PLC shares granted on 17 February 2012 and 132 NV shares and 145 PLC shares from reinvested dividends accrued in 2012 and 136 NV shares and 149 PLC shares from reinvested dividends accrued in 2013. These shares were subject to performance conditions over the three-year period to 31 December 2014 and 121% of the award vested on 17 February 2015. This also includes 5,157 NV and PLC shares granted on 18 February 2013 and 144 NV shares and 159 PLC shares from reinvested dividends accrued in 2013. These shares will vest, subject to performance conditions, on 18 February 2016.
(d) Reflects reinvested dividend equivalents accrued during 2014 and subject to the same performance conditions as the underlying matching shares.
72 Unilever Annual Report and Accounts 2014Governance
DIRECTORS’ REMUNERATION REPORT CONTINUED
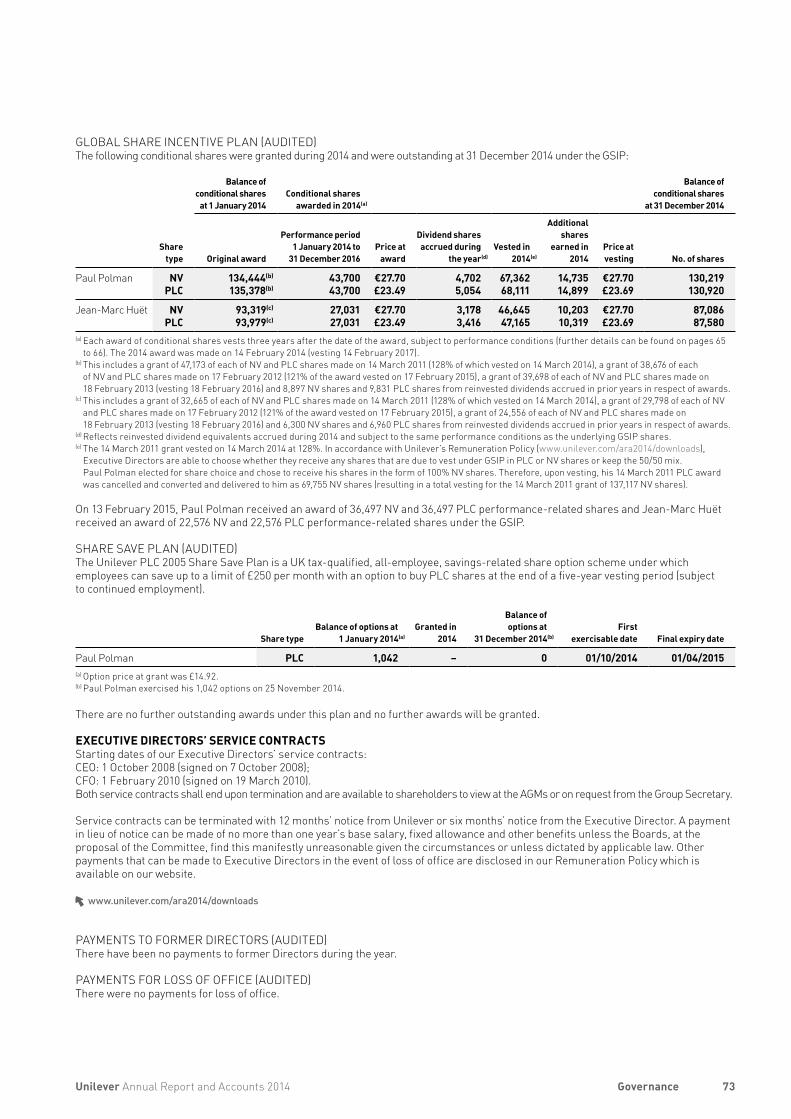
GLOBAL SHARE INCENTIVE PLAN (AUDITED)The following conditional shares were granted during 2014 and were outstanding at 31 December 2014 under the GSIP:
Balance of conditional shares
at 1 January 2014Conditional shares
awarded in 2014(a)
Balance of conditional shares
at 31 December 2014
Share
type Original award
Performance period 1 January 2014 to
31 December 2016Price at
award
Dividend shares accrued during
the year(d)Vested in
2014(e)
Additional shares
earned in 2014
Price at vesting No. of shares
Paul Polman NV 134,444(b) 43,700 €27.70 4,702 67,362 14,735 €27.70 130,219PLC 135,378(b) 43,700 £23.49 5,054 68,111 14,899 £23.69 130,920
Jean-Marc Huët NV 93,319(c) 27,031 €27.70 3,178 46,645 10,203 €27.70 87,086 PLC 93,979(c) 27,031 £23.49 3,416 47,165 10,319 £23.69 87,580(a) Each award of conditional shares vests three years after the date of the award, subject to performance conditions (further details can be found on pages 65
to 66). The 2014 award was made on 14 February 2014 (vesting 14 February 2017). (b) This includes a grant of 47,173 of each of NV and PLC shares made on 14 March 2011 (128% of which vested on 14 March 2014), a grant of 38,676 of each
of NV and PLC shares made on 17 February 2012 (121% of the award vested on 17 February 2015), a grant of 39,698 of each of NV and PLC shares made on 18 February 2013 (vesting 18 February 2016) and 8,897 NV shares and 9,831 PLC shares from reinvested dividends accrued in prior years in respect of awards.
(c) This includes a grant of 32,665 of each of NV and PLC shares made on 14 March 2011 (128% of which vested on 14 March 2014), a grant of 29,798 of each of NV and PLC shares made on 17 February 2012 (121% of the award vested on 17 February 2015), a grant of 24,556 of each of NV and PLC shares made on 18 February 2013 (vesting 18 February 2016) and 6,300 NV shares and 6,960 PLC shares from reinvested dividends accrued in prior years in respect of awards.
(d) Reflects reinvested dividend equivalents accrued during 2014 and subject to the same performance conditions as the underlying GSIP shares.(e) The 14 March 2011 grant vested on 14 March 2014 at 128%. In accordance with Unilever’s Remuneration Policy (www.unilever.com/ara2014/downloads),
Executive Directors are able to choose whether they receive any shares that are due to vest under GSIP in PLC or NV shares or keep the 50/50 mix. Paul Polman elected for share choice and chose to receive his shares in the form of 100% NV shares. Therefore, upon vesting, his 14 March 2011 PLC award was cancelled and converted and delivered to him as 69,755 NV shares (resulting in a total vesting for the 14 March 2011 grant of 137,117 NV shares).
On 13 February 2015, Paul Polman received an award of 36,497 NV and 36,497 PLC performance-related shares and Jean-Marc Huët received an award of 22,576 NV and 22,576 PLC performance-related shares under the GSIP.
SHARE SAVE PLAN (AUDITED) The Unilever PLC 2005 Share Save Plan is a UK tax-qualified, all-employee, savings-related share option scheme under which employees can save up to a limit of £250 per month with an option to buy PLC shares at the end of a five-year vesting period (subject to continued employment).
Share typeBalance of options at
1 January 2014(a)Granted in
2014
Balance of options at
31 December 2014(b)First
exercisable date Final expiry date
Paul Polman PLC 1,042 – 0 01/10/2014 01/04/2015(a) Option price at grant was £14.92.(b) Paul Polman exercised his 1,042 options on 25 November 2014.
There are no further outstanding awards under this plan and no further awards will be granted.
EXECUTIVE DIRECTORS’ SERVICE CONTRACTSStarting dates of our Executive Directors’ service contracts:CEO: 1 October 2008 (signed on 7 October 2008);CFO: 1 February 2010 (signed on 19 March 2010).Both service contracts shall end upon termination and are available to shareholders to view at the AGMs or on request from the Group Secretary.
Service contracts can be terminated with 12 months’ notice from Unilever or six months’ notice from the Executive Director. A payment in lieu of notice can be made of no more than one year’s base salary, fixed allowance and other benefits unless the Boards, at the proposal of the Committee, find this manifestly unreasonable given the circumstances or unless dictated by applicable law. Other payments that can be made to Executive Directors in the event of loss of office are disclosed in our Remuneration Policy which is available on our website.
www.unilever.com/ara2014/downloads
PAYMENTS TO FORMER DIRECTORS (AUDITED)There have been no payments to former Directors during the year.
PAYMENTS FOR LOSS OF OFFICE (AUDITED)There were no payments for loss of office.
73Unilever Annual Report and Accounts 2014 Governance
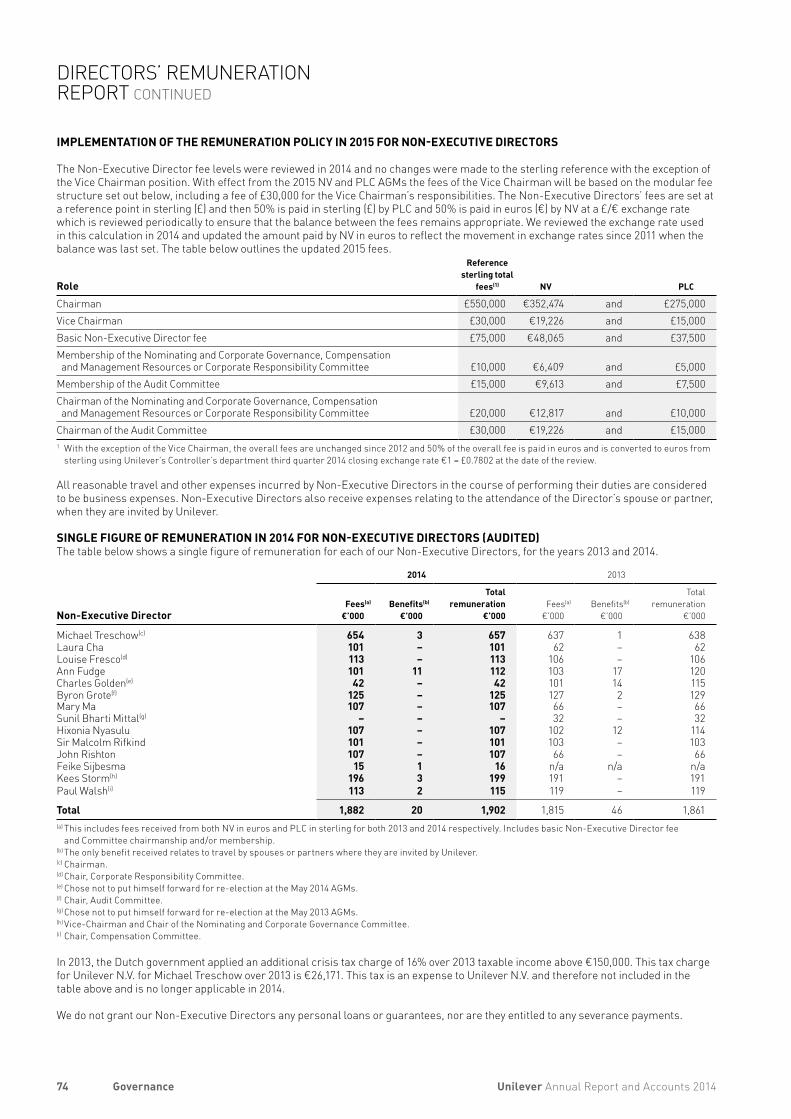
IMPLEMENTATION OF THE REMUNERATION POLICY IN 2015 FOR NON-EXECUTIVE DIRECTORS
The Non-Executive Director fee levels were reviewed in 2014 and no changes were made to the sterling reference with the exception of the Vice Chairman position. With effect from the 2015 NV and PLC AGMs the fees of the Vice Chairman will be based on the modular fee structure set out below, including a fee of £30,000 for the Vice Chairman’s responsibilities. The Non-Executive Directors’ fees are set at a reference point in sterling (£) and then 50% is paid in sterling (£) by PLC and 50% is paid in euros (€) by NV at a £/€ exchange rate which is reviewed periodically to ensure that the balance between the fees remains appropriate. We reviewed the exchange rate used in this calculation in 2014 and updated the amount paid by NV in euros to reflect the movement in exchange rates since 2011 when the balance was last set. The table below outlines the updated 2015 fees.
Role
Reference sterling total
fees(1) NV PLC
Chairman £550,000 €352,474 and £275,000Vice Chairman £30,000 €19,226 and £15,000Basic Non-Executive Director fee £75,000 €48,065 and £37,500Membership of the Nominating and Corporate Governance, Compensation and Management Resources or Corporate Responsibility Committee £10,000 €6,409 and £5,000
Membership of the Audit Committee £15,000 €9,613 and £7,500Chairman of the Nominating and Corporate Governance, Compensation and Management Resources or Corporate Responsibility Committee £20,000 €12,817 and £10,000
Chairman of the Audit Committee £30,000 €19,226 and £15,0001 With the exception of the Vice Chairman, the overall fees are unchanged since 2012 and 50% of the overall fee is paid in euros and is converted to euros from
sterling using Unilever’s Controller’s department third quarter 2014 closing exchange rate €1 = £0.7802 at the date of the review.
All reasonable travel and other expenses incurred by Non-Executive Directors in the course of performing their duties are considered to be business expenses. Non-Executive Directors also receive expenses relating to the attendance of the Director’s spouse or partner, when they are invited by Unilever.
SINGLE FIGURE OF REMUNERATION IN 2014 FOR NON-EXECUTIVE DIRECTORS (AUDITED)The table below shows a single figure of remuneration for each of our Non-Executive Directors, for the years 2013 and 2014.
2014 2013
Non-Executive DirectorFees(a)
€’000Benefits(b)
€’000
Total remuneration
€’000Fees(a)
€’000Benefits(b)
€’000
Total remuneration
€’000
Michael Treschow(c) 654 3 657 637 1 638Laura Cha 101 – 101 62 – 62Louise Fresco(d) 113 – 113 106 – 106Ann Fudge 101 11 112 103 17 120Charles Golden(e) 42 – 42 101 14 115Byron Grote(f) 125 – 125 127 2 129Mary Ma 107 – 107 66 – 66Sunil Bharti Mittal(g) – – – 32 – 32Hixonia Nyasulu 107 – 107 102 12 114Sir Malcolm Rifkind 101 – 101 103 – 103John Rishton 107 – 107 66 – 66Feike Sijbesma 15 1 16 n/a n/a n/aKees Storm(h) 196 3 199 191 – 191Paul Walsh(i) 113 2 115 119 – 119
Total 1,882 20 1,902 1,815 46 1,861(a) This includes fees received from both NV in euros and PLC in sterling for both 2013 and 2014 respectively. Includes basic Non-Executive Director fee
and Committee chairmanship and/or membership. (b) The only benefit received relates to travel by spouses or partners where they are invited by Unilever. (c) Chairman.(d) Chair, Corporate Responsibility Committee.(e) Chose not to put himself forward for re-election at the May 2014 AGMs.(f) Chair, Audit Committee.(g) Chose not to put himself forward for re-election at the May 2013 AGMs.(h) Vice-Chairman and Chair of the Nominating and Corporate Governance Committee.(i) Chair, Compensation Committee.
In 2013, the Dutch government applied an additional crisis tax charge of 16% over 2013 taxable income above €150,000. This tax charge for Unilever N.V. for Michael Treschow over 2013 is €26,171. This tax is an expense to Unilever N.V. and therefore not included in the table above and is no longer applicable in 2014.
We do not grant our Non-Executive Directors any personal loans or guarantees, nor are they entitled to any severance payments.
74 Unilever Annual Report and Accounts 2014Governance
DIRECTORS’ REMUNERATION REPORT CONTINUED
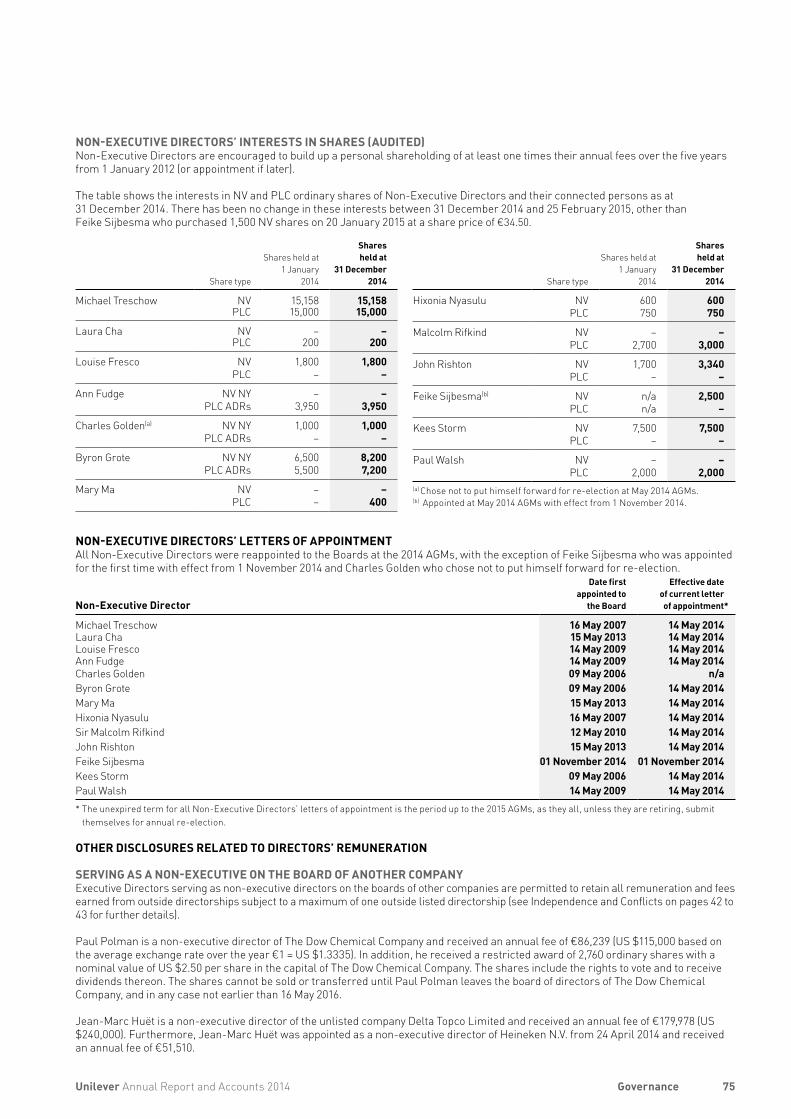
NON-EXECUTIVE DIRECTORS’ INTERESTS IN SHARES (AUDITED)Non-Executive Directors are encouraged to build up a personal shareholding of at least one times their annual fees over the five years from 1 January 2012 (or appointment if later).
The table shows the interests in NV and PLC ordinary shares of Non-Executive Directors and their connected persons as at 31 December 2014. There has been no change in these interests between 31 December 2014 and 25 February 2015, other than Feike Sijbesma who purchased 1,500 NV shares on 20 January 2015 at a share price of €34.50.
NON-EXECUTIVE DIRECTORS’ LETTERS OF APPOINTMENTAll Non-Executive Directors were reappointed to the Boards at the 2014 AGMs, with the exception of Feike Sijbesma who was appointed for the first time with effect from 1 November 2014 and Charles Golden who chose not to put himself forward for re-election.
Non-Executive Director
Date first appointed to
the Board
Effective date of current letterof appointment*
Michael Treschow 16 May 2007 14 May 2014Laura Cha 15 May 2013 14 May 2014Louise Fresco 14 May 2009 14 May 2014Ann Fudge 14 May 2009 14 May 2014Charles Golden 09 May 2006 n/aByron Grote 09 May 2006 14 May 2014Mary Ma 15 May 2013 14 May 2014Hixonia Nyasulu 16 May 2007 14 May 2014Sir Malcolm Rifkind 12 May 2010 14 May 2014John Rishton 15 May 2013 14 May 2014Feike Sijbesma 01 November 2014 01 November 2014Kees Storm 09 May 2006 14 May 2014Paul Walsh 14 May 2009 14 May 2014* The unexpired term for all Non-Executive Directors’ letters of appointment is the period up to the 2015 AGMs, as they all, unless they are retiring, submit
themselves for annual re-election.
OTHER DISCLOSURES RELATED TO DIRECTORS’ REMUNERATION
SERVING AS A NON-EXECUTIVE ON THE BOARD OF ANOTHER COMPANYExecutive Directors serving as non-executive directors on the boards of other companies are permitted to retain all remuneration and fees earned from outside directorships subject to a maximum of one outside listed directorship (see Independence and Conflicts on pages 42 to 43 for further details).
Paul Polman is a non-executive director of The Dow Chemical Company and received an annual fee of €86,239 (US $115,000 based on the average exchange rate over the year €1 = US $1.3335). In addition, he received a restricted award of 2,760 ordinary shares with a nominal value of US $2.50 per share in the capital of The Dow Chemical Company. The shares include the rights to vote and to receive dividends thereon. The shares cannot be sold or transferred until Paul Polman leaves the board of directors of The Dow Chemical Company, and in any case not earlier than 16 May 2016.
Jean-Marc Huët is a non-executive director of the unlisted company Delta Topco Limited and received an annual fee of €179,978 (US $240,000). Furthermore, Jean-Marc Huët was appointed as a non-executive director of Heineken N.V. from 24 April 2014 and received an annual fee of €51,510.
Share type
Shares held at 1 January
2014
Shares held at
31 December 2014
Michael Treschow NV 15,158 15,158PLC 15,000 15,000
Laura Cha NV – –PLC 200 200
Louise Fresco NV 1,800 1,800PLC – –
Ann Fudge NV NY – –PLC ADRs 3,950 3,950
Charles Golden(a) NV NY 1,000 1,000PLC ADRs – –
Byron Grote NV NY 6,500 8,200PLC ADRs 5,500 7,200
Mary Ma NV – –PLC – 400
Share type
Shares held at 1 January
2014
Shares held at
31 December 2014
Hixonia Nyasulu NV 600 600PLC 750 750
Malcolm Rifkind NV – –PLC 2,700 3,000
John Rishton NV 1,700 3,340PLC – –
Feike Sijbesma(b) NV n/a 2,500PLC n/a –
Kees Storm NV 7,500 7,500PLC – –
Paul Walsh NV – –PLC 2,000 2,000
(a) Chose not to put himself forward for re-election at May 2014 AGMs.(b) Appointed at May 2014 AGMs with effect from 1 November 2014.
75Unilever Annual Report and Accounts 2014 Governance
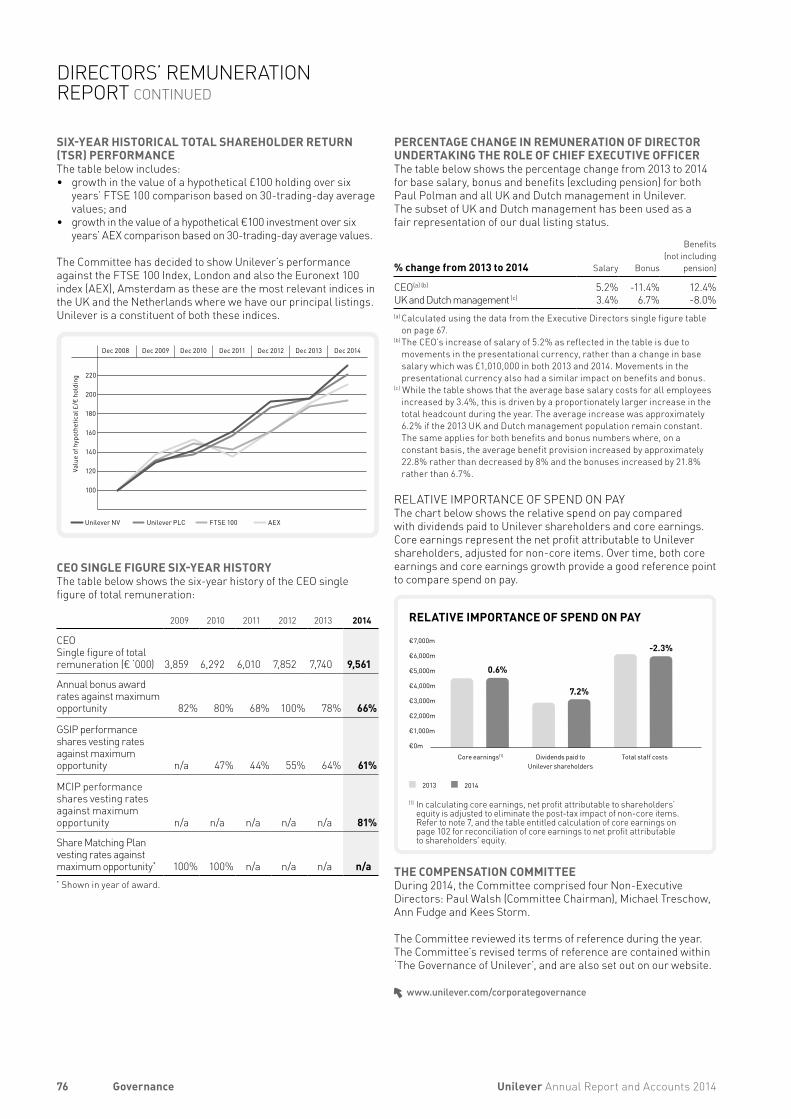
SIX-YEAR HISTORICAL TOTAL SHAREHOLDER RETURN (TSR) PERFORMANCEThe table below includes:• growth in the value of a hypothetical £100 holding over six
years’ FTSE 100 comparison based on 30-trading-day average values; and
• growth in the value of a hypothetical €100 investment over six years’ AEX comparison based on 30-trading-day average values.
The Committee has decided to show Unilever’s performance against the FTSE 100 Index, London and also the Euronext 100 index (AEX), Amsterdam as these are the most relevant indices in the UK and the Netherlands where we have our principal listings. Unilever is a constituent of both these indices.
Unilever NV Unilever PLC FTSE 100 AEX
Valu
e of
hyp
othe
tical
£/€
hol
ding
Dec 2008 Dec 2009 Dec 2010 Dec 2011 Dec 2012 Dec 2013 Dec 2014
100
120
140
160
180
200
220
CEO SINGLE FIGURE SIX-YEAR HISTORYThe table below shows the six-year history of the CEO single figure of total remuneration:
2009 2010 2011 2012 2013 2014
CEO Single figure of total remuneration (€ ‘000) 3,859 6,292 6,010 7,852 7,740 9,561
Annual bonus award rates against maximum opportunity 82% 80% 68% 100% 78% 66%
GSIP performance shares vesting rates against maximum opportunity n/a 47% 44% 55% 64% 61%
MCIP performance shares vesting rates against maximum opportunity n/a n/a n/a n/a n/a 81%
Share Matching Plan vesting rates against maximum opportunity* 100% 100% n/a n/a n/a n/a* Shown in year of award.
PERCENTAGE CHANGE IN REMUNERATION OF DIRECTOR UNDERTAKING THE ROLE OF CHIEF EXECUTIVE OFFICERThe table below shows the percentage change from 2013 to 2014 for base salary, bonus and benefits (excluding pension) for both Paul Polman and all UK and Dutch management in Unilever. The subset of UK and Dutch management has been used as a fair representation of our dual listing status.
% change from 2013 to 2014 Salary Bonus
Benefits (not including
pension)
CEO(a) (b) 5.2% -11.4% 12.4%UK and Dutch management (c) 3.4% 6.7% -8.0%(a) Calculated using the data from the Executive Directors single figure table
on page 67.(b) The CEO’s increase of salary of 5.2% as reflected in the table is due to
movements in the presentational currency, rather than a change in base salary which was £1,010,000 in both 2013 and 2014. Movements in the presentational currency also had a similar impact on benefits and bonus.
(c) While the table shows that the average base salary costs for all employees increased by 3.4%, this is driven by a proportionately larger increase in the total headcount during the year. The average increase was approximately 6.2% if the 2013 UK and Dutch management population remain constant. The same applies for both benefits and bonus numbers where, on a constant basis, the average benefit provision increased by approximately 22.8% rather than decreased by 8% and the bonuses increased by 21.8% rather than 6.7%.
RELATIVE IMPORTANCE OF SPEND ON PAY The chart below shows the relative spend on pay compared with dividends paid to Unilever shareholders and core earnings. Core earnings represent the net profit attributable to Unilever shareholders, adjusted for non-core items. Over time, both core earnings and core earnings growth provide a good reference point to compare spend on pay.
RELATIVE IMPORTANCE OF SPEND ON PAY
Core earnings(1) Dividends paid to Unilever shareholders
Total staff costs
0.6%
7.2%
-2.3%
2013 2014
€0m
€1,000m
€2,000m
€3,000m
€4,000m
€5,000m
€6,000m
€7,000m
(1) In calculating core earnings, net profit attributable to shareholders’ equity is adjusted to eliminate the post-tax impact of non-core items. Refer to note 7, and the table entitled calculation of core earnings on page 102 for reconciliation of core earnings to net profit attributable to shareholders' equity.
THE COMPENSATION COMMITTEE During 2014, the Committee comprised four Non-Executive Directors: Paul Walsh (Committee Chairman), Michael Treschow, Ann Fudge and Kees Storm.
The Committee reviewed its terms of reference during the year. The Committee’s revised terms of reference are contained within ‘The Governance of Unilever’, and are also set out on our website.
www.unilever.com/corporategovernance
76 Unilever Annual Report and Accounts 2014Governance
DIRECTORS’ REMUNERATION REPORT CONTINUED
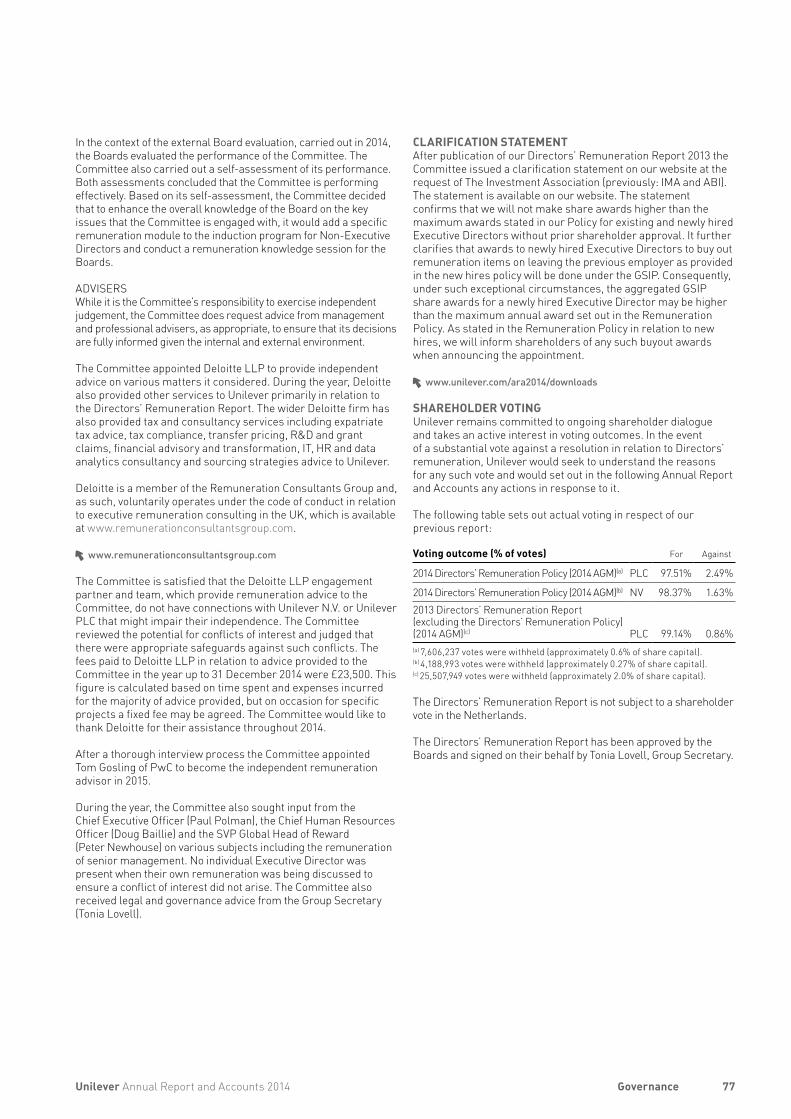
In the context of the external Board evaluation, carried out in 2014, the Boards evaluated the performance of the Committee. The Committee also carried out a self-assessment of its performance. Both assessments concluded that the Committee is performing effectively. Based on its self-assessment, the Committee decided that to enhance the overall knowledge of the Board on the key issues that the Committee is engaged with, it would add a specific remuneration module to the induction program for Non-Executive Directors and conduct a remuneration knowledge session for the Boards.
ADVISERSWhile it is the Committee’s responsibility to exercise independent judgement, the Committee does request advice from management and professional advisers, as appropriate, to ensure that its decisions are fully informed given the internal and external environment.
The Committee appointed Deloitte LLP to provide independent advice on various matters it considered. During the year, Deloitte also provided other services to Unilever primarily in relation to the Directors’ Remuneration Report. The wider Deloitte firm has also provided tax and consultancy services including expatriate tax advice, tax compliance, transfer pricing, R&D and grant claims, financial advisory and transformation, IT, HR and data analytics consultancy and sourcing strategies advice to Unilever.
Deloitte is a member of the Remuneration Consultants Group and, as such, voluntarily operates under the code of conduct in relation to executive remuneration consulting in the UK, which is available at www.remunerationconsultantsgroup.com.
www.remunerationconsultantsgroup.com
The Committee is satisfied that the Deloitte LLP engagement partner and team, which provide remuneration advice to the Committee, do not have connections with Unilever N.V. or Unilever PLC that might impair their independence. The Committee reviewed the potential for conflicts of interest and judged that there were appropriate safeguards against such conflicts. The fees paid to Deloitte LLP in relation to advice provided to the Committee in the year up to 31 December 2014 were £23,500. This figure is calculated based on time spent and expenses incurred for the majority of advice provided, but on occasion for specific projects a fixed fee may be agreed. The Committee would like to thank Deloitte for their assistance throughout 2014.
After a thorough interview process the Committee appointed Tom Gosling of PwC to become the independent remuneration advisor in 2015.
During the year, the Committee also sought input from the Chief Executive Officer (Paul Polman), the Chief Human Resources Officer (Doug Baillie) and the SVP Global Head of Reward (Peter Newhouse) on various subjects including the remuneration of senior management. No individual Executive Director was present when their own remuneration was being discussed to ensure a conflict of interest did not arise. The Committee also received legal and governance advice from the Group Secretary (Tonia Lovell).
CLARIFICATION STATEMENTAfter publication of our Directors’ Remuneration Report 2013 the Committee issued a clarification statement on our website at the request of The Investment Association (previously: IMA and ABI). The statement is available on our website. The statement confirms that we will not make share awards higher than the maximum awards stated in our Policy for existing and newly hired Executive Directors without prior shareholder approval. It further clarifies that awards to newly hired Executive Directors to buy out remuneration items on leaving the previous employer as provided in the new hires policy will be done under the GSIP. Consequently, under such exceptional circumstances, the aggregated GSIP share awards for a newly hired Executive Director may be higher than the maximum annual award set out in the Remuneration Policy. As stated in the Remuneration Policy in relation to new hires, we will inform shareholders of any such buyout awards when announcing the appointment.
www.unilever.com/ara2014/downloads
SHAREHOLDER VOTING Unilever remains committed to ongoing shareholder dialogue and takes an active interest in voting outcomes. In the event of a substantial vote against a resolution in relation to Directors’ remuneration, Unilever would seek to understand the reasons for any such vote and would set out in the following Annual Report and Accounts any actions in response to it.
The following table sets out actual voting in respect of our previous report:
Voting outcome (% of votes) For Against
2014 Directors’ Remuneration Policy (2014 AGM)(a} PLC 97.51% 2.49%
2014 Directors’ Remuneration Policy (2014 AGM)(b) NV 98.37% 1.63%2013 Directors’ Remuneration Report (excluding the Directors’ Remuneration Policy) (2014 AGM)(c) PLC 99.14% 0.86%(a) 7,606,237 votes were withheld (approximately 0.6% of share capital).(b) 4,188,993 votes were withheld (approximately 0.27% of share capital).(c) 25,507,949 votes were withheld (approximately 2.0% of share capital).
The Directors’ Remuneration Report is not subject to a shareholder vote in the Netherlands.
The Directors’ Remuneration Report has been approved by the Boards and signed on their behalf by Tonia Lovell, Group Secretary.
77Unilever Annual Report and Accounts 2014 Governance
DIRECTORS’ RESPONSIBILITY STATEMENTEach of the Directors confirms that, to the best of his or her knowledge:• The Annual Report and Accounts, taken as a whole, is fair,
balanced and understandable, and provides the information necessary for shareholders to assess the Group’s performance, business model and strategy;
• The financial statements which have been prepared in accordance with International Financial Reporting Standards as adopted by the EU and as issued by the International Accounting Standards Board (in the case of the consolidated financial statements) and UK accounting standards (in the case of the PLC parent company accounts) and UK accounting standards and Part 9 of Book 2 of the Dutch Civil Code (in the case of the NV parent company accounts), give a true and fair view of the assets, liabilities, financial position and profit or loss of the Group and the undertakings included in the consolidation taken as a whole; and
• The Strategic Report includes a fair review of the development and performance of the business and the position of the Group and the undertakings included in the consolidation taken as a whole, together with a description of the principal risks and uncertainties that they face.
The Directors and their roles are listed on pages 41 and 54.
GOING CONCERNThe activities of the Group, together with the factors likely to affect its future development, performance, the financial position of the Group, its cash flows, liquidity position and borrowing facilities are described in the Strategic Report on pages 2 to 35. In addition, we describe in notes 15 to 18 on pages 109 to 123 the Group’s objectives, policies and processes for managing its capital; its financial risk management objectives; details of its financial instruments and hedging activities and its exposures to credit and liquidity risk.
The Group has considerable financial resources together with established business relationships with many customers and suppliers in countries throughout the world. As a consequence, the Directors believe that the Group is well placed to manage its business risks successfully despite the current uncertain outlook.
After making enquiries, the Directors have a reasonable expectation that the Group has adequate resources to continue in operational existence for the foreseeable future. Accordingly, they continue to adopt the going concern basis in preparing this Annual Report and Accounts.
INTERNAL AND DISCLOSURE CONTROLS AND PROCEDURESPlease refer to pages 49 to 53 for a discussion of Unilever’s principal risk factors and to pages 50 to 53 for commentary on the Group’s approach to risk management and control.
ANNUAL ACCOUNTSThe Directors are required by Part 9 of Book 2 of the Civil Code in the Netherlands and the UK Companies Act 2006 to prepare accounts for each financial year which give a true and fair view of the state of affairs of the Unilever Group, and the NV and PLC entities, as at the end of the financial year and of the profit or loss and cash flows for that year.
The Directors consider that, in preparing the accounts, the Group and the NV and PLC entities have used the most appropriate accounting policies, consistently applied and supported by reasonable and prudent judgements and estimates, and that all International Financial Reporting Standards as adopted by the EU and as issued by the International Accounting Standards Board (in the case of the consolidated financial statements), UK accounting standards (in the case of the PLC parent company accounts) and Dutch law (in the case of the NV parent company accounts) which they consider to be applicable have been followed.
The Directors have responsibility for ensuring that NV and PLC keep accounting records which disclose with reasonable accuracy their financial position and which enable the Directors to ensure that the accounts comply with the relevant legislation. They also have a general responsibility for taking such steps as are reasonably open to them to safeguard the assets of the Group, and to prevent and detect fraud and other irregularities.
This statement, which should be read in conjunction with the Independent Auditors’ reports, is made with a view to distinguishing for shareholders the respective responsibilities of the Directors and of the auditors in relation to the accounts.
A copy of the financial statements of the Unilever Group is placed on our website at www.unilever.com/investorrelations. The maintenance and integrity of the website are the responsibility of the Directors, and the work carried out by the auditors does not involve consideration of these matters. Accordingly, the auditors accept no responsibility for any changes that may have occurred to the financial statements since they were initially placed on the website. Legislation in the UK and the Netherlands governing the preparation and dissemination of financial statements may differ from legislation in other jurisdictions.
UK law sets out additional responsibilities for the Directors of PLC regarding disclosure of information to auditors. Disclosure in respect of these responsibilities is made on page 48.
78 Unilever Annual Report and Accounts 2014Financial statements
STATEMENT OF DIRECTORS’ RESPONSIBILITIES
NETHERLANDS – KPMG ACCOUNTANTS N.V.TO: THE GENERAL MEETING OF UNILEVER N.V.
UNITED KINGDOM – KPMG LLPTO: THE MEMBERS OF UNILEVER PLC ONLY
For the purpose of these reports, the terms ‘we’ and ‘our’ denote KPMG Accountants N.V. in relation to the Netherlands responsibilities and reporting obligations to the General Meeting of Unilever N.V. and KPMG LLP in relation to UK responsibilities and reporting obligations to the members of Unilever PLC. The Unilever Group (‘the Group’) consists of Unilever PLC, Unilever N.V. and the entities they controlled during the financial year. The reports of KPMG Accountants N.V. and KPMG LLP are presented in the left and right hand columns of this report respectively. Where separate columns are not presented, the content of the reports of KPMG Accountants N.V. and KPMG LLP are identical.
The financial statements (‘the Financial Statements’) comprise:• the consolidated financial statements of the Group (‘the Consolidated Financial Statements’);• the parent company financial statements of Unilever N.V. (‘the N.V. Company Accounts’); and• the parent company financial statements of Unilever PLC (‘the PLC Company Accounts’),
each of which are defined below.
OPINIONS AND CONCLUSIONS ARISING FROM OUR AUDIT1 OUR OPINIONS ON THE FINANCIAL STATEMENTS ARE UNMODIFIED
We have audited the consolidated financial statements of the Group for the year ended 31 December 2014 which comprise the consolidated balance sheet as at 31 December 2014, the consolidated statements of income, comprehensive income, changes in equity and cash flows for the year then ended and notes to the Consolidated Financial Statements, including a summary of the significant accounting policies and other explanatory information. In addition, KPMG Accountants N.V. has audited the N.V. Company Accounts (which comprise the company balance sheet as at 31 December 2014, the company profit and loss account for 2014 and the notes comprising a summary of the significant accounting policies and other explanatory information) and KPMG LLP has audited the PLC Company Accounts (which comprise the company balance sheet as at 31 December 2014 and the notes to the PLC Company Accounts, including the summary of the significant accounting policies and other explanatory information).
In our opinion:• the Consolidated Financial Statements give a true and fair
view of the financial position of the Group as at 31 December 2014 and of its result and its cash flows for the year then ended in accordance with International Financial Reporting Standards as adopted by the European Union (IFRS as adopted by the EU) and with Part 9 of Book 2 of the Netherlands Civil Code; and
• the N.V. Company Accounts give a true and fair view of the financial position of Unilever N.V. as at 31 December 2014, and of its result for 2014 in accordance with United Kingdom accounting standards and Part 9 of Book 2 of the Netherlands Civil Code.
Basis for our opinion We conducted our audit in accordance with Dutch law, including the Dutch Standards on Auditing. Our responsibilities under those standards are further described in the ‘Auditor’s responsibilities’ section of our report.
We believe that the audit evidence we have obtained is sufficient and appropriate to provide a basis for our opinion.
In our opinion: • the Consolidated Financial Statements and the PLC
Company Accounts give a true and fair view of the state of the Group’s and of Unilever PLC’s affairs as at 31 December 2014 and of the Group’s profit for the year then ended;
• the Consolidated Financial Statements have been properly prepared in accordance with International Financial Reporting Standards as adopted by the European Union (IFRS as adopted by the EU);
• the PLC Company Accounts have been properly prepared in accordance with United Kingdom Accounting Standards; and
• both the Consolidated Financial Statements and the PLC Company Accounts have been prepared in accordance with the requirements of the Companies Act 2006 and, as regards the Consolidated Financial Statements, Article 4 of the IAS Regulation.
Separate opinion in relation to IFRS as issued by the International Accounting Standards Board (IASB)As explained in the accounting policies set out in the Consolidated Financial Statements, the Group, in addition to complying with its legal obligation to apply IFRS as adopted by the EU, has also applied IFRS as issued by the IASB. In our opinion, the Consolidated Financial Statements comply with IFRS as issued by the IASB.
79Unilever Annual Report and Accounts 2014 Financial statements
INDEPENDENT AUDITORS’ REPORTS
2 OUR ASSESSMENT OF RISKS OF MATERIAL MISSTATEMENT
In arriving at our audit opinion above on the Financial Statements the risks of material misstatement that had the greatest effect on our audit (key audit matters) were as set out below.
These are the matters that, in our professional judgment, had the greatest effect on: the overall audit strategy; the allocation of resources in our audit; and directing the efforts of the engagement team. We have communicated these matters to the Audit Committee. Our audit procedures relating to these matters were designed in the context and solely for the purposes of our audit of the Financial Statements as a whole, and in forming our opinion thereon, and we do not express discrete opinions on these matters.
Revenue recognition • The risk – Revenue is measured taking account of discounts, incentives and rebates earned by customers on the Group’s sales.
Due to the multitude and variety of contractual terms across the Group’s markets, the estimation of discounts, incentives and rebates recognised based on sales made during the year is considered to be complex.
Revenue is recognised when the risks and rewards of the underlying products have been transferred to the customer. There is a risk that revenue may be overstated because of fraud resulting from the pressure local management may feel to achieve performance targets. The Group focuses on revenue as a key performance measure which could create an incentive for revenue to be recognised before the risks and rewards have been transferred.
• Our response – Our audit procedures included considering the appropriateness of the Group’s revenue recognition accounting policies including those relating to discounts, incentives and rebates and assessing compliance with the policies in terms of applicable accounting standards. We tested the effectiveness of the Group’s controls over calculation of discounts, incentives and rebates and correct timing of revenue recognition.
We assessed sales transactions taking place at either side of the balance sheet date as well as credit notes issued after the year end date to assess whether that revenue was recognised in the correct period. We also developed an expectation of the current year revenue balance based on trend analysis information taking into account historical weekly sales and returns information and our understanding of each market. We then compared this expectation to actual results.
We also considered the adequacy of the Group’s disclosures (in note 2) in respect of revenue.
Indirect tax provisions and contingencies• The risk – Provisions for indirect tax require the Directors to make judgments and estimates in relation to the issues and
exposures. In Brazil (one of the Group’s largest markets) the complex nature of the local tax regulations and jurisprudence make this a particular area of significant judgment.
• Our response – Our procedures included using our own indirect tax and legal specialists to consider the level of provisions required in light of the nature of the Group’s exposures, applicable regulations and the Group’s correspondence with the authorities. We also assessed relevant historical and recent judgments passed by the court authorities in considering any legal precedent or case law, as well as assessing legal opinions from third party lawyers. We also gained an understanding of the Group’s provisioning methodology and challenged assumptions using the knowledge and experience of our own specialists. In addition, we obtained formal confirmations from the Group’s external counsel, where appropriate.
We also considered the adequacy of the Group’s disclosures (in note 19) made in relation to indirect tax provisions and contingencies.
Direct tax provisions and contingencies• The risk – The Group has extensive international operations and in the normal course of business the Directors make
judgments and estimates in relation to tax issues and exposures. This is a key judgment due to the Group operating in a number of tax jurisdictions, the complexities of transfer pricing and other tax legislation.
• Our response – Our audit procedures included testing the effectiveness of the Group’s controls around the recording and continuous re-assessment of tax provisions.
Our own tax specialists performed an assessment of the Group’s correspondence with relevant tax authorities, to consider the completeness of tax provisions for all relevant risks. We also challenged the assumptions used, taking into consideration our own tax specialists’ knowledge and experience. In addition, we assessed relevant judgments passed by relevant authorities in considering any need for a provision, as well as assessing relevant opinions from third parties.
We also considered the adequacy of the Group’s disclosures (in note 20) in respect of tax and uncertain tax positions.
For each risk noted above refer to related disclosure within the Report of the Audit Committee (page 56), accounting policies and financial disclosures within the notes to the Consolidated Financial Statements.
80 Unilever Annual Report and Accounts 2014Financial statements
INDEPENDENT AUDITORS’ REPORTSCONTINUED
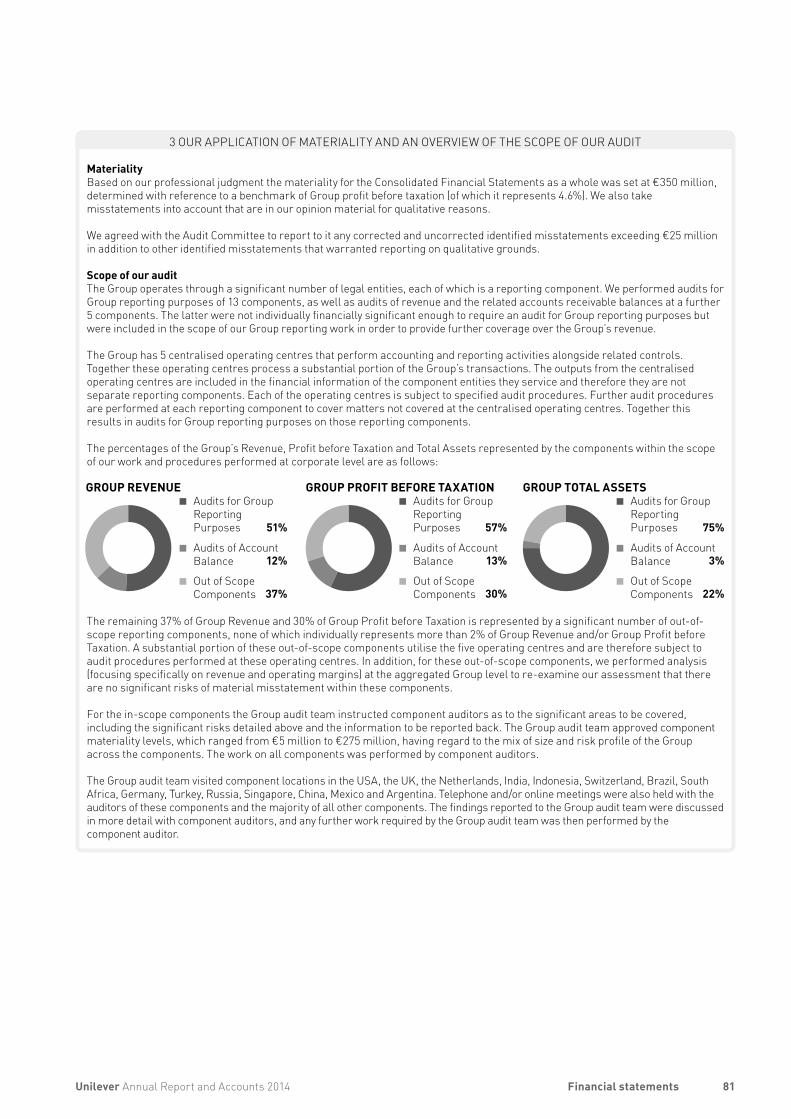
3 OUR APPLICATION OF MATERIALITY AND AN OVERVIEW OF THE SCOPE OF OUR AUDIT
MaterialityBased on our professional judgment the materiality for the Consolidated Financial Statements as a whole was set at €350 million, determined with reference to a benchmark of Group profit before taxation (of which it represents 4.6%). We also take misstatements into account that are in our opinion material for qualitative reasons.
We agreed with the Audit Committee to report to it any corrected and uncorrected identified misstatements exceeding €25 million in addition to other identified misstatements that warranted reporting on qualitative grounds.
Scope of our auditThe Group operates through a significant number of legal entities, each of which is a reporting component. We performed audits for Group reporting purposes of 13 components, as well as audits of revenue and the related accounts receivable balances at a further 5 components. The latter were not individually financially significant enough to require an audit for Group reporting purposes but were included in the scope of our Group reporting work in order to provide further coverage over the Group’s revenue.
The Group has 5 centralised operating centres that perform accounting and reporting activities alongside related controls. Together these operating centres process a substantial portion of the Group’s transactions. The outputs from the centralised operating centres are included in the financial information of the component entities they service and therefore they are not separate reporting components. Each of the operating centres is subject to specified audit procedures. Further audit procedures are performed at each reporting component to cover matters not covered at the centralised operating centres. Together this results in audits for Group reporting purposes on those reporting components.
The percentages of the Group’s Revenue, Profit before Taxation and Total Assets represented by the components within the scope of our work and procedures performed at corporate level are as follows:
The remaining 37% of Group Revenue and 30% of Group Profit before Taxation is represented by a significant number of out-of-scope reporting components, none of which individually represents more than 2% of Group Revenue and/or Group Profit before Taxation. A substantial portion of these out-of-scope components utilise the five operating centres and are therefore subject to audit procedures performed at these operating centres. In addition, for these out-of-scope components, we performed analysis (focusing specifically on revenue and operating margins) at the aggregated Group level to re-examine our assessment that there are no significant risks of material misstatement within these components.
For the in-scope components the Group audit team instructed component auditors as to the significant areas to be covered, including the significant risks detailed above and the information to be reported back. The Group audit team approved component materiality levels, which ranged from €5 million to €275 million, having regard to the mix of size and risk profile of the Group across the components. The work on all components was performed by component auditors.
The Group audit team visited component locations in the USA, the UK, the Netherlands, India, Indonesia, Switzerland, Brazil, South Africa, Germany, Turkey, Russia, Singapore, China, Mexico and Argentina. Telephone and/or online meetings were also held with the auditors of these components and the majority of all other components. The findings reported to the Group audit team were discussed in more detail with component auditors, and any further work required by the Group audit team was then performed by the component auditor.
GROUP REVENUEAudits for Group Reporting Purposes 51%
Audits of Account Balance 12%
Audits of Account Balance 13%
Out of Scope Components 37%
Audits for Group Reporting Purposes 75%
Audits of Account Balance 3%
Out of Scope Components 22%
Audits for Group Reporting Purposes 57%
Out of Scope Components 30%
GROUP TOTAL ASSETSGROUP PROFIT BEFORE TAXATION
81Unilever Annual Report and Accounts 2014 Financial statements
4 OTHER REPORTING
Our report on the Report of the Directors and the other information is unmodifiedPursuant to the legal requirement under Part 9 of Book 2 of the Netherlands Civil Code:• We have no deficiencies to report as a result of our
examination whether the Report of the Directors, to the extent we can assess, has been prepared in accordance with Part 9 of Book 2 of this Code, and whether the information as required under Part 9 of Book 2 has been annexed; and
• Further we report that the Report of the Directors, to the extent we can assess, is consistent with the Consolidated Financial Statements and the N.V. Company Accounts as required by Article 2:391 sub 4 of the Netherlands Civil Code.
EngagementWe have been engaged by the General Meeting at 14 May 2014 as auditor of Unilever N.V. since the audit of year 2014 and we are the statutory auditor since that date up until today.
IndependenceWe are independent of the Unilever Group in accordance with the “Verordening inzake de onafhankelijkheid van accountants bij assurance-opdrachten” (ViO) and other relevant independence regulations in the Netherlands. Furthermore we have complied with the “Verordening gedrags- en beroepsregels accountants” (VGBA).
Our opinion on other matters prescribed by the Companies Act 2006 is unmodifiedIn our opinion:• the part of the Directors’ Remuneration Report to be audited
has been properly prepared in accordance with the Companies Act 2006; and
• the information given in the Strategic Report and the Directors’ Report for the financial year for which the Financial Statements are prepared is consistent with the Consolidated Financial Statements and the PLC Company Accounts.
We have nothing to report in respect of the matters on which we are required to report by exceptionUnder ISAs (UK and Ireland) we are required to report to you if, based on the knowledge we acquired during our audit, we have identified other information in the annual report that contains a material inconsistency with either that knowledge or the Consolidated Financial Statements and/or the PLC Company Accounts, a material misstatement of fact, or that is otherwise misleading.
In particular, we are required to report to you if: • we have identified material inconsistencies between the
knowledge we acquired during our audit and the Directors’ statement that they consider that the Annual Report and Financial Statements taken as a whole is fair, balanced and understandable and provides the information necessary for shareholders to assess the Group’s performance, business model and strategy; or
• the Report of the Audit Committee does not appropriately address matters communicated by us to the Audit Committee.
Under the Companies Act 2006 we are required to report to you if, in our opinion: • adequate accounting records have not been kept by Unilever
PLC, or returns adequate for our audit have not been received from branches not visited by us; or
• the PLC Company Accounts and the part of the Directors’ Remuneration Report to be audited are not in agreement with the accounting records and returns; or
• certain disclosures of Directors’ remuneration specified by law are not made; or
• we have not received all the information and explanations we require for our audit.
Under the Listing Rules we are required to review: • the Directors’ statement, set out on page 78, in relation to
going concern; and• the part of the Corporate Governance Statement on pages 46
to 48 relating to the company’s compliance with the ten provisions of the 2012 UK Corporate Governance Code specified for our review.
We have nothing to report in respect of the above responsibilities.
82 Unilever Annual Report and Accounts 2014Financial statements
INDEPENDENT AUDITORS’ REPORTSCONTINUED
SCOPE AND RESPONSIBILITIES
Directors’ and Audit Committee’s responsibilitiesThe Directors are responsible for:• the preparation and fair presentation of the Consolidated
Financial Statements in accordance with IFRSs as adopted by the EU and Part 9 of Book 2 of the Netherlands Civil Code, and for the preparation of the Report of the Directors in accordance with Part 9 of Book 2 of the Netherlands Civil Code;
• the preparation and fair presentation of the N.V. Company Accounts in accordance with United Kingdom accounting standards and Part 9 of Book 2 of the Netherlands Civil Code; and
• such internal control as management determines is necessary to enable the preparation of the Financial Statements that are free from material misstatement, whether due to fraud or error.
In preparing the Financial Statements, the Directors are responsible for assessing the Group’s and Unilever N.V.’s ability to continue as a going concern. Based on the financial reporting frameworks mentioned, the Directors should prepare the Consolidated Financial Statements and N.V. Company Accounts using the going concern basis of accounting unless the Directors either intend to liquidate the Group and/or Unilever N.V. or to cease operations, or have no realistic alternative but to do so. The Directors should disclose in the Financial Statements events and circumstances that may cast significant doubt on the Group’s and/or Unilever N.V.’s ability to continue as a going concern.
The Audit Committee is responsible for overseeing the Group’s financial reporting process.
Auditor’s responsibilitiesOur responsibilities are set out on page 136, which are incorporated into this report as if set out in full and should be read to provide an understanding of the work we have undertaken.
Directors’ responsibilitiesAs explained more fully in the Directors’ Responsibilities Statement (set out on page 78), the Directors are responsible for the preparation of the Consolidated Financial Statements and the PLC Company Accounts and for being satisfied that they give a true and fair view.
Scope of an audit of financial statementsA description of the scope of an audit of financial statements is provided on the Financial Reporting Council’s website at www.frc.org.uk/auditscopeukprivate.
This report is made solely to the Company’s members as a body and is subject to important explanations and disclaimers regarding our responsibilities which can be accessed on our website via www.kpmg.com/uk/auditscopeukco2014b, and are incorporated into this report as if set out in full and should be read to provide an understanding of the purpose of this report, the work we have undertaken and the basis of our opinions.
SIGNING
Eric van Leeuwen(External auditor)KPMG Accountants N.V.Amsterdam 3 March 2015
Paul Korolkiewicz(Senior Statutory Auditor)for and on behalf of KPMG LLPChartered Accountants and Statutory AuditorLondon3 March 2015
83Unilever Annual Report and Accounts 2014 Financial statements
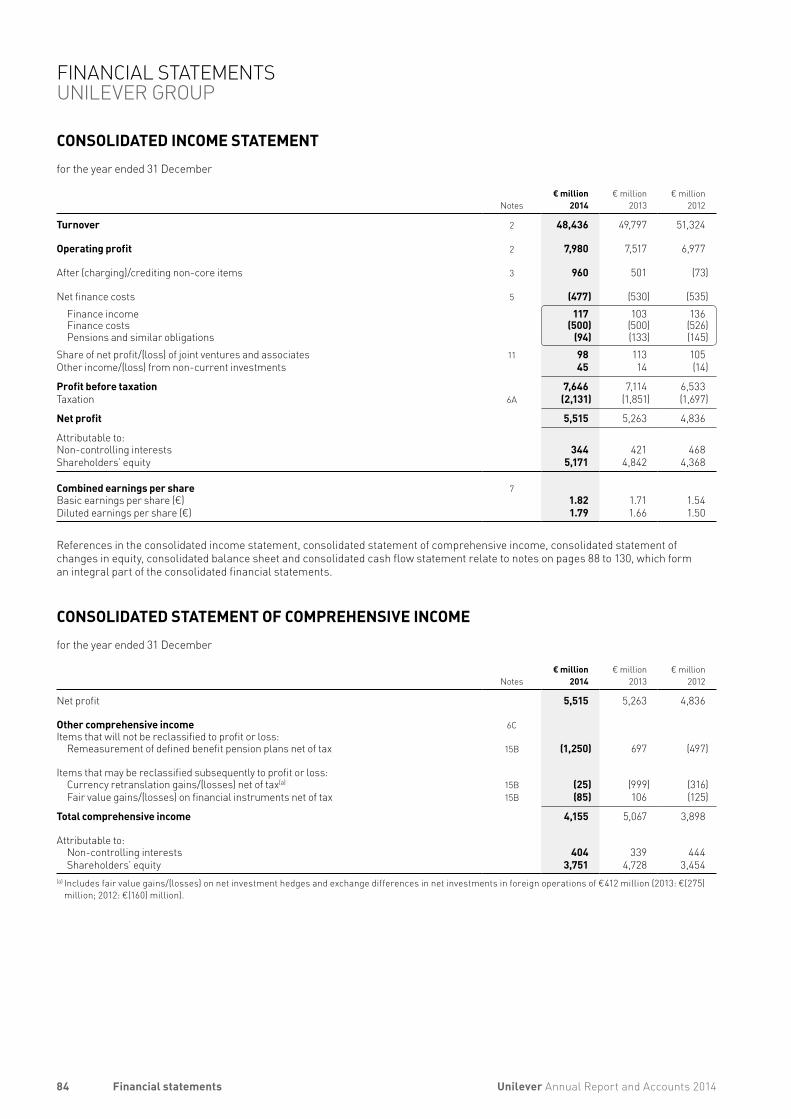
CONSOLIDATED INCOME STATEMENTfor the year ended 31 December
Notes€ million
2014€ million
2013€ million
2012
Turnover 2 48,436 49,797 51,324
Operating profit 2 7,980 7,517 6,977
After (charging)/crediting non-core items 3 960 501 (73)
Net finance costs 5 (477) (530) (535)Finance income 117 103 136Finance costs (500) (500) (526)Pensions and similar obligations (94) (133) (145)
Share of net profit/(loss) of joint ventures and associates 11 98 113 105Other income/(loss) from non-current investments 45 14 (14)
Profit before taxation 7,646 7,114 6,533Taxation 6A (2,131) (1,851) (1,697)
Net profit 5,515 5,263 4,836
Attributable to:Non-controlling interests 344 421 468Shareholders’ equity 5,171 4,842 4,368
Combined earnings per share 7Basic earnings per share (€) 1.82 1.71 1.54Diluted earnings per share (€) 1.79 1.66 1.50
References in the consolidated income statement, consolidated statement of comprehensive income, consolidated statement of changes in equity, consolidated balance sheet and consolidated cash flow statement relate to notes on pages 88 to 130, which form an integral part of the consolidated financial statements.
CONSOLIDATED STATEMENT OF COMPREHENSIVE INCOMEfor the year ended 31 December
Notes€ million
2014€ million
2013€ million
2012
Net profit 5,515 5,263 4,836
Other comprehensive income 6CItems that will not be reclassified to profit or loss:
Remeasurement of defined benefit pension plans net of tax 15B (1,250) 697 (497)
Items that may be reclassified subsequently to profit or loss:Currency retranslation gains/(losses) net of tax(a) 15B (25) (999) (316)Fair value gains/(losses) on financial instruments net of tax 15B (85) 106 (125)
Total comprehensive income 4,155 5,067 3,898
Attributable to:Non-controlling interests 404 339 444Shareholders’ equity 3,751 4,728 3,454
(a) Includes fair value gains/(losses) on net investment hedges and exchange differences in net investments in foreign operations of €412 million (2013: €(275) million; 2012: €(160) million).
84 Unilever Annual Report and Accounts 2014Financial statements
FINANCIAL STATEMENTS UNILEVER GROUP
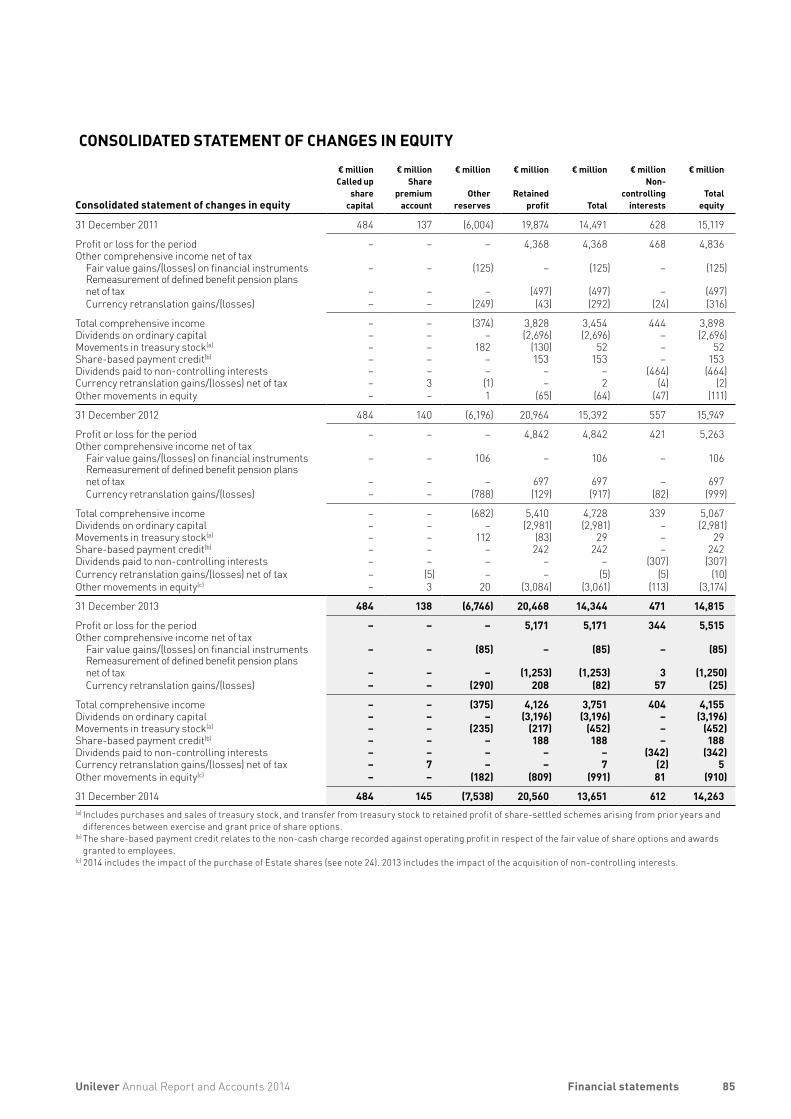
CONSOLIDATED STATEMENT OF CHANGES IN EQUITY
Consolidated statement of changes in equity
€ millionCalled up
sharecapital
€ millionShare
premiumaccount
€ million
Otherreserves
€ million
Retainedprofit
€ million
Total
€ millionNon-
controllinginterests
€ million
Totalequity
31 December 2011 484 137 (6,004) 19,874 14,491 628 15,119
Profit or loss for the period – – – 4,368 4,368 468 4,836Other comprehensive income net of tax
Fair value gains/(losses) on financial instruments – – (125) – (125) – (125)Remeasurement of defined benefit pension plans net of tax – – – (497) (497) – (497)Currency retranslation gains/(losses) – – (249) (43) (292) (24) (316)
Total comprehensive income – – (374) 3,828 3,454 444 3,898Dividends on ordinary capital – – – (2,696) (2,696) – (2,696)Movements in treasury stock(a) – – 182 (130) 52 – 52Share-based payment credit(b) – – – 153 153 – 153Dividends paid to non-controlling interests – – – – – (464) (464)Currency retranslation gains/(losses) net of tax – 3 (1) – 2 (4) (2)Other movements in equity – – 1 (65) (64) (47) (111)
31 December 2012 484 140 (6,196) 20,964 15,392 557 15,949
Profit or loss for the period – – – 4,842 4,842 421 5,263Other comprehensive income net of tax
Fair value gains/(losses) on financial instruments – – 106 – 106 – 106Remeasurement of defined benefit pension plans net of tax – – – 697 697 – 697Currency retranslation gains/(losses) – – (788) (129) (917) (82) (999)
Total comprehensive income – – (682) 5,410 4,728 339 5,067Dividends on ordinary capital – – – (2,981) (2,981) – (2,981)Movements in treasury stock(a) – – 112 (83) 29 – 29Share-based payment credit(b) – – – 242 242 – 242Dividends paid to non-controlling interests – – – – – (307) (307)Currency retranslation gains/(losses) net of tax – (5) – – (5) (5) (10)Other movements in equity(c) – 3 20 (3,084) (3,061) (113) (3,174)
31 December 2013 484 138 (6,746) 20,468 14,344 471 14,815
Profit or loss for the period – – – 5,171 5,171 344 5,515 Other comprehensive income net of tax
Fair value gains/(losses) on financial instruments – – (85) – (85) – (85)Remeasurement of defined benefit pension plans net of tax – – – (1,253) (1,253) 3 (1,250)Currency retranslation gains/(losses) – – (290) 208 (82) 57 (25)
Total comprehensive income – – (375) 4,126 3,751 404 4,155 Dividends on ordinary capital – – – (3,196) (3,196) – (3,196)Movements in treasury stock(a) – – (235) (217) (452) – (452)Share-based payment credit(b) – – – 188 188 – 188 Dividends paid to non-controlling interests – – – – – (342) (342)Currency retranslation gains/(losses) net of tax – 7 – – 7 (2) 5 Other movements in equity(c) – – (182) (809) (991) 81 (910)
31 December 2014 484 145 (7,538) 20,560 13,651 612 14,263 (a) Includes purchases and sales of treasury stock, and transfer from treasury stock to retained profit of share-settled schemes arising from prior years and
differences between exercise and grant price of share options.(b) The share-based payment credit relates to the non-cash charge recorded against operating profit in respect of the fair value of share options and awards
granted to employees.(c) 2014 includes the impact of the purchase of Estate shares (see note 24). 2013 includes the impact of the acquisition of non-controlling interests.
85Unilever Annual Report and Accounts 2014 Financial statements
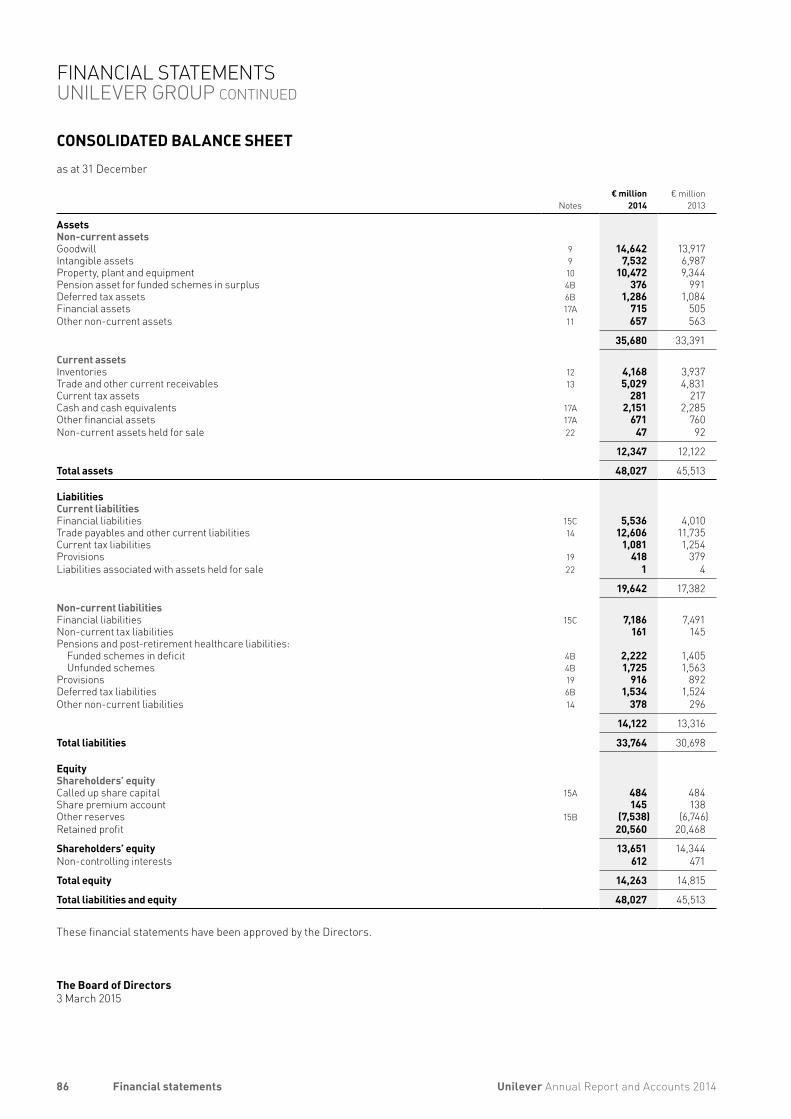
CONSOLIDATED BALANCE SHEETas at 31 December
Notes€ million
2014€ million
2013
AssetsNon-current assetsGoodwill 9 14,642 13,917Intangible assets 9 7,532 6,987Property, plant and equipment 10 10,472 9,344Pension asset for funded schemes in surplus 4B 376 991Deferred tax assets 6B 1,286 1,084Financial assets 17A 715 505Other non-current assets 11 657 563
35,680 33,391
Current assetsInventories 12 4,168 3,937Trade and other current receivables 13 5,029 4,831Current tax assets 281 217Cash and cash equivalents 17A 2,151 2,285Other financial assets 17A 671 760Non-current assets held for sale 22 47 92
12,347 12,122
Total assets 48,027 45,513
Liabilities Current liabilitiesFinancial liabilities 15C 5,536 4,010Trade payables and other current liabilities 14 12,606 11,735Current tax liabilities 1,081 1,254Provisions 19 418 379Liabilities associated with assets held for sale 22 1 4
19,642 17,382
Non-current liabilitiesFinancial liabilities 15C 7,186 7,491Non-current tax liabilities 161 145Pensions and post-retirement healthcare liabilities:
Funded schemes in deficit 4B 2,222 1,405Unfunded schemes 4B 1,725 1,563
Provisions 19 916 892Deferred tax liabilities 6B 1,534 1,524Other non-current liabilities 14 378 296
14,122 13,316
Total liabilities 33,764 30,698
EquityShareholders’ equityCalled up share capital 15A 484 484Share premium account 145 138Other reserves 15B (7,538) (6,746)Retained profit 20,560 20,468
Shareholders’ equity 13,651 14,344Non-controlling interests 612 471
Total equity 14,263 14,815
Total liabilities and equity 48,027 45,513
These financial statements have been approved by the Directors.
The Board of Directors3 March 2015
86 Unilever Annual Report and Accounts 2014Financial statements
FINANCIAL STATEMENTS UNILEVER GROUP CONTINUED
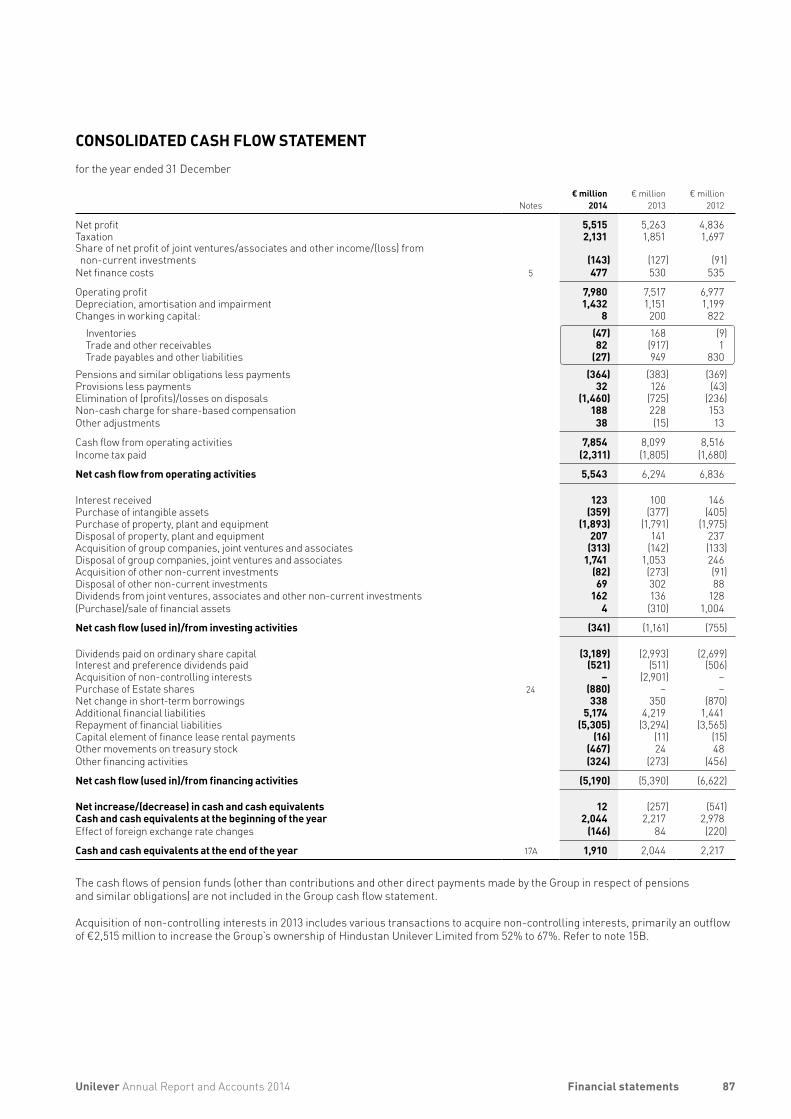
CONSOLIDATED CASH FLOW STATEMENTfor the year ended 31 December
Notes€ million
2014€ million
2013€ million
2012
Net profit 5,515 5,263 4,836Taxation 2,131 1,851 1,697Share of net profit of joint ventures/associates and other income/(loss) from non-current investments (143) (127) (91)
Net finance costs 5 477 530 535
Operating profit 7,980 7,517 6,977Depreciation, amortisation and impairment 1,432 1,151 1,199Changes in working capital: 8 200 822
Inventories (47) 168 (9)Trade and other receivables 82 (917) 1Trade payables and other liabilities (27) 949 830
Pensions and similar obligations less payments (364) (383) (369)Provisions less payments 32 126 (43)Elimination of (profits)/losses on disposals (1,460) (725) (236)Non-cash charge for share-based compensation 188 228 153Other adjustments 38 (15) 13
Cash flow from operating activities 7,854 8,099 8,516Income tax paid (2,311) (1,805) (1,680)
Net cash flow from operating activities 5,543 6,294 6,836
Interest received 123 100 146Purchase of intangible assets (359) (377) (405)Purchase of property, plant and equipment (1,893) (1,791) (1,975)Disposal of property, plant and equipment 207 141 237Acquisition of group companies, joint ventures and associates (313) (142) (133)Disposal of group companies, joint ventures and associates 1,741 1,053 246Acquisition of other non-current investments (82) (273) (91)Disposal of other non-current investments 69 302 88Dividends from joint ventures, associates and other non-current investments 162 136 128(Purchase)/sale of financial assets 4 (310) 1,004
Net cash flow (used in)/from investing activities (341) (1,161) (755)
Dividends paid on ordinary share capital (3,189) (2,993) (2,699)Interest and preference dividends paid (521) (511) (506)Acquisition of non-controlling interests – (2,901) –Purchase of Estate shares 24 (880) – –Net change in short-term borrowings 338 350 (870)Additional financial liabilities 5,174 4,219 1,441Repayment of financial liabilities (5,305) (3,294) (3,565)Capital element of finance lease rental payments (16) (11) (15)Other movements on treasury stock (467) 24 48Other financing activities (324) (273) (456)
Net cash flow (used in)/from financing activities (5,190) (5,390) (6,622)
Net increase/(decrease) in cash and cash equivalents 12 (257) (541)Cash and cash equivalents at the beginning of the year 2,044 2,217 2,978Effect of foreign exchange rate changes (146) 84 (220)
Cash and cash equivalents at the end of the year 17A 1,910 2,044 2,217
The cash flows of pension funds (other than contributions and other direct payments made by the Group in respect of pensions and similar obligations) are not included in the Group cash flow statement.
Acquisition of non-controlling interests in 2013 includes various transactions to acquire non-controlling interests, primarily an outflow of €2,515 million to increase the Group’s ownership of Hindustan Unilever Limited from 52% to 67%. Refer to note 15B.
87Unilever Annual Report and Accounts 2014 Financial statements
FOREIGN CURRENCIESThe consolidated financial statements are presented in euros. The functional currencies of NV and PLC are euros and sterling respectively. Items included in the financial statements of individual group companies are recorded in their respective functional currency which is the currency of the primary economic environment in which each entity operates.
Foreign currency transactions in individual group companies are translated into functional currency using exchange rates at the date of the transaction. Foreign exchange gains and losses from settlement of these transactions, and from translation of monetary assets and liabilities at year-end exchange rates, are recognised in the income statement except when deferred in equity as qualifying hedges.
In preparing the consolidated financial statements, the balances in individual group companies are translated from their functional currency into euros. The income statement, the cash flow statement and all other movements in assets and liabilities are translated at average rates of exchange as a proxy for the transaction rate, or at the transaction rate itself if more appropriate. Assets and liabilities are translated at year-end exchange rates.
The ordinary share capital of NV and PLC is translated in accordance with the Equalisation Agreement. The difference between the value for PLC and the value by applying the year-end rate of exchange is taken to other reserves (see note 15B on page 111).
The effect of exchange rate changes during the year on net assets of foreign operations is recorded in equity. For this purpose net assets include loans between group companies and any related foreign exchange contracts where settlement is neither planned nor likely to occur in the foreseeable future. The Group applies hedge accounting to certain exchange differences arising between the functional currencies of a foreign operation and NV or PLC as appropriate, regardless of whether the net investment is held directly or through an intermediate parent. Differences arising on retranslation of a financial liability designated as a foreign currency net investment hedge are recorded in equity to the extent that the hedge is effective. These differences are reported within profit or loss to the extent that the hedge is ineffective.
Cumulative exchange differences arising since the date of transition to IFRS of 1 January 2004 are reported as a separate component of other reserves. In the event of disposal or part disposal of an interest in a group company either through sale or as a result of a repayment of capital, the cumulative exchange difference is recognised in the income statement as part of the profit or loss on disposal of group companies.
CRITICAL ACCOUNTING ESTIMATES AND JUDGEMENTSThe preparation of financial statements requires management to make judgements, estimates and assumptions in the application of accounting policies that affect the reported amounts of assets, liabilities, income and expenses. Actual results may differ from these estimates. Estimates and judgements are continuously evaluated and are based on historical experience and other factors, including expectations of future events that are believed to be reasonable. Revisions to accounting estimates are recognised in the period in which the estimate is revised and in any future period affected.
1. ACCOUNTING INFORMATION AND POLICIESThe accounting policies adopted are the same as those which were applied for the previous financial year, except as set out below under the heading ‘Recent accounting developments’.
UNILEVERThe two parent companies, NV and PLC, together with their group companies, operate as a single economic entity (the Unilever Group, also referred to as Unilever or the Group). NV and PLC have the same Directors and are linked by a series of agreements, including an Equalisation Agreement, which are designed so that the positions of the shareholders of both companies are as closely as possible the same as if they held shares in a single company.
The Equalisation Agreement provides that both companies adopt the same accounting principles. It also requires that dividends and other rights and benefits attaching to each ordinary share of NV, be equal in value to those rights and benefits attaching to each ordinary share of PLC, as if each such unit of capital formed part of the ordinary share capital of one and the same company.
BASIS OF CONSOLIDATIONDue to the operational and contractual arrangements referred to above, NV and PLC form a single reporting entity for the purposes of presenting consolidated financial statements. Accordingly, the financial statements of Unilever are presented by both NV and PLC as their respective consolidated financial statements. Group companies included in the consolidation are those companies controlled by NV or PLC. Control exists when the Group has the power to direct the activities of an entity so as to affect the return on investment.
The net assets and results of acquired businesses are included in the consolidated financial statements from their respective dates of acquisition, being the date on which the Group obtains control. The results of disposed businesses are included in the consolidated financial statements up to their date of disposal, being the date control ceases.
Intra-group transactions and balances are eliminated.
The company income statement for NV is included in the consolidated financial statements. An abbreviated income statement has been disclosed in the NV company accounts on page 131 in accordance with Article 2:402 of the Dutch Civil Code.
COMPANIES LEGISLATION AND ACCOUNTING STANDARDSThe consolidated financial statements have been prepared in accordance with International Financial Reporting Standards (IFRS) as adopted by the European Union (EU), IFRIC Interpretations and in accordance with Part 9 of Book 2 of the Dutch Civil Code and the UK Companies Act 2006 applicable to companies reporting under IFRS. They are also in compliance with IFRS as issued by the International Accounting Standards Board (IASB).
These financial statements are prepared under the historical cost convention unless otherwise indicated.
ACCOUNTING POLICIESAccounting policies are included in the relevant notes to the consolidated financial statements. These are presented as text highlighted in grey on pages 90 to 128. The accounting policies below are applied throughout the financial statements.
88 Unilever Annual Report and Accounts 2014Financial statements
NOTES TO THE CONSOLIDATED FINANCIAL STATEMENTS UNILEVER GROUP
The Group is currently assessing the impact of the following new standards that are not yet effective and are yet to quantify the potential impact. • IFRS 9 ‘Financial Instruments’ reflects all phases of the
financial instruments project and replaces IAS 39 Financial Instruments: Recognition and Measurement. The standard introduces new requirements for classification and measurement, impairment and hedge accounting. IFRS 9 is effective for annual periods beginning on or after 1 January 2018. We expect the adoption of IFRS 9 to impact the classification and measurement of financial assets but have no impact on financial liabilities.
• IFRS 15 ‘Revenue from Contracts with Customers’ is applicable to all entities and supersedes all existing revenue recognition requirements under IFRS. It applies to all transactions to provide goods and services except those in the scope of other standards. Either full or modified retrospective application is required for annual periods beginning on or after 1 January 2017.
1. ACCOUNTING INFORMATION AND POLICIESCONTINUED
Information about critical judgements in applying accounting policies, as well as estimates and assumptions that have the most significant risk of causing a material adjustment to the carrying amounts of assets and liabilities within the next financial year, are included in the following notes:• separate presentation of items in the income statement – note 3;• measurement of defined benefit obligations – note 4B;• key assumptions used in discounted cash flow projections –
note 9;• utilisation of tax losses and recognition of other deferred tax
assets – note 6B;• likelihood of occurrence of provisions and contingencies,
including direct and indirect tax investigations and audits – notes 19 and 20; and
• measurement of consideration and assets and liabilities acquired as part of business combinations – note 21.
RECENT ACCOUNTING DEVELOPMENTS
ADOPTED BY THE GROUPThe following new and amended standards are relevant to the Group and have been adopted for the first time in these financial statements, with no material impact: • Amendments to IAS 32 ‘Financial Instruments: Presentation’
provides additional guidance on when financial assets and liabilities can be offset.
• Amendments to IAS 39 ‘Financial Instruments: Recognition and Measurement’ provides relief from discontinuing hedge accounting when a hedge derivative is novated.
• Amendment to IFRS 13 ‘Fair value measurement’ clarifies that short term receivables and payables with no stated interest rates can be measured at invoice amounts when the effect of discounting is immaterial.
• IFRIC Interpretation 21 ‘Levies’ clarifies that an entity recognises a liability for a levy when the activity that triggers payment, as identified by relevant legislation, occurs.
NOT ADOPTED BY THE GROUPAll of the following new standards, amendments and interpretations are effective from 1 January 2015 unless otherwise stated. Standards have not yet been endorsed by the EU unless otherwise stated.
The Group does not currently believe adoption of the following new standards would have a material impact on the consolidated results or financial position of the Group.• IFRS 14 ‘Regulatory Deferral Accounts’ permits first time
adopters of IFRS to continue to account for amounts related to rate regulation in accordance with their previous GAAP. The standard does not apply to the Group.
• Amendments to IAS 19 ‘Employee Benefits’ simplifies the accounting for contributions that are independent of the number of years of employee service. These amendments have been endorsed by the EU.
• Amendments to IAS 16 ‘Property, Plant and Equipment’ and IAS 38 ‘Intangible Assets’ cover clarification of the principle of the basis of depreciation and that revenue based depreciation methods are no longer permitted. Effective from 1 January 2016.
89Unilever Annual Report and Accounts 2014 Financial statements
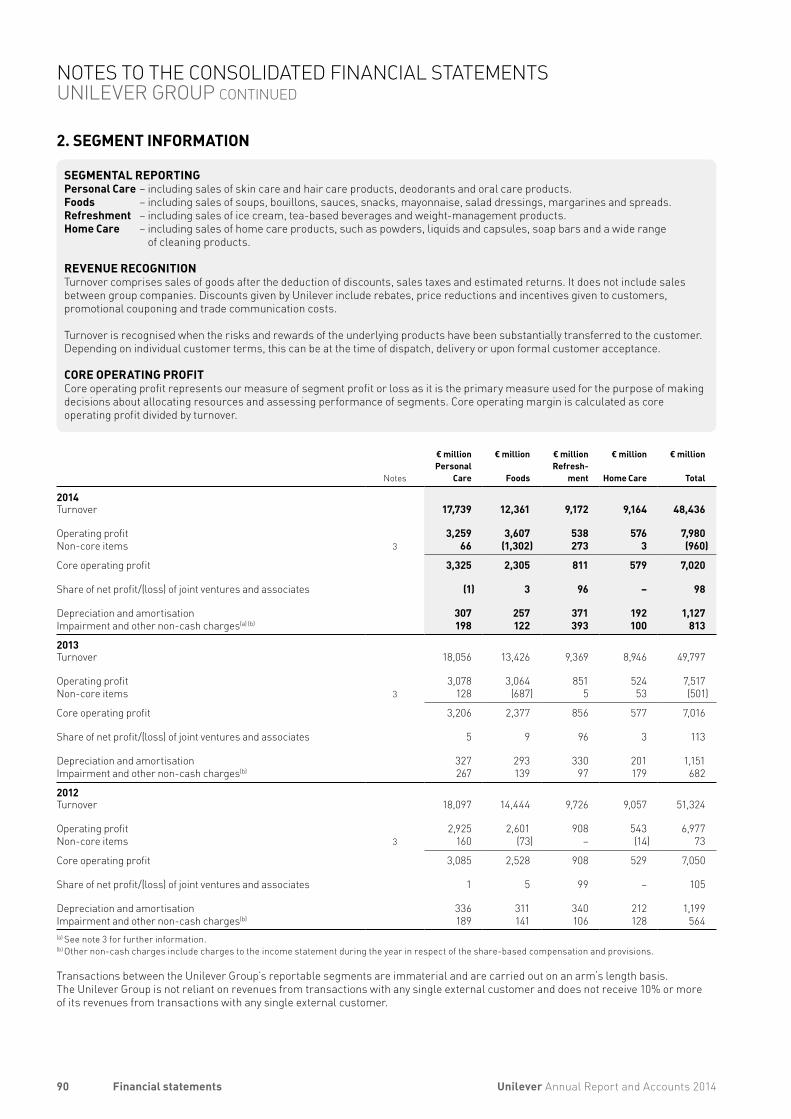
2. SEGMENT INFORMATION
SEGMENTAL REPORTINGPersonal Care – including sales of skin care and hair care products, deodorants and oral care products.Foods – including sales of soups, bouillons, sauces, snacks, mayonnaise, salad dressings, margarines and spreads.Refreshment – including sales of ice cream, tea-based beverages and weight-management products.Home Care – including sales of home care products, such as powders, liquids and capsules, soap bars and a wide range
of cleaning products.
REVENUE RECOGNITION Turnover comprises sales of goods after the deduction of discounts, sales taxes and estimated returns. It does not include sales between group companies. Discounts given by Unilever include rebates, price reductions and incentives given to customers, promotional couponing and trade communication costs.
Turnover is recognised when the risks and rewards of the underlying products have been substantially transferred to the customer. Depending on individual customer terms, this can be at the time of dispatch, delivery or upon formal customer acceptance.
CORE OPERATING PROFIT Core operating profit represents our measure of segment profit or loss as it is the primary measure used for the purpose of making decisions about allocating resources and assessing performance of segments. Core operating margin is calculated as core operating profit divided by turnover.
Notes
€ millionPersonal
Care
€ million
Foods
€ millionRefresh
ment
€ million
Home Care
€ million
Total
2014Turnover 17,739 12,361 9,172 9,164 48,436
Operating profit 3,259 3,607 538 576 7,980 Non-core items 3 66 (1,302) 273 3 (960)
Core operating profit 3,325 2,305 811 579 7,020
Share of net profit/(loss) of joint ventures and associates (1) 3 96 – 98
Depreciation and amortisation 307 257 371 192 1,127 Impairment and other non-cash charges(a) (b) 198 122 393 100 813
2013Turnover 18,056 13,426 9,369 8,946 49,797
Operating profit 3,078 3,064 851 524 7,517Non-core items 3 128 (687) 5 53 (501)
Core operating profit 3,206 2,377 856 577 7,016
Share of net profit/(loss) of joint ventures and associates 5 9 96 3 113
Depreciation and amortisation 327 293 330 201 1,151Impairment and other non-cash charges(b) 267 139 97 179 682
2012 Turnover 18,097 14,444 9,726 9,057 51,324
Operating profit 2,925 2,601 908 543 6,977Non-core items 3 160 (73) – (14) 73
Core operating profit 3,085 2,528 908 529 7,050
Share of net profit/(loss) of joint ventures and associates 1 5 99 – 105
Depreciation and amortisation 336 311 340 212 1,199Impairment and other non-cash charges(b) 189 141 106 128 564(a) See note 3 for further information. (b) Other non-cash charges include charges to the income statement during the year in respect of the share-based compensation and provisions.
Transactions between the Unilever Group’s reportable segments are immaterial and are carried out on an arm‘s length basis.The Unilever Group is not reliant on revenues from transactions with any single external customer and does not receive 10% or more of its revenues from transactions with any single external customer.
90 Unilever Annual Report and Accounts 2014Financial statements
NOTES TO THE CONSOLIDATED FINANCIAL STATEMENTS UNILEVER GROUP CONTINUED
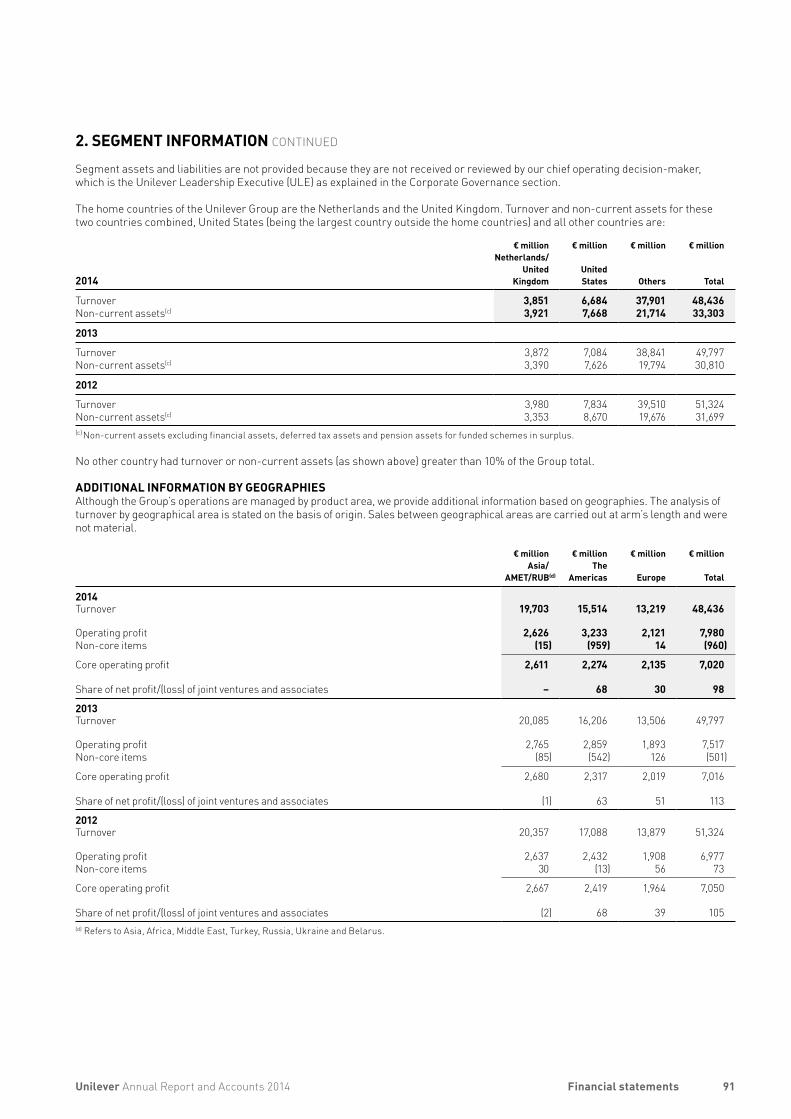
2. SEGMENT INFORMATION CONTINUED
Segment assets and liabilities are not provided because they are not received or reviewed by our chief operating decision-maker, which is the Unilever Leadership Executive (ULE) as explained in the Corporate Governance section.
The home countries of the Unilever Group are the Netherlands and the United Kingdom. Turnover and non-current assets for these two countries combined, United States (being the largest country outside the home countries) and all other countries are:
2014
€ millionNetherlands/
UnitedKingdom
€ million
UnitedStates
€ million
Others
€ million
Total
Turnover 3,851 6,684 37,901 48,436 Non-current assets(c) 3,921 7,668 21,714 33,303
2013
Turnover 3,872 7,084 38,841 49,797Non-current assets(c) 3,390 7,626 19,794 30,810
2012
Turnover 3,980 7,834 39,510 51,324Non-current assets(c) 3,353 8,670 19,676 31,699(c) Non-current assets excluding financial assets, deferred tax assets and pension assets for funded schemes in surplus.
No other country had turnover or non-current assets (as shown above) greater than 10% of the Group total.
ADDITIONAL INFORMATION BY GEOGRAPHIESAlthough the Group’s operations are managed by product area, we provide additional information based on geographies. The analysis of turnover by geographical area is stated on the basis of origin. Sales between geographical areas are carried out at arm’s length and were not material.
€ millionAsia/
AMET/RUB(d)
€ millionThe
Americas
€ million
Europe
€ million
Total
2014Turnover 19,703 15,514 13,219 48,436
Operating profit 2,626 3,233 2,121 7,980 Non-core items (15) (959) 14 (960)
Core operating profit 2,611 2,274 2,135 7,020
Share of net profit/(loss) of joint ventures and associates – 68 30 98
2013Turnover 20,085 16,206 13,506 49,797
Operating profit 2,765 2,859 1,893 7,517Non-core items (85) (542) 126 (501)
Core operating profit 2,680 2,317 2,019 7,016
Share of net profit/(loss) of joint ventures and associates (1) 63 51 113
2012Turnover 20,357 17,088 13,879 51,324
Operating profit 2,637 2,432 1,908 6,977Non-core items 30 (13) 56 73
Core operating profit 2,667 2,419 1,964 7,050
Share of net profit/(loss) of joint ventures and associates (2) 68 39 105(d) Refers to Asia, Africa, Middle East, Turkey, Russia, Ukraine and Belarus.
91Unilever Annual Report and Accounts 2014 Financial statements
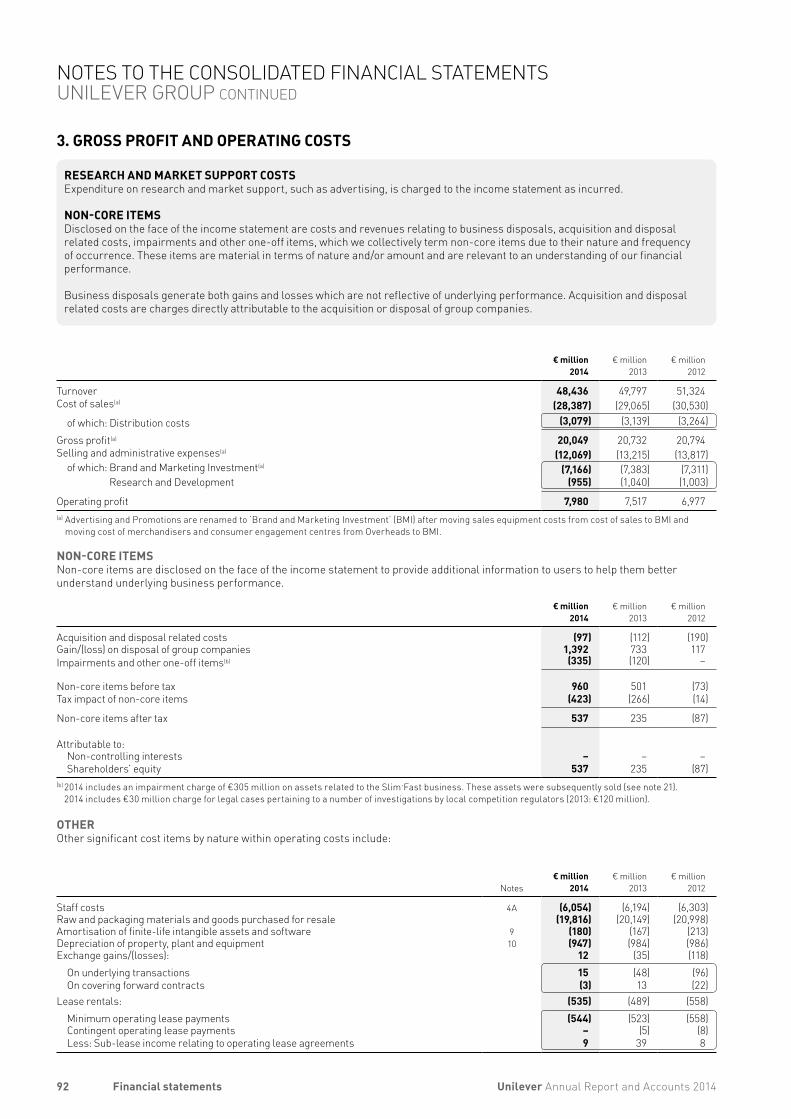
3. GROSS PROFIT AND OPERATING COSTS
RESEARCH AND MARKET SUPPORT COSTSExpenditure on research and market support, such as advertising, is charged to the income statement as incurred.
NON-CORE ITEMSDisclosed on the face of the income statement are costs and revenues relating to business disposals, acquisition and disposal related costs, impairments and other one-off items, which we collectively term non-core items due to their nature and frequency of occurrence. These items are material in terms of nature and/or amount and are relevant to an understanding of our financial performance.
Business disposals generate both gains and losses which are not reflective of underlying performance. Acquisition and disposal related costs are charges directly attributable to the acquisition or disposal of group companies.
€ million2014
€ million2013
€ million2012
Turnover 48,436 49,797 51,324Cost of sales(a) (28,387) (29,065) (30,530)
of which: Distribution costs (3,079) (3,139) (3,264)
Gross profit(a) 20,049 20,732 20,794Selling and administrative expenses(a) (12,069) (13,215) (13,817)
of which: Brand and Marketing Investment(a) (7,166) (7,383) (7,311) Research and Development (955) (1,040) (1,003)
Operating profit 7,980 7,517 6,977(a) Advertising and Promotions are renamed to ‘Brand and Marketing Investment’ (BMI) after moving sales equipment costs from cost of sales to BMI and
moving cost of merchandisers and consumer engagement centres from Overheads to BMI.
NON-CORE ITEMSNon-core items are disclosed on the face of the income statement to provide additional information to users to help them better understand underlying business performance.
€ million2014
€ million2013
€ million2012
Acquisition and disposal related costs (97) (112) (190)Gain/(loss) on disposal of group companies 1,392 733 117Impairments and other one-off items(b) (335) (120) –
Non-core items before tax 960 501 (73)Tax impact of non-core items (423) (266) (14)
Non-core items after tax 537 235 (87)
Attributable to:Non-controlling interests – – –Shareholders’ equity 537 235 (87)
(b) 2014 includes an impairment charge of €305 million on assets related to the Slim.Fast business. These assets were subsequently sold (see note 21). 2014 includes €30 million charge for legal cases pertaining to a number of investigations by local competition regulators (2013: €120 million).
OTHEROther significant cost items by nature within operating costs include:
Notes€ million
2014€ million
2013€ million
2012
Staff costs 4A (6,054) (6,194) (6,303)Raw and packaging materials and goods purchased for resale (19,816) (20,149) (20,998)Amortisation of finite-life intangible assets and software 9 (180) (167) (213)Depreciation of property, plant and equipment 10 (947) (984) (986)Exchange gains/(losses): 12 (35) (118)
On underlying transactions 15 (48) (96)On covering forward contracts (3) 13 (22)
Lease rentals: (535) (489) (558)Minimum operating lease payments (544) (523) (558)Contingent operating lease payments – (5) (8)Less: Sub-lease income relating to operating lease agreements 9 39 8
92 Unilever Annual Report and Accounts 2014Financial statements
NOTES TO THE CONSOLIDATED FINANCIAL STATEMENTS UNILEVER GROUP CONTINUED
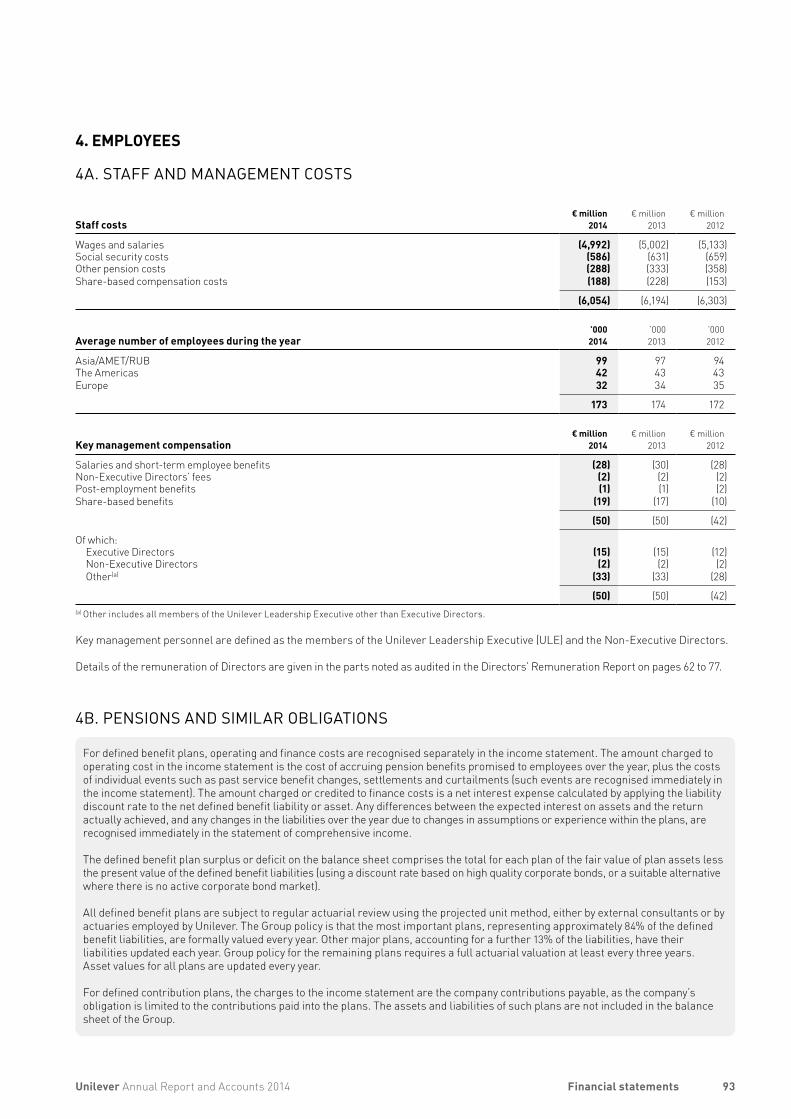
4. EMPLOYEES
4A. STAFF AND MANAGEMENT COSTS
Staff costs€ million
2014€ million
2013€ million
2012
Wages and salaries (4,992) (5,002) (5,133)Social security costs (586) (631) (659)Other pension costs (288) (333) (358)Share-based compensation costs (188) (228) (153)
(6,054) (6,194) (6,303)
Average number of employees during the year’0002014
’0002013
’0002012
Asia/AMET/RUB 99 97 94The Americas 42 43 43Europe 32 34 35
173 174 172
Key management compensation€ million
2014€ million
2013€ million
2012
Salaries and short-term employee benefits (28) (30) (28)Non-Executive Directors’ fees (2) (2) (2)Post-employment benefits (1) (1) (2)Share-based benefits (19) (17) (10)
(50) (50) (42)
Of which:Executive Directors (15) (15) (12)Non-Executive Directors (2) (2) (2)Other(a) (33) (33) (28)
(50) (50) (42)(a) Other includes all members of the Unilever Leadership Executive other than Executive Directors.
Key management personnel are defined as the members of the Unilever Leadership Executive (ULE) and the Non-Executive Directors.
Details of the remuneration of Directors are given in the parts noted as audited in the Directors’ Remuneration Report on pages 62 to 77.
4B. PENSIONS AND SIMILAR OBLIGATIONS
For defined benefit plans, operating and finance costs are recognised separately in the income statement. The amount charged to operating cost in the income statement is the cost of accruing pension benefits promised to employees over the year, plus the costs of individual events such as past service benefit changes, settlements and curtailments (such events are recognised immediately in the income statement). The amount charged or credited to finance costs is a net interest expense calculated by applying the liability discount rate to the net defined benefit liability or asset. Any differences between the expected interest on assets and the return actually achieved, and any changes in the liabilities over the year due to changes in assumptions or experience within the plans, are recognised immediately in the statement of comprehensive income.
The defined benefit plan surplus or deficit on the balance sheet comprises the total for each plan of the fair value of plan assets less the present value of the defined benefit liabilities (using a discount rate based on high quality corporate bonds, or a suitable alternative where there is no active corporate bond market).
All defined benefit plans are subject to regular actuarial review using the projected unit method, either by external consultants or by actuaries employed by Unilever. The Group policy is that the most important plans, representing approximately 84% of the defined benefit liabilities, are formally valued every year. Other major plans, accounting for a further 13% of the liabilities, have their liabilities updated each year. Group policy for the remaining plans requires a full actuarial valuation at least every three years. Asset values for all plans are updated every year.
For defined contribution plans, the charges to the income statement are the company contributions payable, as the company’s obligation is limited to the contributions paid into the plans. The assets and liabilities of such plans are not included in the balance sheet of the Group.
93Unilever Annual Report and Accounts 2014 Financial statements
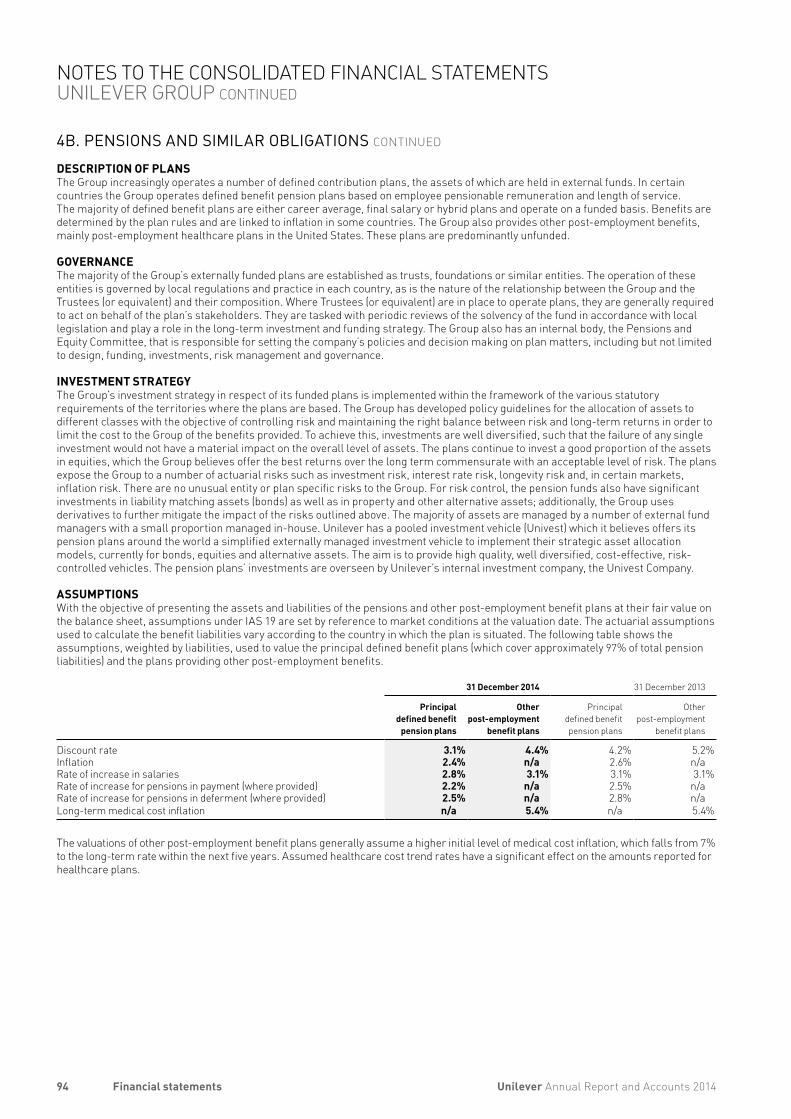
4B. PENSIONS AND SIMILAR OBLIGATIONS CONTINUED
DESCRIPTION OF PLANSThe Group increasingly operates a number of defined contribution plans, the assets of which are held in external funds. In certain countries the Group operates defined benefit pension plans based on employee pensionable remuneration and length of service. The majority of defined benefit plans are either career average, final salary or hybrid plans and operate on a funded basis. Benefits are determined by the plan rules and are linked to inflation in some countries. The Group also provides other post-employment benefits, mainly post-employment healthcare plans in the United States. These plans are predominantly unfunded.
GOVERNANCEThe majority of the Group’s externally funded plans are established as trusts, foundations or similar entities. The operation of these entities is governed by local regulations and practice in each country, as is the nature of the relationship between the Group and the Trustees (or equivalent) and their composition. Where Trustees (or equivalent) are in place to operate plans, they are generally required to act on behalf of the plan’s stakeholders. They are tasked with periodic reviews of the solvency of the fund in accordance with local legislation and play a role in the long-term investment and funding strategy. The Group also has an internal body, the Pensions and Equity Committee, that is responsible for setting the company’s policies and decision making on plan matters, including but not limited to design, funding, investments, risk management and governance.
INVESTMENT STRATEGYThe Group’s investment strategy in respect of its funded plans is implemented within the framework of the various statutory requirements of the territories where the plans are based. The Group has developed policy guidelines for the allocation of assets to different classes with the objective of controlling risk and maintaining the right balance between risk and long-term returns in order to limit the cost to the Group of the benefits provided. To achieve this, investments are well diversified, such that the failure of any single investment would not have a material impact on the overall level of assets. The plans continue to invest a good proportion of the assets in equities, which the Group believes offer the best returns over the long term commensurate with an acceptable level of risk. The plans expose the Group to a number of actuarial risks such as investment risk, interest rate risk, longevity risk and, in certain markets, inflation risk. There are no unusual entity or plan specific risks to the Group. For risk control, the pension funds also have significant investments in liability matching assets (bonds) as well as in property and other alternative assets; additionally, the Group uses derivatives to further mitigate the impact of the risks outlined above. The majority of assets are managed by a number of external fund managers with a small proportion managed in-house. Unilever has a pooled investment vehicle (Univest) which it believes offers its pension plans around the world a simplified externally managed investment vehicle to implement their strategic asset allocation models, currently for bonds, equities and alternative assets. The aim is to provide high quality, well diversified, cost-effective, risk-controlled vehicles. The pension plans’ investments are overseen by Unilever’s internal investment company, the Univest Company.
ASSUMPTIONSWith the objective of presenting the assets and liabilities of the pensions and other post-employment benefit plans at their fair value on the balance sheet, assumptions under IAS 19 are set by reference to market conditions at the valuation date. The actuarial assumptions used to calculate the benefit liabilities vary according to the country in which the plan is situated. The following table shows the assumptions, weighted by liabilities, used to value the principal defined benefit plans (which cover approximately 97% of total pension liabilities) and the plans providing other post-employment benefits.
31 December 2014 31 December 2013
Principal defined benefit
pension plans
Otherpostemployment
benefit plans
Principal defined benefit pension plans
Otherpost-employment
benefit plans
Discount rate 3.1% 4.4% 4.2% 5.2%Inflation 2.4% n/a 2.6% n/aRate of increase in salaries 2.8% 3.1% 3.1% 3.1%Rate of increase for pensions in payment (where provided) 2.2% n/a 2.5% n/aRate of increase for pensions in deferment (where provided) 2.5% n/a 2.8% n/aLong-term medical cost inflation n/a 5.4% n/a 5.4%
The valuations of other post-employment benefit plans generally assume a higher initial level of medical cost inflation, which falls from 7% to the long-term rate within the next five years. Assumed healthcare cost trend rates have a significant effect on the amounts reported for healthcare plans.
94 Unilever Annual Report and Accounts 2014Financial statements
NOTES TO THE CONSOLIDATED FINANCIAL STATEMENTS UNILEVER GROUP CONTINUED
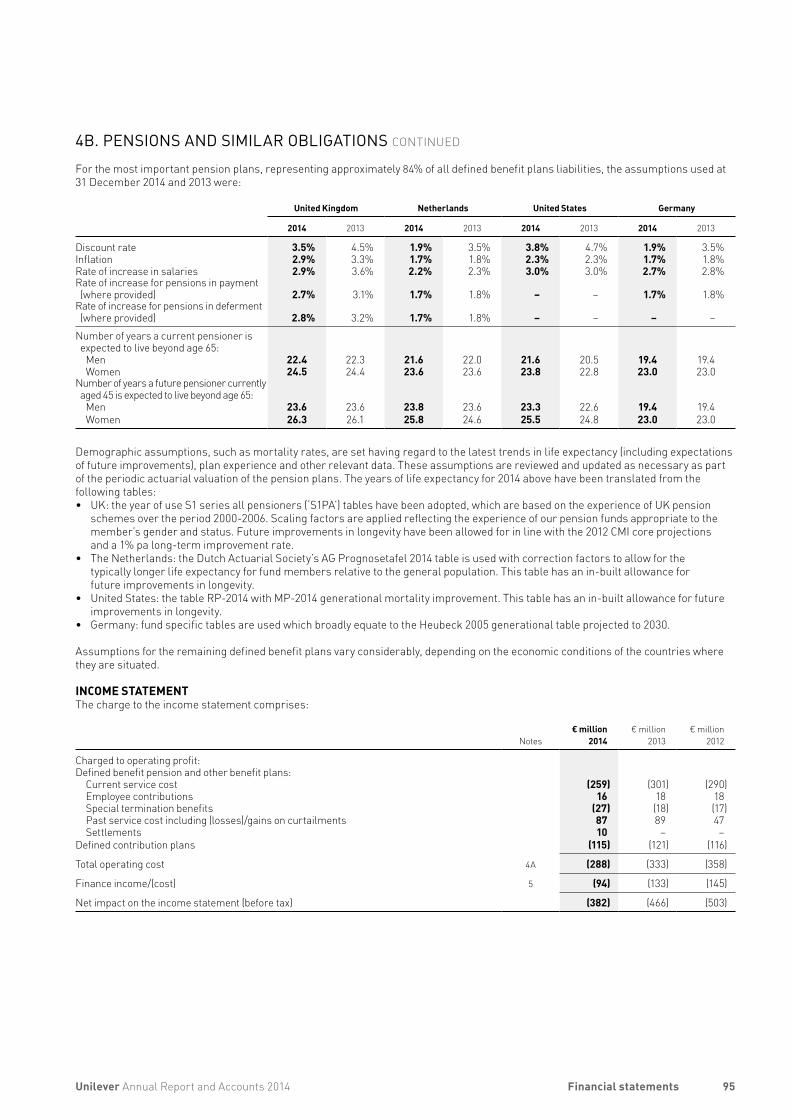
4B. PENSIONS AND SIMILAR OBLIGATIONS CONTINUED
For the most important pension plans, representing approximately 84% of all defined benefit plans liabilities, the assumptions used at 31 December 2014 and 2013 were:
United Kingdom Netherlands United States Germany
2014 2013 2014 2013 2014 2013 2014 2013
Discount rate 3.5% 4.5% 1.9% 3.5% 3.8% 4.7% 1.9% 3.5%Inflation 2.9% 3.3% 1.7% 1.8% 2.3% 2.3% 1.7% 1.8%Rate of increase in salaries 2.9% 3.6% 2.2% 2.3% 3.0% 3.0% 2.7% 2.8%Rate of increase for pensions in payment (where provided) 2.7% 3.1% 1.7% 1.8% – – 1.7% 1.8%
Rate of increase for pensions in deferment (where provided) 2.8% 3.2% 1.7% 1.8% – – – –
Number of years a current pensioner is expected to live beyond age 65:
Men 22.4 22.3 21.6 22.0 21.6 20.5 19.4 19.4Women 24.5 24.4 23.6 23.6 23.8 22.8 23.0 23.0
Number of years a future pensioner currently aged 45 is expected to live beyond age 65:
Men 23.6 23.6 23.8 23.6 23.3 22.6 19.4 19.4Women 26.3 26.1 25.8 24.6 25.5 24.8 23.0 23.0
Demographic assumptions, such as mortality rates, are set having regard to the latest trends in life expectancy (including expectations of future improvements), plan experience and other relevant data. These assumptions are reviewed and updated as necessary as part of the periodic actuarial valuation of the pension plans. The years of life expectancy for 2014 above have been translated from the following tables:• UK: the year of use S1 series all pensioners (‘S1PA’) tables have been adopted, which are based on the experience of UK pension
schemes over the period 2000-2006. Scaling factors are applied reflecting the experience of our pension funds appropriate to the member’s gender and status. Future improvements in longevity have been allowed for in line with the 2012 CMI core projections and a 1% pa long-term improvement rate.
• The Netherlands: the Dutch Actuarial Society’s AG Prognosetafel 2014 table is used with correction factors to allow for the typically longer life expectancy for fund members relative to the general population. This table has an in-built allowance for future improvements in longevity.
• United States: the table RP-2014 with MP-2014 generational mortality improvement. This table has an in-built allowance for future improvements in longevity.
• Germany: fund specific tables are used which broadly equate to the Heubeck 2005 generational table projected to 2030.
Assumptions for the remaining defined benefit plans vary considerably, depending on the economic conditions of the countries where they are situated.
INCOME STATEMENTThe charge to the income statement comprises:
Notes
€ million2014
€ million2013
€ million2012
Charged to operating profit:Defined benefit pension and other benefit plans:
Current service cost (259) (301) (290)Employee contributions 16 18 18Special termination benefits (27) (18) (17)Past service cost including (losses)/gains on curtailments 87 89 47Settlements 10 – –
Defined contribution plans (115) (121) (116)
Total operating cost 4A (288) (333) (358)
Finance income/(cost) 5 (94) (133) (145)
Net impact on the income statement (before tax) (382) (466) (503)
95Unilever Annual Report and Accounts 2014 Financial statements
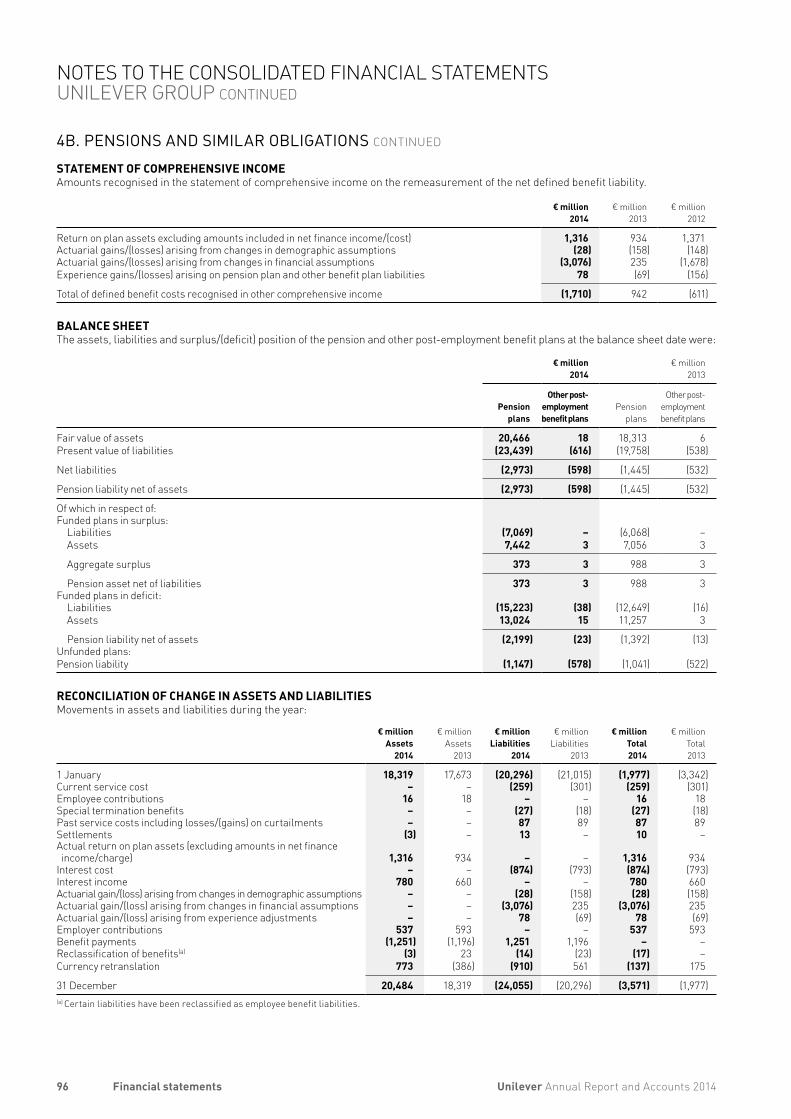
4B. PENSIONS AND SIMILAR OBLIGATIONS CONTINUED
STATEMENT OF COMPREHENSIVE INCOMEAmounts recognised in the statement of comprehensive income on the remeasurement of the net defined benefit liability.
€ million
2014€ million
2013€ million
2012
Return on plan assets excluding amounts included in net finance income/(cost) 1,316 934 1,371 Actuarial gains/(losses) arising from changes in demographic assumptions (28) (158) (148)Actuarial gains/(losses) arising from changes in financial assumptions (3,076) 235 (1,678)Experience gains/(losses) arising on pension plan and other benefit plan liabilities 78 (69) (156)
Total of defined benefit costs recognised in other comprehensive income (1,710) 942 (611)
BALANCE SHEETThe assets, liabilities and surplus/(deficit) position of the pension and other post-employment benefit plans at the balance sheet date were:
€ million 2014
€ million 2013
Pension
plans
Other postemploymentbenefit plans
Pension
plans
Other post-employmentbenefit plans
Fair value of assets 20,466 18 18,313 6Present value of liabilities (23,439) (616) (19,758) (538)
Net liabilities (2,973) (598) (1,445) (532)
Pension liability net of assets (2,973) (598) (1,445) (532)
Of which in respect of:Funded plans in surplus:
Liabilities (7,069) – (6,068) –Assets 7,442 3 7,056 3
Aggregate surplus 373 3 988 3
Pension asset net of liabilities 373 3 988 3Funded plans in deficit:
Liabilities (15,223) (38) (12,649) (16)Assets 13,024 15 11,257 3
Pension liability net of assets (2,199) (23) (1,392) (13)Unfunded plans:Pension liability (1,147) (578) (1,041) (522)
RECONCILIATION OF CHANGE IN ASSETS AND LIABILITIESMovements in assets and liabilities during the year:
€ millionAssets
2014
€ millionAssets
2013
€ millionLiabilities
2014
€ millionLiabilities
2013
€ millionTotal2014
€ millionTotal2013
1 January 18,319 17,673 (20,296) (21,015) (1,977) (3,342)Current service cost – – (259) (301) (259) (301)Employee contributions 16 18 – – 16 18Special termination benefits – – (27) (18) (27) (18)Past service costs including losses/(gains) on curtailments – – 87 89 87 89Settlements (3) – 13 – 10 –Actual return on plan assets (excluding amounts in net finance income/charge) 1,316 934 – – 1,316 934
Interest cost – – (874) (793) (874) (793)Interest income 780 660 – – 780 660Actuarial gain/(loss) arising from changes in demographic assumptions – – (28) (158) (28) (158)Actuarial gain/(loss) arising from changes in financial assumptions – – (3,076) 235 (3,076) 235Actuarial gain/(loss) arising from experience adjustments – – 78 (69) 78 (69)Employer contributions 537 593 – – 537 593Benefit payments (1,251) (1,196) 1,251 1,196 – –Reclassification of benefits(a) (3) 23 (14) (23) (17) –Currency retranslation 773 (386) (910) 561 (137) 175
31 December 20,484 18,319 (24,055) (20,296) (3,571) (1,977)(a) Certain liabilities have been reclassified as employee benefit liabilities.
96 Unilever Annual Report and Accounts 2014Financial statements
NOTES TO THE CONSOLIDATED FINANCIAL STATEMENTS UNILEVER GROUP CONTINUED
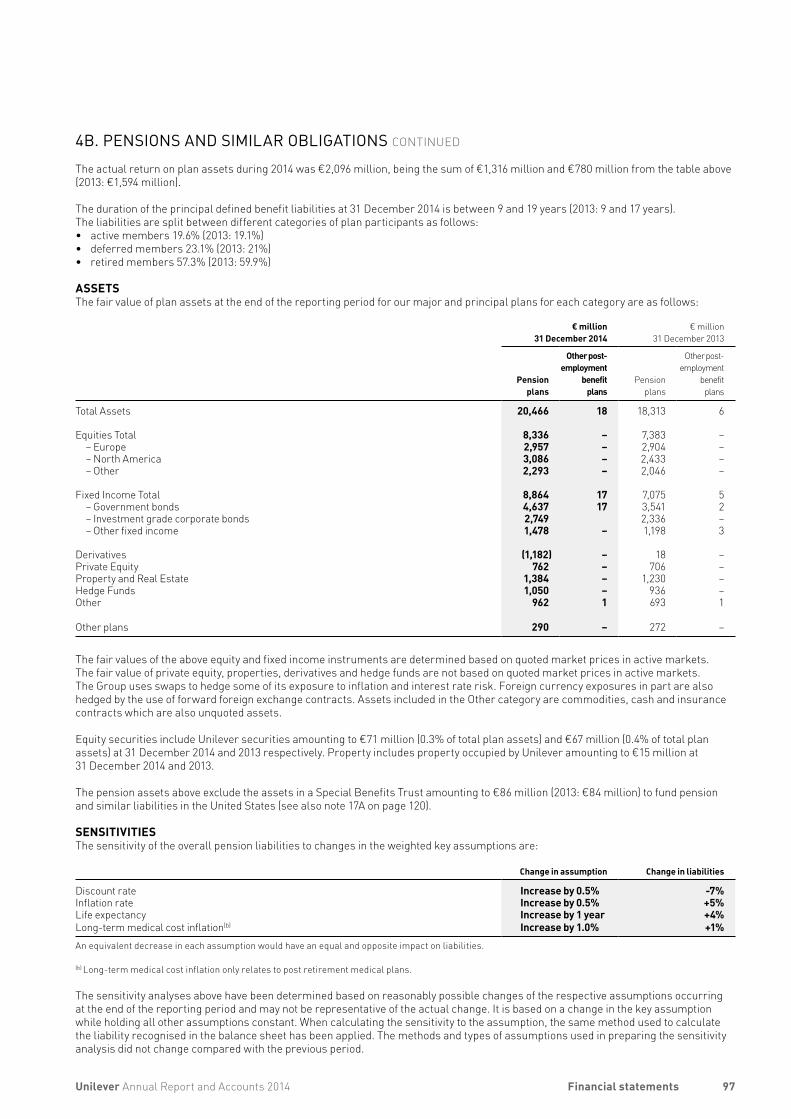
4B. PENSIONS AND SIMILAR OBLIGATIONS CONTINUED
The actual return on plan assets during 2014 was €2,096 million, being the sum of €1,316 million and €780 million from the table above (2013: €1,594 million).
The duration of the principal defined benefit liabilities at 31 December 2014 is between 9 and 19 years (2013: 9 and 17 years). The liabilities are split between different categories of plan participants as follows:• active members 19.6% (2013: 19.1%)• deferred members 23.1% (2013: 21%)• retired members 57.3% (2013: 59.9%)
ASSETSThe fair value of plan assets at the end of the reporting period for our major and principal plans for each category are as follows:
€ million 31 December 2014
€ million 31 December 2013
Pension
plans
Other postemployment
benefitplans
Pension
plans
Other post-employment
benefitplans
Total Assets 20,466 18 18,313 6
Equities Total 8,336 – 7,383 –– Europe 2,957 – 2,904 –– North America 3,086 – 2,433 –– Other 2,293 – 2,046 –
Fixed Income Total 8,864 17 7,075 5– Government bonds 4,637 17 3,541 2– Investment grade corporate bonds 2,749 2,336 –– Other fixed income 1,478 – 1,198 3
Derivatives (1,182) – 18 –Private Equity 762 – 706 –Property and Real Estate 1,384 – 1,230 –Hedge Funds 1,050 – 936 –Other 962 1 693 1
Other plans 290 – 272 –
The fair values of the above equity and fixed income instruments are determined based on quoted market prices in active markets. The fair value of private equity, properties, derivatives and hedge funds are not based on quoted market prices in active markets. The Group uses swaps to hedge some of its exposure to inflation and interest rate risk. Foreign currency exposures in part are also hedged by the use of forward foreign exchange contracts. Assets included in the Other category are commodities, cash and insurance contracts which are also unquoted assets.
Equity securities include Unilever securities amounting to €71 million (0.3% of total plan assets) and €67 million (0.4% of total plan assets) at 31 December 2014 and 2013 respectively. Property includes property occupied by Unilever amounting to €15 million at 31 December 2014 and 2013.
The pension assets above exclude the assets in a Special Benefits Trust amounting to €86 million (2013: €84 million) to fund pension and similar liabilities in the United States (see also note 17A on page 120).
SENSITIVITIES The sensitivity of the overall pension liabilities to changes in the weighted key assumptions are:
Change in assumption Change in liabilities
Discount rate Increase by 0.5% 7%Inflation rate Increase by 0.5% +5%Life expectancy Increase by 1 year +4%Long-term medical cost inflation(b) Increase by 1.0% +1%An equivalent decrease in each assumption would have an equal and opposite impact on liabilities.
(b) Long-term medical cost inflation only relates to post retirement medical plans.
The sensitivity analyses above have been determined based on reasonably possible changes of the respective assumptions occurring at the end of the reporting period and may not be representative of the actual change. It is based on a change in the key assumption while holding all other assumptions constant. When calculating the sensitivity to the assumption, the same method used to calculate the liability recognised in the balance sheet has been applied. The methods and types of assumptions used in preparing the sensitivity analysis did not change compared with the previous period.
97Unilever Annual Report and Accounts 2014 Financial statements
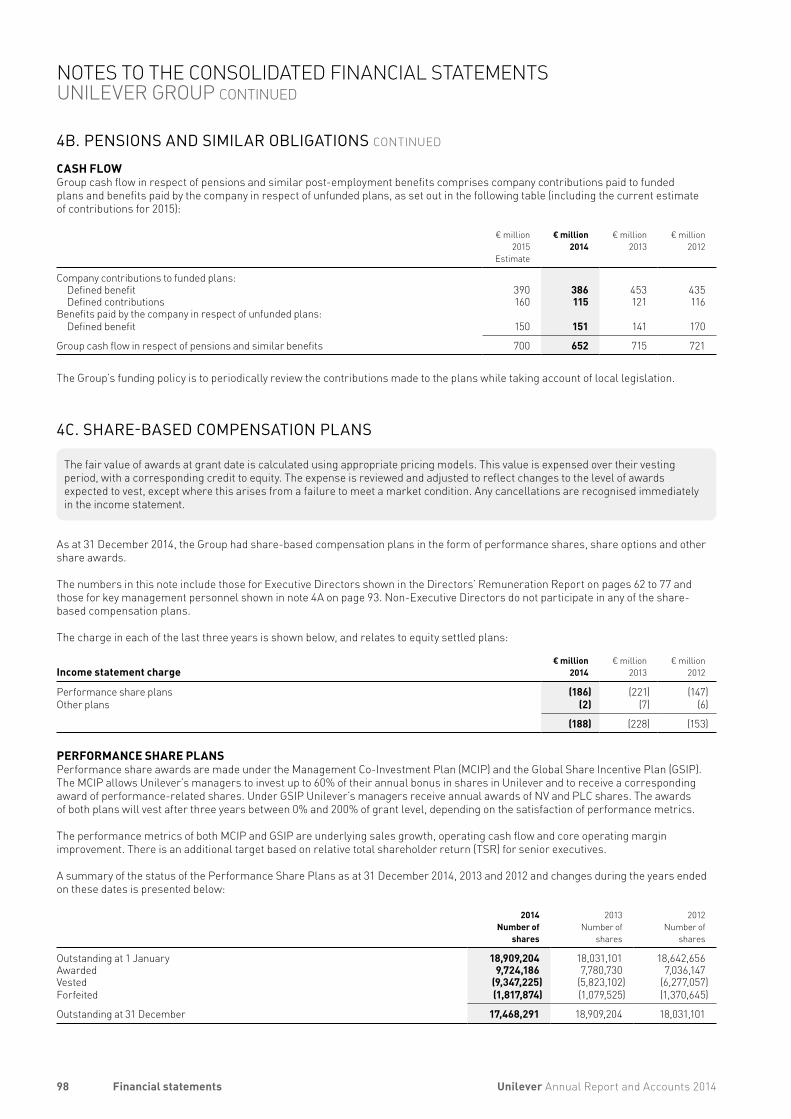
4B. PENSIONS AND SIMILAR OBLIGATIONS CONTINUED
CASH FLOWGroup cash flow in respect of pensions and similar post-employment benefits comprises company contributions paid to funded plans and benefits paid by the company in respect of unfunded plans, as set out in the following table (including the current estimate of contributions for 2015):
€ million2015
Estimate
€ million2014
€ million2013
€ million2012
Company contributions to funded plans:Defined benefit 390 386 453 435Defined contributions 160 115 121 116
Benefits paid by the company in respect of unfunded plans:Defined benefit 150 151 141 170
Group cash flow in respect of pensions and similar benefits 700 652 715 721
The Group’s funding policy is to periodically review the contributions made to the plans while taking account of local legislation.
4C. SHARE-BASED COMPENSATION PLANS
The fair value of awards at grant date is calculated using appropriate pricing models. This value is expensed over their vesting period, with a corresponding credit to equity. The expense is reviewed and adjusted to reflect changes to the level of awards expected to vest, except where this arises from a failure to meet a market condition. Any cancellations are recognised immediately in the income statement.
As at 31 December 2014, the Group had share-based compensation plans in the form of performance shares, share options and other share awards.
The numbers in this note include those for Executive Directors shown in the Directors’ Remuneration Report on pages 62 to 77 and those for key management personnel shown in note 4A on page 93. Non-Executive Directors do not participate in any of the share-based compensation plans.
The charge in each of the last three years is shown below, and relates to equity settled plans:
Income statement charge
€ million2014
€ million2013
€ million2012
Performance share plans (186) (221) (147)Other plans (2) (7) (6)
(188) (228) (153)
PERFORMANCE SHARE PLANSPerformance share awards are made under the Management Co-Investment Plan (MCIP) and the Global Share Incentive Plan (GSIP). The MCIP allows Unilever’s managers to invest up to 60% of their annual bonus in shares in Unilever and to receive a corresponding award of performance-related shares. Under GSIP Unilever’s managers receive annual awards of NV and PLC shares. The awards of both plans will vest after three years between 0% and 200% of grant level, depending on the satisfaction of performance metrics.
The performance metrics of both MCIP and GSIP are underlying sales growth, operating cash flow and core operating margin improvement. There is an additional target based on relative total shareholder return (TSR) for senior executives.
A summary of the status of the Performance Share Plans as at 31 December 2014, 2013 and 2012 and changes during the years ended on these dates is presented below:
2014Number of
shares
2013Number of
shares
2012Number of
shares
Outstanding at 1 January 18,909,204 18,031,101 18,642,656Awarded 9,724,186 7,780,730 7,036,147Vested (9,347,225) (5,823,102) (6,277,057)Forfeited (1,817,874) (1,079,525) (1,370,645)
Outstanding at 31 December 17,468,291 18,909,204 18,031,101
98 Unilever Annual Report and Accounts 2014Financial statements
NOTES TO THE CONSOLIDATED FINANCIAL STATEMENTS UNILEVER GROUP CONTINUED
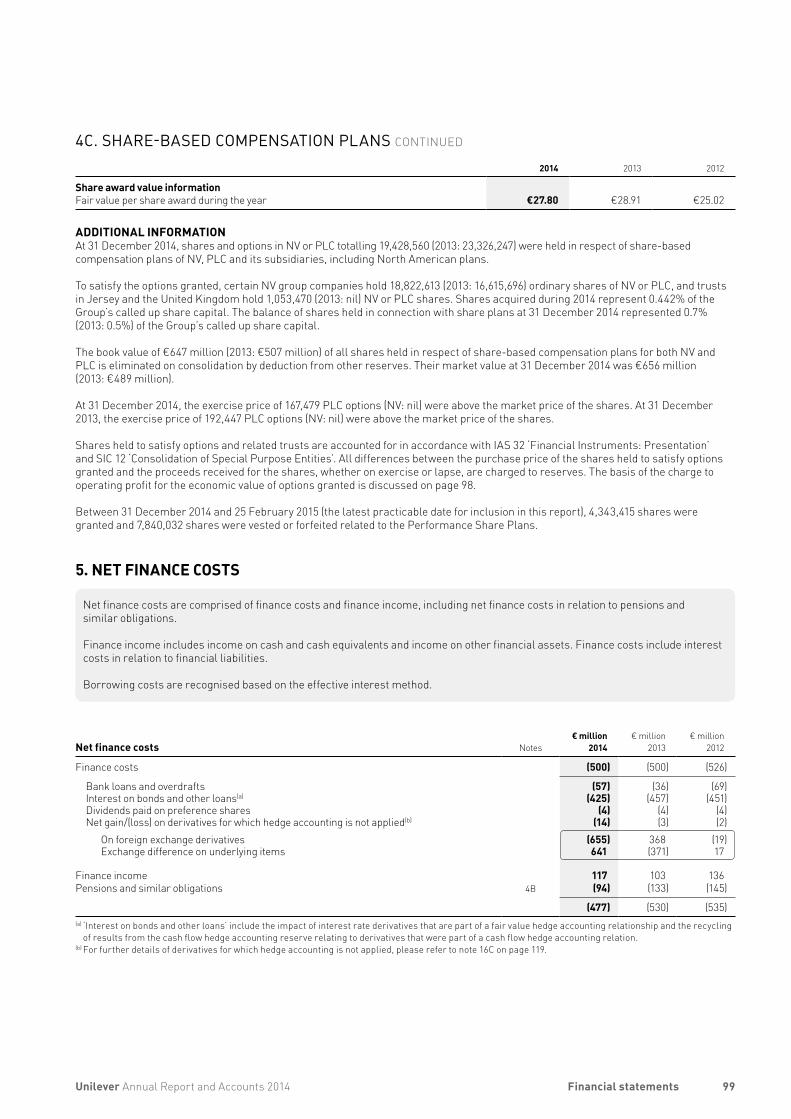
4C. SHARE-BASED COMPENSATION PLANS CONTINUED
2014 2013 2012
Share award value informationFair value per share award during the year €27.80 €28.91 €25.02
ADDITIONAL INFORMATIONAt 31 December 2014, shares and options in NV or PLC totalling 19,428,560 (2013: 23,326,247) were held in respect of share-based compensation plans of NV, PLC and its subsidiaries, including North American plans.
To satisfy the options granted, certain NV group companies hold 18,822,613 (2013: 16,615,696) ordinary shares of NV or PLC, and trusts in Jersey and the United Kingdom hold 1,053,470 (2013: nil) NV or PLC shares. Shares acquired during 2014 represent 0.442% of the Group’s called up share capital. The balance of shares held in connection with share plans at 31 December 2014 represented 0.7% (2013: 0.5%) of the Group’s called up share capital.
The book value of €647 million (2013: €507 million) of all shares held in respect of share-based compensation plans for both NV and PLC is eliminated on consolidation by deduction from other reserves. Their market value at 31 December 2014 was €656 million (2013: €489 million).
At 31 December 2014, the exercise price of 167,479 PLC options (NV: nil) were above the market price of the shares. At 31 December 2013, the exercise price of 192,447 PLC options (NV: nil) were above the market price of the shares.
Shares held to satisfy options and related trusts are accounted for in accordance with IAS 32 ‘Financial Instruments: Presentation’ and SIC 12 ‘Consolidation of Special Purpose Entities’. All differences between the purchase price of the shares held to satisfy options granted and the proceeds received for the shares, whether on exercise or lapse, are charged to reserves. The basis of the charge to operating profit for the economic value of options granted is discussed on page 98.
Between 31 December 2014 and 25 February 2015 (the latest practicable date for inclusion in this report), 4,343,415 shares were granted and 7,840,032 shares were vested or forfeited related to the Performance Share Plans.
5. NET FINANCE COSTS
Net finance costs are comprised of finance costs and finance income, including net finance costs in relation to pensions and similar obligations.
Finance income includes income on cash and cash equivalents and income on other financial assets. Finance costs include interest costs in relation to financial liabilities.
Borrowing costs are recognised based on the effective interest method.
Net finance costs Notes€ million
2014€ million
2013€ million
2012
Finance costs (500) (500) (526)
Bank loans and overdrafts (57) (36) (69)Interest on bonds and other loans(a) (425) (457) (451)Dividends paid on preference shares (4) (4) (4)Net gain/(loss) on derivatives for which hedge accounting is not applied(b) (14) (3) (2)
On foreign exchange derivatives (655) 368 (19)Exchange difference on underlying items 641 (371) 17
Finance income 117 103 136Pensions and similar obligations 4B (94) (133) (145)
(477) (530) (535)(a) ‘Interest on bonds and other loans’ include the impact of interest rate derivatives that are part of a fair value hedge accounting relationship and the recycling
of results from the cash flow hedge accounting reserve relating to derivatives that were part of a cash flow hedge accounting relation.(b) For further details of derivatives for which hedge accounting is not applied, please refer to note 16C on page 119.
99Unilever Annual Report and Accounts 2014 Financial statements
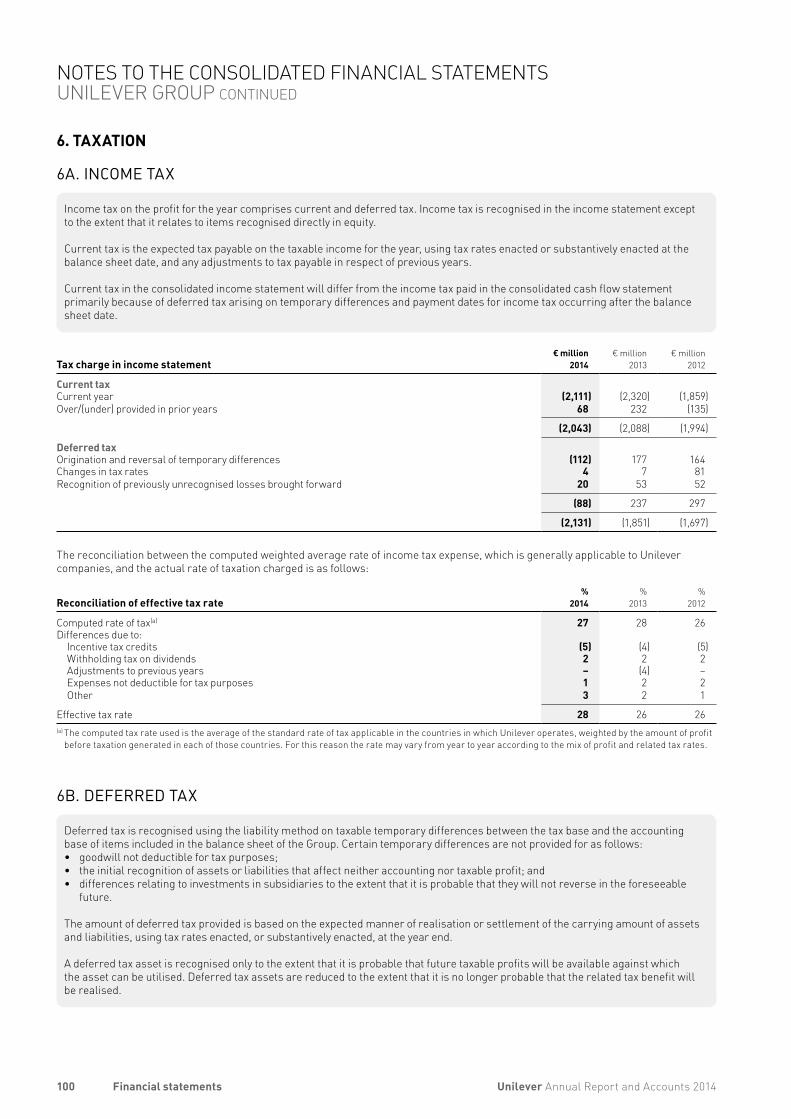
6. TAXATION
6A. INCOME TAX
Income tax on the profit for the year comprises current and deferred tax. Income tax is recognised in the income statement except to the extent that it relates to items recognised directly in equity.
Current tax is the expected tax payable on the taxable income for the year, using tax rates enacted or substantively enacted at the balance sheet date, and any adjustments to tax payable in respect of previous years.
Current tax in the consolidated income statement will differ from the income tax paid in the consolidated cash flow statement primarily because of deferred tax arising on temporary differences and payment dates for income tax occurring after the balance sheet date.
Tax charge in income statement€ million
2014€ million
2013€ million
2012
Current taxCurrent year (2,111) (2,320) (1,859)Over/(under) provided in prior years 68 232 (135)
(2,043) (2,088) (1,994)
Deferred taxOrigination and reversal of temporary differences (112) 177 164Changes in tax rates 4 7 81Recognition of previously unrecognised losses brought forward 20 53 52
(88) 237 297
(2,131) (1,851) (1,697)
The reconciliation between the computed weighted average rate of income tax expense, which is generally applicable to Unilever companies, and the actual rate of taxation charged is as follows:
Reconciliation of effective tax rate%
2014%
2013%
2012
Computed rate of tax(a) 27 28 26Differences due to:
Incentive tax credits (5) (4) (5)Withholding tax on dividends 2 2 2Adjustments to previous years – (4) –Expenses not deductible for tax purposes 1 2 2Other 3 2 1
Effective tax rate 28 26 26(a) The computed tax rate used is the average of the standard rate of tax applicable in the countries in which Unilever operates, weighted by the amount of profit
before taxation generated in each of those countries. For this reason the rate may vary from year to year according to the mix of profit and related tax rates.
6B. DEFERRED TAX
Deferred tax is recognised using the liability method on taxable temporary differences between the tax base and the accounting base of items included in the balance sheet of the Group. Certain temporary differences are not provided for as follows: • goodwill not deductible for tax purposes; • the initial recognition of assets or liabilities that affect neither accounting nor taxable profit; and • differences relating to investments in subsidiaries to the extent that it is probable that they will not reverse in the foreseeable
future.
The amount of deferred tax provided is based on the expected manner of realisation or settlement of the carrying amount of assets and liabilities, using tax rates enacted, or substantively enacted, at the year end.
A deferred tax asset is recognised only to the extent that it is probable that future taxable profits will be available against which the asset can be utilised. Deferred tax assets are reduced to the extent that it is no longer probable that the related tax benefit will be realised.
100 Unilever Annual Report and Accounts 2014Financial statements
NOTES TO THE CONSOLIDATED FINANCIAL STATEMENTS UNILEVER GROUP CONTINUED
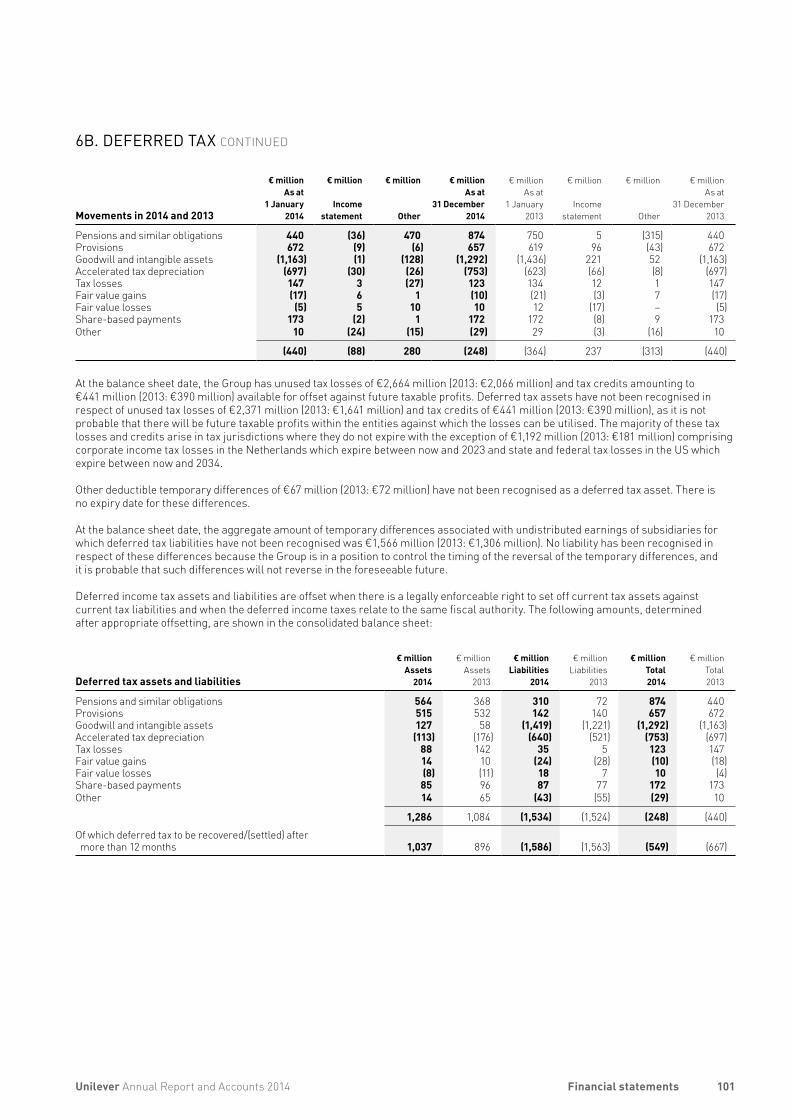
6B. DEFERRED TAX CONTINUED
Movements in 2014 and 2013
€ millionAs at
1 January2014
€ million
Incomestatement
€ million
Other
€ millionAs at
31 December2014
€ millionAs at
1 January2013
€ million
Incomestatement
€ million
Other
€ millionAs at
31 December2013
Pensions and similar obligations 440 (36) 470 874 750 5 (315) 440Provisions 672 (9) (6) 657 619 96 (43) 672Goodwill and intangible assets (1,163) (1) (128) (1,292) (1,436) 221 52 (1,163)Accelerated tax depreciation (697) (30) (26) (753) (623) (66) (8) (697)Tax losses 147 3 (27) 123 134 12 1 147Fair value gains (17) 6 1 (10) (21) (3) 7 (17)Fair value losses (5) 5 10 10 12 (17) – (5)Share-based payments 173 (2) 1 172 172 (8) 9 173Other 10 (24) (15) (29) 29 (3) (16) 10
(440) (88) 280 (248) (364) 237 (313) (440)
At the balance sheet date, the Group has unused tax losses of €2,664 million (2013: €2,066 million) and tax credits amounting to €441 million (2013: €390 million) available for offset against future taxable profits. Deferred tax assets have not been recognised in respect of unused tax losses of €2,371 million (2013: €1,641 million) and tax credits of €441 million (2013: €390 million), as it is not probable that there will be future taxable profits within the entities against which the losses can be utilised. The majority of these tax losses and credits arise in tax jurisdictions where they do not expire with the exception of €1,192 million (2013: €181 million) comprising corporate income tax losses in the Netherlands which expire between now and 2023 and state and federal tax losses in the US which expire between now and 2034.
Other deductible temporary differences of €67 million (2013: €72 million) have not been recognised as a deferred tax asset. There is no expiry date for these differences.
At the balance sheet date, the aggregate amount of temporary differences associated with undistributed earnings of subsidiaries for which deferred tax liabilities have not been recognised was €1,566 million (2013: €1,306 million). No liability has been recognised in respect of these differences because the Group is in a position to control the timing of the reversal of the temporary differences, and it is probable that such differences will not reverse in the foreseeable future.
Deferred income tax assets and liabilities are offset when there is a legally enforceable right to set off current tax assets against current tax liabilities and when the deferred income taxes relate to the same fiscal authority. The following amounts, determined after appropriate offsetting, are shown in the consolidated balance sheet:
Deferred tax assets and liabilities
€ millionAssets
2014
€ millionAssets
2013
€ millionLiabilities
2014
€ millionLiabilities
2013
€ millionTotal2014
€ millionTotal2013
Pensions and similar obligations 564 368 310 72 874 440Provisions 515 532 142 140 657 672Goodwill and intangible assets 127 58 (1,419) (1,221) (1,292) (1,163)Accelerated tax depreciation (113) (176) (640) (521) (753) (697)Tax losses 88 142 35 5 123 147Fair value gains 14 10 (24) (28) (10) (18)Fair value losses (8) (11) 18 7 10 (4)Share-based payments 85 96 87 77 172 173Other 14 65 (43) (55) (29) 10
1,286 1,084 (1,534) (1,524) (248) (440)Of which deferred tax to be recovered/(settled) after more than 12 months 1,037 896 (1,586) (1,563) (549) (667)
101Unilever Annual Report and Accounts 2014 Financial statements
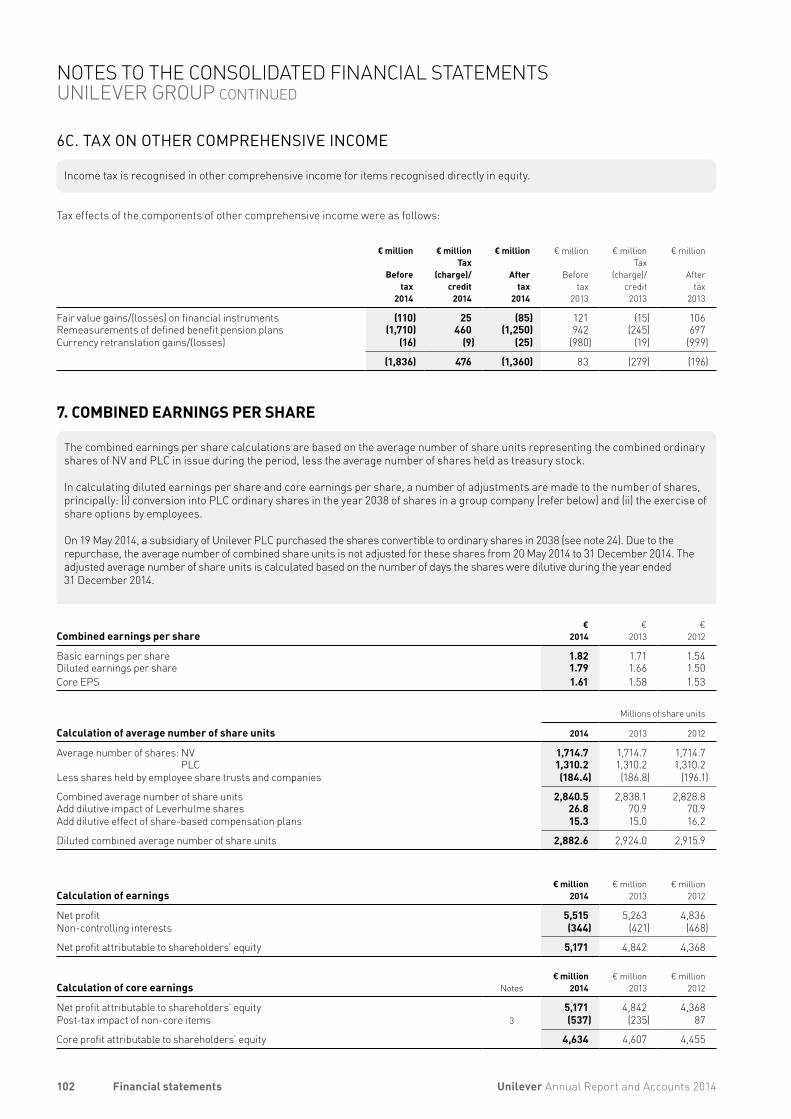
6C. TAX ON OTHER COMPREHENSIVE INCOME
Income tax is recognised in other comprehensive income for items recognised directly in equity.
Tax effects of the components of other comprehensive income were as follows:
€ million
Beforetax
2014
€ millionTax
(charge)/credit
2014
€ million
Aftertax
2014
€ million
Beforetax
2013
€ millionTax
(charge)/credit
2013
€ million
Aftertax
2013
Fair value gains/(losses) on financial instruments (110) 25 (85) 121 (15) 106Remeasurements of defined benefit pension plans (1,710) 460 (1,250) 942 (245) 697Currency retranslation gains/(losses) (16) (9) (25) (980) (19) (999)
(1,836) 476 (1,360) 83 (279) (196)
7. COMBINED EARNINGS PER SHARE
The combined earnings per share calculations are based on the average number of share units representing the combined ordinary shares of NV and PLC in issue during the period, less the average number of shares held as treasury stock.
In calculating diluted earnings per share and core earnings per share, a number of adjustments are made to the number of shares, principally: (i) conversion into PLC ordinary shares in the year 2038 of shares in a group company (refer below) and (ii) the exercise of share options by employees.
On 19 May 2014, a subsidiary of Unilever PLC purchased the shares convertible to ordinary shares in 2038 (see note 24). Due to the repurchase, the average number of combined share units is not adjusted for these shares from 20 May 2014 to 31 December 2014. The adjusted average number of share units is calculated based on the number of days the shares were dilutive during the year ended 31 December 2014.
Combined earnings per share€
2014€
2013€
2012
Basic earnings per share 1.82 1.71 1.54Diluted earnings per share 1.79 1.66 1.50Core EPS 1.61 1.58 1.53
Millions of share units
Calculation of average number of share units 2014 2013 2012
Average number of shares: NV 1,714.7 1,714.7 1,714.7PLC 1,310.2 1,310.2 1,310.2
Less shares held by employee share trusts and companies (184.4) (186.8) (196.1)
Combined average number of share units 2,840.5 2,838.1 2,828.8Add dilutive impact of Leverhulme shares 26.8 70.9 70.9Add dilutive effect of share-based compensation plans 15.3 15.0 16.2
Diluted combined average number of share units 2,882.6 2,924.0 2,915.9
Calculation of earnings€ million
2014€ million
2013€ million
2012
Net profit 5,515 5,263 4,836Non-controlling interests (344) (421) (468)
Net profit attributable to shareholders’ equity 5,171 4,842 4,368
Calculation of core earnings Notes€ million
2014€ million
2013€ million
2012
Net profit attributable to shareholders’ equity 5,171 4,842 4,368Post-tax impact of non-core items 3 (537) (235) 87
Core profit attributable to shareholders’ equity 4,634 4,607 4,455
102 Unilever Annual Report and Accounts 2014Financial statements
NOTES TO THE CONSOLIDATED FINANCIAL STATEMENTS UNILEVER GROUP CONTINUED
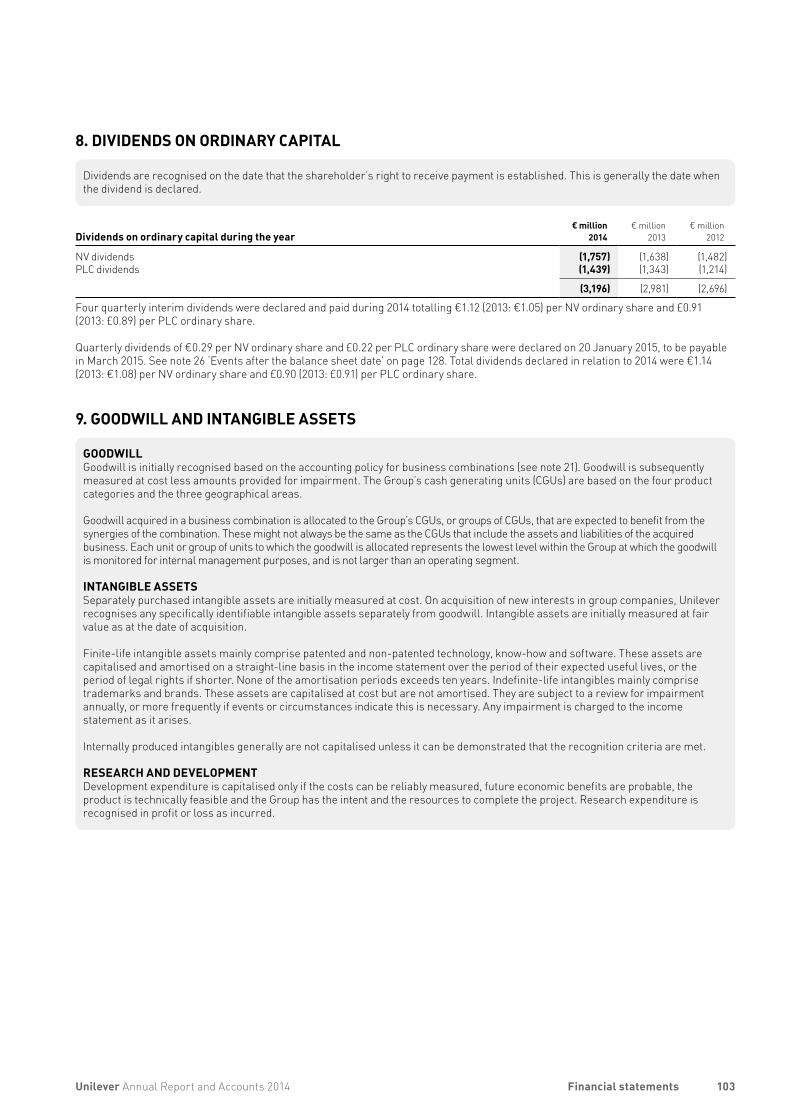
8. DIVIDENDS ON ORDINARY CAPITAL
Dividends are recognised on the date that the shareholder’s right to receive payment is established. This is generally the date when the dividend is declared.
Dividends on ordinary capital during the year€ million
2014€ million
2013€ million
2012
NV dividends (1,757) (1,638) (1,482)PLC dividends (1,439) (1,343) (1,214)
(3,196) (2,981) (2,696)
Four quarterly interim dividends were declared and paid during 2014 totalling €1.12 (2013: €1.05) per NV ordinary share and £0.91 (2013: £0.89) per PLC ordinary share.
Quarterly dividends of €0.29 per NV ordinary share and £0.22 per PLC ordinary share were declared on 20 January 2015, to be payable in March 2015. See note 26 ‘Events after the balance sheet date’ on page 128. Total dividends declared in relation to 2014 were €1.14 (2013: €1.08) per NV ordinary share and £0.90 (2013: £0.91) per PLC ordinary share.
9. GOODWILL AND INTANGIBLE ASSETS
GOODWILLGoodwill is initially recognised based on the accounting policy for business combinations (see note 21). Goodwill is subsequently measured at cost less amounts provided for impairment. The Group’s cash generating units (CGUs) are based on the four product categories and the three geographical areas.
Goodwill acquired in a business combination is allocated to the Group’s CGUs, or groups of CGUs, that are expected to benefit from the synergies of the combination. These might not always be the same as the CGUs that include the assets and liabilities of the acquired business. Each unit or group of units to which the goodwill is allocated represents the lowest level within the Group at which the goodwill is monitored for internal management purposes, and is not larger than an operating segment.
INTANGIBLE ASSETSSeparately purchased intangible assets are initially measured at cost. On acquisition of new interests in group companies, Unilever recognises any specifically identifiable intangible assets separately from goodwill. Intangible assets are initially measured at fair value as at the date of acquisition.
Finite-life intangible assets mainly comprise patented and non-patented technology, know-how and software. These assets are capitalised and amortised on a straight-line basis in the income statement over the period of their expected useful lives, or the period of legal rights if shorter. None of the amortisation periods exceeds ten years. Indefinite-life intangibles mainly comprise trademarks and brands. These assets are capitalised at cost but are not amortised. They are subject to a review for impairment annually, or more frequently if events or circumstances indicate this is necessary. Any impairment is charged to the income statement as it arises.
Internally produced intangibles generally are not capitalised unless it can be demonstrated that the recognition criteria are met.
RESEARCH AND DEVELOPMENTDevelopment expenditure is capitalised only if the costs can be reliably measured, future economic benefits are probable, the product is technically feasible and the Group has the intent and the resources to complete the project. Research expenditure is recognised in profit or loss as incurred.
103Unilever Annual Report and Accounts 2014 Financial statements
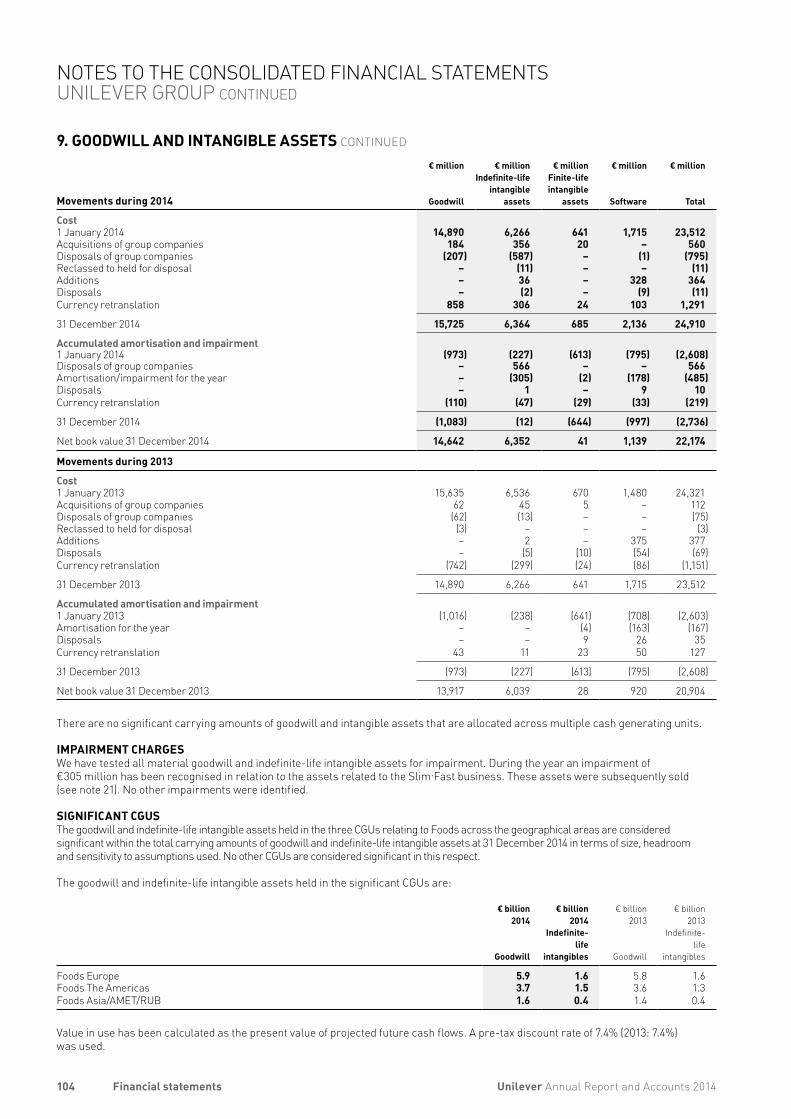
9. GOODWILL AND INTANGIBLE ASSETS CONTINUED
Movements during 2014
€ million
Goodwill
€ millionIndefinitelife
intangibleassets
€ millionFinitelifeintangible
assets
€ million
Software
€ million
Total
Cost1 January 2014 14,890 6,266 641 1,715 23,512 Acquisitions of group companies 184 356 20 – 560 Disposals of group companies (207) (587) – (1) (795)Reclassed to held for disposal – (11) – – (11)Additions – 36 – 328 364 Disposals – (2) – (9) (11)Currency retranslation 858 306 24 103 1,291
31 December 2014 15,725 6,364 685 2,136 24,910
Accumulated amortisation and impairment1 January 2014 (973) (227) (613) (795) (2,608)Disposals of group companies – 566 – – 566 Amortisation/impairment for the year – (305) (2) (178) (485)Disposals – 1 – 9 10 Currency retranslation (110) (47) (29) (33) (219)
31 December 2014 (1,083) (12) (644) (997) (2,736)
Net book value 31 December 2014 14,642 6,352 41 1,139 22,174
Movements during 2013
Cost1 January 2013 15,635 6,536 670 1,480 24,321Acquisitions of group companies 62 45 5 – 112Disposals of group companies (62) (13) – – (75)Reclassed to held for disposal (3) – – – (3)Additions – 2 – 375 377Disposals – (5) (10) (54) (69)Currency retranslation (742) (299) (24) (86) (1,151)
31 December 2013 14,890 6,266 641 1,715 23,512
Accumulated amortisation and impairment1 January 2013 (1,016) (238) (641) (708) (2,603)Amortisation for the year – – (4) (163) (167)Disposals – – 9 26 35Currency retranslation 43 11 23 50 127
31 December 2013 (973) (227) (613) (795) (2,608)
Net book value 31 December 2013 13,917 6,039 28 920 20,904
There are no significant carrying amounts of goodwill and intangible assets that are allocated across multiple cash generating units.
IMPAIRMENT CHARGESWe have tested all material goodwill and indefinite-life intangible assets for impairment. During the year an impairment of €305 million has been recognised in relation to the assets related to the Slim.Fast business. These assets were subsequently sold (see note 21). No other impairments were identified.
SIGNIFICANT CGUSThe goodwill and indefinite-life intangible assets held in the three CGUs relating to Foods across the geographical areas are considered significant within the total carrying amounts of goodwill and indefinite-life intangible assets at 31 December 2014 in terms of size, headroom and sensitivity to assumptions used. No other CGUs are considered significant in this respect.
The goodwill and indefinite-life intangible assets held in the significant CGUs are:
€ billion2014
Goodwill
€ billion2014
Indefinite life
intangibles
€ billion2013
Goodwill
€ billion2013
Indefinite- life
intangibles
Foods Europe 5.9 1.6 5.8 1.6Foods The Americas 3.7 1.5 3.6 1.3Foods Asia/AMET/RUB 1.6 0.4 1.4 0.4
Value in use has been calculated as the present value of projected future cash flows. A pre-tax discount rate of 7.4% (2013: 7.4%) was used.
104 Unilever Annual Report and Accounts 2014Financial statements
NOTES TO THE CONSOLIDATED FINANCIAL STATEMENTS UNILEVER GROUP CONTINUED
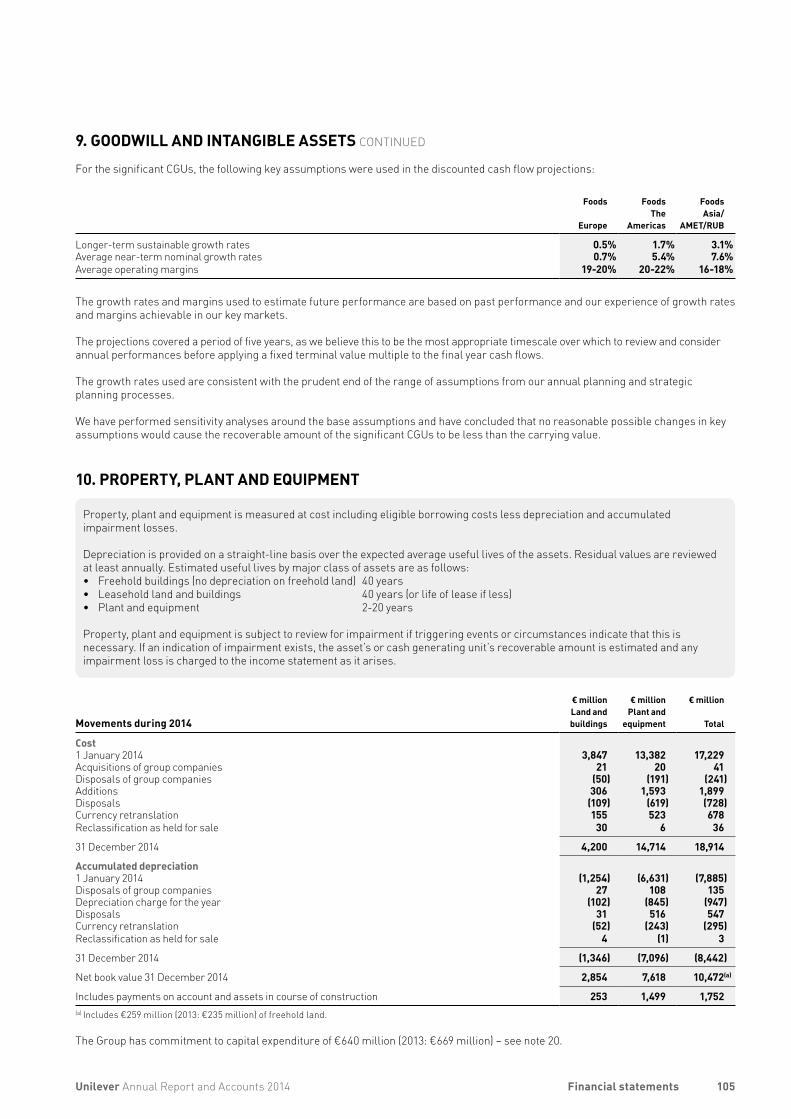
9. GOODWILL AND INTANGIBLE ASSETS CONTINUED
For the significant CGUs, the following key assumptions were used in the discounted cash flow projections:
Foods
Europe
FoodsThe
Americas
FoodsAsia/
AMET/RUB
Longer-term sustainable growth rates 0.5% 1.7% 3.1%Average near-term nominal growth rates 0.7% 5.4% 7.6%Average operating margins 1920% 2022% 1618%
The growth rates and margins used to estimate future performance are based on past performance and our experience of growth rates and margins achievable in our key markets.
The projections covered a period of five years, as we believe this to be the most appropriate timescale over which to review and consider annual performances before applying a fixed terminal value multiple to the final year cash flows.
The growth rates used are consistent with the prudent end of the range of assumptions from our annual planning and strategic planning processes.
We have performed sensitivity analyses around the base assumptions and have concluded that no reasonable possible changes in key assumptions would cause the recoverable amount of the significant CGUs to be less than the carrying value.
10. PROPERTY, PLANT AND EQUIPMENT
Property, plant and equipment is measured at cost including eligible borrowing costs less depreciation and accumulated impairment losses.
Depreciation is provided on a straight-line basis over the expected average useful lives of the assets. Residual values are reviewed at least annually. Estimated useful lives by major class of assets are as follows:• Freehold buildings (no depreciation on freehold land) 40 years• Leasehold land and buildings 40 years (or life of lease if less)• Plant and equipment 2-20 years
Property, plant and equipment is subject to review for impairment if triggering events or circumstances indicate that this is necessary. If an indication of impairment exists, the asset’s or cash generating unit’s recoverable amount is estimated and any impairment loss is charged to the income statement as it arises.
Movements during 2014
€ millionLand andbuildings
€ millionPlant and
equipment
€ million
Total
Cost1 January 2014 3,847 13,382 17,229 Acquisitions of group companies 21 20 41 Disposals of group companies (50) (191) (241)Additions 306 1,593 1,899Disposals (109) (619) (728)Currency retranslation 155 523 678Reclassification as held for sale 30 6 36
31 December 2014 4,200 14,714 18,914
Accumulated depreciation1 January 2014 (1,254) (6,631) (7,885)Disposals of group companies 27 108 135 Depreciation charge for the year (102) (845) (947)Disposals 31 516 547 Currency retranslation (52) (243) (295)Reclassification as held for sale 4 (1) 3
31 December 2014 (1,346) (7,096) (8,442)
Net book value 31 December 2014 2,854 7,618 10,472(a)
Includes payments on account and assets in course of construction 253 1,499 1,752 (a) Includes €259 million (2013: €235 million) of freehold land.
The Group has commitment to capital expenditure of €640 million (2013: €669 million) – see note 20.
105Unilever Annual Report and Accounts 2014 Financial statements
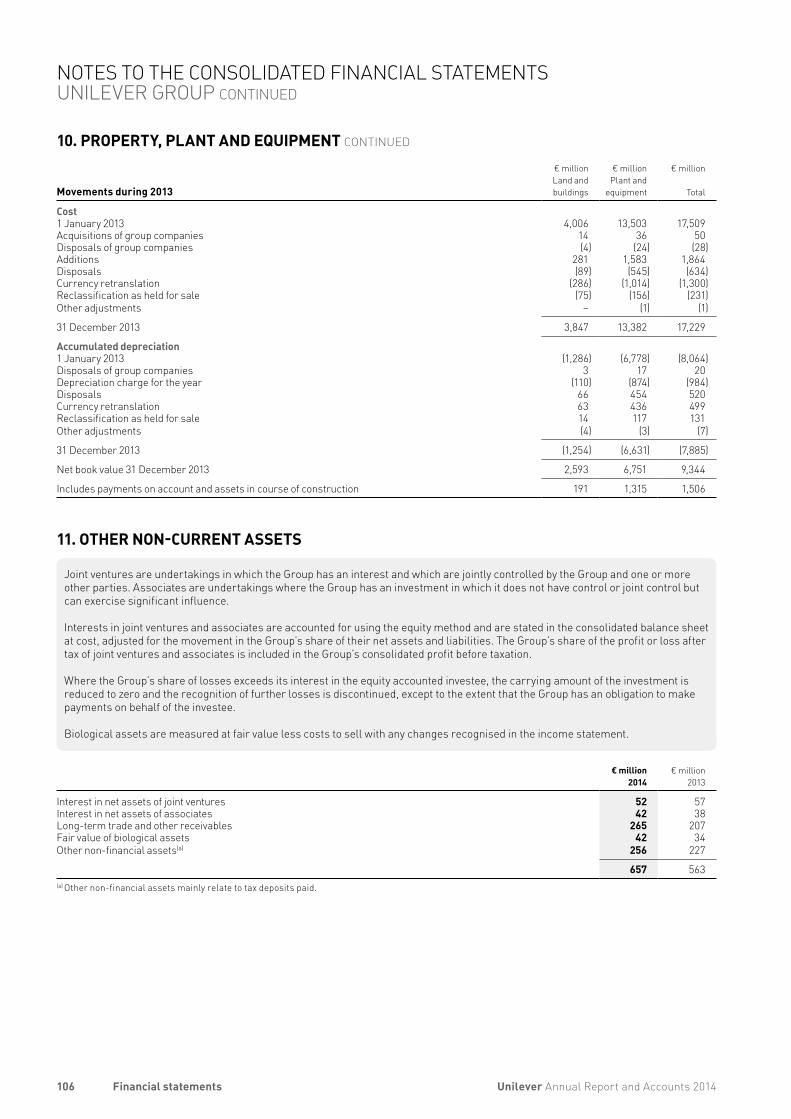
10. PROPERTY, PLANT AND EQUIPMENT CONTINUED
Movements during 2013
€ millionLand andbuildings
€ millionPlant and
equipment
€ million
Total
Cost1 January 2013 4,006 13,503 17,509Acquisitions of group companies 14 36 50Disposals of group companies (4) (24) (28)Additions 281 1,583 1,864Disposals (89) (545) (634)Currency retranslation (286) (1,014) (1,300)Reclassification as held for sale (75) (156) (231)Other adjustments – (1) (1)
31 December 2013 3,847 13,382 17,229
Accumulated depreciation1 January 2013 (1,286) (6,778) (8,064)Disposals of group companies 3 17 20Depreciation charge for the year (110) (874) (984)Disposals 66 454 520Currency retranslation 63 436 499Reclassification as held for sale 14 117 131Other adjustments (4) (3) (7)
31 December 2013 (1,254) (6,631) (7,885)
Net book value 31 December 2013 2,593 6,751 9,344
Includes payments on account and assets in course of construction 191 1,315 1,506
11. OTHER NON-CURRENT ASSETS
Joint ventures are undertakings in which the Group has an interest and which are jointly controlled by the Group and one or more other parties. Associates are undertakings where the Group has an investment in which it does not have control or joint control but can exercise significant influence.
Interests in joint ventures and associates are accounted for using the equity method and are stated in the consolidated balance sheet at cost, adjusted for the movement in the Group’s share of their net assets and liabilities. The Group’s share of the profit or loss after tax of joint ventures and associates is included in the Group’s consolidated profit before taxation.
Where the Group’s share of losses exceeds its interest in the equity accounted investee, the carrying amount of the investment is reduced to zero and the recognition of further losses is discontinued, except to the extent that the Group has an obligation to make payments on behalf of the investee.
Biological assets are measured at fair value less costs to sell with any changes recognised in the income statement.
€ million2014
€ million2013
Interest in net assets of joint ventures 52 57Interest in net assets of associates 42 38 Long-term trade and other receivables 265 207 Fair value of biological assets 42 34 Other non-financial assets(a) 256 227
657 563 (a) Other non-financial assets mainly relate to tax deposits paid.
106 Unilever Annual Report and Accounts 2014Financial statements
NOTES TO THE CONSOLIDATED FINANCIAL STATEMENTS UNILEVER GROUP CONTINUED
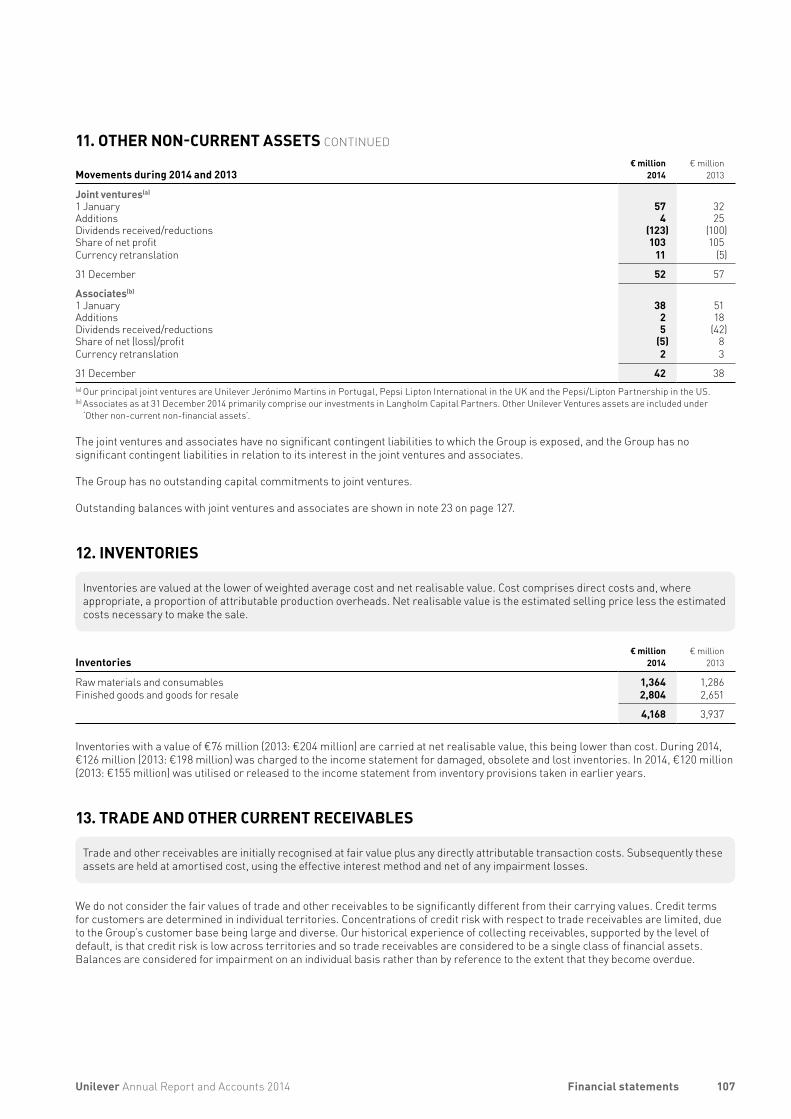
11. OTHER NON-CURRENT ASSETS CONTINUED
Movements during 2014 and 2013€ million
2014€ million
2013
Joint ventures(a)
1 January 57 32Additions 4 25Dividends received/reductions (123) (100)Share of net profit 103 105Currency retranslation 11 (5)
31 December 52 57
Associates(b)
1 January 38 51Additions 2 18Dividends received/reductions 5 (42)Share of net (loss)/profit (5) 8Currency retranslation 2 3
31 December 42 38(a) Our principal joint ventures are Unilever Jerónimo Martins in Portugal, Pepsi Lipton International in the UK and the Pepsi/Lipton Partnership in the US. (b) Associates as at 31 December 2014 primarily comprise our investments in Langholm Capital Partners. Other Unilever Ventures assets are included under
‘Other non-current non-financial assets’.
The joint ventures and associates have no significant contingent liabilities to which the Group is exposed, and the Group has no significant contingent liabilities in relation to its interest in the joint ventures and associates.
The Group has no outstanding capital commitments to joint ventures.
Outstanding balances with joint ventures and associates are shown in note 23 on page 127.
12. INVENTORIES
Inventories are valued at the lower of weighted average cost and net realisable value. Cost comprises direct costs and, where appropriate, a proportion of attributable production overheads. Net realisable value is the estimated selling price less the estimated costs necessary to make the sale.
Inventories€ million
2014€ million
2013
Raw materials and consumables 1,364 1,286Finished goods and goods for resale 2,804 2,651
4,168 3,937
Inventories with a value of €76 million (2013: €204 million) are carried at net realisable value, this being lower than cost. During 2014, €126 million (2013: €198 million) was charged to the income statement for damaged, obsolete and lost inventories. In 2014, €120 million (2013: €155 million) was utilised or released to the income statement from inventory provisions taken in earlier years.
13. TRADE AND OTHER CURRENT RECEIVABLES
Trade and other receivables are initially recognised at fair value plus any directly attributable transaction costs. Subsequently these assets are held at amortised cost, using the effective interest method and net of any impairment losses.
We do not consider the fair values of trade and other receivables to be significantly different from their carrying values. Credit terms for customers are determined in individual territories. Concentrations of credit risk with respect to trade receivables are limited, due to the Group’s customer base being large and diverse. Our historical experience of collecting receivables, supported by the level of default, is that credit risk is low across territories and so trade receivables are considered to be a single class of financial assets. Balances are considered for impairment on an individual basis rather than by reference to the extent that they become overdue.
107Unilever Annual Report and Accounts 2014 Financial statements
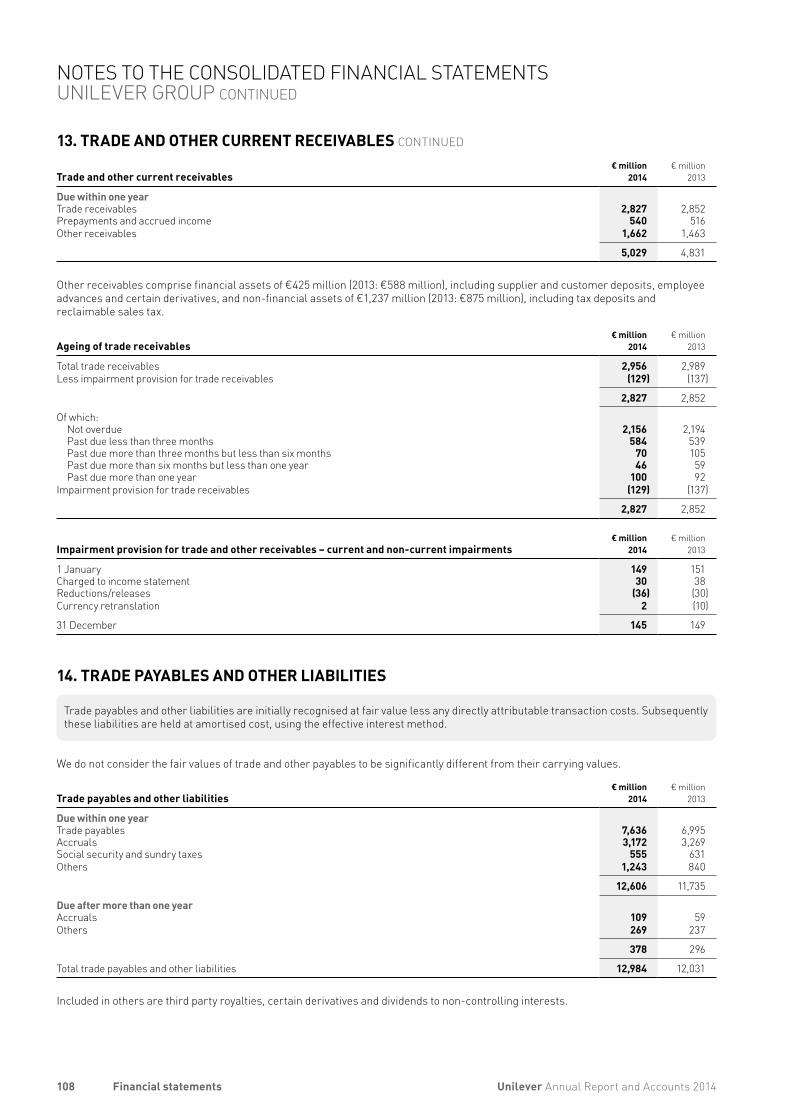
13. TRADE AND OTHER CURRENT RECEIVABLES CONTINUED
Trade and other current receivables€ million
2014€ million
2013
Due within one yearTrade receivables 2,827 2,852Prepayments and accrued income 540 516Other receivables 1,662 1,463
5,029 4,831
Other receivables comprise financial assets of €425 million (2013: €588 million), including supplier and customer deposits, employeeadvances and certain derivatives, and non-financial assets of €1,237 million (2013: €875 million), including tax deposits and reclaimable sales tax.
Ageing of trade receivables € million
2014€ million
2013
Total trade receivables 2,956 2,989Less impairment provision for trade receivables (129) (137)
2,827 2,852
Of which:Not overdue 2,156 2,194Past due less than three months 584 539Past due more than three months but less than six months 70 105Past due more than six months but less than one year 46 59Past due more than one year 100 92
Impairment provision for trade receivables (129) (137)
2,827 2,852
Impairment provision for trade and other receivables – current and noncurrent impairments€ million
2014€ million
2013
1 January 149 151Charged to income statement 30 38Reductions/releases (36) (30)Currency retranslation 2 (10)
31 December 145 149
14. TRADE PAYABLES AND OTHER LIABILITIES
Trade payables and other liabilities are initially recognised at fair value less any directly attributable transaction costs. Subsequently these liabilities are held at amortised cost, using the effective interest method.
We do not consider the fair values of trade and other payables to be significantly different from their carrying values.
Trade payables and other liabilities€ million
2014€ million
2013
Due within one yearTrade payables 7,636 6,995Accruals 3,172 3,269Social security and sundry taxes 555 631Others 1,243 840
12,606 11,735
Due after more than one yearAccruals 109 59Others 269 237
378 296
Total trade payables and other liabilities 12,984 12,031
Included in others are third party royalties, certain derivatives and dividends to non-controlling interests.
108 Unilever Annual Report and Accounts 2014Financial statements
NOTES TO THE CONSOLIDATED FINANCIAL STATEMENTS UNILEVER GROUP CONTINUED
15. CAPITAL AND FUNDING
ORDINARY SHARESOrdinary shares are classified as equity. Incremental costs directly attributable to the issue of ordinary shares are recognised as a deduction from equity, net of any tax effects.
INTERNAL HOLDINGSThe ordinary shares numbered 1 to 2,400 (inclusive) in NV (‘Special Shares’) and deferred stock of PLC are held as to one half of each class by N.V. Elma – a subsidiary of NV – and one half by United Holdings Limited – a subsidiary of PLC. This capital is eliminated on consolidation.
SHARE-BASED COMPENSATIONThe Group operates a number of share-based compensation plans involving options and awards of ordinary shares of NV and PLC. Full details of these plans are given in note 4C on pages 98 and 99.
OTHER RESERVESOther reserves include the fair value reserve, the foreign currency translation reserve, the capital redemption reserve and treasury stock.
SHARES HELD BY EMPLOYEE SHARE TRUSTS AND GROUP COMPANIESCertain PLC trusts, NV and group companies purchase and hold NV and PLC shares to satisfy performance shares granted, share options granted and other share awards (see note 4C). The assets and liabilities of these trusts and shares held by group companies are included in the consolidated financial statements. The book value of shares held is deducted from other reserves, and trusts’ borrowings are included in the Group’s liabilities. The costs of the trusts are included in the results of the Group. These shares are excluded from the calculation of earnings per share.
FINANCIAL LIABILITIESFinancial liabilities are initially recognised at fair value, less any directly related transaction costs. Certain bonds are designated as being part of a fair value hedge relationship. In these cases, the bonds are carried at amortised cost, adjusted for the fair value of the risk being hedged, with changes in value shown in profit and loss. Other financial liabilities, excluding derivatives, are subsequently carried at amortised cost.
DERIVATIVE FINANCIAL INSTRUMENTSThe Group’s use of, and accounting for, derivative instruments is explained in note 16 on page 114 and on pages 118 to 119.
The Group’s Treasury activities are designed to: • maintain a competitive balance sheet in line with A+/A1 rating (see below);• secure funding at lowest costs for the Group’s operations, M&A activity and external dividend payments (see below);• protect the Group’s financial results and position from financial risks (see note 16);• maintain market risks within acceptable parameters, while optimising returns (see note 16); and• protect the Group’s financial investments, while maximising returns (see note 17).
The Treasury department provides central deposit taking, funding and foreign exchange management services for the Group’s operations. The department is governed by standards and processes which are approved by Unilever Leadership Executive (ULE). In addition to guidelines and exposure limits, a system of authorities and extensive independent reporting covers all major areas of activity. Performance is monitored closely by senior management. Reviews are undertaken periodically by corporate audit.
Key instruments used by the department are: • short-term and long-term borrowings;• cash and cash equivalents; and• plain vanilla derivatives, including interest rate swaps and FX contracts.
The Treasury department maintains a list of approved financial instruments. The use of any new instrument must be approved by the Chief Financial Officer. The use of leveraged instruments is not permitted.
109Unilever Annual Report and Accounts 2014 Financial statements
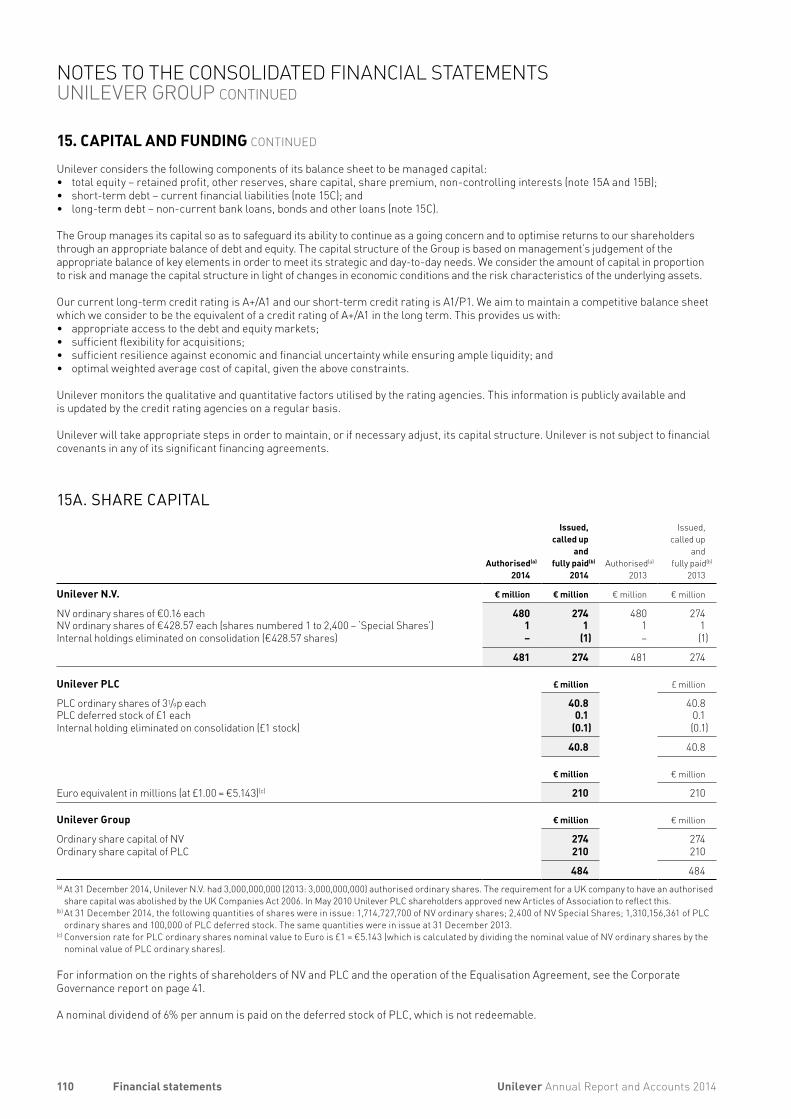
15. CAPITAL AND FUNDING CONTINUED
Unilever considers the following components of its balance sheet to be managed capital: • total equity – retained profit, other reserves, share capital, share premium, non-controlling interests (note 15A and 15B);• short-term debt – current financial liabilities (note 15C); and• long-term debt – non-current bank loans, bonds and other loans (note 15C).
The Group manages its capital so as to safeguard its ability to continue as a going concern and to optimise returns to our shareholders through an appropriate balance of debt and equity. The capital structure of the Group is based on management’s judgement of the appropriate balance of key elements in order to meet its strategic and day-to-day needs. We consider the amount of capital in proportion to risk and manage the capital structure in light of changes in economic conditions and the risk characteristics of the underlying assets.
Our current long-term credit rating is A+/A1 and our short-term credit rating is A1/P1. We aim to maintain a competitive balance sheet which we consider to be the equivalent of a credit rating of A+/A1 in the long term. This provides us with: • appropriate access to the debt and equity markets;• sufficient flexibility for acquisitions;• sufficient resilience against economic and financial uncertainty while ensuring ample liquidity; and• optimal weighted average cost of capital, given the above constraints.
Unilever monitors the qualitative and quantitative factors utilised by the rating agencies. This information is publicly available and is updated by the credit rating agencies on a regular basis.
Unilever will take appropriate steps in order to maintain, or if necessary adjust, its capital structure. Unilever is not subject to financial covenants in any of its significant financing agreements.
15A. SHARE CAPITAL
Authorised(a)
2014
Issued,called up
andfully paid(b)
2014
Authorised(a)
2013
Issued,called up
andfully paid(b)
2013
Unilever N.V. € million € million € million € million
NV ordinary shares of €0.16 each 480 274 480 274 NV ordinary shares of €428.57 each (shares numbered 1 to 2,400 – ‘Special Shares’) 1 1 1 1 Internal holdings eliminated on consolidation (€428.57 shares) – (1) – (1)
481 274 481 274
Unilever PLC £ million £ million
PLC ordinary shares of 31/9p each 40.8 40.8PLC deferred stock of £1 each 0.1 0.1Internal holding eliminated on consolidation (£1 stock) (0.1) (0.1)
40.8 40.8
€ million € million
Euro equivalent in millions (at £1.00 = €5.143)(c) 210 210
Unilever Group € million € million
Ordinary share capital of NV 274 274 Ordinary share capital of PLC 210 210
484 484 (a) At 31 December 2014, Unilever N.V. had 3,000,000,000 (2013: 3,000,000,000) authorised ordinary shares. The requirement for a UK company to have an authorised
share capital was abolished by the UK Companies Act 2006. In May 2010 Unilever PLC shareholders approved new Articles of Association to reflect this.(b) At 31 December 2014, the following quantities of shares were in issue: 1,714,727,700 of NV ordinary shares; 2,400 of NV Special Shares; 1,310,156,361 of PLC
ordinary shares and 100,000 of PLC deferred stock. The same quantities were in issue at 31 December 2013.(c) Conversion rate for PLC ordinary shares nominal value to Euro is £1 = €5.143 (which is calculated by dividing the nominal value of NV ordinary shares by the
nominal value of PLC ordinary shares).
For information on the rights of shareholders of NV and PLC and the operation of the Equalisation Agreement, see the Corporate Governance report on page 41.
A nominal dividend of 6% per annum is paid on the deferred stock of PLC, which is not redeemable.
110 Unilever Annual Report and Accounts 2014Financial statements
NOTES TO THE CONSOLIDATED FINANCIAL STATEMENTS UNILEVER GROUP CONTINUED
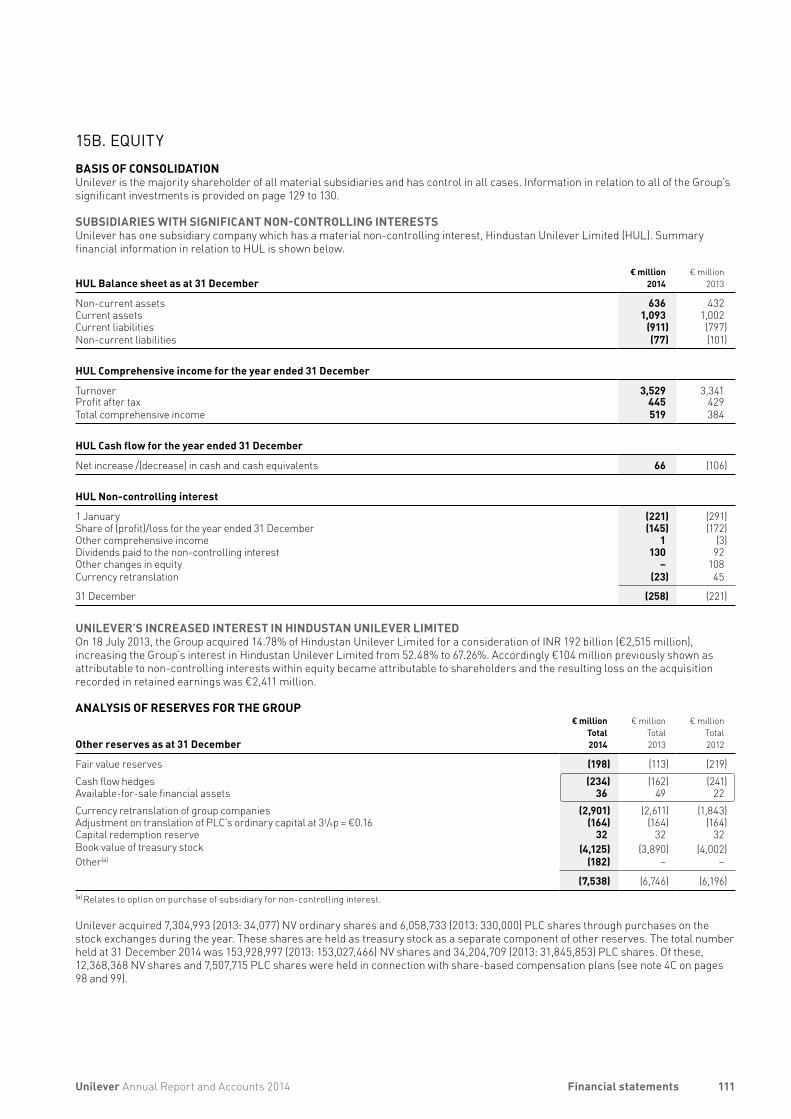
15B. EQUITYBASIS OF CONSOLIDATIONUnilever is the majority shareholder of all material subsidiaries and has control in all cases. Information in relation to all of the Group’s significant investments is provided on page 129 to 130.
SUBSIDIARIES WITH SIGNIFICANT NON-CONTROLLING INTERESTSUnilever has one subsidiary company which has a material non-controlling interest, Hindustan Unilever Limited (HUL). Summary financial information in relation to HUL is shown below.
HUL Balance sheet as at 31 December€ million
2014€ million
2013
Non-current assets 636 432Current assets 1,093 1,002Current liabilities (911) (797)Non-current liabilities (77) (101)
HUL Comprehensive income for the year ended 31 December
Turnover 3,529 3,341Profit after tax 445 429Total comprehensive income 519 384
HUL Cash flow for the year ended 31 December
Net increase /(decrease) in cash and cash equivalents 66 (106)
HUL Non-controlling interest
1 January (221) (291)Share of (profit)/loss for the year ended 31 December (145) (172)Other comprehensive income 1 (3)Dividends paid to the non-controlling interest 130 92Other changes in equity – 108Currency retranslation (23) 45
31 December (258) (221)
UNILEVER’S INCREASED INTEREST IN HINDUSTAN UNILEVER LIMITEDOn 18 July 2013, the Group acquired 14.78% of Hindustan Unilever Limited for a consideration of INR 192 billion (€2,515 million), increasing the Group’s interest in Hindustan Unilever Limited from 52.48% to 67.26%. Accordingly €104 million previously shown as attributable to non-controlling interests within equity became attributable to shareholders and the resulting loss on the acquisition recorded in retained earnings was €2,411 million.
ANALYSIS OF RESERVES FOR THE GROUP
Other reserves as at 31 December
€ millionTotal2014
€ millionTotal2013
€ millionTotal2012
Fair value reserves (198) (113) (219)Cash flow hedges (234) (162) (241)Available-for-sale financial assets 36 49 22 Currency retranslation of group companies (2,901) (2,611) (1,843)Adjustment on translation of PLC’s ordinary capital at 31/9p = €0.16 (164) (164) (164)Capital redemption reserve 32 32 32Book value of treasury stock (4,125) (3,890) (4,002)Other(a) (182) – –
(7,538) (6,746) (6,196)(a) Relates to option on purchase of subsidiary for non-controlling interest.
Unilever acquired 7,304,993 (2013: 34,077) NV ordinary shares and 6,058,733 (2013: 330,000) PLC shares through purchases on the stock exchanges during the year. These shares are held as treasury stock as a separate component of other reserves. The total number held at 31 December 2014 was 153,928,997 (2013: 153,027,466) NV shares and 34,204,709 (2013: 31,845,853) PLC shares. Of these, 12,368,368 NV shares and 7,507,715 PLC shares were held in connection with share-based compensation plans (see note 4C on pages 98 and 99).
111Unilever Annual Report and Accounts 2014 Financial statements
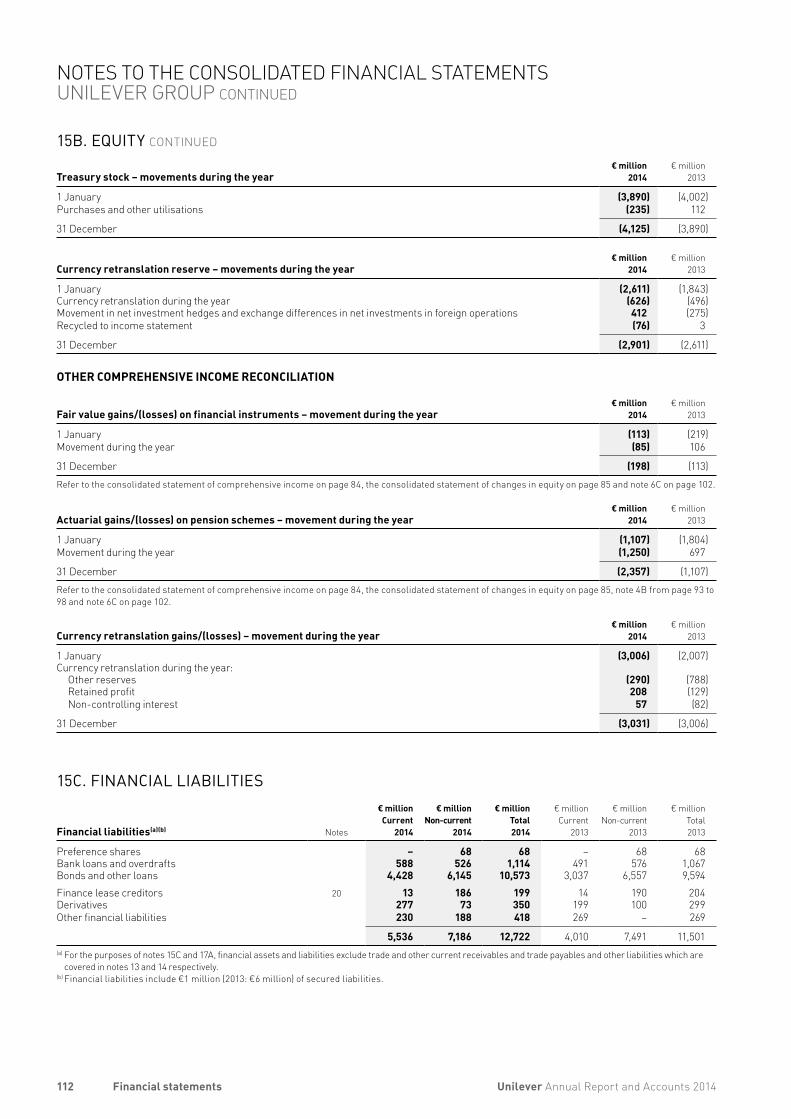
15B. EQUITY CONTINUED
Treasury stock – movements during the year€ million
2014€ million
2013
1 January (3,890) (4,002)Purchases and other utilisations (235) 112
31 December (4,125) (3,890)
Currency retranslation reserve – movements during the year€ million
2014€ million
2013
1 January (2,611) (1,843)Currency retranslation during the year (626) (496)Movement in net investment hedges and exchange differences in net investments in foreign operations 412 (275)Recycled to income statement (76) 3
31 December (2,901) (2,611)
OTHER COMPREHENSIVE INCOME RECONCILIATION
Fair value gains/(losses) on financial instruments – movement during the year€ million
2014€ million
2013
1 January (113) (219)Movement during the year (85) 106
31 December (198) (113)Refer to the consolidated statement of comprehensive income on page 84, the consolidated statement of changes in equity on page 85 and note 6C on page 102.
Actuarial gains/(losses) on pension schemes – movement during the year€ million
2014€ million
2013
1 January (1,107) (1,804)Movement during the year (1,250) 697
31 December (2,357) (1,107)Refer to the consolidated statement of comprehensive income on page 84, the consolidated statement of changes in equity on page 85, note 4B from page 93 to 98 and note 6C on page 102.
Currency retranslation gains/(losses) – movement during the year€ million
2014€ million
2013
1 January (3,006) (2,007)Currency retranslation during the year:
Other reserves (290) (788)Retained profit 208 (129)Non-controlling interest 57 (82)
31 December (3,031) (3,006)
15C. FINANCIAL LIABILITIES
Financial liabilities(a)(b) Notes
€ millionCurrent
2014
€ millionNon-current
2014
€ millionTotal2014
€ millionCurrent
2013
€ millionNon-current
2013
€ millionTotal2013
Preference shares – 68 68 – 68 68Bank loans and overdrafts 588 526 1,114 491 576 1,067Bonds and other loans 4,428 6,145 10,573 3,037 6,557 9,594Finance lease creditors 20 13 186 199 14 190 204Derivatives 277 73 350 199 100 299Other financial liabilities 230 188 418 269 – 269
5,536 7,186 12,722 4,010 7,491 11,501(a) For the purposes of notes 15C and 17A, financial assets and liabilities exclude trade and other current receivables and trade payables and other liabilities which are
covered in notes 13 and 14 respectively.(b) Financial liabilities include €1 million (2013: €6 million) of secured liabilities.
112 Unilever Annual Report and Accounts 2014Financial statements
NOTES TO THE CONSOLIDATED FINANCIAL STATEMENTS UNILEVER GROUP CONTINUED
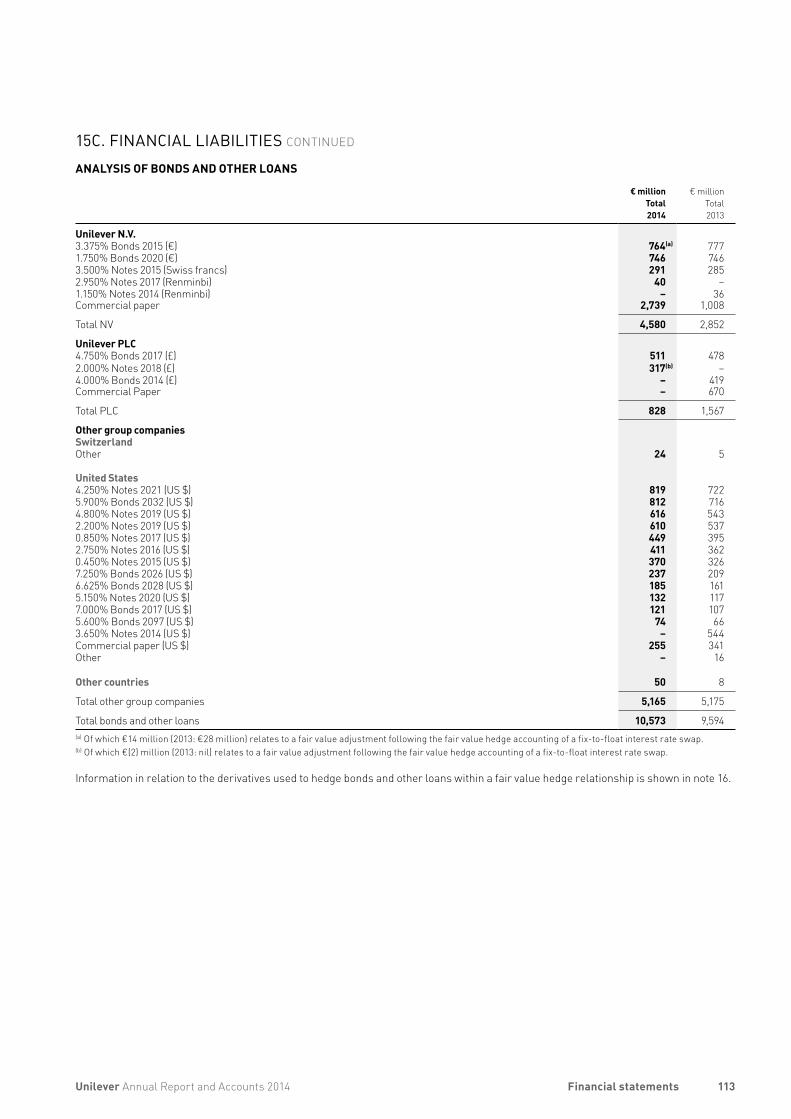
15C. FINANCIAL LIABILITIES CONTINUED
ANALYSIS OF BONDS AND OTHER LOANS
€ millionTotal2014
€ millionTotal2013
Unilever N.V.3.375% Bonds 2015 (€) 764(a) 7771.750% Bonds 2020 (€) 746 7463.500% Notes 2015 (Swiss francs) 291 2852.950% Notes 2017 (Renminbi) 40 –1.150% Notes 2014 (Renminbi) – 36Commercial paper 2,739 1,008
Total NV 4,580 2,852
Unilever PLC4.750% Bonds 2017 (£) 511 4782.000% Notes 2018 (£) 317(b) –4.000% Bonds 2014 (£) – 419Commercial Paper – 670
Total PLC 828 1,567
Other group companiesSwitzerlandOther 24 5
United States4.250% Notes 2021 (US $) 819 7225.900% Bonds 2032 (US $) 812 7164.800% Notes 2019 (US $) 616 5432.200% Notes 2019 (US $) 610 5370.850% Notes 2017 (US $) 449 3952.750% Notes 2016 (US $) 411 3620.450% Notes 2015 (US $) 370 3267.250% Bonds 2026 (US $) 237 2096.625% Bonds 2028 (US $) 185 1615.150% Notes 2020 (US $) 132 1177.000% Bonds 2017 (US $) 121 1075.600% Bonds 2097 (US $) 74 663.650% Notes 2014 (US $) – 544Commercial paper (US $) 255 341Other – 16
Other countries 50 8
Total other group companies 5,165 5,175
Total bonds and other loans 10,573 9,594(a) Of which €14 million (2013: €28 million) relates to a fair value adjustment following the fair value hedge accounting of a fix-to-float interest rate swap.(b) Of which €(2) million (2013: nil) relates to a fair value adjustment following the fair value hedge accounting of a fix-to-float interest rate swap.
Information in relation to the derivatives used to hedge bonds and other loans within a fair value hedge relationship is shown in note 16.
113Unilever Annual Report and Accounts 2014 Financial statements
16. TREASURY RISK MANAGEMENT
DERIVATIVES AND HEDGE ACCOUNTINGDerivatives are measured at fair value with any related transaction costs expensed as incurred. The treatment of changes in the value of derivatives depends on their use as explained below.
(I) FAIR VALUE HEDGES(a)
Certain derivatives are held to hedge the risk of changes in value of a specific bond or other loan. In these situations, the Group designates the liability and related derivative to be part of a fair value hedge relationship. The carrying value of the bond is adjusted by the fair value of the risk being hedged, with changes going to the income statement. Gains and losses on the corresponding derivative are also recognised in the income statement. The amounts recognised are offset in the income statement to the extent that the hedge is effective. When the relationship no longer meets the criteria for hedge accounting, the fair value hedge adjustment made to the bond is amortised to the income statement using the effective interest method.
(II) CASH FLOW HEDGES(a)
Derivatives are also held to hedge the uncertainty in timing or amount of future forecast cash flows. Such derivatives are classified as being part of cash flow hedge relationships. For an effective hedge, gains and losses from changes in the fair value of derivatives are recognised in equity. Any ineffective elements of the hedge are recognised in the income statement. If the hedged cash flow relates to a non-financial asset, the amount accumulated in equity is subsequently included within the carrying value of that asset. For other cash flow hedges, amounts deferred in equity are taken to the income statement at the same time as the related cash flow.
When a derivative no longer qualifies for hedge accounting, any cumulative gain or loss remains in equity until the related cash flow occurs. When the cash flow takes place, the cumulative gain or loss is taken to the income statement. If the hedged cash flow is no longer expected to occur, the cumulative gain or loss is taken to the income statement immediately.
(III) NET INVESTMENT HEDGES(a)
Certain derivatives are designated as hedges of the currency risk on the Group’s investment in foreign subsidiaries. The accounting policy for these arrangements is set out in note 1.
(IV) DERIVATIVES FOR WHICH HEDGE ACCOUNTING IS NOT APPLIEDDerivatives not classified as hedges are held in order to hedge certain balance sheet items and commodity exposures. No hedge accounting is applied to these derivatives, which are carried at fair value with changes being recognised in the income statement.
(a) Applying hedge accounting has not led to material ineffectiveness being recognised in the income statement for both 2013 and 2014.
The Group is exposed to the following risks that arise from its use of financial instruments, the management of which is described in the following sections:• liquidity risk (see note 16A);• market risk (see note 16B); and• credit risk (see note 17B).
16A. MANAGEMENT OF LIQUIDITY RISKLiquidity risk is the risk that the Group will face in meeting its obligations associated with its financial liabilities. The Group’s approach to managing liquidity is to ensure that it will have sufficient funds to meet its liabilities when due without incurring unacceptable losses. In doing this, management considers both normal and stressed conditions. A material and sustained shortfall in our cash flow could undermine the Group’s credit rating, impair investor confidence and also restrict the Group’s ability to raise funds.
The Group maintained a cautious funding strategy, with a positive cash balance throughout 2014. This was the result of cash delivery from the business, coupled with the proceeds from bond issuances. This cash has been invested conservatively with low risk counter-parties at maturities of less than six months.
Cash flow from operating activities provides the funds to service the financing of financial liabilities on a day-to-day basis. The Group seeks to manage its liquidity requirements by maintaining access to global debt markets through short-term and long-term debt programmes. In addition, Unilever has committed credit facilities for general corporate use.
On 31 December 2014 Unilever had undrawn revolving 364-day bilateral credit facilities in aggregate of US $6,550 million (2013: US $6,400 million) with a 364-day term out. As part of the regular annual process the intention is that these facilities will again be renewed in 2015.
114 Unilever Annual Report and Accounts 2014Financial statements
NOTES TO THE CONSOLIDATED FINANCIAL STATEMENTS UNILEVER GROUP CONTINUED
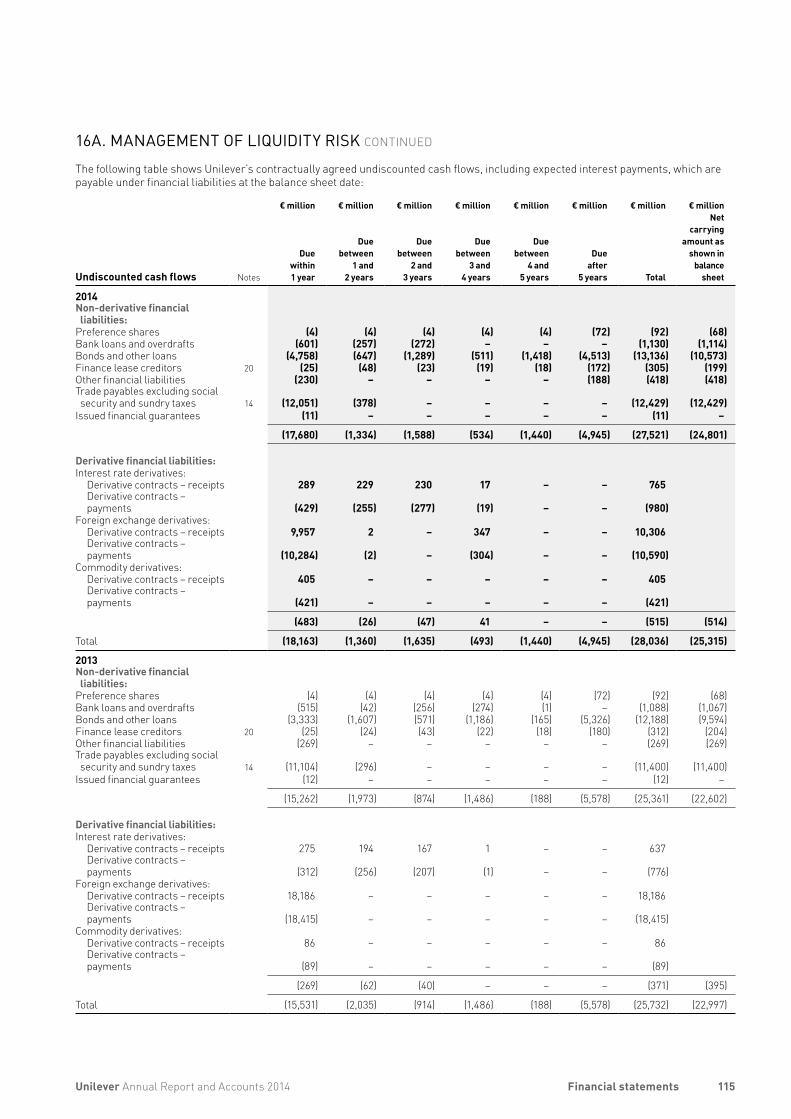
16A. MANAGEMENT OF LIQUIDITY RISK CONTINUED
The following table shows Unilever’s contractually agreed undiscounted cash flows, including expected interest payments, which are payable under financial liabilities at the balance sheet date:
Undiscounted cash flows Notes
€ million
Duewithin1 year
€ million
Duebetween
1 and2 years
€ million
Duebetween
2 and3 years
€ million
Duebetween
3 and4 years
€ million
Duebetween
4 and5 years
€ million
Dueafter
5 years
€ million
Total
€ millionNet
carryingamount as
shown in balance
sheet
2014Non-derivative financial liabilities:
Preference shares (4) (4) (4) (4) (4) (72) (92) (68)Bank loans and overdrafts (601) (257) (272) – – – (1,130) (1,114)Bonds and other loans (4,758) (647) (1,289) (511) (1,418) (4,513) (13,136) (10,573)Finance lease creditors 20 (25) (48) (23) (19) (18) (172) (305) (199)Other financial liabilities (230) – – – – (188) (418) (418)Trade payables excluding social security and sundry taxes 14 (12,051) (378) – – – – (12,429) (12,429)
Issued financial guarantees (11) – – – – – (11) –
(17,680) (1,334) (1,588) (534) (1,440) (4,945) (27,521) (24,801)
Derivative financial liabilities:Interest rate derivatives:
Derivative contracts – receipts 289 229 230 17 – – 765 Derivative contracts – payments (429) (255) (277) (19) – – (980)
Foreign exchange derivatives:Derivative contracts – receipts 9,957 2 – 347 – – 10,306 Derivative contracts – payments (10,284) (2) – (304) – – (10,590)
Commodity derivatives:Derivative contracts – receipts 405 – – – – – 405 Derivative contracts – payments (421) – – – – – (421)
(483) (26) (47) 41 – – (515) (514)
Total (18,163) (1,360) (1,635) (493) (1,440) (4,945) (28,036) (25,315)
2013Non-derivative financial liabilities:
Preference shares (4) (4) (4) (4) (4) (72) (92) (68)Bank loans and overdrafts (515) (42) (256) (274) (1) – (1,088) (1,067)Bonds and other loans (3,333) (1,607) (571) (1,186) (165) (5,326) (12,188) (9,594)Finance lease creditors 20 (25) (24) (43) (22) (18) (180) (312) (204)Other financial liabilities (269) – – – – – (269) (269)Trade payables excluding social security and sundry taxes 14 (11,104) (296) – – – – (11,400) (11,400)
Issued financial guarantees (12) – – – – – (12) –
(15,262) (1,973) (874) (1,486) (188) (5,578) (25,361) (22,602)
Derivative financial liabilities:Interest rate derivatives:
Derivative contracts – receipts 275 194 167 1 – – 637Derivative contracts – payments (312) (256) (207) (1) – – (776)
Foreign exchange derivatives:Derivative contracts – receipts 18,186 – – – – – 18,186Derivative contracts – payments (18,415) – – – – – (18,415)
Commodity derivatives:Derivative contracts – receipts 86 – – – – – 86Derivative contracts – payments (89) – – – – – (89)
(269) (62) (40) – – – (371) (395)
Total (15,531) (2,035) (914) (1,486) (188) (5,578) (25,732) (22,997)
115Unilever Annual Report and Accounts 2014 Financial statements
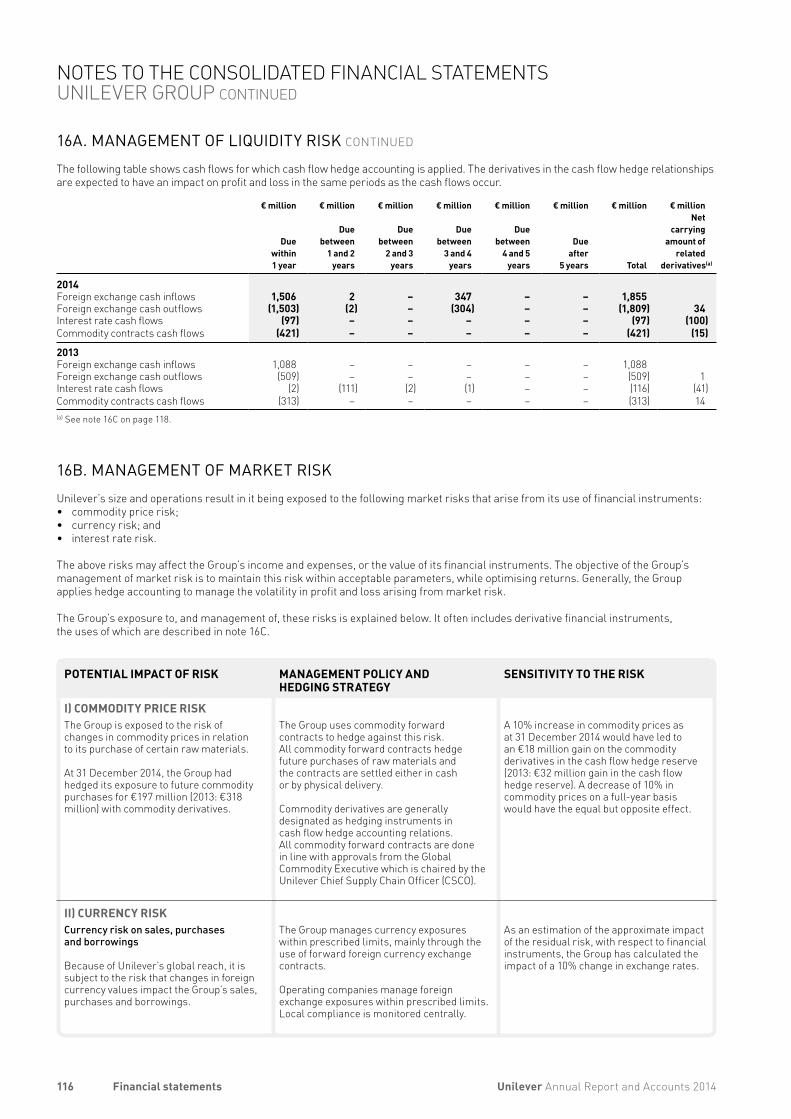
16A. MANAGEMENT OF LIQUIDITY RISK CONTINUED
The following table shows cash flows for which cash flow hedge accounting is applied. The derivatives in the cash flow hedge relationships are expected to have an impact on profit and loss in the same periods as the cash flows occur.
€ million
Duewithin1 year
€ million
Duebetween
1 and 2 years
€ million
Duebetween
2 and 3 years
€ million
Duebetween
3 and 4 years
€ million
Duebetween
4 and 5 years
€ million
Dueafter
5 years
€ million
Total
€ millionNet
carryingamount of
related derivatives(a)
2014Foreign exchange cash inflows 1,506 2 – 347 – – 1,855 Foreign exchange cash outflows (1,503) (2) – (304) – – (1,809) 34 Interest rate cash flows (97) – – – – – (97) (100)Commodity contracts cash flows (421) – – – – – (421) (15)
2013Foreign exchange cash inflows 1,088 – – – – – 1,088Foreign exchange cash outflows (509) – – – – – (509) 1Interest rate cash flows (2) (111) (2) (1) – – (116) (41)Commodity contracts cash flows (313) – – – – – (313) 14(a) See note 16C on page 118.
16B. MANAGEMENT OF MARKET RISKUnilever’s size and operations result in it being exposed to the following market risks that arise from its use of financial instruments:• commodity price risk;• currency risk; and• interest rate risk.
The above risks may affect the Group’s income and expenses, or the value of its financial instruments. The objective of the Group’s management of market risk is to maintain this risk within acceptable parameters, while optimising returns. Generally, the Group applies hedge accounting to manage the volatility in profit and loss arising from market risk.
The Group’s exposure to, and management of, these risks is explained below. It often includes derivative financial instruments, the uses of which are described in note 16C.
POTENTIAL IMPACT OF RISK MANAGEMENT POLICY AND HEDGING STRATEGY
SENSITIVITY TO THE RISK
I) COMMODITY PRICE RISKThe Group is exposed to the risk of changes in commodity prices in relation to its purchase of certain raw materials.
At 31 December 2014, the Group had hedged its exposure to future commodity purchases for €197 million (2013: €318 million) with commodity derivatives.
The Group uses commodity forward contracts to hedge against this risk. All commodity forward contracts hedge future purchases of raw materials and the contracts are settled either in cash or by physical delivery.
Commodity derivatives are generally designated as hedging instruments in cash flow hedge accounting relations. All commodity forward contracts are done in line with approvals from the Global Commodity Executive which is chaired by the Unilever Chief Supply Chain Officer (CSCO).
A 10% increase in commodity prices as at 31 December 2014 would have led to an €18 million gain on the commodity derivatives in the cash flow hedge reserve (2013: €32 million gain in the cash flow hedge reserve). A decrease of 10% in commodity prices on a full-year basis would have the equal but opposite effect.
II) CURRENCY RISKCurrency risk on sales, purchases and borrowings
Because of Unilever’s global reach, it is subject to the risk that changes in foreign currency values impact the Group’s sales, purchases and borrowings.
The Group manages currency exposures within prescribed limits, mainly through the use of forward foreign currency exchange contracts.
Operating companies manage foreign exchange exposures within prescribed limits. Local compliance is monitored centrally.
As an estimation of the approximate impact of the residual risk, with respect to financial instruments, the Group has calculated the impact of a 10% change in exchange rates.
116 Unilever Annual Report and Accounts 2014Financial statements
NOTES TO THE CONSOLIDATED FINANCIAL STATEMENTS UNILEVER GROUP CONTINUED
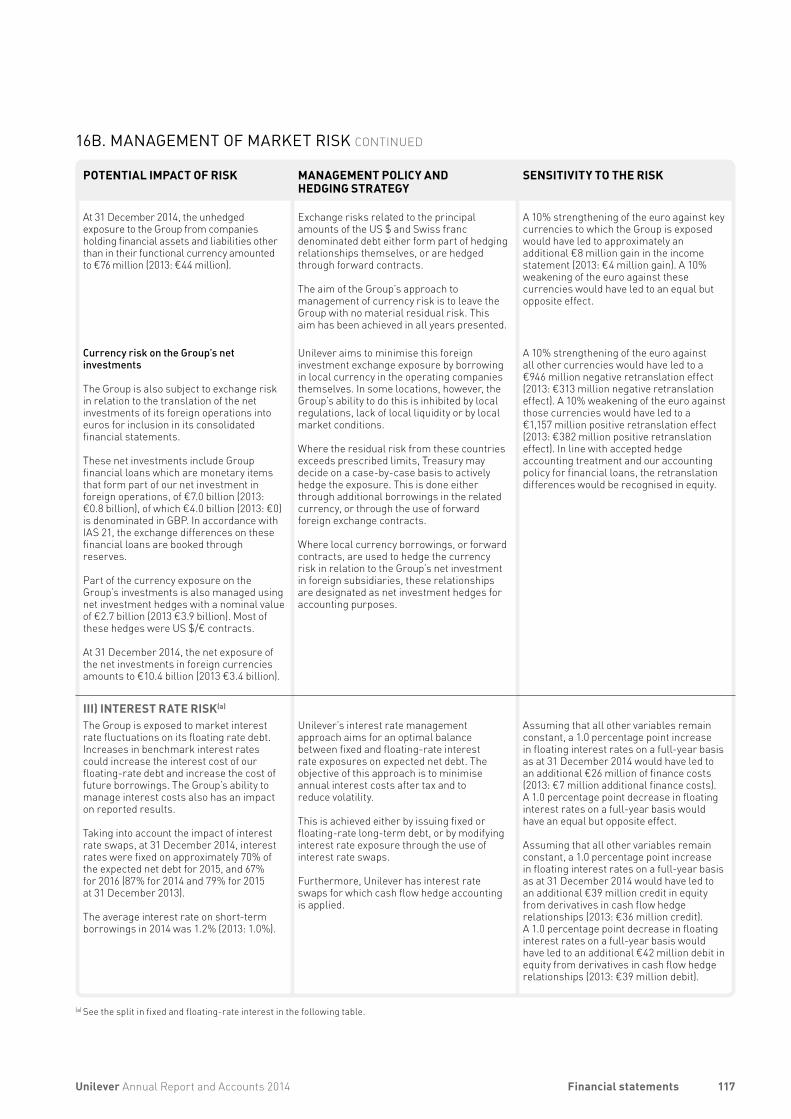
POTENTIAL IMPACT OF RISK MANAGEMENT POLICY AND HEDGING STRATEGY
SENSITIVITY TO THE RISK
At 31 December 2014, the unhedged exposure to the Group from companies holding financial assets and liabilities other than in their functional currency amounted to €76 million (2013: €44 million).
Exchange risks related to the principal amounts of the US $ and Swiss franc denominated debt either form part of hedging relationships themselves, or are hedged through forward contracts.
The aim of the Group’s approach to management of currency risk is to leave the Group with no material residual risk. This aim has been achieved in all years presented.
A 10% strengthening of the euro against key currencies to which the Group is exposed would have led to approximately an additional €8 million gain in the income statement (2013: €4 million gain). A 10% weakening of the euro against these currencies would have led to an equal but opposite effect.
Currency risk on the Group’s net investments
The Group is also subject to exchange risk in relation to the translation of the net investments of its foreign operations into euros for inclusion in its consolidated financial statements.
These net investments include Group financial loans which are monetary items that form part of our net investment in foreign operations, of €7.0 billion (2013: €0.8 billion), of which €4.0 billion (2013: €0) is denominated in GBP. In accordance with IAS 21, the exchange differences on these financial loans are booked through reserves.
Part of the currency exposure on the Group’s investments is also managed using net investment hedges with a nominal value of €2.7 billion (2013 €3.9 billion). Most of these hedges were US $/€ contracts.
At 31 December 2014, the net exposure of the net investments in foreign currencies amounts to €10.4 billion (2013 €3.4 billion).
Unilever aims to minimise this foreign investment exchange exposure by borrowing in local currency in the operating companies themselves. In some locations, however, the Group’s ability to do this is inhibited by local regulations, lack of local liquidity or by local market conditions.
Where the residual risk from these countries exceeds prescribed limits, Treasury may decide on a case-by-case basis to actively hedge the exposure. This is done either through additional borrowings in the related currency, or through the use of forward foreign exchange contracts.
Where local currency borrowings, or forward contracts, are used to hedge the currency risk in relation to the Group’s net investment in foreign subsidiaries, these relationships are designated as net investment hedges for accounting purposes.
A 10% strengthening of the euro against all other currencies would have led to a €946 million negative retranslation effect (2013: €313 million negative retranslation effect). A 10% weakening of the euro against those currencies would have led to a €1,157 million positive retranslation effect (2013: €382 million positive retranslation effect). In line with accepted hedge accounting treatment and our accounting policy for financial loans, the retranslation differences would be recognised in equity.
III) INTEREST RATE RISK(a)
The Group is exposed to market interest rate fluctuations on its floating rate debt. Increases in benchmark interest rates could increase the interest cost of our floating-rate debt and increase the cost of future borrowings. The Group’s ability to manage interest costs also has an impact on reported results.
Taking into account the impact of interest rate swaps, at 31 December 2014, interest rates were fixed on approximately 70% of the expected net debt for 2015, and 67% for 2016 (87% for 2014 and 79% for 2015 at 31 December 2013).
The average interest rate on short-term borrowings in 2014 was 1.2% (2013: 1.0%).
Unilever’s interest rate management approach aims for an optimal balance between fixed and floating-rate interest rate exposures on expected net debt. The objective of this approach is to minimise annual interest costs after tax and to reduce volatility.
This is achieved either by issuing fixed or floating-rate long-term debt, or by modifying interest rate exposure through the use of interest rate swaps.
Furthermore, Unilever has interest rate swaps for which cash flow hedge accounting is applied.
Assuming that all other variables remain constant, a 1.0 percentage point increase in floating interest rates on a full-year basis as at 31 December 2014 would have led to an additional €26 million of finance costs (2013: €7 million additional finance costs). A 1.0 percentage point decrease in floating interest rates on a full-year basis would have an equal but opposite effect.
Assuming that all other variables remain constant, a 1.0 percentage point increase in floating interest rates on a full-year basis as at 31 December 2014 would have led to an additional €39 million credit in equity from derivatives in cash flow hedge relationships (2013: €36 million credit). A 1.0 percentage point decrease in floating interest rates on a full-year basis would have led to an additional €42 million debit in equity from derivatives in cash flow hedge relationships (2013: €39 million debit).
(a) See the split in fixed and floating-rate interest in the following table.
117Unilever Annual Report and Accounts 2014 Financial statements
16B. MANAGEMENT OF MARKET RISK CONTINUED
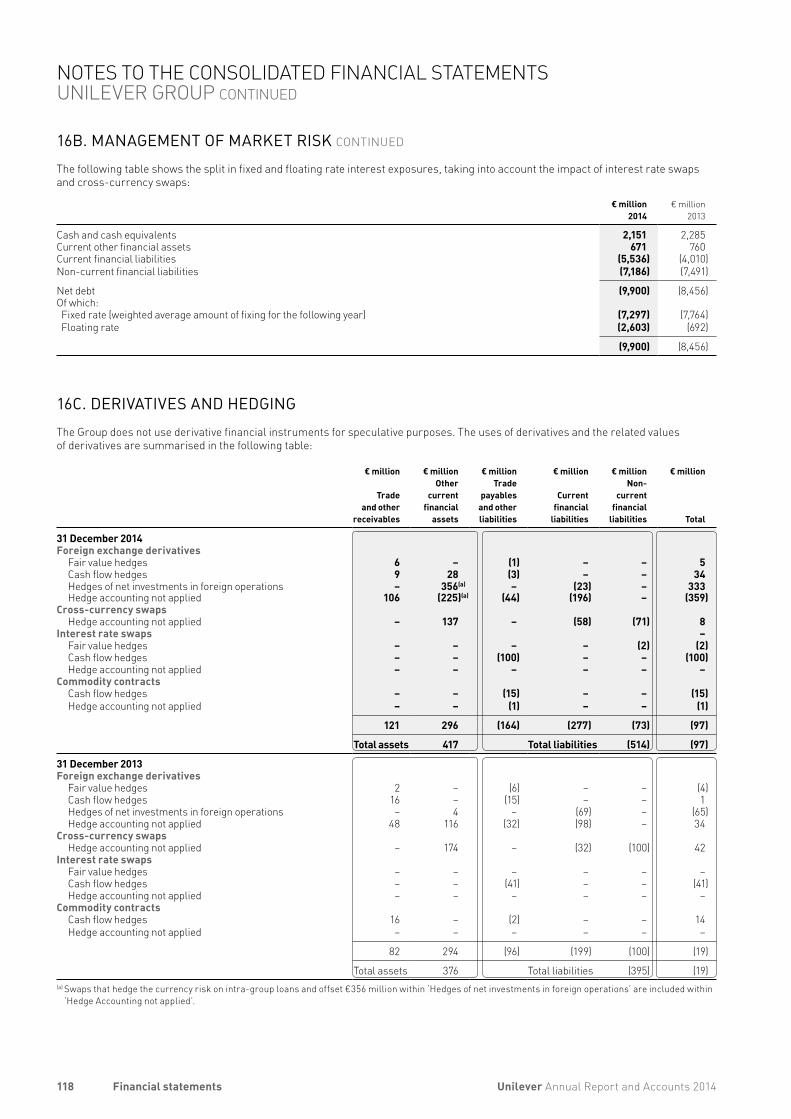
16B. MANAGEMENT OF MARKET RISK CONTINUED
The following table shows the split in fixed and floating rate interest exposures, taking into account the impact of interest rate swaps and cross-currency swaps:
€ million 2014
€ million 2013
Cash and cash equivalents 2,151 2,285Current other financial assets 671 760Current financial liabilities (5,536) (4,010)Non-current financial liabilities (7,186) (7,491)
Net debt (9,900) (8,456)Of which:Fixed rate (weighted average amount of fixing for the following year) (7,297) (7,764)Floating rate (2,603) (692)
(9,900) (8,456)
16C. DERIVATIVES AND HEDGINGThe Group does not use derivative financial instruments for speculative purposes. The uses of derivatives and the related values of derivatives are summarised in the following table:
€ million
Trade and other
receivables
€ millionOther
current financial
assets
€ millionTrade
payables and other liabilities
€ million
Current financial
liabilities
€ millionNon-
current financial
liabilities
€ million
Total
31 December 2014Foreign exchange derivatives
Fair value hedges 6 – (1) – – 5 Cash flow hedges 9 28 (3) – – 34 Hedges of net investments in foreign operations – 356(a) – (23) – 333 Hedge accounting not applied 106 (225)(a) (44) (196) – (359)
Cross-currency swaps Hedge accounting not applied – 137 – (58) (71) 8
Interest rate swaps – Fair value hedges – – – – (2) (2)Cash flow hedges – – (100) – – (100)Hedge accounting not applied – – – – – –
Commodity contractsCash flow hedges – – (15) – – (15)Hedge accounting not applied – – (1) – – (1)
121 296 (164) (277) (73) (97)
Total assets 417 Total liabilities (514) (97)
31 December 2013Foreign exchange derivatives
Fair value hedges 2 – (6) – – (4)Cash flow hedges 16 – (15) – – 1Hedges of net investments in foreign operations – 4 – (69) – (65)Hedge accounting not applied 48 116 (32) (98) – 34
Cross-currency swapsHedge accounting not applied – 174 – (32) (100) 42
Interest rate swapsFair value hedges – – – – – –Cash flow hedges – – (41) – – (41)Hedge accounting not applied – – – – – –
Commodity contractsCash flow hedges 16 – (2) – – 14Hedge accounting not applied – – – – – –
82 294 (96) (199) (100) (19)
Total assets 376 Total liabilities (395) (19)(a) Swaps that hedge the currency risk on intra-group loans and offset €356 million within ‘Hedges of net investments in foreign operations’ are included within
‘Hedge Accounting not applied’.
118 Unilever Annual Report and Accounts 2014Financial statements
NOTES TO THE CONSOLIDATED FINANCIAL STATEMENTS UNILEVER GROUP CONTINUED
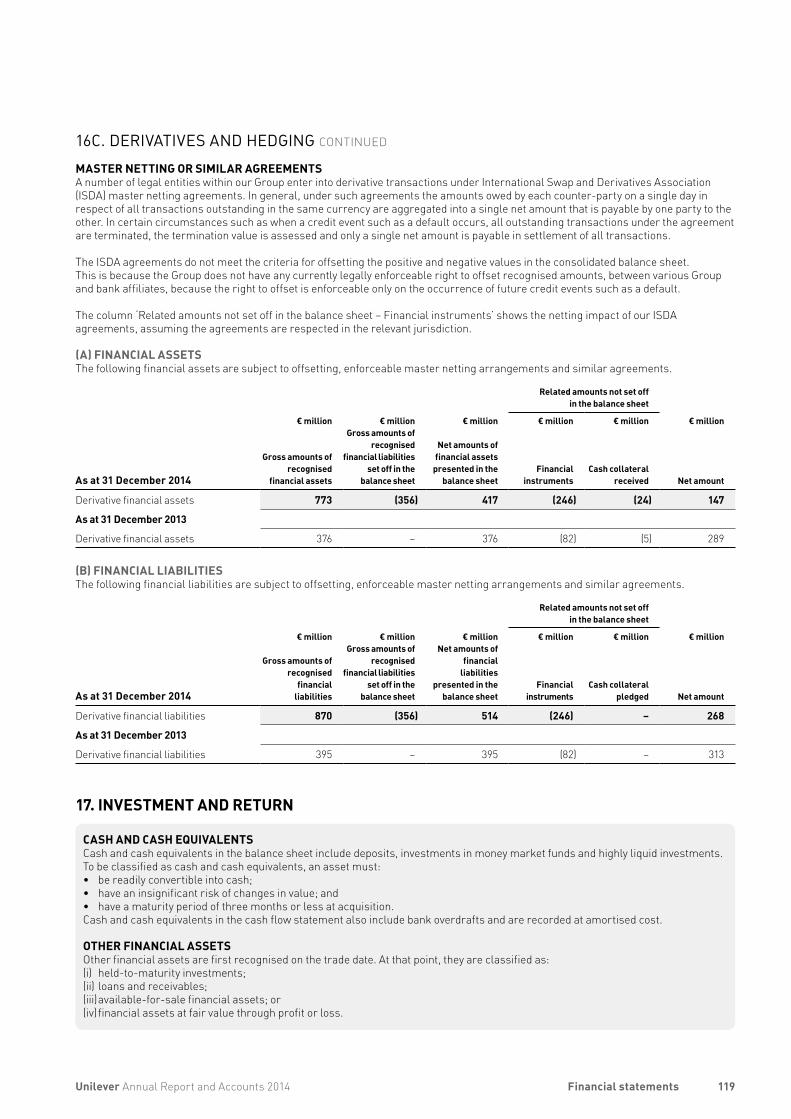
16C. DERIVATIVES AND HEDGING CONTINUED
MASTER NETTING OR SIMILAR AGREEMENTSA number of legal entities within our Group enter into derivative transactions under International Swap and Derivatives Association (ISDA) master netting agreements. In general, under such agreements the amounts owed by each counter-party on a single day in respect of all transactions outstanding in the same currency are aggregated into a single net amount that is payable by one party to the other. In certain circumstances such as when a credit event such as a default occurs, all outstanding transactions under the agreement are terminated, the termination value is assessed and only a single net amount is payable in settlement of all transactions.
The ISDA agreements do not meet the criteria for offsetting the positive and negative values in the consolidated balance sheet.This is because the Group does not have any currently legally enforceable right to offset recognised amounts, between various Group and bank affiliates, because the right to offset is enforceable only on the occurrence of future credit events such as a default.
The column ‘Related amounts not set off in the balance sheet – Financial instruments’ shows the netting impact of our ISDA agreements, assuming the agreements are respected in the relevant jurisdiction.
(A) FINANCIAL ASSETSThe following financial assets are subject to offsetting, enforceable master netting arrangements and similar agreements.
Related amounts not set off in the balance sheet
As at 31 December 2014
€ million
Gross amounts of recognised
financial assets
€ millionGross amounts of
recognised financial liabilities
set off in the balance sheet
€ million
Net amounts of financial assets
presented in the balance sheet
€ million
Financial instruments
€ million
Cash collateralreceived
€ million
Net amount
Derivative financial assets 773 (356) 417 (246) (24) 147
As at 31 December 2013
Derivative financial assets 376 – 376 (82) (5) 289
(B) FINANCIAL LIABILITIESThe following financial liabilities are subject to offsetting, enforceable master netting arrangements and similar agreements.
Related amounts not set off in the balance sheet
As at 31 December 2014
€ million
Gross amounts of recognised
financial liabilities
€ millionGross amounts of
recognised financial liabilities
set off in the balance sheet
€ millionNet amounts of
financial liabilities
presented in the balance sheet
€ million
Financial instruments
€ million
Cash collateral pledged
€ million
Net amount
Derivative financial liabilities 870 (356) 514 (246) – 268
As at 31 December 2013
Derivative financial liabilities 395 – 395 (82) – 313
17. INVESTMENT AND RETURN
CASH AND CASH EQUIVALENTSCash and cash equivalents in the balance sheet include deposits, investments in money market funds and highly liquid investments. To be classified as cash and cash equivalents, an asset must:• be readily convertible into cash; • have an insignificant risk of changes in value; and• have a maturity period of three months or less at acquisition.Cash and cash equivalents in the cash flow statement also include bank overdrafts and are recorded at amortised cost.
OTHER FINANCIAL ASSETSOther financial assets are first recognised on the trade date. At that point, they are classified as: (i) held-to-maturity investments;(ii) loans and receivables;(iii) available-for-sale financial assets; or(iv) financial assets at fair value through profit or loss.
119Unilever Annual Report and Accounts 2014 Financial statements
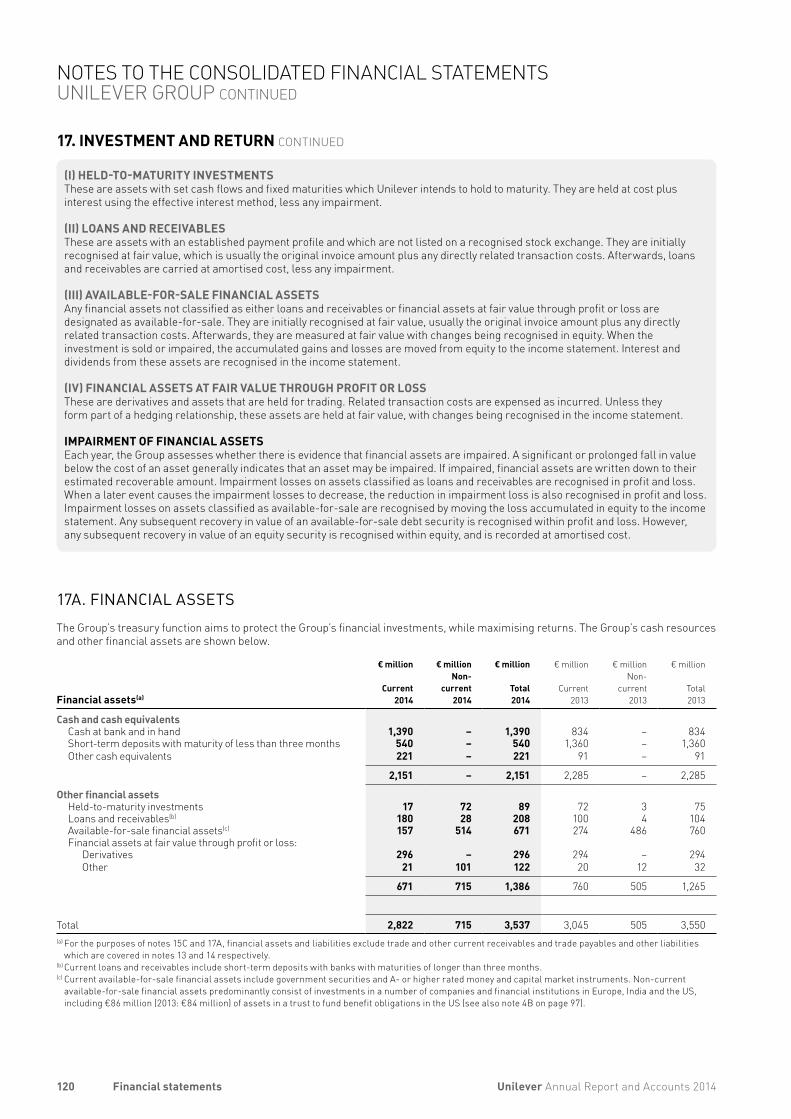
17. INVESTMENT AND RETURN CONTINUED
(I) HELD-TO-MATURITY INVESTMENTSThese are assets with set cash flows and fixed maturities which Unilever intends to hold to maturity. They are held at cost plus interest using the effective interest method, less any impairment.
(II) LOANS AND RECEIVABLESThese are assets with an established payment profile and which are not listed on a recognised stock exchange. They are initially recognised at fair value, which is usually the original invoice amount plus any directly related transaction costs. Afterwards, loans and receivables are carried at amortised cost, less any impairment.
(III) AVAILABLE-FOR-SALE FINANCIAL ASSETSAny financial assets not classified as either loans and receivables or financial assets at fair value through profit or loss are designated as available-for-sale. They are initially recognised at fair value, usually the original invoice amount plus any directly related transaction costs. Afterwards, they are measured at fair value with changes being recognised in equity. When the investment is sold or impaired, the accumulated gains and losses are moved from equity to the income statement. Interest and dividends from these assets are recognised in the income statement.
(IV) FINANCIAL ASSETS AT FAIR VALUE THROUGH PROFIT OR LOSSThese are derivatives and assets that are held for trading. Related transaction costs are expensed as incurred. Unless they form part of a hedging relationship, these assets are held at fair value, with changes being recognised in the income statement.
IMPAIRMENT OF FINANCIAL ASSETSEach year, the Group assesses whether there is evidence that financial assets are impaired. A significant or prolonged fall in value below the cost of an asset generally indicates that an asset may be impaired. If impaired, financial assets are written down to their estimated recoverable amount. Impairment losses on assets classified as loans and receivables are recognised in profit and loss. When a later event causes the impairment losses to decrease, the reduction in impairment loss is also recognised in profit and loss. Impairment losses on assets classified as available-for-sale are recognised by moving the loss accumulated in equity to the income statement. Any subsequent recovery in value of an available-for-sale debt security is recognised within profit and loss. However, any subsequent recovery in value of an equity security is recognised within equity, and is recorded at amortised cost.
17A. FINANCIAL ASSETSThe Group’s treasury function aims to protect the Group’s financial investments, while maximising returns. The Group’s cash resources and other financial assets are shown below.
Financial assets(a)
€ million
Current2014
€ millionNon-
current2014
€ million
Total2014
€ million
Current2013
€ millionNon-
current2013
€ million
Total2013
Cash and cash equivalentsCash at bank and in hand 1,390 – 1,390 834 – 834Short-term deposits with maturity of less than three months 540 – 540 1,360 – 1,360Other cash equivalents 221 – 221 91 – 91
2,151 – 2,151 2,285 – 2,285
Other financial assetsHeld-to-maturity investments 17 72 89 72 3 75Loans and receivables(b) 180 28 208 100 4 104Available-for-sale financial assets(c) 157 514 671 274 486 760Financial assets at fair value through profit or loss:
Derivatives 296 – 296 294 – 294Other 21 101 122 20 12 32
671 715 1,386 760 505 1,265
Total 2,822 715 3,537 3,045 505 3,550(a) For the purposes of notes 15C and 17A, financial assets and liabilities exclude trade and other current receivables and trade payables and other liabilities
which are covered in notes 13 and 14 respectively.(b) Current loans and receivables include short-term deposits with banks with maturities of longer than three months.(c) Current available-for-sale financial assets include government securities and A- or higher rated money and capital market instruments. Non-current
available-for-sale financial assets predominantly consist of investments in a number of companies and financial institutions in Europe, India and the US, including €86 million (2013: €84 million) of assets in a trust to fund benefit obligations in the US (see also note 4B on page 97).
120 Unilever Annual Report and Accounts 2014Financial statements
NOTES TO THE CONSOLIDATED FINANCIAL STATEMENTS UNILEVER GROUP CONTINUED
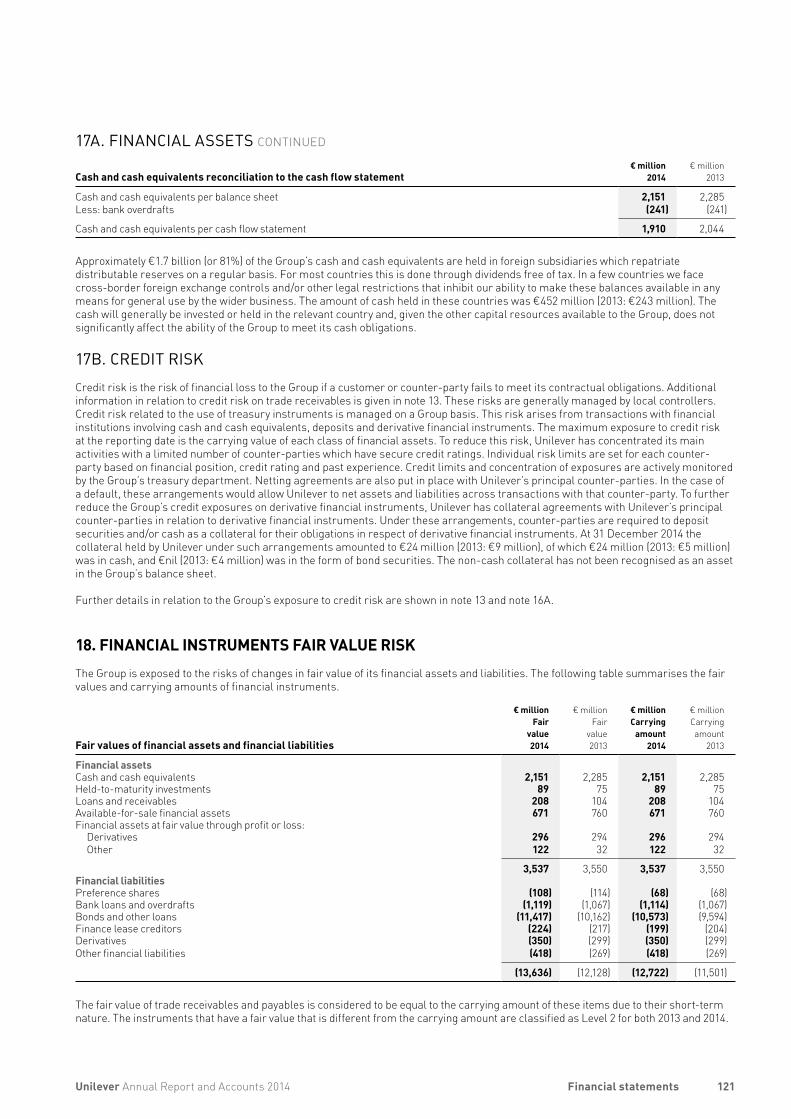
17A. FINANCIAL ASSETS CONTINUED
Cash and cash equivalents reconciliation to the cash flow statement€ million
2014€ million
2013
Cash and cash equivalents per balance sheet 2,151 2,285Less: bank overdrafts (241) (241)
Cash and cash equivalents per cash flow statement 1,910 2,044
Approximately €1.7 billion (or 81%) of the Group’s cash and cash equivalents are held in foreign subsidiaries which repatriate distributable reserves on a regular basis. For most countries this is done through dividends free of tax. In a few countries we face cross-border foreign exchange controls and/or other legal restrictions that inhibit our ability to make these balances available in any means for general use by the wider business. The amount of cash held in these countries was €452 million (2013: €243 million). The cash will generally be invested or held in the relevant country and, given the other capital resources available to the Group, does not significantly affect the ability of the Group to meet its cash obligations.
17B. CREDIT RISKCredit risk is the risk of financial loss to the Group if a customer or counter-party fails to meet its contractual obligations. Additional information in relation to credit risk on trade receivables is given in note 13. These risks are generally managed by local controllers. Credit risk related to the use of treasury instruments is managed on a Group basis. This risk arises from transactions with financial institutions involving cash and cash equivalents, deposits and derivative financial instruments. The maximum exposure to credit risk at the reporting date is the carrying value of each class of financial assets. To reduce this risk, Unilever has concentrated its main activities with a limited number of counter-parties which have secure credit ratings. Individual risk limits are set for each counter-party based on financial position, credit rating and past experience. Credit limits and concentration of exposures are actively monitored by the Group’s treasury department. Netting agreements are also put in place with Unilever’s principal counter-parties. In the case of a default, these arrangements would allow Unilever to net assets and liabilities across transactions with that counter-party. To further reduce the Group’s credit exposures on derivative financial instruments, Unilever has collateral agreements with Unilever’s principal counter-parties in relation to derivative financial instruments. Under these arrangements, counter-parties are required to deposit securities and/or cash as a collateral for their obligations in respect of derivative financial instruments. At 31 December 2014 the collateral held by Unilever under such arrangements amounted to €24 million (2013: €9 million), of which €24 million (2013: €5 million) was in cash, and €nil (2013: €4 million) was in the form of bond securities. The non-cash collateral has not been recognised as an asset in the Group’s balance sheet.
Further details in relation to the Group’s exposure to credit risk are shown in note 13 and note 16A.
18. FINANCIAL INSTRUMENTS FAIR VALUE RISKThe Group is exposed to the risks of changes in fair value of its financial assets and liabilities. The following table summarises the fair values and carrying amounts of financial instruments.
Fair values of financial assets and financial liabilities
€ millionFair
value2014
€ millionFair
value2013
€ millionCarrying
amount2014
€ millionCarryingamount
2013
Financial assetsCash and cash equivalents 2,151 2,285 2,151 2,285Held-to-maturity investments 89 75 89 75Loans and receivables 208 104 208 104Available-for-sale financial assets 671 760 671 760Financial assets at fair value through profit or loss:
Derivatives 296 294 296 294Other 122 32 122 32
3,537 3,550 3,537 3,550Financial liabilitiesPreference shares (108) (114) (68) (68)Bank loans and overdrafts (1,119) (1,067) (1,114) (1,067)Bonds and other loans (11,417) (10,162) (10,573) (9,594)Finance lease creditors (224) (217) (199) (204)Derivatives (350) (299) (350) (299)Other financial liabilities (418) (269) (418) (269)
(13,636) (12,128) (12,722) (11,501)
The fair value of trade receivables and payables is considered to be equal to the carrying amount of these items due to their short-term nature. The instruments that have a fair value that is different from the carrying amount are classified as Level 2 for both 2013 and 2014.
121Unilever Annual Report and Accounts 2014 Financial statements
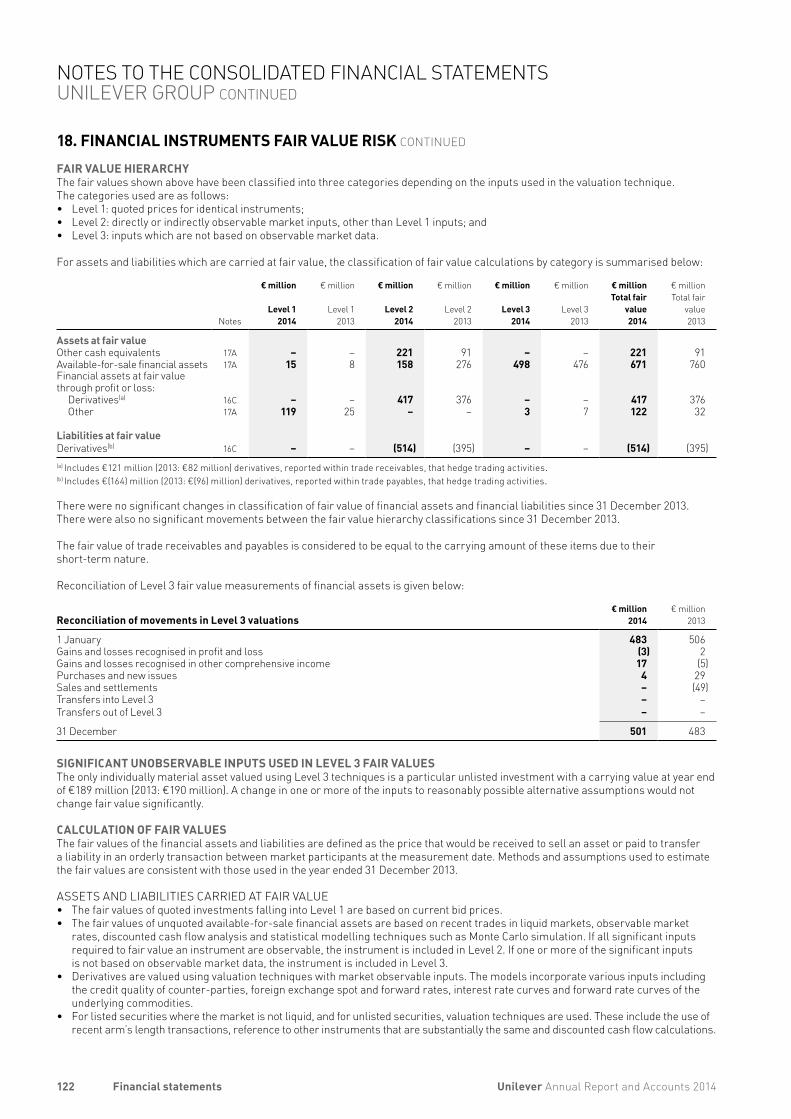
18. FINANCIAL INSTRUMENTS FAIR VALUE RISK CONTINUED
FAIR VALUE HIERARCHYThe fair values shown above have been classified into three categories depending on the inputs used in the valuation technique. The categories used are as follows:• Level 1: quoted prices for identical instruments;• Level 2: directly or indirectly observable market inputs, other than Level 1 inputs; and• Level 3: inputs which are not based on observable market data.
For assets and liabilities which are carried at fair value, the classification of fair value calculations by category is summarised below:
Notes
€ million
Level 12014
€ million
Level 12013
€ million
Level 22014
€ million
Level 22013
€ million
Level 3 2014
€ million
Level 3 2013
€ millionTotal fair
value 2014
€ millionTotal fair
value 2013
Assets at fair valueOther cash equivalents 17A – – 221 91 – – 221 91Available-for-sale financial assets 17A 15 8 158 276 498 476 671 760Financial assets at fair value through profit or loss:
Derivatives(a) 16C – – 417 376 – – 417 376Other 17A 119 25 – – 3 7 122 32
Liabilities at fair valueDerivatives(b) 16C – – (514) (395) – – (514) (395)(a) Includes €121 million (2013: €82 million) derivatives, reported within trade receivables, that hedge trading activities.(b) Includes €(164) million (2013: €(96) million) derivatives, reported within trade payables, that hedge trading activities.
There were no significant changes in classification of fair value of financial assets and financial liabilities since 31 December 2013. There were also no significant movements between the fair value hierarchy classifications since 31 December 2013.
The fair value of trade receivables and payables is considered to be equal to the carrying amount of these items due to their short-term nature.
Reconciliation of Level 3 fair value measurements of financial assets is given below:
Reconciliation of movements in Level 3 valuations€ million
2014€ million
2013
1 January 483 506Gains and losses recognised in profit and loss (3) 2Gains and losses recognised in other comprehensive income 17 (5)Purchases and new issues 4 29Sales and settlements – (49)Transfers into Level 3 – –Transfers out of Level 3 – –
31 December 501 483
SIGNIFICANT UNOBSERVABLE INPUTS USED IN LEVEL 3 FAIR VALUESThe only individually material asset valued using Level 3 techniques is a particular unlisted investment with a carrying value at year end of €189 million (2013: €190 million). A change in one or more of the inputs to reasonably possible alternative assumptions would not change fair value significantly.
CALCULATION OF FAIR VALUESThe fair values of the financial assets and liabilities are defined as the price that would be received to sell an asset or paid to transfer a liability in an orderly transaction between market participants at the measurement date. Methods and assumptions used to estimate the fair values are consistent with those used in the year ended 31 December 2013.
ASSETS AND LIABILITIES CARRIED AT FAIR VALUE• The fair values of quoted investments falling into Level 1 are based on current bid prices. • The fair values of unquoted available-for-sale financial assets are based on recent trades in liquid markets, observable market
rates, discounted cash flow analysis and statistical modelling techniques such as Monte Carlo simulation. If all significant inputs required to fair value an instrument are observable, the instrument is included in Level 2. If one or more of the significant inputs is not based on observable market data, the instrument is included in Level 3.
• Derivatives are valued using valuation techniques with market observable inputs. The models incorporate various inputs including the credit quality of counter-parties, foreign exchange spot and forward rates, interest rate curves and forward rate curves of the underlying commodities.
• For listed securities where the market is not liquid, and for unlisted securities, valuation techniques are used. These include the use of recent arm’s length transactions, reference to other instruments that are substantially the same and discounted cash flow calculations.
122 Unilever Annual Report and Accounts 2014Financial statements
NOTES TO THE CONSOLIDATED FINANCIAL STATEMENTS UNILEVER GROUP CONTINUED
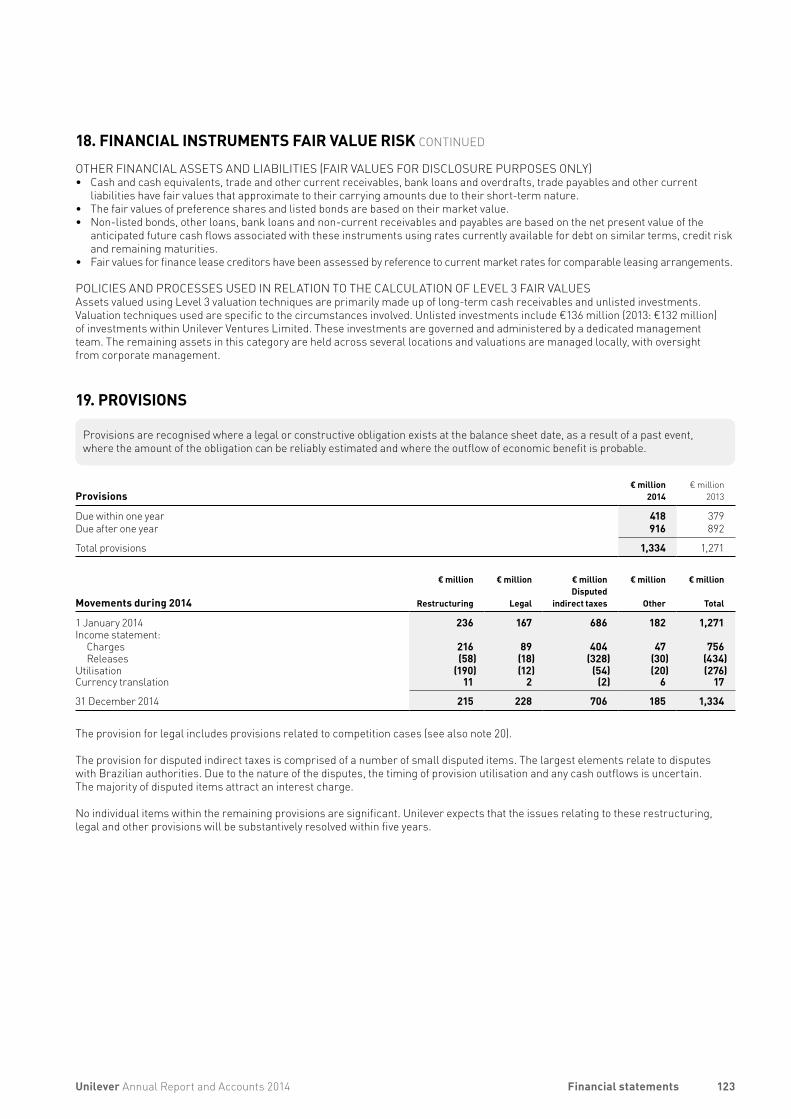
18. FINANCIAL INSTRUMENTS FAIR VALUE RISK CONTINUED
OTHER FINANCIAL ASSETS AND LIABILITIES (FAIR VALUES FOR DISCLOSURE PURPOSES ONLY)• Cash and cash equivalents, trade and other current receivables, bank loans and overdrafts, trade payables and other current
liabilities have fair values that approximate to their carrying amounts due to their short-term nature.• The fair values of preference shares and listed bonds are based on their market value.• Non-listed bonds, other loans, bank loans and non-current receivables and payables are based on the net present value of the
anticipated future cash flows associated with these instruments using rates currently available for debt on similar terms, credit risk and remaining maturities.
• Fair values for finance lease creditors have been assessed by reference to current market rates for comparable leasing arrangements.
POLICIES AND PROCESSES USED IN RELATION TO THE CALCULATION OF LEVEL 3 FAIR VALUESAssets valued using Level 3 valuation techniques are primarily made up of long-term cash receivables and unlisted investments. Valuation techniques used are specific to the circumstances involved. Unlisted investments include €136 million (2013: €132 million) of investments within Unilever Ventures Limited. These investments are governed and administered by a dedicated management team. The remaining assets in this category are held across several locations and valuations are managed locally, with oversight from corporate management.
19. PROVISIONS
Provisions are recognised where a legal or constructive obligation exists at the balance sheet date, as a result of a past event, where the amount of the obligation can be reliably estimated and where the outflow of economic benefit is probable.
Provisions€ million
2014€ million
2013
Due within one year 418 379Due after one year 916 892
Total provisions 1,334 1,271
Movements during 2014
€ million
Restructuring
€ million
Legal
€ millionDisputed
indirect taxes
€ million
Other
€ million
Total
1 January 2014 236 167 686 182 1,271 Income statement:
Charges 216 89 404 47 756Releases (58) (18) (328) (30) (434)
Utilisation (190) (12) (54) (20) (276)Currency translation 11 2 (2) 6 17
31 December 2014 215 228 706 185 1,334
The provision for legal includes provisions related to competition cases (see also note 20).
The provision for disputed indirect taxes is comprised of a number of small disputed items. The largest elements relate to disputes with Brazilian authorities. Due to the nature of the disputes, the timing of provision utilisation and any cash outflows is uncertain. The majority of disputed items attract an interest charge.
No individual items within the remaining provisions are significant. Unilever expects that the issues relating to these restructuring, legal and other provisions will be substantively resolved within five years.
123Unilever Annual Report and Accounts 2014 Financial statements
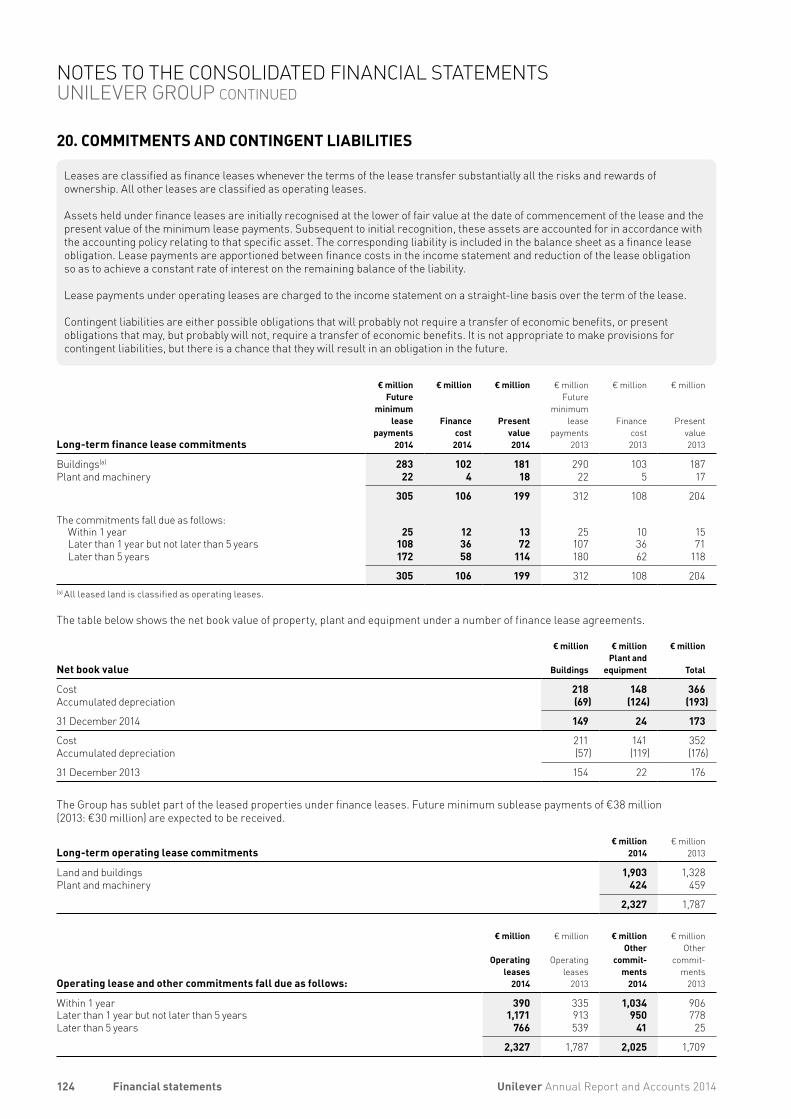
20. COMMITMENTS AND CONTINGENT LIABILITIES
Leases are classified as finance leases whenever the terms of the lease transfer substantially all the risks and rewards of ownership. All other leases are classified as operating leases.
Assets held under finance leases are initially recognised at the lower of fair value at the date of commencement of the lease and the present value of the minimum lease payments. Subsequent to initial recognition, these assets are accounted for in accordance with the accounting policy relating to that specific asset. The corresponding liability is included in the balance sheet as a finance lease obligation. Lease payments are apportioned between finance costs in the income statement and reduction of the lease obligation so as to achieve a constant rate of interest on the remaining balance of the liability.
Lease payments under operating leases are charged to the income statement on a straight-line basis over the term of the lease.
Contingent liabilities are either possible obligations that will probably not require a transfer of economic benefits, or present obligations that may, but probably will not, require a transfer of economic benefits. It is not appropriate to make provisions for contingent liabilities, but there is a chance that they will result in an obligation in the future.
Long-term finance lease commitments
€ millionFuture
minimumlease
payments2014
€ million
Financecost
2014
€ million
Presentvalue2014
€ millionFuture
minimumlease
payments2013
€ million
Financecost2013
€ million
Presentvalue2013
Buildings(a) 283 102 181 290 103 187Plant and machinery 22 4 18 22 5 17
305 106 199 312 108 204
The commitments fall due as follows:Within 1 year 25 12 13 25 10 15Later than 1 year but not later than 5 years 108 36 72 107 36 71Later than 5 years 172 58 114 180 62 118
305 106 199 312 108 204(a) All leased land is classified as operating leases.
The table below shows the net book value of property, plant and equipment under a number of finance lease agreements.
Net book value
€ million
Buildings
€ millionPlant and
equipment
€ million
Total
Cost 218 148 366 Accumulated depreciation (69) (124) (193)
31 December 2014 149 24 173
Cost 211 141 352Accumulated depreciation (57) (119) (176)
31 December 2013 154 22 176
The Group has sublet part of the leased properties under finance leases. Future minimum sublease payments of €38 million (2013: €30 million) are expected to be received.
Long-term operating lease commitments
€ million2014
€ million2013
Land and buildings 1,903 1,328Plant and machinery 424 459
2,327 1,787
Operating lease and other commitments fall due as follows:
€ million
Operatingleases
2014
€ million
Operatingleases
2013
€ millionOther
commit-ments
2014
€ millionOther
commit-ments
2013
Within 1 year 390 335 1,034 906Later than 1 year but not later than 5 years 1,171 913 950 778Later than 5 years 766 539 41 25
2,327 1,787 2,025 1,709
124 Unilever Annual Report and Accounts 2014Financial statements
NOTES TO THE CONSOLIDATED FINANCIAL STATEMENTS UNILEVER GROUP CONTINUED
20. COMMITMENTS AND CONTINGENT LIABILITIES CONTINUED
The Group has sublet part of the leased properties under operating leases. Future minimum sublease payments of €7 million (2013: €12 million) are expected to be received.
Other commitments principally comprise commitments under contracts to purchase materials and services. They do not include commitments for capital expenditure, which are reported in note 10 on page 105.
Contingent liabilities arise in respect of litigation against group companies, investigations by competition, regulatory and fiscal authorities and obligations arising under environmental legislation. The estimated total of such contingent liabilities at 31 December 2014 was €1,406 million (2013: €719 million) of which €1,250 million (2013: €561 million) represents the maximum exposure related to assessments in Brazil regarding a local corporate reorganisation in 2001, as explained further below. The Group does not believe that any of these contingent liabilities will result in a material loss.
LEGAL PROCEEDINGS The Group is involved from time to time in legal and arbitration proceedings arising in the ordinary course of business.
As previously disclosed, along with other consumer products companies and retail customers, Unilever is involved in a number of ongoing investigations by national competition authorities. These proceedings and investigations are at various stages and concern a variety of product markets. In the second half of 2013 Unilever recognised provisions of €120 million related to these cases, disclosed within non-core items. In the second half of 2014 these provisions were increased by a further €30 million.
Ongoing compliance with competition laws is of key importance to Unilever. It is Unilever’s policy to co-operate fully with competition authorities whenever questions or issues arise. In addition, the Group continues to reinforce and enhance our internal competition law compliance programme on an ongoing basis. As disclosed above, where specific issues arise provisions are made and contingent liabilities disclosed to the extent appropriate.
During 2004 in Brazil, and in common with many other businesses operating in that country, one of our Brazilian subsidiaries received a notice of infringement from the Federal Revenue Service. The notice alleges that a 2001 reorganisation of our local corporate structure was undertaken without valid business purpose. The 2001 reorganisation was comparable with restructurings done by many companies in Brazil. The original dispute was resolved in the courts in the Group’s favour. However, in 2013 a new assessment was raised in respect of a similar matter. Additionally, during the course of 2014 another notice of infringement was issued based on the same grounds argued in the previous assessments. The Group believes that the likelihood of a successful challenge by the tax authorities is low, however, there can be no guarantee of success in court.
In many markets, there is a high degree of complexity involved in the local tax regimes. In common with other businesses operating in this environment, the Group is required to exercise judgement in the assessment of any potential exposures in these areas. Where appropriate, the Group will make provisions or disclose contingencies in accordance with the relevant accounting principles.
21. ACQUISITIONS AND DISPOSALS
Business combinations are accounted for using the acquisition accounting method as at the acquisition date, which is the date at which control is transferred to the Group.
Goodwill is measured at the acquisition date as the fair value of consideration transferred, plus non-controlling interests and the fair value of any previously held equity interests less the net recognised amount (which is generally fair value) of the identifiable assets and liabilities assumed. Consideration transferred does not include amounts related to settlement of pre-existing relationships. Such amounts are generally recognised in net profit.
Transaction costs are expensed as incurred, other than those incurred in relation to the issue of debt or equity securities. Any contingent consideration payable is measured at fair value at the acquisition date. Subsequent changes in the fair value of contingent consideration are recognised in net profit.
Changes in ownership that do not result in a change of control are accounted for as equity transactions and therefore do not have any impact on goodwill. The difference between consideration and the non-controlling share of net assets acquired is recognised within equity.
2014 On 16 January 2014 the Group signed an agreement to sell its Royal pasta brand in the Philippines to RFM Corporation, for US $48 million.
On 7 March 2014 the Group acquired a 55% equity stake in the Qinyuan Group, a leading Chinese water purification business for an undisclosed amount.
On 1 April 2014 the Group completed the sale of its meat snacks business, including the Bifi and Peperami brands, to Jack Link’s for an undisclosed amount.
125Unilever Annual Report and Accounts 2014 Financial statements
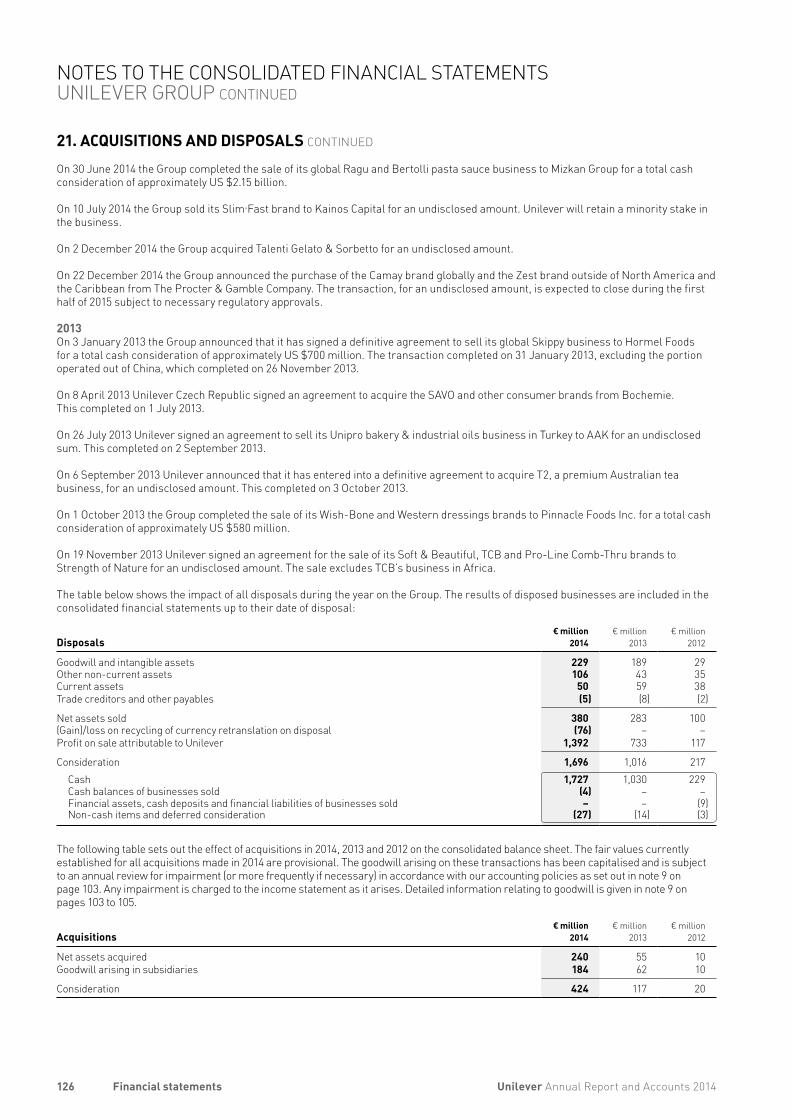
21. ACQUISITIONS AND DISPOSALS CONTINUED
On 30 June 2014 the Group completed the sale of its global Ragu and Bertolli pasta sauce business to Mizkan Group for a total cash consideration of approximately US $2.15 billion.
On 10 July 2014 the Group sold its Slim.Fast brand to Kainos Capital for an undisclosed amount. Unilever will retain a minority stake in the business.
On 2 December 2014 the Group acquired Talenti Gelato & Sorbetto for an undisclosed amount.
On 22 December 2014 the Group announced the purchase of the Camay brand globally and the Zest brand outside of North America and the Caribbean from The Procter & Gamble Company. The transaction, for an undisclosed amount, is expected to close during the first half of 2015 subject to necessary regulatory approvals.
2013 On 3 January 2013 the Group announced that it has signed a definitive agreement to sell its global Skippy business to Hormel Foods for a total cash consideration of approximately US $700 million. The transaction completed on 31 January 2013, excluding the portion operated out of China, which completed on 26 November 2013. On 8 April 2013 Unilever Czech Republic signed an agreement to acquire the SAVO and other consumer brands from Bochemie. This completed on 1 July 2013. On 26 July 2013 Unilever signed an agreement to sell its Unipro bakery & industrial oils business in Turkey to AAK for an undisclosed sum. This completed on 2 September 2013. On 6 September 2013 Unilever announced that it has entered into a definitive agreement to acquire T2, a premium Australian tea business, for an undisclosed amount. This completed on 3 October 2013.
On 1 October 2013 the Group completed the sale of its Wish-Bone and Western dressings brands to Pinnacle Foods Inc. for a total cash consideration of approximately US $580 million.
On 19 November 2013 Unilever signed an agreement for the sale of its Soft & Beautiful, TCB and Pro-Line Comb-Thru brands to Strength of Nature for an undisclosed amount. The sale excludes TCB’s business in Africa.
The table below shows the impact of all disposals during the year on the Group. The results of disposed businesses are included in the consolidated financial statements up to their date of disposal:
Disposals€ million
2014€ million
2013€ million
2012
Goodwill and intangible assets 229 189 29Other non-current assets 106 43 35Current assets 50 59 38Trade creditors and other payables (5) (8) (2)
Net assets sold 380 283 100(Gain)/loss on recycling of currency retranslation on disposal (76) – –Profit on sale attributable to Unilever 1,392 733 117
Consideration 1,696 1,016 217Cash 1,727 1,030 229 Cash balances of businesses sold (4) – –Financial assets, cash deposits and financial liabilities of businesses sold – – (9)Non-cash items and deferred consideration (27) (14) (3)
The following table sets out the effect of acquisitions in 2014, 2013 and 2012 on the consolidated balance sheet. The fair values currently established for all acquisitions made in 2014 are provisional. The goodwill arising on these transactions has been capitalised and is subject to an annual review for impairment (or more frequently if necessary) in accordance with our accounting policies as set out in note 9 on page 103. Any impairment is charged to the income statement as it arises. Detailed information relating to goodwill is given in note 9 on pages 103 to 105.
Acquisitions
€ million2014
€ million2013
€ million2012
Net assets acquired 240 55 10Goodwill arising in subsidiaries 184 62 10
Consideration 424 117 20
126 Unilever Annual Report and Accounts 2014Financial statements
NOTES TO THE CONSOLIDATED FINANCIAL STATEMENTS UNILEVER GROUP CONTINUED
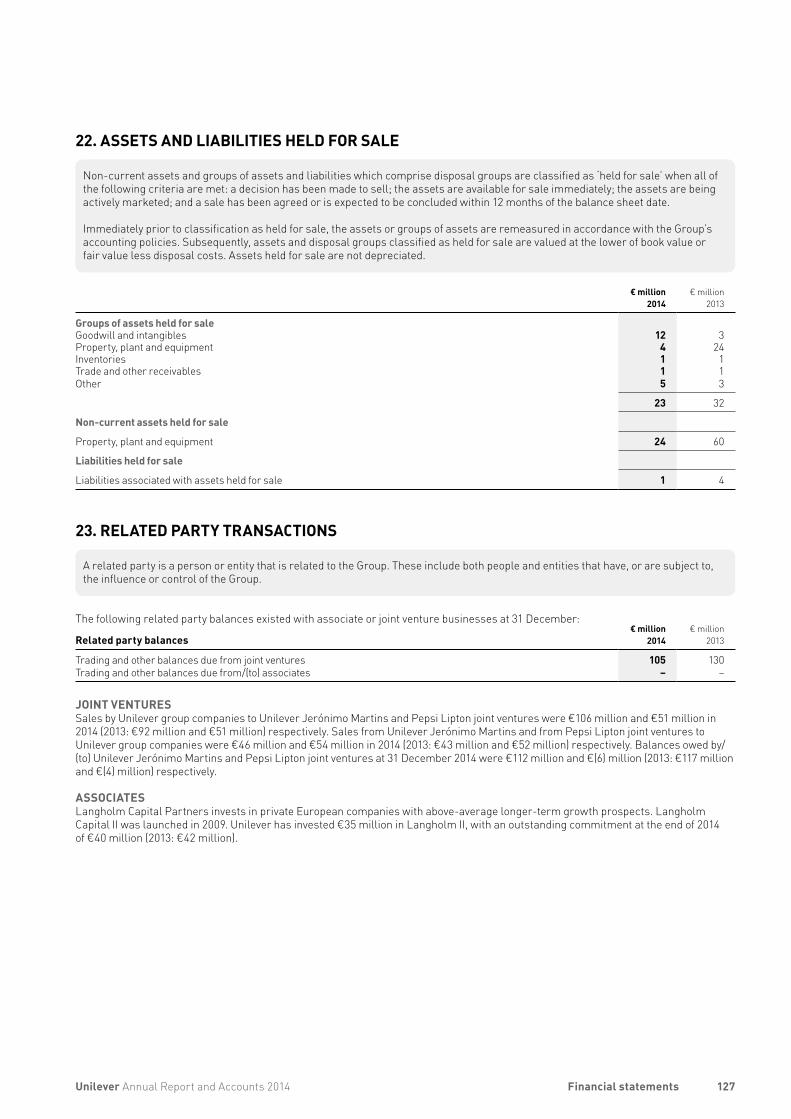
22. ASSETS AND LIABILITIES HELD FOR SALE
Non-current assets and groups of assets and liabilities which comprise disposal groups are classified as ‘held for sale’ when all of the following criteria are met: a decision has been made to sell; the assets are available for sale immediately; the assets are being actively marketed; and a sale has been agreed or is expected to be concluded within 12 months of the balance sheet date.
Immediately prior to classification as held for sale, the assets or groups of assets are remeasured in accordance with the Group’s accounting policies. Subsequently, assets and disposal groups classified as held for sale are valued at the lower of book value or fair value less disposal costs. Assets held for sale are not depreciated.
€ million2014
€ million2013
Groups of assets held for saleGoodwill and intangibles 12 3Property, plant and equipment 4 24Inventories 1 1Trade and other receivables 1 1Other 5 3
23 32
Non-current assets held for sale
Property, plant and equipment 24 60
Liabilities held for sale
Liabilities associated with assets held for sale 1 4
23. RELATED PARTY TRANSACTIONS
A related party is a person or entity that is related to the Group. These include both people and entities that have, or are subject to, the influence or control of the Group.
The following related party balances existed with associate or joint venture businesses at 31 December: Related party balances
€ million2014
€ million2013
Trading and other balances due from joint ventures 105 130Trading and other balances due from/(to) associates – –
JOINT VENTURESSales by Unilever group companies to Unilever Jerónimo Martins and Pepsi Lipton joint ventures were €106 million and €51 million in 2014 (2013: €92 million and €51 million) respectively. Sales from Unilever Jerónimo Martins and from Pepsi Lipton joint ventures to Unilever group companies were €46 million and €54 million in 2014 (2013: €43 million and €52 million) respectively. Balances owed by/(to) Unilever Jerónimo Martins and Pepsi Lipton joint ventures at 31 December 2014 were €112 million and €(6) million (2013: €117 million and €(4) million) respectively.
ASSOCIATESLangholm Capital Partners invests in private European companies with above-average longer-term growth prospects. Langholm Capital II was launched in 2009. Unilever has invested €35 million in Langholm II, with an outstanding commitment at the end of 2014 of €40 million (2013: €42 million).
127Unilever Annual Report and Accounts 2014 Financial statements
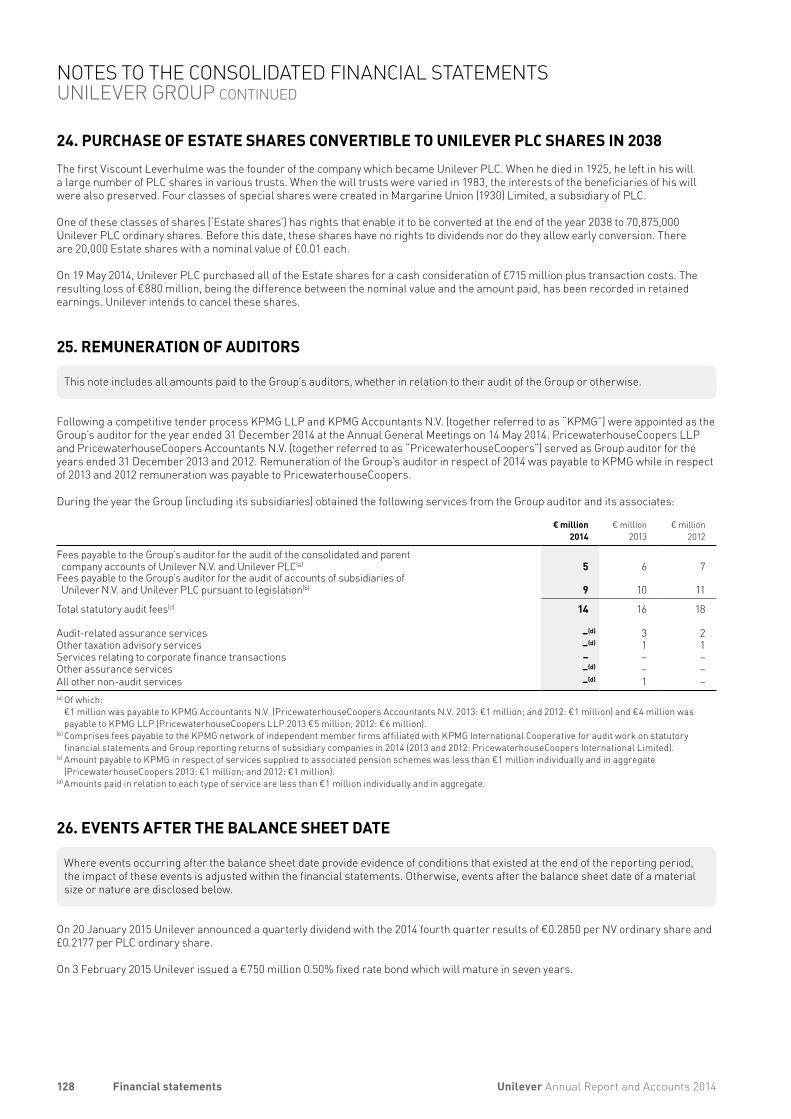
24. PURCHASE OF ESTATE SHARES CONVERTIBLE TO UNILEVER PLC SHARES IN 2038The first Viscount Leverhulme was the founder of the company which became Unilever PLC. When he died in 1925, he left in his will a large number of PLC shares in various trusts. When the will trusts were varied in 1983, the interests of the beneficiaries of his will were also preserved. Four classes of special shares were created in Margarine Union (1930) Limited, a subsidiary of PLC.
One of these classes of shares (‘Estate shares’) has rights that enable it to be converted at the end of the year 2038 to 70,875,000 Unilever PLC ordinary shares. Before this date, these shares have no rights to dividends nor do they allow early conversion. There are 20,000 Estate shares with a nominal value of £0.01 each.
On 19 May 2014, Unilever PLC purchased all of the Estate shares for a cash consideration of £715 million plus transaction costs. The resulting loss of €880 million, being the difference between the nominal value and the amount paid, has been recorded in retained earnings. Unilever intends to cancel these shares.
25. REMUNERATION OF AUDITORS
This note includes all amounts paid to the Group’s auditors, whether in relation to their audit of the Group or otherwise.
Following a competitive tender process KPMG LLP and KPMG Accountants N.V. (together referred to as “KPMG”) were appointed as the Group’s auditor for the year ended 31 December 2014 at the Annual General Meetings on 14 May 2014. PricewaterhouseCoopers LLP and PricewaterhouseCoopers Accountants N.V. (together referred to as “PricewaterhouseCoopers”) served as Group auditor for the years ended 31 December 2013 and 2012. Remuneration of the Group’s auditor in respect of 2014 was payable to KPMG while in respect of 2013 and 2012 remuneration was payable to PricewaterhouseCoopers.
During the year the Group (including its subsidiaries) obtained the following services from the Group auditor and its associates:
€ million2014
€ million2013
€ million2012
Fees payable to the Group’s auditor for the audit of the consolidated and parent company accounts of Unilever N.V. and Unilever PLC(a) 5 6 7
Fees payable to the Group’s auditor for the audit of accounts of subsidiaries of Unilever N.V. and Unilever PLC pursuant to legislation(b) 9 10 11
Total statutory audit fees(c) 14 16 18
Audit-related assurance services –(d) 3 2Other taxation advisory services –(d) 1 1Services relating to corporate finance transactions – – –Other assurance services –(d) – –All other non-audit services –(d) 1 –(a) Of which: €1 million was payable to KPMG Accountants N.V. (PricewaterhouseCoopers Accountants N.V. 2013: €1 million; and 2012: €1 million) and €4 million was
payable to KPMG LLP (PricewaterhouseCoopers LLP 2013 €5 million; 2012: €6 million).(b) Comprises fees payable to the KPMG network of independent member firms affiliated with KPMG International Cooperative for audit work on statutory
financial statements and Group reporting returns of subsidiary companies in 2014 (2013 and 2012: PricewaterhouseCoopers International Limited).(c) Amount payable to KPMG in respect of services supplied to associated pension schemes was less than €1 million individually and in aggregate
(PricewaterhouseCoopers 2013: €1 million; and 2012: €1 million).(d) Amounts paid in relation to each type of service are less than €1 million individually and in aggregate.
26. EVENTS AFTER THE BALANCE SHEET DATE
Where events occurring after the balance sheet date provide evidence of conditions that existed at the end of the reporting period, the impact of these events is adjusted within the financial statements. Otherwise, events after the balance sheet date of a material size or nature are disclosed below.
On 20 January 2015 Unilever announced a quarterly dividend with the 2014 fourth quarter results of €0.2850 per NV ordinary share and £0.2177 per PLC ordinary share.
On 3 February 2015 Unilever issued a €750 million 0.50% fixed rate bond which will mature in seven years.
128 Unilever Annual Report and Accounts 2014Financial statements
NOTES TO THE CONSOLIDATED FINANCIAL STATEMENTS UNILEVER GROUP CONTINUED
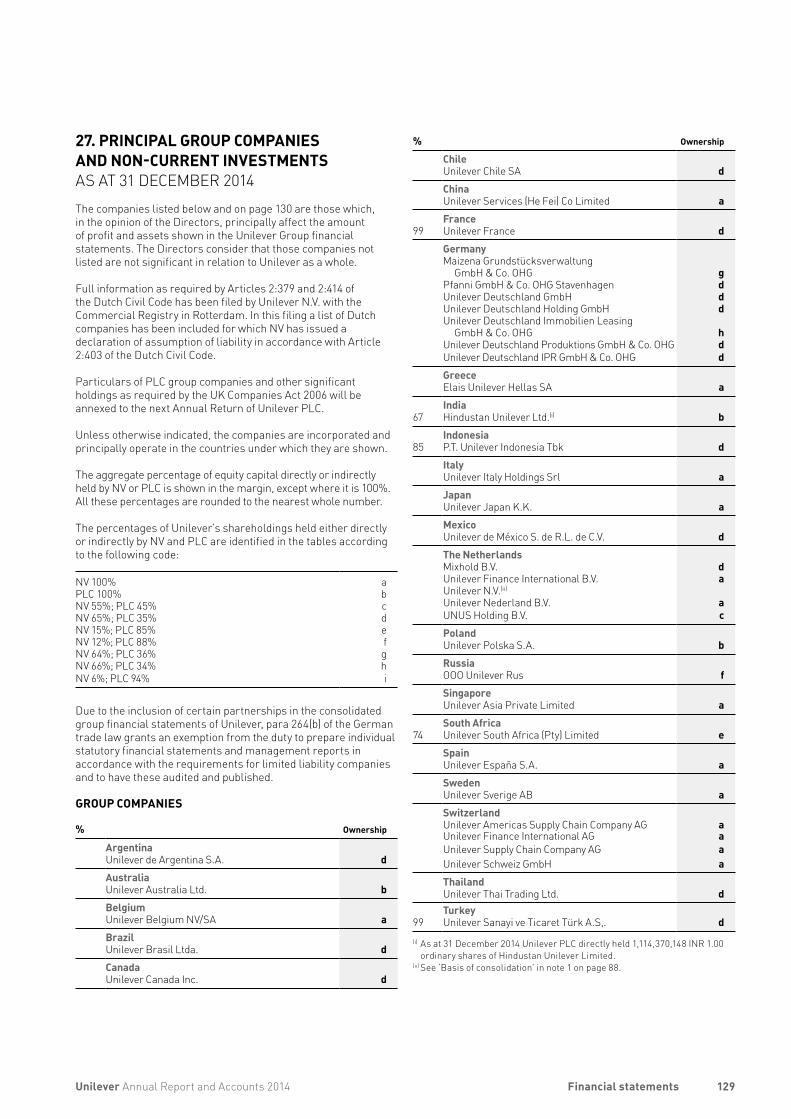
% Ownership
ChileUnilever Chile SA dChinaUnilever Services (He Fei) Co Limited a
99FranceUnilever France dGermanyMaizena Grundstücksverwaltung
GmbH & Co. OHG gPfanni GmbH & Co. OHG Stavenhagen dUnilever Deutschland GmbH dUnilever Deutschland Holding GmbH dUnilever Deutschland Immobilien Leasing
GmbH & Co. OHG hUnilever Deutschland Produktions GmbH & Co. OHG dUnilever Deutschland IPR GmbH & Co. OHG dGreeceElais Unilever Hellas SA a
67IndiaHindustan Unilever Ltd.(i) b
85IndonesiaP.T. Unilever Indonesia Tbk dItalyUnilever Italy Holdings Srl aJapanUnilever Japan K.K. aMexicoUnilever de México S. de R.L. de C.V. dThe NetherlandsMixhold B.V. dUnilever Finance International B.V. aUnilever N.V.(ii) Unilever Nederland B.V. aUNUS Holding B.V. cPolandUnilever Polska S.A. bRussiaOOO Unilever Rus fSingapore Unilever Asia Private Limited a
74South AfricaUnilever South Africa (Pty) Limited eSpain Unilever España S.A. aSwedenUnilever Sverige AB aSwitzerland Unilever Americas Supply Chain Company AG aUnilever Finance International AG aUnilever Supply Chain Company AG aUnilever Schweiz GmbH aThailandUnilever Thai Trading Ltd. d
99TurkeyUnilever Sanayi ve Ticaret Türk A.S,. d
(i) As at 31 December 2014 Unilever PLC directly held 1,114,370,148 INR 1.00 ordinary shares of Hindustan Unilever Limited.
(ii) See ‘Basis of consolidation’ in note 1 on page 88.
27. PRINCIPAL GROUP COMPANIES AND NON-CURRENT INVESTMENTS AS AT 31 DECEMBER 2014The companies listed below and on page 130 are those which, in the opinion of the Directors, principally affect the amount of profit and assets shown in the Unilever Group financial statements. The Directors consider that those companies not listed are not significant in relation to Unilever as a whole.
Full information as required by Articles 2:379 and 2:414 of the Dutch Civil Code has been filed by Unilever N.V. with the Commercial Registry in Rotterdam. In this filing a list of Dutch companies has been included for which NV has issued a declaration of assumption of liability in accordance with Article 2:403 of the Dutch Civil Code.
Particulars of PLC group companies and other significant holdings as required by the UK Companies Act 2006 will be annexed to the next Annual Return of Unilever PLC.
Unless otherwise indicated, the companies are incorporated and principally operate in the countries under which they are shown.
The aggregate percentage of equity capital directly or indirectly held by NV or PLC is shown in the margin, except where it is 100%. All these percentages are rounded to the nearest whole number.
The percentages of Unilever’s shareholdings held either directly or indirectly by NV and PLC are identified in the tables according to the following code:
NV 100% aPLC 100% bNV 55%; PLC 45% cNV 65%; PLC 35% dNV 15%; PLC 85% eNV 12%; PLC 88% fNV 64%; PLC 36% gNV 66%; PLC 34% hNV 6%; PLC 94% i
Due to the inclusion of certain partnerships in the consolidated group financial statements of Unilever, para 264(b) of the German trade law grants an exemption from the duty to prepare individual statutory financial statements and management reports in accordance with the requirements for limited liability companies and to have these audited and published.
GROUP COMPANIES
% Ownership
ArgentinaUnilever de Argentina S.A. dAustraliaUnilever Australia Ltd. bBelgiumUnilever Belgium NV/SA aBrazilUnilever Brasil Ltda. dCanadaUnilever Canada Inc. d
129Unilever Annual Report and Accounts 2014 Financial statements
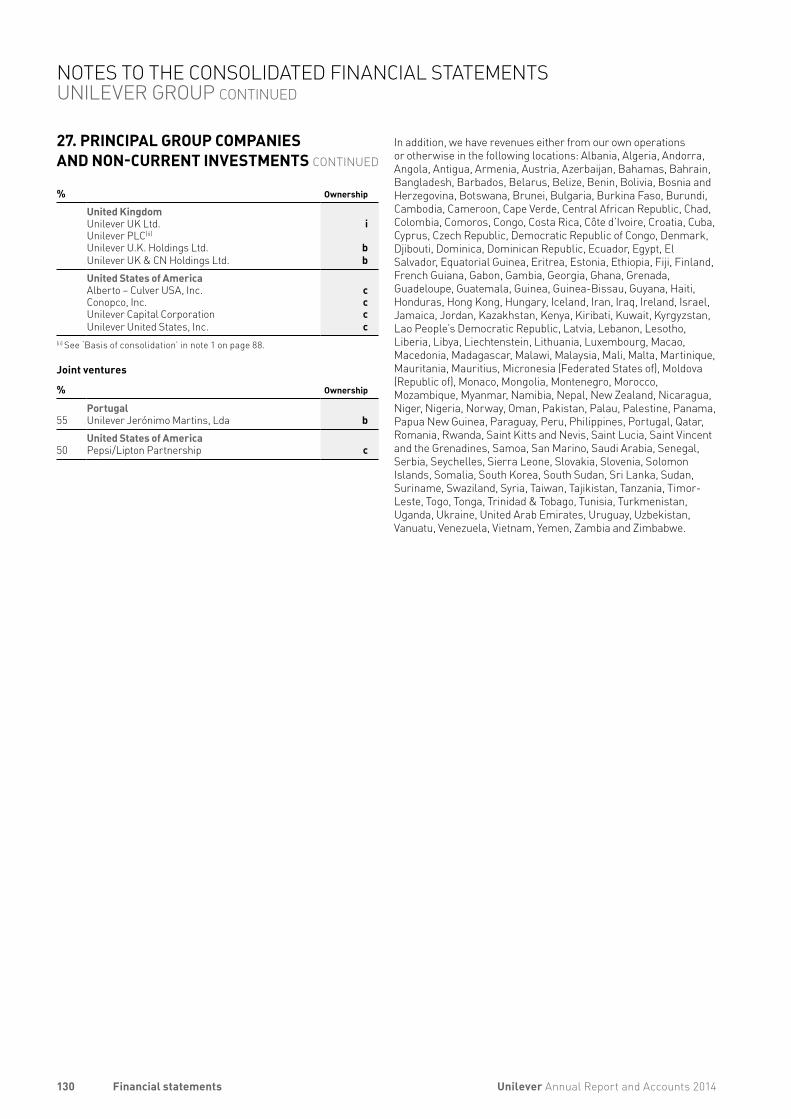
In addition, we have revenues either from our own operations or otherwise in the following locations: Albania, Algeria, Andorra, Angola, Antigua, Armenia, Austria, Azerbaijan, Bahamas, Bahrain, Bangladesh, Barbados, Belarus, Belize, Benin, Bolivia, Bosnia and Herzegovina, Botswana, Brunei, Bulgaria, Burkina Faso, Burundi, Cambodia, Cameroon, Cape Verde, Central African Republic, Chad, Colombia, Comoros, Congo, Costa Rica, Côte d’Ivoire, Croatia, Cuba, Cyprus, Czech Republic, Democratic Republic of Congo, Denmark, Djibouti, Dominica, Dominican Republic, Ecuador, Egypt, El Salvador, Equatorial Guinea, Eritrea, Estonia, Ethiopia, Fiji, Finland, French Guiana, Gabon, Gambia, Georgia, Ghana, Grenada, Guadeloupe, Guatemala, Guinea, Guinea-Bissau, Guyana, Haiti, Honduras, Hong Kong, Hungary, Iceland, Iran, Iraq, Ireland, Israel, Jamaica, Jordan, Kazakhstan, Kenya, Kiribati, Kuwait, Kyrgyzstan, Lao People’s Democratic Republic, Latvia, Lebanon, Lesotho, Liberia, Libya, Liechtenstein, Lithuania, Luxembourg, Macao, Macedonia, Madagascar, Malawi, Malaysia, Mali, Malta, Martinique, Mauritania, Mauritius, Micronesia (Federated States of), Moldova (Republic of), Monaco, Mongolia, Montenegro, Morocco, Mozambique, Myanmar, Namibia, Nepal, New Zealand, Nicaragua, Niger, Nigeria, Norway, Oman, Pakistan, Palau, Palestine, Panama, Papua New Guinea, Paraguay, Peru, Philippines, Portugal, Qatar, Romania, Rwanda, Saint Kitts and Nevis, Saint Lucia, Saint Vincent and the Grenadines, Samoa, San Marino, Saudi Arabia, Senegal, Serbia, Seychelles, Sierra Leone, Slovakia, Slovenia, Solomon Islands, Somalia, South Korea, South Sudan, Sri Lanka, Sudan, Suriname, Swaziland, Syria, Taiwan, Tajikistan, Tanzania, Timor-Leste, Togo, Tonga, Trinidad & Tobago, Tunisia, Turkmenistan, Uganda, Ukraine, United Arab Emirates, Uruguay, Uzbekistan, Vanuatu, Venezuela, Vietnam, Yemen, Zambia and Zimbabwe.
% Ownership
United Kingdom Unilever UK Ltd. iUnilever PLC(ii) Unilever U.K. Holdings Ltd. bUnilever UK & CN Holdings Ltd. bUnited States of America Alberto – Culver USA, Inc. cConopco, Inc. cUnilever Capital Corporation cUnilever United States, Inc. c
(ii) See ‘Basis of consolidation’ in note 1 on page 88.
Joint ventures
% Ownership
55PortugalUnilever Jerónimo Martins, Lda b
50United States of America Pepsi/Lipton Partnership c
27. PRINCIPAL GROUP COMPANIES AND NON-CURRENT INVESTMENTS CONTINUED
130 Unilever Annual Report and Accounts 2014Financial statements
NOTES TO THE CONSOLIDATED FINANCIAL STATEMENTS UNILEVER GROUP CONTINUED

BALANCE SHEET AS AT 31 DECEMBER
€ million2014
€ million2013
Intangible assets 1,217 1,311Investments in subsidiaries 29,240 28,381Debtors due after more than one year 782 –
Total non-current assets 31,239 29,692
Debtors due within one year 4,462 4,960Deferred taxation – 19Cash at bank and in hand 5 3
Total current assets 4,467 4,982Liabilities due within one year (26,181) (24,561)
Net current assets/(liabilities) (21,714) (19,579)
Total assets less current liabilities 9,525 10,113
Liabilities due after more than one year 864 1,865
Provisions for liabilities and charges (excluding pensions and similar obligations) 75 97
Net pension liability 117 100
Capital and reserves 8,469 8,051Called up share capital 275 275Share premium account 20 20Legal reserves 16 16Other reserves (3,325) (3,237)Profit retained 11,483 10,977
Total capital employed 9,525 10,113
PROFIT AND LOSS ACCOUNT FOR THE YEAR ENDED 31 DECEMBER
€ million2014
€ million2013
Income from fixed investments after taxation 2,064 1,558Other income and expenses 157 124
Profit for the year 2,221 1,682
For the information required by Article 2:392 of the Dutch Civil Code, refer to pages 135 and 136. Pages 132 to 134 are part of the notes to the Unilever N.V. company accounts.
The company accounts of Unilever N.V. are included in the consolidated accounts of the Unilever Group. Therefore, and in accordance with Article 2:402 of the Dutch Civil Code, the profit and loss account only reflects the income from fixed investments after taxation and other income and expenses after taxes. Under the terms of Financial Reporting Standard 1 (revised 1996) ‘Cash Flow Statements’ (FRS 1) a cash flow statement is not included, as the cash flows are included in the consolidated cash flow statement of Unilever Group.
131Unilever Annual Report and Accounts 2014 Financial statements
COMPANY ACCOUNTS UNILEVER N.V.
The policies are set out under the heading ‘Capital and funding’ in note 15 to the consolidated accounts on pages 109 and 110. NV is taking advantage of the exemption for not providing all the financial instruments disclosures, because IFRS 7 disclosures are given in note 15 to note 18 to the consolidated accounts on pages 109 to 123.
DEFERRED TAXATIONFull provision is made for deferred taxation on all significant timing differences arising from the recognition of items for taxation purposes in different periods from those in which they are included in NV accounts. Full provision is made at the rates of tax prevailing at the year end unless future rates have been enacted or substantively enacted. Deferred tax assets and liabilities have not been discounted.
OWN SHARES HELD Own shares held by NV are accounted for in accordance with Dutch law and UK GAAP, namely FRS 25 ‘Financial Instruments: Presentation’. All differences between the purchase price of the shares held to satisfy options granted and the proceeds received for the shares, whether on exercise or lapse, are charged to other reserves. In respect to option plans, disclosures are given in note 4C to the consolidated accounts on pages 98 and 99.
RETIREMENT BENEFITSUnilever N.V. has accounted for pensions and similar benefits under the United Kingdom Financial Reporting Standard 17 ‘Retirement benefits’ (FRS 17). The operating and financing costs of defined benefit plans are recognised separately in the profit and loss account; service costs are systematically spread over the service lives of employees, and financing costs are recognised in the periods in which they arise. Variations from expected costs, arising from the experience of the plans or changes in actuarial assumptions, are recognised immediately in equity. The costs of individual events such as past service benefit enhancements, settlements and curtailments are recognised immediately in the profit and loss account. The liabilities and, where applicable, the assets of defined benefit plans are recognised at fair value in the balance sheet. The charges to the profit and loss account for defined contribution plans are NV contributions payable and the assets of such plans are not included in NV’s balance sheet.
DIVIDENDSUnder Financial Reporting Standard 21 ‘Events after the Balance Sheet Date’ (FRS 21), proposed dividends do not meet the definition of a liability until such time as they have been approved by shareholders at the Annual General Meeting. Therefore, we do not recognise a liability in any period for dividends that have been proposed but will not be approved until after the balance sheet date. This holds for external dividends as well as intra-group dividends paid to the parent company.
TAXATIONUnilever N.V. together with certain of its subsidiaries, is part of a tax group for Dutch corporate income tax purposes. Unilever N.V. is the head of the fiscal unity. The members of the fiscal unity are jointly and severally liable for any taxes payable by this group. The external payable to or receivable from the Dutch Tax Authorities, is only included in the books of Unilever N.V. and this amount relates to the fiscal unity comprising all entities except for Unilever Nederland Holdings B.V., Univest Company B.V. and Unilever Insurances N.V. The amounts for the other entities are settled between Unilever N.V. and these entities via intercompany transactions.
ACCOUNTING INFORMATION AND POLICIES
BASIS OF PREPARATIONThe company accounts of Unilever N.V. comply in all material respects with legislation in the Netherlands. As allowed by Article 2:362.1 of the Dutch Civil Code, the company accounts are prepared in accordance with United Kingdom accounting standards, unless such standards conflict with the Civil Code in the Netherlands which would in such case prevail.
The accounts are prepared under the historical cost convention unless otherwise indicated, in accordance with the accounting policies set out below which have been consistently applied.
ADOPTION OF FRS 101 IN 2015In 2012, the FRC, being the standard setting body in the UK, published FRS 101 ‘Reduced Disclosure Framework’ which is available to qualifying entities that prepare their annual report and accounts under EU adopted IFRS (International Financial Reporting Standards). This outlines a reduced disclosure framework available to qualifying entities and all UK entities will be required to adopt this or an alternative standard in 2015.
Unilever N.V. intends to prepare its accounts under FRS 101 for the first time in 2015. The consolidated accounts for the Group will continue to be prepared under full IFRS. The Board considers that it is in the best interests of the Group for Unilever N.V. to adopt FRS 101 ‘Reduced Disclosure Framework’.
A shareholder or shareholders holding in aggregate 5% or more of the total allotted shares in Unilever N.V. may serve objections to the use of the disclosure exemptions on Unilever N.V., in writing, to its registered office (Weena 455, PO Box 760, 3000 DK Rotterdam, The Netherlands) not later than 30 June 2015 and, if so received, Unilever N.V. may not use these disclosure exemptions.
ACCOUNTING POLICIESThe principal accounting policies are as follows:
INTANGIBLE ASSETSIntangible assets are amortised in the profit and loss account over their expected useful lives of up to a maximum of 20 years. These assets are held at cost less accumulated amortisation. They are subject to review for impairment in accordance with United Kingdom Financial Reporting Standard 11 ‘Impairment of Fixed Assets and Goodwill’ (FRS 11). Any impairment is charged to the profit and loss account as it arises.
INVESTMENTS IN SUBSIDIARIESShares in group companies are stated at cost less any amounts written off to reflect a permanent impairment. Any impairment is charged to the profit and loss account as it arises. In accordance with Article 2:385.5 of the Dutch Civil Code, Unilever N.V. shares held by Unilever N.V. subsidiaries are deducted from the carrying value of those subsidiaries. This differs from the accounting treatment under UK GAAP, which would require these amounts to be included within investments in subsidiaries.
FINANCIAL INSTRUMENTSNV accounting policies under United Kingdom generally accepted accounting principles (UK GAAP) namely FRS 25 ‘Financial Instruments: Presentation’, FRS 26 ‘Financial Instruments: Measurement’ and FRS 29 ‘Financial Instruments: Disclosures’ are the same as the Unilever Group’s accounting policies under IFRS namely IAS 32 ‘Financial Instruments: Presentation’, IAS 39 ‘Financial Instruments: Recognition and Measurement’ and IFRS 7: ‘Financial Instruments: Disclosures’.
132 Unilever Annual Report and Accounts 2014Financial statements
NOTES TO THE COMPANY ACCOUNTS UNILEVER N.V.
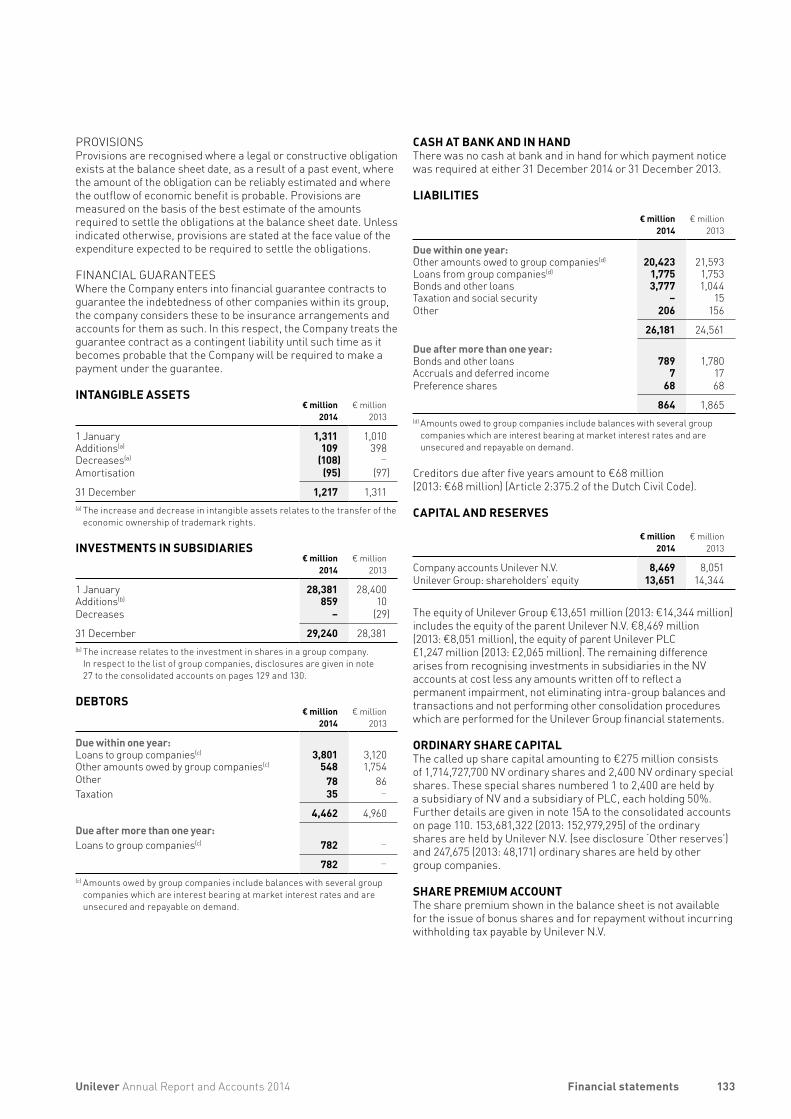
CASH AT BANK AND IN HANDThere was no cash at bank and in hand for which payment notice was required at either 31 December 2014 or 31 December 2013.
LIABILITIES
€ million
2014€ million
2013
Due within one year:Other amounts owed to group companies(d) 20,423 21,593Loans from group companies(d) 1,775 1,753Bonds and other loans 3,777 1,044Taxation and social security – 15Other 206 156
26,181 24,561
Due after more than one year:Bonds and other loans 789 1,780Accruals and deferred income 7 17Preference shares 68 68
864 1,865(d) Amounts owed to group companies include balances with several group
companies which are interest bearing at market interest rates and are unsecured and repayable on demand.
Creditors due after five years amount to €68 million (2013: €68 million) (Article 2:375.2 of the Dutch Civil Code).
CAPITAL AND RESERVES
€ million
2014€ million
2013
Company accounts Unilever N.V. 8,469 8,051Unilever Group: shareholders’ equity 13,651 14,344
The equity of Unilever Group €13,651 million (2013: €14,344 million) includes the equity of the parent Unilever N.V. €8,469 million (2013: €8,051 million), the equity of parent Unilever PLC £1,247 million (2013: £2,065 million). The remaining difference arises from recognising investments in subsidiaries in the NV accounts at cost less any amounts written off to reflect a permanent impairment, not eliminating intra-group balances and transactions and not performing other consolidation procedures which are performed for the Unilever Group financial statements.
ORDINARY SHARE CAPITALThe called up share capital amounting to €275 million consists of 1,714,727,700 NV ordinary shares and 2,400 NV ordinary special shares. These special shares numbered 1 to 2,400 are held by a subsidiary of NV and a subsidiary of PLC, each holding 50%. Further details are given in note 15A to the consolidated accounts on page 110. 153,681,322 (2013: 152,979,295) of the ordinary shares are held by Unilever N.V. (see disclosure ‘Other reserves’) and 247,675 (2013: 48,171) ordinary shares are held by other group companies.
SHARE PREMIUM ACCOUNTThe share premium shown in the balance sheet is not available for the issue of bonus shares and for repayment without incurring withholding tax payable by Unilever N.V.
PROVISIONSProvisions are recognised where a legal or constructive obligation exists at the balance sheet date, as a result of a past event, where the amount of the obligation can be reliably estimated and where the outflow of economic benefit is probable. Provisions are measured on the basis of the best estimate of the amounts required to settle the obligations at the balance sheet date. Unless indicated otherwise, provisions are stated at the face value of the expenditure expected to be required to settle the obligations.
FINANCIAL GUARANTEESWhere the Company enters into financial guarantee contracts to guarantee the indebtedness of other companies within its group, the company considers these to be insurance arrangements and accounts for them as such. In this respect, the Company treats the guarantee contract as a contingent liability until such time as it becomes probable that the Company will be required to make a payment under the guarantee.
INTANGIBLE ASSETS€ million
2014€ million
2013
1 January 1,311 1,010Additions(a) 109 398Decreases(a) (108) –Amortisation (95) (97)
31 December 1,217 1,311(a) The increase and decrease in intangible assets relates to the transfer of the
economic ownership of trademark rights.
INVESTMENTS IN SUBSIDIARIES
€ million2014
€ million2013
1 January 28,381 28,400Additions(b) 859 10Decreases – (29)
31 December 29,240 28,381(b) The increase relates to the investment in shares in a group company. In respect to the list of group companies, disclosures are given in note
27 to the consolidated accounts on pages 129 and 130.
DEBTORS
€ million2014
€ million2013
Due within one year:Loans to group companies(c) 3,801 3,120Other amounts owed by group companies(c) 548 1,754Other 78 86Taxation 35 – 4,462 4,960Due after more than one year:Loans to group companies(c) 782 –
782 –(c) Amounts owed by group companies include balances with several group
companies which are interest bearing at market interest rates and are unsecured and repayable on demand.
133Unilever Annual Report and Accounts 2014 Financial statements
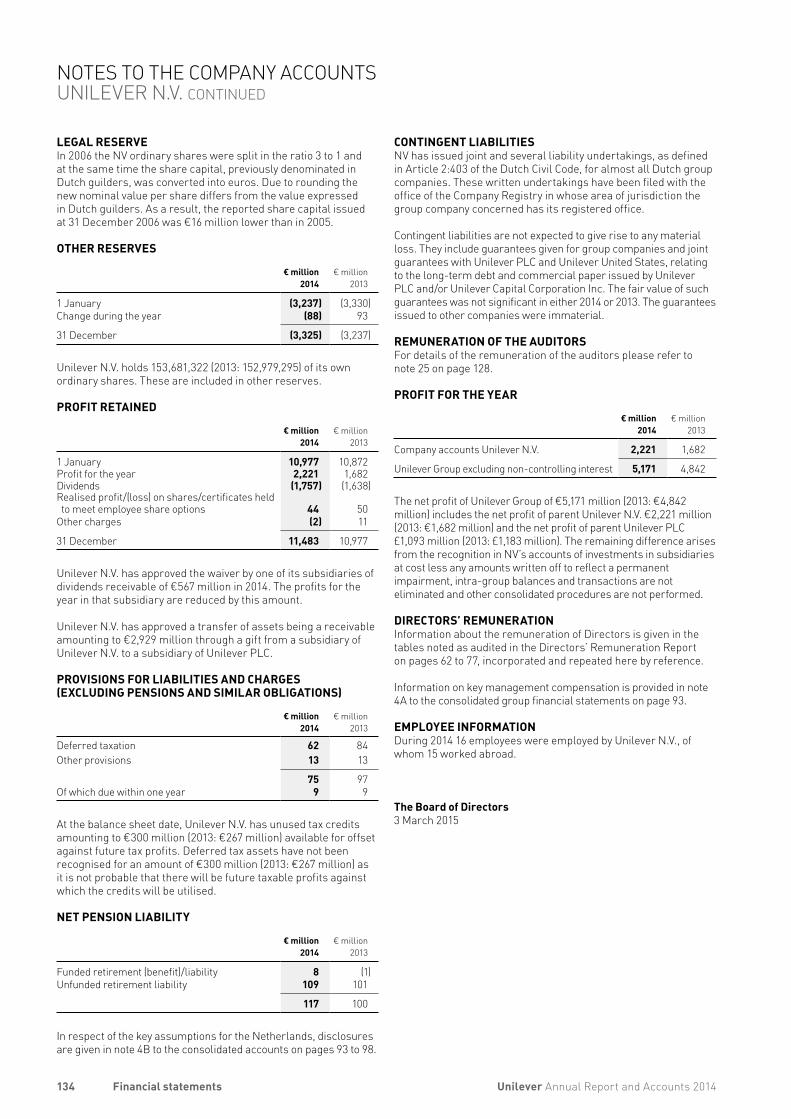
LEGAL RESERVEIn 2006 the NV ordinary shares were split in the ratio 3 to 1 and at the same time the share capital, previously denominated in Dutch guilders, was converted into euros. Due to rounding the new nominal value per share differs from the value expressed in Dutch guilders. As a result, the reported share capital issued at 31 December 2006 was €16 million lower than in 2005.
OTHER RESERVES
€ million
2014€ million
2013
1 January (3,237) (3,330)Change during the year (88) 93
31 December (3,325) (3,237)
Unilever N.V. holds 153,681,322 (2013: 152,979,295) of its own ordinary shares. These are included in other reserves.
PROFIT RETAINED
€ million
2014€ million
2013
1 January 10,977 10,872Profit for the year 2,221 1,682Dividends (1,757) (1,638)Realised profit/(loss) on shares/certificates held to meet employee share options 44 50
Other charges (2) 11
31 December 11,483 10,977
Unilever N.V. has approved the waiver by one of its subsidiaries of dividends receivable of €567 million in 2014. The profits for the year in that subsidiary are reduced by this amount.
Unilever N.V. has approved a transfer of assets being a receivable amounting to €2,929 million through a gift from a subsidiary of Unilever N.V. to a subsidiary of Unilever PLC.
PROVISIONS FOR LIABILITIES AND CHARGES (EXCLUDING PENSIONS AND SIMILAR OBLIGATIONS)
€ million2014
€ million2013
Deferred taxation 62 84Other provisions 13 13
75 97Of which due within one year 9 9
At the balance sheet date, Unilever N.V. has unused tax credits amounting to €300 million (2013: €267 million) available for offset against future tax profits. Deferred tax assets have not been recognised for an amount of €300 million (2013: €267 million) as it is not probable that there will be future taxable profits against which the credits will be utilised.
NET PENSION LIABILITY
€ million2014
€ million2013
Funded retirement (benefit)/liability 8 (1)Unfunded retirement liability 109 101
117 100
In respect of the key assumptions for the Netherlands, disclosures are given in note 4B to the consolidated accounts on pages 93 to 98.
CONTINGENT LIABILITIESNV has issued joint and several liability undertakings, as defined in Article 2:403 of the Dutch Civil Code, for almost all Dutch group companies. These written undertakings have been filed with the office of the Company Registry in whose area of jurisdiction the group company concerned has its registered office.
Contingent liabilities are not expected to give rise to any material loss. They include guarantees given for group companies and joint guarantees with Unilever PLC and Unilever United States, relating to the long-term debt and commercial paper issued by Unilever PLC and/or Unilever Capital Corporation Inc. The fair value of such guarantees was not significant in either 2014 or 2013. The guarantees issued to other companies were immaterial.
REMUNERATION OF THE AUDITORSFor details of the remuneration of the auditors please refer to note 25 on page 128.
PROFIT FOR THE YEAR
€ million2014
€ million2013
Company accounts Unilever N.V. 2,221 1,682
Unilever Group excluding non-controlling interest 5,171 4,842
The net profit of Unilever Group of €5,171 million (2013: €4,842 million) includes the net profit of parent Unilever N.V. €2,221 million (2013: €1,682 million) and the net profit of parent Unilever PLC £1,093 million (2013: £1,183 million). The remaining difference arises from the recognition in NV’s accounts of investments in subsidiaries at cost less any amounts written off to reflect a permanent impairment, intra-group balances and transactions are not eliminated and other consolidated procedures are not performed.
DIRECTORS’ REMUNERATIONInformation about the remuneration of Directors is given in the tables noted as audited in the Directors’ Remuneration Report on pages 62 to 77, incorporated and repeated here by reference.
Information on key management compensation is provided in note 4A to the consolidated group financial statements on page 93.
EMPLOYEE INFORMATIONDuring 2014 16 employees were employed by Unilever N.V., of whom 15 worked abroad.
The Board of Directors3 March 2015
134 Unilever Annual Report and Accounts 2014Financial statements
NOTES TO THE COMPANY ACCOUNTS UNILEVER N.V. CONTINUED
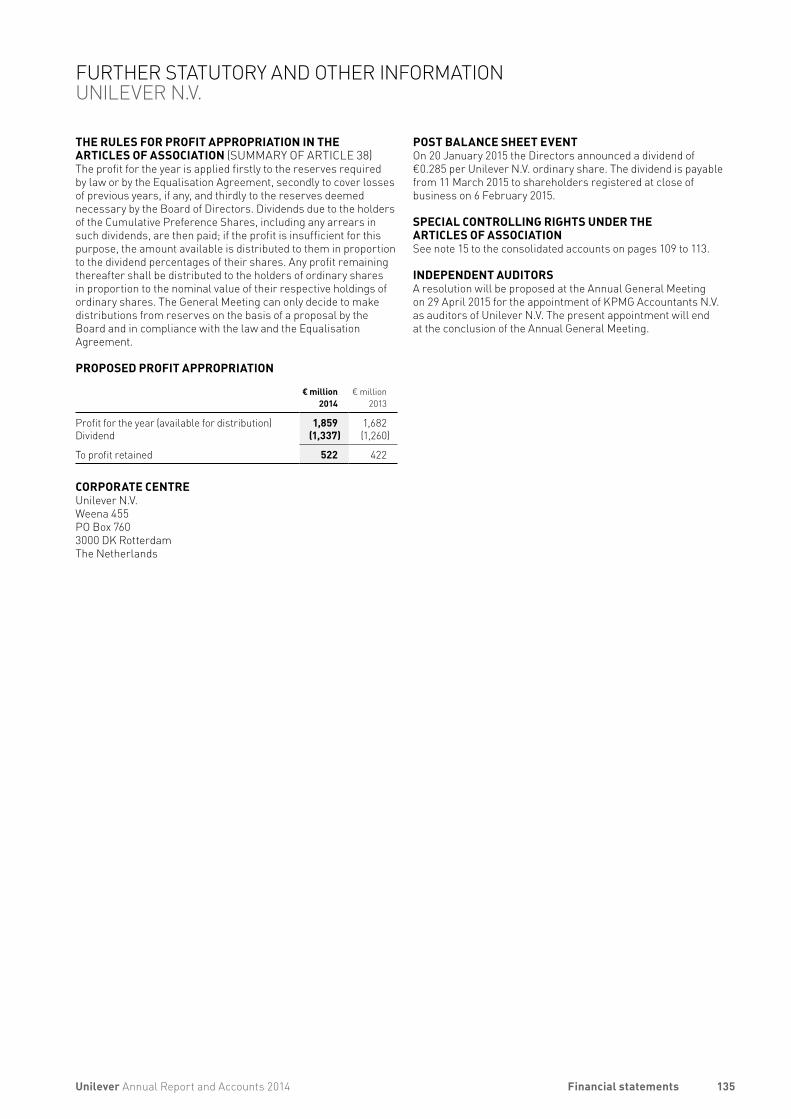
POST BALANCE SHEET EVENTOn 20 January 2015 the Directors announced a dividend of €0.285 per Unilever N.V. ordinary share. The dividend is payable from 11 March 2015 to shareholders registered at close of business on 6 February 2015.
SPECIAL CONTROLLING RIGHTS UNDER THE ARTICLES OF ASSOCIATIONSee note 15 to the consolidated accounts on pages 109 to 113.
INDEPENDENT AUDITORSA resolution will be proposed at the Annual General Meeting on 29 April 2015 for the appointment of KPMG Accountants N.V. as auditors of Unilever N.V. The present appointment will end at the conclusion of the Annual General Meeting.
THE RULES FOR PROFIT APPROPRIATION IN THE ARTICLES OF ASSOCIATION (SUMMARY OF ARTICLE 38)The profit for the year is applied firstly to the reserves required by law or by the Equalisation Agreement, secondly to cover losses of previous years, if any, and thirdly to the reserves deemed necessary by the Board of Directors. Dividends due to the holders of the Cumulative Preference Shares, including any arrears in such dividends, are then paid; if the profit is insufficient for this purpose, the amount available is distributed to them in proportion to the dividend percentages of their shares. Any profit remaining thereafter shall be distributed to the holders of ordinary shares in proportion to the nominal value of their respective holdings of ordinary shares. The General Meeting can only decide to make distributions from reserves on the basis of a proposal by the Board and in compliance with the law and the Equalisation Agreement.
PROPOSED PROFIT APPROPRIATION
€ million2014
€ million2013
Profit for the year (available for distribution) 1,859 1,682Dividend (1,337) (1,260)
To profit retained 522 422
CORPORATE CENTREUnilever N.V.Weena 455PO Box 7603000 DK RotterdamThe Netherlands
135Unilever Annual Report and Accounts 2014 Financial statements
FURTHER STATUTORY AND OTHER INFORMATION UNILEVER N.V.
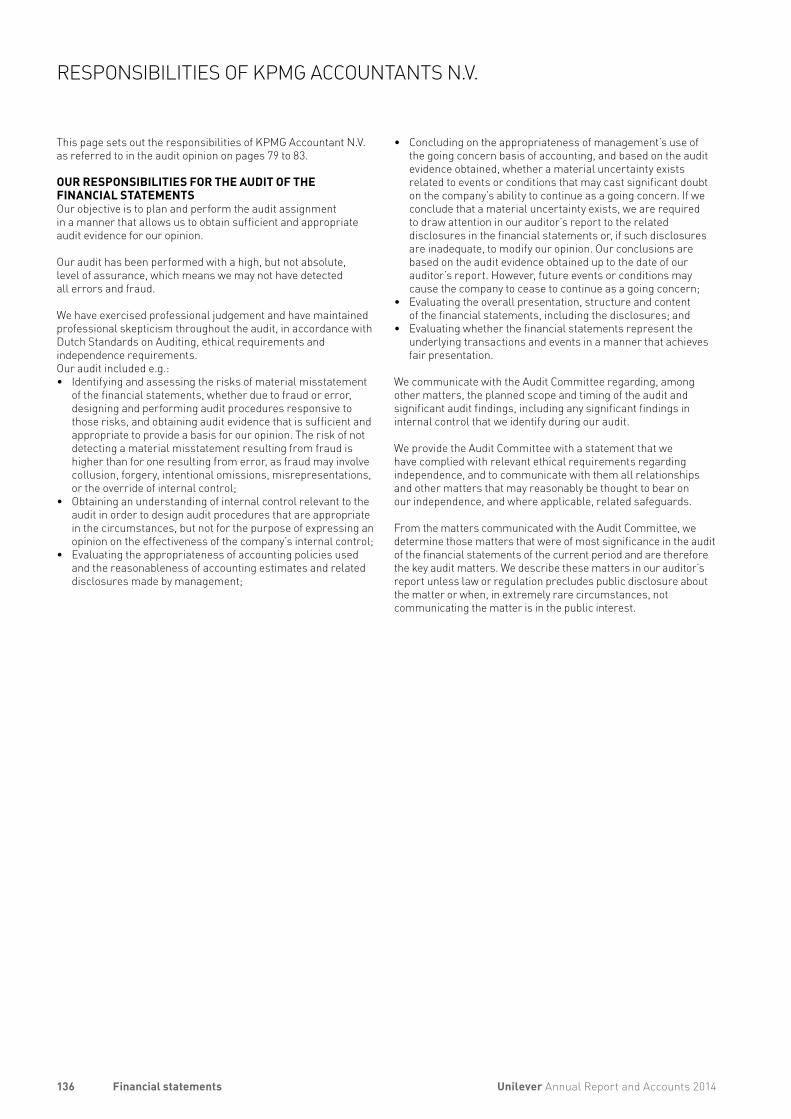
This page sets out the responsibilities of KPMG Accountant N.V. as referred to in the audit opinion on pages 79 to 83.
OUR RESPONSIBILITIES FOR THE AUDIT OF THE FINANCIAL STATEMENTSOur objective is to plan and perform the audit assignment in a manner that allows us to obtain sufficient and appropriate audit evidence for our opinion.
Our audit has been performed with a high, but not absolute, level of assurance, which means we may not have detected all errors and fraud.
We have exercised professional judgement and have maintained professional skepticism throughout the audit, in accordance with Dutch Standards on Auditing, ethical requirements and independence requirements. Our audit included e.g.: • Identifying and assessing the risks of material misstatement
of the financial statements, whether due to fraud or error, designing and performing audit procedures responsive to those risks, and obtaining audit evidence that is sufficient and appropriate to provide a basis for our opinion. The risk of not detecting a material misstatement resulting from fraud is higher than for one resulting from error, as fraud may involve collusion, forgery, intentional omissions, misrepresentations, or the override of internal control;
• Obtaining an understanding of internal control relevant to the audit in order to design audit procedures that are appropriate in the circumstances, but not for the purpose of expressing an opinion on the effectiveness of the company’s internal control;
• Evaluating the appropriateness of accounting policies used and the reasonableness of accounting estimates and related disclosures made by management;
• Concluding on the appropriateness of management’s use of the going concern basis of accounting, and based on the audit evidence obtained, whether a material uncertainty exists related to events or conditions that may cast significant doubt on the company’s ability to continue as a going concern. If we conclude that a material uncertainty exists, we are required to draw attention in our auditor’s report to the related disclosures in the financial statements or, if such disclosures are inadequate, to modify our opinion. Our conclusions are based on the audit evidence obtained up to the date of our auditor’s report. However, future events or conditions may cause the company to cease to continue as a going concern;
• Evaluating the overall presentation, structure and content of the financial statements, including the disclosures; and
• Evaluating whether the financial statements represent the underlying transactions and events in a manner that achieves fair presentation.
We communicate with the Audit Committee regarding, among other matters, the planned scope and timing of the audit and significant audit findings, including any significant findings in internal control that we identify during our audit.
We provide the Audit Committee with a statement that we have complied with relevant ethical requirements regarding independence, and to communicate with them all relationships and other matters that may reasonably be thought to bear on our independence, and where applicable, related safeguards.
From the matters communicated with the Audit Committee, we determine those matters that were of most significance in the audit of the financial statements of the current period and are therefore the key audit matters. We describe these matters in our auditor’s report unless law or regulation precludes public disclosure about the matter or when, in extremely rare circumstances, not communicating the matter is in the public interest.
136 Unilever Annual Report and Accounts 2014Financial statements
RESPONSIBILITIES OF KPMG ACCOUNTANTS N.V.
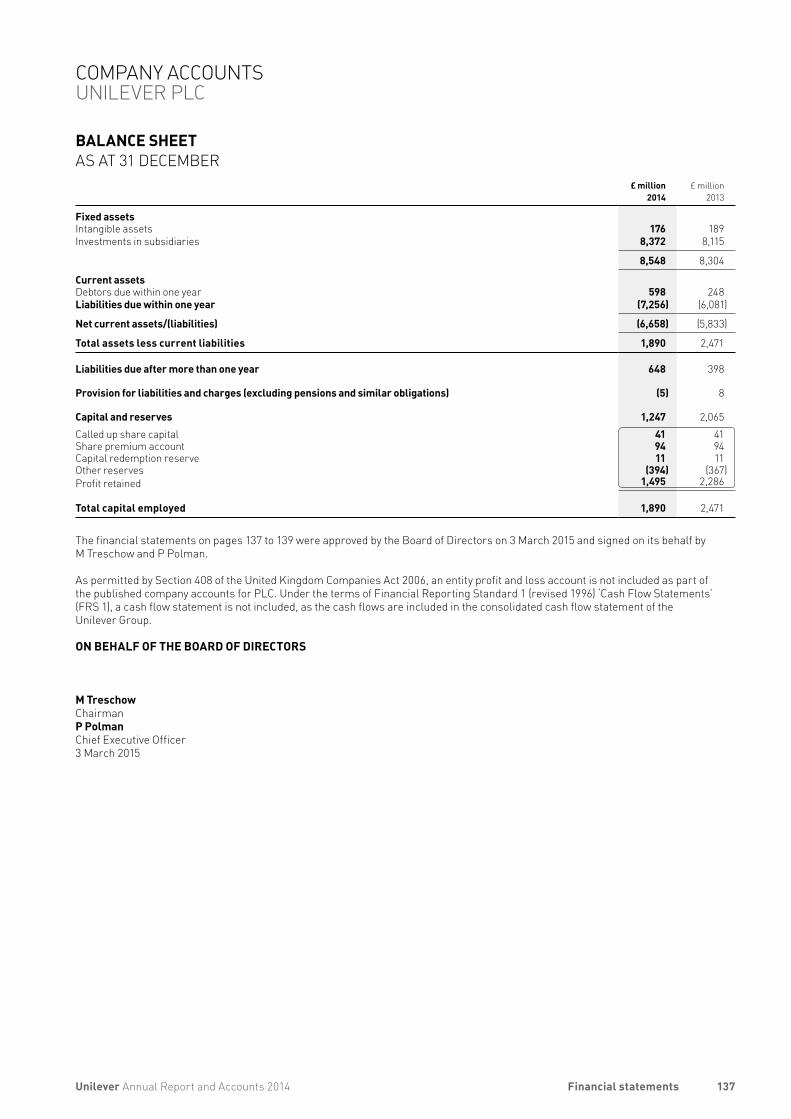
BALANCE SHEET AS AT 31 DECEMBER
£ million2014
£ million2013
Fixed assetsIntangible assets 176 189Investments in subsidiaries 8,372 8,115
8,548 8,304
Current assetsDebtors due within one year 598 248Liabilities due within one year (7,256) (6,081)
Net current assets/(liabilities) (6,658) (5,833)
Total assets less current liabilities 1,890 2,471
Liabilities due after more than one year 648 398
Provision for liabilities and charges (excluding pensions and similar obligations) (5) 8
Capital and reserves 1,247 2,065Called up share capital 41 41Share premium account 94 94Capital redemption reserve 11 11Other reserves (394) (367)Profit retained 1,495 2,286
Total capital employed 1,890 2,471
The financial statements on pages 137 to 139 were approved by the Board of Directors on 3 March 2015 and signed on its behalf by M Treschow and P Polman.
As permitted by Section 408 of the United Kingdom Companies Act 2006, an entity profit and loss account is not included as part of the published company accounts for PLC. Under the terms of Financial Reporting Standard 1 (revised 1996) ‘Cash Flow Statements’ (FRS 1), a cash flow statement is not included, as the cash flows are included in the consolidated cash flow statement of the Unilever Group.
ON BEHALF OF THE BOARD OF DIRECTORS
M Treschow ChairmanP Polman Chief Executive Officer3 March 2015
137Unilever Annual Report and Accounts 2014 Financial statements
COMPANY ACCOUNTS UNILEVER PLC
DEFERRED TAXATIONFull provision is made for deferred taxation on all significant timing differences arising from the recognition of items for taxation purposes in different periods from those in which they are included in PLC accounts. Full provision is made at the rates of tax prevailing at the year end unless future rates have been enacted or substantively enacted. Deferred tax assets and liabilities have not been discounted.
SHARES HELD BY EMPLOYEE SHARE TRUSTSShares held to satisfy options are accounted for in accordance with UK GAAP, namely FRS 25 ‘Financial Instruments: Presentation’, FRS 20 ‘Share Based Payments’ and Urgent Issues Task Force abstract 38 ‘Accounting for ESOP Trusts’ (UITF 38). All differences between the purchase price of the shares held to satisfy options granted and the proceeds received for the shares, whether on exercise or lapse, are charged to other reserves.
DIVIDENDSUnder FRS 21 ‘Events after the Balance Sheet Date’, proposed dividends do not meet the definition of a liability until such time as they have been approved by shareholders at the Annual General Meeting. Therefore, we do not recognise a liability in any period for dividends that have been proposed but will not be approved until after the balance sheet date. This holds for external dividends as well as intra-group dividends paid to the parent company.
TAXATIONCurrent tax is the expected tax payable on the taxable income for the period, using tax rates enacted or substantively enacted at the balance sheet date, and any adjustment to tax payable in respect of previous periods.
PROVISIONSProvisions are recognised where a legal or constructive obligation exists at the balance sheet date, as a result of a past event, where the amount of the obligation can be reliably estimated and where the outflow of economic benefit is probable. Provisions are measured on the basis of the best estimate of the amounts required to settle the obligations at the balance sheet date. Unless indicated otherwise, provisions are stated at the face value of the expenditure expected to be required to settle the obligations.
FINANCIAL GUARANTEESWhere the Company enters into financial guarantee contracts to guarantee the indebtedness of other companies within its group, the Company considers these to be insurance arrangements and accounts for them as such. In this respect, the Company treats the guarantee contract as a contingent liability until such time as it becomes probable that the Company will be required to make a payment under the guarantee.
ACCOUNTING INFORMATION AND POLICIES
BASIS OF PREPARATIONThe accounts have been prepared on a going concern basis and in accordance with applicable United Kingdom accounting standards and the UK Companies Act 2006.
The accounts are prepared under the historical cost convention except for the revaluation of financial assets classified as ‘available-for-sale investments’ or ‘fair value through profit or loss’, and ‘derivative financial instruments’ in accordance with the accounting policies set out below which have been consistently applied.
ADOPTION OF FRS 101 IN 2015In 2012, the FRC, being the standard setting body in the UK, published FRS 101 ‘Reduced Disclosure Framework’ which is available to qualifying entities that prepare their annual report and accounts under EU adopted IFRS (International Financial Reporting Standards). This outlines a reduced disclosure framework available to qualifying entities and all UK entities will be required to adopt this or an alternative standard in 2015.
Unilever PLC intends to prepare its accounts under FRS 101 for the first time in 2015. The consolidated accounts for the Group will continue to be prepared under full IFRS. The Board considers that it is in the best interests of the Group for Unilever PLC to adopt FRS 101 ‘Reduced Disclosure Framework’.
A shareholder or shareholders holding in aggregate 5% or more of the total allotted shares in Unilever PLC may serve objections to the use of the disclosure exemptions on Unilever PLC, in writing, to its corporate office (100 Victoria Embankment, London, EC4Y 0DY) not later than 30 June 2015 and, if so received, Unilever PLC may not use these disclosure exemptions.
ACCOUNTING POLICIESThe principal accounting policies are as follows:
INTANGIBLE ASSETSIntangible assets comprise trademarks purchased after 1 January 1998 and are amortised in the profit and loss account over their expected useful lives of up to a maximum of 20 years. These assets are held at cost less accumulated amortisation. They are subject to review for impairment in accordance with United Kingdom Financial Reporting Standard 11 ‘Impairment of Fixed Assets and Goodwill’ (FRS 11). Any impairment is charged to the profit and loss account as it arises.
INVESTMENTS IN SUBSIDIARIESShares in group companies are stated at cost less any amounts written off to reflect a permanent impairment. Any impairment is charged to the profit and loss account as it arises.
FINANCIAL INSTRUMENTS The company’s accounting policies under United Kingdom generally accepted accounting principles (UK GAAP), namely FRS 25 ‘Financial Instruments: Presentation’, FRS 26 ‘Financial Instruments: Measurement’ and FRS 29 ‘Financial Instruments: Disclosures’, are the same as the Unilever Group’s accounting policies under International Financial Reporting Standards (IFRS) namely IAS 32 ‘Financial Instruments: Presentation’, IAS 39 ‘Financial Instruments: Recognition and Measurement’ and IFRS 7 ‘Financial Instruments: Disclosures’. The policies are set out under the heading ‘Capital and funding’ in note 15 to the consolidated accounts on pages 109 and 110. PLC is taking the exemption for financial instruments disclosures, because IFRS 7 disclosures are given in notes 15 to 18 to the consolidated accounts on pages 109 to 123.
138 Unilever Annual Report and Accounts 2014Financial statements
NOTES TO THE COMPANY ACCOUNTS UNILEVER PLC
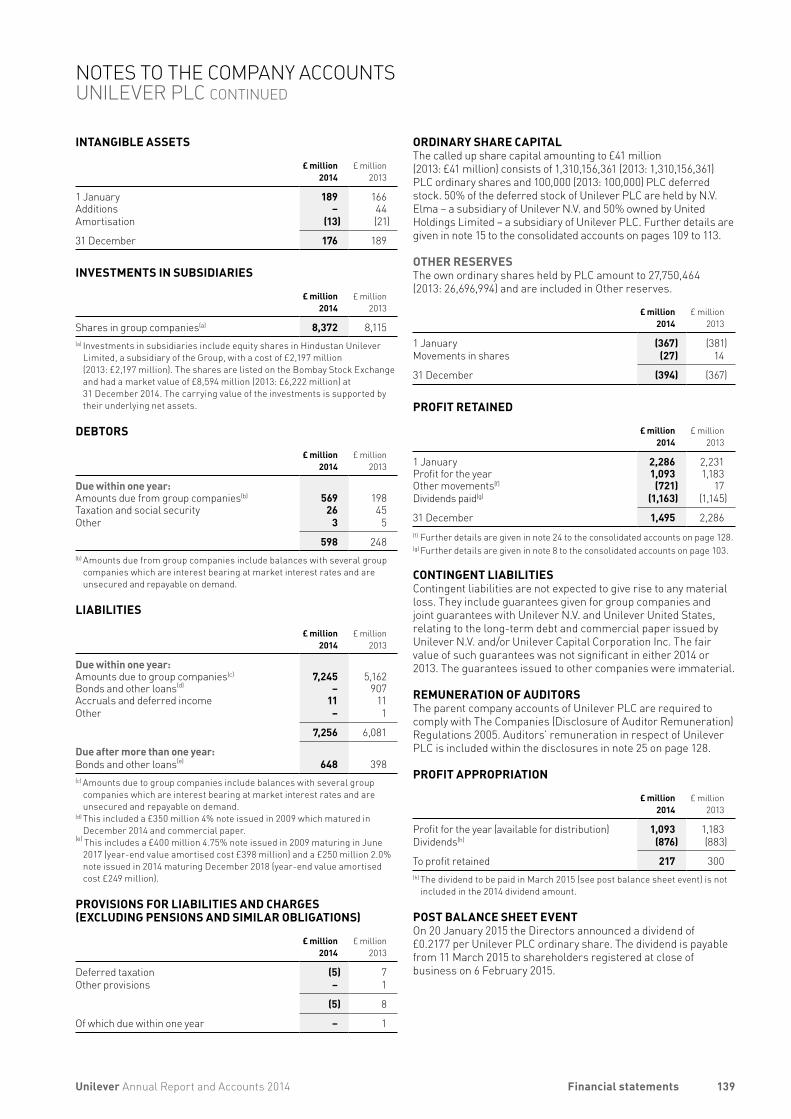
ORDINARY SHARE CAPITALThe called up share capital amounting to £41 million (2013: £41 million) consists of 1,310,156,361 (2013: 1,310,156,361) PLC ordinary shares and 100,000 (2013: 100,000) PLC deferred stock. 50% of the deferred stock of Unilever PLC are held by N.V. Elma – a subsidiary of Unilever N.V. and 50% owned by United Holdings Limited – a subsidiary of Unilever PLC. Further details are given in note 15 to the consolidated accounts on pages 109 to 113.
OTHER RESERVESThe own ordinary shares held by PLC amount to 27,750,464 (2013: 26,696,994) and are included in Other reserves.
£ million
2014£ million
2013
1 January (367) (381)Movements in shares (27) 14
31 December (394) (367)
PROFIT RETAINED
£ million
2014£ million
2013
1 January 2,286 2,231Profit for the year 1,093 1,183Other movements(f) (721) 17Dividends paid(g) (1,163) (1,145)
31 December 1,495 2,286(f) Further details are given in note 24 to the consolidated accounts on page 128. (g) Further details are given in note 8 to the consolidated accounts on page 103.
CONTINGENT LIABILITIESContingent liabilities are not expected to give rise to any material loss. They include guarantees given for group companies andjoint guarantees with Unilever N.V. and Unilever United States, relating to the long-term debt and commercial paper issued by Unilever N.V. and/or Unilever Capital Corporation Inc. The fair value of such guarantees was not significant in either 2014 or 2013. The guarantees issued to other companies were immaterial.
REMUNERATION OF AUDITORSThe parent company accounts of Unilever PLC are required to comply with The Companies (Disclosure of Auditor Remuneration) Regulations 2005. Auditors’ remuneration in respect of Unilever PLC is included within the disclosures in note 25 on page 128.
PROFIT APPROPRIATION
£ million
2014£ million
2013
Profit for the year (available for distribution) 1,093 1,183Dividends(h) (876) (883)
To profit retained 217 300(h) The dividend to be paid in March 2015 (see post balance sheet event) is not
included in the 2014 dividend amount.
POST BALANCE SHEET EVENTOn 20 January 2015 the Directors announced a dividend of £0.2177 per Unilever PLC ordinary share. The dividend is payable from 11 March 2015 to shareholders registered at close of business on 6 February 2015.
INTANGIBLE ASSETS
£ million2014
£ million2013
1 January 189 166Additions – 44Amortisation (13) (21)
31 December 176 189
INVESTMENTS IN SUBSIDIARIES
£ million2014
£ million2013
Shares in group companies(a) 8,372 8,115(a) Investments in subsidiaries include equity shares in Hindustan Unilever
Limited, a subsidiary of the Group, with a cost of £2,197 million (2013: £2,197 million). The shares are listed on the Bombay Stock Exchange and had a market value of £8,594 million (2013: £6,222 million) at 31 December 2014. The carrying value of the investments is supported by their underlying net assets.
DEBTORS
£ million2014
£ million2013
Due within one year:Amounts due from group companies(b) 569 198Taxation and social security 26 45Other 3 5
598 248(b) Amounts due from group companies include balances with several group
companies which are interest bearing at market interest rates and are unsecured and repayable on demand.
LIABILITIES
£ million
2014£ million
2013
Due within one year:Amounts due to group companies(c) 7,245 5,162Bonds and other loans(d) – 907Accruals and deferred income 11 11Other – 1
7,256 6,081
Due after more than one year:Bonds and other loans(e) 648 398(c) Amounts due to group companies include balances with several group
companies which are interest bearing at market interest rates and are unsecured and repayable on demand.
(d) This included a £350 million 4% note issued in 2009 which matured in December 2014 and commercial paper.
(e) This includes a £400 million 4.75% note issued in 2009 maturing in June 2017 (year-end value amortised cost £398 million) and a £250 million 2.0% note issued in 2014 maturing December 2018 (year-end value amortised cost £249 million).
PROVISIONS FOR LIABILITIES AND CHARGES (EXCLUDING PENSIONS AND SIMILAR OBLIGATIONS)
£ million2014
£ million2013
Deferred taxation (5) 7Other provisions – 1
(5) 8
Of which due within one year – 1
139Unilever Annual Report and Accounts 2014 Financial statements
NOTES TO THE COMPANY ACCOUNTS UNILEVER PLC CONTINUED
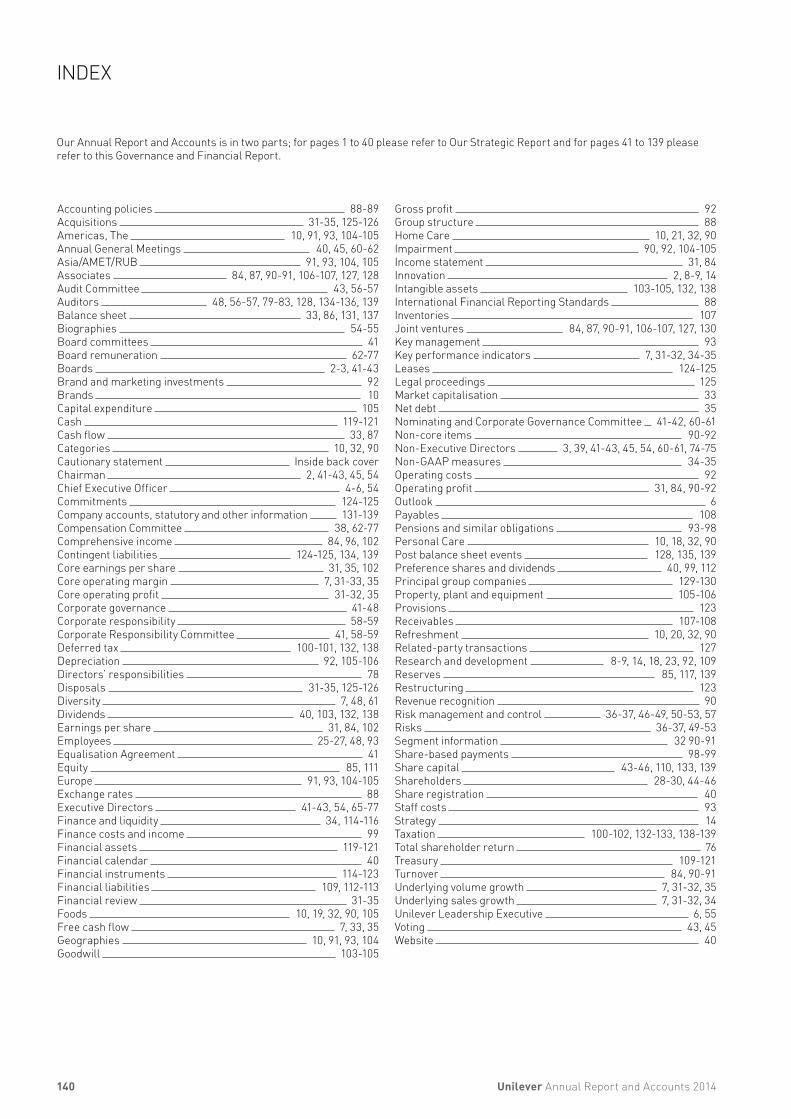
Accounting policies 88-89Acquisitions 31-35, 125-126Americas, The 10, 91, 93, 104-105 Annual General Meetings 40, 45, 60-62 Asia/AMET/RUB 91, 93, 104, 105Associates 84, 87, 90-91, 106-107, 127, 128Audit Committee 43, 56-57Auditors 48, 56-57, 79-83, 128, 134-136, 139 Balance sheet 33, 86, 131, 137Biographies 54-55Board committees 41Board remuneration 62-77Boards 2-3, 41-43Brand and marketing investments 92Brands 10Capital expenditure 105Cash 119-121Cash flow 33, 87Categories 10, 32, 90Cautionary statement Inside back coverChairman 2, 41-43, 45, 54Chief Executive Officer 4-6, 54Commitments 124-125Company accounts, statutory and other information 131-139 Compensation Committee 38, 62-77Comprehensive income 84, 96, 102Contingent liabilities 124-125, 134, 139Core earnings per share 31, 35, 102Core operating margin 7, 31-33, 35Core operating profit 31-32, 35Corporate governance 41-48Corporate responsibility 58-59Corporate Responsibility Committee 41, 58-59Deferred tax 100-101, 132, 138 Depreciation 92, 105-106Directors’ responsibilities 78Disposals 31-35, 125-126Diversity 7, 48, 61Dividends 40, 103, 132, 138Earnings per share 31, 84, 102Employees 25-27, 48, 93Equalisation Agreement 41Equity 85, 111Europe 91, 93, 104-105Exchange rates 88Executive Directors 41-43, 54, 65-77Finance and liquidity 34, 114-116 Finance costs and income 99Financial assets 119-121Financial calendar 40Financial instruments 114-123Financial liabilities 109, 112-113Financial review 31-35Foods 10, 19, 32, 90, 105Free cash flow 7, 33, 35Geographies 10, 91, 93, 104Goodwill 103-105
Gross profit 92Group structure 88Home Care 10, 21, 32, 90Impairment 90, 92, 104-105Income statement 31, 84Innovation 2, 8-9, 14Intangible assets 103-105, 132, 138International Financial Reporting Standards 88Inventories 107Joint ventures 84, 87, 90-91, 106-107, 127, 130Key management 93Key performance indicators 7, 31-32, 34-35Leases 124-125Legal proceedings 125Market capitalisation 33Net debt 35Nominating and Corporate Governance Committee 41-42, 60-61Non-core items 90-92Non-Executive Directors 3, 39, 41-43, 45, 54, 60-61, 74-75Non-GAAP measures 34-35Operating costs 92Operating profit 31, 84, 90-92Outlook 6Payables 108Pensions and similar obligations 93-98Personal Care 10, 18, 32, 90Post balance sheet events 128, 135, 139Preference shares and dividends 40, 99, 112Principal group companies 129-130Property, plant and equipment 105-106Provisions 123Receivables 107-108Refreshment 10, 20, 32, 90Related-party transactions 127Research and development 8-9, 14, 18, 23, 92, 109Reserves 85, 117, 139Restructuring 123Revenue recognition 90Risk management and control 36-37, 46-49, 50-53, 57Risks 36-37, 49-53Segment information 32 90-91Share-based payments 98-99Share capital 43-46, 110, 133, 139Shareholders 28-30, 44-46Share registration 40Staff costs 93Strategy 14Taxation 100-102, 132-133, 138-139Total shareholder return 76Treasury 109-121Turnover 84, 90-91Underlying volume growth 7, 31-32, 35Underlying sales growth 7, 31-32, 34Unilever Leadership Executive 6, 55Voting 43, 45Website 40
Our Annual Report and Accounts is in two parts; for pages 1 to 40 please refer to Our Strategic Report and for pages 41 to 139 please refer to this Governance and Financial Report.
140 Unilever Annual Report and Accounts 2014
INDEX
CAUTIONARY STATEMENTThis document may contain forward-looking statements, including ‘forward-looking statements’ within the meaning of the United States Private Securities Litigation Reform Act of 1995. Words such as ‘will’, ‘aim’, ‘expects’, ‘anticipates’, ‘intends’, ‘looks’, ‘believes’, ‘vision’, or the negative of these terms and other similar expressions of future performance or results, and their negatives, are intended to identify such forward-looking statements. These forward-looking statements are based upon current expectations and assumptions regarding anticipated developments and other factors affecting the Group. They are not historical facts, nor are they guarantees of future performance.
Because these forward-looking statements involve risks and uncertainties, there are important factors that could cause actual results to differ materially from those expressed or implied by these forward-looking statements. Among other risks and uncertainties, the material or principal factors which cause actual results to differ materially are: Unilever’s global brands not meeting consumer preferences; Unilever’s ability to innovate and remain competitive; Unilever’s investment choices in its portfolio management; inability to find sustainable solutions to support long-term growth; customer relationships; the recruitment and retention of talented employees; disruptions in our supply chain; the cost of raw materials and commodities; the production of safe and high quality products; secure and reliable IT infrastructure; successful execution of acquisitions, divestitures and business transformation projects; economic and political risks and natural disasters; financial risks; failure to meet high and ethical standards; and managing regulatory, tax and legal matters. Further details of potential risks and uncertainties affecting the Group are described in the Group’s filings with the London Stock Exchange, Euronext Amsterdam and the US Securities and Exchange Commission, including in the Group’s Annual Report on Form 20-F for the year ended 31 December 2014 and the Annual Report and Accounts 2014. These forward-looking statements speak only as of the date of this document. Except as required by any applicable law or regulation, the Group expressly disclaims any obligation or undertaking to release publicly any updates or revisions to any forward-looking statements contained herein to reflect any change in the Group’s expectations with regard thereto or any change in events, conditions or circumstances on which any such statement is based.
This document is not prepared in accordance with US GAAP and should not therefore be relied upon by readers as such. The Group’s Annual Report on Form 20-F for 2014 is separately filed with the US Securities and Exchange Commission and is available on our corporate website www.unilever.com.
In addition, a printed copy of the Annual Report on Form 20-F is available, free of charge, upon request to Unilever, Investor Relations Department, 100 Victoria Embankment, London EC4Y 0DY, United Kingdom.
This report comprises regulated information within the meaning of Sections 1:1 and 5:25c of the Act on Financial Supervision (“Wet op het financieel toezicht (Wft)”) in the Netherlands.
The brand names shown in this report are trademarks owned by or licensed to companies within the Unilever Group.
References in this document to information on websites (and/or social media sites) are included as an aid to their location and such information is not incorporated in, and does not form part of, the Annual Report and Accounts 2014 or Annual Report on Form 20-F with the exception of the explanations and disclaimers which can be accessed via KPMG’s website: www.kpmg.com/uk/auditscopeukco2014b, which is incorporated into the Auditor’s Report in the Annual Report and Accounts 2014 as if set out in full.
Designed and produced by Unilever Communications in conjunction with Addison Group at www.addison-group.net.
Printed at Pureprint Group, ISO 14001. FSC® certified and CarbonNeutral®.
This document is printed on Amadeus 100% Recycled Silk and Offset. These papers have been exclusively supplied by Denmaur Independent Papers which has offset the carbon produced by the production and delivery of them to the printer.
These papers are 100% recycled and manufactured using de-inked post-consumer waste. All the pulp is bleached using an elemental chlorine free process (ECF). Printed in the UK by Pureprint using its alcofree® and pureprint® environmental printing technology. Vegetable inks were used throughout. Pureprint is a CarbonNeutral® company. Both the manufacturing mill and the printer are registered to the Environmental Management System ISO 14001 and are Forest Stewardship Council® (FSC) chain-of-custody certified.
If you have finished with this document and no longer wish to retain it, please pass it on to other interested readers or dispose of it in your recycled paper waste. Thank you.
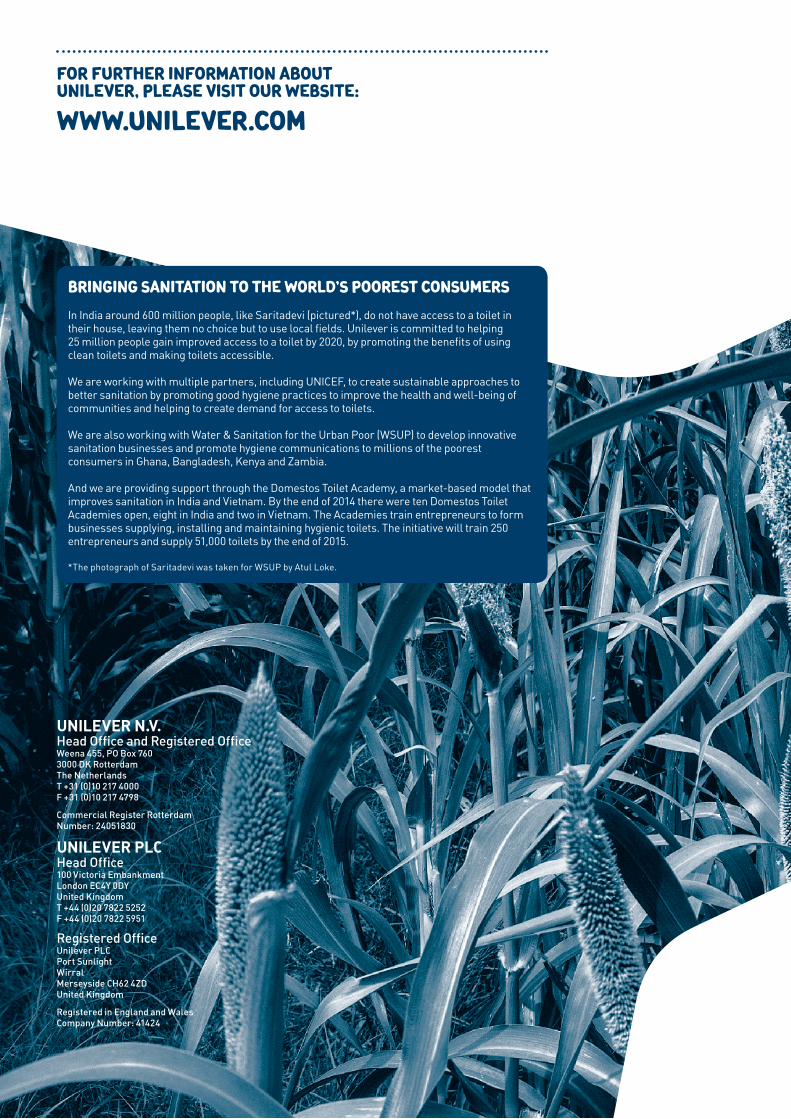
BRINGING SANITATION TO THE WORLD’S POOREST CONSUMERS
In India around 600 million people, like Saritadevi (pictured*), do not have access to a toilet in their house, leaving them no choice but to use local fields. Unilever is committed to helping 25 million people gain improved access to a toilet by 2020, by promoting the benefits of using clean toilets and making toilets accessible.
We are working with multiple partners, including UNICEF, to create sustainable approaches to better sanitation by promoting good hygiene practices to improve the health and well-being of communities and helping to create demand for access to toilets.
We are also working with Water & Sanitation for the Urban Poor (WSUP) to develop innovative sanitation businesses and promote hygiene communications to millions of the poorest consumers in Ghana, Bangladesh, Kenya and Zambia.
And we are providing support through the Domestos Toilet Academy, a market-based model that improves sanitation in India and Vietnam. By the end of 2014 there were ten Domestos Toilet Academies open, eight in India and two in Vietnam. The Academies train entrepreneurs to form businesses supplying, installing and maintaining hygienic toilets. The initiative will train 250 entrepreneurs and supply 51,000 toilets by the end of 2015.
*The photograph of Saritadevi was taken for WSUP by Atul Loke.
UNILEVER N.V.Head Office and Registered OfficeWeena 455, PO Box 760 3000 DK Rotterdam The Netherlands T +31 (0)10 217 4000 F +31 (0)10 217 4798
Commercial Register Rotterdam Number: 24051830
UNILEVER PLCHead Office100 Victoria Embankment London EC4Y 0DY United Kingdom T +44 (0)20 7822 5252 F +44 (0)20 7822 5951
Registered OfficeUnilever PLC Port Sunlight Wirral Merseyside CH62 4ZD United Kingdom
Registered in England and Wales Company Number: 41424
FOR FURTHER INFORMATION ABOUT UNILEVER, PLEASE VISIT OUR WEBSITE:
WWW.UNILEVER.COM


![Environmental Report 2003 - unilever.com · Unilever Environmental Report 2003 1 . 5623 Enviro Report [7] 6/5/04 4:08 pm Page 2 Unilever and sustainable development By making and](https://img.pdfslide.us/doc/110x75/5f01fa937e708231d401f9c7/environmental-report-2003-unilever-environmental-report-2003-1-5623-enviro-report.jpg)